achieving good natural ventilation (clean) kp
TRANSCRIPT

Achieving Good Natural Ventilation through the Use of High Performance
Computer Simulations – Singapore Case Studies
Po Woei Ken ([email protected])
Building System & Diagnostics Pte Ltd

1. Importance of Performing Natural Ventilation CFD Simulation
2. BCA Green Mark CFD Guidelines 3. Boundary Conditions & Simulation Inputs for CFD under
SG Conditions 4. Computational Size of a Typical Natural Ventilation CFD
Simulation 5. Mesh Specification of NV CFD Simulation 6. Selection of Turbulence Model of NV CFD Simulation 7. Natural Ventilation CFD Simulation Methodology 8. Good Practices for Natural Ventilation Design 9. Case Studies
Outlines
2

1. Aiming towards energy and environmentally efficient buildings – to optimize building designs to draw clean fresh air from outside environment into the buildings.
2. Enhancing natural ventilation performance of a building implies:
– Reducing energy consumption from mechanical ventilation – Improving human comfort within occupied spaces – Increasing thermal comfort controllability – Improving indoor air quality
1. Importance of Performing Natural Ventilation CFD Simulation
3

1. BCA stands for (Singapore) Building Construction Authority 2. To achieve the highest Green Mark Rating (Platinum), either a wind tunnel testing or a CFD simulation must be conducted (prerequisite)
3. Final results of the CFD (micro level) simulation MUST meet the criteria set for by BCA GM Version 4.0, i.e. at least 70% of the selected typical dwelling units with good natural ventilation performance (or 0.60 m/s), to qualify for GM Platinum Rating
4. Mathematically, this translates to the overall area weighted velocity magnitude must be at least 70% * 0.60 m/s = 0.42 m/s The process to achieve the 0.42 m/s will be explained in greater details in the next few chapters
2. BCA Green Mark CFD Requirements (GM Version 4)
4

1. Wind dynamic in nature, its behavior is random and at times, the local meteorological data is used
2. Prevailing wind directions in Singapore (Statistical Data)
3. Constant temperature at 33 oC (Isothermal) 4. Boundary condition types include (a) Velocity Inlet, (b)
Pressure Outlet, (c) Non-Slip Wall, & (d) Slip Wall
3. Boundary Conditions & Simulation Inputs for CFD under SG Conditions
5

5. The inbound velocity is mathematically described by a log-law function (see formula below)
Where: • u(z) is the wind speed magnitude expressed as a function of height (z) • d is the zero plane displacement • z0 is the roughness value of the ground • zref is the reference height of 15 m where the statistical wind speed
magnitude at those four prevailing wind directions (of Singapore) are 2.0, 2.8, 2.9 and 3.2 m/s (N, S, NE and SE respectively)
• ψ is a stability term, usually dropped out
6

6. The physical representation of the roughness value of the ground is listed as follows:
Due to the urban nature of Singapore, the roughness value most commonly used in natural ventilation CFD simulation is 1.0 [m]
Terrain description [m] Open sea, Fetch at least 5 km 0.0002
Open flat terrain; grass, few isolated obstacles 0.03
Low crops; occasional large obstacles, x/H > 20 0.10
High crops; scattered obstacles, 15 < x/H < 20 0.25
parkland, bushes; numerous obstacles, x/H ≈ 10 0.50
Regular large obstacle coverage (suburb, forest, urban) 0.50 - 1.00
7

1. The computational domain shall be big enough to include the development of interest and the surrounding buildings residing within the proximity of minimum 3 times or more of the characteristic length of the primary development
4. Computational Size of a Typical Natural Ventilation CFD Simulation
8

Boundary Condition Specification (under NORTH wind)
N
Velocity Inlet (NORTH wind)
Pressure Outlet
Non-slip Wall (for Ground and building Surface)
Slip wall (for side and TOP boundary faces)
Main Buildings
Existing Surrounding Buildings
9

1. Mesh size of 0.1 m to 0.2 m within the modeling dwelling units
2. Mesh size of 0.5 m to 1.0 m around the buildings 3. Mesh size of 10 m at far field boundary with a minimum of
50 m away from the ground
5. Mesh Specification of Natural Ventilation CFD Simulation
10

1. Standard K- ε Turbulence Model
6. Selection of Turbulence Model for Natural Ventilation CFD Simulation
11

7. Natural Ventilation CFD Simulation Methodology (Macro & Micro Levels) A. Macro level simulation 1. Conduct CFD simulation of the main buildings, following the BCA
guidelines governing the inclusion of surrounding buildings, the boundary condition and mesh specification
2. Conduct post processing – Calculating the wind pressure loads acting on ALL window openings on ALL dwelling units, at building mid height level.
3. Calculate overall average pressure differential => The Global Pressure Differential
12

The sample calculation of the individual unit pressure differential, ΔP is as follows: This example unit has 7 window openings
+1.5 Pa – (-1.5 Pa) =
13
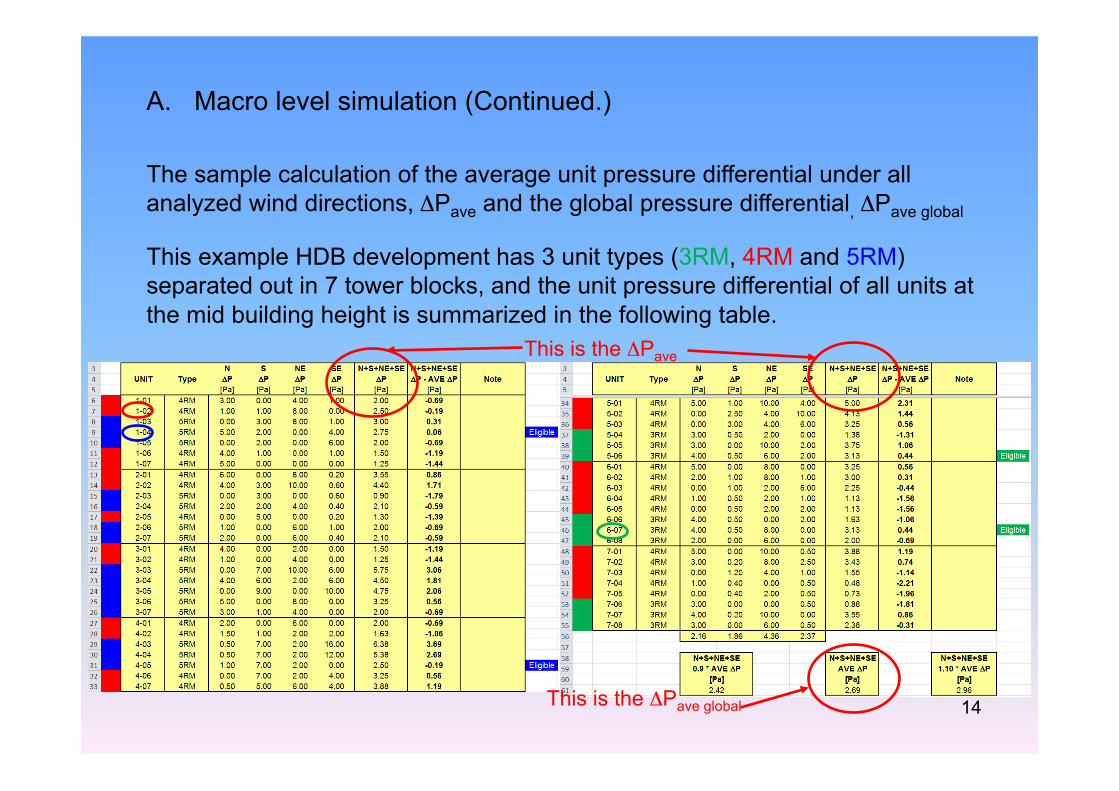
A. Macro level simulation (Continued.) The sample calculation of the average unit pressure differential under all analyzed wind directions, ΔPave and the global pressure differential, ΔPave global
This example HDB development has 3 unit types (3RM, 4RM and 5RM) separated out in 7 tower blocks, and the unit pressure differential of all units at the mid building height is summarized in the following table.
This is the ΔPave
This is the ΔPave global 14

A. Macro level simulation (Continued.) Assuming the development has 7 unit types, with the following unit type mix ratio, then units of Type F and G are not required for micro level CFD simulation, BUT the unit pressure differential of these units of Type F and G still has to be calculated This is the end of macro level simulation
15

B. Micro level simulation 1. The 3D CAD model is modified with the incorporation of the
selected (up to a maximum of 5) units, at the building mid height storey.
In this example, 3 units are selected for micro level simulation:
CAD model incorporating 3 dwelling units 16

B. Micro level simulation (Continued.) An example of the calculation of the overall area weighted velocity magnitude is given as follows: Assuming for this project, there are 5 units selected for the micro level simulation, and the calculation of the area weighted velocity magnitude of the most common unit type is:
17

B. Micro level simulation (Continued.) Example (Continued.) The calculation of the area weighted velocity magnitude of the 2nd most common unit type is:
18

B. Micro level simulation (Continued.) Example (Continued.) The summary showing the calculation of the overall area weighted velocity magnitude is: The result implies the BCA GM V4 CFD requirement is NOT met, as 39.5% is less than the required 70% mark (equivalent to 0.42 m/s)
19

20
• Macro level
- Tower block arrangement - Tower block orientation - Tower block spacing
• Micro level
- Change in unit layout design - Adjustment of window type - Adjustment of window size - Balcony glass balustrade vs. permeable railings
8. Good Practices for NV Design
21

22
Parallel Arrangement
Wind flow path is obstructed by the blocks. Wind not allowed to reach leeward areas
Block on the leeward side will not receive airflow.

23
Staggered Arrangement
Wind can be channeled around the blocks to reach downstream areas.
All blocks can enjoy good airflow

24
Tower Block Orientation
– Building primary facades to face normal to the local prevailing wind direction
– In Singapore the four prevailing wind directions are:
• NORTH • SOUTH • NORTH-EAST • SOUTH-EAST
– Window to face the oncoming wind straight on (ideally)

25
Unit Layout and Design
• Dwelling unit internal layout to promote cross ventilation

26
Adjustment of Window Type
• Typical types include – Casement (100% opening) – Slider (50% effective opening for a 2 piece, 66.7%
effective opening for a 3 piece etc. etc.) – Top Hung (opening size dependent on the allowed
opening angle – Sliding and folding (100% opening)

27
Adjustment of Window Size
• Fixed glass panel does NOT help in improving natural ventilation performance of the dwelling units
• Is full width window warranted? • Height position of the window

28
Balcony Railing vs. Glass Balustrade
• Glass Balustrade does NOT allow air to penetrate • Railing is permeable • The degree of permeability on railing is represented
by the term: Blockage Ratio
• Blockage ratio of 0 implies it is fully transparent, and air is allowed through 100%
• Blockage ratio of 1 implies it is fully blocked, and no air is allowed to penetrate

Example 1: Background: - Multi-storey warehouse type building - Floor to floor height is 9 m Important things to note: - Effect of window vertical position
29
9. Case Studies

(Initial Layout Design, Window @ +4 m above Floor ) Velocity Vector Plot, under NORTH Wind
N
30

(Final Layout Design, Window @ +1 m above Floor ) Velocity Vector Plot, under NORTH Wind
N
31

Example 2: Background: - High rise residential building Important things to note: - Effect of window type and size
32

(Top hung window + non full width window) Velocity Contour Plot
33

(Casement window + non full width window) Velocity Contour Plot
34

(Casement window + full width window) Velocity Contour Plot
35
Example 3: Background: - High rise residential building Important things to note: - Effect of adding additional window opening
36

(Initial Layout Design, no window opening in KIT) Velocity Vector Plot
37

(Initial Layout Design, additional window opening in KIT) Velocity Vector Plot
38

Example 4: Background: - Student dormitory building Important things to note: - Effect of varying air-conditioner compressor
unit (CU) stacking configuration
39

Design Option 1 (Left), Design Option 2 (Right) 3D CAD Model (Isometric View)
40

Design Option 1 Temperature Contour Plot (Side View)
41

Design Option 2 Temperature Contour Plot (Side View)
42

End of Presentation
Its cheaper to simulate than to build the wrong building
Have a nice day!!