achieving food security with cost- · pdf fileachieving food security with cost-effectiveness...
TRANSCRIPT

WP-2008-027
Reforming Foodgrains Management: Achieving Food Security with Cost-Effectiveness
A. Ganesh-Kumar, Ashok Gulati, and Ralph Cummings, Jr.
Indira Gandhi Institute of Development Research, Mumbai December 2008
http://www.igidr.ac.in/pdf/publication/WP-2008-027.pdf

2
Reforming Foodgrains Management: Achieving Food Security with Cost-Effectiveness1
A. Ganesh-Kumar, Ashok Gulati, and Ralph Cummings, Jr.
Indira Gandhi Institute of Development Research (IGIDR)
General Arun Kumar Vaidya Marg Goregaon (E), Mumbai- 400065, INDIA
Email (corresponding author): [email protected]
Abstract
This paper examines the efficacy of the current system of public foodgrains management and policies in promoting food security in the country. It argues that the system has outlived its usefulness, and that continuing with the same only stifles growth in foodgrains, with very little welfare benefits to the poor. The paper then presents a series of suggestions for reforming and modernizing the foodgrains management system in the country that would be welfare improving and also efficient, saving vast amounts of resources that can be used to invest in augmenting agricultural, especially foodgrains output. Key words: Food grains management, Food policy, Food security
JEL codes: O15, Q18
1 This paper draws heavily from a longer report titled “Foodgrains Policy and Management in India: Responding to Today’s Challenges and Opportunities” prepared by the authors for the International Food Policy Research Institute, New Delhi Office. The paper was also presented at a Seminar on on “Economic Reforms and Agriculture in Asia” in Honour of Prof. V. S. Vyas, Institute of Development Studies, Jaipur, Feb. 25, 2008. Usual disclaimers apply. Communication details of the second author is International Food Policy Research Institute, New Delhi, E-mail: [email protected]; and that of the third author is Independent Consultant, USA, E-mail: [email protected].

3
Reforming Foodgrains Management: Achieving Food Security with Cost-Effectiveness
A. Ganesh-Kumar, Ashok Gulati, and Ralph Cummings, Jr.
1. Introduction
Foodgrains are vitally important to food security. In 2004-05, an average Indian household spent 36% of its total expenditure on foodgrains, down from about 50% in 1983. The poor spent an even higher percentage, and derive much of their nutrition (more than three-quarters) from foodgrains. On production side, foodgrains occupy about 66% of the gross cropped area in the country, although they contribute only 36% of the gross value of crop output (TE 2003-04). How the grain economy is managed, therefore, is critical not only for poor consumers but also for large number of producers.
This paper examines the current system of public foodgrain management in its entirety – from price support and procurement operations to public distribution through fair price shops, and buffer stocking for national food security. It re-visits the rationale of each one of these inter-related components and analyses how far the objectives are being met and at what cost. Thereafter, it suggests an agenda for reforming the foodgrain management system in India which is much more cost effective and also well targeted to achieve the objectives of food security than the existing system.
2. The Context for Alarm
M.S. Swaminathan, Chairman of the National Commission on Farmers, says “The farming sector is fast heading for a total collapse if no rapid remedial measures are taken.” [India Today 2007]. The fifth and final report of the National Commission on Farmers recommended a massive approach to revitalize agricultural progress by making agrarian prosperity and food security and sovereignty the bottom line for government policies and priorities in agriculture [MOA 2006]. The report of the Steering Committee on Agriculture and Allied Sciences for Formulation of the Eleventh Five Year Plan (2007-2012), chaired by C. H. Hanumantha Rao, noted that public and private investment in infrastructure, including irrigation, technological change, diversification and fertilizer, the four major sources of agricultural growth in India, had slowed down since the 1990s and recommended stepping up public investments in agriculture to four percent of Agricultural GDP, implying that public investments, at 1999-2000 prices, would be raised annually by 12 percent during the 11th Plan [Planning Commission 2007]. The Prime Minister stated in his inaugural speed to the National Development Council on May 29, 2007: “The rates of growth in agriculture in the last decade have been poor and are a major cause of rural distress. Farming is largely becoming an unviable activity.” A National Food Security Mission was launched and a mega

4
Rs.25,000 crore assistance program to reinvigorate agricultural productivity to four percent annually was announced.
The establishment of the National Food Security Mission signals a major concern for foodgrains. The compound annual growth rate of foodgrain production has been just 1.2% during 2000-06, which is below the rate of growth of population [MOA 2006]. The net per capita availability of foodgrains in the country has fallen from 175 kgs per annum during TE 1993 to 161 Kgs. during TE 2005. During 2006, India imported wheat to the tune of about 5 million tons. All of these factors together seem to have pressed the alarm bells for the government to re-instate the high priority to foodgrains in its strategy to rejuvenate agriculture.2 Much of the emphasis in government approach to boost foodgrain sector is supply-driven, i.e., trying to remove supply bottlenecks to augment production. No serious attempt is being made to reform the foodgrain management system. Our contention is that this is equally important, if not more, to achieve food security in a cost effective manner. Thus, we raise serious questions about whether the present food management system – which has basically persisted for forty years with only minor changes in the context of a radically changing agriculture and total economy – has not out-lived its usefulness.
3. Foodgrains Management in India
The existing system of foodgrains management – with its origins in the unprecedented consecutive severe droughts in 1965-66 and 1966-67 necessitating massive emergency food aid imports and the subsequent need to disseminate high-yielding varieties – is characterized by the dominant presence of the government in all the basic aspects of marketing, viz., procurement, storage and distribution, with all these operations being bundled and carried out by the Food Corporation of India (FCI), the nodal parastatal agency.
The FCI procures foodgrains in the form of wheat or paddy directly from farmers and in the form of rice from rice millers. The procurement/levy price is recommended by the Commission for Agricultural Costs and Prices (CACP) based on considerations of cost of production and includes a “fair” return to land and family labour of the farmers. It is essentially a system of open-ended procurement under which the FCI is obligated to buy all the grains that farmers offer to sell at the prescribed procurement price as long as the grains meet a certain quality standard. Where it operates, this open-ended procurement system effectively renders the procurement price to be a support price below which the prices do not fall. With regard to rice, the millers are obligated to sell a certain fraction of their produce to the FCI at the levy price, which makes it essentially a “tax” on millers. The operation of the
2 Although it is true that growth in foodgrains has slowed down, one can argue that there is no need to panic on this front.
With rising incomes people switch their consumption from foodgrains to high value agriculture products such as fruits and vegetables, milk and dairy products, meat and fish (Engel’s law). The per capita consumption of cereals has fallen from more than 14 kgs. per month in 1983 to 11.5 kgs. in 2004-05. (NSSO, various years). Also, while India was importing more than 5 million tons of wheat, one should not forget that India exported more than 4 million tons of rice of higher value than imports of wheat during 2006-07. The net per capita availability of foodgrains has fluctuated from 164 kgs. per annum during the TE 1983 to 175 Kgs during TE 1993 to 161 kgs during TE 2005.

5
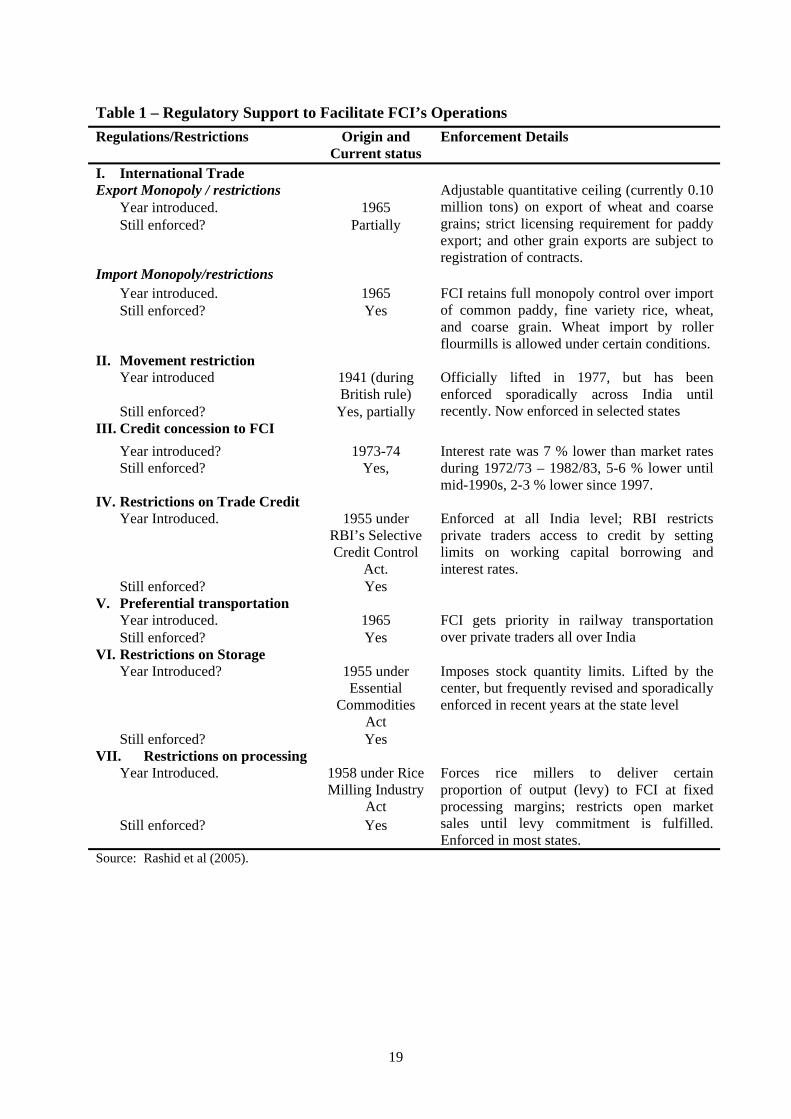
FCI is aided by a whole paraphernalia of self-serving legislations, rules and guidelines, most important amongst which are the monopoly control over international trade in foodgrains, and internal movement and storage restrictions on private traders (Table 1). The former insulate the government from movements in world prices and allow it to pursue a domestic price policy of its own. The latter, by discouraging other options to farmers, enables the FCI to procure grains from the surplus states.
The degree of market intervention – public procurement as percentage of total production – has increased significantly over the past forty years (Table 2). Market intervention is more pronounced in the surplus states, in practice largely confined to Punjab, Haryana, western Uttar Pradesh, and Andhra Pradesh. And the intervention is largely confined to wheat and rice.
The grains procured by the FCI are used to maintain a buffer stock and to meet the needs of the public distribution system (PDS) and various other welfare programmes that the government runs. The FCI is responsible for storing, transporting and distributing the grains through the PDS.
The PDS involves a network of over 485 thousand fair price shops (FPS) through which grains (and a few other commodities) are sold at a subsidized price. Foodgrains for the PDS (and other food based social safety nets (SSNs)) come primarily from the FCI. Thus, the PDS also serves as an outlet for offloading the food stock that government procures under its price support programs. Given these close links between the PDS and the price support, procurement and storage policies, any market liberalization that changes the current procurement-stocking-distribution paradigm will have implications for the functioning of the PDS and other food-based SSNs. If the restrictions on market are withdrawn and floor prices are adjusted, the government may not be able to procure the food stock necessary to run the PDS and other food based SSNs. In fact, this fear of possible disruptions to the functioning of the PDS is often used as an argument to stifle reforms in the government’s foodgrains policies.
4. Does the Current System Ensure Food Security to the Poor?
4.1. Evaluating Price Support
One of the stated objectives of the public intervention in grain management is to ensure a reasonable support price which will induce the farmer to adopt improved methods of cultivation for increasing production. Figures 1 and 2 show the MSP compared to A2 (paid out) and C2 (full costs including returns to labour, land, and management) costs. The MSP is much higher than A2 costs for both wheat and rice in all states which means that the concept of risk-coverage, which was the original justification for support prices, seems to be a relic of the very distant past. Even more significantly, the MSP was above C2 costs for wheat for almost all production and for rice for over two-thirds of production. That is, the MSP is now really an income-transfer mechanism.

6
There is now growing evidence that MSP may not be as effective in inducing production as it was in the past. Forty years after the onset of The Green Revolution almost all of the high potential land is already sown to high-yielding varieties of wheat and rice. A review of the literature on supply response for rice and wheat in India suggest that, by and large, output responds less than proportionately to changes in output prices.3 These studies also show that price incentives have much less impact on output than investments (public and/or private) in technology, which undermines the rationale for government’s price intervention policies in the grain markets as an instrument for inducing production of these two cereals. These studies, however, mask various other important negative side-effects that the public intervention in grain markets has at the ground level. Farmers, being assured of a certain minimum price that guarantees a minimum return, would not be compelled to use inputs such as water, fertilizer, etc., efficiently which will have adverse impact on the natural environment. Besides, they can also be major disincentives for farmers to diversify into other crops, and for private traders from participating in grain markets. The experience of public procurement in the surplus states of Punjab and Andhra Pradesh amply bring out many of these negative effects in great detail.
4.2. Evaluating Buffer Stocks
The inadequacy of the existing food policy regime is reflected in the wild swings in the foodgrains stock (Figure 3). The mid-1990s witnessed partial liberalization of the foodgrains trade policies, first in rice followed by wheat. The consequent spurt in exports was remarkable. Exports of rice shot up from about a million tons to almost 5 million tons, making India the second largest exporter in 1995-96. Next year, wheat exports started increasing. This resulted in increase in domestic prices of wheat. Concerned with rising prices of wheat, government put a ban on exports of wheat and opened imports at zero import duty. Not much wheat imports could come in as world prices were high, but the world price of cereals took a dramatic downturn from 1998 in the wake of East Asian crisis. However, at the domestic level, the MSP offered by the government kept rising. As a result, exports became uncompetitive while sales to the government became lucrative and, given the open-ended public procurement policy, this led to significant increase in public procurement. Faced with mounting fiscal deficit due in part to rising food subsidies, the government increased the ration prices resulting in a fall in demand from FPS. This combination of increasing procurement and declining public distribution resulted in an unprecedented accumulation of public foodgrains stock that reached as high as 63 million metric tons by July 2002, equivalent to about 50 percent of total world trade volume in a given year. In the subsequent years (till 2004), the government subsidized exports (by waiving off a part of the freight and stocking costs) at a price that was 50 percent lower than the government’s procurement costs. As a result, stocks plummeted to just 16 million tons by April 2007. The case of wheat is
3 Krishna and Chibber (1983), Jha and Srinivasan (1999), Srinivasan and Jha (2001), Rashid et al. (2005), Mythili (2006).
See Gulati and Kelly (1999) for a review of the estimates of price elasticities.

7
particularly sharp, from about 41 million tons in July 2002 to just 2 million tons in April 2007.
4.3. Evaluating the Public Distribution System
The PDS was universal up to 1997, when it was converted into the Targeted Public Distribution System (TPDS) under which a distinction was made between the people below and above poverty line for better targeting of food subsidies. A macro level assessment of the performance of the PDS/TPDS based on the data on allocation and offtake of grains across states over the period 1993-94 to 2005-06 suggest the following:
Firstly, the correlation between poverty shares and grain allocation shares across states was only 0.36 in 1993-94 when the PDS was universal. Under TPDS, the correlation between allocations to population Below Poverty Line (BPL) and poverty concentrations across states has risen dramatically to 0.94 in 1999-00 and 0.98 in 2005-06. Thus, there has been a major correction in the way grains are allocated to different states with allocation now being in line with poverty concentrations.
Secondly, offtake of grains by states in 1993-94 was low (below 80%) in most states except Andhra Pradesh and Tamil Nadu. Strikingly, offtake was below 50% of the allocation in Bihar, Madhya Pradesh, Maharashtra, Uttar Pradesh and West Bengal, each of which had large concentrations of poor in the country. The shift to TPDS has seen an improvement in offtake in most states, especially for the BPL population. By 2005-06, almost all states (Bihar is the exception) including the ones with large poverty concentrations had very high offtake percentages (exceeding 75%) for the BPL population. Thus, on this aspect too, there is a definite improvement in the situation for BPL following the move from universal PDS to TPDS.
While there has been a correction in the allocation of grains across states, allocation amongst BPL and APL continues to be loaded in favour of the latter. In 2005-06, 62 percent of grains were allocated to the APL in the country as a whole. Only two states, Jammu & Kashmir and Kerala, have seen reductions in the allotment of grains to the population Above Poverty Line (APL) under the TPDS, both in absolute and in percentage terms. In all other states and in the country as a whole, the allotment to APL population has increased in absolute terms, and in several states in percentage terms as well. Notable amongst these are Bihar, Madhya Pradesh, Rajasthan, Uttar Pradesh and West Bengal, which together account for 61% of the poor in the country in 1999-00.
Has this limited improvement under the TPDS resulted in higher incomes / greater welfare for the poor? To answer this question one needs to examine micro level data for households. Radhakrishna et al. (1997) studied the dependence on PDS by the poor, income gains from PDS and poverty reducing impacts of PDS using National Sample Survey (NSS) data for 1986-87. Dev et al. (2004) carry out a similar exercise using NSS data for 1993-94 and 1999-00. The following conclusions emerge from these two studies:

8
Firstly, dependence on PDS (share of PDS purchase in total grain consumption) by the poor is low but seems to have increased between 1986-87 and 1999-00 at the all-India level and across majority of the states. At the all-India level, the share of PDS grain in total grain consumption has increased from 6.8 percent to 8.8 percent for the rural poor and from 13.64 percent to 16.66 percent for the urban poor. For the non-poor, the PDS dependence has increased in the rural areas, but declined among urban households.
Secondly, income gains through PDS show significant increase for both rural and urban poor following the introduction of the TPDS in 1997 but continues to be small. In 1999-00, income gains at All-India level accounted for about 2 percent of total per capita expenditure of rural poor, twice its share in 1986-87 when PDS was universal. The gains in the poorer states seem to show a significant increase over the years. The correlation between state-wise poverty shares and income gains was close to zero (just 0.01) in 1986-87, and in fact turned marginally negative (-0.07) suggesting that the situation had turned somewhat regressive by 1993-94 when universal PDS was still in operation. The introduction of the TPDS seems to have improved this and by 1999-00 the correlation between the poverty concentrations and income gains across states rose to 0.15.
Finally, the impact of TPDS on poverty head count in 1999-00 though small in magnitude, has increased somewhat compared to the impact of universal PDS in 1986-87. Further, there is considerable variation in the poverty reducing impacts across states, with the four southern states and Orissa showing much larger impact than the national average. Nevertheless, even the highest impact is just 5.2% in Tamil Nadu.
Underlying the above limited benefits flowing out of the PDS/TPDS to the poor are issues of targeting efficiency. Identifying the poor continues to be a challenging task in much of the developing world [Coady et al. 2002]. A major difficulty often is in identifying and addressing transient poverty, and in India this issue forms the basis for arguments for reverting from TPDS to universal PDS [MCA 2001; Swaminathan 2003]. Estimates by Dutta and Ramaswami (2001) using NSS data for the year 1993-94 show that targeting errors are large with substantial spatial variation. Strangely, however, they find that in general inclusion errors are smaller compared to exclusion errors (except in rural Andhra Pradesh), when in fact one would expect the converse to be true under universal PDS.
The rising food subsidy bill has been a matter of concern to many. If the programs are efficient – that is, benefits reaches the intended beneficiaries – then an increase in the subsidy due to an expansion in the program and/or the magnitude of the transfer, may be justified. However, if the programs are inefficient/expensive in transferring benefits to the intended beneficiaries, then any increase in food subsidy would imply inefficient use of scarce public resources, which can have higher social returns in alternative investments.
Dev et al. (2004) define cost-effectiveness as the public costs of transferring one Rupee worth of benefits to the beneficiaries and measure it as the ratio of total public expenditure on

9
a program to total income gains to the target group. Table 3 summarizes their estimates of the cost-effectiveness of alternative SSN programs.4 The cost of transferring one Rupee worth of benefits is found to be the lowest for the ICDS (1.44)5 followed by the EGS (1.85) and the JRY (2.28), while the PDS turns out to be the most expensive at 6.68. A similar conclusion was reached earlier by Radhakrishna et al. (1997) and Dutta and Ramaswami (2001).
Three important messages emerge from the above analysis. First, compared to 1986-87 when universal PDS prevailed, the access, income gains, poverty impacts and targeting efficiency of the TPDS in 1999-00 is better. This goes against the recommendations made in the Report of the High Level Committee on Long-term Grain Policy [MCA 2002b] for reverting back to universal PDS. Second, the targeting errors are large and vary substantially across states, implying that there is significant scope for further improvement. Finally, though somewhat dated, the estimates of overall cost-effectiveness indicate that self-targeted programs are more cost-effective than food subsidy programs.
The self-targeted programs, such as EGS and ICDS, not only provide the poor with access to food but also contribute to overall development by building rural infrastructure and providing health and nutrition education, which help increase productivity and build a healthy labour force. Thus, a move in the future that lays increasing importance to self-targeting employment programs even while de-emphasizing the role of untargeted or administratively targeted food based SSNs such as the PDS/TPDS would be both welfare-improving as well as efficient. Besides, such a move will also reduce the need for government intervention in food markets for procuring, storing and supplying foodgrains to PDS and other such food based SSNs. This would enable the country to carry out reforms to the foodgrains policy regime and move away from parastatal-led price stabilization toward market-led price stabilization regime.
4.4. Cost Implications
Recent trends in the costs of maintaining India’s “procurement-stocking-distribution” paradigm seem to echo some of the very problems that opponents of price stabilization policies had predicted through their theoretical models [Timmer 1996]. The system has become wastefully expensive, is dictated by special interests, has hindered development of private trade, and consequently imposed an increasing burden on society.
As the degree of intervention increased, the size of the FCI’s workforce increased over the years, from 3,904 employees in 1965 to 70,000 in the 1990s. In 2004, FCI reported about 55,000 regular employees and more than 170,000 casual workers. With increasing numbers rose the lobbying powers of FCI’s employees, as reflected in their ability to negotiate higher than market salaries/wages. The wage rates of FCI’s regular employees are 4-5 times higher
4 It may be noted here that the estimates by Dev et al (2004) for 1999-00 are close to those by Dutta and Ramaswami (2001)
for Maharashtra and Andhra Pradesh for the year 1993-94. Similar estimates for a recent year are not readily available. 5 This by no means implies that the ICDS is successful in reducing malnourishment amongst children. Apprehensions on its
effectiveness on that score have been aired by the Prime Minister himself [PMO 2007].

10
than market rates, while the daily wages of the casual workers’ are double that of rural labourers [Chand 2003]. In addition, the rents they derive from the system inflate their net income far above the value of their productivity.
Public costs of the existing system have been increasing for years, but sent a wakeup call to the policy makers in 2002 when public foodgrains stock reached 63 million tons. During the three years 1999-2000 to 2002-03 food subsidy grew steeply at annual rates of 28, 45 and 38 per cent, respectively. Share of subsidy allocated to public storage nearly tripled between 1997-98 to 2001-02. Food subsidy as a percentage of gross domestic product has more than doubled over the last decade and half (Figure 4). The growth in food subsidy is all the more sharp considering that during this period the Indian economy has witnessed a high growth rate. Total food subsidy (at current prices) stood at about Rs.258 billions in 2004-05, which was equivalent to about one percent of national gross domestic product (GDP), 4.2 percent of agricultural GDP, 5.3 percent of the Central government’s total expenditure, and about 23 percent of its capital expenditure.
Underlying the rise in the food subsidy is the rapid rise in FCI’s total expenses as well as its per unit costs of procurement, distribution and storage operations (Table 4). The carrying cost of the buffer stock rose from 21 percent of the total value of the buffer stock in 1999-2000 to nearly 75 percent in 2003-04. The central government spends more on holding buffer stocks than on agriculture, rural development and on irrigation and flood control taken together [MCA 2002b].
Interest payments, freight expenditure and handling expenses constitute major items of FCI’s total expenditure, all of which have registered quantum increase in recent years. The share of interest payments rose to more than 40% in 2000-01 and 2001-02, before declining later on. The freight expenditure has increased due to increased grain movement in recent years.6 Expenditure on employee’s remuneration and benefits has increased due to the departmentalization of contractual labour in FCI depots.
Apart from these direct costs, the current system imposes various forms of hidden costs on the society. The current system has created a large group of stakeholders – FCI’s staff, nearly half a million ration shops, about 225 million ration card holders, and more than 6,000 state marketing and regulatory agencies (including mandi boards) directly involved with public intervention programs – who have a vested interest in maintaining the existing system with all its complex set of regulations. Many reports indicate that the politicians and farmers in the surplus states influence the MSP in India [Dev et al. 2004]. The vested interests are not hard to understand: higher support prices mean more secured markets for farmers, larger procurement for the FCI, and higher tax revenues for the politicians in the surplus states.
6 FCI undertakes grain movement keeping in mind the fresh procurement, stock, allocation and off-take levels. According
to its recent Annual Report, the grain movement by FCI has increased from 29.72 million tons in 2003-04 to 33.92 million tons in 2004-05. Further, the grain movement on inter-state account has significantly increased as compared to the previous years.

11
Guaranteed markets make farmers, especially the larger ones, happy and the happier the farmers, the greater are the chances for politicians to get re-elected. The rapid rise in acreage under rice and wheat in the surplus states of Haryana, Punjab and Andhra Pradesh during 1995/96-2000/01 well above that in the country as a whole is suggestive of the nexus between politicians and farmers [Rashid et al. 2005]. Such a price policy distorts the incentive structure in agriculture, and in fact slows down the natural process of diversification away from cereals to high value agriculture.
Leakages and diversion of foodgrains from the PDS is another major hidden cost to the society. All available estimates, including those by the Government, as well as media reports [Rediff.com 2004] suggest that the leakage from the PDS is high. A recent study by M/s Tata Economic Consultancy Services cited in MCA (2002a) reports that, at the national level, 36 percent of rice and 31 percent of wheat never reach the intended beneficiaries, and that the rate of leakage varies widely across states, from 17 percent in Andhra Pradesh to about 63 percent in Assam. Even the Planning Commission’s estimates suggest that the leakage would fall within the range of 32-40 percent and 27-35 percent for wheat and rice, respectively (Dev et al. 2004).
Inefficiency of the FCI in comparison to the private traders is another hidden cost to the society. Some recent studies conclude that despite enjoying various preferential treatments, FCI’s costs are higher than the private sector. Gulati and Kahkonen (1996) estimate that, while private traders earn 9-10 percent profits on sales, FCI losses as a percentage of sales were 29 percent and 68 percent in the case of rice and wheat, respectively. Similarly, Chand (2002) suggests that FCI’s per unit trading cost is twice as much as private traders in case of wheat and about 20 percent higher in case of rice. His estimates also suggest that, compared to private sector, FCI’s per unit storage costs are 30 percent higher; per unit labour costs are almost four times higher in case of rice and seven times in case of wheat; and interests payments are four times higher in case of rice and two and a half times in case of wheat due to longer storage periods. More strikingly, Jha and Srinivasan (2004) reports that not only have FCI’s unit cost been larger, the gap between the two has been widening.
Proponents of the “procurement-stocking-distribution” paradigm argue that FCI’s costs are not comparable to those of the private sector because, unlike private traders, FCI has a social mandate, a large part of its costs are “policy determined” (e.g., procurement prices and distribution prices are centrally decided), and FCI has to transport its grain over long distance in order to reach the most remote parts of the country [MCA 2002b]. However, the facts do not support these claims. The system has not been successful in transferring income to the intended beneficiaries. “Policy determined” variables are found to be dictated by special interests, and some of the readily comparable FCI cost items have been larger than private sector.

12
5. The Changed Context and the Need for Reforms
Historically, lack of market integration due to inadequate infrastructure (roads, telecommunications, etc.), absence or inadequacy of risk-mitigating institutions, high volatility and thinness of the world grain markets, and foreign exchange constraints faced by the country, provided the broad rationale for public intervention in foodgrains markets [Rashid et al. 2005]. Today, however, the conditions both within and outside the country have changed so drastically that each of the above rationale are no longer valid.
Infrastructure and information flow have improved dramatically since 1970. The paved road network quadrupled from 334,000 km in 1970 to 1,363 million km in 2000. In 1970, just one person in 370 had a telephone, one in 20,000 a television, and one in 32 a radio. By 2000, these figures rose to one in 5, one in 3, and one in 2, respectively [Rashid et al. 2005]. Mobile phone access has exploded even in rural areas. Improvement in transport and communication infrastructure has led to spatially more integrated markets since the mid-1980s [Palaskas and Harris-White 1993; Gosh 2003; Kumar and Sharma 2003]. With the widespread adoption of high-yielding varieties the argument that price supports are required to promote such varieties is no longer valid. World wheat and rice markets are now larger and more robust; international price volatility has become relatively small [Dawe 2004]. And India has accumulated large foreign exchange reserves (about $220 billion in August 2007) many times the amount needed to import any conceivable shortfall in supply. Under conditions in 2006-07, ceteris paribus, buying all 30 million tons of rice available in the world market would have taken less than 5 percent of India’s foreign exchange reserves. This should encourage India to follow more liberal policies in foodgrain management, policies that dovetail international trade with domestic market reforms allowing greater role of private sector in an open economy environment.
6. Reforming Food Policy
The existing system of public intervention through the FCI bundles several operations as well as objectives. Operationally, the FCI (aided by several other state-level agencies) carries out procurement, storage, transport, and distribution of foodgrains. In each of these operations, the FCI and other state-level parastatal agencies have been observed to be inefficient. In terms of the objectives, the existing system seeks to cater to farmers’ interests (production incentives, and price risk protection) and simultaneously consumer interests (consumption subsidy, and price stabilization) using a single set of policy instruments.
Given the conflicting goals of farmers (who want higher prices) and consumers (who want cheap food), meeting both their objectives is a delicate balance by itself. The uncertainties in predicting the swings in output and prices only complicate the matter further. By bundling both producer risk/income protection goals and consumer subsidy goals into the operations of the FCI, the government, faced with resource constraints, is often forced to compromise on one or other of its objectives. To improve the efficiency of the current system

13
of foodgrains management and to enhance the government’s capacity for meeting its distributional goals for welfare improvement, it is of critical importance to unbundle the operations of the FCI and to allow the private sector to compete at each level so that the overall costs are reduced.
The key to successful reforms of the food management system is to decouple the government’s consumer welfare objectives from producer protection objectives, and particularly the MSP as protection against price risk should be decoupled from using it to augment farmer income. The government should not be in the business of determining farm incomes as the current system of MSP is attempting to, and should instead let the market determine the returns to various crops. The government should limit its role to stabilizing prices in order to promote food security of the poor. Price stabilization in a band bordered by the c.i.f. and f.o.b. prices can be pursued by a combination of variable tariffs, and through procurement and offload operations at market prices and by maintaining buffer stocks by the FCI. Only when there is a precipitous fall in prices below even the variable costs of production, a price support may be provided to farmers at a level that is just adequate to recover the variable input costs. The FCI’s procurement, storage and distribution operations should accordingly be scaled down. For the FCI to reduce its procurement operations, the demand on the PDS has to be reduced first by effectively targeting the subsidy to the needy. Eventually the current system of physical entitlements of grains under the PDS has to be replaced by a system of real income transfer that allows the beneficiary to purchase their food requirements from private retailers at the prevailing market price. Overall, the government needs to move away from the current highly interventionist policy regime, to one in which it concentrates on building the necessary infrastructure and institutions to make the market work.
Accordingly:
a) The TPDS should be strengthened and it should cater only to the poor. Over time, the current system of consumption subsidy in the form of physical entitlements should be replaced by a system of food coupons that would allow the poor to purchase their food requirements from the market itself at prevailing market prices. These coupons could be periodically adjusted in line with price movements so as to offer a real income transfer. This would reduce the need for large scale public intervention in procuring, storing and distributing foodgrains, and enable downsizing the scale of public intervention in foodgrains markets. Eventually, employment-generation programmes and innovative income transfer programmes should replace consumption-subsidy programmes for the poor, since income transfers are welfare superior to commodity specific consumption subsidies.
b) Private marketing should be strengthened through reforming the Agricultural Produce Marketing Committees (APMC) Act, abolishing the Essential Commodities Act (ECA), abolishing rice levies, permitting direct purchases from farmers, eliminating movement

14
and storage controls, facilitating warehouse receipts, strengthening futures markets, and opening imports and exports to the private sector.
c) Private trade often relies upon futures market for hedging against price risks over time. A well designed public program of price stabilization too can look up to the futures markets for signals on where the supplies and prices are headed. Modern warehouse facilities, a system of quality certification and the transferability and negotiability of the warehouse receipts backed by legal provisions are critical to ensure that futures market function effectively. Legally backed negotiable warehouse receipts would enable farmers and traders to buy/sell grains, without the grains having to be physically moved around with every transaction. This would reduce transactions costs and hence the final cost to the consumer. Moreover, the negotiable warehouse receipts can in principle be used as collateral by farmers to raise credit. Further, this system by unbundling ownership and storage functions, can foster specialization in storage activity and help reap economies of scale and scope that reduce storage costs and losses. With ownership of grains and management of storage in different hands, this system can also help prevent large traders from getting a stranglehold on the market through uncompetitive trade practices. Besides the legal changes, there is also a need for a system of quality certification. This is a public good, which only the government is best equipped to put in place.
d) Complementary changes to the food pricing policies are required to ensure that the above enabling changes do result in greater private sector participation. Market prices should be stabilised based on transparent rules in an open economy environment (i.e., free of movement, storage and trade restrictions) somewhere within a band bordered by c.i.f. and f.o.b. prices by using a variable tariff policy (within the bound rates) consistent with WTO rules. To implement this policy, an agency that can track international prices and suggest changes in tariffs will be needed. It may be a good idea to convert Commission for Agricultural Costs and Prices to a Tariff Commission to do this job. Futures markets for grains are a useful institution that can give guidance about the future direction of change of the band itself; that is, whether there will be secular rise or fall in the band. It is, therefore, important to dovetail tariff-setting in line with the movements in the futures prices. Institutional arrangements for monitoring the price movements and carrying out tariff changes would have to be developed.
e) As long as the lower level of this band (including tariffs) remains above the A2 cost levels, all public procurement of foodgrains for safety net policy needs and/or for buffer stocks should be at market prices. Tendering should be used to move foodgrains from surplus to deficit areas.
f) The MSP should be set at A2/paid-out-cash-cost levels to mitigate farmers against the risk of precipitous fall in prices. It should become operational only when the lower level of the band, even after raising the tariffs to the maximum permissible bound rates, goes down below the A2 cost level. During such instances, government should invoke “special
15
safeguards mechanisms” to impose temporary quantitative restrictions on imports to eliminate arbitrage opportunities.7
g) The efficiency of FCI should be improved, in part, by making it compete with the private sector on a level playing field. Downsizing FCI should be effected in the current surplus states such as Punjab where FCI operations have ceased to bear any benefits and instead re-orient FCI operations to the eastern states where public support for market development is direly needed. Public procurement along lines described above for meeting the TPDS requirements, as well any buffer stock requirements, should be from the eastern states that have immense potential and cost advantages in rice cultivation.
h) Changes are also required on the operational side of procurement by the FCI. From a system of open-ended procurement at pre-announced procurement prices, the FCI has to move over to a system of tendering for the desired quantities and quality to be delivered at the desired location. For example, if grains are required in the state of Kerala for the TPDS, then the tender can specify that the grains be delivered in Kerala. Competitive bids have to be sought from private suppliers (domestic and foreign) and procurement will have to be at the lowest price. The market prices will thus not be distorted, and costs can be minimized.
The above measures are a sort of integrated package and need to be implemented together so that dividends of such a package can be harnessed to the full in terms of better and targeted food security at a much lower cost. The resources so saved can be ploughed back to agriculture through investments in research and rural infrastructure, which give much higher returns.
References
Anderson, K, W Martin and D van der Mensbrugghe (2006): ‘Market and Welfare Implications of Doha Reform Scenarios’ in K Anderson and W Martin (eds), Agricultural Trade Reform and the Doha Development Agenda, Palgrave Macmillan, New York.
Chand, R (2002): ‘Government Intervention in Foodgrain Markets in the New Context’, National Centre for Agricultural Economics and Policy Research, New Delhi.
____ (2003): ‘Government Intervention in Foodgrain Markets in the New Context’, Policy Paper 19, National Centre for Agricultural Economics and policy Research, New Delhi.
7 Such special safeguards are currently not available to India (and other developing countries) under the current WTO
regime, but future trade negotiations should be directed towards ensuring that such options are available to the country.

16
Coady, D, M Grosh, and J Hoddinott (2002): ‘Targeting of transfers in developing countries: Review of experience and lessons’, Social Safety Net Primer Series, World Bank, Washington DC.
Dawe, D (2004): ‘The Changing Structure of the World Rice Market, 1950-2000’, Food Policy, 27, pp 355-370.
Dev S M (forthcoming): ‘Food Marketing Parastatals and Social Safety Net Programmes: The case of public distribution system in India’, in From Parastatals to Private Trade: Why, When and How?, International Food Policy Research Institute, Washington DC.
Dev, S M, C Ravi, B Viswanathan, A Gulati, and S Ramachander (2004): ‘Economic Liberalization, Targeted Programmes and Household Food Security: A Case Study of India’, MTID Discussion Paper 68, International Food Policy Research Institute, Washington DC.
Dutta, B, and B Ramaswami (2001): ‘Targeting and efficiency in the public distribution system: Case of Andhra Pradesh and Maharashtra’, Economic and Political Weekly, 36, pp 1524-1532.
Ganesh-Kumar, A, M Panda and M E Burfisher (2006): ‘Reforms in Indian Agro-processing and Agriculture Sectors in the context of Unilateral and Multilateral Trade Agreements’, Working Paper WP-2006-011, Indira Gandhi Institute of Development Research, Mumbai.
Gosh, M (2003): ‘Spatial Integration of Wheat Markets in India: Evidence from Cointegration Tests’, Oxford Development Studies, 31, pp 159-71.
Gulati, A and S Kahkonen (1996): ‘The Food Corporation of India: Successes and Failures in Indian Foodgrain Marketing’, NCAER-IRIS Collabourative Project, November, Mimeo.
Gulati, A and T Kelly (1999): Trade liberalization and Indian agriculture, Oxford University Press, New Delhi.
Hertel, T W, and R Keeney (2006): ‘What is at Stake: The Relative Importance of Import Barriers, Export Subsidies and Domestic Support’, in K Anderson and W Martin (eds) Agricultural Trade Reform and the Doha Development Agenda, Palgrave Macmillan, New York.
India Today (2007): “Grain Drain: The Spectre of Foodgrain Imports Stares India in the Face, As Agricultural Growth Plunges to All-Time Low and the Government Fails to Come Up with Timely Remedies. Will the Rs 25,000-Crore Injection Work” by Raj Chengappa with Ramesh Vinayak, June 11, 2007, pp. 39-57.
Jha, S, and P V Srinivasan (1999): ‘Grain price stabilization in India: Evaluation of policy alternatives’, Agricultural Economics, 21, pp 93-108.

17
____ (2004): “Achieving Food Security in a Cost Effective Way: Implications of Domestic Deregulation and Reform Under Liberalized Trade’, MTID Discussion Paper No. 67. International Food Policy Research Institute, Washington DC.
Krishna, R, and A Chibber (1983): ‘Policy modelling of a dual grain market: the case of wheat in India’, Research Report 38, International Food Policy Research Institute Research, Washington DC.
Kumar, P and R K Sharma (2003): ‘Spatial price integration and pricing efficiency at the farm level: A study of paddy in Haryana’, Indian Journal of Agricultural Economics, 58, pp 201-217.
MCA (Ministry of Consumer Affairs, India) (2001): Report of the Tenth Plan Working Group on Public Distribution System and Food Security, New Delhi.
____ (2002a): Annual Report 2001/02, New Delhi.
____ (2002b): Report of the High Level Committee on Long-term Grain Policy, New Delhi.
MOA (Ministry of Agriculture) (2005): ‘Reports of the Commission for Agricultural Costs and Prices 2005’, New Delhi.
____ (2006): ‘Serving Farmers and Saving Farming’, Revised Draft National Policy for Farmers, National Commission on Farmers, New Delhi.
MOF (Ministry of Finance) (2004): ‘Central Government Subsidies in India’, New Delhi.
____ (2006): ‘Economic Survey, 2004-2005’, New Delhi.
Mythili, G (2006): ‘Supply Response of Indian Farmers: An Analysis of Pre- and Post-Reform Periods’, Working Paper WP-2006-009, Indira Gandhi Institute of Development Research, Mumbai.
Palaskas, T B and B Hariss-White (1993): “’Testing market integration: new approaches with case material from the West Bengal economy’, Journal of Development Studies, 30, pp 1-57.
Planning Commission (2007): ‘Report of the Steering Committee on Agriculture and Allied Sectors for Formulation of the Eleventh Five Year Plan (2007-2012)’, New Delhi.
PMO (Prime Minister’s Office) (2007): Press Release January 16, 2007, http://pmindia.nic.in/prelease/pcontent.asp?id=538.
Radhakrishna, R, K Subbarao, S Indrakant, and C Ravi (1997): ‘India’s public distribution system: A national and international perspective’, Discussion Paper No. 380, World Bank, Washington DC.
Rashid, S, S M Dev, M Thomas, and A Gulati (2005): ‘Reforming Food Price Policies in India: Rationales and Distributional Effects’, unpublished manuscript, International Food Policy Research Institute, Washington DC.
18
Rediff.com (2004): ‘Look where rice meant for the poor goes’. August 18, 2004, http://in.rediff.com/news/2004/aug/18rice.htm.
Srinivasan P V and S Jha, (2001): ‘Liberalized trade and domestic price stability: The case of rice and wheat in India’, Journal of Development Economics, 65, pp 417-441.
Swaminathan, M (2003): ‘The dangers of narrow targeting: An assessment of the Targeted Public Distribution System’, in Towards a food secure India: Issues and policies, S M Dev, K P Kannan and N Ramachandran (eds), Institute for Human Development, New Delhi.
Timmer, C P (1996): ‘Does BULOG Stabilize Rice Prices in Indonesia? Should it Try?’, Bulletin of Indonesian Economic Studies, 32, pp 45-74.
19
Table 1 – Regulatory Support to Facilitate FCI’s Operations Regulations/Restrictions Origin and
Current status Enforcement Details
I. International Trade Export Monopoly / restrictions Year introduced. 1965 Still enforced? Partially
Adjustable quantitative ceiling (currently 0.10 million tons) on export of wheat and coarse grains; strict licensing requirement for paddy export; and other grain exports are subject to registration of contracts.
Import Monopoly/restrictions Year introduced. 1965 Still enforced? Yes
FCI retains full monopoly control over import of common paddy, fine variety rice, wheat, and coarse grain. Wheat import by roller flourmills is allowed under certain conditions.
II. Movement restriction Year introduced 1941 (during
British rule) Still enforced? Yes, partially
Officially lifted in 1977, but has been enforced sporadically across India until recently. Now enforced in selected states
III. Credit concession to FCI Year introduced? 1973-74 Still enforced? Yes,
Interest rate was 7 % lower than market rates during 1972/73 – 1982/83, 5-6 % lower until mid-1990s, 2-3 % lower since 1997.
IV. Restrictions on Trade Credit Year Introduced. 1955 under
RBI’s Selective Credit Control
Act. Still enforced? Yes
Enforced at all India level; RBI restricts private traders access to credit by setting limits on working capital borrowing and interest rates.
V. Preferential transportation Year introduced. 1965 Still enforced? Yes
FCI gets priority in railway transportation over private traders all over India
VI. Restrictions on Storage Year Introduced? 1955 under
Essential Commodities
Act Still enforced? Yes
Imposes stock quantity limits. Lifted by the center, but frequently revised and sporadically enforced in recent years at the state level
VII. Restrictions on processing Year Introduced. 1958 under Rice
Milling Industry Act
Still enforced? Yes
Forces rice millers to deliver certain proportion of output (levy) to FCI at fixed processing margins; restricts open market sales until levy commitment is fulfilled. Enforced in most states.
Source: Rashid et al (2005).

20
Table 2 – Public procurement and distribution as percentage of production Period1 Wheat Rice 1967/68 4.04 8.99 1973/74 20.10 7.69 1976/77 15.42 11.17 1982/83 17.13 13.14 1985/86 20.45 15.07 1988/89 16.46 13.27 1995/96 19.70 15.50 2001/02 24.60 21.55 2002/03 28.9 26.5 2003/04 21.9 23.5 2004/05 24.5 28.9 2005/06 21.3 29.5 Notes: 1Triennium Ending. Source: Dev (forthcoming).
Table 3 – Costs of income transfer in various social safety net programs, 1999-00. Programs Total program
costs (billion Rs.)Cost of transferring 1 Rupee to the
poor Actual If targeting was
perfect Public Distribution Systems (PDS)* 73.16 6.68 1.52 Andhra Pradesh Rice Scheme (APRS) 10.63 6.46 1.59 Jawahar Rozgar Yojana (public works) 1.18 2.28 -- Maharashtra Employment Guarantee Scheme (EGS)
1.85 --
ICDS (Integrated Child Development Services)
8.8 1.44 --
Notes: * Due to the unavailability of state level data, total spending on PDS represents only the subsidies by the central government. This implies that the estimates of income transfer costs would have been larger if the state subsidies had been added.
Source: Dev et al (2004).
Table 4 – FCI's Expenses and Economic Costs (Current Prices) Years Economic costs (Rs.per quintal) Total Procurement Cost
Total Expenses
(Rs. million) Wheat Paddy Rice Total Distribution
Cost
Total Carrying Cost (Rs.per
quintal)
1981-82 7839.8 22.3 19.7 9.5 38.0 42.01984-85 12353.1 26.3 29.2 17.3 52.0 43.01989-90 15180.8 40.3 37.3 18.1 76.0 53.01994-95 40250.2 88.3 73.0 46.9 102.0 125.01999-00 61074.2 117.1 116.4 41.4 194.0 168.02003-04 93516.6 138.2 127.1 18.4 192.0 289.0Source: Annual reports of the FCI.

21
Figure 1: Cumulative Production (%) and Costs (C2 and A2): Wheat (TE 2002–03)
200250300350400450500550600650700750800
0 20 40 60 80 100
Cumulative production (%)
Rs p
er q
uint
al
PB UP RAJBH
HP
GUJ
HR
MP
MSP= 620
PB UPBH
HRRAJ
GUJHPMP
Cost C2
Cost A2
Note: BH: Bihar; GUJ: Gujarat; HP: Himachal Pradesh; HR: Haryana; PB: Punjab; MP: Madhya Pradesh;
RAJ: Rajasthan; UP: Uttar Pradesh. Source: MOF (2004) and MOA (2005).
Figure 2: Cumulative Production (%) and Costs (C2 and A2): Paddy (TE 2002–03)
200250300350400450500550600650700750800
0 20 40 60 80 100Cumulative production (%)
Rs p
er q
uint
al
PB BHUP OR AS WB
APKar
TN
HR Ker
MP
MSP= 523
PBAS UP BH ORWB
AP
KarHR
TN
MP
Ker
Cost C2
Cost A2
Note: AP: Andhra Pradesh; AS: Assam; BH: Bihar; GUJ: Gujarat; HP: Himachal Pradesh; HR: Haryana;
Kar: Karnataka; Ker: Kerala; MP: Madhya Pradesh; OR: Orissa; PB: Punjab; RAJ: Rajasthan; TN: Tamil Nadu; WB: West Bengal; UP: Uttar Pradesh.
Source: MOF (2004) and MOA (2005).

22
Figure 3 – Buffer Stocks of Cereals with Central Pool in India
0
10
20
30
40
50
60
7019
92-9
3
1993
-94
1994
-95
1995
-96
1996
-97
1997
-98
1998
-99
1999
-00
2000
-01
2001
-02
2002
-03
2003
-04
2004
-05
2005
-06
2006
-07
Buf
fer s
tock
(mill
ion
tons
Rice Wheat
Notes: For each financial year, stocks as on 1st of April, July, October, and January are shown. Source: Ministry of Agriculture, Govt. of India.
Figure 4 – Food Subsidy
0
20
40
60
80
100
120
140
160
1992
-93
1993
-94
1994
-95
1995
-96
1996
-97
1997
-98
1998
-99
1999
-00
2000
-01
2001
-02
2002
-03
2003
-04
2004
-05
Rs.B
illio
ns a
t 199
3-94
pric
es
0.3
0.4
0.5
0.6
0.7
0.8
0.9
1.0
1.1
% o
f GD
P at
199
3-94
pric
es
Rs. Billions % of GDP
Source: MOF (2006).