achieving complete reaction while the solid volume
TRANSCRIPT

HAL Id: hal-03330686https://hal-cnrs.archives-ouvertes.fr/hal-03330686
Submitted on 1 Sep 2021
HAL is a multi-disciplinary open accessarchive for the deposit and dissemination of sci-entific research documents, whether they are pub-lished or not. The documents may come fromteaching and research institutions in France orabroad, or from public or private research centers.
L’archive ouverte pluridisciplinaire HAL, estdestinée au dépôt et à la diffusion de documentsscientifiques de niveau recherche, publiés ou non,émanant des établissements d’enseignement et derecherche français ou étrangers, des laboratoirespublics ou privés.
Achieving complete reaction while the solid volumeincreases: A numerical model applied to serpentinisation
Benjamin Malvoisin, Yury Podladchikov, Artem Myasnikov
To cite this version:Benjamin Malvoisin, Yury Podladchikov, Artem Myasnikov. Achieving complete reaction while thesolid volume increases: A numerical model applied to serpentinisation. Earth and Planetary ScienceLetters, Elsevier, 2021, 563, pp.116859. 10.1016/j.epsl.2021.116859. hal-03330686

Achieving complete reaction while the solid volumeincreases: a numerical model applied to serpentinisation
Benjamin Malvoisina,b,∗, Yury Y. Podladchikovb,c, Artem V. Myasnikovc
aUniv. Grenoble Alpes, Univ. Savoie Mont Blanc, CNRS, IRD, IFSTTAR, ISTerre, 38000Grenoble, France
bISTE-FGSE, Universite de Lausanne, Quartier de la Mouline, Geopolis, CH-1015Lausanne, Switzerland
cFaculty of Mechanics and Mathematics, Moscow State University, Russian Federation
Abstract
Solid volume increases during the hydration of mantle rocks. The fluid pathwaysnecessary to feed the reaction front with water can be filled by the low densityreaction products. As a result, the reaction front dries out and the reactionstops at low reaction progress. This process of porosity clogging is generallypredicted to dominate in reactive transport models, even when processes suchas reaction-induced fracturing are considered. These predictions are not con-sistent with observations at mid-ocean ridges where dense mantle rocks can becompletely replaced by low density serpentine minerals. To solve this issue, wedevelop a numerical model coupling reaction, fluid flow and deformation. Highextents of reaction can only be achieved when considering that the increase insolid volume during reaction is accommodated through deformation rather thanporosity clogging. The model can generate an overpressure that depends on theextent of reaction and on the boundary conditions. This overpressure inducesviscoelastic compaction that limits the extent of the reaction. The serpentinisa-tion rate is therefore controlled by the accommodation of volume change duringreaction, and thus by deformation, either induced by the reaction itself or bytectonic processes.
Keywords: serpentinisation, numerical model, reaction rate, tectonicdeformation, solid volume increase, fluid pathways, porosity clogging,crystallisation pressure.
1. Introduction
Olivine, the main component of mantle peridotites, hydrates at temperaturebelow ∼ 400 C to form serpentine ± brucite ± magnetite ± hydrogen (Evans,1977). This so-called reaction of serpentinisation requires fluid transport alongpathways often formed by tectonic deformation. In marine geodynamic settings,5
∗Corresponding author: [email protected]
Preprint submitted to Earth and Planetary Science Letters February 22, 2021
the fluid pathways include detachment faults at slow-spreading mid-ocean ridges(Cannat, 1993; Escartın et al., 2008; Rupke and Hasenclever, 2017), bend-faultsat ocean trenches (Ranero et al., 2003; Van Avendonk et al., 2011), and ex-tensional faults at passive margins (Bayrakci et al., 2016). Here we focus onserpentinisation during mantle rock exhumation in the footwall of detachment10
faults at slow spreading mid-ocean ridges.Serpentinisation induces changes in the behaviour of the oceanic lithosphere
due to strong differences in the physico-chemical properties of the reactants andthe products. Serpentine content above ∼ 10 % reduces the rock strength bydecreasing the friction coefficient from 0.6 to ∼ 0.4 (Escartın et al., 1997) with15
consequences on the rheology of the detachment faults active at mid-ocean ridges(Bickert et al., 2020). Magnetite is a ferrimagnetic mineral with a magnetisa-tion four orders of magnitudes higher than olivine (Malvoisin et al., 2012b). Itsprecipitation during serpentinisation can generate magnetic anomalies on theseafloor (Szitkar et al., 2014). Hydrogen is an energy source for chemosynthetic20
organisms and participates in the abiotic synthesis of organic compounds pos-sibly involved in the origin of life (Russell et al., 2010; McCollom and Seewald,2013). Serpentinisation is also an exothermic reaction possibly modifying theheat budget at mid-ocean ridges (Macdonald and Fyfe, 1985). Predicting theevolution of the oceanic lithosphere thus requires to model the rate and the25
extent of serpentinisation at mid-ocean rdiges.Serpentinisation is already modelled at the kilometre scale to investigate
its influence on hydrothermal circulation, heat budget and geodynamics (Em-manuel and Berkowitz, 2006; Delescluse and Chamot-Rooke, 2008; Iyer et al.,2010; Bickert et al., 2020). Reaction rate is assumed to be controlled by a sin-30
gle process in these models. Emmanuel and Berkowitz (2006) and Iyer et al.(2010) used a law derived from experiments of olivine powder hydration (Mar-tin and Fyfe, 1970) whereas Bickert et al. (2020) relate serpentinisation rateto the shear deformation. It remains unclear which assumption should be pre-ferred to model serpentinisation at large scale. Moreover, the used models are35
either incompressible, considering a constant porosity or using a parametrizedlaw for the evolution of porosity. Such approaches are justified by the needto use simplifying assumptions when modelling processes at different time andspace scales. However, they cannot take into account the impact of hydrationon density and porosity whereas these parameters strongly modify deformation40
and fluid flow.Volume change during reaction is the key parameter for modelling the cou-
plings between reaction, deformation and fluid flow. Serpentinisation inducesa change in solid volume (∆V/V ) of ∼ 50 % in a closed system (Macdonaldand Fyfe, 1985; O’Hanley, 1992). Mass transfer through aqueous species trans-45
port can reduce the increase in solid volume (Thayer, 1966; Carmichael, 1987;Fletcher and Merino, 2001). However, Malvoisin et al. (2020b) and Klein and LeRoux (2020) measure ∆V/V in natural samples and in experiments close to thetheoretical value for reaction in a closed system, suggesting that mass transfer islimited, at least during the incipient stage of the reaction. The serpentinisation50
rate directly depends on the evolution of the fluid pathways during reaction.
2
They initially form by thermal cracking (Demartin et al., 2004; Boudier et al.,2010) or tectonic deformation (Roumejon et al., 2015), and then evolve duringreaction as a consequence of ∆V/V . The precipitation of reaction products inthe pores reduces the permeability by several orders of magnitude (Godard et al.,55
2013; Farough et al., 2015). However, a porosity is observed at the nanoscalein serpentinized peridotites (Tutolo et al., 2016). Fluid pathways could thusbe preserved during reaction, even though this should be confirmed with theacquisition of data on pore connectivity at the nanoscale. The positive changein volume during reaction also generates stresses (i.e. crystallisation pressure)60
sufficient to fracture the rock (Jamtveit et al., 2009; Kelemen and Hirth, 2012;Plumper et al., 2012; Malvoisin et al., 2017).
The positive ∆V/V is considered in some models of serpentinisation. It in-duces stress build-up and crack generation in the models of reaction-inducedfracturing (Rudge et al., 2010; Ulven et al., 2014; Shimizu and Okamoto, 2016;65
Malvoisin et al., 2017; Zhang et al., 2019). These models predict an increasein reactive surface area during reaction and reproduce the mesh microtextureobserved in natural samples. However, they either do not take into accountDarcian flow, or they do not conserve fluid mass, and are consequently not ableto quantitatively model porosity evolution during reaction (Evans et al., 2020).70
Reactive transport models such as TOUGHREACT (Xu et al., 2011) incorpo-rate the volumetric effect of reaction on transport properties. They predict astrong reduction in porosity during reaction inducing a positive ∆V/V , prevent-ing the achievement of the high extents of reaction measured in natural samples(Liu et al., 2019; Marini, 2007). This limitation probably arises from the omis-75
sion in these models of mechanisms responsible for fluid pathways generationor preservation. Evans et al. (2020) consider reaction-induced fracturing in amodel combining reaction and fluid flow. They were able to model the effecton fluid pathway evolution of the competition between cracking and porosityclogging. However, high extents of reaction (> 60 %) are only achieved in the80
cracks with limited hydration in the rock groundmass. The main issue regard-ing serpentinisation modelling thus consists in being able to predict the highextents of reaction observed in the natural samples.
The present contribution aims at proposing a new model of serpentinisationaddressing this issue. We derive a new set of equations to model the couplings85
between reaction, deformation and fluid flow. Based on observations in naturalsamples, we consider that the solid volume increase is accommodated throughdeformation rather than porosity clogging. The new model is applied to serpen-tinisation at mid-ocean ridges in the footwall of a detachment fault. We modelfluid-rock interaction during hydrothermal circulation with a one-dimensional90
numerical model. The impact of the parameter values on the model predictionsis explored. On the contrary to previous modelling attempts, the new approachallows high extents of reaction to be reached and reaction-induced pressureincrease to be predicted. The model is finally used to discuss the processescontrolling the serpentinisation rate.95
3

2. Modelling the couplings between reaction, deformation and fluidflow
The model considers a porous matrix of dunite reacting with water in thestability field of serpentine + brucite. Serpentinisation is assumed to be iso-chemical except for the addition of water based on the study of Malvoisin et al.100
(2020b). Si, Mg and Fe are thus not transported as aqueous species betweenthe model grid points. We use here a two-phase continuum medium approachby defining macroscopic properties such as porosity and extent of reaction fora mineralogical assemblage potentially composed at each grid point of botholivine and its reaction products. This approach is valid at a scale larger than105
the olivine grain size so that the rock properties can be averaged over a signif-icant number of grains. Olivine grains reacting during serpentinisation have atypical size of 100 µm (Malvoisin et al., 2017). The model can thus be usedfrom a scale of ∼ 1 mm. The model parameters and their values are given inTable 1. The model is based on the model developed in Malvoisin et al. (2015)110
and in Omlin et al. (2017). The thermodynamic admissibility of the systemsof equations derived below is also verified following the procedure described inYarushina and Podladchikov (2015) (see supplementary materials for details).
The mass conservation equations can be written for the total system as:
∂ (ρwφ+ ρs (1− φ))
∂t+∇j
(ρwφv
jw + ρs (1− φ) vjs
)= 0 (1)
,115
and for the dry solid as:
∂ (ρs (1−Xs) (1− φ))
∂t+∇j
(ρs (1−Xs) (1− φ) vjs
)= 0 (2)
where Xs, φ, ρ, vj and ∇j are the mass fraction of water bound to thesolid, the porosity, the density, the j components of the velocity vector and thej components of the del operator, respectively. The solid properties are denotedwith a subscript s, and the water properties are denoted with a subscript w. This120
particular choice of two independent mass conservation equations is motivatedby their independence on (de)hydration reactions and the absence of reaction-related source terms.
The conservation of fluid momentum is modelled with the Darcy’s law:
φ(vjw − vjs
)= − kφ
ηw
(∇jPw + ρwge
jz
)(3)
where kφ is the permeability, ηw is the fluid viscosity, Pw is the fluid pres-125
sure and ejz are the components of an upward directed unit vector. Combiningequation 3 with equations 1 and 2 allows water velocity to be eliminated.
The changes in density are modelled by introducing compressibilities. Thesolid compressibility and the density change during reaction contribute to the
4

Symbol Definition Unit ValueL Length of the numerical model m 10−1 − 102
ρw Water density kg.m−3 1000 (at 200C and 50 MPa)ρs Solid density kg.m−3 3300 (initial value)vjw Velocity of water m.s−1
vjs Velocity of the solid m.s−1
Xs Mass fraction of water bound in the solid None 0 (initial value)Xseq Mass fraction of water bound in the solid at
the equilibriumNone 0.126?
φ Porosity Noneφ0 Initial porosity None 0.01φp Porosity above which a porous rock has the
same reactive surface area as a powderNone 0.38
kφ Permeability m2 10−20 − 10−16
ηw Water viscosity Pa.s 10−4
g Gravity acceleration m2.s−1 9.81ejz Unit vector along upward directed z-axis Noneηφ Pore viscosity Pa.s 1017 − 1020
τ Characteristic time for reaction s 107 − 109
Pw Fluid pressure Pa 50.106 (initial value)Ps Solid pressure Pa 50.106 (initial value)P Total pressure (fluid + solid) Pa 50.106 (initial value)βd Drained compressibility Pa−1 7.10−10
β′s Solid compressibility measured in an unjack-eted test
Pa−1 1.5.10−11
βw Fluid compressibility defined in equation 6 Pa−1 10−9 ?
βef Effective compressibility in front of Pw Pa−1
βet Effective compressibility in front of P Pa−1
βsr Change in solid density due to reaction (de-fined in equation 4)
None 1.7?
˙εV Dilatational strain rate s−1 10−14 − 10−9
ξ Extent of reaction (ξ = XsXseq
) None 0− 1
ξ Serpentinisation rate s−1
t80 Time to reach 80 % of extent of reaction s
Table 1: Symbols used in the mathematical model. ?: parameter value calculated withPerple X (Connolly, 2005)
5
solid density evolution:130
1
ρs
dρsdt
= β′s
(dPsdt− P − Pw
(1− φ)2
dφ
dt
)− βsr
1
1−Xs
dXs
dt(4)
where β′s is the solid compressibility measured in an unjacketed test, βsris the density change associated with hydration (Xs modification), and Ps isthe solid pressure. d
dt is the material derivative of the solid phase defined asddt = ∂
∂t + vjs∇j . Ps is combined with Pw to calculate the total pressure (P ) as:
P = φPw + (1− φ)Ps (5)
The change in fluid density is calculated by introducing the fluid compress-135
ibility (βw):
1
ρw
dwρwdt
= βwdwPwdt
(6)
where dwdt is the material derivative of the water defined as dw
dt = ∂∂t + vjw∇j
Finally, the change in composition (Xs) is modelled with a first-order kineticlaw:
dXs
dt=
(φ
φp
)2/3Xseq −Xs
τ(7)
where τ is the characteristic time for reaction and Xseq is the water mass140
fraction bound to the solid at the equilibrium, that is in the serpentine + bruciteassemblage. The evolution of reactive surface area during reaction is modelledas a function of porosity with the geometrical relationship proposed by Lichtner(1988) and Kieffer et al. (1999). φp is the minimum porosity for which a porousrock has the same reactive surface area than a powder. We use a value of 0.38145
in the following based on the experimental results of Llana-Funez et al. (2007).Equations 1, 2, 3, 4, 6, 5 and 7 form a system of nine equations in thirteen
unknowns, 7 scalars (ρw, ρs, φ, Xs, Pw, Ps and P ) and 6 vector components(vjw and vjs). Solving this system of equations thus requires four additionalequations.150
The conservation of total momentum could first be used (Malvoisin et al.,2015) but this would require to solve for shear stress evolution which is beyondthe scope of this study. We thus explore the behaviour of the system of equationsfor two cases: (i) a constant solid volume (∇jvjs = 0); (ii) a constant totalpressure (P = constant). These approximations correspond to idealized systems155
in which reaction-induced change in volume is either not accommodated (i) orfully accommodated (ii) by deformation. The behaviour of a real system isexpected to be intermediate between these two extreme cases. Nevertheless,these approximations provide maximum estimates for total pressure variationduring reaction (i) and reaction-induced deformation (ii).160
The last equation necessary to close the system of equations is the equationfor solid deformation. We show below why this equation plays a key role for
6

modelling solid volume change during reaction. We first present the classicalform of this equation usually used in reactive transport models. We then showhow it should be modified to take into account observations at the nanoscale of165
limited mass transfer during serpentinisation.
2.1. Classical approach
The classical approach refers here to models in which reaction-induced defor-mation is not considered in the equations for solid deformation. This approachis used in most of the models considering the couplings between reaction and170
deformation(Balashov and Yardley, 1998; Xu et al., 2011; Tian and Ague, 2014;Malvoisin et al., 2015; Tian et al., 2018; Malvoisin et al., 2020a; Evans et al.,2020; Schmalholz et al., 2020). With the classical approach, solid deformation ismodelled independently from reaction for example with a visco-elastic rheology(Yarushina and Podladchikov, 2015):175
∇jvjs = −βddP
dt+ (βd − β′s)
dPwdt− P − Pw
(1− φ) ηφ(8)
where βd and ηφ are respectively, the drained compressibility and the poreviscosity.
Re-arranging equations 1, 2, 3, 4, 5, 6 and 7 with additional equation 8provides a closed system of three equations describing the system evolutionwith three unknown scalar functions, porosity (φ), fluid pressure (Pw) and mass180
fraction of water in the solid (Xs):
dXs
dt=
(φ
φp
)2/3Xseq −Xs
τ
∇jkφηw
(∇jPw + ρwge
jz
)= −βet
dP
dt+ βew
dPwdt− P − Pw
(1− φ) ηφ+
(ρsρw− (1 + βsr)
)1− φ
1−Xs
dXs
dt
1
(1− φ)
dφ
dt=
(βet −
β′sφ
1− φ
)(−dPdt
+dPwdt
)− P − Pw
(1− φ) ηφ− 1 + βsr
1−Xs
dXs
dt(9)
where βet and βew are the total and fluid effective compressibilities, respec-tively, defined as
βet = βd − β′s, (10)
andβew = βet + φ (βw − β′s) . (11)
Reactive terms appear in the fluid pressure and the porosity evolution equa-tions in 9. This implies that volume change during reaction is accommodated185
through precipitation in the pores and fluid pressure variation. Mineralogicalreactions in the presence of fluid proceed through four steps: the transport offluid up to the primary minerals, the dissolution of the primary minerals, thetransport of aqueous species and the precipitation of the secondary minerals
7

A: Classical approach: no reaction-induced deformation
and porosity clogging
B: New approach: reaction-induced swellingand porosity preservation
Primary mineral
Pores1
2
3
4
Primary mineral
1
23 4&
Figure 1: The two types of models to link reaction, porosity evolution and solid deformation.Mineralogical reactions in the presence of fluid can be decomposed in four steps: fluid transportin the pore network (1); primary mineral (in yellow) dissolution (2); aqueous species transport(3); and secondary phase (in green) precipitation (4). A: the classical approach consists inconsidering that aqueous species are transported up to the pores where precipitation occurs.This process does not generate deformation directly. B: the new approach proposed here isbased on observations at the nanoscale showing that aqueous species transport can be limitedto a scale of less than 100 nm. As a result, the reaction products do not precipitate in thepores but at the surface of the primary mineral. This implies that reaction induces rockdeformation (i.e. swelling; red arrows).
(Figure 1). Modelling fluid-mediated reactions thus requires to assume that190
aqueous species transport occurs. We do not consider this process in our equa-tions, implying that the occurrence of aqueous species transport is restricted toa scale below the spacing of the grid points in our model (< 1 mm). However, wedirectly relate here porosity evolution to reaction. This implicitly requires thatmass transfer efficiently occurs at least at the micrometer scale from the olivine195
surface up to the pores (Figure 1A). This latter assumption may not be veri-fied during hydration reactions as suggested by observations in natural samples(Beard et al., 2009; Boudier et al., 2010; Malvoisin et al., 2020b). We proposein the following a way to take into account these observations by modifyingequation 8.200
2.2. A new approach: reaction-induced swelling
At the submicrometre scale, Beard et al. (2009) and Malvoisin et al. (2020b)report reaction products dominated by a serpentine + brucite mixture with acomposition similar to olivine except for the addition of water. Boudier et al.(2010) show the presence of a ∼ 100 nm thick zone coating the olivine surface,205
and composed of pre-hydrated olivine. Serpentinisation is thus isochemical atleast at the hundred of nanometre scale with limited aqueous species transport,probably by diffusion at grain boundaries (Tutolo et al., 2016) (Figure 1B). Such
8
a replacement process with limited transport is not expected to significantlymodify the existing pores. This implies that the positive change in solid volume210
occurring during reaction is not accommodated by mass transfer up to the poresbut rather by deformation (Figure 1B). All these observations can be taken intoaccount by modifying equation 8 such that porosity evolution does not dependon volume change during reaction:
∇jvjs = −βddP
dt+ (βd − β′s)
dPwdt− P − Pw
(1− φ) ηφ+
1 + βsr1−Xs
dXs
dt(12)
The last term in equation 12 is the deformation induced by solid volume215
change. With this new equation for solid momentum conservation, a new closedsystem of three equations for three unknown functions, φ, Pw and Xs is obtainedby also using equations 1, 2, 3, 4, 5, 6 and 7:
dXs
dt=
(φ
φp
)2/3Xseq −Xs
τ
∇jkφηw
(∇jPw + ρwge
jz
)= −βet
dP
dt+ βew
dPwdt− P − Pw
(1− φ) ηφ
+
(ρs (1− φ)
ρw+ φ (1 + βsr)
)1
1−Xs
dXs
dt
1
(1− φ)
dφ
dt=
(βet −
β′sφ
1− φ
)(−dPdt
+dPwdt
)− P − Pw
(1− φ) ηφ(13)
2.3. Numerical methods, initial set-up and parameters
The numerical model aims at determining the conditions necessary to reach220
high reaction progress during serpentinisation at mid-ocean ridges. We build asimple idealized model for fluid-rock interaction during hydrothermal circulationin exhumed mantle rocks. We do not consider shear deformation and the strongchanges in rock composition occurring during extensive alteration. The modelthus rather applies to a region located outside the shear zones involved in ex-225
humation in the footwall of a detachment fault . We consider a one-dimensionaldomain of length L undergoing serpentinisation at 200C and 50 MPa (initialfluid and total pressures). We impose a constant fluid pressure of 50 MPa at themodel boundaries during simulation. The domain is assumed horizontal so thatgravity terms can be neglected. It is initially exclusively composed of olivine230
(dunite; Xs = 0). The initial porosity is of φ0 = 0.01 to allow for fluid transportand reaction initiation. We predict the evolution of porosity, pressures and rockhydration degree with the systems of equations 9 and 13 for a wide range ofmodel parameter values.
The numerical scheme consists in solving nondimensional versions of equa-235
tions 9 and 13 with an explicit algorithm using pseudotransient iterations Kelleyand Keyes (1998). This algorithm is validated for the system of equations 9 by
9

reproducing an analytical solution in Omlin et al. (2017). We also produce ananalytical benchmark for the system of equations 13. The algorithm is validatedfor this system of equations by reproducing an analytical prediction (see the de-240
rived analytical solution in the supplementary materials). The non-dimensionalequations are obtained by choosing the model scale as the length scale (δ = L),the inverse of the compressibility as the pressure scale (p? = 1
βef0) and the
characteristic time for viscous compaction as the time scale (t? =ηφp? ). This
leads to the introduction of two nondimensional numbers describing the sys-245
tem behaviour : the Dahmkohler number comparing the characteristic timesfor viscoelastic relaxation and for reaction (Da =
βef0ηφτ ); the Deborah number
comparing the characteristic times for viscoelastic relaxation and for viscous
compaction (De =√
kφηφηwL2 ). The non-dimensional systems of equations solved
in the numerical models can be found in the supplementary materials. For250
clarity, we present the following results with dimensional quantities.The values of the parameters used in the model are given in Table 1. Some
parameters such as compressibility are well-constrained. βw is calculated withPerple X (Connolly, 2005) by computing the derivative of ρw with pressure at200C and 50 MPa. We also use Perple X to compute the change in solid density255
as a function of Xs that is used to calculate βsr. For the other less constrainedparameters, we provide in the following ranges of possible values which are usedto compute the Da and De values to be used in the simulations.
Observations in natural samples reveal that preferred fluid pathways sep-arate 10 cm- to 100 m-wide domains undergoing serpentinisation (Roumejon260
et al., 2015). We use this size range as the length of the model (L). Permeabil-ity measured during fluid flow experiments on peridotite takes values comprisedbetween 10−20 and 10−16m2 (Godard et al., 2013; Farough et al., 2015). Poreviscosity spans over four orders of magnitude (1017 to 1020Pa.s; (Hilairet et al.,2007)). The characteristic time for dunite serpentinisation are calculated for an265
initial olivine grain size of 100 µm based on kinetic laws determined with exper-iments on powders. The main parameter controlling reaction rate is the fluidcomposition. The slower rates are measured in experiments using pure water(τ = 2.108s) (Malvoisin et al., 2012a) whereas the faster rates are measured withalkaline fluids (τ = 107s) (Lafay et al., 2012). We use in the following τ values270
comprised between 107s and 109s. These estimates of parameters are used todetermine Da and De values ranging from 10−1.15 to 103.8 and 10−1.5 to 105,respectively. For each system of equations, we perform simulations with the twoassumptions of constant solid volume (i) and constant total pressure (ii). Werun 930 simulations at various De and Da values for each pair of solved equa-275
tions/assumption (4 x 930 simulations in total). The simulations are stoppedwhen the minimum porosity is below 10−15 or when the maximum extent ofreaction is above 99 %.
2.4. Porosity clogging with the classical approach
We first use the system of equations 9 to model serpentinisation. Reaction280
leads to fluid pressure decrease due to water consumption by reaction. This
10

0 0.5 1Time (yr)
0
0.5
1
1.5
2
2.5
3
Exte
nt o
f rea
ctio
n (%
)
A
0 0.5 1Time (yr)
48.5
49
49.5
50
Pres
sure
(MPa
)
B
0 0.5 1Time (yr)
0
0.2
0.4
0.6
0.8
1
Poro
sity
(%)
C
: constant volume approximation (i): constant total pressure approximation (ii)
Figure 2: Results of simulations using the classical approach (equations 7 and 9). The evolu-tions with time of extent of reaction (A), fluid pressure (plain line) and total pressure (dashedline) (B), and porosity (C) are displayed. The models displayed with black and red lines con-sider a constant volume (i) or a constant total pressure (ii) for closing the system of equations,respectively. The blue line in subpanel A corresponds to the maximum extent of reaction pre-dicted for a non-deforming solid matrix (ξmax; see text for details). The models are run withkφ = 10−19m2, L = 10m, τ = 5.107s and ηφ = 1018Pa.s (De = 3; Da = 14)
11

decrease highly depends on the De and Da numbers used in the simulationswhen a constant solid volume (i) is assumed (Figure S2B). At high De and lowDa, Pw variations are limited to several megapascals (Figure 2) whereas, at lowDe and high Da, it can reach several tens of megapascals (Figure S2). The285
water vapor pressure at 200 C (1.6 MPa) can even be achieved. The modeldoes not take into account the effect of vaporisation on density evolution and isthus not relevant for fluid pressures below the water vapor pressure. The fluidpressure decrease is limited to less than 3 MPa when a constant total pressure(ii) is used (Figures 2 B and S3 B). The difference between fluid and total290
pressure indeed drives viscoelastic compaction, limiting fluid pressure variationsrelative to total pressure. For all the parameter values investigated here, themodel predicts a similar decrease of the reaction rate due to porosity cloggingby reaction products (Figures 2 A, S2 A and S3 A). The reaction ultimatelystops when the porosity and the reactive surface area are zero. The maximum295
extent of reaction reached in the simulations is ξmax = 3%. The maximumreaction extent can be predicted by integrating the porosity evolution equationin the system of equation 9 when assuming no deformation and reaction thuslimited by the free space initially available (φ0). The obtained expression isξmax = φ0
Xseq(1+βsr)giving a value of 2.94% for φ0 = 0.01, consistent with the300
model predictions. This expression of ξmax also provides the minimum initialporosity required to completely serpentinise a rock with the model based onequations 9. We calculate here a minimum initial porosity of 34 %.
2.5. Complete serpentinisation with reaction-induced deformation
The results of numerical modelling with equations 13 significantly depend305
on the assumption used for closing the system of equations. When assuming aconstant solid volume (i), the evolutions of extent of reaction and porosity aresimilar to the classical approach. The extent of reaction reaches a maximumclose to ξmax (Figures 3 A and S4 A) as the porosity decreases to become zero(Figures 3 C). The mechanism of porosity decrease is however different since it is310
due to mechanical closure here whereas it is due to the precipitation of reactionproducts in the simulations performed with the classical approach. The drivingforce for viscoelastic compaction is the total pressure increase as a result ofsolid volume increase during reaction (Figure 3 C). We calculate a maximumtotal pressure increase of 14 MPa along a segment spanning from Da = 10 and315
De = 101.5 to Da = 104 and De = 103 in Figure S4 B. This indicates thatreaction-induced pressure increase is favored by a high reaction rate, a highviscosity and/or a low effective compressibility.
We observe two types of behaviour when assuming a constant total pressure(ii). At high Da and low De, porosity clogging occurs as a a result of mechanical320
compaction as observed with assumption (i) (Figure S5). The final extent ofreaction is close to ξmax. At low Da and high De, the porosity and the fluidpressure only change during simulation by less than 0.5 % and several megapas-cals, respectively (Figure 3 E and F). Fluid pathways are thus preserved, andthe extent of reaction reaches 100 % (Figures 3 D and S5 A). The solid volume325
12

0 0.5 1
Time (yr)
0
0.5
1
1.5
2
2.5
3
3.5E
xte
nt
of
rea
ctio
n (
%)
Constant solid volume approximation (i)
A
0 0.5 1
Time (yr)
48
50
52
54
56
58
60
62
64
Pre
ssu
re (
MP
a)
B
0 0.5 1
Time (yr)
0
0.2
0.4
0.6
0.8
1
Po
rosity (
%)
C
0 50 100
Time (yr)
0
20
40
60
80
100
Exte
nt
of
rea
ctio
n (
%)
Constant total pressure approximation (ii)
D
0 50 100
Time (yr)
43
44
45
46
47
48
49
50
Pre
ssu
re (
MP
a)
E
0 50 100
Time (yr)
0
0.2
0.4
0.6
0.8
1
Po
rosity (
%)
F
Figure 3: Results of the reaction-induced deformation numerical model (equations 7 and 13)when assuming a constant solid volume (A, B and C) or a constant total pressure (D, E andF). The evolutions with time of extent of reaction (A and D), fluid pressure (plain line) andtotal pressure (dashed line) (B and E), and porosity (C and F) are displayed. The blue linein subpanels A and D corresponds to the maximum extent of reaction predicted for a non-deforming solid matrix (ξmax; see text for details). The model is run with kφ = 10−19m2,L = 10m, τ = 5.107s and ηφ = 1018Pa.s
13
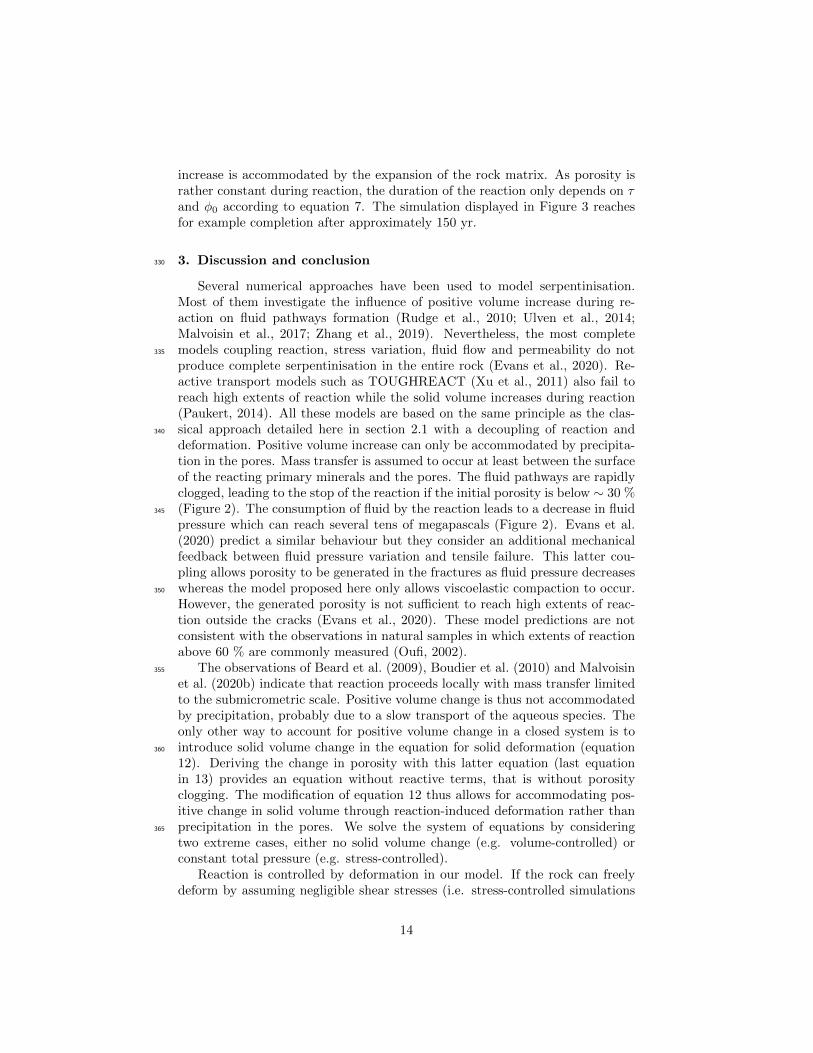
increase is accommodated by the expansion of the rock matrix. As porosity israther constant during reaction, the duration of the reaction only depends on τand φ0 according to equation 7. The simulation displayed in Figure 3 reachesfor example completion after approximately 150 yr.
3. Discussion and conclusion330
Several numerical approaches have been used to model serpentinisation.Most of them investigate the influence of positive volume increase during re-action on fluid pathways formation (Rudge et al., 2010; Ulven et al., 2014;Malvoisin et al., 2017; Zhang et al., 2019). Nevertheless, the most completemodels coupling reaction, stress variation, fluid flow and permeability do not335
produce complete serpentinisation in the entire rock (Evans et al., 2020). Re-active transport models such as TOUGHREACT (Xu et al., 2011) also fail toreach high extents of reaction while the solid volume increases during reaction(Paukert, 2014). All these models are based on the same principle as the clas-sical approach detailed here in section 2.1 with a decoupling of reaction and340
deformation. Positive volume increase can only be accommodated by precipita-tion in the pores. Mass transfer is assumed to occur at least between the surfaceof the reacting primary minerals and the pores. The fluid pathways are rapidlyclogged, leading to the stop of the reaction if the initial porosity is below ∼ 30 %(Figure 2). The consumption of fluid by the reaction leads to a decrease in fluid345
pressure which can reach several tens of megapascals (Figure 2). Evans et al.(2020) predict a similar behaviour but they consider an additional mechanicalfeedback between fluid pressure variation and tensile failure. This latter cou-pling allows porosity to be generated in the fractures as fluid pressure decreaseswhereas the model proposed here only allows viscoelastic compaction to occur.350
However, the generated porosity is not sufficient to reach high extents of reac-tion outside the cracks (Evans et al., 2020). These model predictions are notconsistent with the observations in natural samples in which extents of reactionabove 60 % are commonly measured (Oufi, 2002).
The observations of Beard et al. (2009), Boudier et al. (2010) and Malvoisin355
et al. (2020b) indicate that reaction proceeds locally with mass transfer limitedto the submicrometric scale. Positive volume change is thus not accommodatedby precipitation, probably due to a slow transport of the aqueous species. Theonly other way to account for positive volume change in a closed system is tointroduce solid volume change in the equation for solid deformation (equation360
12). Deriving the change in porosity with this latter equation (last equationin 13) provides an equation without reactive terms, that is without porosityclogging. The modification of equation 12 thus allows for accommodating pos-itive change in solid volume through reaction-induced deformation rather thanprecipitation in the pores. We solve the system of equations by considering365
two extreme cases, either no solid volume change (e.g. volume-controlled) orconstant total pressure (e.g. stress-controlled).
Reaction is controlled by deformation in our model. If the rock can freelydeform by assuming negligible shear stresses (i.e. stress-controlled simulations
14
(ii)), a maximum serpentinisation rate (ξmax) is estimated since shear deforma-370
tion can only delay the volumetric expansion. ξmax depends only on τ and isthus controlled by dissolution and precipitation occurring at the olivine surface(Figures 3 and S5). Complete reaction is achieved in less than 1000 yr, in agree-ment with previous estimates based on experimental data and reaction-inducedfracturing modelling (Malvoisin et al., 2017). The rock expands by approxi-375
mately 50 % with consequences for surface uplift and large scale deformation atmid-ocean ridges and in subduction zones (Germanovich et al., 2012).
If deformation is not allowed (i.e. volume-controlled simulations (i)), theserpentinisation rate is zero and the reaction does not reach completion (Fig-ures 3 and S4)). We refine the estimation of the minimum reaction rate (ξmin)380
in the following by considering volumetric expansion associated with tectonicdeformation which is the main process of deformation at mid-ocean ridges (Can-nat, 1993). Tectonic deformation is partitioned between dilatational and shearstrains. Microstructural observations indicate that strain in detachment faultsis accommodated by crystal-plastic flow and diffusive mass transfer in multiple385
shear zones (Schroeder and John, 2004; Boschi et al., 2006). Reaction-softeningassociated with talc formation promotes shear strain localisation, suggestingthat shear deformation accommodates a significant proportion of the deforma-tion. However, this proportion is difficult to quantify since most numerical mod-els of mantle rock exhumation at mid-ocean ridges are incompressible (Behn and390
Ito, 2008; Bickert et al., 2020). The model developed here is one-dimensionaland does not allow for shear deformation to be modelled. Moreover, volumeincrease during reaction can only be accommodated by expansion. As a result,we only consider dilatational strain in the following by introducing a constantrate of expansion in the model (∇jvjs = ˙εV with ˙εV a constant dilatational395
strain rate imposed by tectonics). Our model is thus not able to probe all thecomplex interactions between tectonic deformation and serpentinisation at mid-ocean ridges. However, it allows determining the conditions for which tectonicexpansion is slower than volume increase induced by dissolution/precipitation(tectonic-controlled versus dissolution/precipitation-controlled rate).400
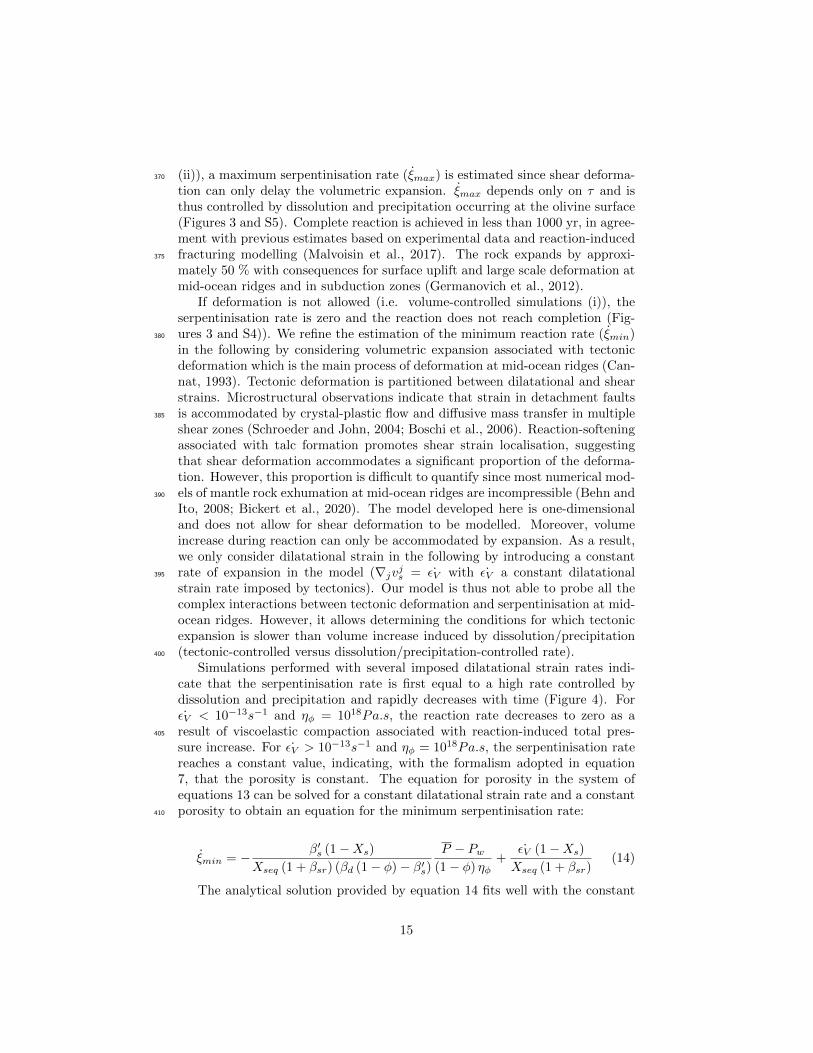
Simulations performed with several imposed dilatational strain rates indi-cate that the serpentinisation rate is first equal to a high rate controlled bydissolution and precipitation and rapidly decreases with time (Figure 4). For˙εV < 10−13s−1 and ηφ = 1018Pa.s, the reaction rate decreases to zero as a
result of viscoelastic compaction associated with reaction-induced total pres-405
sure increase. For ˙εV > 10−13s−1 and ηφ = 1018Pa.s, the serpentinisation ratereaches a constant value, indicating, with the formalism adopted in equation7, that the porosity is constant. The equation for porosity in the system ofequations 13 can be solved for a constant dilatational strain rate and a constantporosity to obtain an equation for the minimum serpentinisation rate:410
ξmin = − β′s (1−Xs)
Xseq (1 + βsr) (βd (1− φ)− β′s)P − Pw
(1− φ) ηφ+
˙εV (1−Xs)
Xseq (1 + βsr)(14)
The analytical solution provided by equation 14 fits well with the constant
15

0 0.5 1 1.5 2 2.5 3Time (yr)
-12
-11
-10
-9
log 10
( )
: rate imposed by dissolution and precipitation: equation 14 (tectonic and viscous compaction): second term of the right-hand side of equation 14 (tectonic only)
v
v
v
vv
Figure 4: Serpentinisation rate (ξ) as a function of time for the model considering reaction-induced deformation and an imposed tectonic expansion. The plain black lines correspondsto five simulations performed with kφ = 10−19m2, L = 10m, τ = 5.107s, ηφ = 1018Pa.s,and at the indicated dilatational strain rates ( ˙εV ). The blue dashed line corresponds to therate imposed by dissolution and precipitation. The black dashed lines corresponds to the ratecalculated with equation 14 considering tectonic deformation and viscous compaction. The reddashed lines corresponds to the rate associated with tectonic deformation only and calculatedwith the second term of right-hand side of equation 14. Note that the serpentinisation ratetends towards the rate imposed by tectonic deformation for ˙εV > 10−13s−1.
reaction rate achieved in the numerical simulations (Figure 4), showing that theminimum serpentinisation rate is controlled by a competition between viscouscompaction (first term of right-hand side of equation 14) and tectonic expansion(second term of right-hand side of equation 14). Figure 5 provides the time nec-415
essary to reach an extent of reaction of 80 % as a function of dilatational strainrate and viscosity (see Supplementary material for details). At low viscosityand low strain rate, reaction does not reach completion as viscous compactiondominates. At moderate to high viscosity and ˙εV < 3.10−10s−1, the minimumserpentinisation rate is controlled by tectonic deformation. The time to reach420
80 % of reaction linearly decreases with strain rate according to the second termof right-hand side of equation 14. It is in the order of millions or thousands ofyears for ˙εV = 10−13s−1 and ˙εV = 10−10s−1, respectively. At ˙εV > 3.10−10s−1,the serpentinisation rate calculated with equation 14 is higher than the ratecalculated with equation 7, suggesting that serpentinisation rate is controlled425
by dissolution and precipitation at the olivine surface.Estimating if serpentinisation is controlled by reaction-induced deformation
or by tectonics is essential to determine if ξmax or ξmin should be used tomodel serpentinisation at large scale. Reaction-induced deformation can onlyoccur if the pressure generated during volume expansion is sufficient to induce430
deformation. The maximum total pressure increase (∆Pmax) can be derived
16

17 18 19 20-14
-13
-12
-11
-10
-9
1
2
3
4
5
6
7
8
No reaction: Viscoelastic compaction
Controlled by dissolution and precipitation
Controlled by tectonic expansion
v
Figure 5: Time necessary to reach 80 % of extent of reaction (t80 in years) as a function ofviscosity (ηφ) and dilatational strain rate ( ˙εV ). t80 is calculated with equation 14. Threedomains can be distinguished: a domain with no reaction due to viscous compaction leadingto fluid pathways clogging, tectonic-controlled domain in which the serpentinisation rate canbe expressed with the second term of the right-handed side of equation 14, and a dissolution-and precipitation controlled domain in which the rate determined with equation 14 is fasterthan the one determined with equation 7.
from equation 13 as:
∆Pmax = −1 + βsrβd
log (1− ξXseq) (15)
Its values for ξmax and ξ = 1 are 14 MPa and ∼ 500 MPa, respectively, ingood agreement with the maximum value calculated in the volume-controlledsimulations (14 MPa at ξmax; Figure S4). Pressure increase during precipitation435
(i.e. crystallisation pressure; ∆Pc) has been reported in experiments (Correns,1949). It is generally calculated in excess of the confining pressure as (Kelemenand Hirth, 2012):
∆Pc =RT
Vmlog Ω (16)
where Ω is the supersaturation in a thin fluid film where precipitation occurs,R is the gas constant and Vm is the molar volume of the precipitating crystal.440
∆Pc values calculated for the serpentinisation reaction can exceed 300 MPa(Kelemen and Hirth, 2012), close to the value of ∆Pmax at ξ = 1. However,equations 15 and 16 are based on different approaches since ∆Pmax expressionconsiders elastic deformation and depends on the extent of reaction whereas ∆Pcequation is based on thermodynamic disequilibrium between the fluid and the445
solid and requires the fluid to be significantly supersaturated with respect to theprecipitating mineral. Experiments of stress monitoring during hydration showthat the reaction-induced pressure increase depends on the extent of reaction,that fluid pathways can shut-down as a result of reaction-induced stress, andthat the generated overpressures are generally one order of magnitude smaller450
17

than the one calculated with equation 16 (Wolterbeek et al., 2018; Skarbek et al.,2018). The predictions of our model are in agreement with these results withprogressive pressure build-up during reaction, compaction and a relatively smalltotal pressure increase (Figure S4). This suggests that equations 13 are a goodalternative to crystallisation pressure calculation based on fluid composition455
(equation 16), particularly when the supersaturation of the solution is difficultto estimate or when other processes such as mechanical compaction have to beconsidered. Moreover, it indicates that, for the investigated parameters, theoverpressure generated during reaction does not exceed 14 MPa due to viscouscompaction (Figure S4). This value is below the yield stress for serpentinised460
peridotites in compression (Escartın et al., 2001). Our model thus predicts alimited driving force for reaction-induced deformation, which could thus onlyoccur in the first several hundreds of metres below the surface. Figure 5 indi-cates that serpentinisation may be mainly controlled by tectonic deformation fordilatational strain rates below 3.10−10s−1 at mid-ocean ridges. This statement465
is in agreement with the extensive serpentinisation observed near detachmentsfaults (Roumejon et al., 2015). Moreover, it validates the approach used in sometectonic models (Bickert et al., 2020) in which serpentinisation rate is relatedto the strain rate. However, one should keep in mind that shear deformation isnot taken into account in Figure 5. We indeed use a constant dilatational strain470
rate that differs from the shear strain rate computed in previous simulations ofmid-ocean ridge processes (Bickert et al., 2020). As a result, we do not cap-ture the potential evolution of strain rate during reaction possibly leading tothe switch from one controlling mechanism to another. An accurate modellingof the effect of tectonic deformation on serpentinisation rate would require to475
determine the extent of strain partitioning during exhumation. This should beachieved in the future by solving for the conservation of total momentum intwo or three dimensions and by implementing equation 14 in a compressiblecode. In addition, the model could be improved by considering aqueous speciesin the fluid to compute the additional thermodynamic force potentially driving480
stress build-up (equation 16). Viscous compaction is also modelled here with aformalism derived for macropores (Yarushina and Podladchikov, 2015). How-ever, the nanopores preserved during reaction (Tutolo et al., 2016) may behavedifferently leading to a different evolution of the porosity through time.
The numerical approach proposed here is a critical leap forward in reac-485
tive transport modelling since it allows for complete reaction without porosityclogging. Serpentinisation but also other hydration and carbonation reactionsinducing a positive change in solid volume can be modelled with the approachproposed here. As a first step, we investigate the volume-controlled and stress-controlled cases but, as shown above, implementing shear stresses will be re-490
quired in the future to produce quantitative prediction relevant for natural sys-tems. Another improvement of the model concerns the implementation of gasformation (hydrogen and steam). The reaction indeed consumes water, decreas-ing the fluid pressure to a level sufficient to produce gases at high Da and lowDe values (Figures S4 B). Vaporisation will in turn significantly modify the fluid495
density and is thus coupled to fluid pressure evolution. Finally, it would be in-
18

teresting to distinguish between nano- and macropores in the model. Tutoloet al. (2016) indeed show that nanopores are preserved during serpentinisationwhereas macropores can potentially be filled by an assemblage of reaction prod-ucts and nanopores. This aspect should be considered to accurately model the500
evolution of the hydraulic properties during reaction and reproduce the evolu-tion of permeability observed in experiments of serpentinisation (Godard et al.,2013; Farough et al., 2015).
Acknowledgements
B.M. acknowledges support from the Swiss National Science Foundation505
(Grant No. PZ00P2 168083). Y.P. and A.M. were supported by the RussianMinistry of Science and Higher Education (project No. 075-15-2019-1890). Wethank Luc Lavier and Lars Rupke for their thoughtful comments and Jean-Philippe Avouac for editorial handling. B.M. had the idea for the reaction-induced swelling approach aboard Chikyu during the Phase 2 Shipboard Science510
Party of the Oman Drilling Project. He thanks the members of this ScienceParty for the stimulating atmosphere aboard.
References
Balashov, V.N., Yardley, B.W.D., 1998. Modeling metamorphic fluid flowwith reaction-compaction-permeability feedbacks. American Journal of515
Science 298, 441–470. URL: http://www.geology.yale.edu/journals/
Ajs.html/http://www.ajsonline.org/cgi/doi/10.2475/ajs.298.6.441,doi:10.2475/ajs.298.6.441.
Bayrakci, G., Minshull, T.A., Sawyer, D.S., Reston, T.J., Klaeschen, D., Pa-penberg, C., Ranero, C., Bull, J.M., Davy, R.G., Shillington, D.J., Perez-520
Gussinye, M., Morgan, J.K., 2016. Fault-controlled hydration of the up-per mantle during continental rifting. Nature Geoscience 9, 384–388. URL:www.nature.com/naturegeoscience, doi:10.1038/ngeo2671.
Beard, J.S., Frost, B.R., Fryer, P., McCaig, A., Searle, R., Ildefonse, B., Zinin,P., Sharma, S.K., 2009. Onset and progression of serpentinization and mag-525
netite formation in Olivine-rich troctolite from IODP hole U1309D. Journalof Petrology 50, 387–403. doi:10.1093/petrology/egp004.
Behn, M.D., Ito, G., 2008. Magmatic and tectonic extension at mid-oceanridges: 1. Controls on fault characteristics. Geochemistry, Geophysics,Geosystems 9, n/a–n/a. URL: https://agupubs.onlinelibrary.530
wiley.com/doi/full/10.1029/2008GC001965https://agupubs.
onlinelibrary.wiley.com/doi/abs/10.1029/2008GC001965https:
//agupubs.onlinelibrary.wiley.com/doi/10.1029/2008GC001965http:
//doi.wiley.com/10.1029/2008GC001965, doi:10.1029/2008GC001965.
19
Bickert, M., Lavier, L., Cannat, M., 2020. How do detachment faults form at535
ultraslow mid-ocean ridges in a thick axial lithosphere? Earth and PlanetaryScience Letters 533, 116048. doi:10.1016/j.epsl.2019.116048.
Boschi, C., Fruh-Green, G.L., Delacour, A., Karson, J.A., Kelley, D.S.,2006. Mass transfer and fluid flow during detachment faulting anddevelopment of an oceanic core complex, Atlantis Massif (MAR540
30N). Geochemistry, Geophysics, Geosystems 7, n/a–n/a. URL:https://agupubs.onlinelibrary.wiley.com/doi/full/10.1029/
2005GC001074https://agupubs.onlinelibrary.wiley.com/doi/abs/10.
1029/2005GC001074https://agupubs.onlinelibrary.wiley.com/doi/
10.1029/2005GC001074http://doi.wiley.com/10.1029/2005GC001074,545
doi:10.1029/2005GC001074.
Boudier, F., Baronnet, A., Mainprice, D., 2010. Serpentine Mineral Re-placements of Natural Olivine and their Seismic Implications: OceanicLizardite versus Subduction-Related Antigorite. Journal of Petrology 51, 495–512. URL: https://academic.oup.com/petrology/article-lookup/doi/550
10.1093/petrology/egp049, doi:10.1093/petrology/egp049.
Cannat, M., 1993. Emplacement of mantle rocks in the seafloor at mid-oceanridges. Journal of Geophysical Research 98, 4163. URL: http://doi.wiley.com/10.1029/92JB02221, doi:10.1029/92JB02221.
Carmichael, D.M., 1987. Induced Stress and Secondary Mass Transfer:555
Thermodynamic Basis for the Tendency toward Constant-Volume Con-straint in Diffusion Metasomatism, in: Chemical Transport in MetasomaticProcesses. Springer Netherlands, Dordrecht, pp. 239–264. URL: http:
//www.springerlink.com/index/10.1007/978-94-009-4013-0_10,doi:10.1007/978-94-009-4013-0_10.560
Connolly, J., 2005. Computation of phase equilibria by linear programming: Atool for geodynamic modeling and its application to subduction zone decar-bonation. Earth and Planetary Science Letters 236, 524–541. URL: http://linkinghub.elsevier.com/retrieve/pii/S0012821X05002839https:
//linkinghub.elsevier.com/retrieve/pii/S0012821X05002839,565
doi:10.1016/j.epsl.2005.04.033.
Correns, C.W., 1949. Growth and dissolution of crystals under linear pres-sure. Discussions of the Faraday Society 5, 267. URL: http://pubs.
rsc.org/en/content/articlehtml/1949/df/df9490500267, doi:10.1039/df9490500267.570
Delescluse, M., Chamot-Rooke, N., 2008. Serpentinization pulse in the activelydeforming Central Indian Basin. Earth and Planetary Science Letters276, 140–151. URL: http://linkinghub.elsevier.com/retrieve/pii/
S0012821X08005979https://linkinghub.elsevier.com/retrieve/pii/
S0012821X08005979, doi:10.1016/j.epsl.2008.09.017.575
20

Demartin, B., Hirth, G., Evans, B., 2004. Experimental constraints on thermalcracking of peridotite at oceanic spreading centers, in: Geophysical Mono-graph Series. Blackwell Publishing Ltd. volume 148, pp. 167–185. URL:http://doi.wiley.com/10.1029/148GM07, doi:10.1029/148GM07.
Emmanuel, S., Berkowitz, B., 2006. Suppression and stimulation of seafloor hy-580
drothermal convection by exothermic mineral hydration. Earth and PlanetaryScience Letters 243, 657–668. doi:10.1016/j.epsl.2006.01.028.
Escartın, J., Hirth, G., Evans, B., 1997. Effects of serpentiniza-tion on the lithospheric strength and the style of normal faultingat slow-spreading ridges. Earth and Planetary Science Letters 151,585
181–189. URL: http://www.sciencedirect.com/science/article/pii/
S0012821X9781847X, doi:10.1016/S0012-821X(97)81847-X.
Escartın, J., Hirth, G., Evans, B., 2001. Strength of slightly serpentinizedperidotites: Implications for the tectonics of oceanic lithosphere. Geology 29,1023–1026. doi:10.1130/0091-7613(2001)029<1023:SOSSPI>2.0.CO.590
Escartın, J., Smith, D.K., Cann, J., Schouten, H., Langmuir, C.H., Escrig,S., 2008. Central role of detachment faults in accretion of slow-spreadingoceanic lithosphere. Nature 455, 790–794. URL: https://www.nature.com/articles/nature07333, doi:10.1038/nature07333.
Evans, B.W., 1977. Metamorphism of Alpine Peridotite and Serpentinite. An-595
nual Review of Earth and Planetary Sciences 5, 397–447. doi:10.1146/annurev.ea.05.050177.002145.
Evans, O., Spiegelman, M., Kelemen, P.B., 2020. Phase-Field Mod-eling of Reaction-Driven Cracking: Determining Conditions for Exten-sive Olivine Serpentinization. Journal of Geophysical Research: Solid600
Earth 125. URL: https://onlinelibrary.wiley.com/doi/abs/10.1029/2019JB018614, doi:10.1029/2019JB018614.
Farough, A., Moore, D.E., Lockner, D.A., Lowell, R.P., 2015. Evolution offracture permeability of ultramafic rocks undergoing serpentinization at hy-drothermal conditions : An experimental study. Geochemistry, Geophysics,605
Geosystems 16, 1–12. doi:10.1002/2015GC005973.Received.
Fletcher, R.C., Merino, E., 2001. Mineral growth in rocks: Kinetic-rheological models of replacement, vein formation, and syntectonic crystal-lization. Geochimica et Cosmochimica Acta 65, 3733–3748. doi:10.1016/S0016-7037(01)00726-8.610
Germanovich, L.N., Genc, G., Lowell, R.P., Rona, P.a., 2012. Deformationand surface uplift associated with serpentinization at mid-ocean ridges andsubduction zones. Journal of Geophysical Research 117, B07103. URL: http://doi.wiley.com/10.1029/2012JB009372, doi:10.1029/2012JB009372.
21

Godard, M., Luquot, L., Andreani, M., Gouze, P., 2013. Incipient hy-615
dration of mantle lithosphere at ridges: A reactive-percolation experi-ment. Earth and Planetary Science Letters 371-372, 92–102. URL: http://linkinghub.elsevier.com/retrieve/pii/S0012821X13001799, doi:10.1016/j.epsl.2013.03.052.
Hilairet, N., Reynard, B., Wang, Y., Daniel, I., Merkel, S., Nishiyama,620
N., Petitgirard, S., 2007. High-Pressure Creep of Serpentine, Inter-seismic Deformation, and Initiation of Subduction. Science 318, 1910–1913. URL: http://www.sciencemag.org/cgi/doi/10.1126/science.
1148494, doi:10.1126/science.1148494.
Iyer, K., Rupke, L.H., Morgan, J.P., 2010. Feedbacks between mantle hydration625
and hydrothermal convection at ocean spreading centers. Earth and PlanetaryScience Letters 296, 34–44. doi:10.1016/j.epsl.2010.04.037.
Jamtveit, B., Putnis, C.V., Malthe-Sørenssen, A., 2009. Reaction inducedfracturing during replacement processes. Contributions to Mineralogy andPetrology 157, 127–133. URL: http://link.springer.com/article/10.630
1007/s00410-008-0324-y, doi:10.1007/s00410-008-0324-y.
Kelemen, P.B., Hirth, G., 2012. Reaction-driven cracking during retrogrademetamorphism: Olivine hydration and carbonation. Earth and PlanetaryScience Letters 345-348, 81–89. URL: http://www.sciencedirect.com/
science/article/pii/S0012821X12003020http://dx.doi.org/10.1016/635
j.epsl.2012.06.018, doi:10.1016/j.epsl.2012.06.018.
Kelley, C.T., Keyes, D.E., 1998. Convergence Analysis of Pseudo-TransientContinuation. SIAM Journal on Numerical Analysis 35, 508–523. URL:http://epubs.siam.org/doi/10.1137/S0036142996304796, doi:10.1137/S0036142996304796.640
Kieffer, B., Jove, C.F., Oelkers, E.H., Schott, J., 1999. An experimental studyof the reactive surface area of the Fontainebleau sandstone as a function ofporosity, permeability, and fluid flow rate. Geochimica et Cosmochimica Acta63, 3525–3534. doi:10.1016/S0016-7037(99)00191-X.
Klein, F., Le Roux, V., 2020. Quantifying the volume increase645
and chemical exchange during serpentinization. Geology URL:https://pubs.geoscienceworld.org/gsa/geology/article/583188/
Quantifying-the-volume-increase-and-chemical, doi:10.1130/G47289.1.
Lafay, R., Montes-Hernandez, G., Janots, E., Chiriac, R., Findling, N.,650
Toche, F., 2012. Mineral replacement rate of olivine by chrysotile andbrucite under high alkaline conditions. Journal of Crystal Growth 347, 62–72. URL: http://dx.doi.org/10.1016/j.jcrysgro.2012.02.040, doi:10.1016/j.jcrysgro.2012.02.040.
22

Lichtner, P.C., 1988. The quasi-stationary state approximation to coupled mass655
transport and fluid-rock interaction in a porous medium. Geochimica etCosmochimica Acta 52, 143–165. URL: http://linkinghub.elsevier.com/retrieve/pii/0016703788900634, doi:10.1016/0016-7037(88)90063-4.
Liu, D., Agarwal, R., Li, Y., Yang, S., 2019. Reactive transport modeling of min-eral carbonation in unaltered and altered basalts during CO2 sequestration.660
International Journal of Greenhouse Gas Control 85, 109–120. URL: https://linkinghub.elsevier.com/retrieve/pii/S1750583618309009, doi:10.1016/j.ijggc.2019.04.006.
Llana-Funez, S., Brodie, K.H., Rutter, E.H., Arkwright, J.C., 2007. Experimen-tal dehydration kinetics of serpentinite using pore volumometry. Journal of665
Metamorphic Geology 25, 423–438. URL: http://doi.wiley.com/10.1111/j.1525-1314.2007.00703.x, doi:10.1111/j.1525-1314.2007.00703.x.
Macdonald, A., Fyfe, W., 1985. Rate of serpentinization inseafloor environments. Tectonophysics 116, 123–135. URL:https://linkinghub.elsevier.com/retrieve/pii/0040195185902252,670
doi:10.1016/0040-1951(85)90225-2.
Malvoisin, B., Austrheim, H., Hetenyi, G., Reynes, J., Hermann, J., Baumgart-ner, L.P., Podladchikov, Y.Y., 2020a. Sustainable densification of the deepcrust. Geology 48, 673–677. doi:10.1130/G47201.1.
Malvoisin, B., Brantut, N., Kaczmarek, M.A., 2017. Control of serpentinisa-675
tion rate by reaction-induced cracking. Earth and Planetary Science Letters476, 143–152. URL: https://linkinghub.elsevier.com/retrieve/pii/
S0012821X17304260, doi:10.1016/j.epsl.2017.07.042.
Malvoisin, B., Brunet, F., Carlut, J., Roumejon, S., Cannat, M., 2012a. Ser-pentinization of oceanic peridotites: 2. Kinetics and processes of San Car-680
los olivine hydrothermal alteration. Journal of Geophysical Research: SolidEarth 117, n/a–n/a. URL: http://doi.wiley.com/10.1029/2011JB008842,doi:10.1029/2011JB008842.
Malvoisin, B., Carlut, J., Brunet, F., 2012b. Serpentinization of oceanic peri-dotites: 1. A high-sensitivity method to monitor magnetite production in685
hydrothermal experiments. Journal of Geophysical Research: Solid Earth117. doi:10.1029/2011JB008612.
Malvoisin, B., Podladchikov, Y.Y.Y., Vrijmoed, J.C.J., 2015. Coupling changesin densities and porosity to fluid pressure variations in reactive porous fluidflow: Local thermodynamic equilibrium. Geochemistry Geophysics Geosys-690
tems 16, 1–57. URL: http://doi.wiley.com/10.1002/2015GC006019http://onlinelibrary.wiley.com/doi/10.1002/2015GC006019/full, doi:10.1002/2015GC006019.
23
Malvoisin, B., Zhang, C., Muntener, O., Baumgartner, Lukas, P., Kelemen,P.B., Oman Drilling Project Science Party, 2020b. Measurement of volume695
change and mass transfer during serpentinisation: insights from the OmanDrilling Project. Journal of Geophysical Research: Solid Earth .
Marini, L., 2007. Geological Sequestration of Carbon Dioxide: Thermody-namics, Kinetics, and Reaction Path Modeling, in: Geological Sequestrationof Carbon Dioxide: Thermodynamics, Kinetics, and Reaction Path700
Modeling. Elsevier. volume 11, pp. 319–409. URL: https://books.
google.ch/books?hl=fr&lr=&id=7GpCbfy7oUQC&oi=fnd&pg=
PP1&dq=marini+2007+CO2+sequestration&ots=DNDqYwZfCL&sig=
DHPz3m3MXXrVmSeANLRgiU6Lpj0http://www.sciencedirect.com/
science/article/pii/S0921319806800268%5Cnhttp://books.google.705
com/books?hl=en, doi:10.1016/S0921-3198(06)80023-2.
Martin, B., Fyfe, W., 1970. Some experimental and theoreti-cal observations on the kinetics of hydration reactions with par-ticular reference to serpentinization. Chemical Geology 6, 185–202. URL: http://www.sciencedirect.com/science/article/pii/710
0009254170900185, doi:10.1016/0009-2541(70)90018-5.
McCollom, T.M., Seewald, J.S., 2013. Serpentinites, Hydrogen, and Life. El-ements 9. URL: http://elements.geoscienceworld.org/content/9/2/
129.
O’Hanley, D.S., 1992. Solution to the volume problem in serpentinization. Geol-715
ogy 20, 705–708. doi:10.1130/0091-7613(1992)020<0705:STTVPI>2.3.CO.
Omlin, S., Malvoisin, B., Podladchikov, Y.Y., 2017. Pore Fluid Extractionby Reactive Solitary Waves in 3-D. Geophysical Research Letters 44, 9267–9275. URL: http://doi.wiley.com/10.1002/2017GL074293, doi:10.1002/2017GL074293.720
Oufi, O., 2002. Magnetic properties of variably serpentinized abyssal peri-dotites. Journal of Geophysical Research 107. URL: http://www.agu.org/pubs/crossref/2002/2001JB000549.shtml, doi:10.1029/2001JB000549.
Paukert, A., 2014. Mineral Carbonation in Mantle Peridotite of the SamailOphiolite , Oman : Implications for permanent geological carbon dioxide725
capture and storage , 166doi:10.7916/D85M63WZ.
Plumper, O., Røyne, A., Magraso, A., Jamtveit, B., 2012. The interface-scalemechanism of reaction-induced fracturing during serpentinization. Geology40, 1103–1106. doi:10.1130/G33390.1.
Ranero, C.R., Phipps Morgan, J., McIntosh, K., Relchert, C., 2003.730
Bending-related faulting and mantle serpentinization at the Middle Amer-ica trench. Nature 425, 367–373. URL: https://pubmed.ncbi.nlm.nih.
gov/14508480/, doi:10.1038/nature01961.
24

Roumejon, S., Cannat, M., Agrinier, P., Godard, M., Andreani, M., 2015.Serpentinization and Fluid Pathways in Tectonically Exhumed Peridotites735
from the Southwest Indian Ridge (62-65 E). Journal of Petrology 56, 703–734. URL: https://academic.oup.com/petrology/article-lookup/doi/10.1093/petrology/egv014, doi:10.1093/petrology/egv014.
Rudge, J.F., Kelemen, P.B., Spiegelman, M., 2010. A simple model ofreaction-induced cracking applied to serpentinization and carbonation of peri-740
dotite. Earth and Planetary Science Letters 291, 215–227. URL: http:
//linkinghub.elsevier.com/retrieve/pii/S0012821X10000452, doi:10.1016/j.epsl.2010.01.016.
Rupke, L.H., Hasenclever, J., 2017. Global rates of mantle serpentinizationand H2 production at oceanic transform faults in 3-D geodynamic models.745
Geophysical Research Letters 44, 6726–6734. URL: http://doi.wiley.com/10.1002/2017GL072893, doi:10.1002/2017GL072893.
Russell, M.J., Hall, A.J., Martin, W., 2010. Serpentinization as a sourceof energy at the origin of life. Geobiology 8, 355–371. URL: http:
//doi.wiley.com/10.1111/j.1472-4669.2010.00249.x, doi:10.1111/j.750
1472-4669.2010.00249.x.
Schmalholz, S.M., Moulas, E., Plumper, O., Myasnikov, A.V., Podladchikov,Y.Y., 2020. 2D HydroMechanicalChemical modelling of (de)hydration reac-tions in deforming heterogeneous rock: The periclasebrucite model reaction.Geochemistry, Geophysics, Geosystems URL: https://onlinelibrary.755
wiley.com/doi/10.1029/2020GC009351, doi:10.1029/2020GC009351.
Schroeder, T., John, B.E., 2004. Strain localization on an oceanic detachmentfault system, Atlantis Massif, 30N, Mid-Atlantic Ridge. Geochemistry, Geo-physics, Geosystems 5, n/a–n/a. URL: https://agupubs.onlinelibrary.wiley.com/doi/full/10.1029/2004GC000728https://agupubs.760
onlinelibrary.wiley.com/doi/abs/10.1029/2004GC000728https:
//agupubs.onlinelibrary.wiley.com/doi/10.1029/2004GC000728http:
//doi.wiley.com/10.1029/2004GC000728, doi:10.1029/2004GC000728.
Shimizu, H., Okamoto, A., 2016. The roles of fluid transport and surface reac-tion in reaction-induced fracturing, with implications for the development of765
mesh textures in serpentinites. Contributions to Mineralogy and Petrology171, 73. URL: http://link.springer.com/10.1007/s00410-016-1288-y,doi:10.1007/s00410-016-1288-y.
Skarbek, R.M., Savage, H.M., Kelemen, P.B., Yancopoulos, D., 2018. Com-petition Between Crystallization-Induced Expansion and Creep Compaction770
During Gypsum Formation, and Implications for Serpentinization. Jour-nal of Geophysical Research: Solid Earth 123, 5372–5393. URL: http:
//doi.wiley.com/10.1029/2017JB015369, doi:10.1029/2017JB015369.
25

Szitkar, F., Dyment, J., Fouquet, Y., Honsho, C., Horen, H., 2014. The mag-netic signature of ultramafic-hosted hydrothermal sites. Geology 42, 715–718.775
doi:10.1130/G35729.1.
Thayer, T.P., 1966. Serpentinization considered as a constant-volumemetasomatic process. The American minerologist 51, 685–710. URL:https://pubs.geoscienceworld.org/msa/ammin/article-abstract/51/
5-6/685/540300.780
Tian, M., Ague, J.J., 2014. The impact of porosity waves on crustal reac-tion progress and CO2 mass transfer. Earth and Planetary Science Letters390, 80–92. URL: http://dx.doi.org/10.1016/j.epsl.2013.12.044http://linkinghub.elsevier.com/retrieve/pii/S0012821X13007590, doi:10.1016/j.epsl.2013.12.044.785
Tian, M., Ague, J.J., Chu, X., Baxter, E.F., Dragovic, N., Chamberlain, C.P.,Rumble, D., 2018. The Potential for Metamorphic Thermal Pulses to DevelopDuring Compaction-Driven Fluid Flow. Geochemistry, Geophysics, Geosys-tems 19, 232–256. URL: http://doi.wiley.com/10.1002/2017GC007269,doi:10.1002/2017GC007269.790
Tutolo, B.M., Mildner, D.F., Gagnon, C.V., Saar, M.O., Seyfried,W.E., 2016. Nanoscale constraints on porosity generation andfluid flow during serpentinization. Geology 44, 103–106. URL:http://geology.gsapubs.org/content/44/2/103.shorthttps:
//pubs.geoscienceworld.org/geology/article/44/2/103-106/132000,795
doi:10.1130/G37349.1.
Ulven, O., Jamtveit, B., Malthe-Sørenssen, A., 2014. Reaction-driven fracturingof porous rock. Journal of Geophysical Research: Solid Earth 119, 7473–7486. URL: http://doi.wiley.com/10.1002/2014JB011102, doi:10.1002/2014JB011102.800
Van Avendonk, H.J., Holbrook, W.S., Lizarralde, D., Denyer, P., 2011.Structure and serpentinization of the subducting Cocos plate offshoreNicaragua and Costa Rica. Geochemistry, Geophysics, Geosystems 12.URL: https://agupubs.onlinelibrary.wiley.com/doi/full/10.1029/
2011GC003592https://agupubs.onlinelibrary.wiley.com/doi/abs/10.805
1029/2011GC003592https://agupubs.onlinelibrary.wiley.com/doi/
10.1029/2011GC003592, doi:10.1029/2011GC003592.
Wolterbeek, T.K., van Noort, R., Spiers, C.J., 2018. Reaction-driven casingexpansion: potential for wellbore leakage mitigation. Acta Geotechnica 13,341–366. doi:10.1007/s11440-017-0533-5.810
Xu, T., Spycher, N., Sonnenthal, E., Zhang, G., Zheng, L., Pruess, K., 2011.Toughreact version 2.0: A simulator for subsurface reactive transport undernon-isothermal multiphase flow conditions. Computers and Geosciences 37,763–774. doi:10.1016/j.cageo.2010.10.007.
26

Yarushina, V.M., Podladchikov, Y.Y., 2015. (De)compaction of porous vis-815
coelastoplastic media: Model formulation. Journal of Geophysical Re-search: Solid Earth 120, 4146–4170. URL: http://doi.wiley.com/10.1002/2014JB011258, doi:10.1002/2014JB011258.
Zhang, L., Nasika, C., Donze, F., Zheng, X., Renard, F., Scholtes, L., 2019.Modeling Porosity Evolution Throughout ReactionInduced Fracturing in820
Rocks With Implications for Serpentinization. Journal of Geophysical Re-search: Solid Earth 124, 5708–5733. URL: https://onlinelibrary.wiley.com/doi/abs/10.1029/2018JB016872, doi:10.1029/2018JB016872.
27