achieving 25% wind energy penetration: lessons from south ... · –!project approval, ... (nz land...
TRANSCRIPT

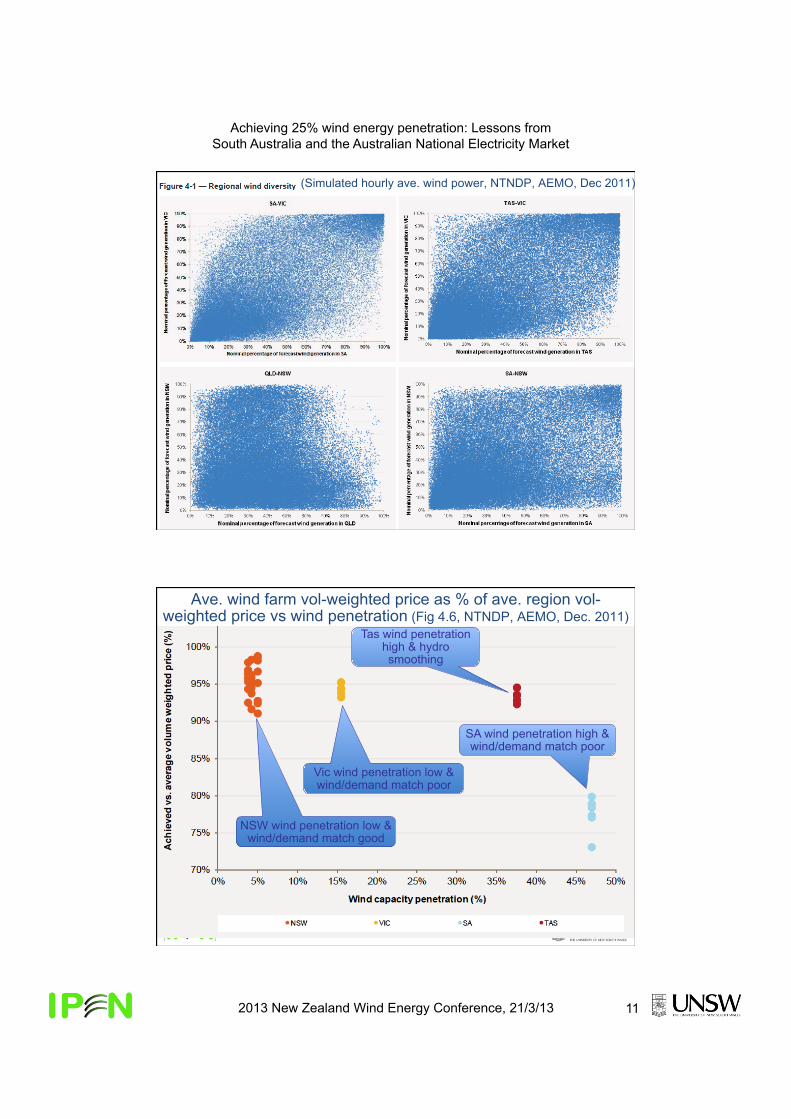
Achieving 25% wind energy penetration: Lessons from South Australia and the Australian National Electricity Market
2013 New Zealand Wind Energy Conference, 21/3/13 1
Achieving 25% wind energy penetration: Lessons from South Australia & the NEM
Hugh Outhred, UNSW & Ipen Consulting 2013 New Zealand Wind Energy Conference, 21/3/13
South Australia
An electricity industry as a complex technological system (Dobrov, 1979)
Australia's competitive electricity industry: experience & implications for ASEAN countries
Hardware (tools, machines, equipment): •! Equipment for energy conversion chain – electricity
generation, transmission, distribution, end-use •! Equipment for monitoring, analysis & control •! Tools & machines for construction & maintenance
Hardware layer
Software (know-how): •! Technical regime: knowledge & skills to design, build,
connect & operate at component & system levels •! Security & commercial regimes: systems for operation
monitoring, negotiation & control, including markets
Software layer
Orgware (institutions, rules, culture): •! Legislation etc. at Federal & State levels •! Judiciary, regulatory, rule management, mores •! Industry structure & self-regulation, eg. ombudsmen,
industry codes, industry culture
Orgware Layer
Critical for complex systems

Achieving 25% wind energy penetration: Lessons from South Australia and the Australian National Electricity Market
2013 New Zealand Wind Energy Conference, 21/3/13 2
Decision-making (DM) framework for managing electricity industry H/S/O
Governance & regulatory regime (O)
!!Formal institutions, legislation & policies !!Informal social context including politics
Security regime (H, S, O)
!!Responsible for core integrity on local or industry-wide basis, with power to override
!!Issues that can’t be commercialised Technical regime (H, S, O)
!!To allow connected industry components to function as industry-wide machine
!!Technical standards & requirements Commercial regime (H, S, O)
!!To coordinate decentralised decision-making according to commercial criteria
!!Market rules & industry structure both matter
Interactions matter
Wind integration as a process of acculturation
Evolving hardware,
software & orgware sp
ecific
to wind energy
Acculturation processes to migrate DM framework from
pre-wind to post-wind context
Evolving hardware, software & orgware for electricity industry with integrated wind energy
Revised DM framework
Evolving hardware,
software & orgware for pre-
existing electricity industry
Pre-existing
DM framework
Achieving 25% wind energy penetration: Lessons from South Australia and the Australian National Electricity Market
2013 New Zealand Wind Energy Conference, 21/3/13 3
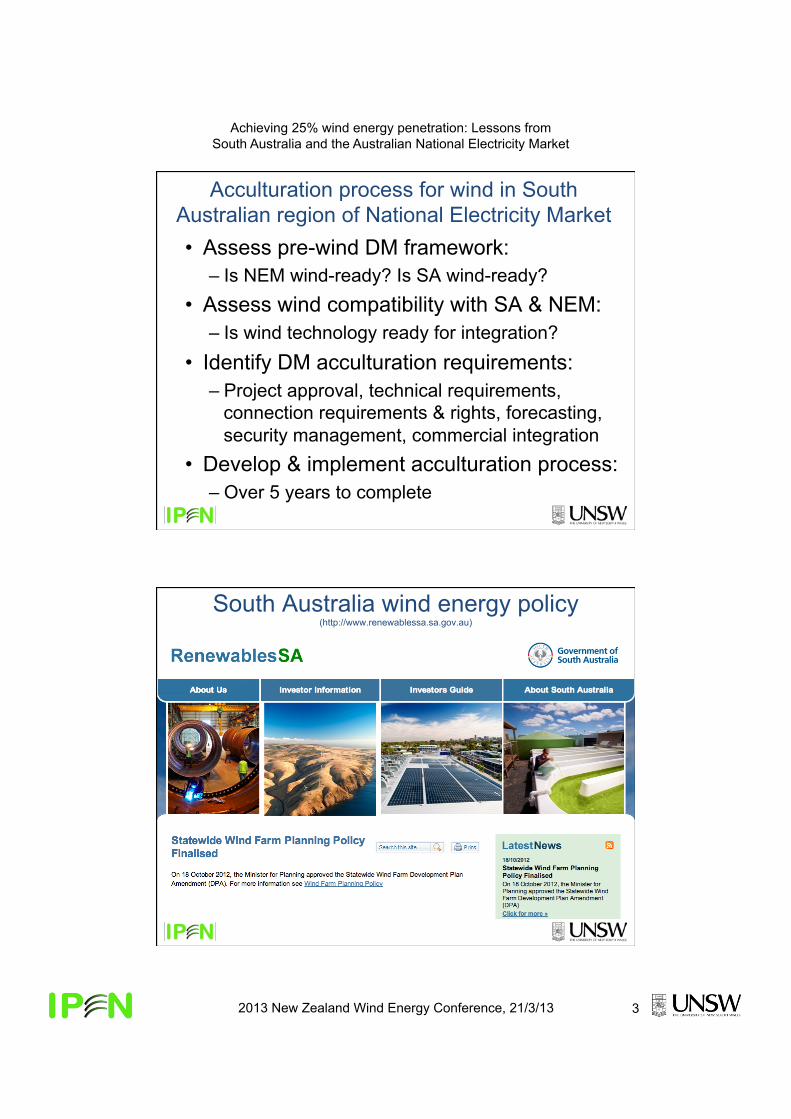
Acculturation process for wind in South Australian region of National Electricity Market •! Assess pre-wind DM framework:
–! Is NEM wind-ready? Is SA wind-ready? •! Assess wind compatibility with SA & NEM:
–! Is wind technology ready for integration? •! Identify DM acculturation requirements:
–!Project approval, technical requirements, connection requirements & rights, forecasting, security management, commercial integration
•! Develop & implement acculturation process: –!Over 5 years to complete
South Australia wind energy policy (http://www.renewablessa.sa.gov.au)

Achieving 25% wind energy penetration: Lessons from South Australia and the Australian National Electricity Market
2013 New Zealand Wind Energy Conference, 21/3/13 4
NEM scope: Qld, NSW, ACT, Vic, SA, Tas Network ~4000km long: Security regime must work well to avoid blackouts Commercial regime must contain adequate location information
Figure 5-1 Wind bubbles defined for NTNDP modelling
(http://www.aemo.com.au/Electricity/Planning/Related-Information/Wind-Integration-Investigation)
“wind bubbles” contain148 existing or proposed wind farms
(AEMO wind integration work package 5, Jan 2012)
NEM multi-region security-constrained spot energy & FCAS dispatch markets plus derivatives
Queensland region
New South Wales region
Victorian region
South Australian
region
Tasmanian region
Limits & loss functions for each interconnector
updated every 5 min
•! NEM security flow constraints updated every five minutes for security-constrained dispatch
•! Dispatch offers changeable to solution time •! Ex-ante five-minute pricing for energy &
frequency control ancillary services •! RRN derivatives & inter-regional hedges
Each region has a designated Regional
Reference Node (RRN) for derivative pricing
Achieving 25% wind energy penetration: Lessons from South Australia and the Australian National Electricity Market
2013 New Zealand Wind Energy Conference, 21/3/13 5
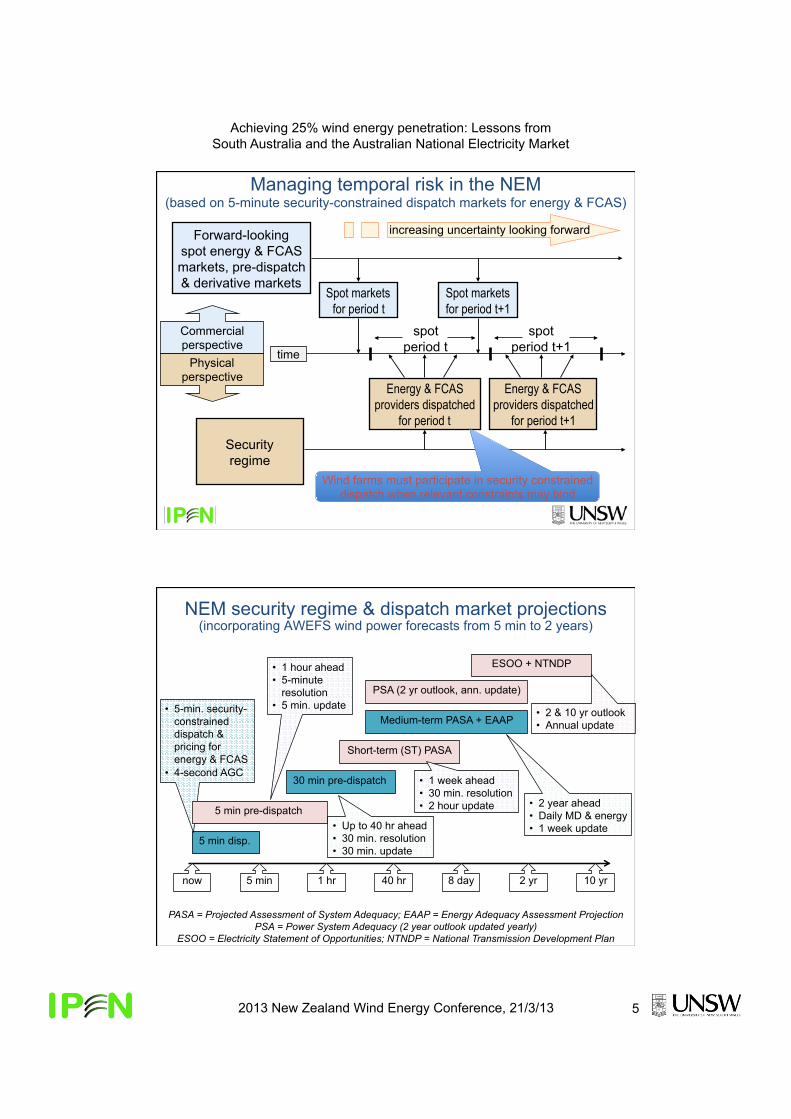
Managing temporal risk in the NEM (based on 5-minute security-constrained dispatch markets for energy & FCAS)
Forward-looking spot energy & FCAS markets, pre-dispatch & derivative markets
Energy & FCAS providers dispatched
for period t
Security regime
Energy & FCAS providers dispatched
for period t+1
time
Spot markets for period t
Spot markets for period t+1
spot period t
spot period t+1
increasing uncertainty looking forward
Physical perspective
Commercial perspective
Wind farms must participate in security constrained dispatch when relevant constraints may bind
NEM security regime & dispatch market projections (incorporating AWEFS wind power forecasts from 5 min to 2 years)
PASA = Projected Assessment of System Adequacy; EAAP = Energy Adequacy Assessment Projection PSA = Power System Adequacy (2 year outlook updated yearly)
ESOO = Electricity Statement of Opportunities; NTNDP = National Transmission Development Plan
now 5 min 1 hr 40 hr 8 day 2 yr 10 yr
5 min disp.
•! 5-min. security-constrained dispatch & pricing for energy & FCAS
•! 4-second AGC
5 min pre-dispatch
•! 1 hour ahead •! 5-minute
resolution •! 5 min. update
Medium-term PASA + EAAP
•! 2 year ahead •! Daily MD & energy •! 1 week update
Short-term (ST) PASA
•! 1 week ahead •! 30 min. resolution •! 2 hour update
30 min pre-dispatch
•! Up to 40 hr ahead •! 30 min. resolution •! 30 min. update
ESOO + NTNDP
•! 2 & 10 yr outlook •! Annual update
PSA (2 yr outlook, ann. update)
Achieving 25% wind energy penetration: Lessons from South Australia and the Australian National Electricity Market
2013 New Zealand Wind Energy Conference, 21/3/13 6
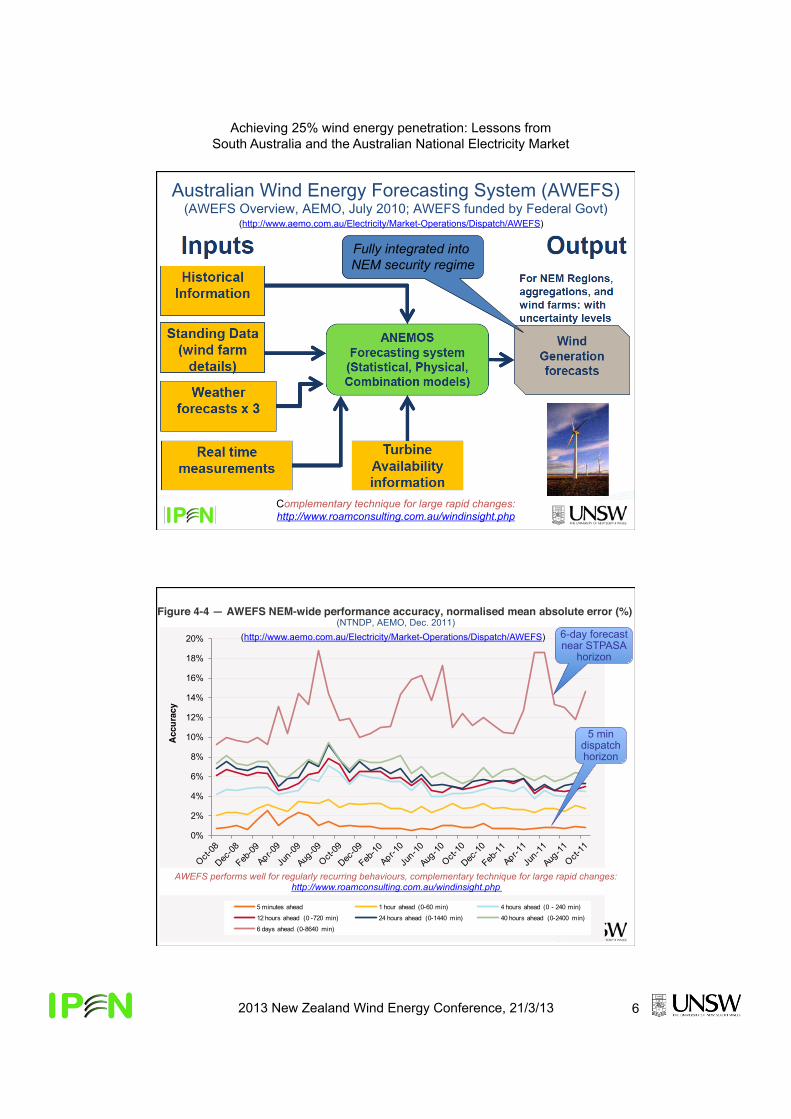
Australian Wind Energy Forecasting System (AWEFS) (AWEFS Overview, AEMO, July 2010; AWEFS funded by Federal Govt)
Fully integrated into NEM security regime
(http://www.aemo.com.au/Electricity/Market-Operations/Dispatch/AWEFS)
Complementary technique for large rapid changes: http://www.roamconsulting.com.au/windinsight.php
Figure 4-4 — AWEFS NEM-wide performance accuracy, normalised mean absolute error (%)
0%
2%
4%
6%
8%
10%
12%
14%
16%
18%
20%
Acc
urac
y
Date
5 minutes ahead 1 hour ahead (0-60 min) 4 hours ahead (0 - 240 min)
12 hours ahead (0 -720 min) 24 hours ahead (0-1440 min) 40 hours ahead (0-2400 min)
6 days ahead (0-8640 min)
(NTNDP, AEMO, Dec. 2011) (http://www.aemo.com.au/Electricity/Market-Operations/Dispatch/AWEFS)
AWEFS performs well for regularly recurring behaviours, complementary technique for large rapid changes: http://www.roamconsulting.com.au/windinsight.php
6-day forecast near STPASA
horizon
5 min dispatch horizon

Achieving 25% wind energy penetration: Lessons from South Australia and the Australian National Electricity Market
2013 New Zealand Wind Energy Conference, 21/3/13 7
Wind resource indicators for South Australia: Land area: ~ 1 million km2 or 13% of Australia Population: ~ 1.65 million or 1.67 people/km2 Resource: ~ 0.2 m km2 with ave. wind speed ! 8 m/s @ 80 m (NZ land area ~ 0.27 m km2, pop density ~ 16.7 people/km2)
Existing wind farms located in regions with: •! Good wind resources •! Planning approvals •! Adequate network capacity
(http://www.aemo.com.au/Electricity/Planning/South-Australian-Advisory-Functions/Wind-Study-Report)
BURRA
KADINA
STREAKY BAY
CLEVE
BERRI
CEDUNA
WOOMERA
LEIGH CREEK
COOBER PEDY
PORT AUGUSTA
PORT LINCOLN
MOUNT GAMBIER
ADELAIDE
Limit of 3 sqkm mapping
0 200 km
Predicted wind speed at 80 metres above ground level,1995-2005, South Australia
Lambert Conformal Conic projection
Wind speed (metres/second)
6.0 6.1 6.2 6.3 6.4 6.55.5 6.6 6.7 6.9 7.0 7.2 7.5 8.5
(http://www.renewablessa.sa.gov.au)
ACIL (2010), Modelling Data for Australian Govt’s Energy White Paper (http://www.aemo.com.au/planning/0400-0019.pdf)
( ( ( ( ( ( ( ( ( ( ( ( (( ( ( ( ( ( ( ( ( ( ( ( (
( ( ( ( ( ( ( ( ( ( (( ( ( ( ( ( ( ( ( ( ( ( (( ( ( ( ( ( ( ( ( ( (
( ( ( ( ( ( ( ( ( ( ( ( (( ( ( ( ( ( ( ( ( ( ( (( (
( ( ( ( ( ( ( ( ( ( ( ( (( ( ( ( ( ( ( ( ( ( (
( ( ( ( ( ( ( ( ( ( ( (( ( ( ( ( ( ( ( ( ( ( ( (( ( ( ( ( (
(
(
( ( ( ( ( ( ( ( ( ( ( ( ( ( ( (( ( ( ( ( ( ( ( ( ( ( ( (( ( ( ( ( ( ( ( ( ( (( ( ( (
Figure 1 Cumulative capacity of identified proposed wind farms versus capacity factor – South Australia
!"
#"
$!"
$#"
%!"
%#"
&!"
&#"
'!"
'#"
! #!! $!!! $#!! %!!! %#!! &!!! &#!! '!!! '#!!
!"#"$%&%'()"$&*+(,-.
!/0/1"&%23($"#"$%&'( 4 536(7/%18
9:
Proposed additional wind farms in 2010 ~ 4 GW Technical potential of 0.2m km2 with 8 m/s at 80m ~ 1,000 GW

Achieving 25% wind energy penetration: Lessons from South Australia and the Australian National Electricity Market
2013 New Zealand Wind Energy Conference, 21/3/13 8
(http://www.aemo.com.au/Electricity/Planning/South-Australian-Advisory-Functions/Wind-Study-Report)
16
Wind generation ann. energy as % of regional output (Performance of the Energy Sector, AER 2012)
Overall, wind energy now ~3% of NEM generation
Achieving 25% wind energy penetration: Lessons from South Australia and the Australian National Electricity Market
2013 New Zealand Wind Energy Conference, 21/3/13 9
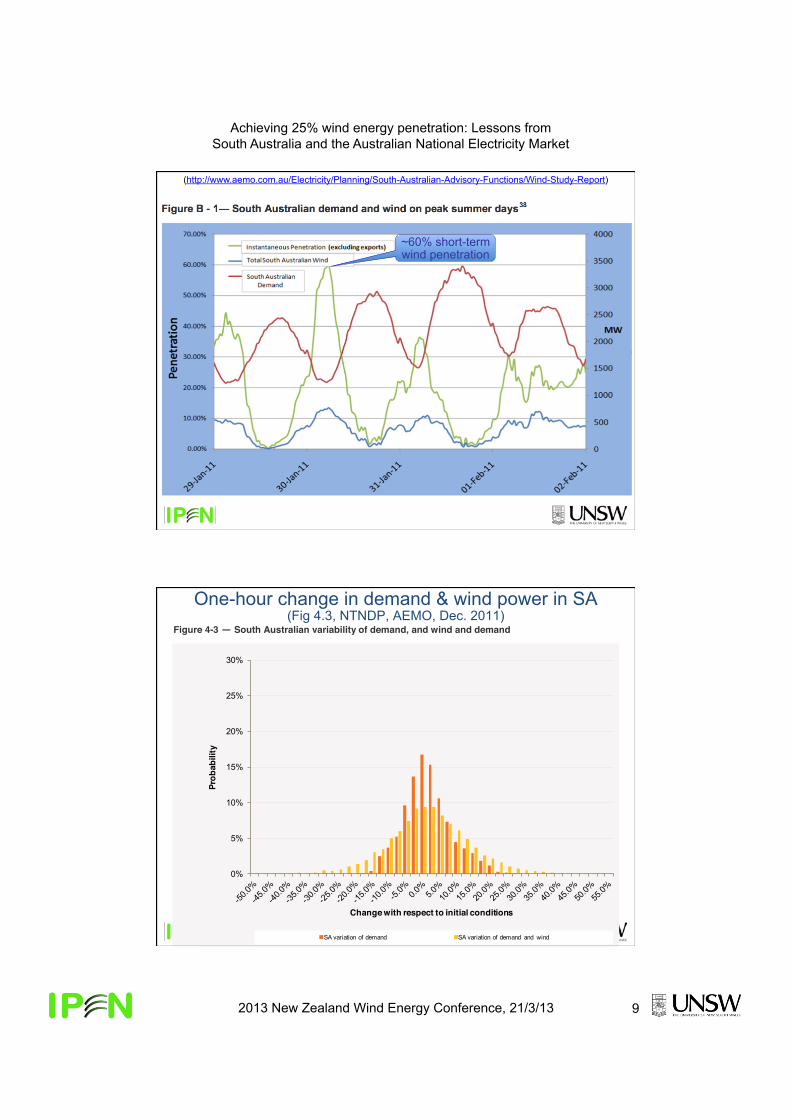
(http://www.aemo.com.au/Electricity/Planning/South-Australian-Advisory-Functions/Wind-Study-Report)
~60% short-term wind penetration
One-hour change in demand & wind power in SA (Fig 4.3, NTNDP, AEMO, Dec. 2011)
Figure 4-3 — South Australian variability of demand, and wind and demand
0%
5%
10%
15%
20%
25%
30%
Prob
abili
ty
Change with respect to initial conditions
SA variation of demand SA variation of demand and wind

Achieving 25% wind energy penetration: Lessons from South Australia and the Australian National Electricity Market
2013 New Zealand Wind Energy Conference, 21/3/13 10
South Australian demand & wind power (NEM Background Information for WP4A, AEMO, Nov. 2011)
Ave. daytime wind low Ave. night-time wind high
NSW demand & wind power (NEM Background Information for WP4A, AEMO, Nov. 2011)
Ave. AM wind low Ave. PM wind high
Achieving 25% wind energy penetration: Lessons from South Australia and the Australian National Electricity Market
2013 New Zealand Wind Energy Conference, 21/3/13 11
© 2010-2011 Asia Edge Pte Ltd. All rights reserved.
(Simulated hourly ave. wind power, NTNDP, AEMO, Dec 2011)
Ave. wind farm vol-weighted price as % of ave. region vol-weighted price vs wind penetration (Fig 4.6, NTNDP, AEMO, Dec. 2011)
NSW wind penetration low & wind/demand match good
Vic wind penetration low & wind/demand match poor
Tas wind penetration high & hydro smoothing
SA wind penetration high & wind/demand match poor

Achieving 25% wind energy penetration: Lessons from South Australia and the Australian National Electricity Market
2013 New Zealand Wind Energy Conference, 21/3/13 12
Facilitating wind energy integration •! Wind resource mapping & forecasting:
–! Centralised forecasting using all relevant information –! Focus on large rapid changes & long widespread lulls
•! Wind farm siting & approvals processes: –! Should be consistent, fair & “evidence-based”
•! Grid connection requirements & costs: –! Difficult choices on grid augmentation
•! Operation with high wind penetration: –! Security constrained wind farm dispatch
•! Clear & consistent investment signals: –! Important for industry stability
Hugh Outhred Bsc, BE (Hons 1), PhD
Email: [email protected]; [email protected]
Hugh Outhred is a Senior Visiting Fellow at the University of New South Wales, an Adjunct Professor at Murdoch University, Guru Besar Luar Biasa at STTNAS Jogjakarta, Indonesia and a Director of Ipen Pty Ltd, which provides advisory and educational services on energy, society and the environment. Hugh retired in 2007 after a 35-year career at UNSW, most recently as Presiding Director, Centre for Energy and Environmental Markets and Head, Electrical Energy Research Group, School of Electrical Engineering and Telecommunications. During his career, Hugh has been a Fulbright Senior Fellow at the University of California Berkeley, a Member of the National Electricity Tribunal, a Member of the New South Wales Licence Compliance Advisory Board, a Board Member of the Australian Cooperative Research Centre for Renewable Energy, an Associate Director of UNSW’s Centre for Photovoltaic Devices and Systems, a Member of CSIRO’s Energy Flagship Advisory Committee and a Lead Author for the IPCC Special Report on Renewable Energy Sources & Climate Change Mitigation, 2011.
Selected documents by Hugh Outhred on wind energy integration in the Australia National Electricity Market: www.ceem.unsw.edu.au/sites/default/.../AGO_SA_Wind_Energy.pdf http://www.ceem.unsw.edu.au/sites/default/files/uploads/publications/unsw readilyacceptablewindpowerinnem_000.pdf http://www.ceem.unsw.edu.au/sites/default/files/uploads/publications/090910REintegrationAust-HICSS43-Accepted.pdf