achievement tests in the panel study of income dynamics ...€¦ · achievement tests in the panel...
TRANSCRIPT
Technical Series Paper #14-02
Achievement Tests in the Panel Study of Income Dynamics Child Development Supplement
Denise Duffy and Narayan Sastry Survey Research Center - Institute for Social Research
University of Michigan
June, 2014
This technical document was supported by funding from the Eunice Kennedy Shriver National Institute of Child Health and Human Development (R01-HD069609 and R01-HD052646).

Abstract To objectively assess the academic skills in reading and mathematics of children in the PSID Child Development Supplement (CDS), subtests from the Woodcock-Johnson Psycho-Educational Battery-Revised (WJ-R) were administered in all three waves of the survey. This document provides an introduction to and an overview of these assessments. In addition, this document describes cognitive tests available for the CDS children’s primary caregivers and for respondents to the 1972 PSID that provide a measure of a grandparent’s cognitive skills for many CDS children.
2

1. Introduction The Panel Study of Income Dynamics (PSID) is a nationally-representative, longitudinal study of U.S. families that began in 1968. Interviews were conducted annually through 1997, and biennially since 1997 (see McGonagle et al., 2012). The PSID Child Development Supplement (CDS) was launched in 1997 to examine a broad array of child developmental outcomes within the context of family, neighborhood, and school environments for an original sample of nearly 3,600 children aged 0–12 years in PSID families (McGonagle and Sastry, 2014). Two additional waves of CDS were fielded in 2002/03 and 2007/08 when eligible children in CDS were, respectively, 5–17 and 10–17 years of age. Further details about CDS are available in the user guide available for each wave (Hofferth et al., 1997; PSID, 2010; PSID 2012).1 In order to objectively assess the academic achievement of the CDS children at each wave—and to measure growth in academic skills over time as children progressed through school—reading and mathematics assessments were administered to children in each of the three waves of the CDS. Children aged three years and older were administered subtests of the Woodcock-Johnson Psycho-Educational Battery-Revised (WJ-R; McGrew, Werder, and Woodcock, 1989; Woodcock and Mather, 1989), a well-established set of measures that provides researchers with information on several dimensions of intellectual skills, including current developmental status, degree of mastery in reading and mathematics, and age- and grade-group standing. For all three waves of the CDS, three subtests were selected to measure reading and math achievement: the Letter-Word Identification test, the Passage Comprehension test (administered to children age six years and older), and the Applied Problems test; the Calculation test was also administered in CDS-I. The Letter-Word Identification test assesses symbolic learning and reading identification skills. The Passage Comprehension test assesses reading comprehension and vocabulary, and the ability to use these two skills together in a sentence completion task. The Applied Problems test assesses mathematics reasoning, achievement, and knowledge. The Calculation test assesses knowledge of mathematic operations and ability to perform computations. Scores from each of these tests can be used individually; in addition, the Letter-Word Identification test and the Passage Comprehension test can be combined to provide a score for Broad Reading and the Applied Problems test and the Calculation test can be combined to provide a score for Broad Math (the latter is only available for CDS-I). For each of the individual tests and the two test composites, the PSID Online Data Center (www.psidonline.org) provides raw scores, standard scores, W scores, and percentile ranks (explained below); also available through the PSID Online Data Center are the individual question-item results, which indicate, for each respondent, whether a specific question on each test was correct or incorrect. (The PSID Online Data Center also provides access to all publicly released data from the Core PSID and the CDS.) The CDS children’s primary caregivers (PCG; most commonly the mother) were also administered the WJ-R Passage Comprehension test in CDS-I, in order to assess their reading skills. Entirely separately from the CDS assessments, but potentially of interest to users of the CDS assessment data, is the fact that in 1972 the respondents to the Core PSID interview were
1 The CDS User Guides are available online at http://psidonline.isr.umich.edu/Guide/documents.aspx.
3

administered a sentence completion test that provides an assessment of verbal skills—specifically, the Lorge-Thorndike Sentence Completion Test. The test from 1972 may be of interest because for many of the CDS children, it provides a measure of a grandparent’s verbal ability. Taken together, the WJ-R assessments from CDS for children and their primary caregivers and the 1972 sentence completion test for a grandparent can be used to provide an intergenerational perspective on children’s acquisition of cognitive skills. The sample design of the CDS combined with structure of the PSID also provides an intragenerational perspective on children’s achievement by allowing comparisons in test scores among siblings and among first cousins. This PSID Technical Document provides guidance and advice on the use and interpretation of the CDS and PSID cognitive assessments, including scoring details and interpretation, as well as data quality and integration issues. The remainder of this document is organized as follows: Section 2 describes the WJ-R test, including how to interpret and use the various scores. Section 3 provides details on children’s WJ-R scores and their interpretation and Section 4 details issues surrounding the administration of the PCG WJ-R test. Section 5 describes the 1972 Sentence Completion test and related validation studies. Section 6 provides guidance surrounding the use of assessments for intergenerational analyses, and Section 7 concludes. 2. WJ-R Test Administration and Score Interpretation The WJ-R comprises a total of nine subtests that measure a range of academic achievement dimensions. Of those subtests, four were selected and administered to CDS children in CDS-I to measure reading and math skills: Letter Word Identification, Passage Comprehension, Applied Problems, and Calculations. Based on WJ-R guidelines regarding the age-appropriateness of the subtests, younger children (ages 3-5 years) were only administered the Letter Word Identification and Applied Problems subtests, while older children (aged 6 years and older) were administered all four subtests (although the Calculation subtest was dropped from CDS-II and CDS-III). The tests are summarized in Table 1.
Table 1. Summary of Woodcock-Johnson (Revised) subtests used in CDS
WJ-R Subtest Description Age group Notes Letter-Word Identification
Assesses symbolic learning and reading identification skills
3–17 years -
Passage Comprehension
Assesses reading comprehension and vocabulary 6–17 years Also available for PCGs in CDS-I
Broad Reading
Combines results from the Letter-Word Identification and Passage Comprehension subtests
6–17 years -
Applied Problems
Assesses mathematics reasoning, achievement, and knowledge
6–17 years -
Calculations Assesses knowledge of mathematic operations and ability to perform computations
6–17 years Only administered in CDS-I
Broad Math
Combines results from the Applied Problems and Calculations subtests
6–17 years Only available for CDS-I
The WJ-R tests have standardized administrative protocols. Specifically, the WJ-R Test is an ‘easel’ test—that is, a test with a question book that sits in front of the respondent. Each WJ-R
4

test requires that interviewers administer it exactly as described in training and their interviewer manual. Any deviation from these procedures invalidates the results. WJ-R administration involves identifying each subject’s basal (starting) level and ceiling (ending) level, both of which depend upon a subject’s age and ability. Having a basal and ceiling limits the test length, while ensuring that the test begins with a set of questions that the subject has a near-certainty of answering correctly and ends with a set of questions that the subject has a near-certainty of not answering correctly (Woodcock and Mather, 1989). Test questions are ordered in increasing difficulty, and starting questions are suggested for each age/grade level. If a subject answers six consecutive questions correctly, the basal level is established. If not, the test administrator moves backward through the assessment, by page, until the subject answers six consecutive questions correctly. The test is complete either when the subject answers six consecutive questions incorrectly (the ceiling), or the last test question is administered. Testing is administered by entire page on the easel, with each page typically including multiple question items. If the ceiling condition is met mid-page, the administrator is instructed to complete the page before terminating the test. Therefore, data users may see cases with more than six consecutive incorrect answers. Interviewers also evaluated conditions that might have violated the guidelines for administering the test and interfered with obtaining a reliable test score. The presence of such conditions is coded and available in the PSID Online Data Center. Specifically, administrators noted whether others were present during testing, and, if so, whether their presence distracted the subject. In addition, a variable indicates whether testing was completed and, if not, the reason. Potential reasons include:
• Caregiver terminated the test, • Child would not respond, • Major interruption, • Child did not understand the WJ-R, • A language problem, • An emotional condition, • A physical condition, • Child was tired, or • Other reason.
Four scores are available for each WJ-R subtest: the raw score, the standard score, the percentile score, and the W score. The four scores and their uses are summarized in Table 2. A new data release in January 2014 included 1997 and 2002 W scores in the PSID Online Data Center for the first time. Users should take care to choose the most appropriate score for their particular purpose. Raw scores are simply a count of correct answers. Standard scores and percentile scores use each subject’s raw score and age, and the scores of members of the subject’s age group from the WJ-R norming samples, to create standardized scores and percentiles. The percentile rank indicates the percent of the age-matched norming sample that had scores below those of the subject, and hence reveals a subject’s standing within their age group. Standardized scores have a mean of 100 for
5

each age group and a standard deviation of 15, which facilitates comparisons across subjects of different ages and comparisons with different achievement assessments (which are also typically standardized to a similar scale). Both standardized scores and percentile scores are useful for cross-sectional comparisons—particularly comparisons that pool subjects across a range of ages. However, these scores are not well-suited for examining changes in a subject’s performance on a WJ-R subtest over time because each test result is standardized independently; therefore, a change in a child’s standard score or percentile rank can reflect both a change in the child’s subtest score and the overall change in the relevant reference group.
Table 2. Summary of Scores Available for Woodcock-Johnson (Revised) Subtests in CDS
Score Description Raw score Count of correct answers on test Standard score Age-standardized score with mean of 100 and standard deviation of 15 for
comparing achievement across children Percentile score Age-standardized percentile for comparing achievement across children W score Score for analyzing gains in achievement over time
The W score is an equal-interval scale that measures both the subject’s achievement and the item difficulty on the same scale. All test items are assigned a W value, based on each item’s difficulty, using a Rasch measurement model. These item scores are used to generate a W score for any possible raw score. The W score is scaled such that a score of 500 represents the average performance of a typical 10 year old subject. Because W scores are on an equal-interval scale, and are not dependent upon peer performance, they are useful for measuring a subject’s growth in a subject area over time. Any 10-point increase in the W score reflects the subject’s ability to perform, with 75% success, tasks that he or she was previously able to perform with 50% success (Jaffe, 2009). WJ-R tests were scored using standard scoring procedures. In CDS-I and CDS-II, scoring was performed using WJ-R scoring look-up tables, while in CDS-III, scoring was performed using a scoring program developed by the Woodcock-Munoz Foundation that automated the process. CDS-I and CDS-II were also rescored using the same scoring program that was used for CDS-III, in order to validate the earlier scoring results. 3. Completion Rates for the Child WJ-R Subtests in CDS In CDS-I, of the 2,803 children who were eligible to take any of the WJ-R subtests, 2,223 attempted the assessments and 2,190 completed all appropriate WJ-R subtests. In subsequent waves, the number of children eligible for testing changed for several reasons. First, younger children become age-eligible to participate in testing. Second, older children reached 18 years of age and left the CDS sample—at which time they became eligible for the PSID Transition into Adulthood (TA) study which did not administer the WJ-R. Finally, some children were lost to follow-up due their family’s attrition from the Core PSID or from the CDS. Table 3 shows the number of eligible children for the WJ-R subtests and the number of begun and completed WJ-R subtests across the three waves.
6

Table 3. Counts, by Wave, of Children Eligible for WJ-R Subtests and of Begun and Completed Subtests
WJ-R subtest
CDS-I (3,563 Children)
CDS-II (2,907 Children)
CDS-III (1,608 Children)
Eligible Began subtest
Completed subtest Eligible
Began subtest
Completed subtest Eligible
Began subtest
Completed subtest
Letter-Word Identification (ages 3+ years)
2,803 2,223 2,218 2,907 2,644 2,633 1,608 1,491 1,490
Passage Comprehension (ages 6+ years)
1,877† 1,532 1,522 2,856 2,595 2,541 1,608 1,491 1,491
Applied Problems (ages 3+ years)
2,803 2,223 2,209 2,907 2,644 2,625 1,608 1,491 1,485
Calculation (ages 6+ years) 1,877† 1,532 1,517 N/A N/A N/A N/A N/A N/A †Approximate number of eligible children for Passage Comprehension and Calculation subtests based on age at 1997 Core PSID interview. In order to examine the characteristics of children that were eligible for, but did not attempt the WJ-R assessment, we conducted a logistic regression analysis of whether an eligible child attempted the CDS-I WJ-R as a function of child and household characteristics. We found that Hispanic children,2 and children from households headed by individuals with lower educational attainment were less likely to attempt the WJ-R. See Appendix 1 for complete model results. Users should keep in mind these results when analyzing the CDS WJ-R assessment data because the CDS sample weights only account for the participation of children in the overall study, not for participation in study components such as the WJ-R assessments.
Table 4. Reasons for Incomplete Child WJ-R Tests
CDS-I CDS-II CDS-III
Reason for incomplete test Variable name
Number of mentions
Variable name
Number of mentions
Variable name
Number of mentions
Caregiver terminated test Q3E2A 0 Q24D2A 0 Q34D2A 0 Did not respond to WJ-R Q3E2B 9 Q24D2B 2 Q34D2B 2 Major interruption Q3E2C 1 Q24D2C 0 Q34D2C 0 Did not understand WJ-R Q3E2D 5 Q24D2D 5 Q34D2D 0 Language problem Q3E2E 0 Q24D2E 0 Q34D2E 0 Emotional condition Q3E2F 4 Q24D2F 3 Q34D2F 1 Physical condition Q3E2G 9 Q24D2G 0 Q34D2G 0 Tired Q3E2H 2 Q24DH 2 Q34DH 0 Other Q3E2I 17 Q24D2I 6 Q34D2I 4 Number of children who did not complete all appropriate WJ assessments
33 23 7
2 Technically, children from non-white and non-black racial groups, but predominantly Hispanic.
7

For children who attempted the WJ-R, but did not complete it, the PSID Online Data Center provides users with variables that explain why WJ-R subtests were not completed. Table 4 details the possible reasons for not completing the WJ-R, as well as the frequency with which each reason is mentioned. Test administrators were permitted to select more than one possible reason when appropriate, and reasons were not always provided for incomplete tests. It is typically the younger children that failed to complete the WJ-R. In CDS-I, children aged three years and six years (the youngest children that could take the Letter-Word Identification/Applied Problems tests and Calculation/Passage Comprehension tests, respectively) comprised over half of the children not completing the WJ-R. Even after excluding tests that were flagged as incomplete, there remain a small number of WJ-R scores that are questionable because their values mark them as outliers. We describe a procedure for identifying such cases, but leave it to users to decide whether to exclude these cases from their analyses. Table 5 shows the percentage of children that completed the WJ-R assessments and had scores more than three standard deviations away from the mean. Because the standard scores are normally distributed, only 0.3% of cases should have scores in this category. Some standard scores are quite extreme, including standard scores of 0. Because the CDS is a longitudinal study, users can evaluate whether to exclude outlier scores by looking at both the likelihood of a given score, and the relationship to other scores for the same child.
Table 5. WJ-R Subtest Standard Scores More than Three Standard Deviations Above or Below the Mean
WJ-R subtest Cases more than three standard
deviations above or below the mean CDS-I CDS-II CDS-III
Letter-Word Identification 1.9% 3.3% 2.1% Passage Comprehension 0.6% 1.3% 0.8% Applied Problems 1.9% 1.3% 0.7% Calculations 0.8% - -
CDS sampled up to two children per household. Therefore, we have assessment data for sibling pairs in the CDS, which enables users to identify the effects of common family factors on children’s achievement. There is both entrance into and attrition from the sample of siblings who completed the WJ-R assessments. First, siblings under the age of three years in CDS-I did not complete a WJ-R test, but these children could have completed the tests in CDS-II and -III. Second, a sibling could turn age 18 years and leave the CDS sample, or siblings could become non-respondents. Table 6 provides counts of sibling pairs that completed all appropriate WJ-R subtests by CDS wave.
Table 6. Sibling Pairs with WJ-R Assessments
In same wave Sibling pairs CDS-I CDS-II CDS-III In any wave Number of sibling pairs with completed WJ-R assessments 558 699 318 951
Total number of sibling pairs 1,109 857 342 1,109
8
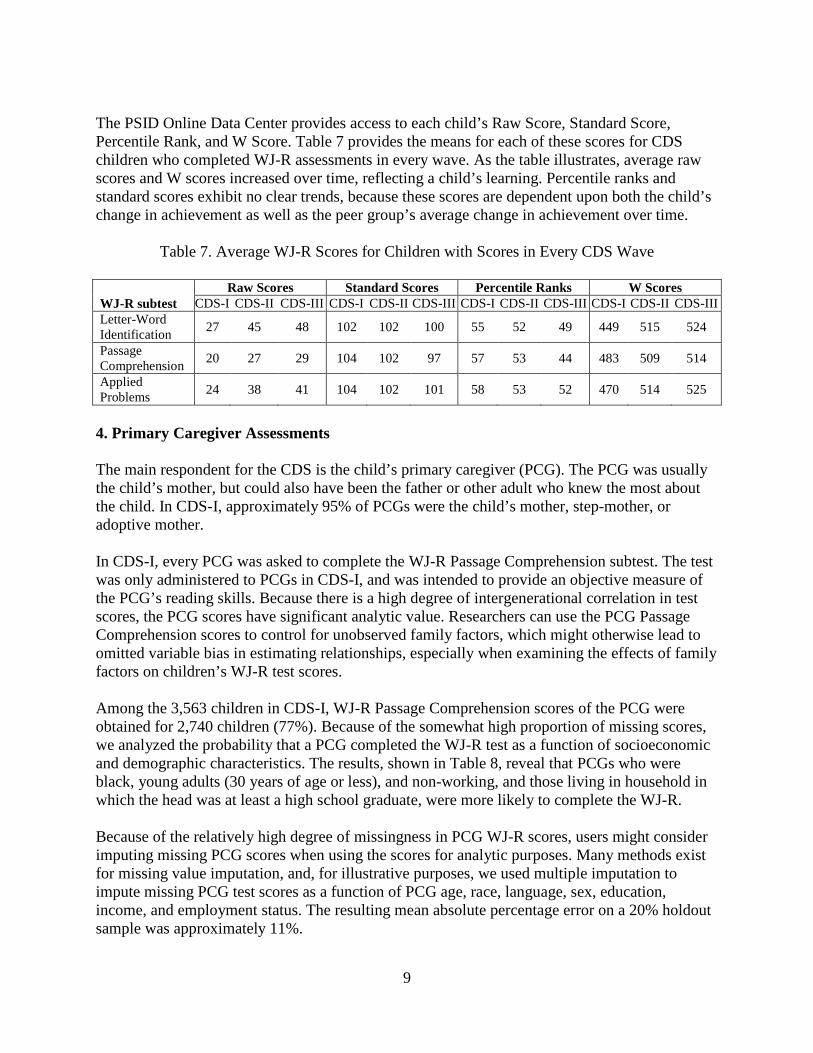
The PSID Online Data Center provides access to each child’s Raw Score, Standard Score, Percentile Rank, and W Score. Table 7 provides the means for each of these scores for CDS children who completed WJ-R assessments in every wave. As the table illustrates, average raw scores and W scores increased over time, reflecting a child’s learning. Percentile ranks and standard scores exhibit no clear trends, because these scores are dependent upon both the child’s change in achievement as well as the peer group’s average change in achievement over time.
Table 7. Average WJ-R Scores for Children with Scores in Every CDS Wave Raw Scores Standard Scores Percentile Ranks W Scores WJ-R subtest CDS-I CDS-II CDS-III CDS-I CDS-II CDS-III CDS-I CDS-II CDS-III CDS-I CDS-II CDS-III Letter-Word Identification 27 45 48 102 102 100 55 52 49 449 515 524
Passage Comprehension 20 27 29 104 102 97 57 53 44 483 509 514
Applied Problems 24 38 41 104 102 101 58 53 52 470 514 525
4. Primary Caregiver Assessments The main respondent for the CDS is the child’s primary caregiver (PCG). The PCG was usually the child’s mother, but could also have been the father or other adult who knew the most about the child. In CDS-I, approximately 95% of PCGs were the child’s mother, step-mother, or adoptive mother. In CDS-I, every PCG was asked to complete the WJ-R Passage Comprehension subtest. The test was only administered to PCGs in CDS-I, and was intended to provide an objective measure of the PCG’s reading skills. Because there is a high degree of intergenerational correlation in test scores, the PCG scores have significant analytic value. Researchers can use the PCG Passage Comprehension scores to control for unobserved family factors, which might otherwise lead to omitted variable bias in estimating relationships, especially when examining the effects of family factors on children’s WJ-R test scores. Among the 3,563 children in CDS-I, WJ-R Passage Comprehension scores of the PCG were obtained for 2,740 children (77%). Because of the somewhat high proportion of missing scores, we analyzed the probability that a PCG completed the WJ-R test as a function of socioeconomic and demographic characteristics. The results, shown in Table 8, reveal that PCGs who were black, young adults (30 years of age or less), and non-working, and those living in household in which the head was at least a high school graduate, were more likely to complete the WJ-R. Because of the relatively high degree of missingness in PCG WJ-R scores, users might consider imputing missing PCG scores when using the scores for analytic purposes. Many methods exist for missing value imputation, and, for illustrative purposes, we used multiple imputation to impute missing PCG test scores as a function of PCG age, race, language, sex, education, income, and employment status. The resulting mean absolute percentage error on a 20% holdout sample was approximately 11%.
9

Table 8. Logistic Regression Model Estimates of Whether PCG Completed WJ-R Assessment
Variable Estimate (Std. Err.)
Intercept 1.1645***
(0.2040)
Sample (vs. SRC sample) SEO sample -0.2904
(0.2059)
Immigrant sample -0.5091* (0.2658)
PCG married (vs. PCG unmarried) 0.1579
(0.1157)
PCG age (vs. PCG age 30-45) PCG age ≤30 0.4518***
(0.1529)
PCG age >45 0.1267
(0.1091)
Race/ethnicity (vs. white) Black 0.4564**
(0.2120)
Other -0.0276
(0.2444)
Male PCG (vs. female PCG) -0.3701
(0.2618)
Head education (vs. college graduate) Less than high school -0.4994***
(0.1911)
High school graduate -0.1104
(0.1597)
Some college -0.0560
(0.1662)
PCG employed (vs. PCG not employed) -0.2391*
(0.1251)
Family income quartile (vs. fourth quartile) First quartile 0.1078
(0.1766)
Second quartile -0.0109
(0.1601)
Third quartile -0.0211
(0.1490)
PCG number of children 0.0187 (0.0472)
Likelihood ratio join test of all parameters (χ2) 62.63*** Note: *p<.10, **p<.05, ***p<.01. N=2,411; 1,861 PCGs completed WJ tests.
Users should note that the language of test was not recorded for PCGs. This is problematic because different versions of the test were used for English and Spanish languages. The versions have a different number of questions, and therefore have a different correspondence between values of the raw score and processed scores (W Score, Standard Score, and Percentile Rank). As
10

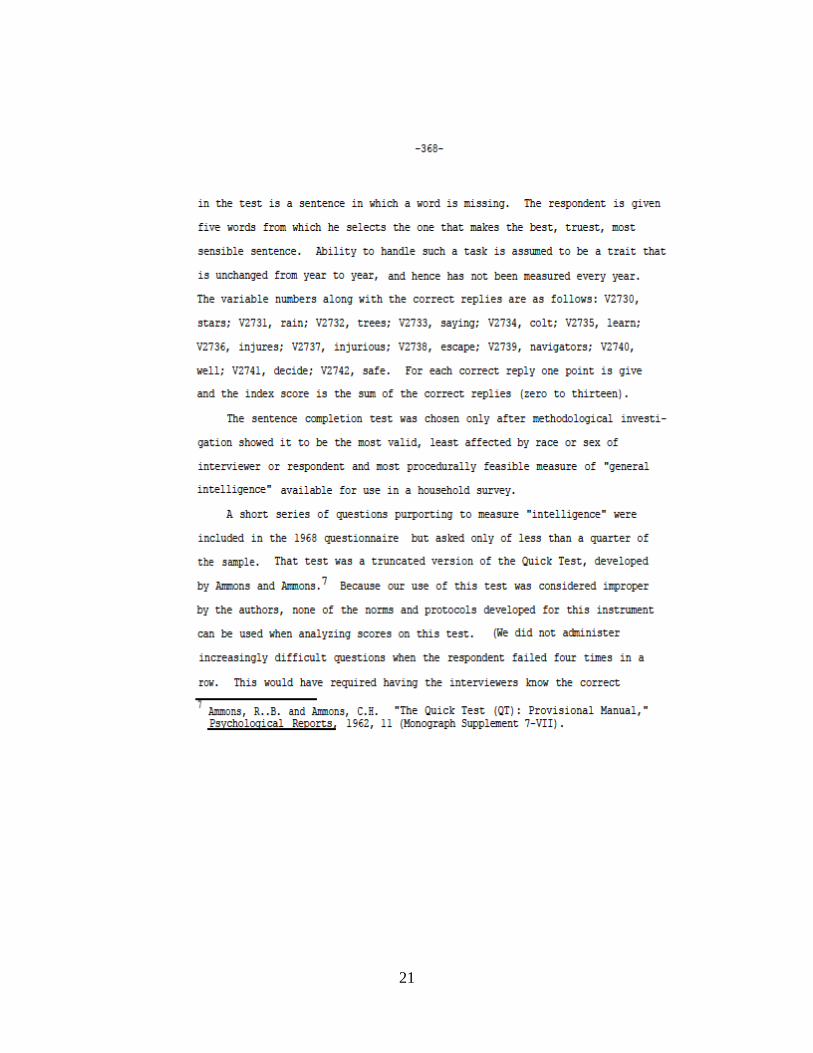
a result, only raw scores were previously released through the PSID Online Data Center. We have now provided processed scores for PCGs, after using variables in the 1997 Core PSID to impute test language. Specifically, we used Head/Wife race (ER12020) and whether a language other than English is spoken at home (ER11938) to impute the language most likely used to by the PCG when completing the test. If the Wife (when PCG is a Wife) or Head speaks a language other than English at home, and if the race of the Head/Wife is coded as “Mentions Hispanic,” then we assigned the score based on the Spanish test. Otherwise, we used the English score. Using this approach, approximately 5% of the children had PCGs who completed the Spanish test. 5. 1972 Lorge-Thorndike Sentence Completion Test (SCT) In the 1972 wave of PSID, respondents were administered a sentence completion test as a measure of language skill. The test was taken from the verbal part of the Lorge-Thorndike Intelligence Test (1950), and comprised thirteen items. Each item is a sentence in which a word is missing, and respondents were given five words from which to choose the best, most sensible answer. Scores ranged from 0–13, with a mean score of 9.0. The distribution of SCT scores is provided in Figure 1. (See Appendix 2 for the test items that were administered to respondents.)
Figure 1. Sentence Completion Test Score Distribution
Although it is a seemingly simple assessment, the SCT was tested and validated as part of the 1971 Detroit Survey, a survey of 365 Detroit residents (Veroff, et al., 1971). Ultimately, the SCT was selected because it was quick and simple to administer and score, and a Detroit Survey analysis suggested that it provided a robust measure of achievement across respondents by race, sex, and socioeconomic status, as well as across various other dimensions of cognitive skills and achievement (Veroff, et al, 1971). Specifically, the survey tested seven potential assessments. The selected tests covered the domains of verbal and perceptual skills. The SCT was found to be
0
200
400
600
800
1000
1200
0 1 2 3 4 5 6 7 8 9 10 11 12 13
11

highly correlated with the other six tests, highly correlated with education, and the results were robust across respondent race, interviewer race, sex, and socioeconomic status (see Appendices 3 and 4). In 1972, every respondent, typically the head of household, was asked to complete a SCT. Scores were similar between Head and Wife respondents (Table 9), and modestly lower for other respondents.
Table 9. Mean Sentence Completion Test (SCT) Score by Relationship to Head
Relationship to Head Mean SCT
score Count Head 9.0 4687 Wife 8.9 368 Child 8.7 14 Other relative (incl. in-laws) 8.0 2 Parent 8.0 2 Sibling 0.0 1
Table 10 shows the relationship between SCT scores and the respondent’s education, sex, age, and race/ethnicity. SCT scores increased significantly with years of completed schooling. In addition, the SCT scores also exhibit statistically significant differences by respondent sex, age group, and race/ethnicity (of household head).
Table 10. Mean Sentence Completion Test (SCT) Score by Respondent Education, Sex, Age and Head Race
Variable Mean SCT
score Count
Education*** Less than 9 years schooling 7.5 1,229 9-12 years schooling 9.1 2,101 >12 years schooling 10.7 705
Sex*** Male 9.2 3,250 Female 8.6 1,816
Age*** ≤ 25 years 9.3 985 26– 45 years 9.3 2,023 46+ years 8.6 2,058
Race/ethnicity of head*** White 9.7 3,151 Black 7.8 1,754 Hispanic 8.0 124 Other 8.3 37 Note: *p<.10, **p<.05, ***p<.01, for F-test of the joint effect of categorical variables on SCT scores.
12

6. Intergenerational Analysis Taken together, the child, PCG, and 1972 Household Head assessments provide users with an intergenerational view of achievement. Using the PSID’s Family Information Mapping System (FIMS),3 we can identify the parents and grandparents of CDS children. Most CDS children have at least one grandparent who completed the 1972 sentence completion test. Of the 3,563 children in the CDS, grandparent test scores are available for 2,580 children (983 children do not have a matched grandparent SCT score from 1972 PSID). The primary reasons that a grandparent test score is not available are: (a) the child was from the 1997 immigrant refresher sample and hence did not have a family member participate in the 1972 PSID; (b) we are not able to identify the child’s grandparents; or (c) the grandparent was not in the 1972 wave of the PSID. A summary of the reasons for missing scores is shown in Figure 2.
Figure 2: Children Missing Grandparent Sentence Completion Scores
3 To make it easier to create data extracts that include information on parents, grandparents, and siblings of the focal person, the PSID created the Family Identification Mapping System - FIMS. See http://simba.isr.umich.edu/FIMS/ for a tutorial and documentation.
Children missing Sentence Completion
Test scores: 983
Original 1968 sample: 654
At least one grandparent in FIMS:
532
Identified grandparent(s) non-respondent in 1972:
494
Grandparent not in 1972 data:
38
Unable to identify grandparent:
122
1997 immigrant refresher sample:
329
13

Grandparent sentence completion test scores are available for 72% of CDS children. It is nearly always the case that the FIMS-identified grandparent without a test score was either the wife or a child of the Household Head in 1972 (and, therefore, was not the 1972 respondent). Although we do not have test scores for these grandparents, we do have socioeconomic status and demographic characteristics that can be used to impute test scores. If users impute sentence completion scores for the 494 children with a grandparent who is identified in FIMS, the percent of CDS children with grandparent test scores increases to 86%. The relationship between CDS children and their grandparent with the 1972 sentence completion test score is detailed in Table 11. Note that in a handful of cases, the sentence completion test score was for the CDS child’s parent. In most cases, the 1972 respondent was the household head, and therefore male. Approximately 58% of the 1972 test scores are available for a relative (grandparent or parent) on the CDS child’s maternal side, while 42% are for a paternal relative. Although we might have naively assumed an even split between test scores from relatives on the mother’s and father’s side, the higher prevalence of maternal relatives likely reflects prevailing rates of single parenthood and estrangement between fathers and children.
Table 11. Summary of Relationship Between the 1972 PSID Respondents and CDS Sampled Children
1972 respondent relationship to CDS child Count Percent Mother's father 1,050 38.2% Father's father 765 27.8% Mother's mother 504 18.3% Father's mother 310 11.3% Mother's adoptive father 31 1.1% Adoptive father's father 16 0.6% Adoptive mother's father 11 0.4% Father's adoptive father 10 0.4% Adoptive father's mother 7 0.3% Adoptive mother's mother 4 0.1% Adoptive mother's adoptive mother 1 0.0% Mother's adoptive mother 1 0.0% Father 29 1.1% Adoptive father 4 0.1% Mother 3 0.1% Adoptive mother 2 0.1% Total 2,748 100.0%
We can assess parents’ academic achievement using the PCG WJ-R scores, because the child’s PCG is typically the child’s mother or adoptive mother. In fact, the PCG is the child’s mother or father (birth, adoptive, or step-parent) for over 98% of the CDS children. The PCG to CDS child relationship is detailed in Table 12. Without resorting to imputed test scores, data users can conduct three-generation analyses using assessments for over half of the CDS children. Figure 3 identifies the children for whom assessments are available for the child, his or her PCG, and a grandparent. Note that the Sentence Completion Test respondent is not always the PCG’s parent. Of the 2,411 PCGs in CDS-I, the
14

PSID has Sentence Completion Test score for a parent of 1,000 of the PCGs. Table 13 describes the relationship between the PCG and the 1972 SCT respondent.
Table 12. Summary of Relationship Type between the PCG and CDS Sampled Children
PCG relationship to CDS child Count Percent Mother/stepmother/adoptive mother 3,407 95.6% Father/stepfather/adoptive father 97 2.7% Legal guardian 44 1.2% Other adult in household 15 0.4% Total 3,563 100.0%
Table 13. Summary of PCG’s Relationship with Sentence Completion Test Respondent
Child's PCG relationship with SCT respondent Count Percent Father/adoptive father 1020 28.6% Mother/adoptive mother 455 12.8% Both 45 1.3% Child's PCG not related to SCT respondent 986 27.7% No grandparent SCT score 1057 29.7% Total 3563 100.0%
Figure 3. Availability of Test Scores across Multiple Generations
Total CDS children 3563
Complete set of CDS assessments
2836
PCG assessment complete
2543
Grandparent 1972 sentence completion
score available 1789
Grandparent 1972 sentence completion
score missing 754
PCG assessment missing
293
Grandparent 1972 sentence completion
score available 210
Grandparent 1972 sentence completion
score missing 83
One or more CDS assessments missing
727
PCG assessment complete
530
Grandparent 1972 sentence completion
score available 363
Grandparent 1972 sentence completion
score missing 167
PCG assessment missing
197
Grandparent 1972 sentence completion
score available 144
Grandparent 1972 sentence completion
score missing 53
15

7. Summary The CDS was designed to supplement the Core PSID by collecting detailed prospective data on children’s cognitive, behavioral, and health status to understand the process of development and accumulation of human capital. The WJ-R assessments, administered in every wave of the CDS, provide an objective measurement of cognitive achievement over time. In addition to child cognitive achievement, the PSID provides objective measures of parent and grandparent cognitive skills through the PCG WJ-R scores and the 1972 Sentence Completion Test. Table 14 shows that there exists a strong, statistically significant correlation among these achievement test scores. As a result, the intergenerational assessments are valuable as both explanatory and descriptive variables, as well as measures to correct for unobserved family characteristics.
Table 14. Correlations among Intergenerational Assessments
CDS-III Passage Comprehension Standard Score
PCG Passage Comprehension Standard Score
Grandparent Sentence Completion
Test Score CDS-III Passage Comprehension Standard Score
1 0.39*** 0.32***
PCG Passage Comprehension Standard Score
0.39 1 0.38***
Grandparent Sentence Completion
Test Score 0.32*** 0.38*** 1
Note: *** p<.01 for correlation coefficient = 0.
16

References Hofferth, Sandra, Pamela E. Davis-Kean, Jean Davis, and Jonathan Finkelstein. 1997. The Child
Development Supplement to the Panel Study of Income Dynamics: 1997 User Guide. Survey Research Center, Institute for Social Research, University of Michigan, Ann Arbor, MI. (http://psidonline.isr.umich.edu/CDS/cdsi_userGD.pdf)
Jaffe, Lynne E.2009. Development, Interpretation, and Application of the W Score and the
Relative Proficiency Index. Woodcock Johnson Assessment Service Bulletin, Number 11. Rolling Meadows, IL: Riverside Publishing.
McGonagle, Katherine A., and Narayan Sastry. 2014. “Cohort Profile: The Panel Study of
Income Dynamics’ Child Development Supplement (CDS) and Transition into Adulthood Study (TA),” International Journal of Epidemiology. ePub ahead of publication.
McGonagle, Katherine A., Robert F. Schoeni, Narayan Sastry, and Vicki Freedman. 2012. “The
Panel Study of Income Dynamics: Overview, Recent Innovations, and Potential for Life Course Research,” Longitudinal and Life Course Studies 3(2): 268–284.
McGrew, K.S., J.K. Werder, and R.W. Woodcock. 1991. WJ-R Technical Manual: A Reference
on Theory and Current Research. Chicago, IL: Riverside. Morgan, James N., Katherine Dickinson, Jonathan Dickinson, Jacob Benus, and Greg Duncan.
1974. Five Thousand American Families: Patterns of Economic Progress, Volume I, An Analysis of the First Five Years of the Panel Study of Income Dynamics. Survey Research Center, Institute for Social Research, University of Michigan, Ann Arbor, MI. (https://psidonline.isr.umich.edu/Publications/Books/5KFams/VolumeI.pdf)
PSID. 1972. A Panel Study of Income Dynamics: Study Design, Procedures, Available Data.
1968–1972 Interviewing Years (Waves I–V), Volume I. Survey Research Center, Institute for Social Research, University of Michigan, Ann Arbor, MI, Pages 367–371.
PSID. 2010. The Panel Study of Income Dynamics Child Development Supplement: User Guide
for CDS-II. Survey Research Center, Institute for Social Research, University of Michigan, Ann Arbor, MI. (http://psidonline.isr.umich.edu/CDS/cdsii_userGd.pdf)
PSID. 2012. The Panel Study of Income Dynamics Child Development Supplement: User Guide
for CDS-III. Survey Research Center, Institute for Social Research, University of Michigan, Ann Arbor, MI. (http://psidonline.isr.umich.edu/CDS/cdsiii_userGd.pdf)
Veroff, Joseph, Lou McClelland, and Kent Marquis. 1971. Measuring Intelligence and
Achievement Motivation in Survyes. Technical Series Paper #71, Panel Study of Income Dynamics, Survey Research Center, Institute for Social Research, University of Michigan, Ann Arbor, MI. (http://psidonline.isr.umich.edu/Publications/Papers/tsp/1971-01_Intelli_achiv.pdf)
Woodcock, R.W., and N. Mather. 1989. Woodcock-Johnson Psycho-Educational Battery--
Revised. Chicago, IL: Riverside.
17

Appendix 1. Logistic Regression Model Estimates of Whether an Eligible Child Attempted the 1997 WJ-R Assessments
Variable Estimate (Std. Err.)
Intercept 1.078***
(0.3593)
Sample (vs. SRC sample) SEO sample 0.0220
(0.2372)
Immigrant refresher sample -0.0882
(0.1938)
Child age (years) 0.0223
(0.0168)
Race/ethnicity (vs. white) Black 0.1261
(0.2080)
Other -0.6406
(0.2071)
Male household head (vs. female) 0.0642
(0.1304)
Head education (vs. college graduate) Less than high school -0.5833***
(0.1688)
High school graduate -0.2564*
(0.1542)
Some college -0.1859
(0.1611)
Head employed (vs. not employed) -0.1144
(0.1428)
Family income quartile (vs. fourth quartile) First quartile 0.1696
(0.1852)
Second quartile 0.0548
(0.1401)
Third quartile -0.0754
(0.1401)
Region (vs. South) Northeast -0.2494
(0.1536)
North Central -0.01724
(0.1256)
West 0.0995 (X.XXX) Household in SMSA (vs. not in SMSA) 0.0041 (0.1037) Likelihood ratio join test of all parameters (χ2) 53.78*** Note: *p<.10, **p<.05, ***p<.01. Model estimated on 2,803 eligible CDS child observations, among who X,XXX attempted the WJ-R assessments.
18
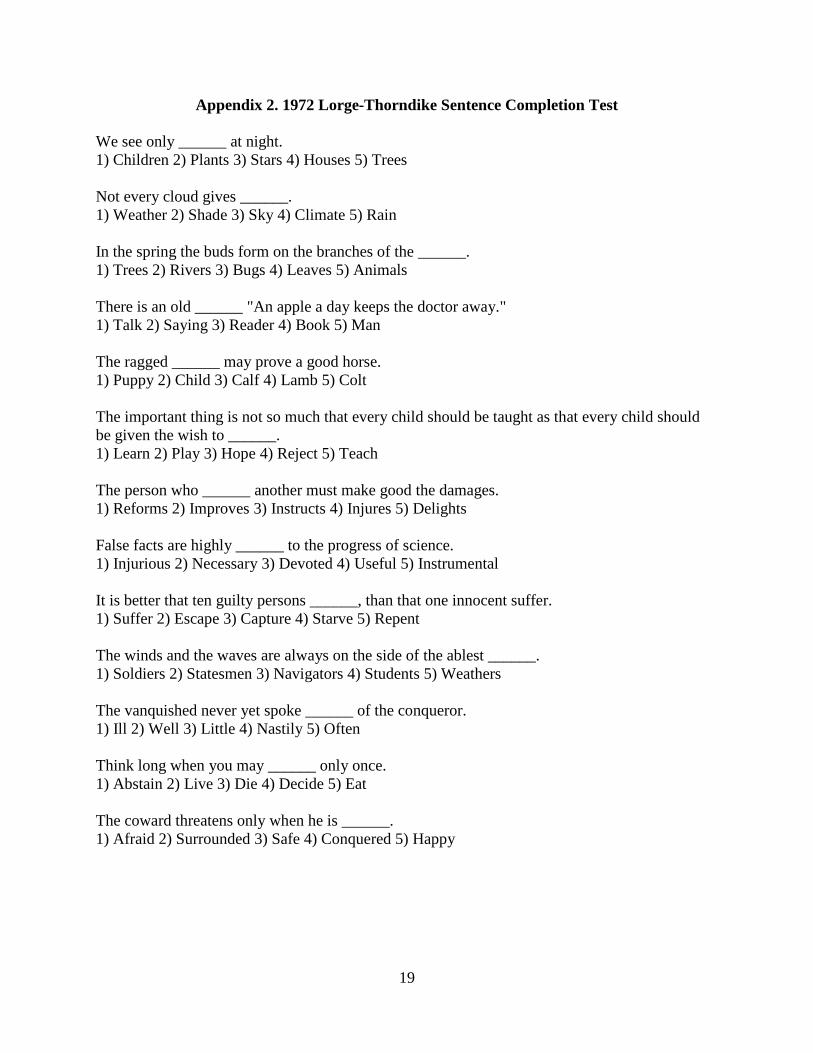
Appendix 2. 1972 Lorge-Thorndike Sentence Completion Test We see only ______ at night. 1) Children 2) Plants 3) Stars 4) Houses 5) Trees Not every cloud gives ______. 1) Weather 2) Shade 3) Sky 4) Climate 5) Rain In the spring the buds form on the branches of the ______. 1) Trees 2) Rivers 3) Bugs 4) Leaves 5) Animals There is an old ______ "An apple a day keeps the doctor away." 1) Talk 2) Saying 3) Reader 4) Book 5) Man The ragged ______ may prove a good horse. 1) Puppy 2) Child 3) Calf 4) Lamb 5) Colt The important thing is not so much that every child should be taught as that every child should be given the wish to ______. 1) Learn 2) Play 3) Hope 4) Reject 5) Teach The person who ______ another must make good the damages. 1) Reforms 2) Improves 3) Instructs 4) Injures 5) Delights False facts are highly ______ to the progress of science. 1) Injurious 2) Necessary 3) Devoted 4) Useful 5) Instrumental It is better that ten guilty persons ______, than that one innocent suffer. 1) Suffer 2) Escape 3) Capture 4) Starve 5) Repent The winds and the waves are always on the side of the ablest ______. 1) Soldiers 2) Statesmen 3) Navigators 4) Students 5) Weathers The vanquished never yet spoke ______ of the conqueror. 1) Ill 2) Well 3) Little 4) Nastily 5) Often Think long when you may ______ only once. 1) Abstain 2) Live 3) Die 4) Decide 5) Eat The coward threatens only when he is ______. 1) Afraid 2) Surrounded 3) Safe 4) Conquered 5) Happy
19

Appendix 3. Original Documentation for 1972 Sentence Completion Test Source: PSID. 1972. A Panel Study of Income Dynamics: Study Design, Procedures, Available Data. 1968–1972 Interviewing Years (Waves I–V), Volume I. Survey Research Center, Institute for Social Research, University of Michigan, Ann Arbor, MI, Pages 367–371.
20
21

22

23
24

Appendix 4. Further Description of 1972 Sentence Completion Test Source: Morgan, James N., Katherine Dickinson, Jonathan Dickinson, Jacob Benus, and Greg Duncan. 1974. Five Thousand American Families: Patterns of Economic Progress, Volume I, An Analysis of the First Five Years of the Panel Study of Income Dynamics. Survey Research Center, Institute for Social Research, University of Michigan, Ann Arbor, MI.
25

26
27

28

29