achievement testing alberta provincial highlights 9 · pdf filethis document contains...
TRANSCRIPT

GR
AD
E
9Alberta Provincial Achievement Testing
AssessmentHighlights
2014–2015
Mathematics

This document contains assessment highlights from the 2015 Grade 9 Mathematics Achievement Test. The examination statistics included in this document represent all writers in English. To obtain French-only statistics which may apply to your school, please refer to the French version of this document.
Assessment Highlights provides information about the overall test, test blueprints, and student performance on the achievement test that was administered in 2015. Also provided is commentary on student performance at the acceptable standard and the standard of excellence on selected items from the 2015 Mathematics Achievement Test. This information is intended for teachers and is best used in conjunction with multi-year and detailed school reports that are available in schools via the extranet. Assessment Highlights reports for all achievement test subjects and grades will be posted on the Alberta Education website every year in the fall.
All released achievement tests, including test blueprints, answer keys with the item difficulty, reporting category, test section, and item description for each test item, are located at education.alberta.ca/admin/testing/achievement/answerkeys.aspx.
These materials, along with the program of studies and subject bulletins, provide information that can be used to inform instructional practice.
For further information, contact: Kelly Rota, Grades 6 and 9 Mathematics Assessment Standards Team Leader, at [email protected]; Sandy Myshak, Grades 6 and 9 Mathematics Examiner, at [email protected]; or Nicole Lamarre, Director, Student Learning Assessments and Provincial Achievement Testing, at [email protected] at the Provincial Assessment Sector, or call 780-427-0010. To call toll-free within Alberta, dial 310-0000.
The Alberta Education Internet address is education.alberta.ca.
This document was written primarily for:
Students
Teachers of Grade 9 Mathematics
Administrators
Parents
General Audience
Others
Copyright 2015, the Crown in Right of Alberta, as represented by the Minister of Education, Alberta Education, Assessment Sector, 44 Capital Boulevard, 10044 108 Street NW, Edmonton, Alberta T5J 5E6, and its licensors. All rights reserved.
Special permission is granted to Alberta educators only to reproduce, for educational purposes and on a non-profit basis, parts of this document that do not contain excerpted material.
Excerpted material in this document shall not be reproduced without the written permission of the original publisher (see credits, where applicable).

ContentsThe 2015 Grade 9 Mathematics Achievement Test ........................................................................................................ 1
How Many Students Wrote the Test? .................................................................................................................... 1
What Was the Test Like? ....................................................................................................................................... 1
How Well Did Students Do? .................................................................................................................................. 1
2015 Test Blueprint and Student Achievement ............................................................................................................... 2
2015 Grade 9 Mathematics Achievement Test Design Commentary ............................................................................. 3
Sample Questions from the 2015 Grade 9 Mathematics Achievement Test .......................................................... 4
Achievement Testing Program Support Documents .....................................................................................................14


1
The 2015 Grade 9 Mathematics Achievement Test
This report provides teachers, school administrators, and the public with an overview of the performance of those students who wrote the 2015 Grade 9 Mathematics Achievement Test. It complements the detailed school and jurisdiction reports.
How Many Students Wrote the Test?A total of 38 687 students wrote the 2015 Grade 9 Mathematics Achievement Test. The English form of the test was written by 35 954 students, and the French form of the test was written by 2 733 students.
What Was the Test Like?The 2015 Grade 9 Mathematics Achievement Test consisted of 40 multiple-choice and 10 numerical-response questions based on four strands: Number, Patterns and Relations, Shape and Space, and Statistics and Probability. In keeping with the intent of the 2007 Program of Studies, the questions on the test required students to apply their understanding of one or more mathematical concepts from within and/or across the four strands. As they solved the mathematical problems, students were expected to use the interrelated mathematical processes of Communication, Connections, Mental Mathematics and Estimation, Problem Solving, Reasoning, and Visualization. A detailed explanation of these mathematical processes is in the Alberta K–9 Mathematics Program of Studies.
How Well Did Students Do?The percentages of students meeting the acceptable standard and the standard of excellence in 2015 are shown in the graph below. Out of a total score of 50 on the test, the provincial average was 29.5/50 (59.0%). The results presented in this report are based on scores of students who wrote the English version of the test. Detailed provincial assessment results are provided in school and jurisdiction reports.
2015 Achievement Standards: The percentage of students in the province who met the acceptable standard on the 2015 Grade 9 Mathematics Achievement Test (based on those who wrote)
0
10
20
30
40
50
60
70
80
90
100
2015 Achievement Standards: The percentage of students in the province who met the standard of excellence on the 2015 Grade 9 Mathematics Achievement Test (based on those who wrote)
2
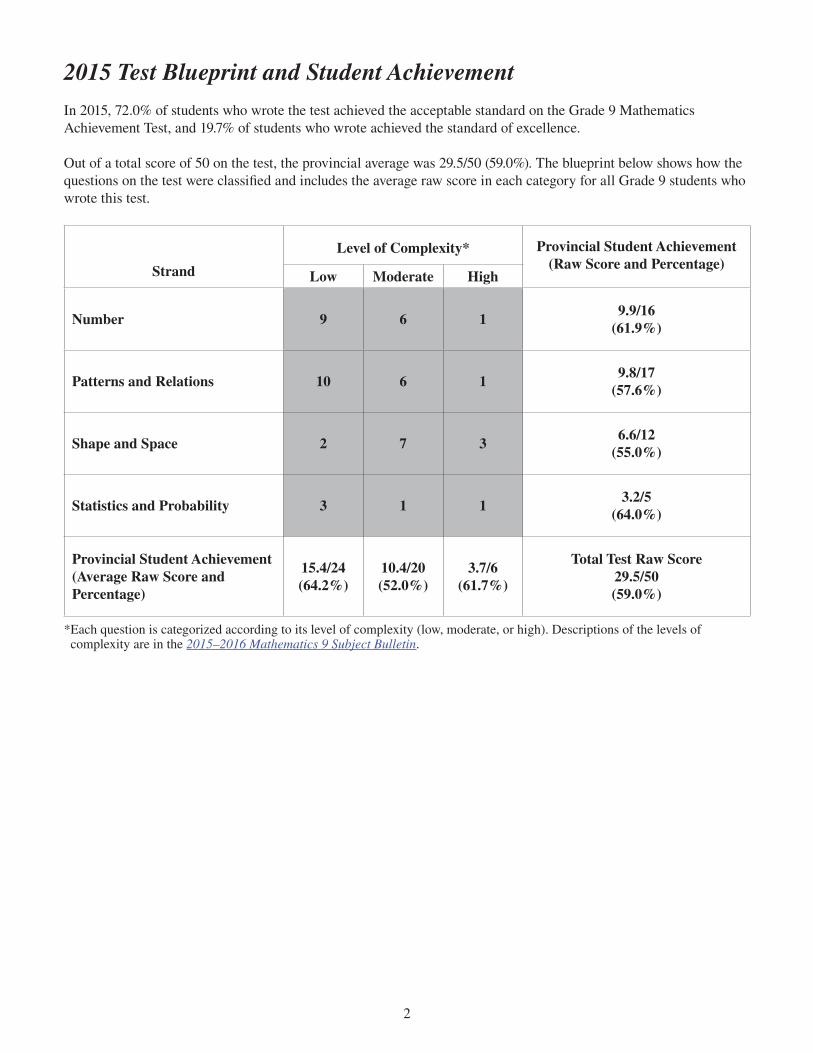
2015 Test Blueprint and Student Achievement
In 2015, 72.0% of students who wrote the test achieved the acceptable standard on the Grade 9 Mathematics Achievement Test, and 19.7% of students who wrote achieved the standard of excellence.
Out of a total score of 50 on the test, the provincial average was 29.5/50 (59.0%). The blueprint below shows how the questions on the test were classified and includes the average raw score in each category for all Grade 9 students who wrote this test.
Strand
Level of Complexity* Provincial Student Achievement (Raw Score and Percentage)
Low Moderate High
Number 9 6 19.9/16
(61.9%)
Patterns and Relations 10 6 19.8/17
(57.6%)
Shape and Space 2 7 36.6/12
(55.0%)
Statistics and Probability 3 1 13.2/5
(64.0%)
Provincial Student Achievement(Average Raw Score and Percentage)
15.4/24(64.2%)
10.4/20(52.0%)
3.7/6(61.7%)
Total Test Raw Score 29.5/50(59.0%)
*Each question is categorized according to its level of complexity (low, moderate, or high). Descriptions of the levels of complexity are in the 2015–2016 Mathematics 9 Subject Bulletin.

3
2015 Grade 9 Mathematics Achievement Test Design Commentary
The 2015 Mathematics Provincial Achievement Test for Grade 9 was based on the 2007 Alberta K–9 Mathematics Program of Studies that was implemented in the 2011–2012 school year. The test blueprint provides information about new test design features (i.e., complexity) and modified test design features (i.e., item format and strand). Items now are selected not only in terms of the knowledge and skills that they assess, but also in terms of their complexity in the form of content and cognition. The introduction of item complexity will provide more information about the depth to which students have mastered particular learning outcomes, as well as provide one more control in the selection of test items to better ensure that tests are equivalent from year to year. Please refer to the 2015–2016 Mathematics 9 Subject Bulletin for more-detailed information about item complexity.
The selection of test items within each of the four strands is now based on two primary factors: item difficulty and item complexity.
Item difficulty refers to the percentage of students who actually chose the correct answer. Items for which the correct answer is selected by more than 70% of the students are generally considered easy. Items for which the correct answer is selected by 50 –70% of the students are about average in difficulty. Items for which the correct answer is selected by less than 50% of the students are regarded as challenging.
Item complexity refers to the cognitive and content demands associated with an item. The rationale for classifying items by their level of complexity is to focus on the expectations underlying the item and not the ability of the student. The cognitive demands that an item makes on a student (i.e., what an item requires the student to recall, understand, analyze, and do) are made with the assumption that the student is familiar with the basic concepts of the task.
The categories—low complexity, moderate complexity, and high complexity—form an ordered description of the demands an item may make on a student. For example, low-complexity items may require a student to solve a one-step problem. Moderate-complexity items may require multiple steps. High-complexity items go even further and require a student to analyze and synthesize information. It is therefore important to consider both the content being assessed by an item and the item complexity when making inferences about student performance on any one outcome. Although there is a logical and predictable relationship between item difficulty and item complexity (i.e., items that are of high complexity tend to be more challenging), there are exceptions.
The following 10 items have been released to illustrate significant performance differences between 3 groups of students: those students who achieved the standard of excellence, those who achieved the acceptable standard, and those students who were below the acceptable standard. The purpose of these comparisons is to provide additional information that may be used for instructional purposes.

4
Sample Questions from the 2015 Grade 9 Mathematics Achievement Test
The following 10 items illustrate significant performance differences between students who obtained the standard of excellence, the acceptable standard, or below the acceptable standard.
Item # Strand Specific Outcome Item Complexity Item Description
6 PR 3 Moderate Select the algebraic expression that represents given information about a real-life context (Gr.8, PR.2).
% of Student Responses (*Correct)
A* B C D
Students Achieving Standard of Excellence 91.9 0.8 6.6 0.8
Students Achieving Acceptable Standard 64.5 7.7 20.8 6.9
Students Below Acceptable Standard 33.3 20.8 23.5 21.7
Catherine sells cupcakes, c, for $1.50 each. The ingredients for each cupcake cost her $0.30, and the sum of all of her other expenses is $20.00/month.
6. Which of the following expressions represents Catherine’s profit each month?
A. 1.5c – (20 + 0.3c)
B. 20c – (1.5 + 0.3c)
C. (20 + 0.3c) – 1.5c
D. (1.5 + 0.3c) – 20c

5
Item # Strand Specific Outcome Item Complexity Item Description
12 N 6 Low Solve a given problem involving the square roots of numbers that are non-perfect squares (Gr.8, N.2).
% of Student Responses (*Correct)
A B* C D
Students Achieving Standard of Excellence 0.9 93.8 3.1 2.2
Students Achieving Acceptable Standard 10.2 64.6 18.9 6.2
Students Below Acceptable Standard 16.1 24.5 49.5 9.6
The area, A, of four square carpets is shown below.
12. Which carpet will cover the most floor area, without touching a wall, when it is laid flat in a square room that has a width of 4.5 m?
A. Carpet 1
B. Carpet 2
C. Carpet 3
D. Carpet 4

6
Item # Strand Specific Outcome Item Complexity Item Description
13 SP 3 Low Analyze the graphs of four linear relations to draw a conclusion to a given question.
% of Student Responses (*Correct)
A B C D*
Students Achieving Standard of Excellence 8.5 0.6 0.2 90.7
Students Achieving Acceptable Standard 27.7 2.1 0.7 69.5
Students Below Acceptable Standard 52.4 6.5 3.2 37.6
The cost of renting a car includes the base fee and a charge for each kilometre driven. The graph below represents the total cost of renting a vehicle at four different rental car companies.
13. Which rental car company has the smallest charge for each kilometre driven?
A. Company W
B. Company X
C. Company Y
D. Company Z

7
Item # Strand Specific Outcome Item Complexity Item Description
16 PR 7 Moderate Simplify a given algebraic expression involving the multiplication and division of polynomial expressions by monomials.
% of Student Responses (*Correct)
A B* C D
Students Achieving Standard of Excellence 4.3 82.6 4.6 8.3
Students Achieving Acceptable Standard 19.4 45.4 19.3 15.4
Students Below Acceptable Standard 28.5 22.9 31.1 16.9
Four students simplified the expression ( )( )
xx x
2 33 4 6-
. Their answers are shown below.
16. Which student correctly simplified the expression?
A. Student 1
B. Student 2
C. Student 3
D. Student 4

8
Item # Strand Specific Outcome Item Complexity Item Description
22 N 3 Low Represent the relationship among three different rational numbers by graphing them on a number line.
% of Student Responses (*Correct)
A B C D*
Students Achieving Standard of Excellence 1.8 1.6 1.9 94.6
Students Achieving Acceptable Standard 7.5 6.7 8.8 76.9
Students Below Acceptable Standard 18.3 22.0 25.4 33.6
Variables q, r, and s represent rational numbers.
q > r s = q + 1
22. Which of the following number lines represents the order of the three rational numbers?

9
Item # Strand Specific Outcome Item Complexity Item Description
24 PR 2 High Graph two linear relations to determine where the two relations intersect on the Cartesian plane (Gr.8, PR.1).
% of Student Responses (*Correct)
A B C* D
Students Achieving Standard of Excellence 5.6 6.8 83.6 3.7
Students Achieving Acceptable Standard 13.6 27.3 48.1 10.2
Students Below Acceptable Standard 19.6 34.5 28.3 16.3
24. The graphs of the relations 3x + y = 17 and y = x + 1 intersect at the point with the coordinates
A. (0, 1)
B. (3, 8)
C. (4, 5)
D. (5, 4)

10
Item # Strand Specific Outcome Item Complexity Item Description
31 PR 4 Moderate Identify the number line that represents the solution to a given linear inequality.
% of Student Responses (*Correct)
A* B C D
Students Achieving Standard of Excellence 80.1 5.2 11.2 3.4
Students Achieving Acceptable Standard 37.5 12.0 34.8 15.4
Students Below Acceptable Standard 16.1 21.3 36.3 25.5
31. Which number line shown below represents the solution to 4(2x – 1) > 4x + 8?

11
Item # Strand Specific Outcome Item Complexity Item Description
32 SS 5 High Complete a given 2-D shape by performing a single transformation to determine the angle of rotational symmetry of the completed 2-D shape (Gr.7, SS.5).
% of Student Responses (*Correct)
A B* C D
Students Achieving Standard of Excellence 4.0 93.6 0.4 2.0
Students Achieving Acceptable Standard 11.0 79.1 3.5 6.2
Students Below Acceptable Standard 20.9 56.6 11.0 10.6
The 2-D shape shown on the Cartesian plane below is reflected about the y-axis.
32. If the original 2-D shape and the reflected image combine to form a new 2-D shape, what is the angle of rotational symmetry of the new 2-D shape?
A. 90°
B. 180°
C. 270°
D. 360°

12
Item # Strand Specific Outcome Item Complexity Item Description
NR 4 SS 5 Low Complete the missing part a 2-D design by performing a single transformation given its line of symmetry (GR.7, SS.5).
% of Student Responses
Correct Incorrect
Students Achieving Standard of Excellence 95.1 4.9
Students Achieving Acceptable Standard 76.7 23.3
Students Below Acceptable Standard 40.4 59.6
An incomplete 2-D shape and its line of symmetry are shown in the diagram below.
Numerical Response
When the 2-D shape is completely drawn, how many points will be inside the 2-D shape?
Answer:
(Record your answer in the numerical-response section on the answer sheet.)
4.

13
Item # Strand Specific Outcome Item Complexity Item Description
NR 10 N 6 Low Identify the benchmarks that would give the most accurate estimation of the square root of a non-perfect square number (Gr.8, N.2).
% of Student Responses
Correct Incorrect
Students Achieving Standard of Excellence 93.5 6.5
Students Achieving Acceptable Standard 71.2 28.8
Students Below Acceptable Standard 35.4 64.6
Numerical Response
Which two squares shown above represent the best benchmarks for estimating the value of 43 ?
Answer: Square __________ and Square __________
(Record both digits of your answer in any order in the numerical-response section on the answer sheet.)
10.

Achievement Testing Program Support DocumentsThe Alberta Education website contains several documents that provide valuable information about various aspects of the achievement testing program. To access these documents, go to the Alberta Education website at education.alberta.ca. Click on one of the specific links to access the following documents.
Achievement Testing Program General Information BulletinThe General Information Bulletin is a compilation of several documents produced by Alberta Education and is intended to provide superintendents, principals, and teachers with easy access to information about all aspects of the achievement testing program. Sections in the bulletin contain information pertaining to schedules and significant dates; security and test rules; test administration directives, guidelines, and procedures; calculator and computer policies; test accommodations; test marking and results; field testing; resources and web documents; forms and samples; and Provincial Assessment Sector contacts.
Subject BulletinsAt the beginning of each school year, subject bulletins are posted on the Alberta Education website for all achievement test subjects for grades 6 and 9. Each bulletin provides descriptions of assessment standards, test design and blueprinting, and scoring guides (where applicable) as well as suggestions for preparing students to write the tests and information about how teachers can participate in test development activities.
Examples of the Standards for Students’ WritingFor achievement tests in grades 6 and 9 English Language Arts and Français/French Language Arts, writing samples have been designed to be used by teachers and students to enhance students’ writing and to assess this writing relative to the standards inherent in the scoring guides for the achievement tests. The exemplars documents contain sample responses with scoring rationales that relate student work to the scoring categories and scoring criteria.
Previous Achievement Tests and Answer KeysAll January achievement tests (parts A and B) for Grade 9 semestered students are secured and must be returned to Alberta Education. All May/June achievement tests are secured except Part A of grades 6 and 9 English Language Arts and Français/French Language Arts. Unused or extra copies of only these Part A tests may be kept at the school after administration. Teachers may also use the released items and/or tests that are posted on the Alberta Education website.
Parent GuidesEach school year, versions of the Alberta Provincial Achievement Testing Parent Guide for grades 6 and 9 are posted on the Alberta Education website. Each guide presents answers to frequently asked questions about the achievement testing program as well as descriptions of and sample questions for each achievement test subject.
Involvement of TeachersTeachers of grades 6 and 9 are encouraged to take part in activities related to the achievement testing program. These activities include item development, test validation, field testing, and marking. In addition, arrangements can be made through the Alberta Regional Professional Development Consortia for teacher in-service workshops on topics such as Interpreting Achievement Test Results to Improve Student Learning.