achats en ligne etude us 2013
DESCRIPTION
Achats en ligne etude us 2013TRANSCRIPT


© 2013 United Parcel Service of America, Inc. 2
Contents
Welcome to the UPS Pulse of the Online Shopper Study ............................................................................ 3
Methodology ............................................................................................................................................. 4
Key Findings ............................................................................................................................................. 4
The State of Online Shopping Satisfaction ................................................................................................... 6
Factors Driving Retailer Recommendations ............................................................................................. 8
Valued Options for Omnichannel Shoppers .............................................................................................. 9
Mobile: The Next Frontier for Digital Commerce ........................................................................................ 11
Mobile Playing a Significant Role ............................................................................................................ 11
Mobile Shopping Habits .......................................................................................................................... 12
Social Commerce ....................................................................................................................................... 14
Social Media Drives Retailer Engagement ............................................................................................. 14
Check-Out Process .................................................................................................................................... 16
Factors Driving Cart Abandonment ......................................................................................................... 16
Setting Delivery Expectations ................................................................................................................. 18
The “Speeders” Profile ............................................................................................................................ 18
Delivery Dates Can Drive Cart Abandonment ........................................................................................ 19
The Delivery Experience ............................................................................................................................ 20
Package Tracking an Important Feature ................................................................................................. 21
Returns and Exchanges ............................................................................................................................. 22
Hassle-Free Returns Drive Recommendations ...................................................................................... 23
Elements of a Positive and Negative Returns Experience ...................................................................... 24
Conclusions ................................................................................................................................................ 26

© 2013 United Parcel Service of America, Inc. 3
Welcome to the UPS Pulse of the Online Shopper Study
Online retail growth (Figure 1) continues to significantly outpace that of overall retail, making a
competitive online shopping experience essential for retailers seeking to capture their share of the thriving
e-commerce market. That’s why UPS has commissioned research with comScore for the second
consecutive year on what elements of the online shopping customer experience drive brand preference,
customer loyalty, and recommendations. Once again, the UPS Pulse of the Online Shopper study goes
beyond topics covered by other studies, which tend to focus on purchase or web usability, and provides
insights from pre-purchase to check-out to post-purchase.
In addition to covering the entire online shopping experience, this year’s study has been expanded to
delve deeper into how mobile and social are shaping the online shopping experience. It explores what
today’s demanding consumers expect from retailers seeking to provide an integrated omnichannel
shopping experience.
Topics addressed in the 2013 study include the following:
What do consumers want in an online shopping experience?
How are mobile and social media channels changing consumers' shopping habits and
expectations?
What do consumers want from retailers in the online check-out and delivery experience?
How important are returns in the overall online shopping experience?
How is omnichannel retailing changing consumer purchasing and returns expectations?
What drives repeat customers and retailer recommendations?
$42 $53 $67 $82 $102
$123 $130 $130 $142 $162
$186
2002 2003 2004 2005 2006 2007 2008 2009 2010 2011 2012
Figure 1: U.S. Retail e-Commerce Sales Growth ($B)
Source: comScore e-Commerce Measurement
+26%
+26% +22%
+24% +20%
+6% 0%
+9% +14%
+15% In 2012, retail e-Commerce
spending in the U.S. surged 15% to reach $186 billion, its second
consecutive year of growth in the mid-teens. To put that growth
rate in perspective, it was seven times greater than the
corresponding growth rate for total U.S. retail spending. In the fourth quarter last year, retail e-Commerce reached 10% of all discretionary spending for the
first time ever.

© 2013 United Parcel Service of America, Inc. 4
Methodology
The study analyzes data from a survey of more than 3,000 U.S. online shoppers conducted in February
2013. These results are compared to results of a similar survey of 3,100 U.S. online shoppers conducted
in February 2012. All shoppers surveyed had to meet the criteria of making at least two online purchases
in a typical 3-month period. Among those surveyed, 41% indicated they made 2-3 online purchases, 33%
made 4-6 purchases, and 27% made 7 or more purchases (Figure 2).
In addition, an online focus group was held on January 8, 2013 to gain supplemental qualitative insight
about the customer experience. Participants met in a virtual online forum where they were asked about a
series of topics related to online shopping and logistics, including shipping and returns preferences. This
forum allowed participants to respond to online discussion questions as well as other participants’
comments throughout the course of the focus group.
Through the quantitative and qualitative research contained in this study, retailers will gain essential new
insights into today’s omnichannel shopper and how to keep pace with consumers’ constantly evolving
expectations.
Key Findings
This study contains detailed insights for retailers on improving the customer experience from pre-
purchase through delivery and returns. Some high-level insights and takeaways include the following:
• Shoppers Want an Improved Post-Purchase Experience
While overall online shopping satisfaction is high, there is room for improvement in the post-
purchase experience area – a key area for driving repeat customers and brand loyalty. Areas for
improvement include: flexibility of shipping options; flexibility to choose delivery date and re-route
packages; and the ability to pick up orders at convenient locations such as retail stores.
2-3 Purchases 41%
4-6 Purchases 33%
7+ Purchases 27%
Figure 2: Respondents (n=3,043)

© 2013 United Parcel Service of America, Inc. 5
• Retailers Should Communicate Clear Expectations on Package Delivery Timing
Communicating early regarding package delivery and executing on the promise of delivery once
communicated leads to advocacy for the retailer. When retailers communicate the expected
delivery date of the order, customers are surprisingly patient and are willing to wait an average of
a week for their orders. Timely arrival of shipments encourages shoppers to recommend an
online retailer. Package tracking services are considered either “essential” or “nice to have” by
almost all consumers.
• Improved Returns Process Offers Opportunity for Retailer Differentiation
Returns continue to be an area of low satisfaction for online shoppers, even as the volume of
returns increases. The number of people that have returned a package in 2013 has grown from
2012 – as has the number of consumers that view a retailer’s returns policy before or after
purchase. Our study findings unveil consumers’ specific returns policy preferences as well as the
overall importance of returns in the online customer experience, including where returns rank on
the list of factors driving retailer recommendations.
• Integrated Omnichannel Experience Drives Value for Consumers
Retailers must keep pace with the rapid adoption of mobile and tailor their offerings to an
increasingly mobile consumer – while extending the shopping experience across channels. Most
omnichannel shoppers prefer online methods of access to retailers, but they are also looking for a
seamless cross-channel experience. Key elements of that experience include: the ability to shop
online and return to a store; receipt of coupon offers via smartphone when consumers are in
close proximity to the store; and the ability to shop online and pick up in store. Online shoppers
are social. That is, they are highly likely to not only use social media platforms but actively
engage in seeking out updates and promotions for sites they follow.

© 2013 United Parcel Service of America, Inc. 6
The State of Online Shopping Satisfaction
Consumer satisfaction with online shopping overall is high at 83% (those survey respondents selecting
the top 2 boxes on a 7-point scale, Figure 3). The dynamics of online shopping with which respondents
are most satisfied are those related to the retailer website – product variety and ease of use. Online
shoppers are least satisfied with control and flexibility in receiving their purchases, which is shown across
four of five lowest-rated elements. Shoppers want the ability to control where they receive their package
and when, and they also want the option to re-route their package after it has shipped. A
green/environmentally friendly shipping option is the area where shoppers are the least satisfied.
43%
44%
44%
49%
55%
55%
58%
61%
62%
68%
69%
69%
71%
73%
76%
80%
81%
83%
A green/environmentally friendly shipping option
Flexibility to re-route packages
Ability to choose a specified time of day for delivery
Flexibility to choose my delivery date
Ability to pick up at a retail location that is convenient
Ability to purchase through a smartphone application
Ability to contact a live customer service rep
Ability to purchase through a tablet application
Ease of making returns/ exchanges
Clear & easy to understand return policy
Ability to create an account
Availability of free or discounted shipping
The number of payment options available
The number of shipping options offered
The ability to track online purchases while in transit
Variety of brands and products offered
Ease of check-out
Overall Satisfaction
Figure 3: Satisfaction With Aspects of Online Shopping 7-point scale (n=3,043), Top 2 Box
Shoppers appear to want more control over their delivery experience.
Q10. Overall, how satisfied are you with your previous online purchasing experiences in the past three months? Q11. Based upon your previous experience, how satisfied are you with each of the following aspects of online purchasing?

© 2013 United Parcel Service of America, Inc. 7
Understanding which elements are important for consumers will help retailers seeking to improve their
shoppers’ satisfaction and increase loyalty. To better understand which elements drive satisfaction, a
quadrant analysis was performed, plotting the “derived” importance of each factor versus the satisfaction
rating. Derived importance was calculated using statistical modeling techniques and indicates which
attributes of the online shopping experience examined in this study were better predictors of overall online
satisfaction versus others. Higher derived importance indicates that the attribute has a stronger impact
on overall satisfaction versus attributes of lower importance. To hone in on factors that will drive a high
level of satisfaction, the quadrant analysis below is plotted using “top box” satisfaction (those survey
respondents selecting the top box on a 7-point scale, Figure 4).
Items in the upper-right quadrant – product variety, ease of checkout, and online tracking – are those
with both high importance and high satisfaction, making them particularly crucial elements for retailers to
deliver in order to maintain high levels of satisfaction.
The upper left quadrant of the chart contains the factors driving satisfaction that are highly important but
currently have low satisfaction. In this study, three factors fall into this quadrant: shipping options offered,
ability to create an account, and a clear and easy to understand returns policy. These should be key
areas of focus for retailers looking to increase their overall customer satisfaction.
The factors in the bottom half of the chart are of lower “derived” importance in driving overall online
shopping satisfaction. While frequently cited by consumers as a must-have, free or discounted shipping is
actually less important in driving overall satisfaction than those factors stated above, including shipping
options and a clear and easy to understand returns policy. While free or discounted shipping is always
rated highly, its low “derived” importance could be explained by the fact that free shipping is no longer a
differentiator, but is often an expectation. Plus, consumers will typically indicate on a survey that they
want something for free.
Figure 4: Quadrant Analysis: Attributes (Top Box Satisfaction)

© 2013 United Parcel Service of America, Inc. 8
Factors Driving Retailer Recommendations
In addition to retaining satisfied customers and acquiring uncommitted potential customers, another way
retailers can increase their business is through customer advocacy and referral. When asked what has
led to a shopper recommending a particular retailer, the availability of free shipping or discounted
shipping was cited as the top factor, followed by timely arrival of shipments, and free or easy returns
(Figure 5). While cost savings is perhaps a predictable factor in retailer referral, the other leading factors
are less obvious. Retailers should take note that not only do consumers value timely delivery and
seamless returns, but they are willing to advocate on their behalf should they meet customers’
expectations in this regard.
On the other hand, certain factors can drive a poor customer experience that leads to negative word-of-
mouth. The top such factor was shipping costs being too high based on the product price (59%, Figure 6).
Other important factors include shipping costs being too high based on the expected delivery date (45%),
products arriving damaged (43%), and delivery taking longer than promised (40%).
23%
27%
28%
29%
41%
65%
25%
29%
34%
34%
47%
68%
Fast credits/refunds if I return products
Tracking Services
Easy returns and exchanges
Free returns
Receiving my product when expected
Free shipping
Figure 5: Drivers of Positive Recommendations
2013 (n=3,043) 2012 (n=3,128)
More than 90% of respondents have recommended an online retailer to
others.
Q17. Assuming you are happy with the product you purchased, what service features have actually led you to recommend an online retailer? Select all that apply.

© 2013 United Parcel Service of America, Inc. 9
Valued Options for Omnichannel Shoppers
When examining aspects driving likelihood to shop with a retailer, shoppers demonstrated a distinct
preference for retailers who deliver an integrated omnichannel experience – both in terms of online/in-
store working together and availability of mobile shopping features. The single most important factor,
cited by 62% of respondents, was the ability to buy online and make returns in-store, while the third most
important factor was availability of in-store pickup (Figure 7).
24%
27%
29%
31%
31%
34%
35%
37%
40%
43%
45%
59%
Check-out process was way too long
Difficulty getting package because I am not home to sign for it
Dealing with the retailer on returns was too cumbersome
Could not find a phone number to contact customer service
Unreliable shipping made it hard to anticipate delivery dates
Getting a refund/credit took too long
Bombarded with e-mail offers I didn’t want
I could not get a refund, only credits
The delivery took longer than I was told
Products arrived damaged due to shipping/ packaging
Shipping costs were too high based on expected delivery date
Shipping costs too high based on product price
Figure 6: Drivers of Negative Recommendations (n=3,043)
18%
23%
25%
36%
37%
40%
41%
44%
47%
62%
The ability to make an appointment for an in-store consult after researching online
The ability to start a purchase online and then complete the purchase in store or via
The availability of an in-store kiosk to browse products
The availability of a mobile application for a smartphone
The ability to complete a purchase in store using mobile device
The option to conduct one-click check-out online
The availability of an application designed specifically for a tablet
The ability to buy online and pickup in store
The push of a coupon/promotion to my smartphone
The ability to buy online and then make returns at the store
Figure 7: Aspects Driving Likelihood to Shop with a Retailer 7-point scale (n=3,043), Top 2 Box
Q19. What experiences (not including price or the product itself) would most likely lead to a negative recommendation to friends/family?
NEWQ_OC3. On a scale of 1 to 7, how likely would you be to shop with a retailer if the following were made available to you?
Shoppers who use location-
based social/deal services are much more interested in
an integrated omnichannel experience.

© 2013 United Parcel Service of America, Inc. 10
On the mobile side of the equation, 47% of smartphone owners said they were likely to shop with a
retailer who provides location-enabled coupons or promotions to their smartphone, while 41% of tablet
owners said the availability of a tablet app increased their likelihood to shop with a retailer (Figure 7).
Further emphasizing the desire for an integrated omnichannel experience, more than one-third of
shoppers want to be able to purchase in store with their mobile device and want a mobile application for
their smartphone (Figure 7).
“Ship to store” services tend to be viewed by consumers as a means to avoid shipping costs, while
leading to incremental sales gains for retailers. 51% of all online shoppers have selected “ship to store”
and more than one-third (38%) of those said they have purchased other items while in the store,
highlighting an incremental sales opportunity for retailers with the availability of this option (Figure 8).
38% 37%
25%
21%
17% 14%
12%
I choose ship to store to
qualify for free shipping
Convenient if the retailer has a store nearby
Inconvenient - I shop online
because it means I don’t
have to go to a store
Convenient for some items
but not for others
Not important
to me
It decreases convenience,
but I like having the
option
Neither convenient nor inconvenient
since shopping for best price/ deals is my #1
priority
Figure 8: Attitudes Toward “Ship to Store” Service (n=1,494)
51% of online shoppers have selected “ship to store” on a past purchase. Of these, 38% have purchased other items while in the store for pickup.
NEWQ_OC4. When purchasing online, have you ever chosen to "ship to store" for pickup? NEWQ_OC4B. When you selected “ship to store” in the past when purchasing online and then actually picked up the item, typically did you end up purchasing more items while you were there for the pickup? Q48. Of the choices below, which do you find best match your attitude toward buying online and picking up at a store? Please select top 2 choices only.

© 2013 United Parcel Service of America, Inc. 11
Mobile: The Next Frontier for Digital Commerce
The past year saw mobile media consumption grow exponentially as smartphone adoption surged nearly
30% to more than 130 million owners, while tablets emerged as one of the fastest selling devices in
history to reach nearly 50 million owners. Tablets have already achieved a level of adoption in three years
that it took smartphones nearly a decade to reach from when they were originally introduced.
While smartphones are becoming disruptive to the traditional retail environment through showrooming,
tablets are changing shopping behaviors in somewhat different ways. Because their functionality more
closely resembles that of computers, tablets are not influencing the in-store shopping experience as much
as they are driving in-home shopping behavior. In fact, tablet users were significantly more likely than
smartphone owners to engage in various shopping behaviors, such as researching product features and
comparing prices. Perhaps most importantly, tablet users were twice as likely to purchase items on their
devices (38%) than smartphone owners (19%), according to comScore MobiLens, US, December 2012.
Mobile Playing a Significant Role
Of the shoppers surveyed, 59% had a smartphone and 40% owned a tablet. Among those who own a
tablet, 59% make purchases on the tablet in a typical three month period compared to 49% of
smartphone owners. Seven percent of the shoppers surveyed are the commerce equivalent of “cord-
cutters”; all of their digital purchases occur via mobile devices and none on PCs.
Also noteworthy is that nearly 7 in 10 online shoppers prefer to access multi-channel retailers via digital
channels. Of those who shop on a mobile device, 30% prefer to access their favorite retailer via
smartphone or tablet (Figure 9). Half of the online shoppers surveyed who use a smartphone (59%) make
purchases on a smartphone in a typical three-month period, and nearly 60% of online shoppers surveyed
who use a tablet do so on a tablet. Given the relatively high buying penetration within these channels –
particularly as adoption of devices continues to increase – it has never been more important for retailers
to ensure they are at the forefront of mobile commerce strategies.
NEWQ_OC1. Thinking of your favorite retailer that has physical stores and an online presence (website/app), how do you prefer to access them? Please select your preferred method.
Figure 9: Retailer Access Preference
7 out of 10 Prefer to Shop with Their Favorite Retailer
Online – And Mobile/Tablet
Users Are Less Likely to Prefer In-
Store Shopping

© 2013 United Parcel Service of America, Inc. 12
Mobile Shopping Habits
One area of opportunity for retailers is to improve the shopping experience on smartphones. Among
heavy shoppers, satisfaction is high for both computers (86%) and tablets (92%) but is markedly lower for
smartphones (66%, Figure 10). While some of this lower satisfaction may be unavoidable due to
smartphones’ smaller screen size, there are methods of optimizing the experience for the smartphone
that can add value for mobile consumers.
In particular, it is extremely important for retailers to have a user-friendly app. Nearly half of consumers
using a retailer’s mobile app are less likely to comparison shop when using an app versus a browser
(Figure 11). This finding underscores the importance of having an engaging mobile app.
1% 14%
33% 8%
86% 66% 92%
Computer (n=764) Smartphone (n=49) Tablet (n=83)
Figure 10: Satisfaction by Device (Among Heavy Shoppers)
Top 2 Neutral Bottom 2
42%
23% 23% 12%
Yes - leave app to comparison shop
Not as frequently as I do when I shop within a web
browser
No - don't leave app to comparison shop
I only use browsers
Figure 11: App-Based Mobile Comparison Shopping (n=782)
46% of shoppers say they are less likely to comparison shop when using a mobile app.
Q10. Overall, how satisfied are you with your previous online purchasing experiences in the past three months?
NEWQ_MOB1. When you shop within a retailer’s mobile app, do you leave that app to comparison shop across other retailers?

© 2013 United Parcel Service of America, Inc. 13
In addition, a mobile app allows retailers to provide deals and promotions according to the user’s location.
Of the nearly 50% of shoppers who use location-based deals services (Figure 12), 60% would like to
receive deals and promotions based on their location and/or transaction history (Figure 13).
Improving apps, particularly in terms of facilitating the browsing and transaction processes, can help
retailers reduce friction and improve mobile conversion. With the inclusion of value-added features that
leverage what’s unique about the mobile medium – namely location-enabled services – retailers can
significantly enhance their customers’ mobile experience.
35%
22%
14%
11%
8%
Groupon
LivingSocial
Facebook Check-In
Yelp!
Foursquare
Figure 12: Use of Location- Based Social/Deal Services
(n=3,043)
60%
8%
31%
Figure 13: Interest in Having Deals/ Promos
Sent by Retailer (Using Location & Transaction
History) (n=1,300)
I would like this
I would neither like nor dislike this
I would dislike this
SM6. Do you use any of the following location-based social/deal services? Please select all that apply. SM7. You indicated having used a location-based social/deal service. How would you feel if your retailer were to use your location and/or transaction history to serve you relevant deals and promotions suited to your interests?
49% of respondents use a location-based social/deal service.

© 2013 United Parcel Service of America, Inc. 14
Social Commerce
Usage of social networking sites continues to be led by Facebook, which accounted for 5 out of every 6
minutes spent in the social networking category in 2012. While Facebook, Twitter and LinkedIn remain
the established leaders in the social networking space, 2012 saw several sites competing for an
increasing amount of attention, establishing themselves as notable players in the market drawing tens of
millions of visitors each month. Tumblr, Pinterest and Instagram each gained more than 10 million
visitors over the course of the year, in part by catering to a desire for more visually appealing content in a
trend that comScore calls “the rise of the visual web.”
Each of these social networks has either demonstrated a strong connection to the broader social
commerce trend or has significant potential in this regard. Facebook is already a well-established touch
point for many brands through their fan pages, while Twitter is also widely used as consumers follow their
favorite retailers. Meanwhile, LinkedIn users have the highest propensity to buy online among these
social networks, spending an average of 135% more than the average internet user (comScore Media
Metrix, U.S., February 2013). And the three players in the “visual web” space are all paving the way
towards a new brand of social commerce, particularly Pinterest and its orientation towards sharing
visually-engaging retail products.
Social Media Drives Retailer Engagement
The social media component of the survey revealed certain insights about how and why consumers
engage with retail brands on the various channels. Of the shoppers surveyed, 84% indicated using at
least one social media site. Facebook ranks as the most popular by a considerable margin, followed by
Twitter, LinkedIn and Pinterest (Figure 14).
77%
26% 22%
18% 17% 10%
Facebook Twitter LinkedIn Pinterest Google+ MySpace
Figure 14: Use of Social Media Sites (n=3,043)
SM1. Do you use any of the following social networking sites? Please select all that apply. SM2. Do you `Like` any retailers on Facebook?
40% of consumers use only 1 social media site, while 33% use 2-3.

© 2013 United Parcel Service of America, Inc. 15
Two-thirds of Facebook users said that they “like” a brand on the site, with two-thirds of those users
saying they have done so to receive a promotion or incentive from that brand (Figure 15). Among those
who “like” a brand on Facebook, 86% said they pay attention to retailers’ updates (Figure 16). This finding
highlights the importance of Facebook as a marketing channel for retailers given its combination of
audience reach and engagement with promotional content.
25%
32%
36%
47%
60%
I like to actively voice my opinion to the brand on
I am a fan of all (or most) brands that I am associated with
I find it’s an easy way to stay up to date with a
retailer
The retailer incentivized me to “Like” its Facebook
page/application
The retailer occasionally offers special promotions
for its Facebook fans
Figure 15: Reasons for “Liking” a Retailer/ Brand
on Facebook (n=1,493)
6%
8%
34%
52%
I don’t even notice updates
I don’t pay attention to updates (i.e.,
I skip over updates)
I pay a lot of attention (i.e., I read the update as if it were from one
of my friends)
I pay a little attention to updates (i.e., I briefly skim for information)
Figure 16: Amount of Attention Paid to
Retailer’s Updates (n=1,493)
SM3. Why did you decide to “Like” a retailer/ brand on Facebook? Please select all that apply. SM4. When you see updates from the retailer on your Facebook newsfeed, how much attention do you generally devote to the update?
86% pay some attention to
retailers’ updates, giving
retailers a channel for
engagement.

© 2013 United Parcel Service of America, Inc. 16
Check-Out Process
Study results also highlight the importance of the check-out process for retailers. While all retailers seek
to maximize conversion, the different drivers behind shopping cart and check-out behaviors are not
always widely understood.
Factors Driving Cart Abandonment
With 88% of online shoppers indicating that they have placed items in the shopping cart and left the site
without making a purchase, clearly shopping cart abandonment is a significant issue that represents lost
opportunity for retailers. Not only is the issue a large one, but it is also growing – up 7 percentage points
compared to last year’s survey.
Among those who have abandoned their shopping carts, shipping cost was the most oft-cited reason
among 54% of these respondents (Figure 17). On the other hand, more than three-quarters of online
shoppers said they have added items to their shopping cart in order to qualify for free shipping,
suggesting that retailers minimum spending thresholds for free shipping are effective at inducing
consumers to spend more.
19%
20%
20%
21%
34%
44%
49%
50%
54%
I wanted to complete the purchase, but got distracted and forgot
I didn't want to register/ create account just to make a purchase
The checkout process was too long and confusing
The pages on the site were loading too slowly
Shipping and handling costs were listed too late during the check-out process
My order value wasn't large enough to qualify for free shipping
I was not ready to purchase, but wanted to save the cart for later
I was not ready to purchase, but wanted to get an idea of the total cost with shipping for comparison
Shipping costs made the total purchase cost more than expected
Figure 17: Abandonment of Cart (n=2,713)
Key takeaway: 76% of Online Shoppers Have Added Items to Their Cart to Qualify for Free Shipping.
In 2013, 88% of online shoppers say they have abandoned a cart vs. 81% in 2012
Q24. When shopping online, have you ever placed items in the online cart or basket but then left the site without making a purchase? Q25. What are some of the reasons that you have abandoned a shopping cart with items you’ve added for purchase?
© 2013 United Parcel Service of America, Inc. 17
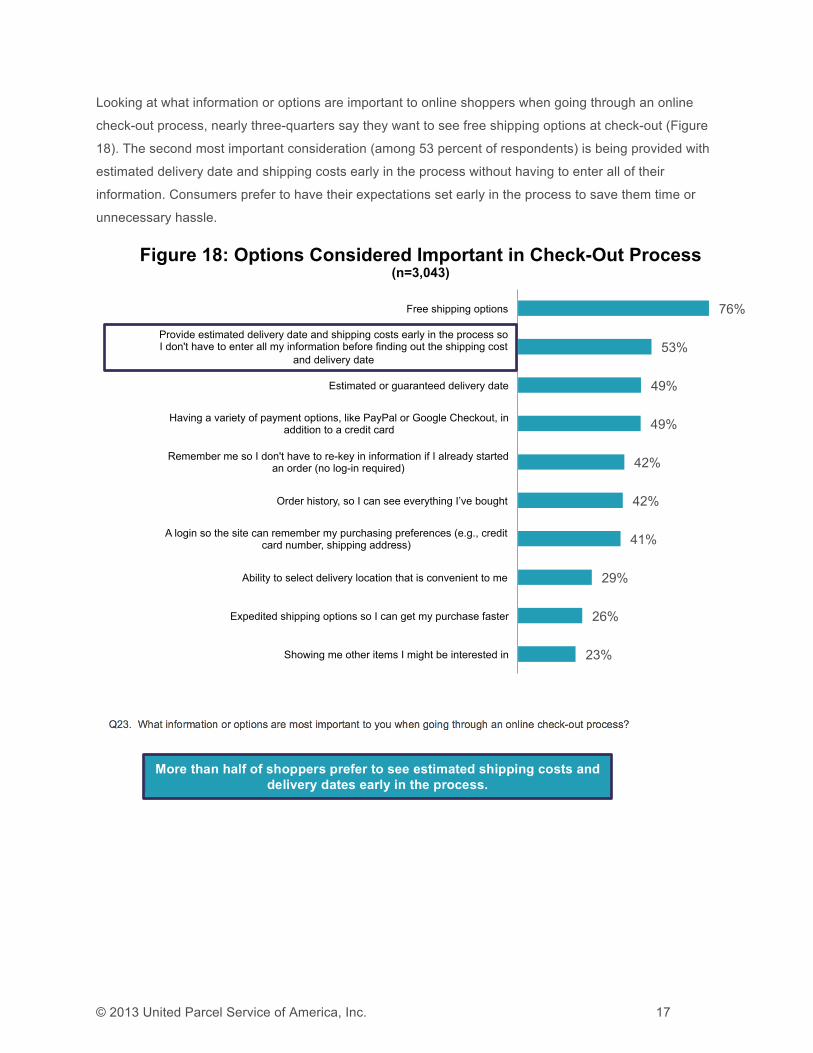
Looking at what information or options are important to online shoppers when going through an online
check-out process, nearly three-quarters say they want to see free shipping options at check-out (Figure
18). The second most important consideration (among 53 percent of respondents) is being provided with
estimated delivery date and shipping costs early in the process without having to enter all of their
information. Consumers prefer to have their expectations set early in the process to save them time or
unnecessary hassle.
23%
26%
29%
41%
42%
42%
49%
49%
53%
76%
Showing me other items I might be interested in
Expedited shipping options so I can get my purchase faster
Ability to select delivery location that is convenient to me
A login so the site can remember my purchasing preferences (e.g., credit card number, shipping address)
Order history, so I can see everything I’ve bought
Remember me so I don't have to re-key in information if I already started an order (no log-in required)
Having a variety of payment options, like PayPal or Google Checkout, in addition to a credit card
Estimated or guaranteed delivery date
Provide estimated delivery date and shipping costs early in the process so I don't have to enter all my information before finding out the shipping cost
and delivery date
Free shipping options
Figure 18: Options Considered Important in Check-Out Process (n=3,043)
Q23. What information or options are most important to you when going through an online check-out process?
More than half of shoppers prefer to see estimated shipping costs and delivery dates early in the process.
© 2013 United Parcel Service of America, Inc. 18
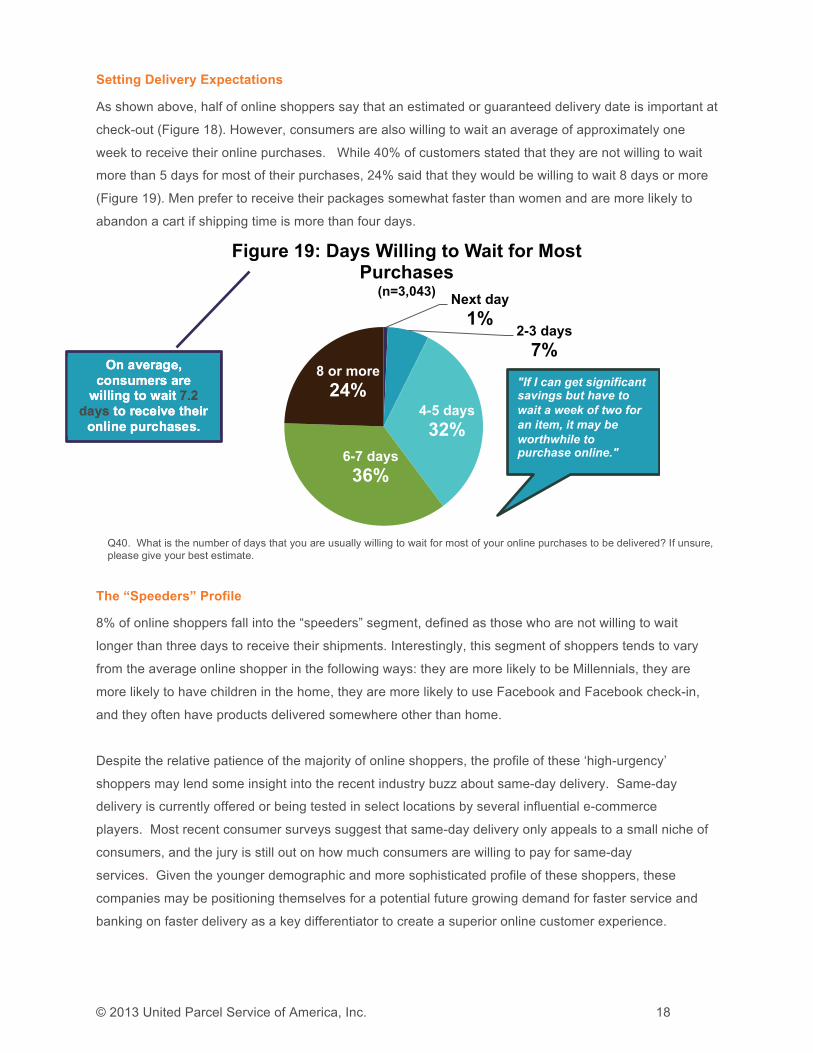
Setting Delivery Expectations
As shown above, half of online shoppers say that an estimated or guaranteed delivery date is important at
check-out (Figure 18). However, consumers are also willing to wait an average of approximately one
week to receive their online purchases. While 40% of customers stated that they are not willing to wait
more than 5 days for most of their purchases, 24% said that they would be willing to wait 8 days or more
(Figure 19). Men prefer to receive their packages somewhat faster than women and are more likely to
abandon a cart if shipping time is more than four days.
The “Speeders” Profile
8% of online shoppers fall into the “speeders” segment, defined as those who are not willing to wait
longer than three days to receive their shipments. Interestingly, this segment of shoppers tends to vary
from the average online shopper in the following ways: they are more likely to be Millennials, they are
more likely to have children in the home, they are more likely to use Facebook and Facebook check-in,
and they often have products delivered somewhere other than home.
Despite the relative patience of the majority of online shoppers, the profile of these ‘high-urgency’
shoppers may lend some insight into the recent industry buzz about same-day delivery. Same-day
delivery is currently offered or being tested in select locations by several influential e-commerce
players. Most recent consumer surveys suggest that same-day delivery only appeals to a small niche of
consumers, and the jury is still out on how much consumers are willing to pay for same-day
services. Given the younger demographic and more sophisticated profile of these shoppers, these
companies may be positioning themselves for a potential future growing demand for faster service and
banking on faster delivery as a key differentiator to create a superior online customer experience.
Next day
1% 2-3 days
7%
4-5 days
32%
6-7 days
36%
8 or more
24%
Figure 19: Days Willing to Wait for Most Purchases
(n=3,043)
"If I can get significant savings but have to wait a week of two for an item, it may be worthwhile to purchase online."
On average, consumers are
willing to wait 7.2 days to receive their
online purchases.
Q40. What is the number of days that you are usually willing to wait for most of your online purchases to be delivered? If unsure, please give your best estimate.

© 2013 United Parcel Service of America, Inc. 19
Delivery Dates Can Drive Cart Abandonment
Forty-four percent of online shoppers indicated that they have
abandoned their shopping cart due to the estimated delivery
date (Figure 20). Of online shoppers that have abandoned their
cart due to estimated delivery time, 21% indicated that no
estimated delivery was shown. With many purchases having
some time consideration – even if that timing is not urgent – such cart abandonment is understandable.
Consumers prefer certainty to uncertainty.
Among those who were shown an estimated delivery date and abandoned their cart, two-thirds of the
time the estimated delivery time was 8 days or more (Figure 20). So while there is some overall tolerance
for longer delivery times, in a competitive shopping environment consumers may seek alternatives when
the delivery time is not satisfactory.
Many shoppers exhibited a willingness to make the trade-off of time savings for cost savings. Specifically,
those consumers who value free shipping are significantly more tolerant of longer shipping periods than
those who do not value free shipping as strongly. Among those who value free shipping most, only 15%
abandoned a cart because of an estimated delivery time of seven days or less. Compare that to 29% for
the rest of the online shopper population.
<=3 days, 3%
4 days, 2%
5 days 10% 6 days, 1%
7 days 10%
>=8 days 53%
No date provided
21%
Figure 20: Length of Time Resulting in Abandonment
(n=1,273)
44% of shoppers have abandoned a cart due to
delivery time. (n=3,043)
Key Takeaway: 21% of shoppers who abandoned their cart due to delivery time did so because no
estimated delivery date was provided.
Q41. Have you ever decided not to make a purchase because the estimated time when you would receive your item(s) was too long or not provided? Q42. What was the estimated delivery time from purchase (in days) that caused you not to make your purchase?

© 2013 United Parcel Service of America, Inc. 20
The Delivery Experience
Shipping and delivery are key value drivers in the online shopping experience, with consumers preferring
different options to meet those needs. Online shoppers expect several delivery options to be available,
with two-thirds expecting both economy ground and ground, and more than half a 2- or 3-day air option
(Figure 21). Nearly half (46%) also expect a next-day shipping option. Online shoppers stated they chose
the most economical shipping option more than three-quarters of the time, and the fastest option only 1%
of the time. More than 20% of online shoppers say they “most often” choose to pay an additional fee for
faster delivery when making a purchase.
87%
67%
58%
46%
78%
16% 5% 1%
Economy ground (5-7 day time in transit)
Ground (3-5 day time in transit for
an additional fee)
2- or 3-day air (for an additional fee)
Next-day air (for an additional fee)
Figure 21: Shipping Options – Expected vs. Selected (n=3,043)
Expected Most often selected
Consumers for whom computers, mobile devices and gaming devices are among the most frequently purchased categories are most likely to select 2-. 3- or Next-Day Air.
Q38. When shopping online, which of the following shipping options do you expect online retailers to offer? Choose all that apply. Q39. When shopping online, which shipping option do you choose most often?

© 2013 United Parcel Service of America, Inc. 21
Package Tracking an Important Feature
As illustrated in the quadrant analysis (Figure 4), the ability to track packages is an important factor in
online shopping satisfaction, with half of online shoppers indicating that tracking is an essential service
(Figure 22). The most important tracking-related services for shoppers were e-mail notifications with a link
to track and the ability to track directly on the retailer’s site (Figure 23).
However, mobile is also emerging to play an important role in shipment tracking. Consumers also indicate
a desire for text notifications with their tracking number, text alerts when their package will be/has been
delivered, and the ability to track their shipment on their mobile device.
It's not important 3%
It's nice to have 47%
It's essential 50%
Figure 22: Relevance of Tracking Services (n=3,043)
18%
28%
29%
30%
32%
40%
52%
54%
63%
71%
Tracking is not essential to give me a great customer experience
Text message telling me my package was delivered
A text message alerting me my shipment will be delivered the following day
The ability to track my shipment with my mobile device
Text notification with a tracking number that I can click on to get the status of my shipment
An easy-to-find customer service number I can call to ask “where is my package”
Email message telling me my package was delivered
Email message alerting me my shipment will be delivered the following day
The ability to track my shipment directly on the retailer’s website
E-mail notifications with a tracking number that I can click on to get the status of my shipment
Figure 23: Most Important Tracking Services (n=3,043)

© 2013 United Parcel Service of America, Inc. 22
33% 38%
30% 28%
20% 20%
17% 14%
2012 (n=3,128) 2013 (n=3,043)
Figure 25: Review of Retailers’ Returns Policies
Not at all
After, if I need to return an item
Both Before and After
Before I purchase an item
Returns and Exchanges
Returns play an even larger role for online retailers because online shoppers want to lower risk for goods
purchased without the opportunity to see, touch, or feel them. While returns and exchanges represent
the last phase of the consumers’ purchase process, it is often their first consideration when visiting a new
retailer site. Two-thirds of customers say they look for the return policy prior to making a purchase online,
suggesting that retailers risk losing customers without an easy-to-find policy on their website (Figure 25).
Evidence also suggests that returns are becoming a more important part of
the online shopping experience. Nearly two-thirds (62%) of online shoppers
said they have returned a product purchased online, up 11 percentage
points in the past year alone (Figure 24). The increase in return activity is
likely due to many retailers making the process easier – and in some cases
cheaper -- for their customers.
51%
62%
2012 (n=3,128)
2013 (n=3,043)
Figure 24: Have Returned
an Online Purchase
Q55. Have you ever returned a product you purchased online for a refund or exchange? Q56. Do you look for an online retailer’s returns policy before or after purchasing an item? A box around a score indicates statistical significance at the 95% confidence level.
Key Takeaway: 62% of online shoppers
have returned a product purchased
online.

© 2013 United Parcel Service of America, Inc. 23
Hassle-Free Returns Drive Recommendations
A hassle-free returns policy is likely to lead to recommendations and repeat business from online
shoppers. It also means that consumers will shop more frequently (67%) with a particular retailer, and
advocate for that retailer (64%, Figure 26). In addition, 74% of online shoppers said that a hassle-free
returns policy would influence their decision to buy from a retailer from which they are shopping for the
first time.
Consumers prefer a returns policy that allows them to return the purchase to the store for free or ship it
back to the retailer for free. If both of those options are not available, consumers would prefer free
shipping back to the retailer over returning to the store. Consumers are least likely to make a purchase if
they have to pay a restocking fee, even if the return shipping is free (Figure 27).
36%
48%
64%
67%
Focus less on prices and more on their quality of service
Drop another retailer with a less easy returns process
Recommend the retailer to a friend
Shop more with that retailer
Figure 26: If an online retailer offers a hassle-free returns policy, I will 3-point scale – Top Box Agreement
Q56a. You indicated that you look at an online retailer’s return policy before purchasing an item. Thinking of what you look for in a retailer’s returns policy, would you complete the sale online if the retailer’s “returns policy” stated the following?
Q59. How much do you agree with the following statements? Having a hassle-free returns policy impacts my decision to make an online purchase from Q60. How much do you agree with the following statements? If an online retailer offers a hassle-free returns policy, I will
34%
44%
65%
82%
33%
33%
22%
14%
32%
23%
12%
4%
You can return to the store for free OR ship it back to the retailer for free using a pre-paid shipping label provided by
the retailer, but you have to pay a restocking fee
You can return to the store for free OR you can ship it back to the retailer but you have to pay for the return shipping
You cannot return it to the store, but you can ship it back to the retailer for free using a pre-paid label provided by the
retailer
You can return to the store for free OR you can ship it back to the retailer for free using a pre-paid label provided by the
retailer
Figure 27: Return Policy Impact on Likelihood to Purchase
5-point Scale (n=2,058)
Likely to complete sale (Top 2 Box) Neutral (Middle Box) Unlikely to complete sale (Bottom 2 Box)

© 2013 United Parcel Service of America, Inc. 24
Elements of a Positive and Negative Returns Experience
A good returns experience is as important as a good returns policy. Online shoppers who have made
returns want free returns shipping, a “no questions asked” return policy, and the inclusion of a return label
in their original package or access to an easy-to-print label (Figure 28). An automatic refund is also very
important in ensuring a good returns experience.
Q58. Thinking of the best returns experience that you have had, what elements were included as a part of this experience? Select all that apply.
1%
19%
22%
24%
28%
33%
35%
39%
43%
47%
53%
58%
65%
Have not had a positive returns experience
Flexibility on how I could ship my return to the retailer
Convenience/ proximity of the physical store location
It was easy to get the package to the delivery company
Quick turnaround on product exchanges
Automatic refund to my debit/credit card as soon as I ship my item(s) back to the retailer
An easy-to-follow returns procedure with no forms or phone calls
Ability to return to a store
An easy-to-print returns label
Automatic refund to my debit/credit card once my item(s) is/are received back by the retailer
A return label right in the box of my original purchase
A “no questions asked” returns policy
Free returns shipping
Figure 28: Elements Included as Part of Best Returns Experience
(n=3,043)
“I don’t want to have to worry
about returns. It can be made
easier on smaller items if the retailer
has a printable prepaid label and
easy returns process that promises and
delivers on a quick refund /
exchange.”

© 2013 United Parcel Service of America, Inc. 25
What constitutes a bad returns experience for consumers, besides having to pay for return shipping, are
paying a restocking fee and waiting too long for a credit (Figure 29).
15%
16%
17%
21%
22%
25%
30%
35%
37%
60%
% 10% 20% 30% 40% 50% 60% 70%
I had to fill out a long form
I couldn’t find the retailer’s returns policy
The returns policy was hard to understand
I had trouble getting the returned item to the shipping company specified by the retailer
I couldn’t reach customer service for help
The returns policy was too restrictive
I could not return to a store
I had to pay a restocking fee
It took too long for me to receive credit/refund
I had to pay for return shipping
Figure 29: Issues Faced When Returning Online Purchases (n=1,827)
Q57. What are some of the issues you have faced when returning a product that you purchased online? Select all that apply and identify the top issue.

© 2013 United Parcel Service of America, Inc. 26
Conclusions
As today’s e-commerce spending increases, so do the expectations of online shoppers:
• Increased need for more convenience and control
• Increased desire for easy returns
• Increased demand for free shipping – and returns
• Increased call for social and mobile channels to work harder
• Increased desire for all retail channels to work together seamlessly
To deliver on what today’s online shoppers want, it’s crucial to understand the key factors that drive
consumers’ shopping habits, purchasing behaviors, brand loyalty and retailer recommendations.
Factors such as offering free and discounted shipping continue to be an important way to recruit, reward,
and retain shoppers – but these are not the only factors. Given the ubiquity of free shipping offers,
consumers have come to expect free shipping at least as an option or at a certain threshold. While free
shipping strategies are certainly worth a retailer’s time to test and see what combinations of promotions
will drive greater cart conversion, this survey also reveals that retailers may get a better return by
focusing on other areas of importance to differentiate themselves from their competitors.
Consumers want more information up-front, more options during check-out and delivery, and more
channels for interacting with their favorite retailers. Despite increasing expectations, consumers are also
willing to wait an average of a week to receive purchases. They are also willing to spend more with a
retailer to take advantage of free shipping offers and to expedite shipping of certain items on certain
occasions. Overall, consumers continue to value flexibility and control, with high expectations around not
only the number of options available during the pre-purchase process, but also in the delivery and returns
experience.
Cart abandonment is on the rise, often driven by higher than expected shipping costs, a desire to
understand total cost for comparison shopping, and order values not qualifying for free shipping.
Retailers can win shoppers over by:
• Following them wherever they are – social and mobile
• Facilitating a seamless cross-channel experience
• Providing information on delivery options and shipping costs with options that accommodate both
value seekers and “speeders”
• Providing tracking information with order and keeping shoppers informed proactively on delivery
status
• Delivering products when expected
• Enabling a “hassle-free” returns experience in the shopper’s channel of choice

© 2013 United Parcel Service of America, Inc. 27
About comScore, Inc.
comScore, Inc. (NASDAQ: SCOR) is a global leader in digital measurement and analytics, delivering
insights on web, mobile and TV consumer behavior that enable clients to maximize the value of their
digital investments. A preferred source of digital audience measurement, comScore offers a variety of on-
demand software and custom services within its four analytics pillars: Audience Analytics, Advertising
Analytics, Digital Business Analytics and Mobile Operator Analytics. By leveraging a world-class
technology infrastructure, the comScore Census Network™ (CCN) captures trillions of digital interactions
a month to power big data analytics on a global scale for its more than 2,000 clients, which include
leading companies such as AOL, Baidu, BBC, Best Buy, Carat, Deutsche Bank, ESPN, France Telecom,
Financial Times, Fox, LinkedIn, Microsoft, MediaCorp, Nestle, Starcom, Terra Networks, Universal
McCann, Verizon, ViaMichelin and Yahoo!. For more information, please visit www.comscore.com.
For more information, please contact:
Susan Engleson Melanie Alavi
comScore, Inc. UPS
703-234-2625 404-828-7374