acg round two.ppt - … file2 © 2009 m.w. partners. all rights reserved. confidential industry...
TRANSCRIPT

© 2009 M.W. Partners. All rights reserved. CONFIDENTIAL
Presentation to: ACG Equity Capital PartnersSaturday, February 21, 2009
Professional Style, LLC
W
WPartners

2CONFIDENTIAL© 2009 M.W. Partners. All rights reserved. CONFIDENTIAL
Industry Experience
W
WPartners
Contents
► Industry Experience
► Executive Summary
► Industry Overview
► Valuation Analysis
► Deal Structure► Comparison► Recommendation
Acquires Acquires Acquires Acquires
Rep(2007) Represented by M.W.
Partners(2005) Represented by M.W.
Partners(2005) Represented by
M.W. Partners(2007) Represented by
M.W. Partners
has been acquired by Acquires has been sold by has been sold by
(2007) Represented by M.W. Partners
(2005) Represented by M.W. Partners
(2008) Represented by M.W. Partners
(2004) Represented by M.W. Partners
3CONFIDENTIAL© 2009 M.W. Partners. All rights reserved.
Executive Summary
Valuation of Professional Style§ Valuation of Professional Style supports a purchase price range
of $17.3M - $20.9M
§ IRR potential to exceed ACG requirements on Professional Style transaction
§ Finance the transaction with a combination of debt and equity
Recommendation§ Recommend proceeding with indication of interest for Alpha
University
W
WPartners
Contents
► Industry Experience
► Executive Summary
► Industry Overview
► Valuation Analysis
► Deal Structure► Comparison► Recommendation

4CONFIDENTIAL© 2009 M.W. Partners. All rights reserved.
Industry Overview:Women’s Apparel & Accessories
[1] Source: Bureau of Labor Statistics as of January 2009[2] Source: Bureau of Economic Analysis as of January 2009 *Historic low Q4’07 – Q4’08[3] Source: Bureau of Economic Analysis as of January 2009
Economic factors
§ Unemployment 7.6% [1]
§ Consumer confidence 37.7% [2]
§ Per capita disposable income growth (1.16%)[3]
§ Personal consumption (3.38%)[3]
Economic activity will surpass 2008 levels by 2011Contents
► Industry Experience
► Executive Summary
► Industry Overview
► Valuation Analysis
► Deal Structure► Comparison► Recommendation

5CONFIDENTIAL© 2009 M.W. Partners. All rights reserved.
Industry Overview:Women’s Apparel & Accessories
Trends & Outlook§ M&A activity has
decreased sharply
§ Increased bankruptcy filings and liquidations in oversaturated retail market
§ Competition intense through 2013
[1] Source: Capital IQ. Note that of the 83 deals evaluated, 45 did not have a disclosed transaction value therefore this chart represents the 38 deals with disclosed deal value.
[1]
Doom & gloom or prime time?
§ E-Commerce platforms expected to reap rewards in rebound
Contents
► Industry Experience
► Executive Summary
► Industry Overview
► Valuation Analysis
► Deal Structure► Comparison► Recommendation

6CONFIDENTIAL© 2009 M.W. Partners. All rights reserved.
Industry Overview:Women’s Apparel & Accessories
Continuing Challenges & Risks
§ Increased shipping costs for consumers
§ Difficult to attract consumer segment – women 35+
§ Competition with department stores
§ Professional Style is weathering the storm
Contents
► Industry Experience
► Executive Summary
► Industry Overview
► Valuation Analysis
► Deal Structure► Comparison► Recommendation

7CONFIDENTIAL© 2009 M.W. Partners. All rights reserved.
Industry Overview:Professional Style: Poised for Success
Market Outperformers Professional Style
Plat
form Multi channel marketing:
Most important online>50% revenue from online
platform
Ops Lean inventory, strong cash flow
+ apparel and accessoriesContinued EBITDA growth + swimwear
Mar
keting §Private label brands
§Special Designers§Customer experience§Contemporary items gaining traction
§“The Fashion Studio”§ Guest designers§“Superior customer service”§ Increase contemporary by 2012
Supplie
rs LCC sourcing+ Top Importing Nation:China 31.5%
57% of imports are from China+ Expanding to Vietnam and Bangladesh
Contents
► Industry Experience
► Executive Summary
► Industry Overview
► Valuation Analysis
► Deal Structure► Comparison► Recommendation
8CONFIDENTIAL© 2009 M.W. Partners. All rights reserved.
Competitors
Contents
► Industry Experience
► Executive Summary
► Industry Overview
► Valuation Analysis
► Deal Structure► Comparison► Recommendation

9CONFIDENTIAL© 2009 M.W. Partners. All rights reserved.
Professional Style SWOT Analysis
Contents
► Industry Experience
► Executive Summary
► Industry Overview
► Valuation Analysis
► Deal Structure► Comparison► Recommendation

10CONFIDENTIAL© 2009 M.W. Partners. All rights reserved.
Valuation Approach
M.W. Partners takes a holistic approach to providing advice for our clients by understanding what your current and future financial growth expectations are.
Our model takes into consideration
§ Current market
§ Recent similar transactions
§ Present value of expected free cash flow
§ Potential borrowing capacity
§ Current lending markets
PrecedentTransactions
LeveragedBuyout
DiscountedCashFlow
Comparable Public
Companies
Contents
► Industry Experience
► Executive Summary
► Industry Overview
► Valuation Analysis
► Deal Structure► Comparison► Recommendation

11CONFIDENTIAL© 2009 M.W. Partners. All rights reserved.
Methodology
§ Eliminate discretionary management fee, maintaining cash in the business
§ Retail stores are closed and no new openings are recommended
§ Incremental restructuring costs associated with these closings
§ Call center is sold and outsourced
Unadjusted Valuation Adjusted Valuation
§ Historical data analyzed as presented
§ Forecast based on current Professional Style management projections
§ Considers management revenue projections
§ Provides guidance for initial bid projections
Contents
► Industry Experience
► Executive Summary
► Industry Overview
► Valuation Analysis
► Deal Structure► Comparison► Recommendation

12CONFIDENTIAL© 2009 M.W. Partners. All rights reserved.
Professional Style, LLCHistorical and Common-Size Income Statements
($ in millions)Fiscal Years Ended December 31,
2006 2007 2008 2006 2007 2008
Revenue 27.1$ 27.5$ 29.8$ 100.0% 100.0% 100.0%
Cost of Goods Sold 17.8 17.9 18.7 65.7% 65.1% 62.8%
Gross Margin 9.3 9.6 11.1 34.3% 34.9% 37.2%
Operating Expenses:General & Administrative 9.1 9.2 9.4 33.6% 33.5% 31.5%Depreciation and Amortization 0.3 0.3 0.3 1.1% 1.1% 1.0%
Total Operating Expenses 9.4 9.5 9.7 34.7% 34.5% 32.6%
Operating Income (0.1) 0.1 1.4 -0.4% 0.4% 4.7%
EBITDA 0.2$ 0.4$ 1.7$ 0.7% 1.5% 5.7%
Professional Style Financials
For full historical data refer to Exhibit 2
Adjusted EBITDA 0.8$ 1.0$ 2.5$ 3.1% 3.8% 8.4%
Contents
► Industry Experience
► Executive Summary
► Industry Overview
► Valuation Analysis
► Deal Structure► Comparison► Recommendation

13CONFIDENTIAL© 2009 M.W. Partners. All rights reserved.
Professional Style Adjusted Financials
For full analysis refer to Key Assumptions, Exhibit 3
Fiscal Years Ended December 31,2009 2010 2011 2012 2013
Revenue 30.8$ 32.9$ 35.4$ 38.9$ 43.8$
Adjusted Revenue 30.1$ 32.2$ 34.5$ 36.8$ 39.3$
Contents
► Industry Experience
► Executive Summary
► Industry Overview
► Valuation Analysis
► Deal Structure► Comparison► Recommendation

14CONFIDENTIAL© 2009 M.W. Partners. All rights reserved.
Professional Style, LLCAdjusted Projected Income Statements
($ in millions)Fiscal Years Ended December 31,
2009 2010 2011 2012 2013
Revenue (1) 30.1$ 32.2$ 34.5$ 36.8$ 39.3$
Gross Margin 12.9 13.4 14.5 16.6 18.7
Total Operating Expenses 9.8 10.0 10.1 10.6 13.5
Adjustments:Management Fees (2) (0.4) (0.4) (0.4) (0.4) (0.4) Discontinued Boutique Retail Stores (3) (0.3) (0.2) - - -
Restructuring Costs (4) 0.5 - - - - Call Center Sale (5) (0.4) - - - - Call Center Outsourcing (6) (0.2) (0.2) (0.2) (0.2) (0.2)
Adjusted Operating Expenses 9.0 9.2 9.5 10.0 12.9
Adjusted EBITDA 4.2$ 4.5$ 5.3$ 6.9$ 6.1$
Net Income 2.3$ 2.5$ 3.1$ 4.1$ 3.6$
Professional Style Adjusted Financials
For full adjusted financials and footnotes refer to Exhibit 4
Contents
► Industry Experience
► Executive Summary
► Industry Overview
► Valuation Analysis
► Deal Structure► Comparison► Recommendation

15CONFIDENTIAL© 2009 M.W. Partners. All rights reserved.
Discounted Cash Flow DiscountedCashFlow
Professional Style, LLCDiscounted Cash Flow Method
Unadjusted Value
($ in millions)
Present Value of Discrete Cash Flows2009 2010 2011 2012 2013
Net Income 2.0 2.2 3.0 4.3 4.6 (+) Depreciation & Amortization 0.3 0.3 0.3 0.3 0.3 (+) Interest Expense (net of taxes) 0.3 0.2 0.1 0.0 - (-) Capital Expenditures (0.5) (0.5) (0.1) (0.1) (0.1) (-) Change in Working Capital (0.8) (0.8) (0.8) (0.8) (0.8)
Free Cash Flow 1.3 1.5 2.5 3.8 4.0
Valuation SummaryTotal Present Value of Discrete Cash Flows 7.7 Present Value of Terminal Cash Flow 15.3
Unadjusted Value of Invested Capital 23.0$
For full discounted cash flow analysis refer to Exhibit 3
Contents
► Industry Experience
► Executive Summary
► Industry Overview
► Valuation Analysis
► Deal Structure► Comparison► Recommendation

16CONFIDENTIAL© 2009 M.W. Partners. All rights reserved.
Adjusted Discounted Cash Flow DiscountedCashFlow
Professional Style, LLCDiscounted Cash Flow Method
Adjusted Value
($ in millions)
Present Value of Discrete Cash Flows2009 2010 2011 2012 2013
Net Income 2.3 2.5 3.1 4.1 3.6 (+) Depreciation & Amortization 0.3 0.3 0.3 0.3 0.3 (+) Interest Expense (net of taxes) 0.3 0.2 0.1 0.0 - (-) Capital Expenditures (0.5) (0.5) (0.1) (0.1) (0.1) (-) Change in Working Capital (0.8) (0.8) (0.8) (0.8) (0.8)
Free Cash Flow 1.6 1.7 2.6 3.6 3.1
Valuation SummaryTotal Present Value of Discrete Cash Flows 7.7 Present Value of Terminal Cash Flow 11.5
Adjusted Value of Invested Capital 19.1$
For full discounted cash flow analysis refer to Exhibit 3
Contents
► Industry Experience
► Executive Summary
► Industry Overview
► Valuation Analysis
► Deal Structure► Comparison► Recommendation

17CONFIDENTIAL© 2009 M.W. Partners. All rights reserved.
Comparable Public Companies Comparable Public
Companies
Comparable guidance yields a TEV of $14M - $17M
Professional Style, LLCGuideline Publicly Traded Company Method
Valuation Summary
($ in millions)Professional Style, LLC Indicated Value
Fundamental Unadjusted Adjusted Unadjusted Adjusted
Latest 12 Months:EBITDA 1.7 2.5 13.6 20.0 Revenue 29.8 29.8 16.2 16.2
Indicated Value: 14.9 18.1 3-Year Average:
EBITDA 0.8 1.5 5.8 10.9 Revenue 28.1 28.1 19.5 19.5
Indicated Value: 12.6 15.2
Total Market Value: 14.2$ 17.2$
For full comparable analysis refer to Exhibit 7
Company Name RevenueAmerican Apparel 511 Coldwater Creek Inc 1,087 Delias Inc 288 Oxford Industries Inc 968 Urban Outfitters Inc 1,792
Contents
► Industry Experience
► Executive Summary
► Industry Overview
► Valuation Analysis
► Deal Structure► Comparison► Recommendation

18CONFIDENTIAL© 2009 M.W. Partners. All rights reserved.
Precedent Transactions
Reviewed precedent transactions, determined comparables, and eliminated outliers based on:
§ Timing (10 – 16)
§ Relevance in size and profitability
§ TEV guidance is $17.6M - $21.1M
PrecedentTransactions
Contents
► Industry Experience
► Executive Summary
► Industry Overview
► Valuation Analysis
► Deal Structure► Comparison► Recommendation
19CONFIDENTIAL© 2009 M.W. Partners. All rights reserved.
Leveraged Buyout
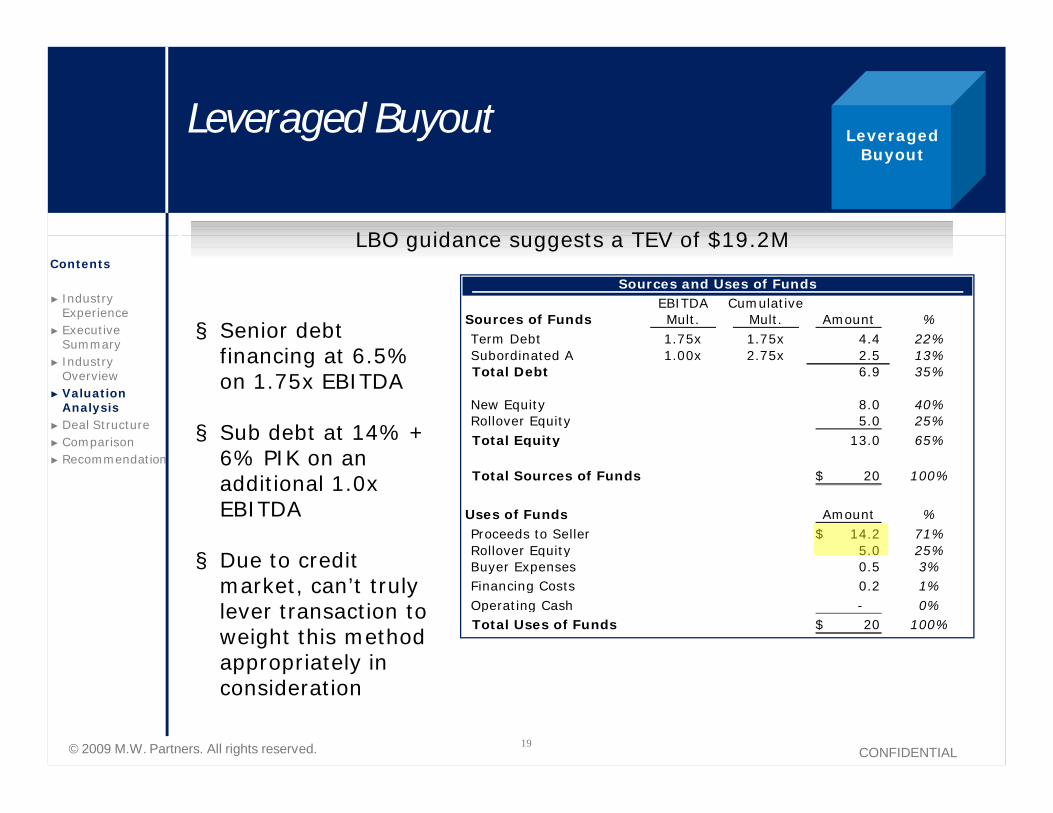
LBO guidance suggests a TEV of $19.2M
LeveragedBuyout
Sources and Uses of FundsEBITDA Cumulative
Sources of Funds Mult. Mult. Amount %Term Debt 1.75x 1.75x 4.4 22%Subordinated A 1.00x 2.75x 2.5 13%Total Debt 6.9 35%
New Equity 8.0 40%Rollover Equity 5.0 25%Total Equity 13.0 65%
Total Sources of Funds 20$ 100%
Uses of Funds Amount %Proceeds to Seller 14.2$ 71%Rollover Equity 5.0 25%Buyer Expenses 0.5 3%Financing Costs 0.2 1%Operating Cash - 0%Total Uses of Funds 20$ 100%
§ Senior debt financing at 6.5% on 1.75x EBITDA
§ Sub debt at 14% + 6% PIK on an additional 1.0x EBITDA
§ Due to credit market, can’t truly lever transaction to weight this method appropriately in consideration
Contents
► Industry Experience
► Executive Summary
► Industry Overview
► Valuation Analysis
► Deal Structure► Comparison► Recommendation

20CONFIDENTIAL© 2009 M.W. Partners. All rights reserved.
Valuation Summary
M.W. Partners analysis of Professional Style
supports a valuation range of $17M - $21M
$12 $14 $16 $18 $20 $22 $24
Comparables
Precedent
DCF
LBO
Conclusion
`
Methodology Low HighComparables 3.8x 4.1xPrecedent 4.7x 5.0xDCF 5.2x 5.5xLBO 5.1x 4.5x
Conclusion 17$ 21$ 4.7x 5.0x
EBITDA 3.7$ 4.2$
Enterprise Value Multiple of:
Contents
► Industry Experience
► Executive Summary
► Industry Overview
► Valuation Analysis
► Deal Structure► Comparison► Recommendation

21CONFIDENTIAL© 2009 M.W. Partners. All rights reserved.
0%
5%
10%
15%
20%
25%
30%
35%
40%
45%
8.3 11.0 15.0 20.0 25.0 30.0 35.0
IRR
Equity Investment ($'s in millions)
IRR Analysis based on Level of Equity Investment
Professional Style Summary
Bid Final$17.3M $20.9M
Buy at a discount up to maximum valuation to receive max return
Buy at a premium, receive above 20% IRR
Buy at a significant premium, receive less than required 20% IRR
Contents
► Industry Experience
► Executive Summary
► Industry Overview
► Valuation Analysis
► Deal Structure► Comparison► Recommendation
22CONFIDENTIAL© 2009 M.W. Partners. All rights reserved.
Deal Structure
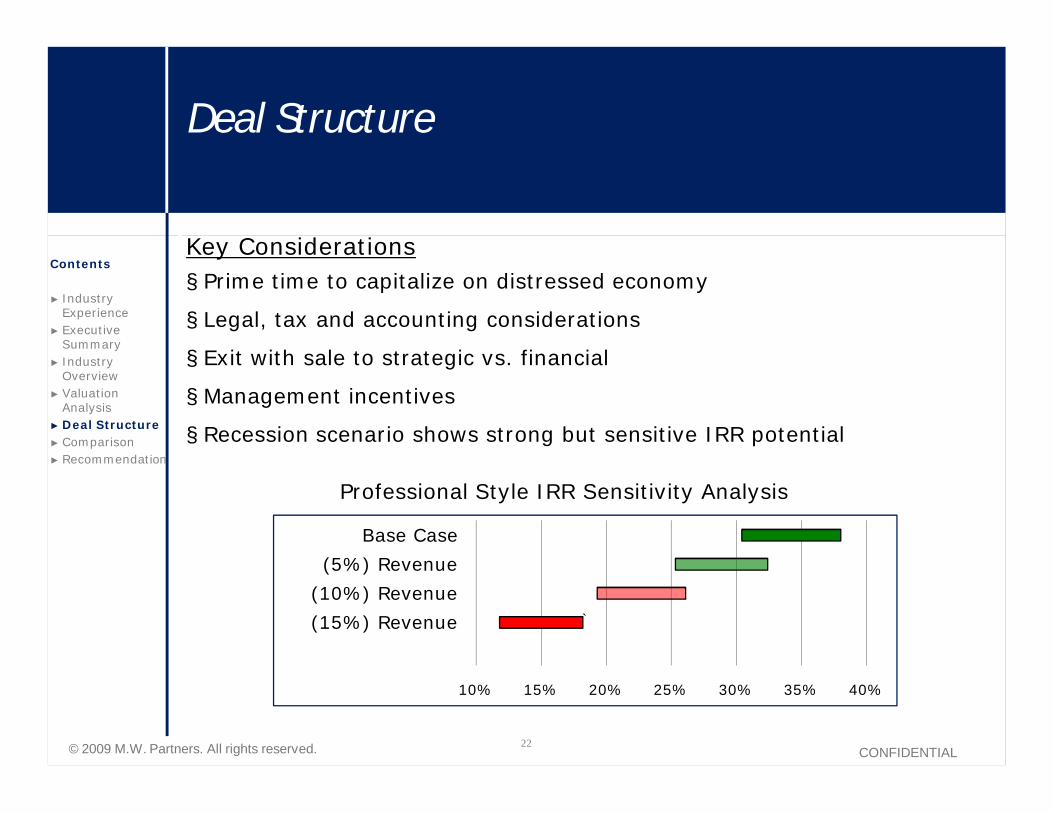
Key Considerations§ Prime time to capitalize on distressed economy
§ Legal, tax and accounting considerations
§ Exit with sale to strategic vs. financial
§ Management incentives
§ Recession scenario shows strong but sensitive IRR potential
10% 15% 20% 25% 30% 35% 40%
Base Case
(5%) Revenue
(10%) Revenue
(15%) Revenue `
Professional Style IRR Sensitivity Analysis
Contents
► Industry Experience
► Executive Summary
► Industry Overview
► Valuation Analysis
► Deal Structure► Comparison► Recommendation

23CONFIDENTIAL© 2009 M.W. Partners. All rights reserved.
Comparison: Alpha University vs. Professional Style
Val
ue TEV $47M - $52M
Equity $19M - $23MTEV $17M - $21MEquity $ 8M - $11M
IRR 32% - 38% IRR potential
Less sensitive31% - 38% IRR potentialHighly sensitive
10% 15% 20% 25% 30% 35% 40%
Base Case
(5%) Revenue
(10%) Revenue
(15%) Revenue `
Alpha University IRR Sensitivity Analysis
Alpha Professional Style Contents
► Industry Experience
► Executive Summary
► Industry Overview
► Valuation Analysis
► Deal Structure► Comparison► Recommendation

24CONFIDENTIAL© 2009 M.W. Partners. All rights reserved.
Comparison:Alpha University vs. Professional Style
Str
ateg
y
Financial buyer likely on exitConservative approach
Opportunity for strategic buyer on exit, high risk – high reward
Pros Recession proof
Proven portfolio performerHigh barriers to entry
Richer profit marginsOpen capacity for complimentary offerings
Cons Highly regulatedLower profit marginsGrowth potential limited
Current economic environmentRisk in fashion trendsDependence on disposable income
Alpha Professional Style Contents
► Industry Experience
► Executive Summary
► Industry Overview
► Valuation Analysis
► Deal Structure► Comparison► Recommendation

25CONFIDENTIAL© 2009 M.W. Partners. All rights reserved.
Final Recommendation: Alpha University vs. Professional Style
§ Recession proof CTE industry
§ Highly regulated = highly supported by government funding vs. consumers disposable income
§ IRR potential less sensitive to changes in revenue
§ High barriers to entry
§ Conservative choice for start up private equity
M.W. Partners recommends pursuing Alpha UniversityContents
► Industry Experience
► Executive Summary
► Industry Overview
► Valuation Analysis
► Deal Structure► Comparison► Recommendation

26CONFIDENTIAL© 2009 M.W. Partners. All rights reserved.
Professional Style Exhibits
M.W. Partners

27CONFIDENTIAL© 2009 M.W. Partners. All rights reserved.
Professional Style Exhibits - Table of Contents Exhibit PageValuation Summary 1 28
Historical & Adjusted Historical Financials 2 29 – 31
Projected & Adjusted Projected Financials 3 32 – 33
Key Assumptions, Weighted Average Cost of Capital 4 34 – 36
DCF Method (Adjusted and Unadjusted) 5 37 – 38
Guideline Publicly Traded Company Method 6 39 – 40
Precedent Transaction Method 7 41
Leveraged Buyout Method 8 42
IRR, Sensitivity Analysis, and Comparison 9 43 – 45
Alpha University Exhibits 10 46 - 51

28CONFIDENTIAL© 2009 M.W. Partners. All rights reserved.
Professional Style, LLCValuation Summary
($ in 000's)
INITIAL BID PRICE VALUATION:Indicated Value
Discounted Cash Flow Method 19,138Guideline Publicly Traded Company Method 14,200Precedent Transaction Method 17,561Leveraged Buyout Method 19,000Overall Indicated Value of Invested Capital 17,341 (1)
Indicated Value of 75% Equity Stake 13,006(-) Interest-bearing Debt 4,675Indicated Value of Invested Equity 8,331
Expected Internal Rate of Return 38.0%
SUGGESTED FINAL OFFER PRICE VALUATION:Indicated Value
Discounted Cash Flow Method 23,005Guideline Publicly Traded Company Method 17,230Precedent Transaction Method 21,074Leveraged Buyout Method 19,000Overall Indicated Value of Invested Capital 20,887 (1)
Indicated Value of 75% Equity Stake 15,665(-) Interest-bearing Debt 4,675Indicated Value of Invested Equity 10,990
Expected Internal Rate of Return 30.5%
(1) Overall market value weighted as follows:Discounted Cash Flow Method: 50%
Guideline Publicly Traded Company Method: 30%Precedent Transaction Method: 20%
Leveraged Buyout Method: 0%50%

29CONFIDENTIAL© 2009 M.W. Partners. All rights reserved.
Professional Style, LLCHistorical and Common-Size Balance Sheets
($ in millions)As of December 31,
2006 2007 2008 2006 2007 2008Assets:Accounts Receivable 1.3$ 1.2$ 1.3$ 16.9% 14.8% 15.3%Inventory 4.7 5.2 5.5 61.0% 64.2% 64.7%Other Current Assets 0.2 0.2 0.2 2.6% 2.5% 2.4%
Total Current Assets 6.2 6.6 7.0 80.5% 81.5% 82.4%
PP&E, net 1.5 1.5 1.5 19.5% 18.5% 17.6%
Total Assets 7.7 8.1 8.5 100.0% 100.0% 100.0%
Liabilities:Accounts Payable 3.5 3.6 2.7 45.5% 44.4% 31.8%Accrued Payroll & Expenses 0.7 0.9 0.8 9.1% 11.1% 9.4%
Total Current Liabilities 4.2 4.5 3.5 54.5% 55.6% 41.2%
Long Term Debt - - - 0.0% 0.0% 0.0%Total Liabilities 4.2 4.5 3.5 54.5% 55.6% 41.2%
Shareholders' Equity 3.5 3.6 5.0 45.5% 44.4% 58.8%Total Liabilities & Shareholders' Equity 7.7 8.1 8.5 100.0% 100.0% 100.0%

30CONFIDENTIAL© 2009 M.W. Partners. All rights reserved.
Professional Style, LLCHistorical and Common-Size Income Statements
($ in millions)Fiscal Years Ended December 31,
2006 2007 2008 2006 2007 2008
Revenue 27.1$ 27.5$ 29.8$ 100.0% 100.0% 100.0%
Cost of Goods Sold 17.8 17.9 18.7 65.7% 65.1% 62.8%
Gross Margin 9.3 9.6 11.1 34.3% 34.9% 37.2%
Operating Expenses:General & Administrative 9.1 9.2 9.4 33.6% 33.5% 31.5%Depreciation and Amortization 0.3 0.3 0.3 1.1% 1.1% 1.0%
Total Operating Expenses 9.4 9.5 9.7 34.7% 34.5% 32.6%
Operating Income (0.1) 0.1 1.4 -0.4% 0.4% 4.7%
EBITDA 0.2$ 0.4$ 1.7$ 0.7% 1.5% 5.7%
Source: Company financial statements, provided
Income Growth2006 2007 2008
Revenue 27.1$ 27.5$ 29.8$ Growth (%) 1.1% 1.5% 8.4%
Gross Margin 9.3 9.6 11.1 Growth (%) - 3.2% 15.6%
Operating Income (0.1) 0.1 1.4 Growth (%) - -200.0% 1300.0%
EBITDA 0.2$ 0.4$ 1.7$ Growth (%) 100.0% 100.0% 325.0%

31CONFIDENTIAL© 2009 M.W. Partners. All rights reserved.
Professional Style, LLCAdjusted Historical and Common-Size Income Statements
($ in millions)Fiscal Years Ended December 31,
2006 2007 2008 2006 2007 2008
Revenue 27.1$ 27.5$ 29.8$ 100.0% 100.0% 100.0%
Cost of Goods Sold 17.8 17.9 18.7 65.7% 65.1% 62.8%
Gross Margin 9.3 9.6 11.1 34.3% 34.9% 37.2%
Operating Expenses:General & Administrative 9.1 9.2 9.4 33.6% 33.5% 31.5%Depreciation and Amortization 0.3 0.3 0.3 1.1% 1.1% 1.0%
Total Operating Expenses 9.4 9.5 9.7 34.7% 34.5% 32.6%
Adjustments:Management Fees (1) (0.4) (0.4) (0.4) -1.5% -1.5% -1.3%Discontinued Boutique Retail Stores (2) (0.0) (0.0) (0.2) -0.1% -0.1% -0.7%Call Center Outsourcing (3) (0.2) (0.2) (0.2) -0.7% -0.7% -0.7%
Adjusted Operating Expenses 8.8 8.9 8.9 32.4% 32.2% 29.9%
Operating Income 0.5 0.7 2.2 2.0% 2.7% 7.4%
Adjusted EBITDA 0.8$ 1.0$ 2.5$ 3.1% 3.8% 8.4%
Source: Company financial statements, provided
Income Growth2006 2007 2008
Revenue 27.1$ 27.5$ 29.8$ Growth (%) 1.1% 1.5% 8.4%
Gross Margin 9.3 9.6 11.1 Growth (%) - 3.2% 15.6%
Operating Income 0.5 0.7 2.2 Growth (%) - 39.1% 197.8%
Adjusted EBITDA 0.8$ 1.0$ 2.5$ Growth (%) 100.0% 25.0% 140.8%
Assumptions:
(1) Assumes $400,000 annual management fee to One Tree Hill Capital Partners is discretionary.(2) Assumes boutique retail stores were discontinued or never opened. Retail stores accounted for -16%, -10%, and -12% for years 2006, 2007, and 2008, respectively.(3) Assumes Call Center was sold and outsourced to Bangalore, India years prior.

32CONFIDENTIAL© 2009 M.W. Partners. All rights reserved.
Professional Style, LLCProjected Income Statements
($ in millions)Fiscal Years Ended December 31,
2009 2010 2011 2012 2013 2009 2010 2011 2012 2013
Revenue 30.8$ 32.9$ 35.4$ 38.9$ 43.8$ 100.0% 100.0% 100.0% 100.0% 100.0%
Cost of Goods Sold 17.6 19.2 20.5 21.4 23.0 57.1% 58.4% 57.9% 55.0% 52.5%
Gross Margin 13.2 13.7 14.9 17.5 20.8 42.9% 41.6% 42.1% 45.0% 47.5%
Operating Expenses:General & Administrative 9.5 9.7 9.8 10.3 13.2 30.8% 29.5% 27.7% 26.5% 30.1%Depreciation and Amortization 0.3 0.3 0.3 0.3 0.3 1.0% 0.9% 0.8% 0.8% 0.7%
Total Operating Expenses 9.8 10.0 10.1 10.6 13.5 31.8% 30.4% 28.5% 27.2% 30.8%
Operating Income 3.4 3.7 4.8 6.9 7.3 11.0% 11.2% 13.6% 17.7% 16.7%
EBITDA 3.7$ 4.0$ 5.1$ 7.2$ 7.6$ 12.0% 12.2% 14.4% 18.5% 17.4%
Interest Expense 0.4 0.3 0.2 0.1 - 1.4% 0.9% 0.5% 0.2% 0.0%
EBIT 3.3 3.7 4.9 7.1 7.6 10.6% 11.2% 13.9% 18.4% 17.4%
Provision for Taxes 1.3 1.5 2.0 2.9 3.0 4.2% 4.5% 5.6% 7.3% 6.9%
Net Income 2.0$ 2.2$ 3.0$ 4.3$ 4.6$ 6.4% 6.7% 8.3% 11.0% 10.4%
Source: Company financial statements, provided
Income Growth2009 2010 2011 2012 2013
Revenue 30.8$ 32.9$ 35.4$ 38.9$ 43.8$ Growth (%) 3.4% 6.8% 7.6% 9.9% 12.6%
Gross Margin 13.2 13.7 14.9 17.5 20.8 Growth (%) - 3.8% 8.8% 17.4% 18.9%
Operating Income 3.4 3.7 4.8 6.9 7.3 Growth (%) - 8.8% 29.7% 43.8% 5.8%
EBITDA 3.7$ 4.0$ 5.1$ 7.2$ 7.6$ Growth (%) 100.0% 8.1% 27.5% 41.2% 5.6%

33CONFIDENTIAL© 2009 M.W. Partners. All rights reserved.
Assumptions:(1) Estimated revenue growth rate based on lesser of company projections and calculated industry data. See Key Assumptions exhibit.(2) Assumes $400,000 annual management fee will be eliminated.(3) Assumes retail stores would account for -8% of 2009 EBITDA and -4% of 2010 EBITDA, and breakeven at 2011 if retail store operations were not discontinued.(4) Incremental restructuring costs associated with the discontinued boutique retail stores estimated at $500,000.(5) Proceeds of $400,000 from sale of Call Center. (6) $200,000 in net annual savings from outsourcing Call Center operations to Bangalore, India. Assumes net savings include costs and fees associated with the existing lease agreement on Lakeland, FL facility.
Professional Style, LLCAdjusted Projected Income Statements
($ in millions) Fiscal Years Ended December 31,2009 2010 2011 2012 2013 2009 2010 2011 2012 2013
Revenue (1) 30.1$ 32.2$ 34.5$ 36.8$ 39.3$ 100.0% 100.0% 100.0% 100.0% 100.0%
Cost of Goods Sold 17.2 18.8 20.0 20.3 20.7 57.1% 58.4% 57.9% 55.0% 52.5%
Gross Margin 12.9 13.4 14.5 16.6 18.7 42.9% 41.6% 42.1% 45.0% 47.5%
Operating Expenses:General & Administrative 9.5 9.7 9.8 10.3 13.2 31.5% 30.1% 28.4% 28.0% 33.6%Depreciation and Amortization 0.3 0.3 0.3 0.3 0.3 1.0% 0.9% 0.9% 0.8% 0.8%
Total Operating Expenses 9.8 10.0 10.1 10.6 13.5 32.5% 31.1% 29.3% 28.8% 34.3%
Adjustments:Management Fees (2) (0.4) (0.4) (0.4) (0.4) (0.4) -1.3% -1.2% -1.2% -1.1% -1.0%Discontinued Boutique Retail Stores (3) (0.3) (0.2) - - - -1.0% -0.5% 0.0% 0.0% 0.0%
Restructuring Costs (4) 0.5 - - - - 1.7% 0.0% 0.0% 0.0% 0.0%Call Center Sale (5) (0.4) - - - - -1.3% 0.0% 0.0% 0.0% 0.0%Call Center Outsourcing (6) (0.2) (0.2) (0.2) (0.2) (0.2) -0.7% -0.6% -0.6% -0.5% -0.5%
Adjusted Operating Expenses 9.0 9.2 9.5 10.0 12.9 29.9% 28.7% 27.5% 27.2% 32.8%
Operating Income 3.9 4.2 5.0 6.6 5.8 13.0% 12.9% 14.5% 17.8% 14.7%
Adjusted EBITDA 4.2$ 4.5$ 5.3$ 6.9$ 6.1$ 14.0% 13.9% 15.4% 18.6% 15.5%
Interest Expense 0.4 0.3 0.2 0.0 - 1.4% 0.9% 0.4% 0.1% 0.0%
EBIT 3.8 4.2 5.2 6.8 6.1 12.5% 13.0% 15.0% 18.6% 15.5%
Provision for Taxes 1.5 1.7 2.1 2.7 2.4 5.0% 5.2% 6.0% 7.4% 6.2%
Net Income 2.3$ 2.5$ 3.1$ 4.1$ 3.6$ 7.5% 7.8% 9.0% 11.1% 9.3%
Source: Company financial statements, provided
Income Growth2009 2010 2011 2012 2013
Revenue (1) 30.1$ 32.2$ 34.5$ 36.8$ 39.3$ Growth (%) 1.1% 6.8% 7.2% 6.7% 6.8%
Gross Margin 12.9 13.4 14.5 16.6 18.7 Growth (%) - 3.8% 8.3% 14.1% 12.8%
Operating Income 3.9 4.2 5.0 6.6 5.8 Growth (%) - 6.5% 20.6% 30.8% -11.9%
EBITDA 4.2$ 4.5$ 5.3$ 6.9$ 6.1$ Growth (%) 100.0% 6.0% 19.2% 29.0% -11.4%

34CONFIDENTIAL© 2009 M.W. Partners. All rights reserved.
Professional Style, LLCKey Assumptions
Capital Structure, Interest, Working Capital, and Annual Revenue Growth Rates
($ in millions)
Unadjusted Capital Structure
Unadjusted EBITDA 1.7 Unadjusted Enterprise Value (1) 15.5
EBITDACapital Multiple Capital %
Senior Debt 1.75x 3.0 19.1%Mezzanine Debt 1.00x 1.7 10.9%Equity 6.39x 10.9 69.9%
9.14x 15.5 100.0%
Unadjusted Debt Schedule (4) Excess CF2009 2010 2011 2012 2013 After Debt
Senior Debt 3.0 3.0 2.8 0.9 - 4.9 Mezzanine Debt 1.7 0.8 - - -
Interest ExpenseSenior (6.5%) 0.2 0.2 0.2 0.1 - Mezzanine (14%, 6% PIK) 0.2 0.1 - - -
Total Unadjusted Interest Expense 0.4 0.3 0.2 0.1 -
Adjusted Capital Structure
Adjusted EBITDA 2.5 Adjusted Enterprise Value (1) 18.8
EBITDACapital Multiple Capital %
Senior Debt 1.75x 3.0 18.0%Mezzanine Debt 1.00x 1.7 10.3%Equity 4.75x 11.9 71.8%
7.50x 16.6 100.0%
Adjusted Debt Schedule (4) Excess CF2009 2010 2011 2012 2013 After Debt
Senior Debt 3.0 3.0 2.3 0.4 - 4.6 Mezzanine Debt 1.7 0.6 - - -
Interest ExpenseSenior (6.5%) 0.2 0.2 0.2 0.0 - Mezzanine (14%, 6% PIK) 0.2 0.1 - - -
Total Adjusted Interest Expense 0.4 0.3 0.2 0.0 -

35CONFIDENTIAL© 2009 M.W. Partners. All rights reserved.
Professional Style, LLCKey Assumptions
Capital Structure, Interest, Working Capital, and Annual Revenue Growth Rates
($ in millions)
Working Capital2006 2007 2008
Historical Working Capital 2.0 2.1 3.5 Increase in Working Capital n/a 0.1 1.4
Average Change in Working Capital 0.75
Projected Revenue Growth Rates
Internet Sales Percentage in 2002 30.0%Internet Sales Percentage in 2008 50.0%
2009 2010 2011 2012 2013
Forecasted Internet Sales % 52.5% 55.0% 57.5% 60.0% 62.5%
Forecasted Revenue Growth by Industry:E-Commerce:
Source: IBIS World 12.6% 11.6% 12.0% 12.1% 12.7%Source: Forrester 11.0% 13.0% 10.0% 9.0% 8.0%
Average E-Commerce Revenue Growth 11.8% 12.3% 11.0% 10.6% 10.4%
Women's Clothing Stores:Source: IBIS World -2.0% 1.1% 2.0% 1.0% 1.0%
Calculated Wtd Avg. Revenue Growth Rate (2) 5.2% 7.3% 7.2% 6.7% 6.8%
Management Projected Growth Rate 3.4% 6.8% 7.6% 9.9% 12.6%
Selected Revenue Growth Rate (3) 1.1% 6.8% 7.2% 6.7% 6.8%
(1) Avg. Enterprise Value calculated using Guideline Publicly Traded Company Method and Precedent Transaction Method.(2) Weighted by applying forecasted internet sales percentage to projected e-commerce growth rates and catalog sales percentage to women's clothing growth rate.
(4) Debt reduced annually by 75% of free cash flows. Mezzanine debt retried first as it held a higher interest rate.
(3) Selected growth rate was the lesser of management projections and calculated weighted average growth rate based on market data. 2009 growth rate adjusted for losses associated with further economic decline and reduced customer satisfaction with customer service (call center).

36CONFIDENTIAL© 2009 M.W. Partners. All rights reserved.
Professional Style, LLCWeighted Average Cost of Capital
Cost of Equity Capital: Source:Risk-free Rate of Return 3.91% www.ustreas.gov , US Treasury 20-year Note as of 2/13/2009Long-term Equity Risk Premium 6.20% Stocks, Bonds, Bills, and Inflation, Ibbotson Associates, 2008Industry Beta 1.56 Cost of Capital, Ibbotson Associates, 2009
Beta-adjusted Equity Risk Premium 9.67%Size Premium 3.65% Stocks, Bonds, Bills, and Inflation, Ibbotson Associates, 2008Unsystematic Risk Premium 3.00% Based on company size within the Ibbotson Micro-Cap range
Total Equity Rate 20.23%
Cost of Debt Capital:Senior Debt:
Average Cost of Debt 6.50% LIBOR + 600 bps. Current LIBOR rate of 0.50%Tax Rate 40.00% Estimate
After-tax Debt Rate 3.90%
Mezzanine Debt:Average Cost of Debt 20.00% 14% interest + 6% PIK interestTax Rate 40.00% Estimate
After-tax Debt Rate 12.00%
Unadjusted Capital Structure:Equity / Total Invested Capital 69.92%Senior Debt / Total Invested Capital 19.14% 1.75x EBITDA / Unadjusted TEVMezzanine Debt / Total Invested Capital 10.94% 1.00x EBITDA / Unadjusted TEV
100.00%
Unadjusted WACC 16.21%
Adjusted Capital Structure:Equity / Total Invested Capital 71.76%Senior Debt / Total Invested Capital 17.97% 1.75x EBITDA / Adjusted TEVMezzanine Debt / Total Invested Capital 10.27% 1.00x EBITDA / Adjusted TEV
100.00%
Adjusted WACC 16.45%

37CONFIDENTIAL© 2009 M.W. Partners. All rights reserved.
Professional Style, LLCDiscounted Cash Flow Method
Unadjusted Value
($ in millions)
Present Value of Discrete Cash Flows2009 2010 2011 2012 2013
Net Income 2.0 2.2 3.0 4.3 4.6 (+) Depreciation & Amortization 0.3 0.3 0.3 0.3 0.3 (+) Interest Expense (net of taxes) 0.3 0.2 0.1 0.0 - (-) Capital Expenditures (0.5) (0.5) (0.1) (0.1) (0.1) (-) Change in Working Capital (0.8) (0.8) (0.8) (0.8) (0.8)
Free Cash Flow 1.3 1.5 2.5 3.8 4.0
Present Value of Discrete Cash Flows (1) 1.1 1.1 1.6 2.1 1.9
Total Present Value of Discrete Cash Flows 7.7
Present Value of Terminal Net Cash FlowFiscal 2013 Free Cash Flow 4.0 Long-term Sustainable Growth Rate (2) 3.40%Terminal Value 32.4
Present Value of Terminal Cash Flow 15.3
Valuation SummaryTotal Present Value of Discrete Cash Flows 7.7 Present Value of Terminal Cash Flow 15.3
Unadjusted Value of Invested Capital 23.0$
Source: Unadjusted projections and weighted average cost of capital exhibits
(1) Present value discounted by the WACC(2) Estimated based on annual GDP growth in the retail trade industry between 1977 and 1997.

38CONFIDENTIAL© 2009 M.W. Partners. All rights reserved.
Professional Style, LLCDiscounted Cash Flow Method
Adjusted Value
($ in millions)
Present Value of Discrete Cash Flows2009 2010 2011 2012 2013
Net Income 2.3 2.5 3.1 4.1 3.6 (+) Depreciation & Amortization 0.3 0.3 0.3 0.3 0.3 (+) Interest Expense (net of taxes) 0.3 0.2 0.1 0.0 - (-) Capital Expenditures (0.5) (0.5) (0.1) (0.1) (0.1) (-) Change in Working Capital (0.8) (0.8) (0.8) (0.8) (0.8)
Free Cash Flow 1.6 1.7 2.6 3.6 3.1
Present Value of Discrete Cash Flows (1) 1.4 1.3 1.7 1.9 1.4
Total Present Value of Discrete Cash Flows 7.7
Present Value of Terminal Net Cash FlowFiscal 2013 Free Cash Flow 3.1 Long-term Sustainable Growth Rate (2) 3.40%Terminal Value 24.5
Present Value of Terminal Cash Flow 11.5
Valuation SummaryTotal Present Value of Discrete Cash Flows 7.7 Present Value of Terminal Cash Flow 11.5
Adjusted Value of Invested Capital 19.1$
Source: Adjusted projections and weighted average cost of capital exhibits
(1) Present value discounted by the WACC(2) Estimated based on annual GDP growth in the retail trade industry between 1977 and 1997.

39CONFIDENTIAL© 2009 M.W. Partners. All rights reserved.
Professional Style, LLCGuideline Publicly Traded Company Method
EBITDA Analysis
($ in millions)EBITDA 3-Year Avg Annual TEV / EBITDA
CompanyLTM
EBITDA 2006 2007 2008 EBITDA Growth TEV LTM 3-Year Avg
American Apparel 46.0 21.7 44.7 46.0 37.5 54.4% 265.7 5.78x 7.09xColdwater Creek Inc 18.4 92.5 122.8 41.8 85.7 -16.6% 210.1 11.42x 2.45xDelias Inc 7.5 6.2 12.0 5.5 7.9 19.7% 66.3 8.84x 8.39xOxford Industries Inc 59.2 124.7 124.1 84.0 110.9 -16.4% 324.9 5.49x 2.93xUrban Outfitters Inc 394.5 244.8 217.9 293.2 252.0 11.8% 2,568.1 6.51x 10.19x
LOW 7.5 -16.6% 5.49x 2.45xHIGH 394.5 54.4% 11.42x 10.19xMEAN 105.1 10.6% 7.61x 6.21xMEDIAN 46.0 11.8% 6.51x 7.09x
Professional Style, LLC:Unadjusted 1.7 0.2 0.4 1.7 0.8 212.5%Adjusted 2.5 0.8 1.0 2.5 1.5 82.9%
Revenue AnalysisRevenue 3-Year Avg Annual TEV / Revenue
CompanyLTM
Revenue 2006 2007 2008 Revenue Growth TEV LTM 3-Year Avg
American Apparel 510.6 285.0 387.0 510.6 394.2 33.9% 265.7 0.52x 0.67xColdwater Creek Inc 1,086.5 779.7 1,054.6 1,151.5 995.3 22.2% 210.1 0.19x 0.21xDelias Inc 288.2 226.7 257.6 274.3 252.9 10.1% 66.3 0.23x 0.26xOxford Industries Inc 968.0 1,109.1 1,128.9 1,043.7 1,093.9 -2.9% 324.9 0.34x 0.30xUrban Outfitters Inc 1,792.0 1,092.1 1,224.7 1,507.7 1,274.8 17.6% 2,568.1 1.43x 2.01x
LOW 288.2 -2.9% 0.19x 0.21xHIGH 1,792.0 33.9% 1.43x 2.01xMEAN 929.1 16.2% 0.54x 0.69xMEDIAN 968.0 17.6% 0.34x 0.30x
Professional Style, LLC:Unadjusted 29.8 27.1 27.5 29.8 28.1 4.9%Adjusted 29.8 27.1 27.5 29.8 28.1 4.9%

40CONFIDENTIAL© 2009 M.W. Partners. All rights reserved.
Guideline Publicly Traded Company MethodRevenue Performance Ratios
($ in millions) ReturnsLTM 3-Year Avg
CompanyEBITDA / Revenue
EBITDA / Revenue
American Apparel 9.0% 9.5%Coldwater Creek Inc 1.7% 8.6%Delias Inc 2.6% 3.1%Oxford Industries Inc 6.1% 10.1%Urban Outfitters Inc 22.0% 19.8%
LOW 1.7% 3.1%HIGH 22.0% 8.6%MEAN 8.3% 10.2%MEDIAN 6.1% 9.5%
Professional Style, LLC:Unadjusted 5.7% 2.7%Adjusted 8.4% 5.2%
Professional Style, LLCGuideline Publicly Traded Company Method
Valuation Summary
($ in millions)Professional Style, LLC Industry Multiples Indicated Value
Fundamental Unadjusted Adjusted Low High Mean Median Selected Unadjusted Adjusted
Latest 12 Months:EBITDA 1.7 2.5 5.5 11.4 7.6 6.5 8.0 13.6 20.0 Revenue 29.8 29.8 0.2 1.4 0.5 0.3 0.5 16.2 16.2
Indicated Value: 14.9 18.1 3-Year Average:
EBITDA 0.8 1.5 2.5 10.2 6.2 7.1 7.5 5.8 10.9 Revenue 28.1 28.1 0.2 2.0 0.7 0.3 0.7 19.5 19.5
Indicated Value: 12.6 15.2
Total Market Value: 14.2$ 17.2$ (1)

41CONFIDENTIAL© 2009 M.W. Partners. All rights reserved.
Professional Style, LLCPrecedent Transaction Method
Valuation Summary
($ in millions)% Revenue
% Revenue from Catalogue Enterprise MultiplesTransaction Close Date from Retail or Internet Value Revenue EBITDA EBITDA % Revenue EBITDA
Transaction 1 Oct-08 10% 90% 25 27 4 15.0% 0.9x 6.3xTransaction 2 Aug-08 25% 75% 79 107 11 10.3% 0.7x 7.2xTransaction 3* Feb-08 5% 95% 35 45 6 13.2% 0.8x 5.8xTransaction 6* Aug-07 30% 70% 61 48 5 10.4% 1.3x 12.1xTransaction 8 May-07 0% 100% 43 52 6 11.6% 0.8x 7.1xTransaction 4 Sep-07 50% 50% 148 493 21 4.3% 0.3x 7.1xTransaction 5 Sep-07 80% 20% 65 41 8 19.3% 1.6x 8.1xTransaction 7 Aug-07 65% 35% 337 115 33 28.6% 2.9x 10.2xTransaction 9 Apr-07 70% 30% 657 1,167 98 8.4% 0.6x 6.7xTransaction 10 Nov-06 60% 40% 107 92 13 14.2% 1.2x 8.2xTransaction 11 Sep-06 85% 15% 79 101 8 7.9% 0.8x 9.9xTransaction 12 Feb-06 75% 25% 513 511 45 8.8% 1.0x 11.4xTransaction 13 May-05 0% 100% 14 26 2 7.8% 0.5x 6.8xTransaction 14 Apr-03 75% 25% 315 114 22 19.3% 2.8x 14.3xTransaction 15 Nov-02 95% 5% 506 670 61 9.1% 0.8x 8.3xTransaction 16 May-02 85% 15% 1,937 1,614 156 9.7% 1.2x 12.4x
All Transactions:LOW 14 26 2 4.3% 0.3x 5.8xHIGH 1,937 1,614 156 28.6% 2.9x 14.3xAVERAGE 308 326 31 12.4% 1.1x 8.9x
Relevant Transactions (by date, size, revenue, and industry):LOW 25 27 4 10.3% 0.7x 5.8xHIGH 79 107 11 15.0% 1.3x 12.1xAVERAGE 49 56 6 12.1% 0.9x 7.7x
Average adjusted for EBITDA Multiple outliers* 49 62 7 12.3% 0.8x 6.9x
Overall Average Guidance: 49 59 7 12.2% 0.9x 7.3x
Professional Style, LLC (1)
Unadjusted Value 17.6 29.8 1.7 5.7%Adjusted Value 21.1 29.8 2.5 8.4%
(1) Applied EBITDA and Revenue multiples were weighted at 60% and 40%, respectively.
42CONFIDENTIAL© 2009 M.W. Partners. All rights reserved.
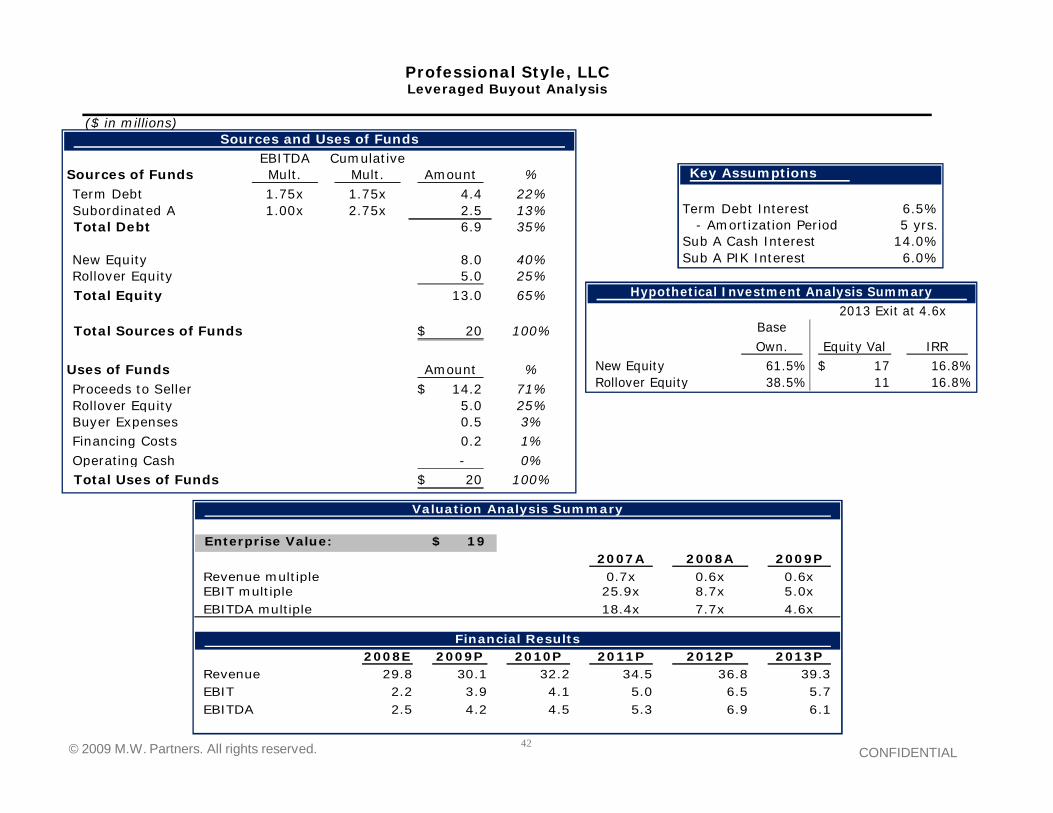
Sources and Uses of FundsEBITDA Cumulative
Sources of Funds Mult. Mult. Amount %Term Debt 1.75x 1.75x 4.4 22%Subordinated A 1.00x 2.75x 2.5 13%Total Debt 6.9 35%
New Equity 8.0 40%Rollover Equity 5.0 25%Total Equity 13.0 65%
Total Sources of Funds 20$ 100%
Uses of Funds Amount %Proceeds to Seller 14.2$ 71%Rollover Equity 5.0 25%Buyer Expenses 0.5 3%Financing Costs 0.2 1%Operating Cash - 0%Total Uses of Funds 20$ 100%
Key Assumptions
Term Debt Interest 6.5% - Amortization Period 5 yrs.Sub A Cash Interest 14.0%Sub A PIK Interest 6.0%
Professional Style, LLCLeveraged Buyout Analysis
($ in millions)
Valuation Analysis Summary
Enterprise Value: 19$ 2007A 2008A 2009P
Revenue multiple 0.7x 0.6x 0.6xEBIT multiple 25.9x 8.7x 5.0xEBITDA multiple 18.4x 7.7x 4.6x
Financial Results2008E 2009P 2010P 2011P 2012P 2013P
Revenue 29.8 30.1 32.2 34.5 36.8 39.3 EBIT 2.2 3.9 4.1 5.0 6.5 5.7 EBITDA 2.5 4.2 4.5 5.3 6.9 6.1
Hypothetical Investment Analysis Summary2013 Exit at 4.6x
BaseOwn. Equity Val IRR
New Equity 61.5% 17$ 16.8%Rollover Equity 38.5% 11 16.8%

43CONFIDENTIAL© 2009 M.W. Partners. All rights reserved.
Professional Style, LLCInternal Rate of Return
($ in millions)
2011 2012 2013
Value of Invested Capital (after adjustments) 20.9$ 20.9$ 20.9$ EBITDA Multiple (1) 8.34x 8.34x 8.34x
Projected Value of Invested Capital in Exit Year (2) 44.4 57.2 50.7 Value of 73% Equity Stake (3) 32.4 41.8 37.0 Plus Excess Cash / (Less Remaining Debt) (4) (0.2) 2.5 4.6 Value of Invested Equity in Exit Year 32.2$ 44.3$ 41.6$
Internal Rate of Return:
Equity Investment IRR (by exit year)
2011 2012 2013
8.3 56.9% 51.8% 38.0%11.0 43.0% 41.7% 30.5%15.0 28.9% 31.1% 22.7%20.0 17.1% 22.0% 15.8%25.0 8.7% 15.4% 10.7%30.0 2.3% 10.2% 6.8%35.0 -2.8% 6.1% 3.5%
(1) Multiple of unadjusted EBITDA of $2.5 million(2) Based on adjusted projected EBITDA of exit year(3) 2.5% dilution in original 75% equity piece due to management stock compensation program(4) Excess Cash or (Remaining Debt) after annual reductions of 75% of free cash flows
Note: IRR's calculated using a discount rate equal to the adjusted WACC of 16.45% and exit year equity return (calculated above)

44CONFIDENTIAL© 2009 M.W. Partners. All rights reserved.
Professional Style, LLCSensitivity Analysis
IRR Calculations
($ in millions)
Base Case Scenario:
Equity Investment IRR (by exit year)
2011 2012 2013
8.3 56.9% 51.8% 38.0%11.0 43.0% 41.7% 30.5%15.0 28.9% 31.1% 22.7%20.0 17.1% 22.0% 15.8%25.0 8.7% 15.4% 10.7%30.0 2.3% 10.2% 6.8%35.0 -2.8% 6.1% 3.5%
Annual Projected Revenue Sensitized at -5%:
Equity Investment IRR (by exit year)
2011 2012 2013
8.3 47.1% 45.7% 32.4%11.0 34.1% 36.0% 25.3%15.0 20.9% 25.8% 17.8%20.0 9.9% 17.1% 11.2%25.0 2.0% 10.7% 6.3%30.0 -4.0% 5.8% 2.5%35.0 -8.8% 1.8% -0.6%
($ in millions)Annual Projected Revenue Sensitized at -10%:
Equity Investment IRR (by exit year)
2011 2012 2013
8.3 36.5% 39.2% 26.1%11.0 24.5% 29.8% 19.3%15.0 12.2% 20.1% 12.1%20.0 1.9% 11.8% 5.9%25.0 -5.4% 5.7% 1.2%30.0 -10.9% 1.0% -2.4%35.0 -15.4% -2.8% -5.3%
Annual Projected Revenue Sensitized at -15%:
Equity Investment IRR (by exit year)
2011 2012 2013
8.3 23.9% 31.5% 18.2%11.0 13.0% 22.7% 11.8%15.0 1.9% 13.5% 5.1%20.0 -7.5% 5.6% -0.8%25.0 -14.1% -0.1% -5.1%30.0 -19.2% -4.5% -8.5%35.0 -23.2% -8.2% -11.3%

45CONFIDENTIAL© 2009 M.W. Partners. All rights reserved.
Professional Style, LLCComparisons to Alpha University
($ in millions)
Professional Style, LLC Alpha University
Suggested Bid Price $8.3 $18.7Suggested Final Offer Price $11.0 $23.2
Estimated Exit Value After 5 Years $41.6 $91.7
Internal Rate of Return:Base Case Scenario 30.5% - 38.0% 31.6% - 37.5%
Projected Revenue Sensitized at -5% 25.3% - 32.4% 30.6% - 36.4%Projected Revenue Sensitized at -10% 19.3% - 26.1% 29.5% - 35.3%Projected Revenue Sensitized at -15% 11.8% - 18.2% 28.4% - 34.2%

46CONFIDENTIAL© 2009 M.W. Partners. All rights reserved.
INITIAL BID PRICE VALUATION:Indicated Value $000
Discounted cash flow method 44,295Guideline publicly traded company method 50,304Precedent transaction method 46,317Leveraged buyout method 40,000Overall indicated market value of invested capital 46,502 (1)
Indicated value of 80% equity stake 37,201(-) Interest-bearing debt 18,550Indicated value of invested equity 18,651
Expected internal rate of return 37.5%
SUGGESTED FINAL OFFER PRICE VALUATION:Indicated Value $000
Discounted cash flow method (rounded) 52,496Guideline publicly traded company method (rounded) 53,844Precedent transaction method 49,140Leveraged buyout method 40,000Overall indicated market value of invested capital 52,229 (1)
Indicated value of 80% equity stake 41,783(-) Interest-bearing debt 18,550Indicated value of invested equity 23,233
Expected internal rate of return 31.6%
(1) Overall market value weighted as follows:Guideline publicly traded company method: 30%
Discounted cash flow method: 50%Precedent transaction method: 20%
Leveraged buyout method: 0%100%
Valuation SummaryAlpha University

47CONFIDENTIAL© 2009 M.W. Partners. All rights reserved.
Alpha UniversityAdjusted Projected Income Statements ($'s in millions)
2009 2010 2011 2012 2013 2009 2010 2011 2012 2013Revenue 30.2$ 32.6$ 35.2$ 38.0$ 41.1$ 99.2% 96.9% 93.8% 87.5% 82.7%New Branch Revenue 0.2 1.0 2.3 5.4 8.6 0.8% 3.1% 6.2% 12.5% 17.3%
Total Revenue 30.4 33.6 37.5 43.5 49.7 100.0% 100.0% 100.0% 100.0% 100.0%
Cost of educational services 22.7 24.9 27.6 32.1 35.9 74.5% 74.1% 73.4% 73.9% 72.2%New Branch Expenses 0.7 0.3 0.6 0.8 0.2 2.4% 0.8% 1.5% 1.8% 0.3%General and administrative expenses 1.8 1.8 1.9 1.9 2.0 5.9% 5.3% 5.1% 4.4% 4.0%Depreciation and amortization 0.2 0.2 0.2 0.2 0.2 0.7% 0.6% 0.5% 0.5% 0.4%
Total Expenses 25.4 27.2 30.2 35.0 38.3 83.4% 80.9% 80.5% 80.5% 77.0%Adjustments:
Company Aircraft (0.3) (0.3) (0.3) (0.3) (0.3) -1.0% -0.9% -0.8% -0.7% -0.6%Corporate Travel Expenses 0.1 0.1 0.1 0.1 0.1 0.2%Discretionary Owner's Salary (0.3) (0.3) (0.3) (0.3) (0.3) -0.8% -0.7% -0.7% -0.6% -0.5%
Adjusted Expenses 24.9 26.7 29.7 34.5 37.8 81.8% 79.4% 79.2% 79.4% 76.0%
Operating Income 5.5 6.9 7.8 9.0 11.9 18.2% 20.6% 20.8% 20.6% 24.0%
EBITDA 5.7$ 7.1$ 8.0$ 9.2$ 12.1$ 18.9% 21.2% 21.3% 21.1% 24.4%
Interest Expense 1.9 1.7 1.5 1.2 0.9 6.2% 5.0% 3.9% 2.7% 1.9%
EBIT 3.8 5.4 6.6 8.0 11.2 12.6% 16.2% 17.5% 18.3% 22.5%
Provision for Taxes (2.3) (3.3) (3.9) (4.8) (6.7) -7.6% -9.7% -10.5% -11.0% -13.5%
Net Income 1.5$ 2.2$ 2.6$ 3.2$ 4.5$ 5.1% 6.5% 7.0% 7.3% 9.0%
Source: Company financial statements, provided
Assumptions:Existing Branch Revenue Growth Rate: 8.6% in 2009, 8% thereafter. Consistent projected gross profit margin.New Branch Revenue: based on last 3 years average branch revenue and enrollment, by year of operation.New Branch Expenses: based on 15 month break even calculation.Adjustments: Company aircraft and owner's salary are discretionary expenses and will be eliminated. Increased corporate travel expenses.Tax Rate of 40%
Fiscal Years Ending December 31,

48CONFIDENTIAL© 2009 M.W. Partners. All rights reserved.
Alpha UniversityDiscounted Cash Flow Method
Present value of Discrete Net Cash Flows 2009 2010 2011 2012 2013Net Income 1.6 2.0 2.4 2.8 3.6 Plus depreciation and amortization 0.2 0.2 0.2 0.2 0.2 Plus interest expense (net of taxes) 1.1 1.0 0.9 0.7 0.6 Less capital expenditures 0.5 0.6 0.7 0.8 0.8 Less working capital requirements 0.0 0.0 0.0 0.0 0.0 Free cash flow 2.4 2.6 2.8 2.9 3.5
Present value of discrete cash flows (1) 2.1 2.1 2.0 1.9 2.0 Total present value of discrete cash flows 10.1
Present Value of Terminal Net Cash FlowFiscal 2012 net cash flow 3.5 Long-term nominal growth rate (2) 5.70%Terminal value 60.1
Present value of terminal cash flow 34.2
Valuation SummaryInterim flows value 10.1 Terminal value 34.2 Market value of invested capital 44.3$
(1) Present value discounted at WACC presented in Exhibit 14.(2) Estimated based on historical Vocational school enrollment growth since 1985 of 5.7%.
Source: Adjusted projections and weighted average cost of capital exhibits
Fiscal Years Ended December 31,

49CONFIDENTIAL© 2009 M.W. Partners. All rights reserved.
Alpha UniversityAdjusted Discounted Cash Flow Method
Present value of Discrete Net Cash Flows 2009 2010 2011 2012 2013Net Income 1.5 2.2 2.6 3.2 4.5 Plus depreciation and amortization 0.2 0.2 0.2 0.2 0.2 Plus interest expense (net of taxes) 1.1 1.0 0.9 0.7 0.6 Less capital expenditures 0.5 0.6 0.7 0.8 0.8 Less working capital requirements 0.0 0.0 0.0 0.0 0.0 Free cash flow 2.3 2.8 3.0 3.3 4.4
Present value of discrete cash flows (1) 2.1 2.2 2.1 2.1 2.5 Total present value of discrete cash flows 11.0
Present Value of Terminal Net Cash FlowFiscal 2012 net cash flow 4.4 Long-term nominal growth rate (2) 5.70%Terminal value 73.2
Present value of terminal cash flow 41.5
Valuation SummaryInterim flows value 11.0 Terminal value 41.5 Market value of invested capital 52.5$
(1) Present value discounted at WACC presented in Exhibit 14(2) Estimated based on historical Vocational school enrollment growth since 1985 of 5.7%.
Source: Adjusted projections and weighted average cost of capital exhibits
Fiscal Years Ended December 31,

50CONFIDENTIAL© 2009 M.W. Partners. All rights reserved.
Alpha UniversityInternal Rate of Return
($ in millions)
2011 2012 2013
Value of Invested Capital (after adjustments) 52.2$ 52.2$ 52.2$ EBITDA Multiple (1) 9.01x 9.01x 9.01x
Projected Value of Invested Capital in Exit Year (2) 72.2 82.5 109.3 Value of 78% Equity Stake (3) 56.3 64.4 85.2 Plus Excess Cash / (Less Remaining Debt) (4) (13.2) (11.0) 6.5 Value of Invested Equity in Exit Year 43.1$ 53.4$ 91.7$
Internal Rate of Return:
EquityInvestment IRR (by exit year)
2011 2012 2013
18.7 32.2% 30.1% 37.5%23.2 22.8% 23.1% 31.6%25.0 19.9% 20.9% 29.7%30.0 12.8% 15.5% 25.1%35.0 7.2% 11.1% 21.3%40.0 2.5% 7.5% 18.1%45.0 -1.5% 4.4% 15.3%50.0 -4.9% 1.7% 12.9%
(1) Multiple of unadjusted EBITDA of $5.8 million(2) Based on adjusted projected EBITDA of exit year(3) 2.5% dilution in original 80% equity piece due to management stock compensation program(4) Excess Cash or (Remaining Debt) after annual reductions of 80% of free cash flows
Note: IRR's calculated using a discount rate equal to the adjusted WACC of 12% and exit year equity return (calculated above)

51CONFIDENTIAL© 2009 M.W. Partners. All rights reserved.
Alpha UniversitySensitivity Analysis
IRR Calculations
($ in millions)
Base Case Scenario:
Equity Investment IRR (by exit year)
2011 2012 2013
18.7 32.2% 30.1% 37.5%23.2 22.8% 23.1% 31.6%25.0 19.9% 20.9% 29.7%30.0 12.8% 15.5% 25.1%35.0 7.2% 11.1% 21.3%40.0 2.5% 7.5% 18.1%45.0 -1.5% 4.4% 15.3%50.0 -4.9% 1.7% 12.9%
Annual Projected Revenue Sensitized at -5%:
Equity Investment IRR (by exit year)
2011 2012 2013
18.7 28.3% 27.8% 36.4%23.2 19.3% 20.9% 30.6%25.0 16.4% 18.7% 28.7%30.0 9.5% 13.4% 24.1%35.0 4.0% 9.2% 20.3%40.0 -0.5% 5.6% 17.1%45.0 -4.3% 2.5% 14.4%50.0
Annual Projected Revenue Sensitized at -10%:
Equity Investment IRR (by exit year)
2011 2012 2013
18.7 24.2% 25.3% 35.3%23.2 15.5% 18.6% 29.5%25.0 12.7% 16.4% 27.6%30.0 6.0% 11.3% 23.1%35.0 0.7% 7.0% 19.3%40.0 -3.7% 3.5% 16.2%45.0 -7.4% 0.5% 13.5%50.0 -10.6% -2.1% 11.1%
Annual Projected Revenue Sensitized at -15%:
Equity Investment IRR (by exit year)
2011 2012 2013
18.7 19.9% 22.7% 34.2%23.2 11.4% 16.1% 28.4%25.0 8.7% 14.0% 26.5%30.0 2.3% 8.9% 22.0%35.0 -2.8% 4.8% 18.3%40.0 -7.0% 1.4% 15.2%45.0 -10.6% -1.6% 12.5%50.0 -13.7% -4.1% 10.2%