aceh flood - world banksiteresources.worldbank.org/.../acehfloodreport_en.pdf · aceh flood ix...
TRANSCRIPT

ACEH FLOODDamage and Loss Assessment


ACEH FLOOD
Damage and Loss Assessment

iv Damage and Loss Assessment

Aceh Flood v
Table of Contents Table of Contents..........................................................................................................................................iii Acknowledgements .....................................................................................................................................vii Glossary ....................................................................................................................................................... viii Executive Summary....................................................................................................................................... ix I. THE ACEH FLOODS ..................................................................................................................................... 1
The Floods of December 2006............................................................................................................ 2 The Aceh Flood Assessment ............................................................................................................... 3 Affected Locations and People........................................................................................................... 5
II. ESTIMATIONS OF DAMAGE AND LOSSES ............................................................................................... 7
Summary of Damage and Losses from the Floods ............................................................................. 8 Affected Sectors ................................................................................................................................. 9 Infrastructure and Housing .............................................................................................................. 10 Productive Sector ............................................................................................................................. 11 Social Sector ..................................................................................................................................... 13 Government Sector .......................................................................................................................... 14
III. IMPACT BY DISTRICT.............................................................................................................................. 15
Geographic Spread of Damage and Losses ...................................................................................... 16 Aceh Tamiang ................................................................................................................................... 16 Aceh Utara........................................................................................................................................ 19 Aceh Timur ....................................................................................................................................... 20 Gayo Lues ......................................................................................................................................... 21 Bireuen ............................................................................................................................................. 23 Bener Meriah.................................................................................................................................... 24 Aceh Tengah ..................................................................................................................................... 26 Concentration of Impacts................................................................................................................. 27
IV. CONCLUSIONS AND RECOMMENDATIONS.......................................................................................... 31
Conclusions....................................................................................................................................... 32 Recommendations............................................................................................................................ 32
ANNEXES...................................................................................................................................................... 35
List of Boxes
Box 1. The Kecamatan Development Program (Kdp) in Aceh ........................................................................ 3 Box 2. Estimation of Damage and Losses ....................................................................................................... 8 Box A1: Damage Data Collected ................................................................................................................... 36 Box A2: Estimate of Losses ........................................................................................................................... 38

vi Damage and Loss Assessment
List of Tables
Table 1. Number of Affected Sub‐Districts and Villages – By District............................................................. 5 Table 2: Deaths, Injuries and Affected Population – By District..................................................................... 6 Table 3: Damage and Losses – Key Items By Sector ....................................................................................... 9 Table 4: Infrastructure and Housing Sector Damage and Losses – By Sub‐Sector ...................................... 10 Table 5: Productive Sector Damage and Losses – By Sub‐Sector ................................................................ 12 Table 6: Social Sector Damage and Losses – By Sub‐Sector ........................................................................ 13 Table 7: Key Damage and Losses – Aceh Tamiang ....................................................................................... 17 Table 8: Damage and Losses for Five Most Affected Sub‐Districts – Aceh Tamiang .................................... 17 Table 9: Key Damage and Losses – Aceh Utara ............................................................................................ 19 Table 10: Damage and Losses for Five Most Affected Sub‐Districts – Aceh Utara....................................... 19 Table 11: Key Damage and Losses – Aceh Timur.......................................................................................... 20 Table 12: Damage and Losses for All Six Affected Sub‐Districts – Aceh Timur............................................. 21 Table 13: Key Damage and Losses – Gayo Lues............................................................................................ 22 Table 14: Key Damage and Losses – Bireuen................................................................................................ 23 Table 15: Damage and Losses for All Six Affected Sub‐Districts – Bireuen .................................................. 23 Table 16: Key Damage and Losses – Bener Meriah ...................................................................................... 25 Table 17: Damage and Losses for All Four Affected Sub‐Districts – Bener Meriah ...................................... 25 Table 18: Key Damage and Losses – Aceh Tengah ....................................................................................... 26 Table 19: Sub‐District Damage Intensity ...................................................................................................... 27 Table 20: Damage and Losses for Ten Most Affected Sub‐Districts ............................................................. 27 Table 21: Sub‐District Damage Intensity – By District .................................................................................. 28 Table 22: Village Damage Averages.............................................................................................................. 28 Table 23: Village Damage Intensity – By District .......................................................................................... 28 Table 24. Damage and Losses for Ten Most Affected Villages ..................................................................... 29 List of Figures
Figure 1: Productive Age of Affected Population ........................................................................................... 6 Figure 2: Occupation of Affected Population ................................................................................................. 6 Figure 3: International Comparison of Damage and Losses .......................................................................... 8 Figure 4: Damage and Losses – By Sector ...................................................................................................... 9 Figure 5: Infrastructure and Housing Sector Damage and Losses –% Sub‐Sector........................................ 10 Figure 6: Number of Houses Damaged ‐ By District ..................................................................................... 10 Figure 7: Productive Sector Damage and Losses – % Sub‐Sector ................................................................ 12 Figure 8: Agricultural Field Damage (Hectares) – By District........................................................................ 12 Figure 9: Social Sector Damage and Losses – Sub‐Sector%......................................................................... 13 Figure 10: Damage and Losses – By District ................................................................................................ 16 List of Map
Map 1. Provincial Map of Affected Locations................................................................................................. 2 Map 2: Affected Sub‐District in Aceh Tamiang............................................................................................. 18 Map 3: Affected Sub‐Districts in Aceh Utara................................................................................................ 19 Map 4: Affected Sub‐Districts in Aceh Timur ............................................................................................... 21 Map 5: Affected Sub‐Districts in Gayo Lues ................................................................................................. 22 Map 6: Affected Sub‐Districts in Bireuen ..................................................................................................... 24 Map 7: Affected Sub‐Districts in Bener Meriah............................................................................................ 25 Map 8: Affected Sub‐Districts in Aceh Tengah ............................................................................................. 26
Aceh Flood vii
ACKNOWLEDGEMENTS
The Aceh Flood Assessment is a joint product of the Government of Indonesia’s Kecamatan Development Program and the World Bank, and was undertaken at the request of the Aceh Flood Coordinator (then the acting District Head of Aceh Utara) and Satkorlak (the Provincial Coordinating Body for Disaster Management).
The report was led by a core team consisting of: Patrick Barron, Samuel Clark, Muslahuddin Daud, Ahmad Zaki Fahmi, Yustina Hasibuan and Ambar Mawardi (World Bank), and M. Rusli (KDP).
The assessment could not have been completed without the dedicated contribution of the following individuals:
KDP team in Aceh: Ramli (from the KDP Regional Management Unit). Thanks also to the tireless work of KMKabs (District Management Consultants), FKs (Kecamatan Facilitators) and FDs (Village Facilitators) in Aceh Tamiang, Aceh Tengah, Aceh Timur, Aceh Utara, Bener Meriah, Bireuen, and Gayo Lues.
Government: Teuku Pribadi (former acting District Head of Aceh Utara), Sarwono (Head of Satkorlak) and Richard Gnagey (PMD).
World Bank: Magda Adriani, Nyak Anwar, Victor Bottini, Cut Dian, Ratnasari Dewi, Wolfgang Fengler, Joel Hellman, Mustafa Imbrahim, Ismail, Zejd Muhammad, Teuku Umar, Sri Wahyuni, and Susan Wong.
Other agencies: Satoko Nakagawa, Jorg Meier, Enayat Madani, and Andre Therik (UNORC), and James Bean and Tarun Kumar Mallick (IOM).
For more information, contact:

viii Damage and Loss Assessment
GLOSSARY APBN National State Budget
Balai Desa Community Hall
Bengkel Mechanics or Auto‐Repair Garage
Bupati District Head
BPS National Statistics Office
BRR Aceh Reconstruction and Rehabilitation Agency
CDD Community‐Driven Development
FD KDP Village Facilitator
FK KDP Kecamatan Facilitator
Ha Hectares
HH Household
Kabupaten District
KDP Kecamatan Development Program
Kecamatan Sub‐district
Km Kilometres
KMKab KDP District Management Consultant
MCK Public Toilet Block
Meunasah Prayer House
Podes Village Potential Survey
Rp. Rupiah, Indonesian currency (USD$1 = Rp. 9,000)
Satkorlak Provincial Coordinating Body for Disaster Management
UNORC Office of the United Nations Recovery Coordinator for Aceh and Nias

Aceh Flood ix
EXECUTIVE SUMMARY
In late December 2006, widespread flooding struck eastern and central Aceh and parts of neighboring North Sumatra province. Seven Acehnese districts were affected: Aceh Tamiang, Aceh Timur, Bireuen and Aceh Utara on the east coast; and Aceh Tengah, Bener Meriah and Gayo Lues in the highlands.
Government requested that a damage assessment be carried out in affected areas to assess the damage and to better design post‐emergency assistance. The survey was carried out through the network of the Kecamatan Development Program (KDP) from December 30 – January 19 in affected villages.
THE ACEH FLOODS
The assessment indicates that 757 villages in 46 sub‐districts in seven Acehnese districts were affected. In Aceh Tamiang and Aceh Utara almost every sub‐district and village was affected; in the other five districts a smaller percentage of sub‐districts and villages were affected.
The floods affected over half a million people, but fortunately deaths and injuries were relatively low. 512,879 people live in affected villages. The survey indicated that there were 47 deaths and 8,460 injuries (1.5% of affected population). The poor make up 27% of flood‐affected households.
ESTIMATION OF DAMAGE AND LOSSES
The total damage and losses caused by the flood are estimated at US$ 210 million or Rp. 1.9 trillion. Damage constitute a greater share of the total: US$ 198 million (or Rp. 1.78 trillion or 94%), compared to the US$ 12 million (Rp. 110 billion) in losses, although this in part is due to limited available data on losses. Private damage and losses far outweighed public damage and losses, accounting for 70% of the total.
Damage and losses from the flood are concentrated in two main sectors: infrastructure and housing and the productive sector. Damage and losses in the former amounts to Rp. 1.33 trillion ($148 million), or 71% of total damage and losses. In the productive sector, damage and losses are estimated at Rp. 418 billion ($46 million), or 22%.
A total of 4,412 homes require replacement, 13,124 were heavily damaged, and 24,874 were lightly damaged. Overall, housing damage and losses account for US$ 105 million (Rp. 952 billion), 51% of the total from the floods.
The agricultural sector was particularly hard‐hit. The survey indicates that a total of 2,353ha of agricultural land require rehabilitation, 14,440ha were heavily damaged, and 7,610ha were lightly damaged. Rehabilitating the productive sector will be crucial for facilitating the return to “normal” social and economic living conditions.

x Damage and Loss Assessment
IMPACTS BY DISTRICT
Over 75% of damage and losses were concentrated in two districts: Aceh Tamiang and Aceh Utara. These two districts sustained damage and losses totalling Rp. 1 trillion ($115 million) and Rp. 515 billion ($57 million) respectively. The least affected district was Aceh Tengah with Rp. 6.9 billion of impacts ($769,189).
Some sub‐districts were more affected than others. Total damage and losses for sub‐districts range from a high of Rp. 118 billion ($13 million) for Banda Pusaka in Aceh Tamiang, to a low of Rp. 99 million ($11,107) for Dewantara, Aceh Utara. Indeed, the ten most affected sub‐districts account for approximately 58% of total damage and losses across the province, or Rp. 1 trillion ($121 million).
There is also significant variation in damage and losses per village within and across districts. Calculated at the sub‐district level, village averages range from a high of Rp. 23 billion ($2.5 million) per village in Tenggulan sub‐district, in Aceh Tamaing, to a low of Rp. 96 million ($10,720) per village in Nisam, in Aceh Utara. The ten most affected villages account for 16% of damage and losses across the province, or Rp. 407 billion ($34 million). All these villages are located in the ten most affected sub‐districts, which are located in Aceh Tamiang, Aceh Utara and Aceh Timur.
RECOMMENDATIONS
Expand Existing Tsunami Programs. Many existing programs cover key sectors affected by the flood, particularly housing, agriculture, roads, schools and health.
Target Funds Locally. The massive variation in impacts suggests that funds should be allocated at the sub‐district or village level.
Utilize Community‐Driven Development Mechanisms. The types of damage vary considerably between areas. Adopting a community‐based approach can help match funding to diverse community needs and can increase community ownership.
Manage Expectations and Complaints. The tsunami reconstruction process highlights the importance of managing expectations and responding to complaints when they occur.

Aceh Flood 1
I. THE ACEH FLOODS ”The flood came while I was preparing for my daughter’s wedding party. One cow was already cooked and it started floating in the water. The height of the water was almost up to the roof of our house. Fortunately my family and I were able to escape to the hill beside our village. We were lucky because the water came from the street very fast, and took only a short time to get to a very high level. But thanks to Allah, nobody from this village died.
I trade in my kiosk everyday and also sell fried bananas. But because of the flood, everything is gone. During the flood I was given only rice and instant noodles to survive. In the past month, I have begun to trade again because others in my family have given me assistance.”
Halimatussa’diah 55 year‐old widow
Bukit Rata village, Sub‐district Kejuruan Muda, Aceh Tamiang

2 Damage and Loss Assessment
The Floods of December 2006 In late December 2006, widespread flooding hit eastern and central Aceh and parts of neighboring North Sumatra province. Heavy rains caused rivers to burst their banks. Deforestation caused by widespread logging—much of it illegal—contributed to the problem. Seven Acehnese districts were affected: Aceh Tamiang, Aceh Timur, Bireuen and Aceh Utara on the east coast; and Aceh Tengah, Bener Meriah and Gayo Lues in‐land. As flood levels rose in the last week of December, hundreds of thousands of people were displaced from their homes. Aceh Tamiang, in particular, was heavily affected with a large proportion of the district under water.
Map 1. Provincial Map of Affected Locations
RESPONSE
The Government responded quickly and also requested donor and NGO assistance. A coordination team, led by Satkorlak (Provincial Coordinating Body for Disaster Management) was established and a command center was set up in Lhokseumawe. The acting district head for Aceh Utara was given

Aceh Flood 3
responsibility for coordination on the ground. Emergency supplies (rice, tents, medicine) were delivered to affected areas. The Government requested that the office of the United Nations Recovery Coordinator for Aceh and Nias (UNORC) coordinate donor assistance, in particular for Aceh Tamiang district.
The shift to longer‐term reconstruction and rehabilitation, however, has been slower. Key factors delaying this shift to a longer‐term response include resolving financing issues, delays in cleaning away mud due to the lack of heavy earth‐moving equipment, and the lack of quantitative data on the extent and whereabouts of the damage and losses. The Aceh Tamiang government in March, for example, submitted a proposal for special funding to the central government for Rp. 1.7 trillion ($190 million), covering housing, roads, and livelihoods. The central government’s response has reportedly been slow, with only commitments for the reconstruction of 1,000 houses from APBN (Anggaran Pendapatan Belanja Negara—National State Budget) confirmed as of April 24. Local and international NGOs are also still working in the affected areas. However, their activities are on a smaller scale and remain mostly focused on shorter‐term relief efforts, such as the distribution of water, food, and temporary shelter (tents). The tsunami reconstruction agency (BRR) has committed to building 125 houses in Aceh Tamiang, which, as this assessment indicates, only meets a fraction of the need.
The Aceh Flood Assessment Government requested that a damage assessment be carried out in affected areas to assess the damage and to better design post‐emergency assistance. The survey was carried out through the network of the Kecamatan Development Program (KDP), which has facilitators in every village in Aceh (see Box 1). The World Bank was asked to provide assistance in developing the survey instruments, training facilitators, and analyzing the data.
Box 1. The Kecamatan Development Program (KDP) in Aceh
KDP is a World Bank‐financed Government of Indonesia project that works in rural villages across Indonesia. Since it started in 1998, the project has covered 34,000 villages in every Indonesian province apart from Jakarta, Bengkulu and Bangka Belitung. KDP provides block grants to the local level that are used for small projects that accord with the wishes of communities. Meetings are held at the village level to develop proposals (for small‐infrastructure, irrigation, health and education projects, economic activities, etc.). These proposals are prioritized at the sub‐district level at a meeting of representatives from each village. Communities make all decisions on what proposals to develop, which should be financed, and how implementation is to take place. In Aceh, KDP now operates in all 5726 rural villages (most urban villages in Banda Aceh, Langsa, Sabang and Lhokseumawe are not covered by the program). KDP operated since 1998 when conflict still raged across Aceh. After the tsunami, the Government decided to scale‐up KDP from its then coverage of 1/3 of the province. Donors put large sums of money through the program for immediate tsunami relief and to aid longer‐term reconstruction. The Government also decided to use the KDP network and system to distribute almost US$ 60 million of reintegration aid to conflict victims. To manage the process, facilitators with technical engineering and social empowerment skills exist at the district and sub‐district levels. Every village has two local facilitators. These facilitators collected the information contained in the report.

4 Damage and Loss Assessment
The assessment was conducted in all affected villages and utilized local knowledge for assessing impacts. Immediately after the flooding started, district meetings of KDP facilitators were held to map out which sub‐districts and villages had been impacted. Data was collected primarily by the KDP village facilitators. Each filled out a summary form for their village. In completing the formats, facilitators toured the affected areas in their villages, recording information on levels and extent of damage. They also spoke with others in the village, including victims and village leaders, to get more accurate estimates of damage. In some areas, they had to wait for the floods to subside before they could collect accurate data. Technical facilitators at the sub‐district and district level then verified forms. The latter facilitators are all experienced civil engineers and were able to correct any local mistakes. The World Bank team entered and cleaned the data, cross‐checked a sample of forms, and followed‐up with facilitators where entered values appeared to be inaccurate.
Full village surveys were conducted from December 30 – January 19 in affected villages. The survey thus captures the impacts of the floods in the two‐three weeks following the disaster. Because the forms were at the village level, the survey may miss damage associated with the flood at higher administrative levels.
The survey was able to take place quickly because the KDP facilitators had in previous months conducted a similar exercise to estimate infrastructure damage from the tsunami, conflict and poor maintenance. The 2006 KDP Aceh Village Survey was conducted in every village in Aceh and collected data on infrastructure and social aspects.1 The Flood Assessment survey instruments are a simplified version of those used earlier—hence they had already been piloted and amended. Little training was needed for local KDP facilitators because they already had experience doing damage assessments in the previous survey. This helped ensure that the survey could be launched quickly and that data was relatively accurate. For a longer description of the methodology and a copy of the survey instrument, see Annexes A and B respectively.
This report provides a summary of data collected in the flood assessment. Data was initially provided to local government at the end of February and was presented to international agencies active in flood relief and reconstruction in a UNORC seminar on March 15, 2007. The report provides information on:
Affected locations and people (the rest of this section); Estimates of damage and losses (Section II); Impacts by district (Section III)
It finishes with Conclusions and Recommendations (Section IV). Data break‐downs are annexed, as in an explanation of the methodology and assumptions used for generating cost estimates.2
1 Ministry of Home Affairs, Kecamatan Development Program, World Bank (2007), 2006 Village Survey in Aceh: An Assessment of Village Infrastructure and Social Conditions (Banda Aceh and Jakarta). 2 Complete data reports for the 757 affected villages (totalling 2,271 pages) are available in softcopy, as is the database. Please contact Ambar Mawardi ([email protected]), Samuel Clark ([email protected]), or Patrick Barron ([email protected]).

Aceh Flood 5
Affected Locations and People
AFFECTED LOCATIONS
The floods affected 757 villages in 46 sub‐districts in seven Acehnese districts. In Aceh Tamiang and Aceh Utara almost every sub‐district and village was affected; in the other five districts a smaller percentage of sub‐districts and villages were affected. Table 1 shows the number of sub‐districts and villages affected in each district, and makes a comparison with the rapid Inter‐Agency Assessment completed in early January 2007.3 Annex D provides more detailed lists of affected locations.
Table 1. Number of Affected Sub‐districts and Villages – by District
Aceh Flood Assessment Inter‐Agency Assessment Affected District Number of Affected Sub‐districts
(% of those in districts) Number of Affected Villages
(% of those in districts) Number of Affected Villages (%
of those in districts) Aceh Tamiang 12 (100%) 190 (90%) 126 (59%) Aceh Utara 20 (90%) 378 (44%) 381 (45%) Aceh Timur 6 (28%) 58 (12%) 71 (15%) Gayo Lues 1 (11%) 9 (11%) 22 (25%) Bireuen 2 (13%) 49 (9%) ** Bener Meriah 4 (57%) 69 (51%) * Aceh Tengah 1 (10%) 4 (2%) 6 (3%) TOTAL 46 (46%) 757 (29%) ~606 (~24%)
Sources: Aceh Flood Assessment and UNORC Inter‐Agency Assessment Report (January 2007) * Data on affected villages not provided. **The Inter‐Agency Assessment did not include Bireuen.
AFFECTED POPULATIONS
The floods affected over half a million people, but fortunately deaths and injuries were relatively low. 512,879 people live in affected villages. The survey indicated that there were 47 deaths, 7,887 heavy injuries (1.5% of affected population), and 573 light injuries. The majority of deaths occurred in Aceh Tamiang (65%), whereas most injuries occurred in Aceh Tamiang and Aceh Utara (44% and 48% respectively). Table 2 summarizes deaths, injuries (heavy and light), and the affected population for the seven affected districts.4
Of those affected by the floods, 39% (201,991 persons) are of productive age and the majority (126,251) are farmers. Given that the floods damaged over 50% of both fields and gardens in affected areas, the livelihoods of the vast majority of those affected has been seriously disrupted.
The poor make up 27% of flood‐affected households.5 The impacts of the flood on this group will likely be greater than for others, as they do not have the same social and economic safety nets as the
3 There are number of a discrepancies in affected locations between the KDP survey and the UNORC Inter‐Agency Assessment Report distributed in early January 2007, although the figures are comparable. See discussion in the methodology annex. 4 Out of 730 (of 757) villages reporting. Affected population is calculated based on total population in affected villages. Village population data is from the 2006 Village Survey in Aceh, fielded in August‐September 2006, and complemented with PODES (2005) data. 5 Out of 535 (of 757) villages reporting. Poverty levels are from the 2006 Aceh Village Survey, fielded in August‐September 2006, and complemented with PODES (2005) data. See: Ministry of Home Affairs, Kecamatan

6 Damage and Loss Assessment
better off. Ensuring the floods do not push the poor deeper into poverty and the “near‐poor” back into poverty should be a priority of those responding to the floods.
Table 2: Deaths, Injuries and Affected Population – by District
Injuries District Deaths Heavy Light
Affected Population
Aceh Tamiang 31 3456 165 213,302 Aceh Utara 5 3783 181 187,481 Aceh Timur 7 385 45 42,120 Bener Meriah 3 7 3 34,905 Bireuen 0 189 170 29,276 Gayo Lues 1 61 9 4,652 Aceh Tengah 0 6 0 1,143 TOTAL 47 7887 573 512,879
Source: Aceh Flood Assessment
Figure 1: Productive Age of Affected Population Figure 2: Occupation of Affected Population
Source: Aceh Flood Assessment Source: Aceh Flood Assessment
Development Program, World Bank (2007), 2006 Village Survey in Aceh: An Assessment of Village Infrastructure and Social Conditions (Banda Aceh and Jakarta), p. 23.
Aceh Flood 7
II. ESTIMATIONS OF DAMAGE AND LOSSES “The flood is like a second tsunami for us. After the tsunami we never again had a normal life. We could not plant our fields because the land had a high salt degree. Also, the embankment for the irrigation system is still not working because the canal is saturated with sand after the tsunami and the flood.
The flood came about three o’clock at night. We had to flee to Lepang village. Although no‐one died, the fish embankment was destroyed, and the fields and were also victims. The community’s houses were flooded with water. So this is like a second tsunami.
Meanwhile we can only wait for west season to water our embankment, so now we are back to the sea as fisherman and breeding ducks and chickens to improve our income.”
Muriazi 38 year‐old male
Alue Angke village, Sub‐district Gandapura, Bireuen

8 Damage and Loss Assessment
Summary of Damage and Losses from the Floods AGGREGATE DAMAGE AND LOSSES
The total damage and losses caused by the flood are estimated at Rp. 1.9 trillion or US$ 210 million. Damage constitute a greater share of the total: Rp. 1.78 trillion (or US$ 198 million – 94%), compared to the Rp. 110 billion (US$ 12 million) in losses, although this in part is due to limited available data on losses.
Box 2. Estimation of Damage and Losses
The survey estimates damage and losses associated with the floods (see Annex A for a complete list of damage and losses covered by the survey). The costs of the damage associated with the floods were calculated by generating estimates for how much it would cost to replace or repair affected infrastructure. Infrastructure damage included information on the social sector, infrastructure and housing, productive sectors, and government administration. For each sub‐category of infrastructure, the number of units or meters damaged was collected. Damage was disaggregated by its degree, whether infrastructure as lightly damaged, heavily damaged, or whether it needed replacement. The value of associated losses were also calculated but are less comprehensive than for damage. Losses are indirect impacts that relate to flows that are affected by the floods, such as reduced expenditures and increased expenditures over the period of time until the assets are recovered. Insufficient data meant that these could only be calculated for a limited number of areas, in the social, infrastructure and housing and productive sectors. Unit costs were calculated using information from KDP district facilitators as well as data on costs for replacement of tsunami‐affected infrastructure. (See Annex A for a list of unit costs and assumptions).
Private damage and losses far outweighed public damage and losses, accounting for 70% of the total. This is largely due to the flood’s devastating impact on private housing and agriculture, which
account for 50% and 14% of total damage and losses, respectively.
DAMAGE AND LOSSES IN AN
INTERNATIONAL PERSPECTIVE
Although the Aceh flood was significant, it was relatively small in comparison to other recent disasters in the developing world. The KDP survey estimates the damage and losses of the Aceh flood at Rp. 1.9 trillion ($210 million). As shown in Figure 3, this is far less than for other disasters that have occurred in the past ten years. However, given that Aceh is still rebuilding after the devastating tsunami and almost 30 years of conflict, it is a serious setback for those affected and the province as a whole.
Figure 3: International Comparison of Damage and Losses
Source: Bappenas, Provincial and Local Governments of D.I.Yogyakarta and Central Java and International Partners (July 2006). Preliminary Damage and Loss Assessment: Yogyakarta and Central Java Natural Disaster.

Aceh Flood 9
Affected Sectors
Damage and losses from the flood are concentrated in two main sectors: infrastructure and housing, and the productive sector. Damage and losses in the infrastructure and housing sector amounted to Rp. 1.33 trillion ($148 million, or 71% of all damage and losses) – see Figure 4. In the productive sector, damage and losses are estimated at to Rp. 418 billion ($46 million – 22%). Although the social sector was relatively unscathed, the disaster had a significant societal impact, affecting living conditions, livelihoods, as well as health clinics and places of worship.
The flood affected all types of structures and belongings, but particularly houses, roads, mosques and prayer houses, and agricultural fields (see Table 3). In terms of cost, the most affected items were houses (50% of all damage and losses), roads/paths6 (13%), agricultural fields (10%), and mosques and prayer houses (5%). The following sections provide more detailed information for each of the four sectors, including provincial totals for key items affected in both unit and monetary terms.
Table 3: Damage and Losses – Key Items by sector
Sector ‐ Key items Units Damaged Monetary Damage & Losses Replace Heavy Light Rupiah (Rp.) USD ($) Social All Schools 7 37 141 123 34,828,800,000 3,869,867
All Health Posts 8 54 87 126 10,116,350,000 1,124,039 Mosques & Prayer Houses 97 254 426 87,570,000,000 9,730,000 Infrastructure & Housing Houses 4,414 12,995 24,837 946,209,696,000 105,134,411 All Roads/Paths 138km 1,658km 1,004km 237,307,884,000 26,367,543 All Bridges 379 457 279 64,441,400,000 7,160,156 Public Toilet Blocks (MCK) 173 292 275 18,232,200,000 2,025,800 Productive All Fields 2,353ha 14,440ha 7,610ha 180,289,917,057 20,032,213 All Plantations/Orchards 531ha 20,631ha 12,100ha 44,463,729,414 4,940,414 Fish Ponds 193ha 2,707ha 2,115ha 47,181,653,120 5,242,406 Village Markets 10 13 20 5,787,000,000 643,000 Shops 117 267 791 54,011,700,000 6,001,300 Government
Village Buildings 9 48 69 92 9,120,000,000 1,013,333
Source: Aceh Flood Assessment
6 This includes 9 types: district roads, paved village roads, dirt village roads, paved hamlet roads, dirt hamlet roads, paved footpaths, dirt footpaths, paved orchard roads, and dirt orchard roads. 7 Includes kindergartens (TK). 8 Includes post‐natal clinics (posyandu). 9 Includes village offices and community halls (balai desa).
Figure 4: Damage and Losses – by Sector
Source: Aceh Flood Assessment

10 Damage and Loss Assessment
Infrastructure and Housing Total damage and losses in the infrastructure and housing sector amount to Rp. 1.3 trillion or US$ 147 million. The vast majority of this is impacts on private housing and on transportation. Over 70% of damage and losses are concentrated in the infrastructure and housing sector, with housing and transportation accounting for 71% and 24% respectively (Figure 5). Indeed, housing and transportation respectively account for 51% and 17% of total damage and losses. Energy supply and water and sanitation were less affected. Table 4 summarizes the total monetary damage and losses for the housing and infrastructure as a whole as well as for the four sub‐sectors.
HOUSING
Housing damage and losses account for Rp. 952 billion ($105 million) or 51% total damage and losses. The assessment indicates that a total of 4,412 homes require replacement, 13,124 were heavily damaged, and 24,874 were lightly damaged.
The vast majority of housing damage was sustained in Aceh Tamiang. A total of 26,636 units (62%) or Rp. 633 billion ($70 million) of the houses damaged are in Aceh Tamiang (see Figure 6). The sheer strength of the flood in Aceh Tamiang meant that 3,093 require replacement, over 70% of the total number of homes that need to be replaced from the Aceh floods. Aceh Utara was the second most affected in monetary terms, although far fewer houses require replacement.
Table 4: Infrastructure and Housing Sector Damage and Losses – by sub‐sector
Sub‐sector Damage (Rp.) Losses (Rp.) Sub‐sector Totals (Rp. / US$) Housing 846,941,920,000 105,158,900,000 952,100,820,000 ($105,788,980) Transportation 316,839,484,000 0 316,839,484,000 ($35,204,387) Energy 1,808,553,000 0 1,808,553,000 ($200,950) Water and Sanitation 61,182,240,000 0 61,182,240,000 ($6,798,027) Total 1,226,772,197,000 ($36,308,022) 105,158,900,000 ($11,684,322) 1,331,931,097,000 ($147,992,344)
Source: Aceh Flood Assessment
Figure 5: Infrastructure and Housing Sector Damage and Losses –% sub‐sector
Source: Aceh Flood Assessment
Figure 6: Number of Houses Damaged ‐ by District
Source: Aceh Flood Assessment

Aceh Flood 11
TRANSPORTATION
The flood also caused significant damage to the transportation sector amounting to Rp. 316 billion ($35 million) or 25% of infrastructure costs. This largely consists of damage to roads and bridges, the former accounting for Rp. 237 billion (US$ 26 million), the latter Rp. 64 billion (US$ 7 million). Damage to transportation infrastructure has high negative impacts on local economies, restricting access to markets and driving up local prices of imported goods.
ENERGY
The energy sub‐sector was less affected, accounting for only 1.8 billion ($200,000). This low figure may, however, underestimate the total damage to the energy sector given that the survey focused on village‐level damage. The survey indicates that the flood has not had a significant impact on electricity access at the village‐level, although it may be necessary for the state electricity company (PLN) to conduct its own survey, given gaps in the survey for larger‐scale energy infrastructure.
WATER AND SANITATION
Damage in the water and sanitation sub‐sector is quite significant, accounting for Rp. 61 billion (US$ 6.7 million) or almost 5% of damage in the infrastructure sector. The assessment indicates that 4,042 wells were destroyed, 10,903 were heavily damaged, and 11,348 were lightly damaged. In addition, 173 public toilet blocks were destroyed, 292 heavily damaged, and 275 lightly damaged. Again, the majority of this damage occurred in Aceh Tamiang and Aceh Utara.10
Productive Sector Total damage and losses in the productive sector amounted to Rp. 417 billion or US$ 46 million, accounting for 22% of total damage and losses. As shown in Table 5 and Figure 7, damage and losses were spread across four sub‐sectors: agricultural, fisheries, trade, and enterprises. Rehabilitating the productive sector, particularly the agricultural sub‐sector, will be crucial for facilitating the return to “normal” social and economic living conditions. The majority, almost 60%, of those affected are farmers. There are also significant numbers of affected labourers, whose livelihoods are often connected to agricultural activities, as well as traders.
AGRICULTURE
Damage to the agricultural sub‐sector accounts for the vast majority (71%) of damage in the productive sector. Table 5 indicates that the agricultural sub‐sector sustained damage totalling Rp. 335 billion or US$ 37 million. This largely consists of damage to all types of agricultural fields. The survey indicates that a total of 2,353ha require replacement, 14,440ha were heavily damaged, and 7,610ha were lightly damaged.
As with housing damage, the majority of agricultural damage occurred in Aceh Tamiang. Figure 8 shows that damage to agricultural fields were concentrated in Aceh Tamiang (Rp. 100 billion, US$ 11 million), with Aceh Utara also greatly impacted (Rp. 52 billion, US$ 5.5 million). The total damaged area affected in these two districts is relatively similar: 12,421ha in Aceh Tamiang and 8,135ha in Aceh Utara. However, the costs are much higher in Aceh Tamiang due to the larger area requiring replacement (as opposed to heavy or light damage).
10 Annexes E and F, respectively, provide a more complete summary of damage and losses in the water and sanitation sub‐sector at the provincial and district level.

12 Damage and Loss Assessment
Table 5: Productive Sector Damage and Losses – by sub‐sector
Sub‐sector Damage (Rp.) Losses (Rp.) Sub‐sector Totals (Rp.) Agriculture 335,138,989,591 0 335,138,989,591 ($37,237,666) Fishery 7,470,000,000 0 7,470,000,000 ($830,000) Trade 58,885,000,000 913,700,000 59,798,700,000 ($6,542,778) Enterprises 15,040,000,000 306,600,000 15,346,600,000 ($1,705,178) Total 416,533,989,591 ($46,281,554) 1,220,300,000 ($135,589) 417,754,289,591 ($46,417,143)
Source: Aceh Flood Assessment
Figure 7: Productive Sector Damage and Losses – % sub‐sector
Figure 8: Agricultural Field Damage (hectares) – by District
Source: Aceh Flood Assessment
Source: Aceh Flood Assessment
TRADE
The second most affected sub‐sector was trade, accounting for damage and losses totalling Rp. 60 billion (US$ 6.5 million) or 14% of productive sector damage and losses. Shops in Aceh Tamiang and Aceh Utara sustained most of the damage and losses; the former accounts for 48% of shops damaged (571 units), the latter 39% (468 units), a total of 87% of shop damage (or 1,039 of 1,175 impacted shops). Village markets were also substantially affected.
ENTERPRISES
Damage and losses to the enterprises sub‐sector amounted to Rp. 15 billion (US$1.7 million) or 4% of productive sector damage and losses. However, these figures are likely to underestimate the extent of damage due to the fact that the assessment was limited to collecting data on bengkel (mechanic or auto‐repair garages), one of the most common enterprises at the village‐level. The assessment indicates that seventeen bengkel were destroyed, 126 heavily damaged, and 152 lightly damaged.

Aceh Flood 13
FISHERIES
The fisheries sub‐sector sustained damage and losses totalling Rp. 7 billion or US$ 830,000, which constitutes only 2% of total damage and losses in the productive sector. Indeed, the affected population profile in the earlier chapter indicated that only 4,838 fishermen, compared to 126,251 farmers, were affected. It should be noted, however, that fish ponds, which sustained damage totalling 47 billion (US$ 5.2 million), were not included in the fisheries sub‐sector, but, rather, as a form of agriculture.
Social Sector Damage and losses in the social sector were primarily related to damaged mosques, prayer houses and community centers. Total damage and losses in the social sector amounted Rp. 136 billion (US$ 15 million). Table 6 and Figure 9 indicate that the community, culture and religious sub‐sector accounted for 65% of damage and losses in this sector, reflecting the existence of mosques and/or prayer houses and the absence of schools and/or health posts in many villages.
Figure 9: Social Sector Damage and Losses – Sub‐Sector%
Table 6: Social Sector Damage and Losses – by sub‐sector
Source: Aceh Flood Assessment
Sub‐sector Damage (Rp.) Losses (Rp.) Total (Rp.) / $ Education 34,800,000,000 28,800,000 34,828,800,000
($3,869,867) Health 10,102,600,000 4,006,850,000 14,109,450,000
($1,567,717) Community, Culture and Religion
87,570,000,000 0 87,570,000,000 ($9,370,000)
Total 136,508,250,000 ($15,167,583)
Source: Aceh Flood Assessment
COMMUNITY, CULTURE AND RELIGION
Damage and losses in the community, culture and religion sub‐sector amounted to Rp. 87 billion (US$ 9.3 million), or 64% of the social sector damage and losses. In total, 97 mosques and prayer houses require replacement, 254 are heavily damaged, and 426 lightly damaged. Again, these damage were largely sustained in Aceh Utara and Aceh Tamiang. The former accounts for 183 places of worship (47%), the latter for 163 (41%).
EDUCATION
The education sub‐sector accounts for 25% of damage and losses in the social sector, at a total cost of Rp. 34 billion (US$ 3.9 million). Again, over 60% of this damage, in terms of total units damaged, occurred in Aceh Tamiang. The assessment indicates that in this district fourteen schools were destroyed, 70 were heavily damaged, and 71 were lightly damaged.

14 Damage and Loss Assessment
HEALTH
The health sub‐sector was, according to the assessment, less affected with Rp. 14 billion, or US$ 1.6 million, worth of damage and losses. Data collected included damage to health clinics and post‐natal clinics, as well as loss estimates of the costs of cleaning these facilities and providing medical treatment for the approximately 8,460 individuals injured by the floods. In total, the assessment indicates that 54 health and post‐natal clinics were destroyed, 87 were heavily damaged, and 126 were lightly damaged.
Government Sector Damage to village government buildings amounted to Rp. 9 billion or US$ 1 million. The KDP survey methodology meant data on the government sector was limited to village government offices. In total, forty‐eight village offices require replacement, sixty‐nine were heavily damaged, and ninety‐two were lightly damaged. Again, these damage were concentrated in Aceh Tamaing and Aceh Utara. Monetarily, Rp. 3.7 billion (US$ 904,444) or 40% was sustained in the former, compared to Rp. 3 billion ($338,333) or 33% in the latter.

Aceh Flood 15
III. IMPACT BY DISTRICT “I fought between life and death to give birth to my second baby after days in pain in the middle of the floods. My condition was not normal, my first baby was born by caesararian, and everybody and my family was worried about me.
When the water started to get into the house from underneath the floor, I fled to a higher place accompanied by two midwives. I was in pain for three days and I did not sleep. The midwives had difficulties helping me because of the limited tools and medicines.
Many efforts were taken to taken to find a medical doctor to conduct the surgery but it was impossible because the roads were blocked with water and no help came. My family tried to find an alternative means of transportation such as a double‐cabin truck, rubber boats, and helicopter, but they failed. Finally after one week of waiting, my baby was born on December 26th 2006. I feel that it was a miracle because of the sincere hopes of everyone who witnessed my pain.”
Nurhadijah 33 year‐old housewife
Perkebunan village, Sub‐district Muda, Aceh Tamiang

16 Damage and Loss Assessment
Geographic Spread of Damage and Losses Over 75% of damage and losses were concentrated in two districts: Aceh Tamiang and Aceh Utara. As shown in Figure 10, the most affected districts were Aceh Tamiang and Aceh Utara with Rp. 1 trillion (56%) and Rp. 515 billion (27%) of damage and losses respectively. The least affected district was Aceh Tengah with Rp. 6.9 billion (less than 1%). Figure 10 shows the damage and losses for each district. Annex F includes detailed data reports for each district.
Figure 10: Damage and Losses – by District
Source: Aceh Flood Assessment
Aceh Tamiang Aceh Tamiang was the most affected district, accounting for 56% of damage and losses. The survey indicates that a total of 213,302 people or 45,746 households were affected in twelve sub‐districts and 190 villages. Almost the entire district was affected, with the survey indicating impact in all sub‐districts and 90% of villages (see Map 2 below). It also accounted for the majority of key structural damage, including 68% of houses, 60% of schools, 41% of health posts, 33% of roads, 56% of agricultural fields, and 57% of plantations. Table 7 summarizes the damage and losses for these key items.
Within Aceh Tamaing, the five most affected sub‐districts account for 56% of district damage and losses or Rp. 580 billion (US$ 64 million). The five sub‐districts that sustained the greatest monetary damage and losses were: Bandar Pusaka, Karang Baru, Tenggulan Kejurunan Muda, and Rantau (see Table 8). Overall, these five sub‐districts account for 30% of damage and losses across the seven districts affected by the floods. The least affected sub‐district in Aceh Tamaing, Tamiang Hulu, recorded damage and losses totalling Rp. 34 billion ($ 3.8 million), which is five times as high as the least affected district, Aceh Tengah, and almost as high as the second and third most affected districts, Bireuen and Bener Meriah. See Annex F for a summary of damage and losses for all twelve Aceh Tamiang sub‐districts.

Aceh Flood 17
Table 7: Key Damage and Losses – Aceh Tamiang
Sector ‐ Key items Units Damaged Monetary Damage & Losses Replace Heavy Light Rupiah (Rp.) USD ($) Social Schools 19 85 104 20,727,650,000 2,303,072 Health Posts 23 46 44 4,286,750,000 476,306 Mosques11 35 129 199 38,610,000,000 4,290,000 Infrastructure & Housing Houses 3,093 9,392 14,151 633,782,876,000 70,420,320 All Roads/Paths 20km 680km 223km 78,703,203,000 8,744,800 All Bridges 117 139 115 18,937,800,000 2,104,200 Public Toilet Block (MCK) 69 89 87 6,253,800,000 694,867 Productive All Fields 1,295ha 9,319ha 1,807ha 100,811,157,167 11,201,240 All Plantations/Orchards 72ha 11,912ha 7,716ha 25,376,071,034 2,819,563 Fish Ponds 113ha 1,085ha 170ha 18,405,551,500 2,045,061 Village Market 7 5 6 2,880,000,000 320,000 Shops 41 102 428 22,603,000,000 2,511,444 Government Village Offices12 48 69 92 3,780,000,000 420,000
Source: Aceh Flood Assessment
Table 8: Damage and Losses for Five Most Affected Sub‐Districts – Aceh Tamiang
No Sub‐district Damage (Rp.) Losses (Rp.) Total (Rp.) 1 Bandar Pusaka 110,043,190,267 8,495,460,000 118,538,650,267 2 Karang Baru 110,587,808,187 7,520,834,000 118,108,642,187 3 Tenggulan 107,610,678,828 8,509,940,000 116,120,618,828 4 Kejuruan Muda 105,609,302,932 9,251,216,000 114,860,518,932 5 Rantau 103,305,786,105 9,835,144,000 113,140,930,105 Total 580,769,360,319 ($64,529,929)
Source: Aceh Flood Assessment
11 Includes both Mosques and Prayers Houses (Meunasah). 12 Includes both Village Offices and Community Halls (Balai Desa).

18 Damage and Loss Assessment
Map 2: Affected Sub‐district in Aceh Tamiang

Aceh Flood 19
Aceh Utara Aceh Utara was the second most affected district sustaining 27% of provincial damage and losses. The survey indicates that a total of 187,481 people or 43,777 households were affected. As in Aceh Tamiang, almost all sub‐districts were affected (twenty sub‐districts, or 90% of the total). However, the percentage of villages affected is much lower (378 villages, 44%).
Although the damage was widespread in Aceh Utara and a greater number of villages were affected than in Aceh Tamiang, the impact was not as heavy. Aceh Utara accounts for 20% of houses, 27% of schools, 33% of health posts, 34% of roads, 29% of agricultural fields, and 11% of plantations damaged. Table 9 summarizes the damage and losses for these key items.
Table 9: Key Damage and Losses – Aceh Utara
Sector ‐ Key items Units Damaged Monetary Damage & Losses Replace Heavy Light Rupiah (Rp.) USD ($) Social Schools 10 40 64 9,275,400,000 1,030,600 Health Posts 18 23 69 3,377,850,000 375,317 Mosques 33 88 194 34,170,000,000 3,796,667 Infrastructure & Housing Houses 403 2,280 8,686 194,516,574,000 21,612,953 All Roads/Paths 96km 469km 562km 81,209,532,500 9,023,281 All Bridges 147 123 123 24,363,400,000 2,707,044 Public Toilet Block (MCK) 43 155 153 7,656,600,000 850,733 Productive All Fields 315ha 3,536ha 4,284ha 52,460,086,605 5,828,899 All Plantation/Orchards 144ha 1,665ha 2,534ha 4,971,746,483 552,416 Fish Ponds 48ha 886ha 590ha 15,337,062,720 1,704,118 Village Market 2 5 10 1,908,000,000 212,000 Shops 37 95 336 19,613,400,000 2,179,267 Government Village Office 18 19 37 3,045,000,000 338,333
Source: Aceh Flood Assessment
The five most affected sub‐districts in Aceh Utara accounted for the vast majority of district damage and losses. As indicated in Table 10, damage and losses in these sub‐districts total Rp. 369 billion (US$ 41 million), or 72% of district and 20% of provincial costs. Compared to Aceh Tamaing there was more spread, with the least affected sub‐district (Dewantara) reporting only Rp. 100 million (US$ 11,000) of impacts. Annex F provides figures for all 20 of Aceh Utara’s affected sub‐districts.
Table 10: Damage and Losses for Five Most Affected Sub‐Districts – Aceh Utara
No Sub‐district Damage (Rp.) Losses (Rp.) Total (Rp.) 1 Lhoksukon 110,462,088,620 6,839,596,000 117,301,684,620 2 Langkahan 102,201,326,623 5,069,424,000 107,270,750,623 3 Tanah Pasir 60,118,627,535 2,981,018,000 63,099,645,535 4 Tanah Luas 45,225,704,370 1,891,396,000 47,117,100,370 5 Samudera 33,561,785,361 748,906,000 34,310,691,361 Total 369,099,872,509 ($41,011,097)
Source: Aceh Flood Assessment
Map 3: Affected Sub‐districts in Aceh Utara

20 Damage and Loss Assessment
Aceh Timur Aceh Timur was the third most affected district and accounted for 20% of provincial damage and losses. A total of 42,120 people and 9,238 households were affected. Unlike Aceh Tamiang and Aceh Utara, the flood did not affect the entire district; six sub‐districts (28% of those in the district) and fifty‐eight villages (12%) were hit (see Map 4). Aceh Timur accounts for 8% of houses, 7% of schools, 11% of health posts, 14% of roads, and 9% of agricultural fields damaged in the province. Table 11 summarizes the damage and losses for these key structures.
Table 11: Key Damage and Losses – Aceh Timur
Sector ‐ Key items Units Damaged Monetary Damage & Losses Replace Heavy Light Rupiah (Rp.) USD ($) Social Schools 5 8 8 2,926,950,000 325,217 Health Posts 6 15 10 1,512,600,000 168,067 Mosques 12 17 17 6,540,000,000 726,667 Infrastructure & Housing Houses 598 1,214 1,548 90,377,040,000 10,041,893 All Roads/Paths 12km 223km 150km 32,965,412,000 3,662,824 All Bridges 50 58 27 6,772,800,000 652,533 Public Toilet Blocks (MCK) 45 23 25 2,767,800,000 307,533 Productive All Fields 572ha 626ha 958ha 14,674,994,778 10,080,747 All Plantations/Orchards 113ha 5,199ha 1,495ha 10,093,248,000 1,121,472 Fish Ponds ‐ 15ha 1,045ha 1,120,385,000 124,487 Village Markets 1 2 2 711,000,000 79,000 Shops 27 59 25 9,097,900,000 1,010,878 Government Village Buildings 4 10 10 1,050,000,000 116,667
Source: Aceh Flood Assessment

Aceh Flood 21
Damage and losses in Aceh Timur were concentrated in three sub‐districts. Pante Bidari was particularly affected, with impacts totalling Rp. 99 billion (US$ 11 million) or 53% of the district total. The total damage and losses in the three most affected sub‐districts is Rp. 168 billion or US$ 19 million.
Table 12: Damage and Losses for all Six Affected Sub‐districts – Aceh Timur
No Sub‐district Damage (Rp.) Losses (Rp.) Total (Rp.) 1 Pante Bidari 93,876,796,566 5,237,538,000 99,114,334,566 2 Simpang Ulim 33,437,124,742 1,686,328,000 35,123,452,742 3 Simpang Jernih 30,906,476,440 2,994,556,000 33,901,032,440 4 Serbajadi 14,390,250,030 423,260,000 14,813,510,030 5 Julok 4,794,350,000 122,608,000 4,916,958,000 6 Birem Bayeun 393,300,000 0 393,300,000 Total 188,262,587,778 ($20,918,065)
Source: Aceh Flood Assessment
Map 4: Affected Sub‐districts in Aceh Timur
Gayo Lues Gayo Lues was the fourth most affected district sustaining 3% of provincial damage and losses. The survey indicates that a total of 4,652 people and 1,081 households were affected. In Gayo Lues, the flood affected only one sub‐district, Pinding, and nine villages in the north‐east near the border with Aceh Tamiang and Aceh Timur (see Map 5). However, as will be elaborated upon below, the impact in this sub‐district was very high. Pinding Sub‐district accounts for 2% of all houses, 4% of
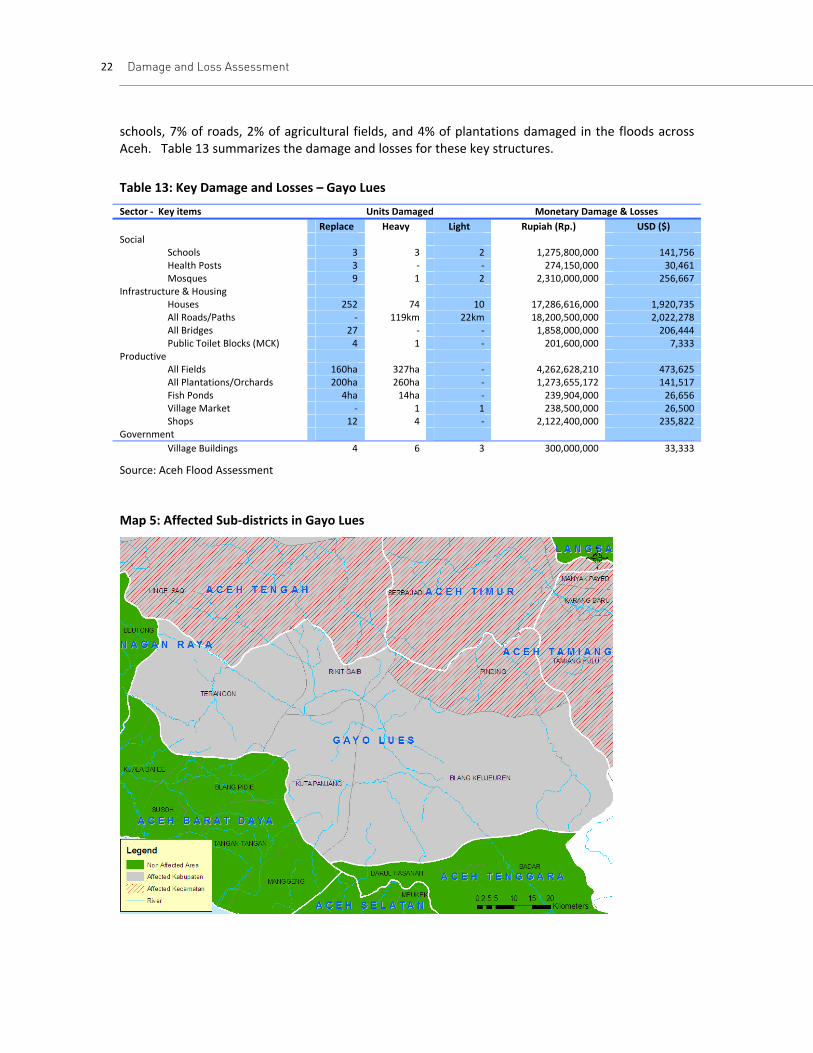
22 Damage and Loss Assessment
schools, 7% of roads, 2% of agricultural fields, and 4% of plantations damaged in the floods across Aceh. Table 13 summarizes the damage and losses for these key structures.
Table 13: Key Damage and Losses – Gayo Lues
Sector ‐ Key items Units Damaged Monetary Damage & Losses Replace Heavy Light Rupiah (Rp.) USD ($) Social Schools 3 3 2 1,275,800,000 141,756 Health Posts 3 ‐ ‐ 274,150,000 30,461 Mosques 9 1 2 2,310,000,000 256,667 Infrastructure & Housing Houses 252 74 10 17,286,616,000 1,920,735 All Roads/Paths ‐ 119km 22km 18,200,500,000 2,022,278 All Bridges 27 ‐ ‐ 1,858,000,000 206,444 Public Toilet Blocks (MCK) 4 1 ‐ 201,600,000 7,333 Productive All Fields 160ha 327ha ‐ 4,262,628,210 473,625 All Plantations/Orchards 200ha 260ha ‐ 1,273,655,172 141,517 Fish Ponds 4ha 14ha ‐ 239,904,000 26,656 Village Market ‐ 1 1 238,500,000 26,500 Shops 12 4 ‐ 2,122,400,000 235,822 Government Village Buildings 4 6 3 300,000,000 33,333
Source: Aceh Flood Assessment
Map 5: Affected Sub‐districts in Gayo Lues

Aceh Flood 23
Bireuen Bireuen was the fifth most affected district, accounting for 2% of damage and losses. The survey indicates that the flood affected a total of 29,276 people and 6,510 households in two sub‐districts and 49 villages in the eastern part of the district close to Aceh Utara (see Map 6). Bireuen accounts for just over 1% of houses, less than 1% of schools, 5% of health posts, 3% of roads, 3% of agricultural fields, and 1.5% of plantations/orchards damaged. Table 14 summarizes the damage and losses for these key structures.
The flood affected only two sub‐districts in Bireuen: Ganda Pura and Peusanagan. Ganda Pura sustained 66% of the district’s damage and losses while Peusanagan accounted for 34% (see Table 15).
Table 14: Key Damage and Losses – Bireuen
Sector ‐ Key items Units Damaged Monetary Damage & Losses Replace Heavy Light Rupiah (Rp.) USD ($) Social Schools ‐ 2 3 435,200,000 38,356 Health Posts 4 3 1 590,000,000 65,556 Mosques 3 8 6 2,040,000,000 226,667 Infrastructure & Housing Houses 50 101 423 10,966,024,000 1,218,447 All Roads/Paths 1.2km 40km 29km 6,761,027,500 751,225 All Bridges 24 15 12 3,457,200,000 384,133 Public Toilet Blocks (MCK) 4 6 3 382,200,000 42,467 Productive All Fields ‐ 315ha 525ha 5,050,382,910 561,154 All Plantations/Orchards ‐ 341ha 208ha 711,470,483 79,052 Fish Ponds 28ha 445ha 311ha 7,717,710,000 857,453 Village Market ‐ ‐ 1 49,500,000 5,500 Shops ‐ 1 2 116,600,000 12,956 Government Village Buildings 4 6 3 705,000,000 78,333
Source: Aceh Flood Assessment
Table 15: Damage and Losses for all Six Affected Sub‐districts – Bireuen
No Sub‐district Damage (Rp.) Losses (Rp.) Total (Rp. / $) 1 Ganda Pura 29,516,222,504 894,506,000 30,410,728,504 2 Peusangan 15,410,246,989 380,968,000 15,791,214,989 Total 46,201,943,493
($5,133,549) Source: Aceh Flood Assessment

24 Damage and Loss Assessment
Map 6: Affected Sub‐districts in Bireuen
Bener Meriah Bener Meriah was the sixth most affected district, also accounting for 2% of damage and losses. The survey indicates that the flood affected a total of 34,905 people or 8,199 households in four sub‐districts and sixty‐nine villages, located in the eastern half of the district (see Map 7). Bener Meriah accounts for less than 1% of houses, schools, and health posts damaged, 1% of agricultural fields, and 4% of plantations, and 7% of roads. Table 16 summarizes the damage and losses for these key items.
In Bener Meriah the majority of damage and losses were recorded in two sub‐districts: Syiah Utama and Bukit. Table 16 shows that these two sub‐districts account for 82% of damage and losses, or Rp. 37 billion (US$ 4.1 million). The two less affected sub‐districts experienced damage and losses totalling only Rp. 7.8 billion (US$ 872,051).

Aceh Flood 25
Table 16: Key Damage and Losses – Bener Meriah
Sector ‐ Key items Units Damaged Monetary Damage & Losses Replace Heavy Light Rupiah (Rp.) USD ($) Social Schools ‐ 3 ‐ 180,000,000 20,000 Health Posts ‐ ‐ ‐ 0 0 Mosques 4 10 2 3,450,000,000 383,333 Infrastructure & Housing Houses 12 43 13 2,169,588,000 241,065 All Roads/Paths 91km 35km 5.6km 18,577,297,000 2,064,144 All Bridges 8 119 ‐ 7,682,600,000 853,622 Public Toilet Block (MCK) 8 18 6 966,000,000 107,333 Productive All Fields ‐ 266ha 8ha 2,361,075,893 262,342 All Plantations/Orchards ‐ 1,136ha 124ha 1,986,927,207 262,342 Fish Ponds ‐ 261 ‐ 4,345,011,300 482,779 Village Market ‐ ‐ ‐ 0 0 Shops ‐ 6 ‐ 458,400,000 50,933 Government Village Office ‐ 4 ‐ 240,000,000 26,667 Source: Aceh Flood Assessment
Table 17: Damage and Losses for all Four Affected Sub‐districts – Bener Meriah
No Sub‐district Damage (Rp.) Losses (Rp.) Total (Rp.) 1 Syiah Utama 26,109,518,391 114,462,000 26,223,980,391 2 Bukit 10,626,616,219 46,972,000 10,673,588,219 3 Bandar 4,262,332,834 4,106,000 4,266,438,834 4 Permata 3,478,773,955 103,248,000 3,582,021,955 Total 44,746,029,399 ($4,971,781) Source: Aceh Flood Assessment
Map 7: Affected Sub‐districts in Bener Meriah

26 Damage and Loss Assessment
Aceh Tengah
Aceh Tengah was the least affected district, accounting for less than 1% of damage and losses. The survey indicates that a total of 1,143 people and 258 households in one sub‐district (Linge) and four villages were affected (see Map 8). Aceh Tengah accounts for less than 1% of houses, schools, health posts, roads, agricultural fields, and plantations/orchards damaged. Table 18 summarises the damage and losses for these key structures.
Table 18: Key Damage and Losses – Aceh Tengah
Sector ‐ Key items Units Damaged Monetary Damage & Losses Replace Heavy Light Rupiah (Rp.) USD ($) Social Schools ‐ ‐ 2 90,100,000 10,011 Health Posts ‐ ‐ 2 67,200,000 7,478 Mosques 1 1 6 450,000,000 50,000 Infrastructure & Housing Houses 4 20 43 1,346,582,000 149,620 All Roads/Paths 2.2km 3.8km 9.3km 1,521,632,000 169,070 All Bridges 6 3 ‐ 1,329,600,000 147,733 Public Toilet Blocks (MCK) ‐ ‐ 1 4,200,000 467 Productive All Fields 11ha 52ha 28ha 669,591,495 74,399 All Plantations/Orchards 2ha 17ha 23ha 50,611,034 5,623 Fish Ponds ‐ 1ha ‐ 16,660,000 1,851 Village Market ‐ ‐ ‐ ‐ ‐ Shops ‐ ‐ ‐ ‐ ‐ Government Village Buildings ‐ ‐ ‐ ‐ ‐ Source: Aceh Flood Assessment
Map 8: Affected Sub‐districts in Aceh Tengah

Aceh Flood 27
Concentration of Impacts
SUB-DISTRICT AVERAGES
The flood did not affect all sub‐districts to the same extent. Sub‐district damage and losses range from a high of Rp. 118 billion (US$ 13 million) for Banda Pusaka in Aceh Tamiang, to a low of Rp. 99 million (US$ 11,107) for Dewantara in Aceh Utara. Table 19 categorizes affected sub‐districts into four levels of impact. There are nine sub‐districts with very high damage, twelve with high levels of impact, nine with medium impact, and sixteen with low damage. Annex F lists total damage and losses for each sub‐district.
The ten most affected sub‐districts account for approximately 58% of total damage and losses across the province. As shown in Table 20, damage and losses in the ten most affected sub‐districts amount to Rp. 1 trillion (US$ 121 million). These highly affected sub‐districts are mostly in Aceh Tamiang, where seven of the ten are located, whereas Aceh Utara has two and Aceh Timur has one. Reconstruction programs must target these highly affected sub‐districts.
Impact levels vary within each district. For example, in Aceh Timur there is one very high, two high, one medium, and two low affected sub‐districts (Table 21). This has significant implications for any reconstruction policy, suggesting the need for targeting below the district level.
Table 19: Sub‐district Damage Intensity
Impact Category Range Number of Sub‐districts Very High Rp. 90+ billion (~$10 million+) 10 High Rp. 30 – 89 billion (~$5.5 – 11 million) 12 Medium Rp. 10 – 29 billion (~$3 – 5.5 million) 9 Low < Rp. 10 billion (< $1 million) 15
Table 20: Damage and Losses for Ten Most Affected Sub‐districts
No Sub‐district District Damage (Rp.) Losses (Rp) Total (Rp. / $) 1 Bandar Pusaka Aceh Tamiang 110,043,190,267 8,495,460,000 118,538,650,267 2 Karang Baru Aceh Tamiang 110,587,808,187 7,520,834,000 118,108,642,187 3 Lhoksukon Aceh Utara 110,462,088,620 6,839,596,000 117,301,684,620 4 Tenggulan Aceh Tamiang 107,610,678,828 8,509,940,000 116,120,618,828 5 Kejuruan Muda Aceh Tamiang 105,609,302,932 9,251,216,000 114,860,518,932 6 Rantau Aceh Tamiang 103,305,786,105 9,835,144,000 113,140,930,105 7 Langkahan Aceh Utara 102,201,326,623 5,069,424,000 107,270,750,623 8 Pante Bidari Aceh Timur 93,876,796,566 5,237,538,000 99,114,334,566 9 Kota Kuala Simpang Aceh Tamiang 85,315,678,466 9,967,820,000 95,283,498,466 10 Bendahara Aceh Tamiang 86,896,207,215 5,375,126,000 92,271,333,215 Total 1,092,010,961,809 ($121,334,551) Source: Aceh Flood Assessment

28 Damage and Loss Assessment
Table 21: Sub‐District Damage Intensity – by District
Damage and Losses District Total Sub‐districts Very High High Medium Low
Aceh Tamiang 12 7 5 ‐ ‐ Aceh Tengah 1 ‐ ‐ ‐ 1 Aceh Timur 6 1 2 1 2 Aceh Utara 20 2 3 5 10 Bener Meriah 4 ‐ ‐ 2 2 Bireuen 2 ‐ 1 1 ‐ Gayo Lues 1 ‐ 1 ‐ ‐
VILLAGE AVERAGES
Village damage and losse averages also vary significantly across and within districts. Calculated at the sub‐district level, village averages range from a high of Rp. 23 billion (US$ 2.5 million) per village in Tenggulan sub‐district, Aceh Tamaing, to a low of Rp. 96 million (US$ 10,720) per village in Nisam, Aceh Utara.13
All sub‐districts with village averages categorized as very high (above Rp. 10 billion per village) are in Aceh Tamiang. There are a total of ten very high villages in Tenggulan and Kota Kuala Simpang, Aceh Tamiang, were village averages are Rp. 23 billion (US$ 2.5 million) and Rp. 19 billion (US$ 2.1 million), respectively. That said, there is also a range of sub‐district village averages across most districts. Table 23 indicates, for example, that in Aceh Timur there are thirteen high, twenty medium, and twenty‐five low affected sub‐districts.
The ten most affected villages account for Rp. 407 billion (US$ 34 million) or 16% of damage and losses across the province. All these villages were located in the ten most affected sub‐districts (Table 24). Again, this suggests the need for a delivery mechanism capable of determining reconstruction fund allocations down to the village level.
Table 22: Village Damage Averages
Damage Category Range Number of Villages Very High Rp. 10+ billion (~$1 million+) 10 High Rp. 5 – 10 billion (~$0.5 – 1 million) 8 Medium Rp. 1 – 5 billion (~$0.1 – 0.5 million) 16 Low < Rp. 1 billion (< $100,000) 20
Table 23: Village Damage Intensity – by District
Damage and Losses District # of Sub‐districts
# of Villages Very High High Medium Low
Aceh Tamiang 12 190 10 56 124 ‐ Aceh Tengah 1 4 ‐ ‐ 4 ‐ Aceh Timur 6 58 ‐ 13 20 25 Aceh Utara 20 378 ‐ 16 145 217 Bener Meriah 4 69 ‐ ‐ 20 49 Bireuen 2 49 ‐ ‐ 11 38 Gayo Lues 1 9 ‐ 9 ‐ ‐
13 It is important to note that these village averages are calculated based on sub‐district totals, i.e. the total sub‐district damage and losses divided by the number of villages. The limitations of such an approach is that it potentially masks variation within the sub‐district.

Aceh Flood 29
Table 24. Damage and Losses for Ten Most Affected Villages
No Village Sub‐district District Damage Losses Total 1 Tenggulan Tenggulan Aceh Tamiang 70,277,851,512 5,612,300,000 75,890,151,512 2 Kota Lintang Kota Kuala Simpang Aceh Tamiang 41,957,508,034 5,201,838,000 47,159,346,034 3 Lubok Pusaka Langkahan Aceh Utara 33,676,490,799 1,706,230,000 35,382,720,799 4 Babo Bandar Pusaka Aceh Tamiang 25,620,563,790 2,062,648,000 27,683,211,790 5 Landuh Rantau Aceh Tamiang 21,371,103,448 2,818,360,000 24,189,463,448 6 Simpang Kiri Tenggulan Aceh Tamiang 20,211,655,267 1,834,154,000 22,045,809,267 7 Bukit Tempurung Kota Kuala Simpang Aceh Tamiang 17,465,430,000 2,341,430,000 19,806,860,000 8 Dalam Karang Baru Aceh Tamiang 17,599,673,793 1,456,898,000 19,056,571,793 9 Buket Linteung Tenggulan Aceh Tamiang 17,093,283,835 1,034,296,000 18,127,579,835 10 Suka Damai Pante Bidari Aceh Timur 16,912,812,069 1,256,002,000 18,168,814,069 307,510,528,547
($34,167,837) Source: Aceh Flood Assessment


Aceh Flood 31
IV. CONCLUSIONS AND RECOMMENDATIONS “Our village floods so often that we call it the “sunken village”. But yesterday’s flood was so high and that has never happened before.
I had just planted 1500 chilli plants over the river bank, because according to experience this was alright. But this time the flood went way up the river bank.
After the flood people had a hard time finding jobs, so some of them moved to Malaysia. [I] wanted to go to the field, but the irrigation is broken, and it is dry season. Everybody’s well is dry, though the depth is down to twelve meters.”
Rusli 28 year‐old farmer
Bungon village, kecamatan Matang Kuli, Aceh Utara

32 Damage and Loss Assessment
This assessment has quantified the damage and losses from the December 2006 Aceh flood. It was undertaken in seven districts, Aceh Tamiang, Aceh Tengah, Aceh Timur, Aceh Utara, Bener Meriah, Bireuen, and Gayo Lues, and collected data on four sectors, infrastructure and housing, productive, social, and government. The results and findings suggest the following conclusions and recommendations:
Conclusions MAJOR IMPACT
The Aceh floods impacted over half a million people, caused 47 deaths and 8,460 injuries, and resulted in damage and losses of Rp. 1.9 trillion or US$ 210 million. Although this is not on the same scale as other recent disasters in the developing world, including the Indian Ocean tsunami, the floods are significant setback in a province still rebuilding after the devastating tsunami and 30 years of violent conflict. The flood damage and losses add an additional 16% to the Rp. 12 trillion ($1.2 billion) needed to rebuild or repair infrastructure damaged by the conflict, tsunami or lack of maintenance.14
PRIVATE INFRASTRUCTURE DISPROPORTIONATELY AFFECTED
The flood disproportionately affected private infrastructure, specifically housing and agriculture, which places an enormous strain on many families. Damage and losses to privately‐owned infrastructure account for 70% of the total from the floods.
IMPACT IS CONCENTRATED IN A LIMITED NUMBER OF AREAS
Impact varies widely across villages, sub‐districts, and districts. The ten most‐affected sub‐districts account for 58% of total damage and losses. The ten most affected villages account for 16% of damage and losses across the province.
Recommendations EXPAND EXISTING TSUNAMI PROGRAMS
There are many existing tsunami programs that cover the key sectors affected by the flood, particularly housing, agriculture, roads, schools and health. Rather than spend considerable time (re)designing reconstruction programs for flood areas, these programs can in most cases be expanded, geographically or in scope.
TARGET FUNDS LOCALLY
The massive variation in impacts suggests that funds should be allocated at the sub‐district or village level. In Aceh Utara, for example, there are both very highly affected sub‐districts (with damage and losses of over Rp. 90 billion) and sub‐districts only slightly affected (under Rp. 10 billion). In Aceh Tamiang there are villages with damage amounting to more than Rp. 10 billion ($1.1
14 Previous damage estimates as of August 2006. Ministry of Home Affairs, Kecamatan Development Program, World Bank (2007), 2006 Village Survey in Aceh: An Assessment of Village Infrastructure and Social Conditions (Banda Aceh and Jakarta).

Aceh Flood 33
million) as well as many villages with damage and losses of less than Rp. 1 billion ($110,000). This suggests reconstruction funds need to be allocated at the sub‐district or even village‐level.
UTILIZE COMMUNITY-DRIVEN DEVELOPMENT MECHANISMS
The types of damage vary considerably between areas. Adopting a community‐based approach can help match funding to diverse community needs and can increase community ownership. If block grants are given to villages for reconstruction, they can decide whether they should be used for repairing schools, revitalizing farmland, or rebuilding a local health clinic. Community‐based approaches can also help ensure transparency of fund distribution, particularly important when allocating contested private goods.
MANAGE EXPECTATIONS AND COMPLAINTS
The tsunami reconstruction process highlights the importance of managing expectations and responding to complaints when they occur. Expectations for reconstruction support are extremely high in Aceh. This is largely the result of unrealistic promises and targets development agencies. The flood reconstruction effort will face similar challenges. Managing expectations and providing clear information on projects is crucial.


35
ANNEXES
METHODOLOGY
SURVEY INSTRUMENT
FLOOD AFFECTED LOCATIONS
PROVINCIAL DATA SUMMARY
DISTRICT DATA SUMMARIES
SUB-DISTRICT DAMAGE AND LOSSES SUMMARY

36
ANNEX A: METHODOLOGY
The methodology for assessing the damage and losses of the December 2006 Aceh floods consisted of the following five components:
Survey instrument development Affected locations mapping Village data collection Data cleaning and verification Estimation of unit costs
SURVEY INSTRUMENT DEVELOPMENT
In order to ensure a quick and efficient data collection process, the Aceh flood assessment adopted a simplified version of the survey instrument used for the 2006 KDP Aceh Village Survey.15 This survey had focused on the collection of infrastructure and social data, thus the flood assessment instrument collected data on direct impacts and infrastructure damage due to the floods.
Data on direct impacts included information on the number of people killed, injured and missing.16 Infrastructure damage included information on the social sector, infrastructure and housing, productive sectors, and government administration. The ECLAC methodology was used for categorising this infrastructure damage (Box A1).
Box A1: Damage Data Collected
Direct Impacts • Affected locations • Killed, injured and people missing
Social Sector Damage
• Schools and kindergartens • Health posts and post‐natal clinics • Prayer Rooms • Mosques
Infrastructure and Housing Damage
• Houses and Barracks (IDP housing) • Roads (district, village, hamlet, orchard, and
footpaths) • Calverts and retaining walls • Bridges (concrete, wood, steel framed and
suspension) • Electricity • Wells, pumps, pipes and storage tanks • Public toilet facilities
Productive Sector Damage • Field and plantations • Fish ponds and weirs • Irrigation channels • Rice warehouses and winnowing facilities • Fish and village markets • Jetties • Shops and garages
Government Administration
• Village offices
15 Ministry of Home Affairs, Kecamatan Development Program, World Bank (2007), 2006 Village Survey in Aceh: An Assessment of Village Infrastructure and Social Conditions (Banda Aceh and Jakarta). 16 In addition, the survey collected information on village access, internal displacement, and immediate needs. However, due to rapid changes in the situation, this information was not used in the assessment.

37
For each sub‐category of infrastructure, the number of units or meters damaged was disaggregated by its degree, that is, whether infrastructure was lightly damaged, heavily damaged, or whether it needed replacement (i.e. was destroyed). Because the survey instrument is designed for data collection on village level impacts, the assessment may miss damage associated with the flood at higher administrative levels.
AFFECTED LOCATIONS MAPPING
In order to determine where to implement the survey, a mapping of affected locations was undertaken. This also utilised the KDP network. First, KMKabs (KDP District Management Consultants) were requested to map for their districts kecamatan that were highly affected, lightly affected, and not affected. Second, FKs (KDP Kecamatan Facilitators) from highly and lightly affected kecamatan were asked to map for their kecamatan villages that were and were not affected. The survey instrument was then implemented in all affected villages. This mapping also provided the data on affected locations used in this assessment.
FIELD DATA COLLECTION
Village surveys were implemented from December 30 – January 19 in all affected villages, thus capturing the impact of the floods in the two‐three weeks following the disaster. In order to draw on local knowledge in the assessment of flood impact, the KDP village facilitators were used as the primary data collectors. Each filled out a summary form for their village. In completing the formats, village facilitators toured the affected areas in their village recording information on levels and extent of damage. They also talked with others in the village, including victims and village leaders, to get more accurate estimates of damage. In some areas, they had to wait for the floodwater to subside before they could collect accurate data.
DATA CLEANING AND VERIFICATION
The data cleaning and verification involved a three‐step process. First, FKs at the sub‐district level reviewed and verified surveys from each of their affected villages. Second, the technical facilitators at the district level verified the results for each of their affected kecamatan. Given these facilitators are all experienced civil engineers and/or have considerable knowledge of local conditions, they were to correct anomalies and ensure village needs were not conflated with flood damage. Finally, the World Bank team in Banda Aceh entered and cleaned the data, cross‐checked a sample of complete surveys, and verified to local facilitators when entered values appeared inaccurate.
ESTIMATIONS OF COSTS
The costs of the damage associated with the floods were calculated by generating estimates for how much it would cost to replace or repair affected infrastructure. Unit costs were primarily calculated using information from KDP district facilitators, but were augmented and cross‐checked with costs and assumptions used in the damage calculation from the tsunami and the earthquake in Yogyakarata (Table A1 below lists unit costs and assumptions).
The value of associated losses were also calculated. Losses are indirect impacts that refer to resource flows that are affected by the floods, such as reduced expenditures and increased expenditures over the period until the assets are recovered. Insufficient data meant that these could only be calculated for a limited number of areas (see Box A2).

38
Box A2: Estimate of Losses
Social Sectors • Costs of clean‐up for school facilities and kindergarten • Costs of clean‐up of health posts • Costs of emergency medical assistance for the injured
Infrastructure and Housing
• Debris removal • Transitional shelters • Cost of furniture and household appliances lost/damaged • Clothing and food stocks
Productive Sectors
• Village markets • Shops • Garages

39
Table A1: Estimated Unit Costs and Assumptions
Tingkat Kerusakan SECTOR / SUB SECTOR
Type unit Light Damage Heavy Damage Replace Abandoned
Assumptions
SOCIAL SECTOR Segala Tingkat Sekolah (Kecuali TK)
unit 45,000,000 180,000,000 225,000,000 168,750,000 Education
TK unit 15,000,000 60,000,000 75,000,000 56,250,000 Puskesmas Pembantu unit 33,600,000 84,000,000 168,000,000 126,000,000 * Based on Tsunami D&L unit
cost plus 20% inflation adjustment * Light Damage : 20%; Heavy Damage: 50%
Health
Posyandu unit 10,600,000 26,500,000 53,000,000 39,750,000 Equivalent with House Tempat Ibadah unit 60,000,000 240,000,000 300,000,000 225,000,000 Community,
Culture & Religion Meunasah unit 30,000,000 120,000,000 150,000,000 112,500,000 HOUSING & INFRASTRUCTURE
Rumah unit 10,600,000 26,500,000 53,000,000 39,750,000 * Full Reconstruction Cost for REKOMPAK/WB Project * Light Rehab = 20% of Full Cost; Heavy Rehab: 50%
Housing
Barak unit 960000 2400000 4800000 3,600,000 * T‐Shelter cost Rp. 1.2 Mn (JRF Project in Yogya), * 1 Barrack consist of 4 T‐Shelter * Light Rehab = 20% of Full Cost; Heavy=50%
Jalan Kabupaten m 100,000 250,000 500,000 375,000 * Full reconstruction cost equivalent with Tsunami D/L Unit Cost, * Actual cost for WB Project in Eastern Indonesia (4m2 wide road and hotmix quality) = Rp. 700,000/m2. Assuming 30% mark up = Rp. 490,000 * Light Rehabilitation = 20% of full cost; Heavy Rehab = 50%
Poros desa (diperkeras) m 75,000 120,000 135,000 101,250 Poros desa (tanah) m 32,500 50,000 65,000 48,750 Poros dusun (diperkeras) m 62,500 100,000 112,500 84,375 Poros dusun (tanah) m 27,000 42,000 54,000 40,500 Lingkungan (diperkeras) m 50,000 80,000 90,000 67,500 Lingkungan (tanah) m 22,000 34,000 43,000 32,250 Jalan Kebun (diperkeras) m 62,500 100,000 112,500 84,375 Jalan Kebun (tanah) m 27,000 42,000 54,000 40,500 Gorong‐gorong unit 2,400,000 4,800,000 6,000,000 4,500,000 Tembok Penahan Tanah m 60,000 120,000 150,000 112,500 Beton unit 16,000,000 96,000,000 120,000,000 90,000,000 Gelagar Besi unit 15,000,000 65,000,000 78,000,000 58,500,000 Gelagar Kayu unit 9,000,000 41,600,000 52,000,000 39,000,000
Transportation
Gantung unit 120,000,000 240,000,000 300,000,000 225,000,000 Sumur Gali unit 750,000 1,500,000 3,000,000 2,250,000 Sumur Pompa Tangan unit 200,000 400,000 800,000 600,000 Sumur Pompa Mesin unit 250,000 500,000 1,000,000 750,000 Hidran Umum unit 1,000,000 4,000,000 5,000,000 3,750,000 Perpipaan m 20,000 40,000 50,000 37,500 Perlindungan Mata Air unit 8,000,000 20,000,000 25,000,000 18,750,000 Sistem Penjernihan unit 5,000,000 15,000,000 30,000,000 22,500,000 Penampungan Air Hujan unit 3,000,000 7,500,000 15,000,000 11,250,000
Water and Sanitation
MCK unit 4,200,000 33,600,000 42,000,000 31,500,000 Energy Generator unit 2,000,000 4,800,000 8,000,000 6,000,000 * Genset = Rp. 200 mn (BRR
Masterplan) * Cost of Repair; Light =20% Heavy=100%
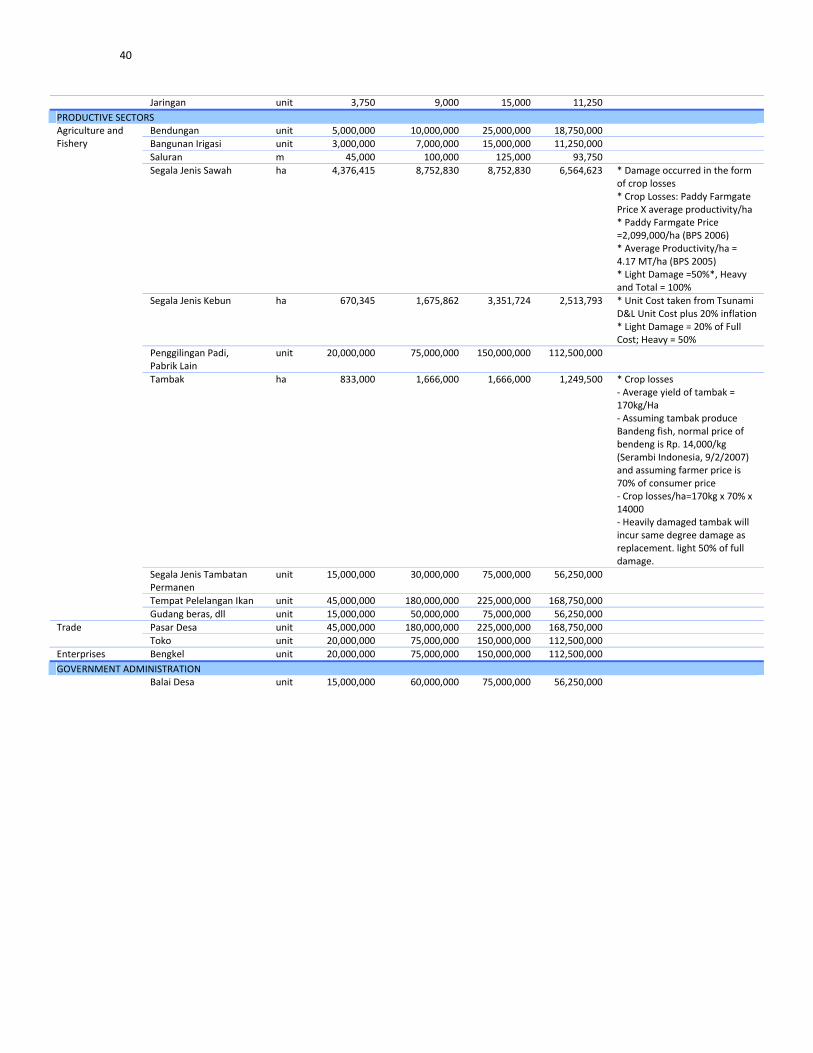
40
Jaringan unit 3,750 9,000 15,000 11,250 PRODUCTIVE SECTORS
Bendungan unit 5,000,000 10,000,000 25,000,000 18,750,000 Bangunan Irigasi unit 3,000,000 7,000,000 15,000,000 11,250,000 Saluran m 45,000 100,000 125,000 93,750 Segala Jenis Sawah ha 4,376,415 8,752,830 8,752,830 6,564,623 * Damage occurred in the form
of crop losses * Crop Losses: Paddy Farmgate Price X average productivity/ha * Paddy Farmgate Price =2,099,000/ha (BPS 2006) * Average Productivity/ha = 4.17 MT/ha (BPS 2005) * Light Damage =50%*, Heavy and Total = 100%
Segala Jenis Kebun ha 670,345 1,675,862 3,351,724 2,513,793 * Unit Cost taken from Tsunami D&L Unit Cost plus 20% inflation* Light Damage = 20% of Full Cost; Heavy = 50%
Penggilingan Padi, Pabrik Lain
unit 20,000,000 75,000,000 150,000,000 112,500,000
Tambak ha 833,000 1,666,000 1,666,000 1,249,500 * Crop losses ‐ Average yield of tambak = 170kg/Ha ‐ Assuming tambak produce Bandeng fish, normal price of bendeng is Rp. 14,000/kg (Serambi Indonesia, 9/2/2007) and assuming farmer price is 70% of consumer price ‐ Crop losses/ha=170kg x 70% x 14000 ‐ Heavily damaged tambak will incur same degree damage as replacement. light 50% of full damage.
Segala Jenis Tambatan Permanen
unit 15,000,000 30,000,000 75,000,000 56,250,000
Tempat Pelelangan Ikan unit 45,000,000 180,000,000 225,000,000 168,750,000
Agriculture and Fishery
Gudang beras, dll unit 15,000,000 50,000,000 75,000,000 56,250,000 Pasar Desa unit 45,000,000 180,000,000 225,000,000 168,750,000 Trade Toko unit 20,000,000 75,000,000 150,000,000 112,500,000
Enterprises Bengkel unit 20,000,000 75,000,000 150,000,000 112,500,000 GOVERNMENT ADMINISTRATION Balai Desa unit 15,000,000 60,000,000 75,000,000 56,250,000

41
ANNEX B: SURVEY INSTRUMENT (INDONESIAN)
Kajian Banjir Aceh Desember 2006
Tanggal └─┴─┘ / └─┴─┘ / └─┴─┴─┴─┘
Nama Fasilitator Desa/Petugas Survei yang mengisi formulir ini:
Nama Kabupaten: ___________________________________ Nama Kecamatan: ___________________________________ Nama Desa : ____________________________________
BAGIAN 1: KAJIAN PRASARANA - UNTUK DAERAH YANG TERIMBAS BANJIR
1.1 Laporan Status Kerusakan Prasarana Desa
Jumlah menurut tingkat kerusakan I II III IV
No. Jenis Prasarana Tipe Satuan
Tidak rusak
Perlu perbaikan ringan
Perlu perbaikan berat
Perlu diganti
Jalan kabupaten meter Poros desa (diperkeras) meter Poros desa (tanah) meter Poros dusun (diperkeras) meter Poros dusun (tanah) meter Lingkungan (diperkeras) meter Lingkungan (tanah) meter Jalan kebun (diperkeras) meter Jalan kebun (tanah) meter Gorong‐gorong unit
1.1.1 Jalan
Tembok Penahan Tanah meter Beton unit Gelagar besi unit Gelagar kayu unit
1.1.2 Jembatan
Gantung unit Sumur gali unit Sumur pompa tangan unit Sumur pompa mesin unit Hidran umum unit Perpipaan meter Perlindungan mata air unit Sistim penjernihan unit
1.1.3 Air Bersih
Penampungan air hujan unit MCK unit 1.1.4 MCK
Sumber unit 1.1.5 Listrik Jaringan meter Bendungan unit Bangunan irigasi unit
1.1.6 Irigasi
Saluran meter 1.1.7 Tambatan perahu Segala jenis tambatan
permanen unit
Balai desa/kantor desa unit Segala tingkat sekolah (tdk TK) unit TK unit
1.1.8 Fasilitas desa
Puskesmas pembantu unit
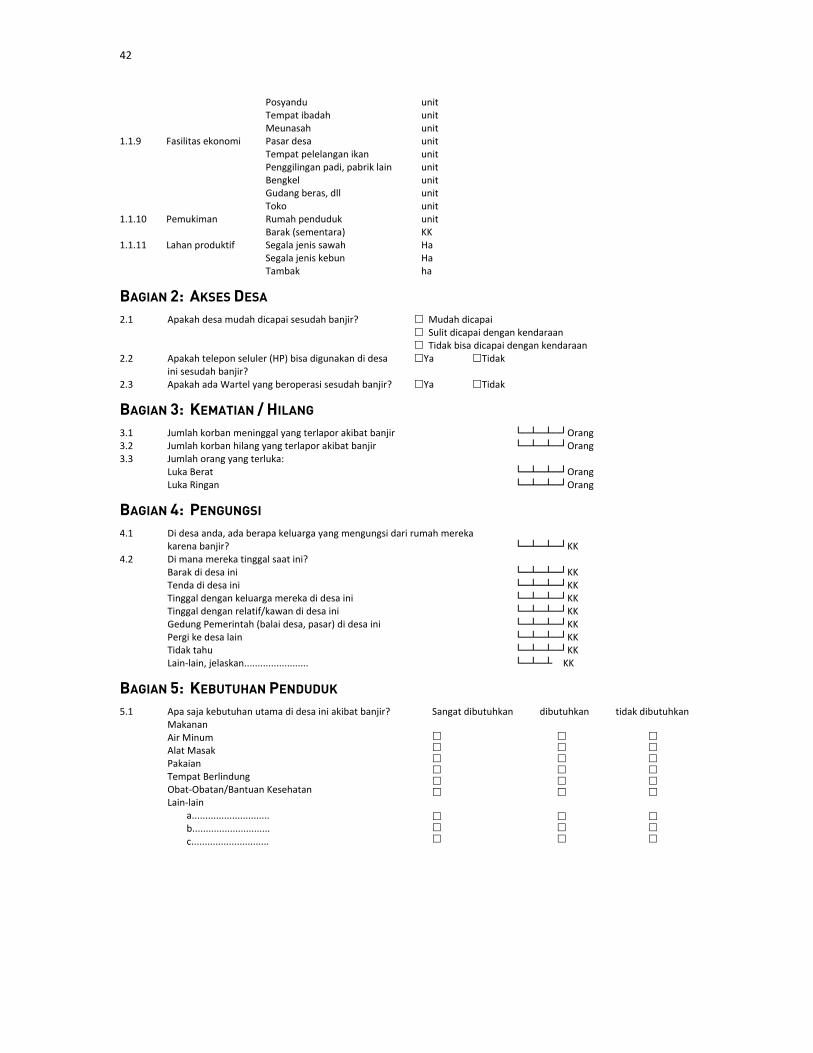
42
Posyandu unit Tempat ibadah unit Meunasah unit Pasar desa unit Tempat pelelangan ikan unit Penggilingan padi, pabrik lain unit Bengkel unit Gudang beras, dll unit
1.1.9 Fasilitas ekonomi
Toko unit 1.1.10 Pemukiman Rumah penduduk unit Barak (sementara) KK 1.1.11 Lahan produktif Segala jenis sawah Ha Segala jenis kebun Ha Tambak ha
BAGIAN 2: AKSES DESA 2.1 Apakah desa mudah dicapai sesudah banjir?
Mudah dicapai Sulit dicapai dengan kendaraan Tidak bisa dicapai dengan kendaraan
2.2 Apakah telepon seluler (HP) bisa digunakan di desa ini sesudah banjir?
Ya Tidak
2.3 Apakah ada Wartel yang beroperasi sesudah banjir? Ya Tidak
BAGIAN 3: KEMATIAN / HILANG 3.1 Jumlah korban meninggal yang terlapor akibat banjir └─┴─┴─┘Orang 3.2 Jumlah korban hilang yang terlapor akibat banjir └─┴─┴─┘Orang 3.3 Jumlah orang yang terluka:
Luka Berat Luka Ringan
└─┴─┴─┘Orang └─┴─┴─┘Orang
BAGIAN 4: PENGUNGSI 4.1 Di desa anda, ada berapa keluarga yang mengungsi dari rumah mereka
karena banjir? └─┴─┴─┘KK
4.2 Di mana mereka tinggal saat ini? Barak di desa ini Tenda di desa ini Tinggal dengan keluarga mereka di desa ini Tinggal dengan relatif/kawan di desa ini Gedung Pemerintah (balai desa, pasar) di desa ini Pergi ke desa lain Tidak tahu Lain‐lain, jelaskan........................
└─┴─┴─┘KK └─┴─┴─┘KK └─┴─┴─┘KK └─┴─┴─┘KK └─┴─┴─┘KK └─┴─┴─┘KK └─┴─┴─┘KK └─┴─┴��KK
BAGIAN 5: KEBUTUHAN PENDUDUK 5.1 Apa saja kebutuhan utama di desa ini akibat banjir?
Makanan Air Minum Alat Masak Pakaian Tempat Berlindung Obat‐Obatan/Bantuan Kesehatan Lain‐lain a............................. b............................. c.............................
Sangat dibutuhkan dibutuhkan tidak dibutuhkan

43
ANNEX C: FLOOD AFFECTED LOCATIONS District Sub‐district # Affected Villages
Aceh Tamiang BANDA MULIA 8 BANDAR PUSAKA 14 BENDAHARA 32 KARANG BARU 30 KEJURUAN MUDA 15 KOTA KUALA SIMPANG 5 MANYAK PAYED 32 RANTAU 13 SEKERAK 14 SERUWAY 16 TAMIANG HULU 6 TENGGULAN 5 Aceh Tengah LINGE 4 Aceh Timur BIREM BAYEUN 4 JULOK 6 PANTE BIDARI 13 SERBAJADI 15 SIMPANG JERNIH 7 SIMPANG ULIM 13 Aceh Utara BAKTIYA BARAT 5 COT GIREK 8 DEWANTARA 1 KUTA MAKMUR 16 LANGKAHAN 16 LHOK SUKON 59 MATANGKULI 59 MEURAH MULIA 13 MUARA BATU 11 NIBONG 20 NISAM 12 PAYA BAKONG 4 SAMUDERA 19 SAWANG (A.UTARA) 14 SIMPANG KERAMAT 5 SYAMTALIRA ARON 23 SYAMTALIRA BAYU 19 TANAH JAMBO AYE 2 TANAH LUAS 52 TANAH PASIR 20 Bener Meriah BANDAR 15 BUKIT 22 PERMATA 12 SYIAH UTAMA 20 Bireuen GANDA PURA 38 PEUSANGAN 11 Gayo Lues PINDING 9 Total 757

44
ANNEX D: PROVINCIAL DATA SUMMARY KAJIAN BANJIR ACEH ACEH FLOOD ASSESSMENT PROGRAM PEMBANGUNAN KECAMATAN (PPK) 2007 KECAMATAN DEVELOPMENT PROGRAM (KDP) 2007 LAPORAN RINGKASAN OVERALL SUMMARY REPORT
STATISTIK PROFIL KESELURUHAN / STATISTIC OVERALL PROFILE
Populasi / Population: 512879
Kepala Keluarga (KK) / Households: 114809
Usia Produktif / Productive Age: 201991
Pekerjaan / Occupation: 213391
Petani / Farmers: 126251 Paramedis / Paramedics: 1449 Nelayan / Fisherman: 4838 Tentara/Polisi / Army/Police: 1234 Pedagang / Traders: 13056 Usahawan / Entrepreneurs: 2493 PNS / Civil Servants: 4551 Buruh / Labourers: 40947 Guru / Teachers: 5825 Lain / Other: 12747
Keluarga Miskin / Poor Households: 30751
Catatan: Data di bagian in berasal dari Kajian PPK terhadap Dampak Konflik dan Tsunami (2006), BPS population data (PODES 2005), dan dari program BRA‐PPK. Note: The data in this section is from the KDP Conflict and Tsunami Damage Assessment (2006), BPS population data (PODES 2005) and village population data from the BRA‐KDP program.
LOKASI YANG TERIMBAS / MENINGGAL / LUKA / HILANG AFFECTED LOCATIONS / DEATHS / INJURIES / MISSING
Kabupaten/District Jumlah Korban Meninggal/ Deaths
Jumlah Korban Luka Berat/ Heavy Injuries
Jumlah Korban Luka Ringan/ Light Injuries
Jumlah Korban Hilang/Missing
NAD ‐ Aceh Tamiang 31 3456 165 12 NAD ‐ Aceh Tengah 6 NAD ‐ Aceh Timur 7 385 45 3 NAD ‐ Aceh Utara 5 3783 181 13 NAD ‐ Bener Meriah 3 7 3 4 NAD – Bireuen 189 170 NAD ‐ Gayo Lues 1 61 9 3
Catatan: Terdapat beberapa perbedaan dengan figure yang dibuat oleh UN dan Pemerintah. Note: There are some small discrepancies with both UN and GoI figures.

45
KERUSAKAN PRASARANA / INFRASTRUCTURE DAMAGE
Jenis / Category Tipe / Type Unit Not Damaged
Light Damaged
Heavy Damaged
Needs to be replaced
Total (Rp.)
SEKTOR SOSIAL / SOCIAL SECTORS Segala Tingkat Sekolah / All Schools unit 177 123 109 27 31,230,000,000 Pendidikan /
Education TK / Kindergarten unit 87 60 32 10 3,570,000,000 Puskesmas Pembantu / Health Post unit 51 39 23 12 5,258,400,000 Kesehatan /
Health Posyandu /Post‐Natal Clinic unit 138 87 64 42 4,844,200,000 Tempat Ibadah / Prayer Room unit 310 210 133 50 59,520,000,000 Masyarakat,
Budaya, Agama / Community, Culture, Religion
Meunasah/Mesjid / Mosque unit 317 216 121 47 28,050,000,000
PRASARANA DAN PEMUKIMAN / INFRASTRUCTURE AND HOUSING Rumah Penduduk / Houses unit 47,281 24,874 13,124 4,412 845,286,400,000 Pemukiman /
Housing Barak / Barracks KK 1,375 350 244 153 1,655,520,000 Jalan Kabupaten / District Roads meter 377,408 123,498 214,540 8,090 70,029,800,000 Poros Desa (diperkeras) / Villlage Road (Paved) meter 452,558 268,560 392,940 24,460 70,596,900,000 Poros Desa (tanah) / Village Road (Dirt) meter 176,718 119,631 255,687 20,230 17,987,307,500 Poros Dusun (diperkeras) /Hamlet Road (Paved) meter 217,054 131,606 229,961 15,985 33,019,787,500 Poros Dusun (tanah) / Hamlet Road (Dirt) meter 200,976 110,197 215,684 17,446 12,976,131,000 Lingkungan (diperkeras) / Footpath (paved) meter 50,699 22,485 62,303 7,311 6,766,480,000 Lingkungan (tanah) / Footpath (dirt) meter 106,065 64,060 70,396 14,407 4,422,285,000 Jalan Kebun (diperkeras) / Orchard Road (paved) meter 97,403 45,930 67,812 12,874 11,100,150,000 Jalan Kebun (tanah) / Orchard Road (dirt) meter 148,475 118,817 149,042 17,430 10,409,043,000 Gorong‐Gorong / Calvert unit 1,538 614 1,004 680 10,372,800,000 Tembok Penahan Tanah / Retaining Wall meter 36,031 8,458 14,746 16,536 4,757,400,000 Jembatan Beton / Concrete Bridge unit 426 111 120 75 22,296,000,000 Jembatan Gelagar Besi / Steel Bridge unit 53 47 84 42 9,441,000,000 Jembatan Gelagar Kayu / Wood Bridge unit 59 106 239 249 23,844,400,000
Transportasi dan Komunikasi / Transportation and Communication
Jembatan Gantung / Suspension Bridge unit 11 13 14 13 8,820,000,000 Sumber Listrik /Electiricy Source unit 64 20 16 94 868,800,000 Sumber Energi /
Energy Jaringan Listrik / lectricity Network meter 489,854 29,512 36,442 33,407 939,753,000 Sumur Gali / Well unit 26,303 11,348 10,903 4,042 36,991,500,000 Sumur Pompa Tangan / Hand Pump unit 259 398 258 61 231,600,000 Sumur Pompa Mesin / Machine Pump unit 2,872 1,193 1,421 337 1,345,750,000 Hidran Umum / Public Standpipe unit 19 27 35 16 247,000,000 Perpipaan / Piping meter 47,276 10,213 21,912 28,329 2,497,190,000 Perlindungan Mata Air / Catchment unit 1 8 36 3 859,000,000 Sistem Penjernihan / Purification Syste unit 6 3 11 9 450,000,000 Penampungan Air Hujan / Storage Tank unit 5 6 10 21 408,000,000
Air Bersih dan Sanitasi / Water and Sanitation
MCK / Public Toilet and Landry unit 341 275 292 173 18,232,200,000 SEKTOR PRODUKTIF / PRODUCTIVE SECTORS
Segela Jenis Sawah / All Fields ha 17,343 7,610 14,440 2,353 180,289,917,057 Segala Jenis Kebun / All Plantations ha 29,132 12,100 20,631 531 44,463,729,414 Tambak / Fish Ponds ha 1,767 2,115 2,707 193 47,181,653,120 Bendungan / Weir unit 36 10 33 23 955,000,000 Bangunan Irigasi / Irrigation Gates unit 120 76 79 40 1,381,000,000 Saluran / Irrigation Channels meter 397,994 178,932 261,945 65,810 42,472,690,000 Penggilingan Padi / Rice Winnowing Facility unit 153 136 126 23 15,620,000,000
Pertanian / Agriculture
Gudang Beras / Rice Warehouse unit 49 55 27 8 2,775,000,000 Tempat Pelelangan Ikan / Fish Market unit 11 14 21 4 5,310,000,000 Perikanan /
Fishery Tambatan / Permanent Jetty unit 5 9 15 21 2,160,000,000 Pasar Desa / Village Market unit 35 20 13 10 5,490,000,000 Perdagangan /
Trade Toko / Shop unit 2,375 791 267 117 53,395,000,000 Usaha / Enterprises
Bengkel / Garage unit 239 152 126 17 15,040,000,000
ADMINISTRASI PEMERINTAHAN / GOVERNMENT ADMINISTRATION Balai/Kantor Desa / Village Office unit 123 92 69 48 9,120,000,000
USD 198,330,976 Rp.1,784,978,786,591

46
KERUGIAN PRASARANA / INFRASTRUCTURE LOSSES
Jenis / Category Tipe / Type Unit No Light Loss
Heavy Loses
Replace Losses
Total (Rp.)
SEKTOR SOSIAL / SOCIAL SECTORS Membersihkan failitas Segala Tingkat Sekolah / Clean up facilities of All Schools
unit 177 123 109 27 21,100,000 Pendidikan / Education
Membersihkan fasilitas TK / Clean up facilities of Kindergarten
unit 87 60 32 10 7,700,000
Membersihkan fasilitas Pustu / Clean up facilities of Pustu
unit 51 39 23 12 6,050,000 Kesehatan / Health
Pengobatan Darurat bagi yang terluka / Emergency Medical Assistance for the Injured
Injured Person
573 7,887 4,000,800,000
PRASARANA DAN PEMUKIMAN / INFRASTRUCTURE AND HOUSING Pemindahan Puing / Debris Removal unit 47,281 24,874 13,124 4,412 3,217,900,000 Tempat Tinggal Sementara / T‐shelter unit 47,281 24,874 13,124 4,412 21,043,200,000 Perabotan dan Alat Rumah Tangga / Furniture and HH Appliances
unit 47,281 24,874 13,124 4,412 71,769,600,000
Persediaan Pakaian / Clothing Stock unit 47,281 24,874 13,124 4,412 6,753,240,000
Pemukiman / Housing
Persediaan Makanan / Food Stock unit 47,281 24,874 13,124 4,412 2,374,960,000 SEKTOR PRODUKTIF / PRODUCTIVE SECTORS
Pasar Desa / Village Market unit 35 20 13 10 297,000,000 Perdagangan / Trade Toko / Shop unit 2,375 791 267 117 616,700,000 Usaha / Enterprises
Bengkel / Garage unit 239 152 126 17 306,600,000
USD 12,268,317 Rp. 110,414,850,000

47
ANNEX E: DISTRICT DATA SUMMARIES
KAJIAN BANJIR ACEH ACEH FLOOD ASSESSMENT PROGRAM PEMBANGUNAN KECAMATAN (PPK) 2007 KECAMATAN DEVELOPMENT PROGRAM (KDP) 2007 LAPORAN RINGKASAN KABUPATEN DISTRICT SUMMARY REPORT
KABUPATEN / DISTRICT: NAD ‐ ACEH TAMIANG
STATISTIC OVERALL PROFILE / STATISTIK PROFIL KESELURUHAN
Populasi / Population: 213302
Kepala Keluarga (KK) / Households: 45746
Usia Produktif / Productive Age: 53336
Pekerjaan / Occupation: 72755 Petani / Farmers: 33191 Paramedis / Paramedics: 500 Nelayan / Fishermann: 2157 Tentara/Polisi / Army/Police: 678 Pedagang / Traders: 6275 Usahawan / Entreprenours: 886 PNS / Civil Servants: 1916 Buruh / Labourers: 17831 Guru / Teachers: 1753 Lain / Other: 7568 Keluarga Misking / Poor Households: 10201
Catatan: Data di bagian in berasal dari Kajian PPK terhadap Dampak Konflik dan Tsunami (2006), BPS population data (PODES 2005), dan dari program BRA‐PPK. Note: The data in this section is from the KDP Conflict and Tsunami Damage Assessment (2006), BPS population data (PODES 2005) and village population data from the BRA‐KDP program.
LOKASI YANG TERIMBAS / MENINGGAL / LUKA / HILANG AFFECTED LOCATIONS / DEATHS / INJURIES / MISSING
Kabupaten/ District
Kecamatan/ Sub‐district
Jumlah Korban Meninggal/ Deaths
Jumlah Korban Luka Berat/ Heavy Injuries
Jumlah Korban Luka Ringan/ Light Injuries
Jumlah Korban Hilang/ Missing
NAD ‐ Aceh Tamiang BANDA MULIA 97 1 NAD ‐ Aceh Tamiang BANDAR PUSAKA 134 NAD ‐ Aceh Tamiang BENDAHARA 1 1331 37 NAD ‐ Aceh Tamiang KARANG BARU 8 65 25 2 NAD ‐ Aceh Tamiang KEJURUAN MUDA 7 392 2 NAD ‐ Aceh Tamiang KOTA KUALA SIMPANG 1 54 19 NAD ‐ Aceh Tamiang MANYAK PAYED 2 160 NAD ‐ Aceh Tamiang RANTAU 2 325 2 NAD ‐ Aceh Tamiang SEKERAK 9 181 66 7 NAD ‐ Aceh Tamiang SERUWAY 20 NAD ‐ Aceh Tamiang TAMIANG HULU 83 13 NAD ‐ Aceh Tamiang TENGGULAN 1 614 3

48
KERUSAKAN PRASARANA / INFRASTRUCTURE DAMAGE
Jenis / Category Tipe / Type Unit Not Damaged
Light Damage
Heavy Damage
Needs to be replaced
Total (Rp.)
SEKTOR SOSIAL / SOCIAL SECTORS Segala Tingkat Sekolah / All Schools unit 51 71 70 14 18,945,000,000 Pendidikan /
Education TK / Kindergarten unit 31 33 15 5 1,770,000,000 Puskesmas Pembantu / Health Post unit 18 15 10 4 2,016,000,000 Kesehatan /
Health Posyandu / Post‐Natal Clinic unit 39 29 36 19 2,268,400,000 Tempat Ibadah / Prayer Room unit 67 89 62 12 23,820,000,000 Masyarakat,
Budaya, Agama / Community, Culture, Religion
Meunasah/Mesjid / Mosque unit 67 110 67 23 14,790,000,000
PRASARANA DAN PEMUKIMAN / INFRASTRUCTURE AND HOUSING Rumah Penduduk / Houses unit 17,832 14,151 9,392 3,093 562,817,600,000 Pemukiman /
Housing Barak / Barracks KK 549 92 36 95 630,720,000 Jalan Kabupaten / District Roads meter 57,295 18,760 36,615 770 11,414,750,000 Poros Desa (diperkeras) / Villlage Road (Paved) meter 89,867 85,230 223,818 8,480 34,395,210,000 Poros Desa (tanah) / Village Road (Dirt) meter 39,605 21,890 109,536 2,000 6,318,225,000 Poros Dusun (diperkeras) /Hamlet Road (Paved) meter 40,533 43,690 107,849 3,650 13,926,150,000 Poros Dusun (tanah) / Hamlet Road (Dirt) meter 43,421 21,195 110,429 2,000 5,318,283,000 Lingkungan (diperkeras) / Footpath (paved) meter 1,095 4,635 28,765 2,532,950,000 Lingkungan (tanah) / Footpath (dirt) meter 19,000 8,700 16,850 764,300,000 Jalan Kebun (diperkeras) / Orchard Road (paved) meter 1,222 3,600 7,878 3,000 1,350,300,000 Jalan Kebun (tanah) / Orchard Road (dirt) meter 15,262 16,045 38,550 2,052,315,000 Gorong‐Gorong / Calvert unit 225 269 387 190 3,643,200,000 Tembok Penahan Tanah / Retaining Wall meter 3,183 694 395 1,800 359,040,000 Jembatan Beton / Concrete Bridge unit 90 43 23 13 4,456,000,000 Jembatan Gelagar Besi / Steel Bridge unit 21 29 38 18 4,309,000,000 Jembatan Gelagar Kayu / Wood Bridge unit 16 40 73 83 7,712,800,000
Transportasi dan Komunikasi / Transportation and Communication
Jembatan Gantung / Suspension Bridge unit 1 3 5 3 2,460,000,000 Sumber Listrik / Electicity Source unit 4 1 2,000,000 Sumber Energi /
Energy Jaringan Listrik / Electricity Network meter 86,795 7,062 16,400 7,225 282,457,500 Sumur Gali / Well unit 2,780 3,528 5,761 2,017 17,338,500,000 Sumur Pompa Tangan / Hand Pump unit 107 29 205 4 91,000,000 Sumur Pompa Mesin / Machine Pump unit 1,216 810 1,316 187 1,047,500,000 Hidran Umum / Public Standpipe unit 4 5 15 65,000,000 Perpipaan / Piping meter 5,190 5,965 305 4,910 377,000,000 Perlindungan Mata Air / Catchment unit 2 1 1 61,000,000 Sistem Penjernihan / Purification Syste unit 1 2 2 40,000,000 Penampungan Air Hujan / Storage Tank unit 1 2 2 8 141,000,000
Air Bersih dan Sanitasi / Water and Sanitation
MCK / Public Toilet and Landry unit 44 87 89 69 6,253,800,000
SEKTOR PRODUKTIF / PRODUCTIVE SECTORS Segela Jenis Sawah / All Fields ha 1,969 1,807 9,319 1,295 100,811,157,167 Segala Jenis Kebun / All Plantations ha 11,789 7,716 11,912 72 25,376,071,034 Tambak / Fish Ponds ha 134 170 1,085 113 18,405,551,500 Bendungan / Weir unit 2 1 5 1 80,000,000 Bangunan Irigasi / Irrigation Gates unit 12 7 12 8 225,000,000 Saluran / Irrigation Channels meter 36,365 52,649 137,875 20,196 18,681,205,000 Penggilingan Padi / Rice Winnowing Facility unit 41 78 78 8 8,610,000,000
Pertanian / Agriculture
Gudang Beras / Rice Warehouse unit 23 35 6 825,000,000 Tempat Pelelangan Ikan / Fish Market unit 2 5 7 1 1,710,000,000 Perikanan /
Fishery Tambatan / Permanent Jetty unit 1 2 6 12 1,110,000,000 Pasar Desa / Village Market unit 7 6 5 7 2,745,000,000 Perdagangan /
Trade Toko / Shop unit 405 428 102 41 22,360,000,000 Usaha / Enterprises
Bengkel / Garage unit 85 92 80 2 8,140,000,000
ADMINISTRASI PEMERINTAH / GOVERNMENT ADMINISTRATION Balai/Kantor Desa / Village Office unit 24 42 30 18 3,780,000,000
USD 107,403,165 Rp. 966,628,485,201

49
KERUGIAN PRASARANA / INFRASTRUCTURE LOSSES
Jenis / Category Tipe / Type Unit No Light Loss
Heavy Loses
Replace Losses
Total (Rp.)
SEKTOR SOSIAL / SOCIAL SECTORS Membersihkan failitas Segala Tingkat Sekolah / Clean up facilities of All Schools
unit 51 71 70 14 12,650,000 Pendidikan / Education
Membersihkan fasilitas TK / Clean up facilities of Kindergarten
unit 31 33 15 5 3,900,000
Membersihkan fasilitas Pustu / Clean up facilities of Pustu
unit 18 15 10 4 2,350,000 Kesehatan / Health
Pengobatan Darurat bagi yang terluka / Emergency Medical Assistance for the Injured
Injured Person
165 3,456 1,744,500,000
PRASARANA DAN PEMUKIMAN / INFRASTRUCTURE AND HOUSING Pemindahan Puing / Debris Removal unit 17,832 14,151 9,392 3,093 2,110,700,000 Tempat Tinggal Sementara / T‐shelter unit 17,832 14,151 9,392 3,093 14,982,000,000 Perabotan dan Alat Rumah Tangga / Furniture and HH Appliances
unit 17,832 14,151 9,392 3,093 47,786,400,000
Persediaan Pakaian / Clothing Stock unit 17,832 14,151 9,392 3,093 4,594,560,000
Pemukiman / Housing
Persediaan Makanan / Food Stock unit 17,832 14,151 9,392 3,093 1,491,616,000
SEKTOR PRODUKTIF / PRODUCTIVE SECTORS Pasar Desa / Village Market unit 7 6 5 7 135,000,000 Perdagangan /
Trade Toko / Shop unit 405 428 102 41 243,000,000 Usaha / Enterprises
Bengkel / Garage unit 85 92 80 2 179,200,000
USD 8,142,875 Rp. 73,285,876,000

50
KAJIAN BANJIR ACEH ACEH FLOOD ASSESSMENT PROGRAM PEMBANGUNAN KECAMATAN (PPK) 2007 KECAMATAN DEVELOPMENT PROGRAM (KDP) 2007 LAPORAN RINGKASAN KABUPATEN DISTRICT SUMMARY REPORT
KABUPATEN / DISTRICT: NAD ‐ ACEH TENGAH
STATISTIC OVERALL PROFILE / STATISTIK PROFIL KESELURUHAN
Populasi / Population: 1143
Kepala Keluarga (KK) / Households: 258
Usia Produktif / Productive Age: 768
Pekerjaan / Occupation: 413 Petani / Farmers: 383 Paramedis / Paramedics: Nelayan / Fishermann: Tentara/Polisi / Army/Police: Pedagang / Traders: 4 Usahawan / Entreprenours: PNS / Civil Servants: 5 Buruh / Labourers: 10 Guru / Teachers: 10 Lain / Other:
Keluarga Misking / Poor Households: 85
Catatan: Data di bagian in berasal dari Kajian PPK terhadap Dampak Konflik dan Tsunami (2006), BPS population data (PODES 2005), dan dari program BRA‐PPK. Note: The data in this section is from the KDP Conflict and Tsunami Damage Assessment (2006), BPS population data (PODES 2005) and village population data from the BRA‐KDP program.
LOKASI YANG TERIMBAS / MENINGGAL / LUKA / HILANG AFFECTED LOCATIONS / DEATHS / INJURIES / MISSING
Kabupatenn/District Kecamatan/Sub‐district
Jumlah Korban Meninggal/ Deaths
Jumlah Korban Luka Berat/ Heavy Injuries
Jumlah Korban Luka Ringan/ Light Injuries
Jumlah Korban Hilang/ Missing
NAD ‐ Aceh Tengah LINGE 6

51
KERUSAKAN PRASARANA / INFRASTRUCTURE DAMAGE
Jenis / Category Tipe / Type Unit Not Damage
Light Damage
Heavy Damage
Needs to be
replaced
Total (Rp.)
SEKTOR SOSIAL / SOCIAL SECTORS Segala Tingkat Sekolah / All Schools unit 2 2 90,000,000 Pendidikan /
Education TK / Kindergarten unit 0 Puskesmas Pembantu / Health Post unit 2 2 67,200,000 Kesehatan /
Health Posyandu / Post‐Natal Clinic unit 0 Tempat Ibadah / Prayer Room unit 2 0 Masyarakat,
Budaya, Agama / Community, Culture, Religion
Meunasah/Mesjid / Mosque unit 6 1 1 450,000,000
PRASARANA DAN PEMUKIMAN / INFRASTRUCTURE AND HOUSING Rumah Penduduk / Houses unit 181 43 20 4 1,197,800,000 Pemukiman /
Housing Barak / Barracks KK 0 Jalan Kabupaten / District Roads meter 47,000 7,200 1,800 1,170,000,000 Poros Desa (diperkeras) / Villlage Road (Paved) meter 4,500 1,000 75,000,000 Transportation and Poros Desa (tanah) / Village Road (Dirt) meter 3,000 Poros Dusun (diperkeras) /Hamlet Road (Paved) meter 500 700 78,750,000 Poros Dusun (tanah) / Hamlet Road (Dirt) meter 500 1,500 63,000,000 Lingkungan (diperkeras) / Footpath (paved) meter 0 Lingkungan (tanah) / Footpath (dirt) meter 50 1,100,000 Jalan Kebun (diperkeras) / Orchard Road (paved) meter 0 Jalan Kebun (tanah) / Orchard Road (dirt) meter 4,500 1,104 547 1,500 133,782,000 Gorong‐Gorong / Calvert unit 0 Tembok Penahan Tanah / Retaining Wall meter 0 Jembatan Beton / Concrete Bridge unit 0 Jembatan Gelagar Besi / Steel Bridge unit 0 Jembatan Gelagar Kayu / Wood Bridge unit 1 4 249,600,000
Transportasi dan Komunikasi /
Jembatan Gantung / Suspension Bridge unit 2 2 1,080,000,000 Sumber Listrik / Electicity Source unit 0 Sumber Energi /
Energy Jaringan Listrik / Electricity Network meter 7,800 1,500 6,200 61,425,000 Sumur Gali / Well unit 0 Sumur Pompa Tangan / Hand Pump unit 0 Sumur Pompa Mesin / Machine Pump unit 0 Hidran Umum / Public Standpipe unit 6 24,000,000 Perpipaan / Piping meter 3,000 300 135,000,000 Perlindungan Mata Air / Catchment unit 0 Sistem Penjernihan / Purification Syste unit 0 Penampungan Air Hujan / Storage Tank unit 0
Air Bersih dan Sanitasi / Water and Sanitation
MCK / Public Toilet and Landry unit 1 4,200,000
SEKTOR PRODUKTIF / PRODUCTIVE SECTORS Segela Jenis Sawah / All Fields ha 141 28 52 11 669,591,495 Segala Jenis Kebun / All Plantations ha 342 23 17 2 50,611,034 Tambak / Fish Ponds ha 1 16,660,000 Bendungan / Weir unit 8 200,000,000 Bangunan Irigasi / Irrigation Gates unit 1 3,000,000 Saluran / Irrigation Channels meter 4,200 1,500 3,000 4,500 930,000,000 Penggilingan Padi / Rice Winnowing Facility unit 3 1 20,000,000
Pertanian / Agriculture
Gudang Beras / Rice Warehouse unit 0 Tempat Pelelangan Ikan / Fish Market unit 0 Perikanan /
Fishery Tambatan / Permanent Jetty unit 0 Pasar Desa / Village Market unit 1 0 Perdagangan /
Trade Toko / Shop unit 0 Usaha / Enterprises
Bengkel / Garage unit 0
ADMINISTRASI PEMERINTAH / GOVERNMENT ADMINISTRATION Balai/Kantor Desa / Village Office unit 0
USD 752,302 Rp. 6,770,719,529
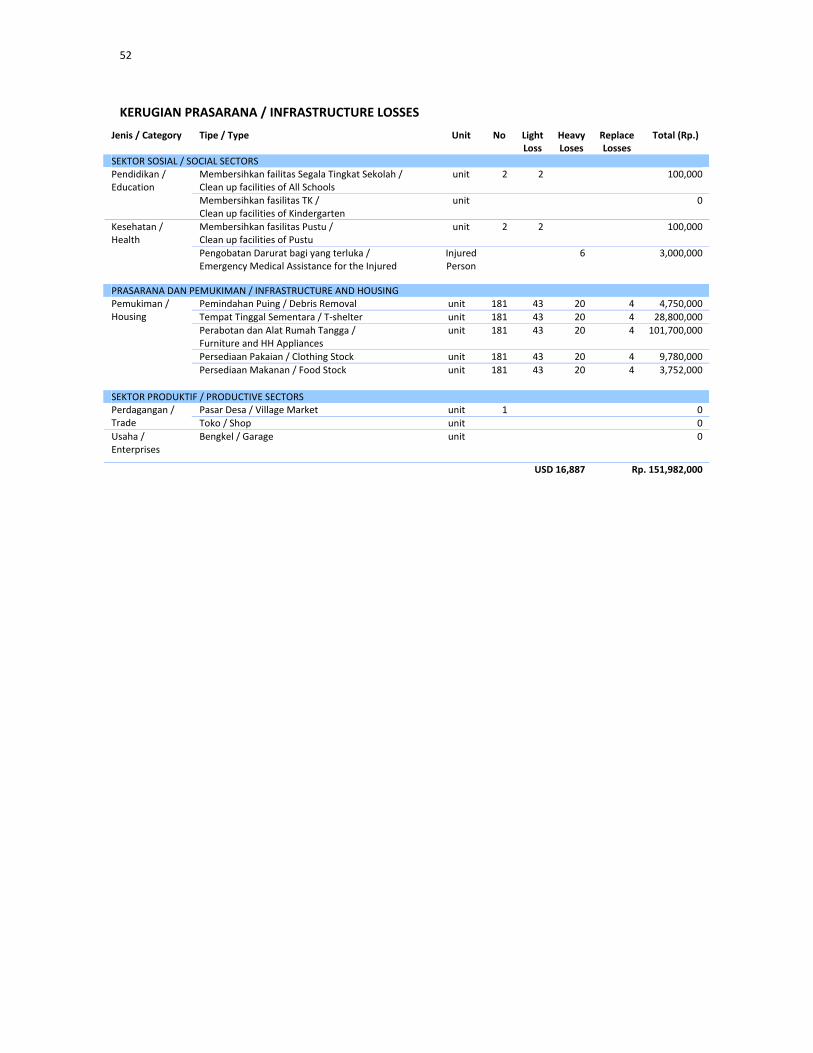
52
KERUGIAN PRASARANA / INFRASTRUCTURE LOSSES
Jenis / Category Tipe / Type Unit No Light Loss
Heavy Loses
Replace Losses
Total (Rp.)
SEKTOR SOSIAL / SOCIAL SECTORS Membersihkan failitas Segala Tingkat Sekolah / Clean up facilities of All Schools
unit 2 2 100,000 Pendidikan / Education
Membersihkan fasilitas TK / Clean up facilities of Kindergarten
unit 0
Membersihkan fasilitas Pustu / Clean up facilities of Pustu
unit 2 2 100,000 Kesehatan / Health
Pengobatan Darurat bagi yang terluka / Emergency Medical Assistance for the Injured
Injured Person
6 3,000,000
PRASARANA DAN PEMUKIMAN / INFRASTRUCTURE AND HOUSING Pemindahan Puing / Debris Removal unit 181 43 20 4 4,750,000 Tempat Tinggal Sementara / T‐shelter unit 181 43 20 4 28,800,000 Perabotan dan Alat Rumah Tangga / Furniture and HH Appliances
unit 181 43 20 4 101,700,000
Persediaan Pakaian / Clothing Stock unit 181 43 20 4 9,780,000
Pemukiman / Housing
Persediaan Makanan / Food Stock unit 181 43 20 4 3,752,000
SEKTOR PRODUKTIF / PRODUCTIVE SECTORS Pasar Desa / Village Market unit 1 0 Perdagangan /
Trade Toko / Shop unit 0 Usaha / Enterprises
Bengkel / Garage unit 0
USD 16,887 Rp. 151,982,000

53
KAJIAN BANJIR ACEH ACEH FLOOD ASSESSMENT PROGRAM PEMBANGUNAN KECAMATAN (PPK) 2007 KECAMATAN DEVELOPMENT PROGRAM (KDP) 2007 LAPORAN RINGKASAN KABUPATEN DISTRICT SUMMARY REPORT
KABUPATEN / DISTRICT: NAD ‐ ACEH TIMUR
STATISTIC OVERALL PROFILE / STATISTIK PROFIL KESELURUHAN
Populasi / Population: 42120
Kepala Keluarga (KK) / Households: 9238
Usia Produktif / Productive Age: 16135
Pekerjaan / Occupation: 20693 Petani / Farmers: 14033 Paramedis / Paramedics: 132 Nelayan / Fishermann: 234 Tentara/Polisi / Army/Police: 10 Pedagang / Traders: 1157 Usahawan / Entreprenours: 108 PNS / Civil Servants: 235 Buruh / Labourers: 4068 Guru / Teachers: 255 Lain / Other: 461
Keluarga Misking / Poor Households: 1975
Catatan: Data di bagian in berasal dari Kajian PPK terhadap Dampak Konflik dan Tsunami (2006), BPS population data (PODES 2005), dan dari program BRA‐PPK. Note: The data in this section is from the KDP Conflict and Tsunami Damage Assessment (2006), BPS population data (PODES 2005) and village population data from the BRA‐KDP program.
LOKASI YANG TERIMBAS / MENINGGAL / LUKA / HILANG AFFECTED LOCATIONS / DEATHS / INJURIES / MISSING
Kabupatenn/District Kecamatan/Sub‐district
Jumlah Korban Meninggal/ Deaths
Jumlah Korban Luka Berat/ Heavy Injuries
Jumlah Korban Luka Ringan/ Light Injuries
Jumlah Korban Hilang/ Missing
NAD ‐ Aceh Timur BIREM BAYEUN NAD ‐ Aceh Timur JULOK 5 NAD ‐ Aceh Timur PANTE BIDARI 7 160 39 NAD ‐ Aceh Timur SERBAJADI 90 NAD ‐ Aceh Timur SIMPANG JERNIH 5 3 NAD ‐ Aceh Timur SIMPANG ULIM 130 1

54
KERUSAKAN PRASARANA / INFRASTRUCTURE DAMAGE
Jenis / Category Tipe / Type Unit Not Damage
Light Damage
Heavy Damage
Needs to be
replaced
Total (Rp.)
SEKTOR SOSIAL / SOCIAL SECTORS Segala Tingkat Sekolah / All Schools unit 5 8 8 5 2,925,000,000 Pendidikan /
Education TK / Kindergarten unit 2 0 Puskesmas Pembantu / Health Post unit 1 5 4 3 1,008,000,000 Kesehatan /
Health Posyandu / Post‐Natal Clinic unit 5 5 11 3 503,500,000 Tempat Ibadah / Prayer Room unit 5 8 10 5 4,380,000,000 Masyarakat,
Budaya, Agama / Community, Culture, Religion
Meunasah/Mesjid / Mosque unit 10 9 7 7 2,160,000,000
PRASARANA DAN PEMUKIMAN / INFRASTRUCTURE AND HOUSING Rumah Penduduk / Houses unit 2,156 1,548 1,214 598 80,273,800,000 Pemukiman /
Housing Barak / Barracks KK 1 12 29,760,000 Jalan Kabupaten / District Roads meter 5,000 14,000 27,600 800 8,700,000,000 Poros Desa (diperkeras) / Villlage Road (Paved) meter 36,780 61,300 52,645 560 10,990,500,000 Poros Desa (tanah) / Village Road (Dirt) meter 1,900 23,680 34,300 5,800 2,861,600,000 Poros Dusun (diperkeras) /Hamlet Road (Paved) meter 7,700 15,710 39,000 4,881,875,000 Poros Dusun (tanah) / Hamlet Road (Dirt) meter 2,750 8,925 25,640 2,280 1,440,975,000 Lingkungan (diperkeras) / Footpath (paved) meter 4,500 360,000,000 Lingkungan (tanah) / Footpath (dirt) meter 4,050 4,000 9,600 414,400,000 Jalan Kebun (diperkeras) / Orchard Road (paved) meter 1,000 10,190 13,750 1,500 2,180,625,000 Jalan Kebun (tanah) / Orchard Road (dirt) meter 4,912 13,003 16,744 1,502 1,135,437,000 Gorong‐Gorong / Calvert unit 115 37 106 53 915,600,000 Tembok Penahan Tanah / Retaining Wall meter 1,001 2,300 3,610 200 601,200,000 Jembatan Beton / Concrete Bridge unit 12 7 10 2 1,312,000,000 Jembatan Gelagar Besi / Steel Bridge unit 1 4 260,000,000 Jembatan Gelagar Kayu / Wood Bridge unit 20 43 46 4,360,800,000
Transportasi dan Komunikasi / Transportation and
Jembatan Gantung / Suspension Bridge unit 1 2 840,000,000 Sumber Listrik / Electicity Source unit 0 Sumber Energi /
Energy Jaringan Listrik / Electricity Network meter 8,000 1,632 7,242 13,380 271,998,000 Sumur Gali / Well unit 1,294 1,153 404 24 1,542,750,000 Sumur Pompa Tangan / Hand Pump unit 32 5 7 2 5,400,000 Sumur Pompa Mesin / Machine Pump unit 7 20 13 11,500,000 Hidran Umum / Public Standpipe unit 1 2 8 48,000,000 Perpipaan / Piping meter 7,600 100 345 8,138 422,700,000 Perlindungan Mata Air / Catchment unit 1 20,000,000 Sistem Penjernihan / Purification Syste unit 0 Penampungan Air Hujan / Storage Tank unit 1 2 4 78,000,000
Air Bersih dan Sanitasi / Water and Sanitation
MCK / Public Toilet and Landry unit 9 25 23 45 2,767,800,000
SEKTOR PRODUKTIF / PRODUCTIVE SECTORS Segela Jenis Sawah / All Fields ha 3,740 958 626 572 14,674,994,778 Segala Jenis Kebun / All Plantations ha 4,350 1,495 5,199 113 10,093,248,000 Tambak / Fish Ponds ha 1,045 15 1,120,385,000 Bendungan / Weir unit 2 2 1 55,000,000 Bangunan Irigasi / Irrigation Gates unit 2 1 29,000,000 Saluran / Irrigation Channels meter 7,038 12,850 12,642 1,800 2,067,450,000 Penggilingan Padi / Rice Winnowing Facility unit 9 1 9 3 1,145,000,000
Pertanian / Agriculture
Gudang Beras / Rice Warehouse unit 1 1 15,000,000 Tempat Pelelangan Ikan / Fish Market unit 1 45,000,000 Perikanan /
Fishery Tambatan / Permanent Jetty unit 3 90,000,000 Pasar Desa / Village Market unit 2 2 1 675,000,000 Perdagangan /
Trade Toko / Shop unit 44 25 59 27 8,975,000,000 Usaha / Enterprises
Bengkel / Garage unit 16 3 60,000,000
ADMINISTRASI PEMERINTAH / GOVERNMENT ADMINISTRATION Balai/Kantor Desa / Village Office unit 5 10 10 4 1,050,000,000
USD19,755,366 Rp. 177,798,297,778

55
KERUGIAN PRASARANA / INFRASTRUCTURE LOSSES
Jenis / Category Tipe / Type Unit No Light Loss
Heavy Loses
Replace Losses
Total (Rp.)
SEKTOR SOSIAL / SOCIAL SECTORS Membersihkan failitas Segala Tingkat Sekolah / Clean up facilities of All Schools
unit 5 8 8 5 1,950,000 Pendidikan / Education
Membersihkan fasilitas TK / Clean up facilities of Kindergarten
unit 2 0
Membersihkan fasilitas Pustu / Clean up facilities of Pustu
unit 1 5 4 3 1,100,000 Kesehatan / Health
Pengobatan Darurat bagi yang terluka / Emergency Medical Assistance for the Injured
Injured Person
45 385 197,000,000
PRASARANA DAN PEMUKIMAN / INFRASTRUCTURE AND HOUSING Pemindahan Puing / Debris Removal unit 2,156 1,548 1,214 598 288,500,000 Tempat Tinggal Sementara / T‐shelter unit 2,156 1,548 1,214 598 2,174,400,000 Perabotan dan Alat Rumah Tangga / Furniture and HH Appliances
unit 2,156 1,548 1,214 598 6,815,700,000
Persediaan Pakaian / Clothing Stock unit 2,156 1,548 1,214 598 636,480,000
Pemukiman / Housing
Persediaan Makanan / Food Stock unit 2,156 1,548 1,214 598 188,160,000
SEKTOR PRODUKTIF / PRODUCTIVE SECTORS Pasar Desa / Village Market unit 2 2 1 36,000,000 Perdagangan /
Trade Toko / Shop unit 44 25 59 27 122,900,000 Usaha / Enterprises
Bengkel / Garage unit 16 3 2,100,000
USD 1,162,699 Rp. 10,464,290,000

56
KAJIAN BANJIR ACEH ACEH FLOOD ASSESSMENT PROGRAM PEMBANGUNAN KECAMATAN (PPK) 2007 KECAMATAN DEVELOPMENT PROGRAM (KDP) 2007 LAPORAN RINGKASAN KABUPATEN DISTRICT SUMMARY REPORT
KABUPATEN / DISTRICT: NAD ‐ ACEH UTARA
STATISTIC OVERALL PROFILE / STATISTIK PROFIL KESELURUHAN
Populasi / Population: 187481
Kepala Keluarga (KK) / Households: 43777
Usia Produktif / Productive Age: 94457
Pekerjaan / Occupation: 82369 Petani / Farmers: 54415 Paramedis / Paramedics: 537 Nelayan / Fishermann: 1558 Tentara/Polisi / Army/Police: 393 Pedagang / Traders: 4145 Usahawan / Entreprenours: 1111 PNS / Civil Servants: 1306 Buruh / Labourers: 14073 Guru / Teachers: 2064 Lain / Other: 2767
Keluarga Misking / Poor Households: 13855
Catatan: Data di bagian in berasal dari Kajian PPK terhadap Dampak Konflik dan Tsunami (2006), BPS population data (PODES 2005), dan dari program BRA‐PPK. Note: The data in this section is from the KDP Conflict and Tsunami Damage Assessment (2006), BPS population data (PODES 2005) and village population data from the BRA‐KDP program.
LOKASI YANG TERIMBAS / MENINGGAL / LUKA / HILANG AFFECTED LOCATIONS / DEATHS / INJURIES / MISSING
Kabupatenn/District Kecamatan/Sub‐district Jumlah Korban Meninggal/ Deaths
Jumlah Korban Luka Berat/ Heavy Injuries
Jumlah Korban Luka Ringan/ Light Injuries
Jumlah Korban Hilang/ Missing
NAD ‐ Aceh Utara BAKTIYA BARAT NAD ‐ Aceh Utara COT GIREK NAD ‐ Aceh Utara DEWANTARA NAD ‐ Aceh Utara KUTA MAKMUR 21 NAD ‐ Aceh Utara LANGKAHAN 232 87 12 NAD ‐ Aceh Utara LHOK SUKON 3 2220 51 1 NAD ‐ Aceh Utara MATANGKULI 1 NAD ‐ Aceh Utara MEURAH MULIA 25 NAD ‐ Aceh Utara MUARA BATU 73 NAD ‐ Aceh Utara NIBONG 6 NAD ‐ Aceh Utara NISAM NAD ‐ Aceh Utara PAYA BAKONG 1 40 NAD ‐ Aceh Utara SAMUDERA 46 NAD ‐ Aceh Utara SAWANG (A.UTARA) 60 9 NAD ‐ Aceh Utara SIMPANG KERAMAT NAD ‐ Aceh Utara SYAMTALIRA ARON NAD ‐ Aceh Utara SYAMTALIRA BAYU NAD ‐ Aceh Utara TANAH JAMBO AYE NAD ‐ Aceh Utara TANAH LUAS 243 24 NAD ‐ Aceh Utara TANAH PASIR 817 10

57
KERUSAKAN PRASARANA / INFRASTRUCTURE DAMAGE
Jenis / Category Tipe / Type Unit Not Damage
Light Damage
Heavy Damage
Needs to be replaced
Total (Rp.)
SEKTOR SOSIAL / SOCIAL SECTORS Segala Tingkat Sekolah / All Schools unit 101 39 27 5 7,740,000,000 Pendidikan /
Education TK / Kindergarten unit 48 25 13 5 1,530,000,000 Puskesmas Pembantu / Health Post unit 22 17 8 2 1,579,200,000 Kesehatan /
Health Posyandu / Post‐Natal Clinic unit 66 52 15 16 1,796,700,000 Tempat Ibadah / Prayer Room unit 215 109 51 23 25,680,000,000 Masyarakat,
Budaya, Agama / Community, Culture, Religion
Meunasah/Mesjid / Mosque unit 211 85 37 10 8,490,000,000
PRASARANA DAN PEMUKIMAN / INFRASTRUCTURE AND HOUSING Rumah Penduduk / Houses unit 22,126 8,686 2,280 403 173,850,600,000 Pemukiman /
Housing Barak / Barracks KK 782 212 98 438,240,000 Jalan Kabupaten / District Roads meter 228,413 64,488 34,695 5,470 17,857,550,000 Poros Desa (diperkeras) / Villlage Road (Paved) meter 264,570 110,208 99,575 15,370 22,289,550,000 Poros Desa (tanah) / Village Road (Dirt) meter 111,913 71,511 57,461 12,430 6,005,107,500 Poros Dusun (diperkeras) /Hamlet Road (Paved) meter 150,781 63,097 71,850 11,555 12,428,500,000 Poros Dusun (tanah) / Hamlet Road (Dirt) meter 131,820 75,487 62,355 13,131 5,366,133,000 Lingkungan (diperkeras) / Footpath (paved) meter 46,199 16,150 24,978 7,311 3,463,730,000 Lingkungan (tanah) / Footpath (dirt) meter 80,415 46,860 34,196 8,407 2,555,085,000 Jalan Kebun (diperkeras) / Orchard Road (paved) meter 93,640 30,040 31,025 8,374 5,922,075,000 Jalan Kebun (tanah) / Orchard Road (dirt) meter 117,001 84,590 53,780 14,428 5,321,802,000 Gorong‐Gorong / Calvert unit 976 268 392 323 4,462,800,000 Tembok Penahan Tanah / Retaining Wall meter 28,900 5,454 9,477 10,494 3,038,580,000 Jembatan Beton / Concrete Bridge unit 313 51 58 48 12,144,000,000 Jembatan Gelagar Besi / Steel Bridge unit 29 18 11 10 1,765,000,000 Jembatan Gelagar Kayu / Wood Bridge unit 41 44 49 85 6,854,400,000
Transportasi dan Komunikasi / Transportation and Communication
Jembatan Gantung / Suspension Bridge unit 8 10 5 4 3,600,000,000 Sumber Listrik / Electicity Source unit 51 14 14 16 223,200,000 Sumber Energi /
Energy Jaringan Listrik / Electricity Network meter 357,709 19,118 6,400 2,902 172,822,500 Sumur Gali / Well unit 18,682 6,378 4,379 1,865 16,947,000,000 Sumur Pompa Tangan / Hand Pump unit 96 87 46 55 79,800,000 Sumur Pompa Mesin / Machine Pump unit 827 341 87 95 223,750,000 Hidran Umum / Public Standpipe unit 10 3 7 2 41,000,000 Perpipaan / Piping meter 29,891 1,048 5,032 7,671 605,790,000 Perlindungan Mata Air / Catchment unit 1 1 5 108,000,000 Sistem Penjernihan / Purification Syste unit 4 3 2 105,000,000 Penampungan Air Hujan / Storage Tank unit 4 3 5 3 91,500,000
Air Bersih dan Sanitasi / Water and Sanitation
MCK / Public Toilet and Landry unit 274 153 155 43 7,656,600,000
SEKTOR PRODUKTIF / PRODUCTIVE SECTORS Segela Jenis Sawah / All Fields ha 10,129 4,284 3,536 315 52,460,086,605 Segala Jenis Kebun / All Plantations ha 10,172 2,534 1,665 144 4,971,746,483 Tambak / Fish Ponds ha 1,365 590 886 48 15,337,062,720 Bendungan / Weir unit 31 5 21 9 460,000,000 Bangunan Irigasi / Irrigation Gates unit 107 63 53 23 905,000,000 Saluran / Irrigation Channels meter 317,951 100,970 84,129 29,657 16,663,675,000 Penggilingan Padi / Rice Winnowing Facility unit 82 50 32 7 4,450,000,000
Pertanian / Agriculture
Gudang Beras / Rice Warehouse unit 20 19 21 8 1,935,000,000 Tempat Pelelangan Ikan / Fish Market unit 6 8 14 3 3,555,000,000 Perikanan /
Fishery Tambatan / Permanent Jetty unit 1 7 6 8 885,000,000 Pasar Desa / Village Market unit 22 10 5 2 1,800,000,000 Perdagangan /
Trade Toko / Shop unit 1,699 336 95 37 19,395,000,000 Usaha / Enterprises
Bengkel / Garage unit 112 56 45 14 6,595,000,000
ADMINISTRASI PEMERINTAH / GOVERNMENT ADMINISTRATION Balai/Kantor Desa / Village Office unit 77 37 19 18 3,045,000,000
USD 54,765,676 Rp. 492,891,085,808

58
KERUGIAN PRASARANA / INFRASTRUCTURE LOSSES
Jenis / Category Tipe / Type Unit No Light Loss
Heavy Loses
Replace Losses
Total (Rp.)
SEKTOR SOSIAL / SOCIAL SECTORS Membersihkan failitas Segala Tingkat Sekolah / Clean up facilities of All Schools
unit 101 39 27 5 5,400,000 Pendidikan / Education
Membersihkan fasilitas TK / Clean up facilities of Kindergarten
unit 48 25 13 5 3,300,000
Membersihkan fasilitas Pustu / Clean up facilities of Pustu
unit 22 17 8 2 1,950,000 Kesehatan / Health
Pengobatan Darurat bagi yang terluka / Emergency Medical Assistance for the Injured
Injured Person
181 3,783 1,909,600,000
PRASARANA DAN PEMUKIMAN / INFRASTRUCTURE AND HOUSING Pemindahan Puing / Debris Removal unit 22,126 8,686 2,280 403 722,750,000 Tempat Tinggal Sementara / T‐shelter unit 22,126 8,686 2,280 403 3,219,600,000 Perabotan dan Alat Rumah Tangga / Furniture and HH Appliances
unit 22,126 8,686 2,280 403 14,760,900,000
Persediaan Pakaian / Clothing Stock unit 22,126 8,686 2,280 403 1,326,060,000
Pemukiman / Housing
Persediaan Makanan / Food Stock unit 22,126 8,686 2,280 403 636,664,000
SEKTOR PRODUKTIF / PRODUCTIVE SECTORS Pasar Desa / Village Market unit 22 10 5 2 108,000,000 Perdagangan /
Trade Toko / Shop unit 1,699 336 95 37 218,400,000 Usaha / Enterprises
Bengkel / Garage unit 112 56 45 14 121,800,000
USD 2,559,380 Rp. 23,034,424,000
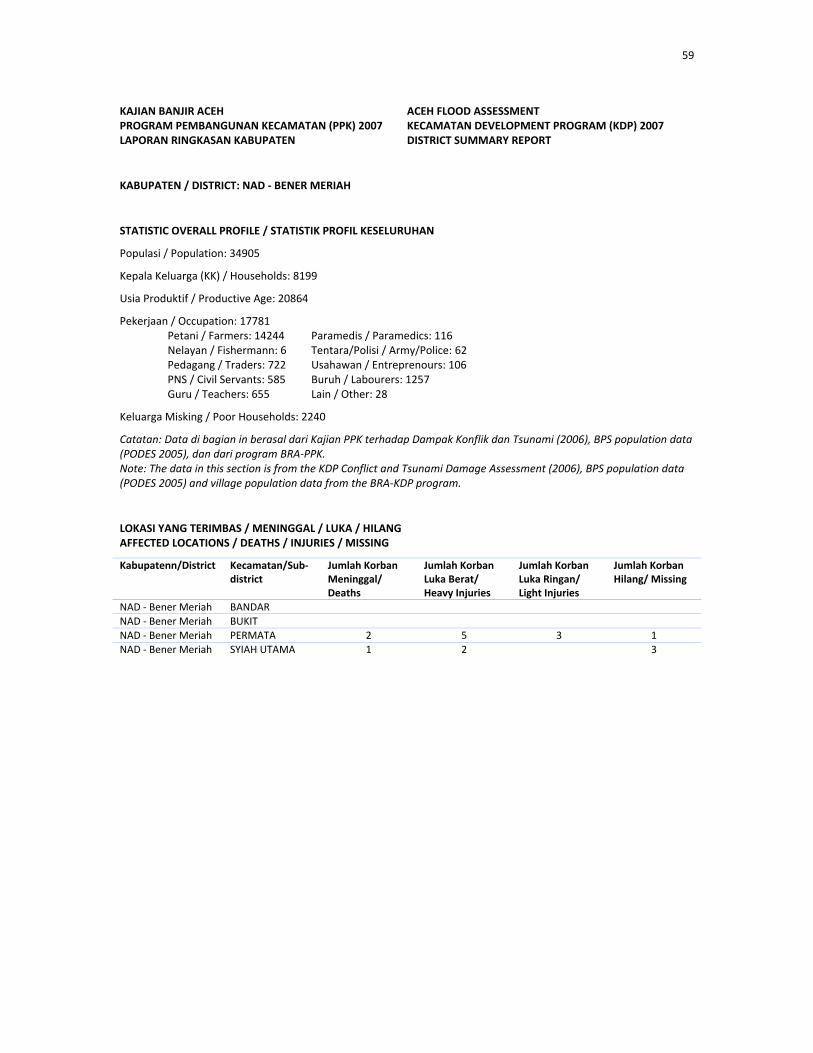
59
KAJIAN BANJIR ACEH ACEH FLOOD ASSESSMENT PROGRAM PEMBANGUNAN KECAMATAN (PPK) 2007 KECAMATAN DEVELOPMENT PROGRAM (KDP) 2007 LAPORAN RINGKASAN KABUPATEN DISTRICT SUMMARY REPORT
KABUPATEN / DISTRICT: NAD ‐ BENER MERIAH
STATISTIC OVERALL PROFILE / STATISTIK PROFIL KESELURUHAN
Populasi / Population: 34905
Kepala Keluarga (KK) / Households: 8199
Usia Produktif / Productive Age: 20864
Pekerjaan / Occupation: 17781 Petani / Farmers: 14244 Paramedis / Paramedics: 116 Nelayan / Fishermann: 6 Tentara/Polisi / Army/Police: 62 Pedagang / Traders: 722 Usahawan / Entreprenours: 106 PNS / Civil Servants: 585 Buruh / Labourers: 1257 Guru / Teachers: 655 Lain / Other: 28
Keluarga Misking / Poor Households: 2240
Catatan: Data di bagian in berasal dari Kajian PPK terhadap Dampak Konflik dan Tsunami (2006), BPS population data (PODES 2005), dan dari program BRA‐PPK. Note: The data in this section is from the KDP Conflict and Tsunami Damage Assessment (2006), BPS population data (PODES 2005) and village population data from the BRA‐KDP program.
LOKASI YANG TERIMBAS / MENINGGAL / LUKA / HILANG AFFECTED LOCATIONS / DEATHS / INJURIES / MISSING
Kabupatenn/District Kecamatan/Sub‐district
Jumlah Korban Meninggal/ Deaths
Jumlah Korban Luka Berat/ Heavy Injuries
Jumlah Korban Luka Ringan/ Light Injuries
Jumlah Korban Hilang/ Missing
NAD ‐ Bener Meriah BANDAR NAD ‐ Bener Meriah BUKIT NAD ‐ Bener Meriah PERMATA 2 5 3 1 NAD ‐ Bener Meriah SYIAH UTAMA 1 2 3

60
KERUSAKAN PRASARANA / INFRASTRUCTURE DAMAGE
Jenis / Category Tipe / Type Unit Not Damaged
Light Damage
Heavy Damage
Needs to be replaced
Total (Rp.)
SEKTOR SOSIAL / SOCIAL SECTORS Segala Tingkat Sekolah / All Schools unit 0 Pendidikan /
Education TK / Kindergarten unit 3 180,000,000 Puskesmas Pembantu / Health Post unit 0 Kesehatan /
Health Posyandu / Post‐Natal Clinic unit 0 Tempat Ibadah / Prayer Room unit 1 8 4 3,180,000,000 Masyarakat,
Budaya, Agama / Community, Culture, Religion
Meunasah/Mesjid / Mosque unit 1 2 270,000,000
PRASARANA DAN PEMUKIMAN / INFRASTRUCTURE AND HOUSING Rumah Penduduk / Houses unit 958 13 43 12 1,913,300,000 Pemukiman /
Housing Barak / Barracks KK 17 40,800,000 Jalan Kabupaten / District Roads meter 1,000 3,800 56,800 14,580,000,000 Poros Desa (diperkeras) / Villlage Road (Paved) meter 9,850 50 3,495 423,150,000 Poros Desa (tanah) / Village Road (Dirt) meter 300 600 24,920 1,265,500,000 Poros Dusun (diperkeras) /Hamlet Road (Paved) meter 150 1,000 109,375,000 Poros Dusun (tanah) / Hamlet Road (Dirt) meter 1,140 1,015 6,530 301,665,000 Lingkungan (diperkeras) / Footpath (paved) meter 3,010 240,800,000 Lingkungan (tanah) / Footpath (dirt) meter 6,300 6,000 472,200,000 Jalan Kebun (diperkeras) / Orchard Road (paved) meter 291 6,609 660,900,000 Jalan Kebun (tanah) / Orchard Road (dirt) meter 5,600 75 12,421 523,707,000 Gorong‐Gorong / Calvert unit 8 18 78 417,600,000 Tembok Penahan Tanah / Retaining Wall meter 985 454 54,480,000 Jembatan Beton / Concrete Bridge unit 16 1,536,000,000 Jembatan Gelagar Besi / Steel Bridge unit 31 1 2,093,000,000 Jembatan Gelagar Kayu / Wood Bridge unit 2 71 5 3,213,600,000
Transportasi dan Komunikasi / Transportation and Communication
Jembatan Gantung / Suspension Bridge unit 1 2 840,000,000 Sumber Listrik / Electicity Source unit 1 4,800,000 Sumber Energi /
Energy Jaringan Listrik / Electricity Network meter 0 Sumur Gali / Well unit 0 Sumur Pompa Tangan / Hand Pump unit 0 Sumur Pompa Mesin / Machine Pump unit 0 Hidran Umum / Public Standpipe unit 19 4 35,000,000 Perpipaan / Piping meter 3,020 12,430 1,710 582,700,000 Perlindungan Mata Air / Catchment unit 3 29 604,000,000 Sistem Penjernihan / Purification Syste unit 1 1 20,000,000 Penampungan Air Hujan / Storage Tank unit 0
Air Bersih dan Sanitasi / Water and Sanitation
MCK / Public Toilet and Landry unit 3 6 18 8 966,000,000
SEKTOR PRODUKTIF / PRODUCTIVE SECTORS Segela Jenis Sawah / All Fields ha 200 8 266 2,361,075,893 Segala Jenis Kebun / All Plantations ha 1,526 124 1,136 1,986,927,207 Tambak / Fish Ponds ha 261 4,345,011,300 Bendungan / Weir unit 1 1 10,000,000 Bangunan Irigasi / Irrigation Gates unit 1 3 8 65,000,000 Saluran / Irrigation Channels meter 2,050 1,370 4,290 490,650,000 Penggilingan Padi / Rice Winnowing Facility unit 0
Pertanian / Agriculture
Gudang Beras / Rice Warehouse unit 0 Tempat Pelelangan Ikan / Fish Market unit 0 Perikanan /
Fishery Tambatan / Permanent Jetty unit 0 Pasar Desa / Village Market unit 0 Perdagangan /
Trade Toko / Shop unit 6 450,000,000 Usaha / Enterprises
Bengkel / Garage unit 0
ADMINISTRASI PEMERINTAH / GOVERNMENT ADMINISTRATION Balai/Kantor Desa / Village Office unit 4 240,000,000
USD 4,941,916 Rp. 44,477,241,399

61
KERUGIAN PRASARANA / INFRASTRUCTURE LOSSES
Jenis / Category Tipe / Type Unit No Light Loss Heavy Loses
Replace Losses
Total (Rp.)
SEKTOR SOSIAL / SOCIAL SECTORS Membersihkan failitas Segala Tingkat Sekolah / Clean up facilities of All Schools
unit 0 Pendidikan / Education
Membersihkan fasilitas TK / Clean up facilities of Kindergarten
unit 3 300,000
Membersihkan fasilitas Pustu / Clean up facilities of Pustu
unit 0 Kesehatan / Health
Pengobatan Darurat bagi yang terluka / Emergency Medical Assistance for the Injured
Injured Person
3 7 3,800,000
PRASARANA DAN PEMUKIMAN / INFRASTRUCTURE AND HOUSING Pemindahan Puing / Debris Removal unit 958 13 43 12 6,750,000 Tempat Tinggal Sementara / T‐shelter unit 958 13 43 12 66,000,000 Perabotan dan Alat Rumah Tangga / Furniture and HH Appliances
unit 958 13 43 12 162,450,000
Persediaan Pakaian / Clothing Stock unit 958 13 43 12 17,280,000
Pemukiman / Housing
Persediaan Makanan / Food Stock unit 958 13 43 12 3,808,000
SEKTOR PRODUKTIF / PRODUCTIVE SECTORS Pasar Desa / Village Market unit 0 Perdagangan /
Trade Toko / Shop unit 6 8,400,000 Usaha / Enterprises
Bengkel / Garage unit 0
USD 29,865 Rp. 268,788,000

62
KAJIAN BANJIR ACEH ACEH FLOOD ASSESSMENT PROGRAM PEMBANGUNAN KECAMATAN (PPK) 2007 KECAMATAN DEVELOPMENT PROGRAM (KDP) 2007 LAPORAN RINGKASAN KABUPATEN DISTRICT SUMMARY REPORT
KABUPATEN / DISTRICT: NAD – BIREUEN
STATISTIC OVERALL PROFILE / STATISTIK PROFIL KESELURUHAN
Populasi / Population: 29276
Kepala Keluarga (KK) / Households: 6510
Usia Produktif / Productive Age: 14230
Pekerjaan / Occupation: 15839 Petani / Farmers: 7464 Paramedis / Paramedics: 163 Nelayan / Fishermann: 763 Tentara/Polisi / Army/Police: 67 Pedagang / Traders: 695 Usahawan / Entreprenours: 262 PNS / Civil Servants: 485 Buruh / Labourers: 2963 Guru / Teachers: 1054 Lain / Other: 1923
Keluarga Misking / Poor Households: 1939
Catatan: Data di bagian in berasal dari Kajian PPK terhadap Dampak Konflik dan Tsunami (2006), BPS population data (PODES 2005), dan dari program BRA‐PPK. Note: The data in this section is from the KDP Conflict and Tsunami Damage Assessment (2006), BPS population data (PODES 2005) and village population data from the BRA‐KDP program.
LOKASI YANG TERIMBAS / MENINGGAL / LUKA / HILANG AFFECTED LOCATIONS / DEATHS / INJURIES / MISSING
Kabupatenn/District Kecamatan/Sub‐district
Jumlah Korban Meninggal/ Deaths
Jumlah Korban Luka Berat/ Heavy Injuries
Jumlah Korban Luka Ringan/ Light Injuries
Jumlah Korban Hilang/ Missing
NAD ‐ Bireuen GANDA PURA 101 150 NAD ‐ Bireuen PEUSANGAN 88 20

63
KERUSAKAN PRASARANA / INFRASTRUCTURE DAMAGE
Jenis / Category Tipe / Type Unit Not Damage
Light Damage
Heavy Damage
Needs to be replaced
Total (Rp.)
SEKTOR SOSIAL / SOCIAL SECTORS Segala Tingkat Sekolah / All Schools unit 17 2 1 270,000,000 Pendidikan /
Education TK / Kindergarten unit 6 1 1 75,000,000 Puskesmas Pembantu / Health Post unit 5 1 2 420,000,000 Kesehatan /
Health Posyandu / Post‐Natal Clinic unit 26 1 2 2 169,600,000 Tempat Ibadah / Prayer Room unit 18 2 2 1 900,000,000 Masyarakat,
Budaya, Agama / Community, Culture, Religion
Meunasah/Mesjid / Mosque unit 28 4 6 2 1,140,000,000
PRASARANA DAN PEMUKIMAN / INFRASTRUCTURE AND HOUSING Rumah Penduduk / Houses unit 3,558 423 101 50 9,810,300,000 Pemukiman /
Housing Barak / Barracks KK 44 45 81 237,600,000 Jalan Kabupaten / District Roads meter 27,700 4,250 8,030 1,050 2,957,500,000 Poros Desa (diperkeras) / Villlage Road (Paved) meter 43,491 8,572 8,307 50 1,646,490,000 Poros Desa (tanah) / Village Road (Dirt) meter 18,500 1,450 3,470 220,625,000 Poros Dusun (diperkeras) /Hamlet Road (Paved) meter 16,240 7,259 3,262 80 788,887,500 Poros Dusun (tanah) / Hamlet Road (Dirt) meter 20,845 2,575 7,230 35 375,075,000 Lingkungan (diperkeras) / Footpath (paved) meter 2,405 1,700 550 129,000,000 Lingkungan (tanah) / Footpath (dirt) meter 2,600 950 450 36,200,000 Jalan Kebun (diperkeras) / Orchard Road (paved) meter 250 2,100 1,550 286,250,000 Jalan Kebun (tanah) / Orchard Road (dirt) meter 1,200 1,000 7,000 321,000,000 Gorong‐Gorong / Calvert unit 210 22 41 96 825,600,000 Tembok Penahan Tanah / Retaining Wall meter 1,962 10 810 2,922 536,100,000 Jembatan Beton / Concrete Bridge unit 6 10 13 8 2,368,000,000 Jembatan Gelagar Besi / Steel Bridge unit 6 468,000,000 Jembatan Gelagar Kayu / Wood Bridge unit 2 2 10 621,200,000
Transportasi dan Komunikasi / Transportation and Communication
Jembatan Gantung / Suspension Bridge unit 0 Sumber Listrik / Electicity Source unit 1 0 Sumber Energi /
Energy Jaringan Listrik / Electricity Network meter 28,650 200 200 500 10,050,000 Sumur Gali / Well unit 3,547 289 359 135 1,160,250,000 Sumur Pompa Tangan / Hand Pump unit 24 277 55,400,000 Sumur Pompa Mesin / Machine Pump unit 822 22 5 54 62,000,000 Hidran Umum / Public Standpipe unit 2 10,000,000 Perpipaan / Piping meter 575 100 800 34,000,000 Perlindungan Mata Air / Catchment unit 0 Sistem Penjernihan / Purification System unit 1 5 5 225,000,000 Penampungan Air Hujan / Storage Tank unit 1 6 97,500,000
Air Bersih dan Sanitasi / Water and Sanitation
MCK / Public Toilet and Landry unit 10 3 6 4 382,200,000
SEKTOR PRODUKTIF / PRODUCTIVE SECTORS Segela Jenis Sawah / All Fields ha 1,165 525 315 5,050,382,910 Segala Jenis Kebun / All Plantations ha 953 208 341 711,470,483 Tambak / Fish Ponds ha 268 311 445 28 7,717,078,600 Bendungan / Weir unit 2 2 4 1 75,000,000 Bangunan Irigasi / Irrigation Gates unit 2 4 1 49,000,000 Saluran / Irrigation Channels meter 30,390 9,593 20,009 5,937 3,174,710,000 Penggilingan Padi / Rice Winnowing Facility unit 17 6 5 495,000,000
Pertanian / Agriculture
Gudang Beras / Rice Warehouse unit 5 0 Tempat Pelelangan Ikan / Fish Market unit 3 0 Perikanan /
Fishery Tambatan / Permanent Jetty unit 3 0 Pasar Desa / Village Market unit 5 1 45,000,000 Perdagangan /
Trade Toko / Shop unit 187 2 1 115,000,000 Usaha / Enterprises
Bengkel / Garage unit 25 1 150,000,000
ADMINISTRASI PEMERINTAH / GOVERNMENT ADMINISTRATION Balai/Kantor Desa / Village Office unit 15 3 6 4 705,000,000
USD 4,991,830 Rp. 44,926,469,493

64
KERUGIAN PRASARANA / INFRASTRUCTURE LOSSES
Jenis / Category Tipe / Type Unit No Light Loss
Heavy Loses
Replace Losses
Total (Rp.)
SEKTOR SOSIAL / SOCIAL SECTORS Membersihkan failitas Segala Tingkat Sekolah / Clean up facilities of All Schools
unit 17 2 1 200,000 Pendidikan / Education
Membersihkan fasilitas TK / Clean up facilities of Kindergarten
unit 6 1 1 150,000
Membersihkan fasilitas Pustu / Clean up facilities of Pustu
unit 5 1 2 400,000 Kesehatan / Health
Pengobatan Darurat bagi yang terluka / Emergency Medical Assistance for the Injured
Injured Person
170 189 111,500,000
PRASARANA DAN PEMUKIMAN / INFRASTRUCTURE AND HOUSING Pemindahan Puing / Debris Removal unit 3,558 423 101 50 38,750,000 Tempat Tinggal Sementara / T‐shelter unit 3,558 423 101 50 181,200,000 Perabotan dan Alat Rumah Tangga / Furniture and HH Appliances
unit 3,558 423 101 50 832,950,000
Persediaan Pakaian / Clothing Stock unit 3,558 423 101 50 70,680,000
Pemukiman / Housing
Persediaan Makanan / Food Stock unit 3,558 423 101 50 32,144,000
SEKTOR PRODUKTIF / PRODUCTIVE SECTORS Pasar Desa / Village Market unit 5 1 4,500,000 Perdagangan /
Trade Toko / Shop unit 187 2 1 1,600,000 Usaha / Enterprises
Bengkel / Garage unit 25 1 1,400,000
USD 141,719 Rp. 1,275,474,000

65
KAJIAN BANJIR ACEH ACEH FLOOD ASSESSMENT PROGRAM PEMBANGUNAN KECAMATAN (PPK) 2007 KECAMATAN DEVELOPMENT PROGRAM (KDP) 2007 LAPORAN RINGKASAN KABUPATEN DISTRICT SUMMARY REPORT
KABUPATEN / DISTRICT: NAD ‐ GAYO LUES
STATISTIC OVERALL PROFILE / STATISTIK PROFIL KESELURUHAN
Populasi / Population: 4652
Kepala Keluarga (KK) / Households: 1081
Usia Produktif / Productive Age: 2201
Pekerjaan / Occupation: 3541 Petani / Farmers: 2521 Paramedis / Paramedics: 0 Nelayan / Fishermann: 120 Tentara/Polisi / Army/Police: 24 Pedagang / Traders: 58 Usahawan / Entreprenours: 20 PNS / Civil Servants: 19 Buruh / Labourers: 745 Guru / Teachers: 34 Lain / Other: 0
Keluarga Misking / Poor Households: 456
Catatan: Data di bagian in berasal dari Kajian PPK terhadap Dampak Konflik dan Tsunami (2006), BPS population data (PODES 2005), dan dari program BRA‐PPK. Note: The data in this section is from the KDP Conflict and Tsunami Damage Assessment (2006), BPS population data (PODES 2005) and village population data from the BRA‐KDP program.
LOKASI YANG TERIMBAS / MENINGGAL / LUKA / HILANG AFFECTED LOCATIONS / DEATHS / INJURIES / MISSING
Kabupatenn/District Kecamatan/ Sub‐district
Jumlah Korban Meninggal/ Deaths
Jumlah Korban Luka Berat/ Heavy Injuries
Jumlah Korban Luka Ringan/ Light Injuries
Jumlah Korban Hilang/ Missing
NAD ‐ Gayo Lues PINDING 1 61 9 3

66
KERUSAKAN PRASARANA / INFRASTRUCTURE DAMAGE
Jenis / Category Tipe / Type Unit Not Damaged
Light Damage
Heavy Damage
Needs to be replaced
Total (Rp.)
SEKTOR SOSIAL / SOCIAL SECTORS Segala Tingkat Sekolah / All Schools unit 1 1 3 3 1,260,000,000 Pendidikan /
Education TK / Kindergarten unit 1 15,000,000 Puskesmas Pembantu / Health Post unit 3 1 168,000,000 Kesehatan /
Health Posyandu / Post‐Natal Clinic unit 2 2 106,000,000 Tempat Ibadah / Prayer Room unit 3 1 5 1,560,000,000 Masyarakat,
Budaya, Agama / Community, Culture, Religion
Meunasah/Mesjid / Mosque unit 1 1 1 4 750,000,000
PRASARANA DAN PEMUKIMAN / INFRASTRUCTURE AND HOUSING Rumah Penduduk / Houses unit 470 10 74 252 15,423,000,000 Pemukiman /
Housing Barak / Barracks KK 58 278,400,000 Jalan Kabupaten / District Roads meter 11,000 11,000 49,000 13,350,000,000 Poros Desa (diperkeras) / Villlage Road (Paved) meter 3,500 2,200 5,100 777,000,000 Poros Desa (tanah) / Village Road (Dirt) meter 1,500 500 26,000 1,316,250,000 Poros Dusun (diperkeras) /Hamlet Road (Paved) meter 1,300 1,700 7,000 806,250,000 Poros Dusun (tanah) / Hamlet Road (Dirt) meter 500 1,000 2,000 111,000,000 Lingkungan (diperkeras) / Footpath (paved) meter 1,000 500 40,000,000 Lingkungan (tanah) / Footpath (dirt) meter 3,500 3,000 179,000,000 Jalan Kebun (diperkeras) / Orchard Road (paved) meter 1,000 7,000 700,000,000 Jalan Kebun (tanah) / Orchard Road (dirt) meter 3,000 20,000 921,000,000 Gorong‐Gorong / Calvert unit 4 18 108,000,000 Tembok Penahan Tanah / Retaining Wall meter 1,120 168,000,000 Jembatan Beton / Concrete Bridge unit 5 4 480,000,000 Jembatan Gelagar Besi / Steel Bridge unit 2 7 546,000,000 Jembatan Gelagar Kayu / Wood Bridge unit 16 832,000,000
Transportasi dan Komunikasi / Transportation
Jembatan Gantung / Suspension Bridge unit 2 0 Sumber Listrik / Electicity Source unit 8 5 1 78 638,800,000 Sumber Energi /
Energy Jaringan Listrik / Electricity Network meter 900 9,400 141,000,000 Sumur Gali / Well unit 1 3,000,000 Sumur Pompa Tangan / Hand Pump unit 0 Sumur Pompa Mesin / Machine Pump unit 1 1,000,000 Hidran Umum / Public Standpipe unit 4 1 4 24,000,000 Perpipaan / Piping meter 1,000 3,000 5,600 340,000,000 Perlindungan Mata Air / Catchment unit 2 2 66,000,000 Sistem Penjernihan / Purification Syste unit 2 60,000,000 Penampungan Air Hujan / Storage Tank unit 0
Air Bersih dan Sanitasi / Water and Sanitation
MCK / Public Toilet and Landry unit 1 1 4 201,600,000
SEKTOR PRODUKTIF / PRODUCTIVE SECTORS Segela Jenis Sawah / All Fields ha 327 160 4,262,628,210 Segala Jenis Kebun / All Plantations ha 360 200 1,273,655,172 Tambak / Fish Ponds ha 14 4 239,904,000 Bendungan / Weir unit 3 75,000,000 Bangunan Irigasi / Irrigation Gates unit 7 105,000,000 Saluran / Irrigation Channels meter 3,720 465,000,000 Penggilingan Padi / Rice Winnowing Facility unit 1 2 5 900,000,000
Pertanian / Agriculture
Gudang Beras / Rice Warehouse unit 0 Tempat Pelelangan Ikan / Fish Market unit 0 Perikanan /
Fishery Tambatan / Permanent Jetty unit 1 75,000,000 Pasar Desa / Village Market unit 1 1 225,000,000 Perdagangan /
Trade Toko / Shop unit 40 4 12 2,100,000,000 Usaha / Enterprises
Bengkel / Garage unit 1 1 1 95,000,000
ADMINISTRASI PEMERINTAH / GOVERNMENT ADMINISTRATION Balai/Kantor Desa / Village Office unit 2 4 300,000,000
USD 5,720,721 Rp. 51,486,487,382

67
KERUGIAN PRASARANA / INFRASTRUCTURE LOSSES
Jenis / Category Tipe / Type Unit No Light Loss
Heavy Loses
Replace Losses
Total (Rp.)
SEKTOR SOSIAL / SOCIAL SECTORS Membersihkan failitas Segala Tingkat Sekolah / Clean up facilities of All Schools
unit 1 1 3 3 800,000 Pendidikan / Education
Membersihkan fasilitas TK / Clean up facilities of Kindergarten
unit 1 50,000
Membersihkan fasilitas Pustu / Clean up facilities of Pustu
unit 3 1 150,000 Kesehatan / Health
Pengobatan Darurat bagi yang terluka / Emergency Medical Assistance for the Injured
Injured Person
9 61 31,400,000
PRASARANA DAN PEMUKIMAN / INFRASTRUCTURE AND HOUSING Pemindahan Puing / Debris Removal unit 470 10 74 252 45,700,000 Tempat Tinggal Sementara / T‐shelter unit 470 10 74 252 391,200,000 Perabotan dan Alat Rumah Tangga / Furniture and HH Appliances
unit 470 10 74 252 1,309,500,000
Persediaan Pakaian / Clothing Stock unit 470 10 74 252 98,400,000
Pemukiman / Housing
Persediaan Makanan / Food Stock unit 470 10 74 252 18,816,000
SEKTOR PRODUKTIF / PRODUCTIVE SECTORS Pasar Desa / Village Market unit 1 1 13,500,000 Perdagangan /
Trade Toko / Shop unit 40 4 12 22,400,000 Usaha / Enterprises
Bengkel / Garage unit 1 1 1 2,100,000
USD 214,891 Rp.1,934,016,000

68
ANNEX F: SUB-DISTRICT DAMAGE AND LOSSES SUMMARY District Sub‐district Damage (Rp.) Losses (Rp.) Total (Rp.) Total ($)
Aceh Tamiang BANDA MULIA 43,104,025,950 1,822,582,000 44,926,607,950 4,991,845 BANDAR PUSAKA 110,043,190,267 8,495,460,000 118,538,650,267 13,170,961 BENDAHARA 86,896,207,215 5,375,126,000 92,271,333,215 10,252,370 KARANG BARU 110,587,808,187 7,520,834,000 118,108,642,187 13,123,182 KEJURUAN MUDA 105,609,302,932 9,251,216,000 114,860,518,932 12,762,280 KOTA KUALA SIMPANG 85,315,678,466 9,967,820,000 95,283,498,466 10,587,055 MANYAK PAYED 84,406,861,634 3,609,298,000 88,016,159,634 9,779,573 RANTAU 103,305,786,105 9,835,144,000 113,140,930,105 12,571,214 SEKERAK 53,705,553,349 4,486,538,000 58,192,091,349 6,465,788 SERUWAY 43,476,208,414 2,157,666,000 45,633,874,414 5,070,430 TAMIANG HULU 32,567,183,853 2,254,252,000 34,821,435,853 3,869,048 TENGGULAN 107,610,678,828 8,509,940,000 116,120,618,828 12,902,291 Aceh Tengah LINGE 6,770,719,529 151,982,000 6,922,701,529 769,189 Aceh Timur BIREM BAYEUN 393,300,000 0 393,300,000 43,700 JULOK 4,794,350,000 122,608,000 4,916,958,000 546,329 PANTE BIDARI 93,876,796,566 5,237,538,000 99,114,334,566 11,012,704 SERBAJADI 14,390,250,030 423,260,000 14,813,510,030 1,645,946 SIMPANG JERNIH 30,906,476,440 2,994,556,000 33,901,032,440 3,766,781 SIMPANG ULIM 33,437,124,742 1,686,328,000 35,123,452,742 3,902,606 Aceh Utara BAKTIYA BARAT 3,794,421,203 43,332,000 3,837,753,203 426,417 COT GIREK 5,454,808,402 355,070,000 5,809,878,402 645,542 DEWANTARA 99,960,000 0 99,960,000 11,107 KUTA MAKMUR 27,028,987,920 954,594,000 27,983,581,920 3,109,287 LANGKAHAN 102,201,326,623 5,069,424,000 107,270,750,623 11,918,972 LHOK SUKON 110,462,088,620 6,839,596,000 117,301,684,620 13,033,521 MATANGKULI 19,385,166,342 1,059,952,000 20,445,118,342 2,271,680 MEURAH MULIA 5,174,307,232 104,386,000 5,278,693,232 586,521 MUARA BATU 15,154,917,850 855,986,000 16,010,903,850 1,778,989 NIBONG 26,131,979,154 1,089,686,000 27,221,665,154 3,024,629 NISAM 1,157,800,000 0 1,157,800,000 128,644 PAYA BAKONG 1,380,781,900 103,726,000 1,484,507,900 164,945 SAMUDERA 33,561,785,361 748,906,000 34,310,691,361 3,812,299 SAWANG (A.UTARA) 8,397,767,272 273,668,000 8,671,435,272 963,493 SIMPANG KERAMAT 1,783,872,600 50,000 1,783,922,600 198,214 SYAMTALIRA ARON 7,930,274,611 95,874,000 8,026,148,611 891,794 SYAMTALIRA BAYU 17,930,897,495 537,204,000 18,468,101,495 2,052,011 TANAH JAMBO AYE 515,611,320 30,556,000 546,167,320 60,685 TANAH LUAS 45,225,704,370 1,891,396,000 47,117,100,370 5,235,233 TANAH PASIR 60,118,627,535 2,981,018,000 63,099,645,535 7,011,072 Bener Meriah BANDAR 4,262,332,834 4,106,000 4,266,438,834 474,049 BUKIT 10,626,616,219 46,972,000 10,673,588,219 1,185,954 PERMATA 3,478,773,955 103,248,000 3,582,021,955 398,002 SYIAH UTAMA 26,109,518,391 114,462,000 26,223,980,391 2,913,776 Bireuen GANDA PURA 29,516,222,504 894,506,000 30,410,728,504 3,378,970 PEUSANGAN 15,410,246,989 380,968,000 15,791,214,989 1,754,579 Gayo Lues PINDING 51,486,487,382 1,934,016,000 53,420,503,382 5,935,611