accuracy of opus solutions for 1- to 4-h observing sessions
TRANSCRIPT

Introduction
For more than a decade, the Global Positioning System(GPS) has been revolutionizing the way surveyors,engineers, GIS professionals, and others measure posi-tional coordinates. In particular, GPS technology isenabling surveying companies to realize greater pro-ductivity. These companies, and geospatial profession-als in general, are adopting GPS technology andmerging it with their standard measuring systems toimprove their efficiency and provide better customerservices. As more and more surveying companies adoptGPS methodologies, they become the standard for therest to follow. Currently, three-dimensional (3-D)positional coordinates of points can routinely bedetermined with centimeter-level accuracy, relative toGPS active control points that are continuously oper-ated (Eckl et al. 2001). The National Geodetic Survey(NGS) a Program Office of the National Oceanic and
Atmospheric Administration (NOAA) manages such anetwork, the National and Cooperative ContinuouslyOperating Reference Station (CORS), serving a diversenumber of applications (Snay et al. 2002b; http://www.ngs.noaa.gov/CORS/). This network of activecontrol points forms the basis for the National SpatialReference System (NSRS) by providing a frameworkfor surveying and mapping activities throughout theUSA.
As a means to provide GPS users easier access to theNSRS, NGS developed the Web-based On-line Posi-tioning Users Service (OPUS), which enables its users tosubmit static GPS observation files to NGS via theWorld Wide Web; whereby OPUS will compute posi-tional coordinates for the location associated with thedata. The OPUS utility uses NGS computers and PA-GES (Program for the Adjustment of GPS Ephemerides)software (http://www.ngs.noaa.gov/GRD/GPS/DOC/toc.html) to provide geodetic positions consistent with
T. Soler
P. Michalak
N. D. Weston
R. A. Snay
R. H. Foote
Accuracy of OPUS solutions for 1- to 4-hobserving sessions
Received: 8 June 2005Accepted: 14 June 2005Published online: 1 December 2005� Springer-Verlag 2005
Abstract We processed 30 consecu-tive days of Global Positioning Sys-tem (GPS) data using the On-linePositioning Users Service (OPUS)provided by the National GeodeticSurvey (NGS) to determine how theaccuracy of derived three-dimen-sional positional coordinates de-pends on the length of the observingsession T, for T ranging from 1 h to4 h. We selected five ContinuouslyOperating Reference Stations(CORS), distributed widely acrossthe USA, and processed the GPSdata for each with correspondingdata from three of its nearby CORS.Our results support the current
OPUS policy that recommends usinga minimum of 2 h of static GPSdata. In particular, 2 h of data yiel-ded a root mean square error of 0.8,2.1, and 3.4 cm in the north, east,and up components of the derivedpositional coordinates, respectively.Results drastically improve forsolutions containing 3 h or more ofGPS data.
Keywords GPS Processingservices Æ OPUS Æ Position relativeto observation time
GPS Solut (2006) 10: 45–55DOI 10.1007/s10291-005-0007-3 ORIGINAL ARTICLE
T. Soler (&) Æ N. D. WestonR. A. Snay Æ R. H. FooteNational Geodetic Survey, NOAA,1315 East-West Highway, Silver Spring,MD 20910, USAE-mail: [email protected].: +301-713-3205Fax: +301-713-4322
P. MichalakWarsaw University of Technology,Institute of Geodesy and GeodeticAstronomy, Sq Politechniki 1,00-661 Warsaw, Poland

NSRS. OPUS is automatic and requires the user to inputonly a minimal amount of information (Mader et al.2003). It processes submitted GPS data with corre-sponding data from three nearby CORS sites. Its usersreceive OPUS-derived positional coordinates via e-mailin a timely fashion, usually a few minutes. The OPUSreport provides coordinates for both the current reali-zation of the 3-D International Terrestrial ReferenceFrame (called ITRF2000) and the current realization ofthe North American Datum of 1983 (called NAD 83(CORS96)). The adopted formulation for transformingITRF2000 coordinates to NAD 83 (CORS96) coordi-nates is given in Soler and Snay (2004) and is practicallyimplemented through the Horizontal Time-DependentPositioning (HTDP) software (Snay 1999) (see http://ngs.noaa.gov/TOOLS/Htdp/Htdp.shtml). The OPUSstandard output also provides the user with 2-D StatePlane Coordinates (SPC), Universal Transverse Merca-tor (UTM) coordinates, and for completeness, includesthe convergence, the point scale on the map, and thecombined factor involving the elevation reduction fac-tor. For professionals who desire to do their ownadjustment of vector components, OPUS also has theoption of selecting an extended output containing moredetailed information.
This investigation was motivated by the need to ad-dress the question of how accurate OPUS solutions arewhen the duration of the observing session (denoted T)spans only a few hours, specifically 1 h £ T £ 4 h.Shortening the total observation time hinders the reso-lution of integer ambiguities associated with carrierphase GPS data. Shortening T also provides less data forestimating the nuisance parameters associated with tro-pospheric refraction.
OPUS solutions
All OPUS solutions for this investigation used the ‘‘fi-nal’’ precise orbits disseminated by the InternationalGNSS Service (IGS), which are readily available via theInternet (http://igscb.jpl.nasa.gov). The IGS currentlydisseminates 3-D satellite positions (ephemeris) ata sample interval of 15 min, with accuracies of about3 cm and a latency of approximately 13 days (http://igscb.jpl.nasa.gov/components/prods.html). OPUS solu-tions use the ionospheric-free model obtained by com-bining the L1 and L2 carrier phase measurements, and adata-recording interval of 30 s. OPUS derives ITRF2000coordinates of an unknown point by selecting threeCORS sites as reference (fixed) stations. The positionalcoordinates and velocities of these three sites are ex-tracted from NGS‘ Integrated Data Base (IDB). Thecriteria followed to select the reference stations wereprimarily based on the quality of archived GPS dataduring the time span of the observing session. The dis-
tance between CORS sites is not a major concern; moreemphasis is given to the compatibility between the user’sdata and the data for the three CORS sites. OPUS ap-plies TEQC (Translate Edit Quality Control) softwaredeveloped by UNAVCO, Inc. (Estey and Meertens1999) to check data quality and formatting problems.The OPUS solution is not a solution using all datasimultaneously. Instead, it is the (unweighted) mean ofthree separate single-baseline solutions. Consequently,the choice was made to assume that checking ‘‘repeat-ability’’ is more important than doing a true multi-baseline solution. The three separate single-baselinesolutions yield the peak-to-peak error for the resultingpositional coordinates. This peak-to-peak error isthought to provide a more realistic measure of thequality of the determined positional coordinates, thanformal errors obtained via a simultaneous solution.Formal error statistics do not account for unmodeledsystematic effects due, for example, to orbital, atmo-spheric, multipath errors, and nonlinear motion of thereference stations. The peak-to-peak error representsthe difference between the maximum and minimumvalue of a positional coordinate, as obtained from thethree separate baseline solutions. Also it is alwaysgreater in magnitude than the conventional root meansquare (RMS) error, preferred by many GPS users.
Methodology and data processing
We selected five CORS sites throughout the USA toserve as unknown (‘‘rover’’) points. We assumed that the‘‘true’’ coordinates of these rover points were providedby ITRF2000 values at an epoch of 1997.00, which areposted at http://www.ngs.noaa.gov/CORS/coordinates.These coordinates are the result of a multi-year solutioninvolving GPS data ranging from 1994 to 2003. For eachrover point, we selected 30 days of data observed duringJune 2004. We subdivided each day’s data into mutually,nonoverlapping sessions for each selected value of T(1, 2, 3, and 4 h). For each subset of data we computedthe positional coordinates of each rover point usingOPUS. In each case, and to save time, we allowed OPUSto automatically select a set of three reference stations.Finally, we used only those solutions that, in each case,involved the exact same set of these reference stations.This restriction ensured that certain systematic errors(e.g. errors in the relative positional coordinates amongthe reference stations) were not introduced into the re-sults. Figure 1 depicts (as black diamonds) the locationof rover points, identified by their four-character names.The figure also shows (by open circles) the correspond-ing CORS sites selected as reference stations by OPUS.For clarity, Table 1 contains the distances and azimuths,from the rovers, to each of their three associated refer-ence stations.
46

On-line Positioning Users Service computesITRF2000 positional coordinates at the mean epoch ofthe observations, denoted t. Consequently, before com-paring results it was necessary to transform these coor-dinates from epoch t to a common epoch 1997.00,according to the well-known equation:
xðtÞyðtÞzðtÞ
8<
:
9=
;O
¼xð1997:00Þyð1997:00Þzð1997:00Þ
8<
:
9=
;þðt�1997:00Þ�
vx
vy
vz
8<
:
9=
;P
ð1Þ
where the subindices P and O stand for ‘‘published’’ and‘‘OPUS-derived,’’ respectively, and vx; vy ; vz are the
velocities along the Cartesian components x, y, and z onthe ITRF2000 frame, as explicitly given in the publishedcoordinate sheet of each CORS station.
Thus, the final coordinates on the ITRF2000 atepoch 1997.00 are:
xð1997:00Þyð1997:00Þzð1997:00Þ
8<
:
9=
;¼
xðtÞyðtÞzðtÞ
8<
:
9=
;O
þð1997:00� tÞ �vx
vy
vz
8<
:
9=
;P
ð2Þ
The differences between published and OPUS-deter-mined coordinates using Eq. 2 can be written as
dxð1997:00Þdyð1997:00Þdzð1997:00Þ
8<
:
9=
;¼
xð1997:00Þyð1997:00Þzð1997:00Þ
8<
:
9=
;P
�xð1997:00Þyð1997:00Þzð1997:00Þ
8<
:
9=
;
ð3Þ
In order to have a visual representation it is moreconvenient to plot these differences (residuals) with re-spect to a local geodetic frame pointing east, north, andup (geodetic vertical).
Therefore, the following well-known transformationis applied:
deð1997:00Þdnð1997:00Þduð1997:00Þ
8<
:
9=
;¼ ½R�
dxð1997:00Þdyð1997:00Þdzð1997:00Þ
8<
:
9=
;ð4Þ
Fig. 1 Location of the referencestations used in this study
Table 1 Location of base stations with respect to rovers
CORS station (Rover) Base stations Distance (m) Azimuth (�)
SLAI LTMH 261189.9 188.9208NEDR 280708.3 244.4947OMH1 184261.9 266.5105
MBWW CASP 103025.6 350.9761TMGO 212628.7 157.5125ZDV1 210428.2 154.6049
MIA3 MTNT 76331.5 281.2888RMND 26048.3 239.6354ZMA1 18916.8 302.5571
TCUN NMSF 223296.7 287.6911SUM1 104313.9 105.7375TXAM 157964.6 86.7427
GODE ANP1 18886.9 93.7874GAIT 36312.7 290.1976ZDC1 62594.7 278.3690
47

where [R] is the 3·3 rotation matrix of the transforma-tion between the local global frame (x, y, z) and the localgeodetic frame (e, n, u), namely (e.g. Soler and Hothem1988),
½R� ¼� sin k cos k 0
� sin / cos k � sin / sin k cos /cos / cos k cos / sin k sin /
2
4
3
5 ð5Þ
where / and k denote the geodetic latitude and longitudeof the point in question, respectively.
Resulting statistics
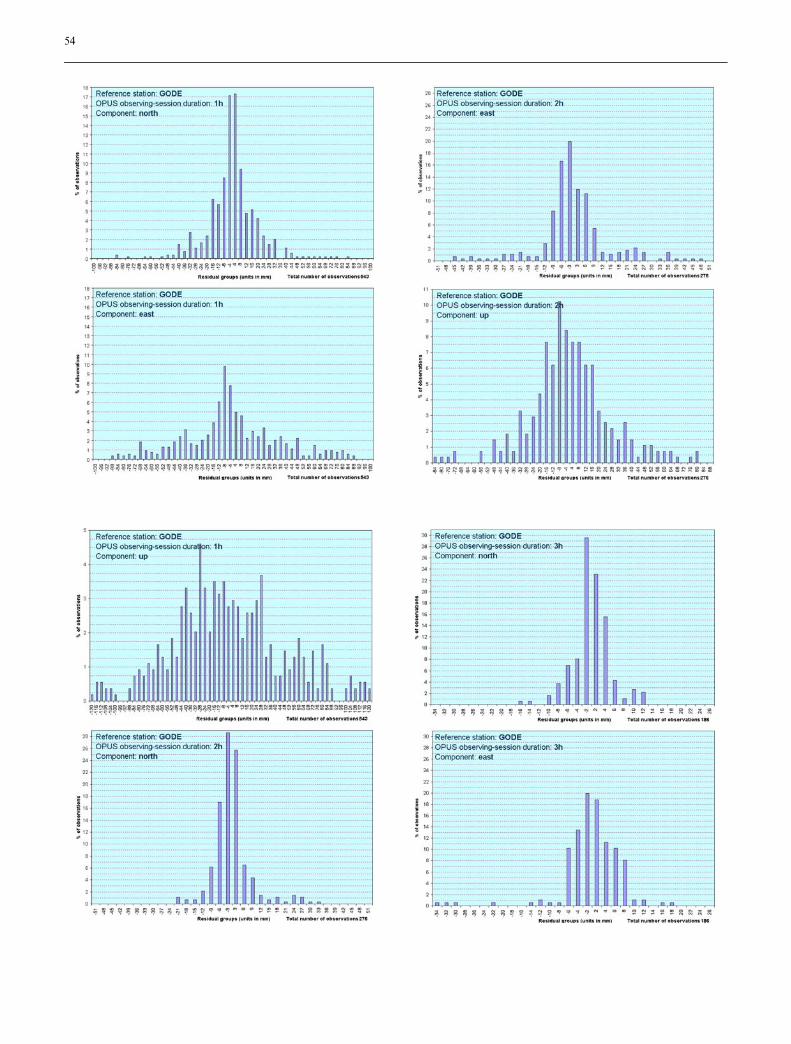
For each point P and for each considered value of T(1, 2, 3, and 4 h), the various estimates for the positionalcoordinates of the ‘‘unknown rover’’ were comparedwith the published ‘‘true’’ coordinates; and corre-sponding differences were plotted on the local horizonframe along the components north (n), east (e), and up(u) using the formulation described above. Mean andRMS values in each component were then computed foreach site and each value of T. Any individual componentof a positional difference that exceeded its correspondingRMS value by more than a factor of three was thendiscarded, and the corresponding RMS was recom-puted. Table 2 presents the number of solutions usedand the total number of rejected solutions (solutionsexceeding 3RMS+solutions with different station set).The plots for station GODE along the north, east, andup components are given explicitly in the Appendix. The
Appendix also contains histograms of the residuals forthe four observing times used in this investigation. Ifdesired, the results for all other stations can bechecked at http://www.ngs.noaa.gov/OPUS/Plots/Paper/OPUSPlotsPaper.doc. Station GODE was selected forpresentation in this paper for no particular reason exceptthat it belongs to the IGS network and is considered areliable station whose history spans several years.
When using GPS, the formal statistics associated withthe results are always optimistic because uncertaintiesassigned to observables usually do not account for var-ious systematic errors such as meteorological conditions,multipath, etc. In the case of OPUS, NGS is studying thepossibility of replacing the peak-to-peak values currentlygiven on the output by another statistic able to repre-sent, more realistically, the combined error of any OPUSsolution. The first step was taken with this particularinvestigation where the peak-to-peak error was replacedby the following empirical equation for the standarderror denoted s. This equation involves particular sta-tistics available in the OPUS output:
s ðcmÞ ¼
ffiffiffiffiffiffiffiffiffiffiffiffiffiffiffiffiffiffiffiffiffiffiffiffiffiffiffiffiffiffiffiffiffiffiffiffiffiffiffiffiffiffiffiffiffiffiffiffiffiffiffiffiffiffiffiffiffiffiffiffiffiffiffiffi
RMSO1:5
� �2
� kffiffiffiffiTp� �2
þ p1:7
� �2s
east : k ¼ 1; p ¼ penorth : k ¼ 1; p ¼ pnup : k ¼ 3:7; p ¼ pu
8><
>:ð6Þ
RMSO (cm)=overall RMS for the doubly differ-enced iono-free carrier phase observables for the threesingle baseline solutions as given in the OPUS output.
Table 2 The number of solutions performed and other statistics
CORS station T (h) Number ofall computedsolutions
Number of solutionswith the samestation set
Number ofrejected solutions(residual>3RMS)
Number of usedsolutions
Rejectedsolutions (%)
SLAI 1 713 700 24 676 3.42 356 355 15 340 4.23 238 238 9 229 3.84 177 172 4 168 2.3
MBWW 1 708 629 10 619 1.62 354 314 15 299 4.83 237 210 8 202 3.84 179 159 4 155 2.5
MIA3 1 704 556 18 538 3.22 356 283 16 267 5.73 238 224 11 213 4.94 179 136 7 129 5.1
TCUN 1 690 580 22 558 3.82 347 294 13 281 4.43 229 190 6 184 3.24 170 135 6 129 4.4
GODE 1 712 565 22 543 3.92 358 293 17 276 5.83 237 196 10 186 5.14 178 144 7 137 4.9
48

T=total session duration in hours (1, 2, 3, or 4 h).pe;pn;pu (cm)=peak-to-peak errors along the east, north,and up components as given in the OPUS output.
Values for k were derived empirically in a previousstudy (Eckl et al. 2001; Snay et al. 2002a). See also Eq. 7later.
RMSO measures how well GPS data (involved in aparticular OPUS solution) fit the mathematical modelincorporated in PAGES software. This quantity is di-vided by 1.5 cm, which based on experimental results isconsidered the average value for a good OPUS solution.
The error bars depicted on the graphs are based onEq. 6. Notice that they are primarily impacted by peak-to-peak errors, which are the most pessimistic of thesample statistics contained in Eq. 6. It is also apparentfrom the plots that the OPUS software has difficultyfixing integer ambiguities to their correct values whenthe time span of the observation is 1 h or 2 h. Hence,peak-to-peak errors are sometimes small, but the plottedpoint is located relatively far from the ‘‘true’’ value.
Table 3 summarizes the RMS errors. A perusal ofTable 3 immediately reveals that station MIA3 has thelargest RMS errors among the five rover points. Inparticular the vertical component is systematically largerby a factor of about two when compared to the othertabulated values. Although no detailed investigation tounderstand this dilemma was undertaken, the tropicalweather in Florida, marked by high humidity, and thestrong possibility that OPUS does not correctly modelfor tropospheric effects, may have contributed to thelarger than usual RMS error for the height componentat station MIA3.
In order to understand the possible troposphericinfluence on the solutions obtained for this investigation,Figs. 2 and 3 show the daily maximum and minimumrelative humidity and mean daily temperature for themonth of June for stations TCUN and MIA3, whichaccording to Table 3 are considered the best and worst
solutions of all the sites investigated. A cursory check onthe humidity plot reveals that the overall humidity forMIA3 is larger than TCUN every day of the month.Furthermore, the range between the max. and min.humidity in the case of MIA3 always ranges betweenabout 50% and 90%. The temperature graph also cor-roborates the fact that higher humidity and tempera-tures (such as MIA3) may produce the muggyconditions directly affecting the behavior of the tropo-sphere which, at present, is very difficult to model. Manyresearchers are investigating this particular topic, tryingto fully understand the real impact of humid weather onthe troposphere and GPS observations. In any case,based on the empirical results of this exercise, cautionsare in order when using GPS observations in general,and OPUS in particular, during summer months intropical areas.
Table 3 RMS values (cm) along the n, e, and u components for each point and each observing time window T. Observations werecollected during the month of June 2004
T (h) GODE MBWW MIA3 SLAI TCUN MEAN PRED
1 RMS n 1.92 2.29 2.57 2.21 1.61 2.12 0.95e 5.28 5.86 8.10 6.85 5.21 6.26 0.99u 7.31 7.35 12.63 8.12 6.91 8.46 3.65
2 RMS n 0.71 0.67 1.07 0.86 0.55 0.77 0.67e 1.63 1.45 3.62 2.32 1.52 2.11 0.70u 2.70 2.74 5.89 3.07 2.47 3.37 2.58
3 RMS n 0.39 0.42 0.67 0.52 0.43 0.48 0.55e 0.60 0.43 1.48 1.05 0.77 0.87 0.57u 1.67 1.53 3.30 1.89 1.76 2.03 2.11
4 RMS n 0.30 0.34 0.62 0.41 0.38 0.41 0.48e 0.83 0.37 0.83 0.60 0.54 0.63 0.50u 1.27 1.22 3.14 1.64 1.21 1.70 1.83
Fig. 2 Daily maximum and minimum relative humidity for themonth of June at MIA3 and TCUN
49

The overall systematic improvement of the solutionswhen observation time exceeds 1 h was expected. Alsoaccuracy for the northward component is usually better
than that for the eastward component which, in turn, isbetter than the accuracy for the upward (vertical) com-ponent. The first NGS objective, while developingOPUS, was to simplify the labor of its constituency byfreeing it from having to process GPS data. In factOPUS can be used as a ‘‘black box’’ alternative fordetermining positional coordinates referred to the NSRSwith relatively minor decision-making from a user.However, as Table 3 shows, the amount of totalobserving time in the field should be carefully consid-ered, to attain prespecified accuracies like those requiredfor some engineering/surveying projects. For example,to obtain sub-centimeter RMS error in the horizontalcomponents, the observation time span should be atleast 3 h. Assuming standard weather conditions, a 3 hobserving session should yield ellipsoidal heights with anRMS error of about 2 cm.
Figure 4 displays the mean RMS error of the fivetests performed for this investigation (Table 3). Thepredicted results (PRED in Table 3) were determinedusing the empirical formula presented in Eckl et al.(2001) and Snay et al. (2002a). According to these au-thors the RMS errors (expressed in cm) can be computedby the ‘‘simple-to-remember rule of thumb’’ equation:
Fig. 3 Mean daily temperature at MIA3 and TCUN during themonth of June
Fig. 4 OPUS results plotted against the predicted curve (Eq. 7). Note that the scale of the ‘‘up’’ plot differs from that of the ‘‘north’’ and‘‘east’’ plots
50

RMS (cmÞ ¼ kffiffiffiffiTp k ¼ 1:0;horizontal (north and eastÞ
k ¼ 3:7; vertical
�
ð7Þ
where T denotes the duration of the observing sessionexpressed in hours and k is a free parameter in units ofcm
ffiffiffiffiTp
: The efficacy of Eq. 7 rests in its ability to predictRMS errors for other possible session duration, from4 h to 24 h. As Fig. 4 and Table 3 shows, this empiricalformula extrapolates well to sessions of 3 h, however,for 2 h and less, Eq. 7 should not be applied ‘ because ofthe difficulty of fixing integer ambiguities. Notice thatthe curve of Fig. 4 does not fit well the east componentfor T<4 h.
As Fig. 4 show, the following conclusion can bedrawn: the RMS error for the north component fits wellthe predicted curve, except for the 1 h case, however,even when using only 1 h of observation time, the RMSerror in the north component is about 2 cm, which ismore than desirable for most surveying applications.With the exception of the station located in Miami(MIA3), the height (up) component fits the predictedgraph well, except for GPS observations lasting 1 h.Finally, the east component is the weakest of the threewhen the observations span a short time. This is clearlyseen in Fig. 4, where the RMS error (excluding MIA3)for 2 h of data jumps to about 2 cm and, more impor-tantly, the 1-h case gives an average RMS error of about6.5 cm. Thus, the RMS errors of the east and up com-ponents are greatly worsened for observation spans of1 h or less.
This expected degeneration of results when theobserving time is 1 h or less, is not unique to OPUS.The majority of on-line services, such as AUSPOS,SCOUT, Auto-GIPSY, and PPP, give large errorswhen short periods of time are observed (Ghoddousi-Fard and Dare 2005; Tetreault et al. 2005), corrobo-rating, primarily, that due to little or no change ingeometry and anomalous atmospheric conditions,when the observation span is short it is very difficultto fix integers properly.
Conclusions
Since 2002, NGS has been providing the GPS com-munity with OPUS processing, free of charge. Amongthe limitations for using OPUS, the time duration ofthe GPS data set was always emphasized. A minimumof 2 h of data is recommended to obtain results suf-ficiently accurate for surveying applications. The re-sults of this investigation indicate, when using 2 h ofdata, results in the north, east, and vertical (up)components have experimentally determined RMS er-rors of 0.8, 2.1, and 3.4 cm, respectively. Reducing theobservation span to less than 2 h drastically increasesuncertainties due to difficulty in fixing integer ambi-guities as consequence of poor geometry and localatmospheric disturbances. NGS is currently trying todevelop alternative software capable of reliably fixinginteger ambiguities for time periods of 15 min and less(Kashani et al. 2005).
51

Appendix
52

53
54

References
Eckl MC, Snay R, Soler T, Cline MW,Mader GL (2001) Accuracy of GPS-derived relative positions as a functionof interstation distance and observing-session duration. J Geodes 75(12):633–640
Estey LH, Meertens CM (1999) TEQC: themulti-purpose toolkit for GPS/GLON-ASS data. GPS Solutions 3(1):42–49
Ghoddousi-Fard R, Dare P (2005) OnlineGPS processing services: an initialstudy. GPS Solutions 9(3) (in press)
Kashani I, Wielgosz P, Grejner-BrzezinskaDA, Mader GL (2005) A new network-based rapid-static module for the NGSOnline Positioning User Service—OPUS-RS. ION 61st Annual Meeting,June 27–29, Cambridge, MA, (Ab-stract)
Mader GL, Weston ND, Morrison ML,Milbert DG (2003) The On-line Posi-tioning User Service (OPUS). Prof Surv23(5):26, 28, 30
Snay RA (1999) Using HTDP software totransform spatial coordinates acrosstime and between reference frames.Surv Land Inf Syst 59(1):15–25
Snay RA, Soler T, Eckl M (2002a) GPSprecision with carrier phase observa-tions: does distance and/or time matter?Prof Surv 22(10):20, 22, 24
Snay RA, Adams G, Chin M, Frakes S,Soler T, Weston ND (2002b) The syn-ergistic CORS program continues toevolve. In: Proceedings of the ION GPS2002 (CD-ROM), Institute of Naviga-tion, Alexandria, VA, pp2630–2639
Soler T, Hothem LD (1988) Coordinatesystems used in geodesy: basic defini-tions and concepts. J Surv Eng114(2):84–97
Soler T, Snay RA (2004) Transformingpositions and velocities between theInternational Terrestrial ReferenceFrame of 2000 and North AmericanDatum of 1983. J Surv Eng 130(2):49–55
Tetreault P, Kouba J, Heroux P, Legree P(2005) CSRS-PPP: an Internet servicefor GPS user access to the CanadianSpatial reference Frame. Geomatica59(1):17–28
55