accuracy and reliability of retinal photo grading for ...€¦ · tos with the test set to improve...
TRANSCRIPT

RESEARCH ARTICLE
Accuracy and reliability of retinal photo
grading for diabetic retinopathy: Remote
graders from a developing country and
standard retinal photo grader in Australia
Fakir M. Amirul Islam1,2*
1 Department of Statistics, Data Science and Epidemiology, Faculty of Health, Arts and Design, Swinburne
University of Technology, Hawthorn, Victoria, Australia, 2 Organisation for Rural Community Development
(ORCD), Dariapur, Narail, Bangladesh
Abstract
Background
To evaluate the accuracy and reliability of fundus retinal photos graded by local graders in
Bangladesh with those graded by an expert at the Centre for Eye Research Australia
(CERA) in the context of mass scale diabetic retinopathy (DR) screening in Bangladesh.
Methods
A population-based cross-sectional study of 3,104 adults identified 213 (7.2%) eligible
patients with diabetes of age� 40 years in 2012–2013. Retinal photographs were collected
using a non-mydriatic digital fundus retinal camera and a two-field imaging protocol. The
photos were graded by two remote graders (G1 and G2) who were trained by a retinal spe-
cialist (RS) in Bangladesh, by the RS himself, and by a Centre for Eye Research Australia
(CERA) grader. The local graders up skilled their grading ability by comparing 30% of the
photos graded by the CERA grader with their own grades. Learning from that exercise was
applied to the remaining 70% of photos, which were re-graded. Reliability and accuracy of
grading amongst the graders were reported using cross tabulation, inter- and intra-grader
reliability, and with sensitivity and specificity.
Results
Of 122 eyes from 61 patients, the mild (R1) DR was estimated to be 14 to 25%, pre-prolifer-
ative (R2) DR 4–8%, and proliferative (R3) DR 0.8 to 1.6%, whereas 25%, 8%, 18%, and
15% were found to be ungradable by CERA, RS, G1, and G2, respectively. Of 8 (6.6%)
eyes identified as R2 by the CERA grader, 5 (63%), 3 (38%) and 3 (38%) were correctly
classified as R2, whereas the rest were classified either as R1 or R3 but none were classi-
fied as no DR (R0) or ungradable by the RS, G1 and G2, respectively. After getting experi-
ence reviewing the 30% test set graded by the CERA grader, the local graders graded
moderate and severe DR with 100% accuracy. After excluding ungradable photos, the
PLOS ONE | https://doi.org/10.1371/journal.pone.0179310 June 20, 2017 1 / 12
a1111111111
a1111111111
a1111111111
a1111111111
a1111111111
OPENACCESS
Citation: Islam FMA (2017) Accuracy and reliability
of retinal photo grading for diabetic retinopathy:
Remote graders from a developing country and
standard retinal photo grader in Australia. PLoS
ONE 12(6): e0179310. https://doi.org/10.1371/
journal.pone.0179310
Editor: Chen-Wei Pan, Soochow University Medical
College, CHINA
Received: February 13, 2017
Accepted: May 8, 2017
Published: June 20, 2017
Copyright: © 2017 Fakir M. Amirul Islam. This is an
open access article distributed under the terms of
the Creative Commons Attribution License, which
permits unrestricted use, distribution, and
reproduction in any medium, provided the original
author and source are credited.
Data Availability Statement: All relevant data are
included in the paper and its Supporting
Information files.
Funding: The author received 5000 Euro from the
German Ophthalmology society which was spent
to buy a retinal camera as part of the total cost. The
funder had no role in study design, data collection
and analysis, decision to publish, or preparation of
the manuscript.
Competing interests: The authors have declared
that no competing interests exist.

sensitivity (specificity) relative to the CERA grader was 82% (88%) before and 80% (93%)
after training for G1 and 56% (87%) before and 77% (90%) after training for G2. In case of
maculopathy, the CERA grader reported 11.2% eyes with maculopathy, which included
100% of the 4.9% by RS, 6.6% by G1, and 7.4% by G2.
Conclusions
Local graders in Bangladesh are able to grade retinal photos with high accuracy if the DR is
at least of a moderate level. With appropriate training and experience, local graders have
the ability to contribute significantly to the grading of millions of retinal photos, which
required grading in resource- poor countries.
Introduction
Diabetic retinopathy (DR) is a major complication of diabetes mellitus (DM) which, if left
untreated, can result in blindness. Not only is it a cause of blindness, it is also associated with a
2–3 times higher risk of stroke, coronary heart disease, and heart failure independent of car-
diovascular risk factors [1, 2]. The amount of DR is increasing as the number of cases of DM
increases, especially in Asia, including Bangladesh and sub-Saharan Africa [3, 4]. A recent
meta-analysis showed that the prevalence of DM among adults in Bangladesh has increased
from 4% in 1995–2000 to 9% in 2006–2010, equating to approximately 13 million people living
with diabetes amongst the 160 million people[5]. Amongst the approximately 347 million peo-
ple worldwide reported to have DM, 34% have some form of DR and about 10% have vision-
threatening DR [6, 7]. DR accounts for 4.8% of the 37 million cases of blindness worldwide
[8].
Fortunately, DR is preventable with early diagnosis, timely referral for ophthalmic care, and
early treatment. However, one of the challenges of treating DR is that it is non-symptomatic in
the early stages and does not manifest symptoms until visual impairment occurs [8]. There-
fore, periodic screening for early detection of DR, which is universally accepted, needs to be a
priority. Currently, however, screening is not uniformly available in developed countries and
widespread systematic retinal examination of people with DM is virtually non-existent in Ban-
gladesh and other developing countries [9].
According to the American Diabetes Association (ADA) guidelines, every patients diag-
nosed with DM needs to have an immediate retinal examination and a follow-up examination
every 2 years so long as they are without DR. For those with moderate to severe DR, a follow-
up retinal examination should be completed every 3 months after detection. This indicates
that on an average, every patient with diabetes need to have a retinal examination once a year.
In total, this means that almost 13 million people with diabetes need to be photographed for
detection of DR in Bangladesh alone [10]. The process of screening for DR is complex and
attention to detail is required if screening efforts are to succeed. Friedman and colleagues [9]
conducted a comprehensive study to identify barriers to screening for DR in resource-poor
settings and reported that an efficient and accurate system must be in place if there is any hope
of screening in this setting. The authors also expressed a number of concerns about such initia-
tives, including the use of general medical doctors without specialized education and training.
[9]. However, the fact is that the human resources for eye care services and number of skilled
graders in low resource countries are extremely inadequate, [11, 12] when compared to the
Reliability and accuracy in grading retinal photos
PLOS ONE | https://doi.org/10.1371/journal.pone.0179310 June 20, 2017 2 / 12

targeted ratio of ophthalmologists to population of 1:100,000, as set in 2010 by the World
Health Organization (WHO) [13].
Bearing in mind a number of limitations in collecting and grading retinal photos in a
resource-poor setting, what can be done to screen large numbers of patients with DM in rural
areas where no specialist physicians or retinal specialists are available even at the district level.
The optimal solution is for ophthalmic assistants and technicians at the district level to be
trained in collecting and grading retinal photos and to establish a referral pathway between
technicians and the ophthalmologists in the major cities. However, it is currently unknown
whether local technicians are able to collect and grade retinal photos with an acceptable level
of accuracy.
The current study aims to check the reliability and accuracy of grading retinal photos by
rural technicians in comparison with a grader from the CERA (gold standard) grader. The
study also aims to determine if accessing feedback on photos graded by a CERA grader
increases the ability of local graders to grade photos accurately.
Materials and methods
Study sample
In a cross-sectional study of 3,104 adults aged�30 years that aimed to study the prevalence of
and risk factors for diabetes [14–17], we identified 220 participants with diabetes. Of those,
213 were 40 years of age or older and eligible to participate in this study. All eligible partici-
pants were contacted and asked to attend the Organisation for Rural Community Develop-
ment (ORCD) centre to collect retinal photographs. Participants were recruited from March
to July 2015. Retinal photographs are being obtained using a non-mydriatic digital fundus reti-
nal camera and a two-field imaging protocol. To date, retinal photos from 84 participants have
been obtained, and the study is ongoing. For the current study, we have analyzed 244 photos
from 122 eyes of 61 participants. The study participants, their characteristics, and recruitment
strategy have been described elsewhere [14, 16].
Retinal photography and grading photos
Photographs were taken using a 45-degree, 6.3 megapixel digital non-mydriatic camera
(Canon, Lake Success, NY). Participants were seated in a darkened room. Both eyes of each
participant were photographed using a two-photographic fields protocol, the first centered
on the optic disc (Field 1) and the second centered on the fovea (Field 2). Standard software
was used for image acquisition and archiving (Digital Healthcare Inc. Eye QSL, England).
Images were then graded for retinopathy and other retinal diseases. The Early Treatment
Diabetic Retinopathy Study (ETDRS) [18], which is considered to be more appropriate to
grade for retinal photos as it captures seven fields of the retina, was not used for this intended
mass scale screening for DR. The ETDRS grading scheme is very complicated and involves
seven pictures of each eye making it impractical for a large-scale screening program in a rural
setting. Therefore, a simplified version of ETDRS was used for the current grading purpose
[19].
The photos were graded by two trained, local graders-a health technologist (G1) and a
bachelor of arts graduate (G2)-and a retinal specialist who provided training to the local grad-
ers. Photos were subsequently graded by a senior grader at CERA in Melbourne, Australia, as
per same DR grading protocol [19].
Reliability and accuracy in grading retinal photos
PLOS ONE | https://doi.org/10.1371/journal.pone.0179310 June 20, 2017 3 / 12

Training for the local graders
The local graders received 2 months training from a retinal specialist at the Dhaka Vision Eye
Hospital. They received training on collecting and grading retinal photos, basic anatomy of the
eyes, and basic understanding of eye care. They also received training from a CERA grader,
which is considered to be the gold standard. The CERA grader graded photos with a compre-
hensive explanation for each of the photos, and those were sent to the local graders to improve
their grading skills. The local graders divided the photos into two groups: 1) a small group of
64 photos from 32 eyes (i.e., test set to increase grading skills) and 2) a large group of 180 pho-
tos from 90 eyes (i.e., experimental set to compare grading accuracy). The local graders
reviewed grading explanations provided by the CERA grader and compared their graded pho-
tos with the test set to improve their grading skills. By doing so, the local graders graded the
experimental set again. Grading for second time took place 3 months after the first grading,
which negates the possibility of past experience influencing grading ability. In total, photos
were graded by the two local graders, one retinal specialist (RS) and by a CERA grader who
has more than 15 years of experience in DR and retinal vessel calibre grading.
Diabetic retinopathy
Retinopathy was classified according to a modified version of ETDRS by Shotliff and Duncan
[19]: Summary of grading and management criteria. DR level was defined as:
Level R0 = None or no DR
R1 = Microaneurysms (MA), retinal hemorrhages (H) and any exudates
R2 = Intra-retinal microvascular abnormalities (IRMA), venous beading (VB), venous loop
or reduplication, multiple deep, round or blot hemorrhages, and cotton wool spots (CWS)
R3 = New vessels on disc (NVD), new vessels elsewhere (NVE), pre-retinal or vitreous hem-
orrhage, pre-retinal fibrosis ± tractional retinal detachment
Maculopathy
M0 = no maculopathy
M1 = Maculopathy present; exudate within 1 disc diameter (DD) of the centre of the fovea,
or circinate or group of exudates within the macula, or retinal thickening within 1DD of the
center of the fovea (if stereo available) or any microaneurysm or hemorrhage within 1DD of
the centre of the fovea (only if associated with a best visual acuity of�6/12)
Ethics approval
This research adhered to the tenets of the Declaration of Helsinki and the research protocol
was approved by Human Research Ethics Committee at the Swinburne University of Technol-
ogy (RES 2015/66). We obtained written consent from participants who were able to sign their
name, and a finger print was obtained from those who were unable to do so (47%). In the case
of finger print consent, the data collector provided a counter signature for the participants.
Participants were informed of their right to withdraw from the study at any stage or to request
their data be excluded from analysis.
Statistical analysis
The prevalence of DR estimated by different graders was reported using simple descriptive sta-
tistics and presented graphically. Cross tabulation was used to report agreement of level of DR
and maculopathy between CERA and other graders. Intra- and inter-grader reliability were
reported using correlation coefficients. Accuracy was assessed using sensitivity and specificity,
Reliability and accuracy in grading retinal photos
PLOS ONE | https://doi.org/10.1371/journal.pone.0179310 June 20, 2017 4 / 12
calculated using the formula for sensitivity = (a/(a+c)) and specificity = (d/(b+d)). In the for-
mula “a” equals the number of DR or maculopathy graded correctly by both graders; “b”
equals the number of DR or maculopathy correctly classified by the CERA grader but misclas-
sified by the other grader; “c” equals the number of non-DR or no maculopathy correctly clas-
sified by the CERA grader but misclassified by other grader; and “d” equals the number of
non-DR or no maculopathy correctly classified as non-DR by both the CERA and local grad-
ers. The primary objective was to report the percentage of correctly classified DR or maculopa-
thy by the local graders compared to those graded by the CERA grader. The statistical software
SPSS (SPSS Inc., version 21) was used for data analyses.
Results
The ratio of male and female participants who were included in the study (21 (35%) male and
40 (65%) female) was similar to that who were not included in the study (55 (36%) male and
97 (64%) female) from the eligible 213 participants. The mean age of the included participants
was 52 years (standard deviation = 8, range = 42–71), which was also similar to the participants
who were not included in the study 54 (11, 40–78) (Table 1).
Of 244 photos, the percentage of DR lesions (R1) (i.e., micro-aneurysm or retinal hemor-
rhage or exudates) was estimated to be 14%, 19%, 14% and 25% of eyes; preproliferative DR
(R2) was 7%, 8%, 4% and 4%; and proliferative DR (R3) was 1.6%, 0.8%, 0.8% and 1.6% eyes
which were graded by the CERA, RS, and local graders G1 and G2, respectively. The ungrad-
able photos were 25%, 8%, 18% and 15% by the CERA, RS, and local graders G1 and G2,
respectively (Fig 1).
Of 64 (52.5%) eyes identified with no retinopathy (R0) by the CERA grader, the correctly
classified eyes were 83%, 88% and 72% by RS, G1 and G2, respectively. Of 17 (13.9%) identified
as R1 of DR by the CERA grader, 5 (29%), 7 (41%) and 8 (47%) were correctly classified as R1,
whereas 3 (18%), 2 (12%) and 2 (12%) were classified as R2 by RS and G1 and G2, respectively.
Of 8 (6.6%) identified as R2 by the CERA grader, 5 (63%), 3 (38%) and 3 (38%) were correctly
classified as R2, whereas the rest were classified either as R1 or R3 and none were misclassified
as R0 or ungradable. After receiving training through a test set of 64 eyes, photos identified as
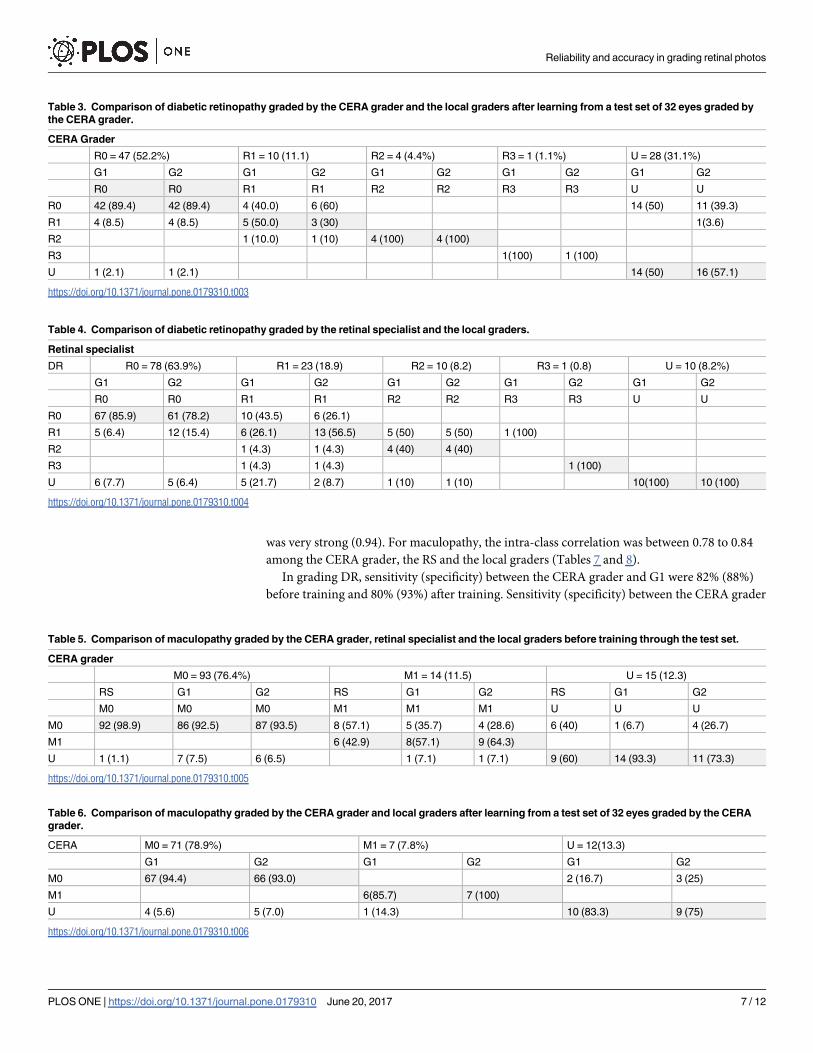
R2 and R3 by the CERA grader were perfectly classified by the local graders (Tables 2 and 3).
Of 78 (63.9%) eyes identified with no retinopathy by the RS, the correctly classified eyes were
86% and 78% by the G1 and G2, respectively. Of 23 (18.9%) identified as R1 category by the
RS, 6 (26%), 13 (57%) were correctly classified as R1 by G1 and G2, respectively. In cases of R2
and R3, more than 90% were classified correctly (Table 4).
Of 93 (76.4%) eyes identified without maculopathy by the CERA grader, the correctly classi-
fied eyes were 99%, 93% and 94% by the RS, G1 and G2, respectively. Of 14 (11.5%) identified
Table 1. Age and sex of patients with diabetes included and those who were not included in the dia-
betic retinopathy study.
aPatients not included, n = 152 bPatients were included, n = 61
Sex
Female, n (%) 97 (64) 40 (65)
Male, n (%) 55 (36) 21 (35)
Age in years
Mean (SD, min.-max.) 54 (11, 40–78) 52 (8, 41–72)
aat least 20% of DM patients were not interested to participate the DR study.bThe study is ongoing for prevalence of and risk factors for DR study.
https://doi.org/10.1371/journal.pone.0179310.t001
Reliability and accuracy in grading retinal photos
PLOS ONE | https://doi.org/10.1371/journal.pone.0179310 June 20, 2017 5 / 12

as M1 category by the CERA grader, 6 (43%), 8 (57%) and 9 (64%) were correctly classified by
the RS, G1 and G2, respectively. After training was received through the training set of 7
(7.8%) graded as M1 by the CERA grader, 6 (86%) and 7 (100) were correctly classified by G1
and G2, respectively (Tables 5 and 6).
Intra-class correlation coefficients between the CERA grader and the RS (0.62), G1 (0.70),
and G2 (0.63) were good, but these were stronger between RS and the local graders, G1 (0.78)
and G2 (0.83), respectively. The intra-class correlation between the local graders G1 and G2
Fig 1. DR (%) graded by CERA grader, retinal specialist (R. Specialist) and the local graders (Grader 1 and Grader 1).
https://doi.org/10.1371/journal.pone.0179310.g001
Table 2. Comparison of diabetic retinopathy graded by the CERA grader, retinal specialist and the local graders before training through the test
set.
CERA grader
R0 = 64 (52.5%) R1 = 17 (13.9) R2 = 8 (6.6) R3 = 2 (1.6) U = 31 (25.4%)
RS G1 G2 RS G1 G2 RS G1 G2 RS G1 G2 RS G1 G2
R0 R0 R0 R1 R1 R1 R2 R2 R2 R3 R3 R3 U U U
R0 53 (82.8) 56 (87.5) 46 (71.9) 9 (52.9) 8 (47.1) 7 (41.2) 16 (51.6) 13 (41.9) 14 (45.2)
R1 11 (17.2) 4 (6.3) 15 (23.4) 5 (29.4) 7 (41.2) 8 (47.1) 2 (25.0) 4 (50.0) 3 (37.5) 1 (50) 1 (50) 5 (16.1) 1 (3.2) 3 (9.7)
R2 3 (17.6) 2 (11.8) 2 (11.8) 5 (62.5) 3 (37.5) 3 (37.5) 1 (50) 1 (3.2)
R3 1 (12.5) 1 (12.5) 2 (25.0)
U 4 (6.3) 3 (4.7) 1 (50) 1 (50) 1 (50) 9 (29.0) 17 (54.8) 14 (45.2)
https://doi.org/10.1371/journal.pone.0179310.t002
Reliability and accuracy in grading retinal photos
PLOS ONE | https://doi.org/10.1371/journal.pone.0179310 June 20, 2017 6 / 12
was very strong (0.94). For maculopathy, the intra-class correlation was between 0.78 to 0.84
among the CERA grader, the RS and the local graders (Tables 7 and 8).
In grading DR, sensitivity (specificity) between the CERA grader and G1 were 82% (88%)
before training and 80% (93%) after training. Sensitivity (specificity) between the CERA grader
Table 3. Comparison of diabetic retinopathy graded by the CERA grader and the local graders after learning from a test set of 32 eyes graded by
the CERA grader.
CERA Grader
R0 = 47 (52.2%) R1 = 10 (11.1) R2 = 4 (4.4%) R3 = 1 (1.1%) U = 28 (31.1%)
G1 G2 G1 G2 G1 G2 G1 G2 G1 G2
R0 R0 R1 R1 R2 R2 R3 R3 U U
R0 42 (89.4) 42 (89.4) 4 (40.0) 6 (60) 14 (50) 11 (39.3)
R1 4 (8.5) 4 (8.5) 5 (50.0) 3 (30) 1(3.6)
R2 1 (10.0) 1 (10) 4 (100) 4 (100)
R3 1(100) 1 (100)
U 1 (2.1) 1 (2.1) 14 (50) 16 (57.1)
https://doi.org/10.1371/journal.pone.0179310.t003
Table 4. Comparison of diabetic retinopathy graded by the retinal specialist and the local graders.
Retinal specialist
DR R0 = 78 (63.9%) R1 = 23 (18.9) R2 = 10 (8.2) R3 = 1 (0.8) U = 10 (8.2%)
G1 G2 G1 G2 G1 G2 G1 G2 G1 G2
R0 R0 R1 R1 R2 R2 R3 R3 U U
R0 67 (85.9) 61 (78.2) 10 (43.5) 6 (26.1)
R1 5 (6.4) 12 (15.4) 6 (26.1) 13 (56.5) 5 (50) 5 (50) 1 (100)
R2 1 (4.3) 1 (4.3) 4 (40) 4 (40)
R3 1 (4.3) 1 (4.3) 1 (100)
U 6 (7.7) 5 (6.4) 5 (21.7) 2 (8.7) 1 (10) 1 (10) 10(100) 10 (100)
https://doi.org/10.1371/journal.pone.0179310.t004
Table 5. Comparison of maculopathy graded by the CERA grader, retinal specialist and the local graders before training through the test set.
CERA grader
M0 = 93 (76.4%) M1 = 14 (11.5) U = 15 (12.3)
RS G1 G2 RS G1 G2 RS G1 G2
M0 M0 M0 M1 M1 M1 U U U
M0 92 (98.9) 86 (92.5) 87 (93.5) 8 (57.1) 5 (35.7) 4 (28.6) 6 (40) 1 (6.7) 4 (26.7)
M1 6 (42.9) 8(57.1) 9 (64.3)
U 1 (1.1) 7 (7.5) 6 (6.5) 1 (7.1) 1 (7.1) 9 (60) 14 (93.3) 11 (73.3)
https://doi.org/10.1371/journal.pone.0179310.t005
Table 6. Comparison of maculopathy graded by the CERA grader and local graders after learning from a test set of 32 eyes graded by the CERA
grader.
CERA M0 = 71 (78.9%) M1 = 7 (7.8%) U = 12(13.3)
G1 G2 G1 G2 G1 G2
M0 67 (94.4) 66 (93.0) 2 (16.7) 3 (25)
M1 6(85.7) 7 (100)
U 4 (5.6) 5 (7.0) 1 (14.3) 10 (83.3) 9 (75)
https://doi.org/10.1371/journal.pone.0179310.t006
Reliability and accuracy in grading retinal photos
PLOS ONE | https://doi.org/10.1371/journal.pone.0179310 June 20, 2017 7 / 12

and G2 were 56% (87%) before training and 77% (90%) after training. In case of maculopathy,
the sensitivities were 100% and specificities were above 85% among the CERA grader, the RS,
and local graders (Tables 9 and 10).
Discussion
In this first study of reliability and accuracy of grading retinal photos by local graders in a rural
district in Bangladesh compared with a senior grader at CERA, we found that local graders are
able to grade photos with at least 80% accuracy. The accuracy becomes at least 80% if DR is at
Table 7. Intra-class correlation coefficient (95% CI) among CERA grader, retinal specialist and local
graders in grading DR and maculopathy before training through the test set.
CERA grader Retinal Specialist Grader 1
Diabetic Retinopathy
Retinal Specialist 0.62 (0.46, 0.73)**
Grader 1 0.70 (0.58, 0.79)** 0.78 (0.68, 0.85)**
Grader 2 0.63 (0.47, 0.74)** 0.83 (0.75, 0.88)** 0.94 (0.92, 0.96) **
Maculopathy
Retinal Specialist 0.80 (0.71, 0.86)**
Grader 1 0.84 (0.76, 0.88)** 0.76 (0.66, 0.83)**
Grader 2 0.78 (0.68, 0.84)** 0.83 (0.76, 0.88)** 0.94 (0.91, 0.96) **
** for P<0.001
https://doi.org/10.1371/journal.pone.0179310.t007
Table 8. Intra-class correlation coefficient (95% CI) among CERA grader and local graders in grading
DR after learning from a test set of 32 eyes graded by the CERA grader.
CERA grader Grader 1
Grader 1 0.71 (0.56, 0.81)**
Grader 2 0.77 (0.65, 0.85)** 0.90 (0.80, 0.92)**
** for P<0.001
https://doi.org/10.1371/journal.pone.0179310.t008
Table 9. Correctly classified retinal photos with and without DR, and with and without maculopathy by CERA grader, retinal specialist and the
local graders before training through the test set.
Diabetic Retinopathy
Retinal Specialist Grader 1 Grader 2
CERA grader DR + DR- DR + DR- DR + DR-
DR+ 17 9 18 8 19 7
DR- 11 53 4 56 15 46
Sensitivity 61% 82% 56%
Specificity 86% 88% 87%
Maculopathy
CERA grader Mac.+ Mac.- Mac.+ Mac.- Mac.+ Mac.-
Maculopathy+ 6 8 8 5 9 4
Maculopathy - 0 92 0 86 0 87
Sensitivity 100% 100% 100%
Specificity 92% 95% 96%
https://doi.org/10.1371/journal.pone.0179310.t009
Reliability and accuracy in grading retinal photos
PLOS ONE | https://doi.org/10.1371/journal.pone.0179310 June 20, 2017 8 / 12
the moderate to severe stage by taking trainings from the specialist graders from overseas and
by comparing their own grading with the photos graded by the specialist graders. Initially, the
interclass correlation of grading photos between the RS and the local graders was about 80%,
though it was only about 60% between the CERA and local graders. However, after the local
graders were trained using a test set graded by the CERA grader, the interclass correlation
increased to more than 70%. In case of maculopathy, interclass correlation coefficients were
more than 85% and sensitivity increased more than 20% (56% before and 77% after training).
These findings are important given the need to collect and grade retinal photos, per ADA crite-
ria [10], from a large population with DM in Bangladesh and other resource-poor countries.
This research demonstrated that task sharing amongst ophthalmologists and mid-level eye
and health care workers in screening and detection of DR is needed, possible, and has the
potential to address the current shortage in the eye care workforce. The findings from this
research included good reliability and accuracy in grading retinal photos by local graders com-
pared with the CERA grader. Expanding the roles of mid-level health workers and ophthal-
mologists in major eye hospitals can creating bridges between people with diabetes in the
community and help extend eye care to the community. This entails empowering mid-level
eye and health care workers and providing them with adequate training, technology, and pol-
icy to share specific tasks with ophthalmologists. Task sharing in eye care for people with dia-
betes could provide benefits of increased access to eye care services and optimum utilization of
the health workforce, which are important elements in eye care delivery [11, 12].
The local graders were able to grade photos in the R2 and R3 categories above 90% correctly
after gaining skills from the test set graded by the CERA grader. However, there was a reason-
able proportion of misclassification in the case of R1 category. The local graders, including the
RS, graded the majority of the photos as R0, however, those were graded as R1 by the CERA
grader. In fact, tracking small retinal features, such as micro-aneurysms, requires more experi-
ence and skill, high recordkeeping accuracy, and competence in grading [20]. Therefore, mis-
classification in the R1 category by the local graders was anticipated and their accuracy can be
expected to increase in reliability as their years of experience increases. Since the R1 category
requires the participant to undergo a second retinal examination after a year and R2 and R3
categories need immediate referral to an ophthalmologist, misclassification of a proportion of
the R1 category may a less serious issue at the screening stage.
The prevalence of DR in our study was (22.1%), as graded by the CERA grader, and 18.8%
to 30.3%, as graded by the RS and local graders. The results from the local graders are compa-
rable with another study conducted in a small sample in Bangladesh (21.6%) [21], the Hoorn
study (23.5%) in Netherlands [22], but higher than the Finnish study in Finland (14.0%) and
the Chennai Urban Rural Epidemiology Study (CURES) in India (17.6%)[23]. The prevalence
of DR graded by the CERA grader would be higher than 22.1% if the grader had been able to
grade 100% of the photos. The prevalence of 22.1% was found from 75% of the gradable
photos, indicating about 30% would have DR if all photos had been gradable. The higher
Table 10. Correctly classified retinal photos with and without DR by CERA grader and the local grad-
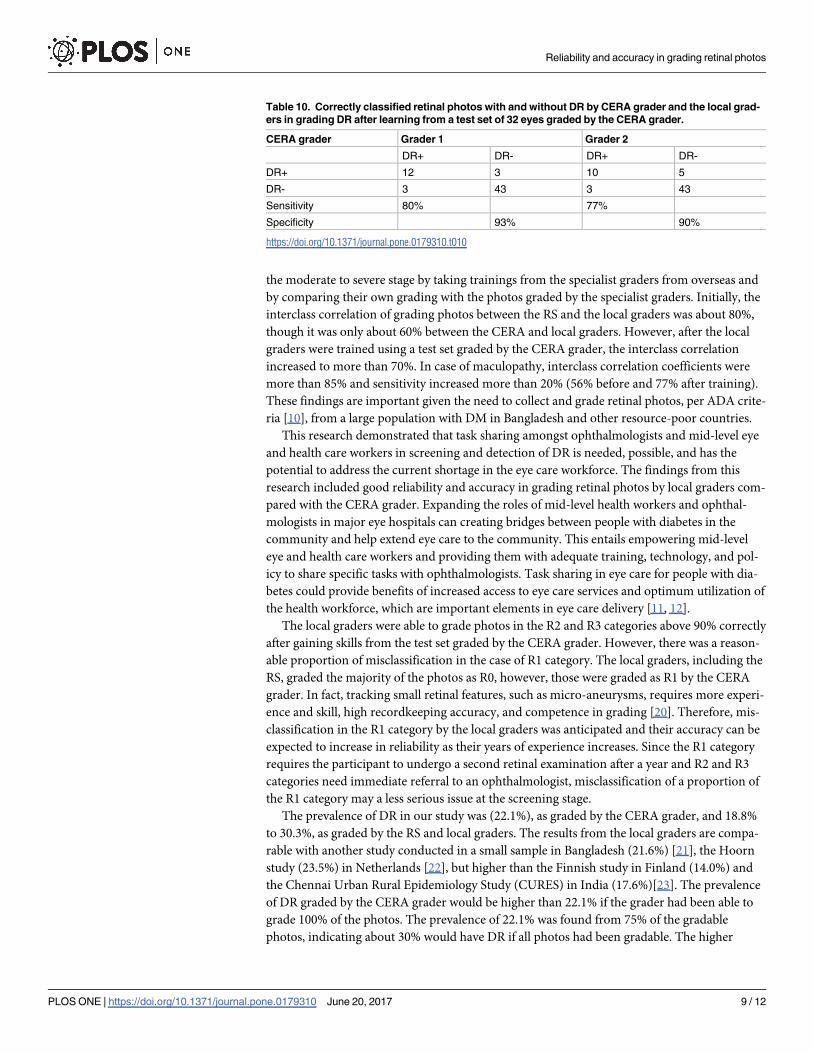
ers in grading DR after learning from a test set of 32 eyes graded by the CERA grader.
CERA grader Grader 1 Grader 2
DR+ DR- DR+ DR-
DR+ 12 3 10 5
DR- 3 43 3 43
Sensitivity 80% 77%
Specificity 93% 90%
https://doi.org/10.1371/journal.pone.0179310.t010
Reliability and accuracy in grading retinal photos
PLOS ONE | https://doi.org/10.1371/journal.pone.0179310 June 20, 2017 9 / 12
prevalence of DR in our study compared to the previous study in Bangladesh can be attributed
with the fact that our study was conducted in people of age 40 years or older, compared to
25 years and older in another study [21], as DR is consistently associated with older age [21,
22, 24].
Amongst the strengths of our study is the obtainment of the first data investigating the
accuracy and reliability of grading retinal photos by local graders in a rural district in Bangla-
desh, compared with a world class grader at CERA and with a RS in Bangladesh. Non-mydri-
atic fundus retinal camera, which is considered the gold standard for collecting retinal photos,
was used for this study. The potential limitation of our study was use of a two photographic
fields protocol, compared to most studies which use seven fields protocol to capture DR lesions
[2, 18, 24–26]. The sample size was small and thus the study had insufficient power, caution is
necessary before recommending mass scale grading by local graders.
Conclusions
In conclusion, this study demonstrated that local graders can be trained by retinal specialists
in Bangladesh and that grading accuracy increases significantly if local graders are able to
access photos with an explanation of grading provided by an expert grader located overseas.
This is beneficial because it showed that learning can occur without the physical attendance of
rural graders in developed countries, which would involve a huge amount of cost for remote
graders. This study also demonstrated that grading by local graders would help address the
challenge of the massive increase in diabetes and its complications in rural Bangladesh.
Supporting information
S1 Dataset. Diabetic retinopathy data.
(SAV)
Acknowledgments
There are many people to acknowledge for this manuscript. I would like to thank Dr Muham-
mad Moniruzzman, retinal specialist at Dhaka Vision Eye Hospital, for providing training to
the local graders and for also grading the photos himself. I would like to thank the CERA
grader, Jessica Alessi-Calandro, for grading the photos and providing detailed notes to aid the
local graders in improving their knowledge and skill. Thanks to local retinal photographers
and graders, Arzan Hossain and Lima Asma, and the project coordinator, Md Rafiqul Islam,
without whom the study would not have been possible. Thanks goes to Professor Robert Fin-
ger, Department of Ophthalmology at the University of Bonn, for his sincere support to con-
duct the research by writing grant to the German Ophthalmology Society which was funded in
2013. Thanks also goes to Dr Rahul Chakrabarti for his suggestion to write this manuscript. I
am grateful to Dr Jessica Mackelprang-Carter, Lecturer of Psychological Sciences, Swinburne
University of Technology, for reviewing the manuscript for language and grammar. Finally, I
would like to express my gratitude to the study participants for their voluntary participation.
Author Contributions
Conceptualization: FMAI.
Data curation: FMAI.
Formal analysis: FMAI.
Reliability and accuracy in grading retinal photos
PLOS ONE | https://doi.org/10.1371/journal.pone.0179310 June 20, 2017 10 / 12

Funding acquisition: FMAI.
Investigation: FMAI.
Methodology: FMAI.
Project administration: FMAI.
Resources: FMAI.
Software: FMAI.
Supervision: FMAI.
Validation: FMAI.
Visualization: FMAI.
Writing – original draft: FMAI.
Writing – review & editing: FMAI.
References1. Cheung N, Rogers S, Couper DJ, Klein R, Sharrett AR, Wong TY. Is diabetic retinopathy an indepen-
dent risk factor for ischemic stroke? Stroke. 2007; 38(2):398–401. Epub 2006/12/30. https://doi.org/10.
1161/01.STR.0000254547.91276.50 PMID: 17194880.
2. Cheung N, Wang JJ, Klein R, Couper DJ, Sharrett AR, Wong TY. Diabetic retinopathy and the risk of
coronary heart disease: the Atherosclerosis Risk in Communities Study. Diabetes Care. 2007; 30
(7):1742–6. Epub 2007/03/29. https://doi.org/10.2337/dc07-0264 PMID: 17389333.
3. IDF. International Diabetes Atlas sixth edition. http://www.idf.org/atlasmap/atlasmap. 2013.
4. Guariguata L, Whiting DR, Hambleton I, Beagley J, Linnenkamp U, Shaw JE. Global estimates of diabe-
tes prevalence for 2013 and projections for 2035. Diabetes Res Clin Pract. 2014; 103(2):137–49.
https://doi.org/10.1016/j.diabres.2013.11.002 PMID: 24630390.
5. Saquib N, Saquib J, Ahmed T, Khanam MA, Cullen MR. Cardiovascular diseases and type 2 diabetes
in Bangladesh: a systematic review and meta-analysis of studies between 1995 and 2010. BMC public
health. 2012; 12:434. https://doi.org/10.1186/1471-2458-12-434 PMID: 22694854.
6. Yau JW, Rogers SL, Kawasaki R, Lamoureux EL, Kowalski JW, Bek T, et al. Global prevalence and
major risk factors of diabetic retinopathy. Diabetes Care. 2012; 35(3):556–64. https://doi.org/10.2337/
dc11-1909 PMID: 22301125;
7. World Health Organization. Diabetes. Geneva, Switzerland: World Health Organization. 2014.
8. World Health Organization. Prevention of Blindness From Diabetes Mellitus: Report of a WHO Consul-
tation in Geneva, Switzerland, 9–11 November 2005. Geneva, Switzerland: World Health Organization;
2006. 2005.
9. Friedman DS, Ali F, Kourgialis N. Diabetic retinopathy in the developing world: how to approach identify-
ing and treating underserved populations. Am J Ophthalmol. 2011; 151(2):192–4 e1. https://doi.org/10.
1016/j.ajo.2010.10.014 PMID: 21251492.
10. American Diabetes Association. Standards of medical care in diabetes. Diabetes Care 2013; 36: S11–
S66. https://doi.org/10.2337/dc13-S011 PMID: 23264422
11. Resnikoff S, Felch W, Gauthier TM, Spivey B. The number of ophthalmologists in practice and training
worldwide: a growing gap despite more than 200,000 practitioners. Br J Ophthalmol. 2012; 96(6):783–
7. https://doi.org/10.1136/bjophthalmol-2011-301378 PMID: 22452836.
12. Awan H, Khan MD, Felch W, Spivey B, Taylor H, Resnikoff S, et al. Status of Ophthalmic Education and
the Eye Health Workforce in South Asian Association for Regional Cooperation Countries. Asia Pac J
Ophthalmol (Phila). 2014; 3(2):74–82. https://doi.org/10.1097/APO.0000000000000037 PMID:
26107489.
13. Organization. WH. Situation Analysis of VISION 2020 in the WHO South-East Asia Region. 2012.
14. Islam FM, Chakrabarti R, Dirani M, Islam MT, Ormsby G, Wahab M, et al. Knowledge, Attitudes and
Practice of Diabetes in Rural Bangladesh: The Bangladesh Population Based Diabetes and Eye Study
(BPDES). PLoS One. 2014; 9(10):e110368. https://doi.org/10.1371/journal.pone.0110368 PMID:
25313643;
Reliability and accuracy in grading retinal photos
PLOS ONE | https://doi.org/10.1371/journal.pone.0179310 June 20, 2017 11 / 12
15. Chakrabarti R, Finger RP, Lamoureux E, Islam MT, Dirani M, Bhuiyan MA, et al. Rationale and method-
ology for a population-based study of diabetes and common eye diseases in a rural area in Bangladesh:
Bangladesh Population-based Diabetes and Eye Study (BPDES). Bangladesh Journal of Medical Sci-
ence 2015; 14(ePub).
16. Islam FM, Chakrabarti R, Islam MT, Wahab M, Lamoureux E, Finger RP, et al. Prediabetes, diagnosed
and undiagnosed diabetes, their risk factors and association with knowledge of diabetes in rural Bangla-
desh: The Bangladesh Population-based Diabetes and Eye Study. Journal of diabetes. 2015. https://
doi.org/10.1111/1753-0407.12294 PMID: 25851830.
17. Islam FM, Chakrabarti R, Islam SZ, Finger RP, Critchley C. Factors Associated with Awareness, Atti-
tudes and Practices Regarding Common Eye Diseases in the General Population in a Rural District in
Bangladesh: The Bangladesh Population-based Diabetes and Eye Study (BPDES). PLoS One. 2015;
10(7):e0133043. https://doi.org/10.1371/journal.pone.0133043 PMID: 26200458;
18. Early Treatment Diabetic Retinopathy Study Research Group. Grading diabetic retinopathy from ste-
reoscopic color fundus photographs: an extension of the modified Airlie House classification: ETDRS
report number 10. Ophthalmology 1991; 98(suppl):786–806.
19. Shorliff K, Duncan G. Diabetic retinopathy: summary of grading and management criteria. Pract Diab
Int 2006; 23(9).
20. Adal KM, van Etten PG, Martinez JP, van Vliet LJ, Vermeer KA. Accuracy assessment of intra- and
intervisit fundus image registration for diabetic retinopathy screening. Invest Ophthalmol Vis Sci. 2015;
56(3):1805–12. https://doi.org/10.1167/iovs.14-15949 PMID: 25650416.
21. Akhter A, Fatema K, Ahmed SF, Afroz A, Ali L, Hussain A. Prevalence and associated risk indicators of
retinopathy in a rural Bangladeshi population with and without diabetes. Ophthalmic Epidemiol. 2013;
20(4):220–7. https://doi.org/10.3109/09286586.2013.809770 PMID: 23865602.
22. van Leiden HA, Dekker JM, Moll AC, Nijpels G, Heine RJ, Bouter LM, et al. Blood pressure, lipids, and
obesity are associated with retinopathy: the hoorn study. Diabetes Care. 2002; 25(8):1320–5. PMID:
12145228.
23. Rema M, Premkumar S, Anitha B, Deepa R, Pradeepa R, Mohan V. Prevalence of diabetic retinopathy
in urban India: the Chennai Urban Rural Epidemiology Study (CURES) eye study, I. Invest Ophthalmol
Vis Sci. 2005; 46(7):2328–33. https://doi.org/10.1167/iovs.05-0019 PMID: 15980218.
24. Wong TY, Klein R, Sharrett AR, Manolio TA, Hubbard LD, Marino EK, et al. The prevalence and risk fac-
tors of retinal microvascular abnormalities in older persons: The Cardiovascular Health Study. Ophthal-
mology. 2003; 110(4):658–66. https://doi.org/10.1016/S0161-6420(02)01931-0 PMID: 12689883.
25. Wong TY, Klein R, Islam FM, Cotch MF, Folsom AR, Klein BE, et al. Diabetic retinopathy in a multi-eth-
nic cohort in the United States. Am J Ophthalmol. 2006; 141(3):446–55. Epub 2006/02/24. https://doi.
org/10.1016/j.ajo.2005.08.063 PMID: 16490489;
26. Cheung N, Islam FM, Saw SM, Shankar A, de Haseth K, Mitchell P, et al. Distribution and associations
of retinal vascular caliber with ethnicity, gender, and birth parameters in young children. Investigative
ophthalmology & visual science. 2007; 48(3):1018–24. Epub 2007/02/28. https://doi.org/10.1167/iovs.
06-0978 PMID: 17325141.
Reliability and accuracy in grading retinal photos
PLOS ONE | https://doi.org/10.1371/journal.pone.0179310 June 20, 2017 12 / 12