accrual accounting and access to external funds: evidence ... · accounting, facilitate small...
TRANSCRIPT

Accrual Accounting and Access to External Funds: Evidence from
Small Businesses
Dan Dhaliwal
Eller School of Management
University of Arizona
Kyonghee Kim*
Trulaske College of Business
University of Missouri-Columbia
Sukesh Patro
College of Business
Northern Illinois University
Raynolde Pereira
Trulaske College of Business
University of Missouri-Columbia
First Version: 15th April, 2014
Current Version: 15th January, 2015
* Corresponding author. Tel.: 573-882-2538, Fax.: 573-882-2537, [email protected]

Accrual Accounting and Access to External Funds: Evidence from Small Businesses
Abstract
This paper examines two related questions. First, does accrual accounting, in comparison to cash
accounting, facilitate small businesses’ access to external funds? Second, does it also affect the
nature of the firm’s borrowing relationships, i.e., arm’s length financing as opposed to
relationship-based financing? These questions are prompted by theory that suggests information
problems can lead to credit rationing, particularly for small businesses since they tend to be more
opaque. We find a positive relation between a firm’s use of accrual accounting and its access to
lines of credit and trade credit, two primary forms of external financing of small businesses. We
find accrual accounting is positively associated with both the amount and terms of borrowing for
these forms of financing. We also find accrual accounting facilitates a larger number of credit
relationships and relationships with more distant financial institutions. Additionally, accrual
accounting is associated with a shorter duration of borrowing relationships and lowered reliance
on personal contact in communications with financial institutions. Overall, the evidence supports
the argument that the use of accrual accounting can play a significant role in easing the credit
constraints of small businesses and in facilitating greater use of arm’s length financing.

1
Accrual Accounting and Access to External Funds: Evidence from Small Businesses
1. Introduction
In their recent survey of research on the role of financial reporting in debt contracting,
Armstrong et al. (2010) highlight the lack of understanding as to "whether attributes of firms'
financial reports influence their ability to access debt markets." This paper is directed at
addressing this void. Specifically, we examine whether accrual accounting, in comparison to cash
accounting, affects small businesses’ access to external credit from financial intermediaries and
suppliers. We also examine the impact of accrual accounting on the nature of the borrowing
relationship as it relates to the firm’s use of arm’s length financing as opposed to relationship-
based financing. By pursuing these questions, we seek to understand not only whether accrual
accounting enhances the small firm’s ability to raise external funds, but also how it is able to do
so.
Small businesses are an important segment of the U.S. economy providing “55% of all jobs
and 66% of all net new jobs since the 1970s” and occupying “30-50% of all commercial space”.2
Despite its significance, this segment of the economy has received relatively sparse attention in
the accounting literature. In particular, we have limited understanding of the impact of accounting
on small business financing. Information asymmetry is acute for small businesses because there
are simply fewer sources of reliable information about these firms. One reason for this
information scarcity lies in the fact that these businesses face higher failure rates. Also, there is a
lack of “economies of scale in lending to these businesses”, which in turn discourages the
information-seeking activities of financial intermediaries (Liu et al. 2011). Finally, small businesses
are generally private and hence not subject to the mandatory disclosure requirements of publicly
2 https://www.sba.gov/offices/headquarters/ocpl/resources/13493

2
listed firms. Thus, lenders have more limited information for ex-ante screening and ex-post
monitoring of small businesses than for public firms. One way lenders could address the
information problem is to “price protect” themselves by charging opaque borrowers a higher
interest rate. However, theory suggests that such an approach is potentially problematic in credit
markets (Stiglitz and Weiss 1981). First, elevated interest rates are likely to attract high-risk
borrowers while discouraging potential low-risk borrowers. Second, high interest rates may
induce borrower actions that are contrary to the interests of the lender, such as investing in
riskier projects (Stiglitz and Weiss 1981). Therefore, “lenders may optimally choose to ration the
quantity of loans they grant rather than raising the rate to clear the market” (Petersen and Rajan
1994). Because information asymmetry problems are more acute for small businesses they are
more likely to face such credit rationing outcomes.
Cassar et al. (2014) argue that “borrowers can reduce information asymmetries with lenders
by using more sophisticated accounting methods to signal their type and provide more decision-
relevant data”. The use of accrual-based accounting is one measure of the sophistication of the
accounting method used by firms. Accrual accounting provides a better measurement of a firm’s
periodic performance and financial condition than does cash accounting. Specifically, accrual
accounting entails the timely recognition of revenue and expenses, capturing the firm’s economic
earnings more accurately (Dechow 1994). Further, by requiring a broader recognition of a firm’s
assets and liabilities, it provides a better gauge of the owner’s equity of the firm. Given these
features, accrual accounting, in comparison with cash accounting, is likely to be more useful to
lenders in evaluating the credit worthiness of small businesses. Consequently, we anticipate
accrual accounting to be positively associated with small businesses’ access to external credit.

3
Another solution to overcome information asymmetry problems that small businesses have
with lenders is to rely on relationship-based financing wherein a firm enters into a long term,
sometimes exclusive, borrowing relationship with a financial institution. Such a relationship
enables financial institutions to gather information about firms’ credit worthiness and monitor
them on an on-going basis after a loan has been made. However, Rajan (1992) notes that an
exclusive relationship can be costly to the borrower in that it exposes the firm to potential holdup
problems.3 Instead of relying on relationship-based financing, firms can improve their access to
external credit by improving the quality of information provided to lenders. In doing so, firms
move away from relationship-based financing to arm’s length financing, wherein they turn to
obtaining funds from multiple sources of financing located over greater distances, and rely less
on personal contacts. The availability of arm’s length financing reduces the necessity for a firm to
enter into a long term financing relationship with any one particular creditor, suggesting that
higher quality information will also reduce the duration of a firm’s relationship with its creditors.
Thus, we also anticipate that accrual accounting will impact the small business’ external financing
in that it can help reduce the firm’s reliance on relationship-based financing and instead will
facilitate arm’s length financing arrangements. We empirically evaluate these predictions.
Our empirical analysis focuses on the two primary forms of external credit for small
businesses: lines of credit from banks (LCs) and trade credit provided by suppliers (TC) (Mach
and Wolken, 2006).4,5 Our analysis involves data gathered from the 2003 Survey of Small Business
Finances (SSBF). This survey was carried out under the auspices of the Board of Governors of
3 The argument here is that banks with exclusive relationship with borrowers will be able to extract information
rents in the form of higher interest costs. They are able to do so due to the fact that they have access to firm specific
information that is not transferable (Rajan 1992). 4 In the 2003 SSBF survey, credit lines are used by 34% of firms and trade credit from supplier(s) is used by 60% of
firms (Mach and Wolken, 2006, pages A178 and A181). 5 For completeness, we also evaluate the impact of accrual accounting on small businesses’ access to bank loans.

4
the Federal Reserve System and covers over 4,000 non-farm and non-financial small businesses.
Our findings are as follows. We find a positive association between the use of accrual accounting
and small businesses’ access to both lines of credit and trade credit. With respect to lines of
credit (LCs), we find that small businesses that use accrual accounting, as opposed to cash
accounting, have a larger number of LCs and a larger amount of credit available through LCs.
With respect to trade credit, we find a positive relation between the use of accrual accounting
and the number of suppliers that provide trade credit and the extent of purchases financed
through such credit. We also examine whether the use of accrual accounting is associated with
favorable terms of trade credit received and find it is associated with a longer interest-free
repayment window.
The above results suggest that accrual accounting is associated with better access to external
credit in the form of lines of credit and trade credit. While important, these results do not help
explain how accrual accounting improves firms’ access to external funds. Our next set of analyses
examines the potential answer to this question that this happens because accrual accounting
makes it easier for a firm to enter into arm’s length financing arrangements. Consistent with our
prediction above, we find that small businesses using accrual accounting have, on average, a larger
number of financial institutions with which they transact and that the financial service providers
are geographically more distant from the firm’s business headquarters. We also find that accrual
accounting facilitates more remote forms of communication with the firms’ financiers such as
email and phone as opposed to in-person meetings. If accrual accounting lowers small businesses’
reliance on nearby financial institutions and facilitates distant banking relationships, it should also
increase their ability to enter into new credit relationships with financial institutions. Consistent
with this argument, we find a negative association between accrual accounting and the average

5
duration of the firm’s relationships with its financial institutions suggesting that accrual accounting
helps enhance the portability of the firm’s borrowing arrangements. Taken together, this set of
results suggests that accrual accounting lowers small businesses’ reliance on relationship-based
financing and promotes arm’s length financing (Petersen and Rajan 1994).
While we interpret our findings as being indicative of the favorable impact of accrual
accounting on access to external funds, a potential concern is whether the observed relation
flows in the opposite direction, i.e., whether the positive relation is due to the influence of
external credit on the choice of accrual accounting. For example, it is possible that small
businesses are more likely to adopt accrual-based accounting in response to lenders’ increased
informational demands. Alternatively, firm characteristics that are associated with lower costs /
higher benefits of using accrual accounting for the borrower may also be associated with lower
costs of information acquisition by lenders. In light of these concerns, we adopt an instrumental
variable (IV) approach to further evaluate the relation between accrual accounting (in comparison
to cash accounting) and access to external credit. Re-estimating our tests, we continue to find
the use of accrual accounting is associated with larger amounts of credit under LCs and a greater
proportion of purchases made using trade credit. Consistent with accrual accounting facilitating
arm’s length financing, we also find a positive association between accrual accounting and the
number of financial institutions the small business transacts with and the average distance
between the small business and its financial institutions. Thus, our overall results remain unaltered
under the IV estimation.
Our study contributes to three strands of existing research. First, our results are relevant to
the research on the debt market effects of accounting quality. Despite accounting information
being a crucial source of information for lenders, we have a limited understanding of whether and

6
how the quality of the firm’s accounting impacts its access to external financing. Prior research in
this regard has focused on large, publicly traded firms and documents how the quality of accrual-
based financial reports impacts the cost of capital (e.g. Francis et al. 2005). By using a small
business setting, we provide a useful departure from this literature in that we focus on the
accounting choices (i.e., accrual accounting versus cash accounting) of firms that have high
information asymmetry and hence are more likely to face credit rationing conditions. Our results
highlight the role of accrual accounting in improving firms’ access to external funds both in terms
of the quantity of credit and in terms of the firm’s ability to enter into arm’s length financing
arrangements with multiple, geographically distant creditors.
Second, our study contributes to the growing literature on the impact of accounting on small
businesses. To clarify this contribution of our study, it is important that we distinguish it from
prior research in this area. Minnis (2011) focuses on private firms and finds audited financial
statements help reduce the cost of debt. In contrast, our focus is on how the use of accrual
accounting impacts small businesses’ access to external credit. We also depart from the focus in
Allee and Yohn (2009) on the preparation of formal financial statements and its impact on
approval of new loan applications and interest rates on the loans approved. Our focus on the
comparison between cash and accrual accounting speaks to the issue of the quality of firm-specific
information. Also, contrary to the aforementioned studies, we focus on lines of credit and trade
credit, the two most prominent forms of small business financing. Further, we also examine
whether accrual accounting facilitates arm’s length contracting between the firm and its funding
sources. More related to our study is Cassar et al. (2014). Similar to our study, they contrast
the effects of cash and accrual accounting. However, we differ from their study in two key ways.
First, while their focus is limited to the likelihood of new loan approval and interest rates of new

7
loans approved as is the case in Allee and Yohn (2009), we take a more comprehensive look at
multiple sources of external financing, including credit from suppliers and non-price terms of such
credit. Second, their attention is directed on understanding how accrual accounting interacts with
other alternative sources of firm-specific information in lending decisions. Our study seeks to
understand whether accrual accounting helps access external funds and whether it achieves this
by enabling firms to enter into arm’s length financing arrangements.
Finally, our findings also contribute to the research on the role of information quality in credit
markets. While much of this research distinguishes between soft and hard information, we
highlight the importance of the quality of hard information. Theory (see, for example, Diamond
1984) notes that banks have a competitive advantage in collecting information and hence are
better able to evaluate and extend credit to information-problematic borrowers. Our results
suggest that improvements in the quality of hard information provided by borrowers can also
help increase access by facilitating relationships with more lenders and geographically more
distant lenders, by facilitating more remote forms of interaction, and by increasing the portability
of the borrowing relationship.
The rest of the paper is organized as follows: Section 2 describes the related literature and
develops our hypotheses. Section 3 discusses the data and details the empirical methods. Section
4 presents the results, and Section 5 summarizes and concludes the paper.
2. Related Literature and Hypothesis Development
2.1 Background
Information asymmetry between borrowers and lenders creates problems of adverse
selection (Leland and Pyle 1977) and moral hazard (Jensen and Meckling 1976). One solution for
the lender is to impose a higher interest rate in settings involving higher information asymmetry.
8
Stiglitz and Weiss (1981), however, counter that a high interest rate can exacerbate, rather than
alleviate, the adverse selection and moral hazard problems because it can serve to attract
relatively riskier borrowers and affect ex-post borrower behavior by inducing excessive risk-
taking. Thus, lenders may ration the amount of loans instead (Rajan and Petersen 1994). Small
businesses are more susceptible to such credit rationing since they tend to be, for the reasons
noted previously, relatively opaque firms.
Given the opacity of small businesses, considerable research has been directed at
understanding the appropriate form of financing for these firms. The early consensus that
emerged from this inquiry is that small businesses will rely on “relationship-based lending” with
their local banks. As Beck et al. (2011) note, relationship-based lending is “a type of financing
based primarily on “soft” information gathered by the loan officer through continuous,
personalized, direct contacts with SMEs (small and medium enterprises), their owners and
managers, and the local community in which they operate” (e.g. Berger and Udell. 1995, 2002).6
However, a number of recent studies challenge this conventional wisdom by noting that small
businesses need not strictly rely on relationship-based financing but that arm’s length financing is
also a viable option for these firms (e.g., Berger and Udell 2006; De la Torre, et al. 2010; Beck et
al. 2011). Arm’s length financing essentially involves the use of “hard information to screen firms”
(Beck et al 2011).7 In addition to helping screen borrowers, hard information also facilitates
monitoring of borrowers after a loan is made. A firm’s financial statement is a canonical example
of hard information in that it represents information that can be reduced to numbers and
effectively transmitted and processed (Petersen 2004).
6 In addition to the reliance on soft information, relationship-based lending also suggests that the financial
intermediaries involved are smaller and less hierarchical, a characteristic vital for dealing with opaque firms (Stein
2002). 7 Besides hard information, arm’s length financing also implies the use of “hard assets” as collateral (Beck et al 2011).

9
While the literature to date emphasizes the distinction between hard and soft information,
we have limited understanding as to whether the quality of hard information matters in small
businesses’ access to external credit. As Berger and Udell (2006) posit, “the borrower must have
informative financial statements” for it to matter with respect to the firm’s access to external
financing, particularly when the financing is more in the form of arm’s length transacting rather
than relationship-based financing. By examining whether and how the use of accrual accounting
impacts the firm’s access to external financing, we take up this issue in this study,
2.2 Testable Hypotheses
Accrual accounting, relative to cash accounting, is posited to provide a more accurate picture
of a firm’s operations, because it focuses on the true economic transactions of the firm rather
than the timing of cash receipts and payments associated with the transactions (Dechow 1994).
First, accrual accounting, unlike cash accounting, requires the recognition of revenue when it is
earned, not when cash payment is received (revenue recognition principle). Second, it requires
that expenses be matched against the corresponding revenues recognized, not when the
payments are made (matching principle). Besides affording better measurement of a firm’s
economic income (and hence a better measurement of a firm’s performance), accrual accounting
is also posited to provide more accurate information about a firm’s assets and liabilities and their
associated changes.8 Stated differently, accrual accounting provides a better assessment of a firm’s
financial standing by recognizing a firm’s noncash assets and liabilities. Consequentially,
information contained in accrual-based financial records is more helpful in preparing accurate
forecasts of the firm’s economic future. This allows lenders to better assess the risk of borrowing
8 FASB Concepts Statement No.1 paragraphs 37-47 provides more discussion about accrual accounting.

10
firms.9 In the context of small businesses, Dun and Bradstreet (D&B) takes the position that
“being able to display an accurate picture of your business operations is necessary for you to
demonstrate your business’s credit quality and to build market credibility”, and that adoption of
accrual accounting is necessary in order to obtain financing and trade credit, and to attract
customers in the long run.10 To the extent that accrual accounting ameliorates a firm’s
information environment, it can improve a firm’s access to external credit markets. Given that
lines of credit and trade credit represent the dominant sources of financing for small businesses,
greater access to external financing could be reflected in more lines of credit and larger amounts
of trade credit. This reasoning leads to the following testable hypothesis:
H1a: The use of accrual accounting is associated with greater access to lines of credit and
trade credit.
While our central focus is on the relation between accrual accounting (in comparison with
cash accounting) and firms’ access to external funds, we recognize that accrual accounting can
also impact the terms of external financing. This issue is important because borrowers care not
only about the quantity of financing, but also its price. It is ex-ante unclear whether accrual
accounting has a positive influence on the quantity alone or both the quantity and price of external
financing. Therefore, we also examine the following hypothesis on the terms of lines of credit and
trade credit:
H1b: The use of accrual accounting for financial records is associated with more
favorable terms of lines of credit and trade credit.
9 Accrual accounting is beneficial not only to parties external to a firm such as it borrowers. It also helps firm insiders
such as the firm’s managers to properly manage the firm’s debts and the flow of financial activity. While important,
our study focuses on the role of accrual accounting on the relation between the firm and its outside lenders. 10 http://www.dandb.com/credit-resources/business-finances/why-a-small-business-should-use-accruals-based-
accounting/

11
To the extent that accrual accounting enhances the firm’s ability to access external funds, a
question that follows is what is the mechanism by which this happens. To recall, a prevailing view
is that greater opacity implies more reliance on relationship-based financing, while greater
transparency affords more arm’s length financing arrangements (Petersen and Rajan 1994). A
hallmark of arm’s length financing is the greater reliance on hard information as opposed to soft
information. Because accrual accounting enhances the quality of hard information, it should help
facilitate arm’s length financing by the firm. Berger and Udell (2006) argue that high quality
accounting is a part of the “necessary conditions for informative financial statements” that can
facilitate arm’s length financing. For example, arm’s length financing may involve the use of
contracting devices such as covenants. Some of these covenants, such as financial covenants, are
based on financial statement numbers (e.g. financial ratios such as leverage and profitability ratios).
If the financial statements are not based on sound accounting standards, the covenants involved
would be largely ineffective and hence not facilitate contracting between the firm and its external
lenders.
Because data limitations preclude direct measurement of the extent of arm’s length financing
that small businesses have, we take a comprehensive approach to addressing the relation between
accrual accounting and arm’s length financing. Specifically, we focus on the following four aspects
regarding arm’s length financing (Petersen and Rajan 1994, 2002): First, does accrual accounting
allow the firm to enter into financing agreements with multiple lenders? Second, does accrual
accounting allow the firm to enter into financing agreements with geographically distant lenders?
Third, does accrual accounting allow the firm to rely less on long-term relationships with its
lenders? Finally, does accrual accounting allow the firm to rely less on in-person transactions
with its lenders? These are stated in the following testable hypotheses for small businesses:

12
H2a: The use of accrual accounting is associated with a larger number of financial
institutions with which the firm transacts (i.e., less borrowing concentration).
H2b: The use of accrual accounting is associated with a longer average distance between
the firm’s head office and its lenders (i.e., more geographically distant lenders).
H2c: The use of accrual accounting is associated with shorter durations of banking
relationships with lenders (i.e., less repeated transactions).
H2d: The use of accrual accounting is associated with more remote forms of
communication with lenders.
3. Data, Methodology, and Key Variables
3.1. Data
The data used in this study is from the 2003 Survey of Small Business Finances (SSBF)
conducted by the Federal Reserve Board (FRB). The survey covers 4,240 firms that are for-profit,
non-financial, non-farm, non-subsidiary businesses that have fewer than 500 employees. The data
was mostly collected by telephone interviews that took place between June and December in
2004.11 The survey data includes but is not limited to, i) demographic information, ii) data on the
materials the respondents used to respond to survey questions, iii) information about the
characteristics of financial service suppliers, and iv) information about the firm’s external financing.
Survey data often has missing values because of the respondent’s refusal to answer or
mistakes on the part of staff members conducting the survey. The FRB uses a statistical process
of multiple imputation to fill in the missing values in the 2003 SSBF data.12 Through the imputation
process, the FRB has created five copies (called implicates) of the 2003 data, where the non-
missing values of the data are the same across the five copies, but the imputed values of missing
11 The reference date for most questions is the date of the interview. The reference date for the firm’s financial
information is the day of the firm’s most recent fiscal-year end and can range from July 1, 2003 – June 30, 2004. 12 Therefore, the 2003 SSBF has a relatively small amount of missing values – on average only 1.8% of items asked
for were missing and the median firm had less than 0.5% missing items

13
data may differ. 13 This yields a total of 21,200 observations for the 4,240 firms. We require the
sample firms to have non-negative total assets and non-missing data for the accounting method
used (i.e., cash versus accrual versus hybrid). This step reduces the number of observations to
20,827. We further limit the sample to observations with non-missing control variables, resulting
in a base sample of 20,267 observations for 5 implicates (4,052-4,055 observations per implicate).
Details of the sample formation procedure are reported in Table 1.
Table 1 about here
3.2. Analysis Method
Analysis of multiply-imputed data involves two steps: 1) estimating the parameters of interest
separately for each implicate, and 2) summarizing the parameter statistics using sample variances
adjusted for the between-imputation variance of each parameter (Rubin 1987; Little and Rubin
2002). We follow the SAS procedures suggested by the FRB when analyzing the data. Specifically,
we use SAS SURVEYREG or SURVEYLOGISTIC for the first step and SAS MIANALYZE for the
second step.14 For the 2003 SSBF survey, the FRB used a stratified random sampling with
oversampling of larger firms (20-499 employees) because larger firms, although a small percentage
of the population, are of special interest to researchers. Because of the complex and unequal
probability in sampling design, the FRB provides sample stratification and weights and suggests
that researchers use estimates constructed using weighted statistics to make unbiased inferences
for the population (2003 SSBF Technical Codebook). Accordingly, we follow the FRB suggestion
in all our analyses, including univariate analysis and descriptive statistics.
13 To impute a missing value, the FRB fits a model to obtain a predicted value of the missing value, and then adds a
random term to the predicted value. The goal of the imputation process is to obtain the best possible estimates of
the true but unobserved values of data which are missing. As more imputed values are generated for each missing
value, the approximation to the true sampling distribution improves (Rubin 1987). The 2003 SSBF Technical
Codebook (pages 14-16) contains a detailed description of this procedure. 14 Details of the FRB’s suggestions are in the 2003 SSBF Technical Codebook (pages 41-50).

14
3.3. Key Variables
Dependent Variables
Our dependent variables are broadly classified into measures of external credit (LCs and
TC) and measures of arm’s length financing. The following is a description of the key dependent
variables:
Lines of Credit (LCs): Lines of credit are arrangements with a financial institution that allow a
firm to borrow funds during a specified period up to a specific credit limit (FRB 2003 Annotated
Survey Questionnaire). We use the following variables:
# of LCs: The total number of lines of credit the firm maintains.
Total LC Amount: The dollar value of credit limits under these lines of credit.
# of LC Renewal Applications: The number of times the firm attempted to renew existing lines
of credit during the past three years. We expect that firms are more likely to apply for
renewal of existing LCs when terms of the existing LCs are favorable and the chance of their
renewal applications being accepted is reasonably high.
Trade Credit (TC): TC is extended to small businesses for short periods, generally 30-60 days
and is used to reduce transaction costs (Mach and Wolken, 2006).
# of TC Suppliers: The number of suppliers from whom the firm made purchases using trade
credit during the interview reference year.
% of Purchases in TC: Percentage of the firm’s total purchases made using trade credit during
the interview reference year.
TC Financing Duration: The duration of trade credit with zero interest offered by the most
important supplier. It has values 1 through 11 and is coded as follows: 1 for cash on delivery,

15
2 for 1-7 days, 3 for 8-10 days, 4 for 11-14 days, 5 for 15 days, 6 for 16-20 days, 7 for 21-30
days, 8 for 31-45 days, 9 for 46-60 days, 10 for 61-90 days, and 11 for more than 90 days.
Arm’s Length Financing: Similar to Petersen and Rajan (1994, 2002), we use the following
variables to measure the nature of the small business’ relationship with its financial institutions,
i.e., arm’s length financing versus relationship-based financing:
# of Fin. Institutions: Number of financial institutions the firm dealt with during the interview
reference year. It is a number derived by the FRB based on the number of financial service
flags with non-missing values. A higher number indicates less concentration of borrowing and
lower (greater) reliance on relationship-based (arm’s length) financing.
Distance: Average distance (in miles) from the firm’s main office to financial institutions the
firm transacts with, as reported by the firm. A larger distance denotes lower (greater) reliance
on relationship-based (arm’s length) financing.
Duration: Average number of months the firm has conducted business with its financial
institutions. A shorter duration denotes less private information the lenders acquired through
repeated transactions with the firm, and hence lower (greater) reliance on relationship-based
(arm’s length) financing.
Contact Mode: The method of communication the firm uses with its financial institutions. It is
coded as follows: 1 for in person, 2 for by telephone, 3 for by mail, 4 for direct withdrawal
or wire, 5 for through ATM, 6 for via the internet, and 7 for other. The larger the number,
the less personal the interaction between the small business and its lender and the lower
(greater) the reliance on relationship-based (arm’s length) financing.
Key Independent Variable

16
Accrual: Indicator variable coded as 1 if the firm keeps its books using accrual accounting
during the interview reference year, and 0 if it uses cash or hybrid accounting method.
Appendix A reports detailed descriptions of all variables used in the study.
3.4. Descriptive Statistics
Firm Characteristics: Table 2 reports summary statistics for key dependent and independent
variables. Sample firms have average sales of $1.1 million and about 9 employees. The average
duration the firms have been in business (Firm-Age) is 14.4 years, suggesting that these firms are
younger than large, publicly traded firms. Most of the sample firms (92%) are manager-owned.
The most common form of organization is corporations (47%)15, followed by proprietorships
(44%). Regarding industry composition, the majority of the firms are in the service (46%) and
wholesale industries (25%).
Table 2 about here
External Credit: LCs are the most common form of credit obtained from financial institutions
– 35% of the firms report they have at least one outstanding line of credit. Trade credit is the
most widely used form of external credit with 61% of the firms reporting they use some trade
credit. The firms have, on average, about 13 suppliers offering trade credit and they make around
39% of their purchases using trade credit. The average duration for trade credit is 6.5, which
corresponds to the 16-20 day bracket. It is useful to note that the sample firms report an average
monthly penalty of about 1% for not paying off trade credit before it is due (not tabulated). This
suggests trade credit can be a relatively expensive form of credit compared to loans or LCs
(Petersen and Rajan 1994). However, 59% of firms report they always repay by the due date, and
the remaining 41% report they make late payments less than 30% of the time. This general pattern
15 31% are S-Corporations and 16% are C-Corporations.

17
of trade credit usage suggests that most firms limit their use of trade credit such that the effective
cost is much lower relative to the full cost of using this as a means of long-term financing. Also,
to the extent that some firms are paying the penalty, it suggests that these firms face conditions
that are akin to credit rationing (Mach and Wolken, 2006).
Arm’s Length Financing: Sample firms interact with an average of 2.4 financial institutions,16 and
the average duration of their relationship is nearly 105 months (8.7 years). The mean distance
between the firm’s head office and its financial institutions is 117 miles, and the average mode of
communication with financial institutions is 2.03, which in our classification is roughly equivalent
to communicating by telephone.
Accrual Accounting: 25% of the firms surveyed report they use accrual accounting and the
remaining 75% use cash-based or other accounting methods. Based on untabulated descriptive
statistics, however, only 16% of the sample firms report that they use formal financial statements
to answer the survey questions. Of the firms that report they use formal financial statements,
roughly half report the use of accrual accounting. Conversely, of the firms that use accrual
accounting only 29% report the use of formal financial statements to respond to the survey. This
is further discussed in sub-section 4.7.1. below.
4. Results
4.1. Correlations
Table 3 reports correlations of our key dependent and independent variables. Consistent
with our hypotheses, the use of accrual accounting (Accrual) is positively associated with the
number of LCs (ρ = 0.22) and total credit available under LCs (ρ = 0.32). The availability and use
16 Financial institutions include commercial banks, savings and loan associations, credit unions, leasing companies, and
other sources of financial service.

18
of trade credit is similarly larger for firms that use accrual accounting. The correlations between
Accrual and the number of suppliers providing trade credit and the fraction of total firm purchases
made using trade credit are 0.47 and 0.37, respectively. The positive correlation (ρ = 0.07)
between Accrual and the duration of trade credit suggests that firms using accrual accounting tend
to receive better credit terms (i.e., a longer period with zero interest) from their suppliers. All
of the above correlations are significant at the 5% level or better.
Table 3 about here
One notable firm characteristic that correlates with, both, the use of accrual accounting and
external credit availability is firm size. Both sales revenue and the number of employees are highly
positively associated with Accrual, with correlations of 0.45 for log-transformed sales and 0.37 for
the number of employees. The correlations also show that larger firms generally have greater
access to external credit and greater use of arm’s length financing (or less reliance on relationship
financing). The total number and value of LCs are highly positively correlated with the two
measures of firms size with correlations greater than 0.31. With respect to trade credit, the
number of trade credit suppliers and the % of total purchases made using trade credit are
positively associated with both sales (ρ ≥ 0.44) and the number of employees (ρ ≥ 0.29). The
average distance and communication mode are positively and significantly associated with the two
measures of firm size as well. These correlations highlight the importance of controlling for the
effect of firm size when examining the association between accrual accounting and access to
external credit (reliance on arm’s length financing). Accordingly, we begin our analysis by
examining the association between accrual accounting and our key dependent variables for
portfolios of firm-size in a univariate setting.
4.2. Univariate Tests

19
In Table 4, we classify the sample into three subgroups based on firm size: sales below $1
million (2464 observations), between $1 million and $3 million (610 observations), and greater
than $3 million (979 observations). We then examine whether firms that use accrual accounting
have better access to external credit and make greater use of arm’s length financing that firms
within that subgroup that do not sure use accrual accounting. Table 4, Panel A reports the results
for lines of credit and trade credit, and Table 4, Panel B reports the results for arm’s length
financing.
Table 4, Panels A and B about here
Panel A shows that the average number (proportion) of firms that use accrual accounting is
515 (21%), 319 (52%) and 744(76%) for the smallest, middle, and largest size subgroups,
respectively. This is consistent with the positive correlation between Accrual and Sales in Table 3.
However, this also shows that not all firms that use accrual accounting are large firms. Panel A
shows that accrual accounting is generally associated with more credit resources and greater
usage across all three portfolios. Firms using accrual accounting are more likely to use lines of
credit (LC = 1) across all size portfolios (p-value ≤ 0.06). The amount of credit available via LCs
(Total LC Value) is also larger (p-value ≤ 0.05) except for the smallest subgroup (sales < $1
million). Results are similar and stronger for trade credit (TC). The fraction of firms that have
access to trade credit is higher for firms that use accrual accounting in each of the three size
subgroups with the difference significant at the 4% level in the largest size subgroup and at the
1% level in the remaining two subgroups. Similarly, the fraction of all purchases funded by trade
credit is higher for firms that use accrual accounting than for those that do not (p-value < 0.01).
Table 4, Panel B relates the mean values of the four measures of arm’s length financing to
accrual accounting across the three subgroups. In the smallest size subgroup, compared to firms

20
that do not use accrual accounting, firms using accrual accounting tend to transact with more
financial institutions (p < 0.01) and more distant financial institutions (p = 0.01). These firms on
average have a shorter duration of relationship with their financial institutions (p = 0.01) and their
communication mode is less personal (p = 0.11). However, other than the number of financial
institutions for the largest size subgroup (with sales > $3 million) and the contact mode for the
middle size subgroup (with $1 million ≤ Sales < $3 million), these patterns do not hold for the
remaining two subgroups. This pattern suggests that smaller firms benefit more from using accrual
accounting in improving their arm’s length financing than do larger firms.
Overall, the results in Table 4 show that accrual accounting is positively associated with
access to external credit across all size subgroups, while it is associated with more arm’s length
financing for firms with sales less than $1 million. These results are generally supportive of the
hypotheses. More importantly, they suggest that it is unlikely that the association between accrual
accounting and firms’ access to external credit or arm’s length financing is attributable to large
firms.
4.3. Multivariate Tests – Access to External Credit
4.3.1. Lines of Credit (LCs)
We next turn to multivariate tests of our hypotheses. We begin with tests of the firm’s LC
facilities. Specifically, we examine how the firm’s accounting choice is related to the number of
LCs, the total amount of credit available under LCs and the number of LC renewal applications.
Besides the indicator variable for the use of accrual accounting (Accrual), we include a
comprehensive set of firm characteristics and performance attributes that can potentially affect
the credit resources of the firm. To capture the impact of formal financial statements, separate
from the use of accrual accounting, we include an indicator variable for whether the firm has

21
formal financial statements compiled by an accounting professional. To account for the impact of
aspects of the firm’s capital structure, we include firm leverage (the ratio of debt to total assets)
and the firm’s credit rating based on the Dun & Bradstreet credit score (higher values of the
rating show higher credit quality). We also include firm size as measured by sales revenue, the
number of employees and the number of sites in which the firm’s businesses operate, and firm
performance (return on assets). Because firm age can impact the use of external credit, we include
it in the model (Petersen and Rajan 1994). To account for the impact of the business structure
of the firm, we include the ownership stake of the manager(s), an indicator for whether the firm
is managed by the owner, and indicator variables for whether the firm is organized as a
proprietorship or partnership (corporations are the base case). Finally, the model includes
indicators variables for the five major industrial sectors (Mining, Construction, Manufacturing,
Wholesale, and Services).17
Results reported in Table 5 show that after accounting for the impact of these variables,
Accrual is positively associated with the number of LCs that the firm maintains (one-sided p-value
= 0.065), the total credit amount available under these LCs (p-value = 0.02), and the number of
LC renewal applications during the last three years (p-value = 0.08). The results also show that
after considering the impact of the firm’s accounting choice, whether the firm compiles formal
financial statements does not matter to its LC resources – the associations with Financial Report
while positive are not significant at traditional levels. Firm size measured, both, by sales and
number of employees has a strong positive impact (p-value < 0.01) on each of these aspects of
the LC resources, and firm performance has a negative effect (p-value < 0.01). The latter result
17 Mining, Construction, Manufacturing, and Wholesale are the industries that are generally required by the IRS to
use accrual accounting. However, there are several regulatory exemptions from this requirement for the firms with
annual revenue less than $10 million (Revenue Procedure 2002-28).

22
is consistent with the interpretation that better firm performance reduces the need for external
funding. Interestingly, the results also suggest that proprietorship firms have fewer LCs (p-value
= 0.01), smaller amounts of credit available under LCs (p-value < 0.01) and fewer LC renewal
applications (p-value = 0.03), suggesting that these firms on average face greater credit rationing.
Overall, the results of Table 5 support the hypothesis that the use of accrual-based accounting is
associated with better access to external credit as reflected in more and larger lines of credit
(Hypothesis 1a) and more favorable terms as reflected in more renewal applications (Hypothesis
1b).
Table 5 about here
4.3.2. Trade Credit (TC)
We next examine the number of TC relationships the firm has and the fraction of all firm
purchases that are made using TC. In addition, we examine the average duration of zero-interest
TC financing available to the firm. The model includes the control variables discussed above.
Results reported in Table 6 show that Accrual is strongly and positively associated with the
number of TC relationships (p-value < 0.01) and the extent to which TC is used to fund the firm’s
purchases (p-value < 0.01). As before, firm size has a strong positive impact on these TC
dimensions and firm performance has a strong negative impact (p-value < 0.01). Also, after
accounting for Accrual, whether the firm compiles formal financial statements is not significantly
related to the credit resources of the firm. For these aspects of TC, the impact of the capital
structure policy variables is also negligible – both leverage and credit rating are not significant.
The results also show that businesses organized as proprietorships on average have fewer TC
relationships and rely less on TC for their purchases, all else equal. This is consistent with the LC
results that the proprietorship structure is associated with lesser credit from financial institutions.

23
Table 6 about here
We expect that accrual accounting is also likely to be related to the duration of zero-interest
financing available via TC (H1b), since accrual accounting provides information about the firm’s
performance and its financial condition that is more accurate and has higher ongoing consistency.
For this test, we include only those firms that use trade credit from their suppliers. Results
reported in the rightmost columns of Table 6 show that the average duration of zero-interest
TC financing is positively associated with Accrual (p-value < 0.05) and the compilation of formal
financial statements (p-value = 0.08). Unlike the results thus far, this aspect of TC financing is not
related to firm size. Overall, the results of Table 6 support Hypothesis 1a that the use of accrual
accounting is associated with greater access to external credit via more trade credit relationships
and greater usage of trade credit. The results also support Hypothesis 1b in that accrual
accounting is associated with better terms of trade credit in the form of longer durations of the
zero-interest window.
4.4. Multivariate Tests – Arm’s Length Financing
We next turn to tests of our second hypothesis. Specifically, we examine the association
between the use of accrual accounting and the relationship small businesses have with financial
institutions, i.e., the lenders to the firm including commercial banks, suppliers and other lenders.
Better quality hard information is more efficacious in overcoming information asymmetry
problems, allowing firms to transact with more financial institutions and more distant ones. Thus,
better quality hard information is likely to facilitate arm’s length financing and lower reliance on
relationship-based financing that is established by conveying firm information to specific lenders
by a series of meetings and/or transactional interactions. Following the same logic, we also expect
that the choice of accrual accounting can impact the mode of communication between the

24
borrower and lender, facilitating more remote forms of interaction (for example, via telephone
and email as opposed to in-person meetings).
Table 7 shows that accrual accounting is positively associated with the number of financial
institutions with which the firm interacts (p-value = 0.02). The average distance at which these
institutions are located from the firm is somewhat larger when the firm uses accrual accounting
(p-value = 0.10). The results also show that the average duration of relationships with lending
institutions is shorter for firms using accrual accounting (p-value < 0.01). This is consistent with
the interpretation that these firms begin interactions with more new financial institutions, which
in turn suggests that accrual accounting helps make the borrowing relationship more portable.
Finally, the method of communication used by small businesses to interact with their financial
institutions is more remote for firms using accrual accounting (p-value = 0.02). Overall, the results
of Table 7, support Hypotheses 2a-2d that the use of accrual accounting is systematically
associated with the number and nature of borrowing relationships in which the firm participates,
and suggests that accrual accounting facilitates small businesses’ arm’s length financing.
Table 7 about here
4.5. Instrumental Variable Estimation
While we have used the firm’s choice of accrual accounting as a predetermined variable, it is
possible that the endogenous choice of the accounting method affects our results. This choice
could be endogenous for various reasons. For example, firms in need of external financing may
have adopted accrual accounting in response to lenders’ demand for accrual-based financial
record-keeping. Alternatively, certain firm characteristics could determine both a firm’s adoption
of accrual accounting and its access to external credit. For example, the marginal cost of using
accrual-based accounting is lower for larger firms and such firms are less risky, ceteris paribus,

25
making lenders more willing to extend credit. To examine whether such endogenous choice
impacts our results, we use an instrument variable approach where whether or not the firm
extends any credit to its customers (Credit-Sale) serves as the instrument for Accrual.18 Cash
accounting distorts the operating performance of a firm when the firm extends credit to its
customers, because credit sales are not reflected in the firm’s revenue until the associated
accounts receivable are collected. Therefore, we expect that firms with credit sales are more
likely to use accrual accounting. However, it is unlikely that firms’ decision to extend credit sales
influences their access to external credit and the extent of arm’s length financing. Using Credit-
Sale as an instrument variable for Accrual, we estimate the following 2SLS model:
Accrual = a0 + a1Credit-Sale + u
External Credit (Arm’s Length Financing) = b0 + b1Accrual + ΣControls + v
Table 8 about here
Appendix B reports results of the first stage estimation. Consistent with our discussion, Credit-
Sale is highly correlated with the use of accrual accounting with an average adjusted R2 of 14.33%
(p < 0.01). Appendix B also shows Credit-Sale continues to be positively and significantly associated
with Accrual when we include all the covariates used in the second stage regression. Panel A of
Table 8 reports reduced-form regression results for our main test of Hypothesis 1a. The results
show that the total amount available under LCs and the proportion of firm purchases made using
trade credit are significantly positively related to the use of accrual-based accounting (p-value <
0.01). The strength of the association is generally stronger after accounting for the endogeneity
18 53% of firms that extend credit sales and thus have account receivables use accrual accounting. Therefore, while
highly correlated Credit-Sale is not equivalent to accrual accounting. Cassar et al. (2014) use the number of days in
inventory as an instrument variable for accrual accounting in addition to Credit-Sale. This variable, however, is
irrelevant for firms in the service industry and about 46% of small businesses in our sample are in the service industry.
Therefore, we do not use the number of days in inventory as an additional instrument.

26
of the accrual accounting choice, i.e., compared to corresponding OLS results reported in Tables
5 and 6. Further, the impact of the control variables in Table 8 closely resembles their impact in
the earlier results. Panel B of Table 8 reports results for our main tests of Hypothesis 2. The use
of accrual accounting is significantly positively related to the number of financial institutions with
which the firm interacts (p-value < 0.01) and the distance at which these institutions are located
from the firm (p-value = 0.02). Here also, the results are stronger after accounting for the
endogeneity of the accrual accounting choice. Overall, while we acknowledge the constraints we
face in addressing the endogeneity issue due to data limitations, to the extent that our instrument
variable approach using Credit-Sale helps mitigate the endogeneity issue, the results in Table 8
further confirm our inference on the relation between small businesses’ use of accrual accounting
and their access to external credit and arm’s length financing.19
4.6. Loan Financing
Our study is related to a recent paper by Allee and Yohn (2009) that also uses the same SSBF
survey data. The main focus in Allee and Yohn (2009) is on the factors associated with the use of
formal financial statements and their sophistication including whether the statements are
compiled, reviewed and/or audited by an accounting professional, and whether the statements
are accrual-based or not. While not the main focus of their paper, they also relate the use/
sophistication of formal financial statements to access to new loans. They find that the use of
financial statements in and of itself does not have a significant impact on the likelihood of new
loans being granted or the cost of new loans. However, having financial statements prepared on
an accrual basis is associated with lower interest rates on new loans. For completeness, we
19 We estimate the 2SLS for other measures of LCs, TC, and arm’s length financing. We find results qualitatively
similar for all other measures except for Duration and Contact Mode. The impact of Accrual on Duration and Contact
Mode is insignificant. These 2SLS results are not tabulated for brevity but available upon request.

27
conduct a comprehensive set of tests on the relationship between loans availed by small
businesses and their use of accrual accounting. In addition to the likelihood of new loan approvals
and interest rates on new loans approved tested in Allee and Yohn (2009), we also examine how
the use of accrual accounting is associated with the number and value of existing loans on the
books of the firm. Loans are measured as the sum of capital leases, car and equipment loans,
mortgages, and other loans outstanding on the firm’s books.20
4.6.1. Loans – Univariate Analysis
Untabulated results show that the correlations between Accrual and the total number and
value of loans outstanding are significantly positive.21 Accrual is also positively associated with the
likelihood of all new loan applications being accepted and negatively associated with the interest
rate on new loans approved. Similar to the univariate analysis of LCs and TC conditional on firm
size, we examine the firm’s loans for subgroups of firm size. The proportion of firms with a loan
on the books is higher when firms use accrual accounting – the differences in this proportion
between accrual and non-accrual accounting firms within the smallest and middle size subgroups
are significant at the 1% level. For the largest size subgroup, the difference is not significantly
different from zero. However, within this subgroup the mean total loan value of for firms that
use accrual accounting is much higher than for firms using non-accrual accounting. For the other
two subgroups also, the mean total value of loans is higher for firms that use accrual accounting.
4.6.2. Loans – Multivariate Analysis
20 The Federal Reserve Board classifies credit from financial institutions into lines of credit (LCs), loans (e.g., vehicle
or equipment loans, business mortgages), and capital leases (Mach and Wolken, 2006). In this study, we combine
loans and capital leases under the broad classification of ‘loans’. As suggested by the types of loans, this category of
financing is primarily long-term. 21 The results of the univariate analyses discussed here are not tabulated for the sake of brevity. They are available
from the authors upon request.

28
Similar to the analysis of LCs and TC discussed earlier, we examine loans in a multivariate
setting. We use the same regression model as the one in Tables 5 (LCs) and 6 (TC). Panel A of
Table 9 shows a significant positive association between the number of loans and Accrual (p-value
= 0.04). Similarly, total loan value is positively associated with Accrual (p-value = 0.01). Expectedly,
the number of loans and total loan value are each positively related to firm leverage (p-value <
0.01) and negatively related to the credit rating (p-value < 0.01). They are also positively related
to firm size measured by sales and the number of employees (p-value < 0.01), and negatively
related to firm performance (p-value < 0.01) and firm age (p-value < 0.05). As before, the negative
relation with firm performance is consistent with the argument that better firm performance
reduces the firm’s need for additional debt financing. Similarly, like most of the results so far,
whether the firm compiles formal financial statements by an accounting professional is not
significantly related to the number or value of loans.
Table 9 Panels A and B about here
Panel B of Table 9 examines the association between Accrual and the likelihood of new loan
approvals and the interest rate on these new loans. Tests of these aspects of the firm’s loan
activity are similar to corresponding tests in Allee and Yohn (2009) and Cassar et al. (2014), and
include only those firms that sought new loans in the three years prior to the survey. Unlike the
corresponding insignificant impact of accrual-based financial statements in Allee and Yohn (2009)
and accrual accounting in Cassar et al. (2014), we find accrual accounting to be positively and
significantly associated with the likelihood of new loan approval (p-value = 0.02). The difference
in results is further examined in subsection 4.7.1. below.
Consistent with the results in Allee and Yohn (2009), we find Accrual is negatively associated
with new loan interest rates (p-value = 0.01). The impact of firm leverage on the likelihood of

29
new loan approval is negative (p-value = 0.06) and the impact of credit rating is positive (p-value
0.01). The credit rating also has a significant negative effect on the new loan interest rate (p-value
= 0.02). Firm performance does not have a significant impact probably because the tests are
conditioned on the firm having sought a new loan. Overall, the results of Table 9 provide further
support for Hypothesis 1a that the use of accrual accounting for financial records is associated
with the firm securing more credit and for Hypothesis 1b that such credit is availed at better
terms. Finally, we re-estimate the relationship between Accrual and the total value of loans using
the 2SLS model of Table 8.22 We find that Accrual is significantly positively associated with total
loan value (p-value < 0.01).
4.7. Additional Analysis
4.7.1. Use of Accrual Accounting versus Use of Financial Statements
To examine the benefits of using accrual accounting independent of the production of formal
financial statements, in this sub-section we re-examine the use of accrual accounting for
subgroups of firms that report they use financial statements to respond to the SSBF survey
questions and those that use other means. Firms in the former subgroup (N = 839) correspond
to the group of firms Allee and Yohn (2009) focus on. About 53% of such firms report the use
of accrual accounting to maintain financial records. Firms in the latter subgroup (N = 3,213) use
a variety of other methods to answer the questions, including tax records, bank statements,
memory, etc. About 35% of such firms report they use accrual accounting to maintain their
financial records. Thus, 1,576 firms are coded as using accrual accounting in our tests as opposed
to about 466 if we were to limit the sample to firms that used formal financial statements. In
Panel A of Table 10 we re-estimate regressions for the three forms of credit examined in Table
22 These results are not tabulated for the sake of brevity. They are available from the authors upon request.

30
5 (LCs), Table 6 (TC) and Table 9 (Loans) separately for these two subgroups of firms. For the
sake of brevity, we report only the coefficient on Accrual and its significance. The results show
that the use of accrual accounting is positively associated with the number of LCs (p-value = 0.10)
and the total value of credit available under LCs (p-value 0.01) for the subgroup of firms that do
not use formal financial statements (to respond to survey questions). For the subgroup that uses
formal financial statements, only # of LC Renewal Applications is positively associated (p-value =
0.06) with Accrual. For TC, in both subgroups Accrual is positively associated with the number of
TC suppliers and the fraction of purchases financed through TC (p-value < 0.01). However, TC
duration has a significant positive association (p-value = 0.02) with Accrual only in the subgroup
that does not use formal financial statements.
Table 10 Panels A and B about here
The differences between the two subgroups are probably sharpest for the firm’s existing loans
and new loan activity. For existing loans, the association between Accrual and the number of loans
has higher significance (p-value < 0.01) for firms that don’t use formal financial statements than
for those that do (p-value = 0.08). There is a similar pattern for the total value of existing loans
with the association significant at the 2% level for non-users of formal financial statements and at
the 9% level for users. Further, Accrual is positively associated with the likelihood of new loan
approvals (p-value = 0.02) and negatively associated with the interest rate on new loans (p-value
= 0.01) for non-users of formal financial statements whereas the corresponding associations for
users are insignificant. This finding is consistent with Cassar et al. (2014) and supports their
argument that other types of firm information can substitute for information provided by accrual
accounting.

31
We also re-estimate our results for arm’s length financing for these two subgroups of firms.
As before, only results for Accrual are reported in Panel B of Table 10. Here also the two
subgroups behave quite differently. Accrual is significantly positively associated with the number
of financial institutions (p-value < 0.01) and the average distance from the financial institutions (p-
value = 0.03) only for firms that do not use formal financial statements (p-values < 0.01 and 0.03,
respectively). Similarly, Accrual is negatively and significantly associated with the average duration
of relationships with financial institutions only for the non-user subgroup. Finally, for the contact
mode, the association between Accrual and the remoteness of the mode of contact is positive in
both subgroups but significant only in the user subgroup (p-value = 0.01). Overall, the results of
Table 10 suggest that the benefits of using accrual accounting with regard to the firm’s access to
external credit and the firm’s interactions with financial institutions are above and beyond the
benefits arising from the production of formal financial statements.
4.7.2. Robustness Tests with Alternative Samples
C-Corporations are generally required to use accrual-based accounting for tax reporting
purposes. To examine if our results are driven by the presence of C-Corporations, we remove
them from the sample (942-943 firms from each implicate) and re-estimate the regressions in
Tables 5, 6, and 9. We also form an alternative sample excluding firms with annual sales revenue
over $5 million (802-803 firms from each implicate) and again re-estimate these regressions. Both
sub-samples yield qualitatively similar results for loans, TC, and the extent of arm’s length
financing. However, in both samples the coefficient on Accrual in the regressions for LCs is no
longer significant at conventional levels.23
5. Summary and Conclusions
23 These results are not reported for the sake of brevity. They are available from the authors upon request.

32
Using data from the 2003 Survey of Small Business Finances conducted by the Federal Reserve
Board, we use of accrual accounting by small businesses is positively associated with various
aspects of their access to external credit. Specifically, firms that use accrual accounting tend to
have more lines of credit and a larger amount of such credit. Tests of trade credit, the most
frequently used form of external credit for small businesses, also yield similar results – firms that
use accrual accounting receive credit from more suppliers and for longer durations with zero-
interest. Similarly, these firms have more loans and a larger amount of loans on their books, and
are more likely to get new loans approved and at lower interest rates. We also find that for firms
using accrual accounting, lenders tend to be located at a greater distance from the firm, and that
interactions between the firm and its lenders involve less in-person contact. These results suggest
that accrual accounting is associated with improvements in the quality of the “hard” information
provided by the firm, which makes transacting on the basis of the information easier. Further
supporting this interpretation, we find that the use of accrual accounting is associated with greater
portability of the borrowing relationship – the average duration of the firm’s relationships with
its financial institutions is inversely related to the use of accrual accounting. These results together
suggest that accrual accounting facilitates small businesses’ arm’s length financing and lowers their
reliance on relationship-based financing.
References
Allee, K., and Yohn, T., 2009. The demand for financial statements in an unregulated environment:
An examination of the production and use of financial statements by privately held small
businesses, The Accounting Review 84(1): 1-25.
Armstrong, C., Guay, W., and Weber, J., 2010. The role of information and financial reporting in
corporate governance and debt contracting, Journal of Accounting and Economics 50: 179-234.
Beck, T., Demirguc-Kunt, A., and Peria, M., 2011. Bank financing for SMEs: evidence across
countries and bank ownership types, Journal of financial Services Research 39: 35-54.
33
Berger, A.N., and Udell, G.F., 1995. Relationship lending and lines of credit in small firm finance,
Journal of Business 68: 351-381.
_____________________., 2002. Small business credit availability and relationship lending: The
importance of bank organizational structure. The Economic Journal 112: 32–53.
_____________________., 2006. A more complete conceptual framework for SME finance,
Journal of Banking and Finance 30: 2945-2966.
Cassar, G., Ittner, C., Cavalluzzo, K., 2014. Alternative Information Sources and Information
Asymmetry Reduction: Evidence from Small Business Debt, Journal of Accounting and
Economics, forthcoming
Dechow, P. 1994. Accounting earnings and cash flows as measures of firm performance: The role
of accounting accruals. Journal of Accounting and Economics 18, 3-42.
De la Torre, A., Pería, M., and Schmukler, S. 2010. Bank Involvement with SMEs: Beyond
Relationship Lending, Journal of Banking & Finance 34(9): 2280-2293.
Diamond, D., 1984. Financial intermediation and delegated monitoring, Review of Economic Studies
51(3): 393-414.
Francis, J., Schipper, K., and Vincent, L., 2005. Earnings and dividend informativeness when cash flow rights are separated from voting rights, Journal of Accounting and Economics 39(2): 329-
360.
Jensen, M. and Meckling, W. 1976. Theory of the firm: managerial behavior, agency costs and
capital structure. Journal of Financial Economics 3: 305-360.
Leland, H., and Pyle, D., 1977. Information asymmetries, financial structure, and financial
intermediation, Journal of Finance 32(2): 371-387.
Little, R., and Rubin, D., 2002. Statistical Analysis with Missing Data, John Wiley and Sons, New
York
Liu, M., Margartis, D., and Tourani-Rad, A., 2011. Asymmetric information and price competition
in small business lending, Journal of Banking and Finance 35(9): 2189-2196.
Mach, T., and Wolken, J., 2006. Financial services used by small businesses: Evidence from the
2003 Survey of Small Business Finances, Federal Reserve Bulletin, October 24, 2006: A167-
A195.
Minnis, M., 2011. The value of financial statement verification in debt financing: evidence from
private U.S. firms, Journal of Accounting Research 49: 457-506.
Petersen, M. 2004. Information: Hard and Soft, Working Paper, Northwestern University and
NBER.
Petersen, M. and Rajan, R., 1994. The benefits of lending relationships: Evidence from small
business data, Journal of Finance 49(1): 3-37.
_____________________, 1997. Trade Credit: Theories and Evidence, Review of Financial
Studies 10(3): 661-601.
_____________________, 2002. Does distance still matter? The information revolution in
small business lending, Journal of Finance 57(6): 2533-2569.
Rajan, R., 1992. Insiders and outsiders: The choice between informed and arm’s-length debt,
Journal of Finance 47(4): 1367-1400.
Rubin, D., 1987. Multiple Imputation for Non-Response in Survey, John Wiley and Sons, New York
Stein, J., 2002. Information Production and Capital Allocation: Decentralized versus Hierarchical
Firms, Journal of Finance 57(6): 1891-1921.
Stiglitz, J. and Weiss, A., 1981. Credit rationing in markets with imperfect information. American
Economic Review 71(3): 393-410.

34
35
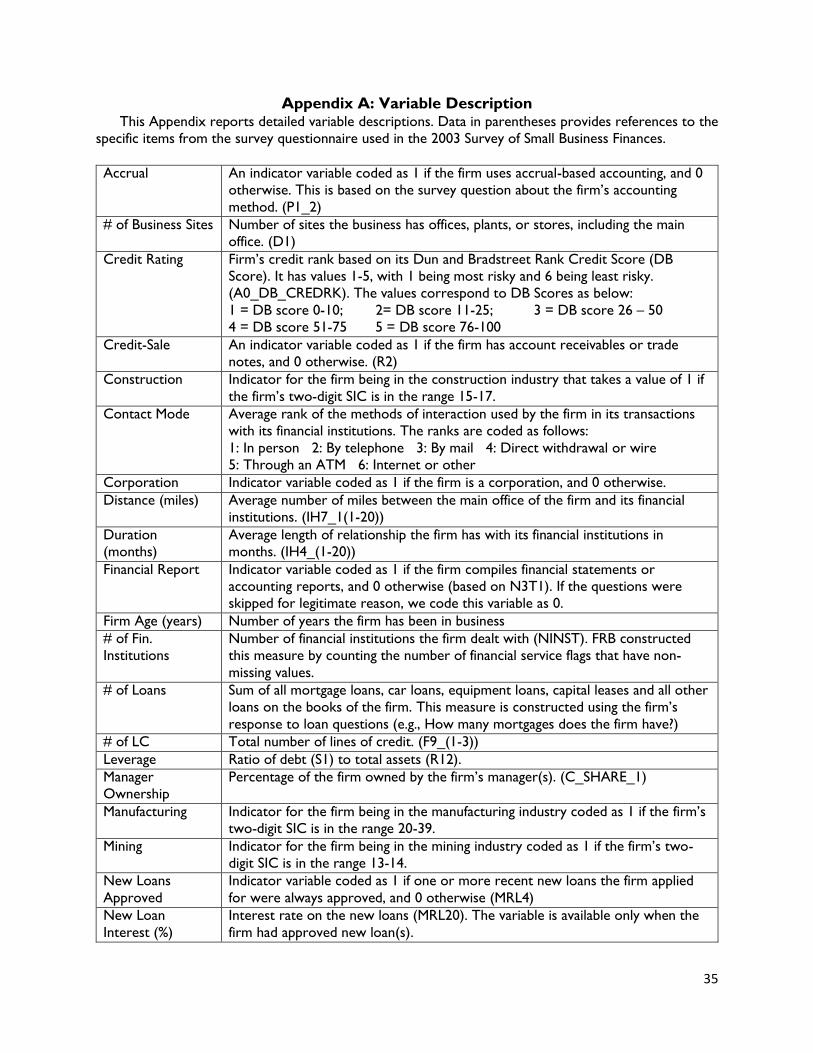
Appendix A: Variable Description This Appendix reports detailed variable descriptions. Data in parentheses provides references to the
specific items from the survey questionnaire used in the 2003 Survey of Small Business Finances.
Accrual An indicator variable coded as 1 if the firm uses accrual-based accounting, and 0
otherwise. This is based on the survey question about the firm’s accounting
method. (P1_2)
# of Business Sites Number of sites the business has offices, plants, or stores, including the main
office. (D1)
Credit Rating Firm’s credit rank based on its Dun and Bradstreet Rank Credit Score (DB
Score). It has values 1-5, with 1 being most risky and 6 being least risky.
(A0_DB_CREDRK). The values correspond to DB Scores as below:
1 = DB score 0-10; 2= DB score 11-25; 3 = DB score 26 – 50
4 = DB score 51-75 5 = DB score 76-100
Credit-Sale An indicator variable coded as 1 if the firm has account receivables or trade
notes, and 0 otherwise. (R2)
Construction Indicator for the firm being in the construction industry that takes a value of 1 if
the firm’s two-digit SIC is in the range 15-17.
Contact Mode Average rank of the methods of interaction used by the firm in its transactions
with its financial institutions. The ranks are coded as follows:
1: In person 2: By telephone 3: By mail 4: Direct withdrawal or wire
5: Through an ATM 6: Internet or other
Corporation Indicator variable coded as 1 if the firm is a corporation, and 0 otherwise.
Distance (miles) Average number of miles between the main office of the firm and its financial
institutions. (IH7_1(1-20))
Duration
(months)
Average length of relationship the firm has with its financial institutions in
months. (IH4_(1-20))
Financial Report Indicator variable coded as 1 if the firm compiles financial statements or
accounting reports, and 0 otherwise (based on N3T1). If the questions were
skipped for legitimate reason, we code this variable as 0.
Firm Age (years) Number of years the firm has been in business
# of Fin.
Institutions
Number of financial institutions the firm dealt with (NINST). FRB constructed
this measure by counting the number of financial service flags that have non-
missing values.
# of Loans Sum of all mortgage loans, car loans, equipment loans, capital leases and all other
loans on the books of the firm. This measure is constructed using the firm’s
response to loan questions (e.g., How many mortgages does the firm have?)
# of LC Total number of lines of credit. (F9_(1-3))
Leverage Ratio of debt (S1) to total assets (R12).
Manager
Ownership
Percentage of the firm owned by the firm’s manager(s). (C_SHARE_1)
Manufacturing Indicator for the firm being in the manufacturing industry coded as 1 if the firm’s
two-digit SIC is in the range 20-39.
Mining Indicator for the firm being in the mining industry coded as 1 if the firm’s two-
digit SIC is in the range 13-14.
New Loans
Approved
Indicator variable coded as 1 if one or more recent new loans the firm applied
for were always approved, and 0 otherwise (MRL4)
New Loan
Interest (%)
Interest rate on the new loans (MRL20). The variable is available only when the
firm had approved new loan(s).

36
Owner Exp # of years of experience the owner(s) of the business has managing or owning a
business, including the existing firm. (C_EXPER_1)
Owner Mgr Indicator variable coded as 1 when the firm owner(s) manages the day-to-day
operation of the business. (C_MANAGE_1)
Proprietorship Indicator variable coded as 1 if firm type is proprietorship, and 0 otherwise.
Partnership Indicator variable coded as 1 if firm type is partnership, and 0 otherwise.
% of Purchases
with TC
Percentage of total purchases made by the firm using trade credit during the
most recent fiscal year. (L2)
# of LC Renewal
Applications
The number of times the firm attempted to renew existing lines of credit
during the past three years. (MRL1)
ROA Ratio of operating income to total assets. Operating income is defined as (sales +
other income – total operating costs). (P2 + P4 – P5/R12)
Sales Sales Revenue ($ ‘000). (P2)
Total # of
Employees
# of people that worked in the company (including owner(s) during a typical pay
period in 2003. (A_TOTEMP)
Service Indicator for the firm being in the service industry coded as 1 if the firm’s two-
digit SIC is in the range 70-89.
Total Loan Value Total principal the firm owes for all loans counted under (# of Loans). This
question is constructed using the firm’s response to loan value questions (e.g.,
What is the total amount of principal owed on this/all mortgages?)
Total LC Amount The sum of credit available under the lines of credits.
# of TC Suppliers Number of suppliers that gave trade credit to the firm during the most recent
fiscal year (L3).
TC Financing
Duration
Financing duration offered by the most important suppliers. It is measured as the
number of days between the invoice date and the due date for the full payment
for the invoice (L11) and is coded as follows.
1: Cash on delivery 2: 1-7 days/1 week 3: 8-10 days
4: 11-14 days 5: 15 days 6: 16-20 days
7: 21-30 days 8: 31-45 days 9: 46-60 days
10: 61-90 days 11: > 90 days
Wholesale Indicator for the firm being in the wholesale industry coded as 1 if the firm’s
two-digit SIC is in the range 50-59.
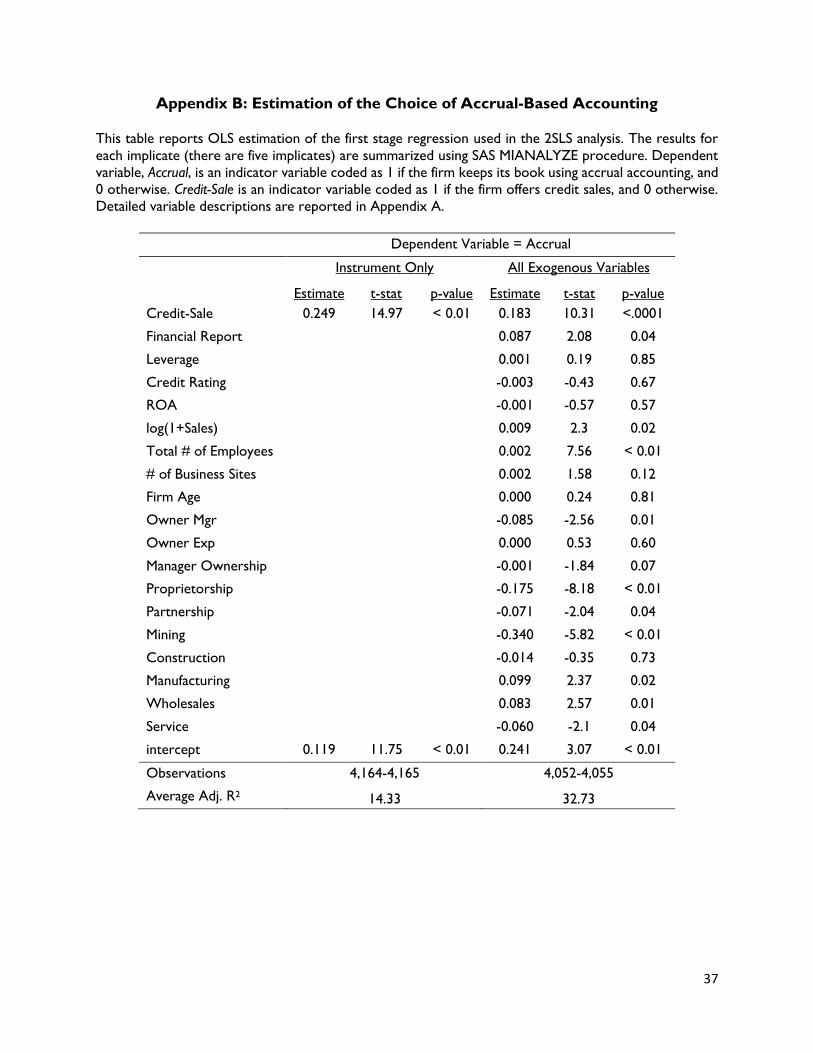
37
Appendix B: Estimation of the Choice of Accrual-Based Accounting
This table reports OLS estimation of the first stage regression used in the 2SLS analysis. The results for
each implicate (there are five implicates) are summarized using SAS MIANALYZE procedure. Dependent
variable, Accrual, is an indicator variable coded as 1 if the firm keeps its book using accrual accounting, and
0 otherwise. Credit-Sale is an indicator variable coded as 1 if the firm offers credit sales, and 0 otherwise.
Detailed variable descriptions are reported in Appendix A.
Dependent Variable = Accrual
Instrument Only All Exogenous Variables
Estimate t-stat p-value Estimate t-stat p-value
Credit-Sale 0.249 14.97 < 0.01 0.183 10.31 <.0001
Financial Report 0.087 2.08 0.04
Leverage 0.001 0.19 0.85
Credit Rating -0.003 -0.43 0.67
ROA -0.001 -0.57 0.57
log(1+Sales) 0.009 2.3 0.02
Total # of Employees 0.002 7.56 < 0.01
# of Business Sites 0.002 1.58 0.12
Firm Age 0.000 0.24 0.81
Owner Mgr -0.085 -2.56 0.01
Owner Exp 0.000 0.53 0.60
Manager Ownership -0.001 -1.84 0.07
Proprietorship -0.175 -8.18 < 0.01
Partnership -0.071 -2.04 0.04
Mining -0.340 -5.82 < 0.01
Construction -0.014 -0.35 0.73
Manufacturing 0.099 2.37 0.02
Wholesales 0.083 2.57 0.01
Service -0.060 -2.1 0.04
intercept 0.119 11.75 < 0.01 0.241 3.07 < 0.01
Observations 4,164-4,165 4,052-4,055
Average Adj. R2 14.33 32.73

38
Table 1
Sample Formation
# of observations
# of unique
firms
Initial Sample
21,200
4,240 per
implicate
1) Delete if total assets missing
or negative & Accrual is
missing
20,827
4,165 Implicate 1
4,165 implicate 2
4,164 Implicate 3
4,167 Implicate 4
4,166 Implicate 5
20,827
2) Delete if control variables
are missing 20,267
4,053 implicate 1
4,053 implicate 2
4,052 implicate 3
4,055 implicate 4
4,054 implicate 5
20267
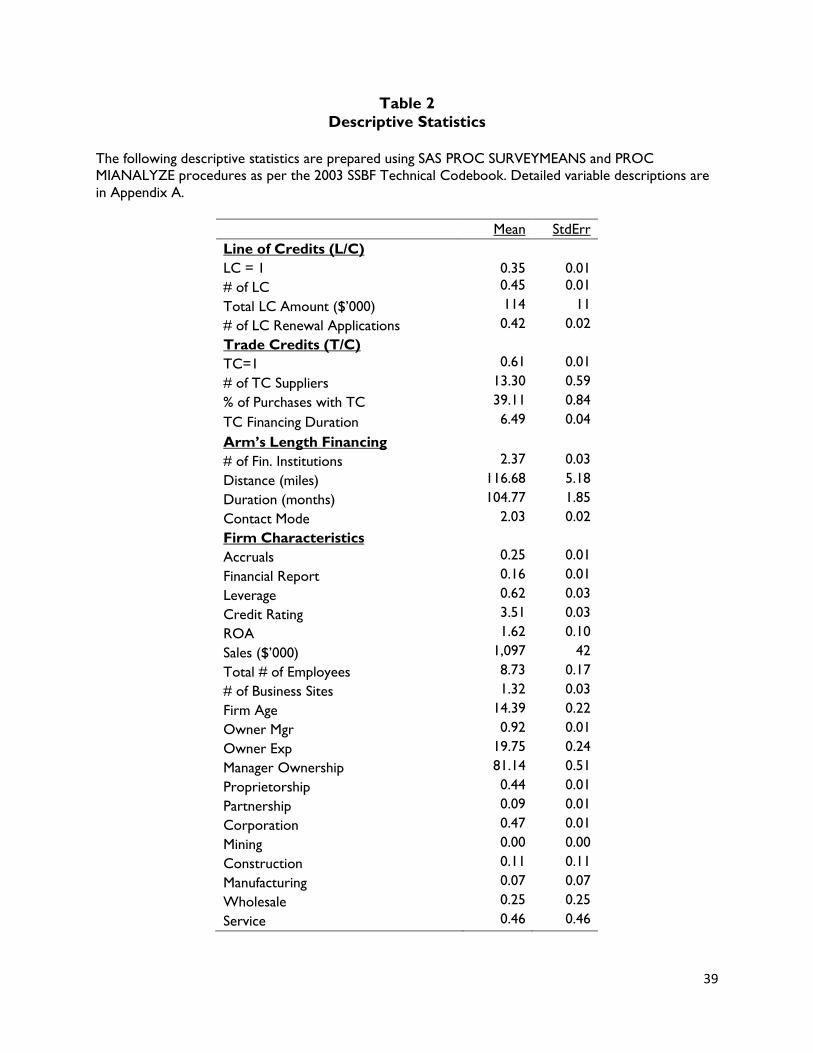
39
Table 2
Descriptive Statistics
The following descriptive statistics are prepared using SAS PROC SURVEYMEANS and PROC
MIANALYZE procedures as per the 2003 SSBF Technical Codebook. Detailed variable descriptions are
in Appendix A.
Mean StdErr
Line of Credits (L/C)
LC = 1 0.35 0.01
# of LC 0.45 0.01
Total LC Amount ($’000) 114 11
# of LC Renewal Applications 0.42 0.02
Trade Credits (T/C)
TC=1 0.61 0.01
# of TC Suppliers 13.30 0.59
% of Purchases with TC 39.11 0.84
TC Financing Duration 6.49 0.04
Arm’s Length Financing
# of Fin. Institutions 2.37 0.03
Distance (miles) 116.68 5.18
Duration (months) 104.77 1.85
Contact Mode 2.03 0.02
Firm Characteristics
Accruals 0.25 0.01
Financial Report 0.16 0.01
Leverage 0.62 0.03
Credit Rating 3.51 0.03
ROA 1.62 0.10
Sales ($’000) 1,097 42
Total # of Employees 8.73 0.17
# of Business Sites 1.32 0.03
Firm Age 14.39 0.22
Owner Mgr 0.92 0.01
Owner Exp 19.75 0.24
Manager Ownership 81.14 0.51
Proprietorship 0.44 0.01
Partnership 0.09 0.01
Corporation 0.47 0.01
Mining 0.00 0.00
Construction 0.11 0.11
Manufacturing 0.07 0.07
Wholesale 0.25 0.25
Service 0.46 0.46

40
Table 3
Correlations This table reports Pearson correlations between key dependent and independent variables. Values in bold are significant at the 5% level or
better.
A B C D E F G H I J K L M N O
Accruals = 1 A 1
Financial Rreport = 1 B 0.08 1
log(Sales) C 0.45 0.12 1
Total # of Employees D 0.37 0.06 0.55 1
Manager Exp E 0.17 0.06 0.25 0.20 1
Proprietorship F -0.39 -0.10 -0.51 -0.31 -0.15 1
# of TC Suppliers G 0.47 0.09 0.60 0.48 0.25 -0.40 1
% of Purchases with TC H 0.37 0.06 0.44 0.29 0.20 -0.32 0.78 1
TC Financing Duration I 0.07 0.00 0.01 0.01 -0.02 -0.04 0.08 0.05 1
# of LC J 0.22 0.07 0.36 0.24 0.11 -0.23 0.32 0.22 0.04 1
Total LC Amount K 0.32 0.08 0.49 0.39 0.15 -0.32 0.46 0.33 0.07 0.80 1 # of LC Renewal
Applications L 0.25 0.05 0.37 0.31 0.11 -0.23 0.34 0.23 0.04 0.41 0.52 1
# of Fin. Institutions M 0.29 0.08 0.45 0.38 0.11 -0.29 0.40 0.27 0.04 0.39 0.38 0.28 1
Distance N 0.18 0.02 0.26 0.22 0.03 -0.17 0.27 0.20 0.01 0.19 0.22 0.15 0.51 1
Duration O -0.02 0.02 0.03 0.01 0.41 0.06 0.04 0.06 -0.02 0.01 0.00 -0.01 -0.14 -0.18 1
Contact Mode P 0.12 0.03 0.14 0.14 -0.02 -0.10 0.13 0.05 0.03 0.10 0.13 0.08 0.22 0.31 -0.14
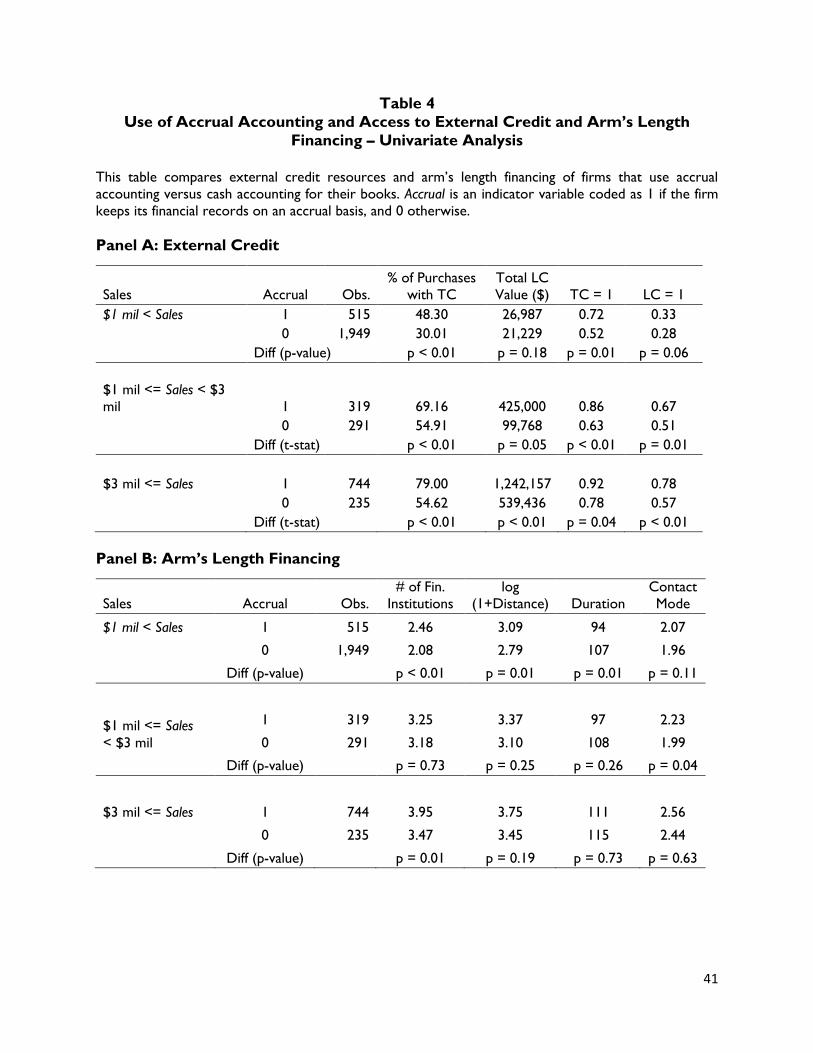
41
Table 4
Use of Accrual Accounting and Access to External Credit and Arm’s Length
Financing – Univariate Analysis
This table compares external credit resources and arm’s length financing of firms that use accrual
accounting versus cash accounting for their books. Accrual is an indicator variable coded as 1 if the firm
keeps its financial records on an accrual basis, and 0 otherwise.
Panel A: External Credit
Sales Accrual Obs.
% of Purchases
with TC
Total LC
Value ($) TC = 1 LC = 1
$1 mil < Sales 1 515 48.30 26,987 0.72 0.33
0 1,949 30.01 21,229 0.52 0.28
Diff (p-value) p < 0.01 p = 0.18 p = 0.01 p = 0.06
$1 mil <= Sales < $3
mil 1 319 69.16 425,000 0.86 0.67
0 291 54.91 99,768 0.63 0.51
Diff (t-stat) p < 0.01 p = 0.05 p < 0.01 p = 0.01
$3 mil <= Sales 1 744 79.00 1,242,157 0.92 0.78
0 235 54.62 539,436 0.78 0.57
Diff (t-stat) p < 0.01 p < 0.01 p = 0.04 p < 0.01
Panel B: Arm’s Length Financing
Sales Accrual Obs.
# of Fin.
Institutions
log
(1+Distance) Duration
Contact
Mode
$1 mil < Sales 1 515 2.46 3.09 94 2.07
0 1,949 2.08 2.79 107 1.96
Diff (p-value) p < 0.01 p = 0.01 p = 0.01 p = 0.11
$1 mil <= Sales
< $3 mil
1 319 3.25 3.37 97 2.23
0 291 3.18 3.10 108 1.99
Diff (p-value) p = 0.73 p = 0.25 p = 0.26 p = 0.04
$3 mil <= Sales 1 744 3.95 3.75 111 2.56
0 235 3.47 3.45 115 2.44
Diff (p-value) p = 0.01 p = 0.19 p = 0.73 p = 0.63
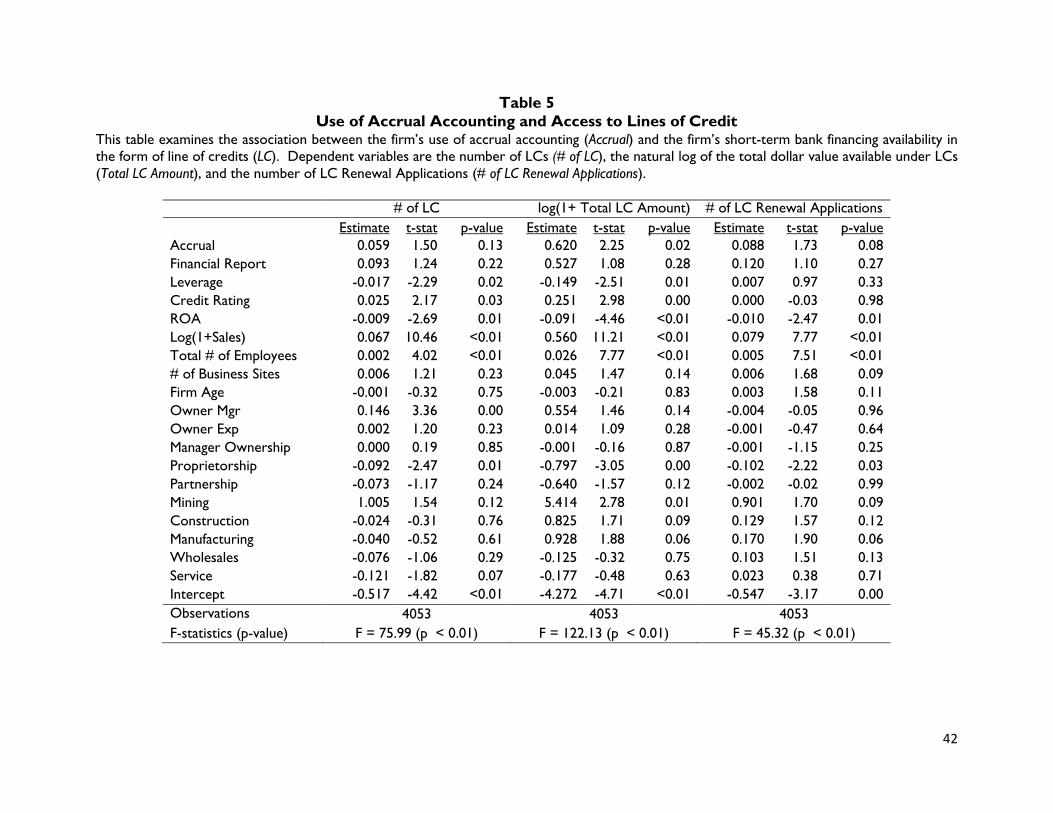
42
Table 5
Use of Accrual Accounting and Access to Lines of Credit This table examines the association between the firm’s use of accrual accounting (Accrual) and the firm’s short-term bank financing availability in
the form of line of credits (LC). Dependent variables are the number of LCs (# of LC), the natural log of the total dollar value available under LCs
(Total LC Amount), and the number of LC Renewal Applications (# of LC Renewal Applications).
# of LC log(1+ Total LC Amount) # of LC Renewal Applications
Estimate t-stat p-value Estimate t-stat p-value Estimate t-stat p-value
Accrual 0.059 1.50 0.13 0.620 2.25 0.02 0.088 1.73 0.08
Financial Report 0.093 1.24 0.22 0.527 1.08 0.28 0.120 1.10 0.27
Leverage -0.017 -2.29 0.02 -0.149 -2.51 0.01 0.007 0.97 0.33
Credit Rating 0.025 2.17 0.03 0.251 2.98 0.00 0.000 -0.03 0.98
ROA -0.009 -2.69 0.01 -0.091 -4.46 <0.01 -0.010 -2.47 0.01
Log(1+Sales) 0.067 10.46 <0.01 0.560 11.21 <0.01 0.079 7.77 <0.01
Total # of Employees 0.002 4.02 <0.01 0.026 7.77 <0.01 0.005 7.51 <0.01
# of Business Sites 0.006 1.21 0.23 0.045 1.47 0.14 0.006 1.68 0.09
Firm Age -0.001 -0.32 0.75 -0.003 -0.21 0.83 0.003 1.58 0.11
Owner Mgr 0.146 3.36 0.00 0.554 1.46 0.14 -0.004 -0.05 0.96
Owner Exp 0.002 1.20 0.23 0.014 1.09 0.28 -0.001 -0.47 0.64
Manager Ownership 0.000 0.19 0.85 -0.001 -0.16 0.87 -0.001 -1.15 0.25
Proprietorship -0.092 -2.47 0.01 -0.797 -3.05 0.00 -0.102 -2.22 0.03
Partnership -0.073 -1.17 0.24 -0.640 -1.57 0.12 -0.002 -0.02 0.99
Mining 1.005 1.54 0.12 5.414 2.78 0.01 0.901 1.70 0.09
Construction -0.024 -0.31 0.76 0.825 1.71 0.09 0.129 1.57 0.12
Manufacturing -0.040 -0.52 0.61 0.928 1.88 0.06 0.170 1.90 0.06
Wholesales -0.076 -1.06 0.29 -0.125 -0.32 0.75 0.103 1.51 0.13
Service -0.121 -1.82 0.07 -0.177 -0.48 0.63 0.023 0.38 0.71
Intercept -0.517 -4.42 <0.01 -4.272 -4.71 <0.01 -0.547 -3.17 0.00
Observations 4053 4053 4053
F-statistics (p-value) F = 75.99 (p < 0.01) F = 122.13 (p < 0.01) F = 45.32 (p < 0.01)

43
Table 6
Use of Accrual Accounting and Trade Credit This table examines the association between the firm’s use of accrual accounting (Accrual) and their use of supplier-provided financing in the form
of trade credit (TC) during the most recent fiscal year. Dependent variables are the natural log of the number of trade creditors of the firm (# of
TC Suppliers), the percent of total purchases made using trade credit (% of Purchases with TC), and the interest free financing duration of trade
credit offered by the most important supplier (TC Financing Duration). The test for TC financing duration only includes firms that have trade credit
financing.
log(1+# of TC Suppliers) % of Purchases with TC TC Financing Duration
Estimate t-stat p-value Estimate t-stat p-value Estimate t-stat p-value
Accrual 0.465 7.14 <.0001 10.828 5.42 <.0001 0.226 2.02 0.05
Financial Report 0.085 0.69 0.49 0.344 0.10 0.92 0.248 1.73 0.08
Leverage 0.025 1.63 0.10 0.759 1.61 0.11 -0.063 -1.67 0.09
Credit Rating 0.022 1.16 0.25 0.751 1.18 0.24 -0.030 -0.82 0.41
ROA -0.035 -7.26 <.0001 -0.942 -5.74 <.0001 -0.015 -1.05 0.30
Log(1+Sales) 0.181 14.25 <.0001 4.050 9.39 <.0001 -0.004 -0.12 0.91
Total # of Employees 0.008 8.75 <.0001 0.038 1.60 0.11 0.000 0.19 0.85
# of Business Sites 0.000 0.05 0.96 -0.014 -0.14 0.89 -0.003 -0.27 0.79
Firm Age 0.004 1.31 0.19 0.075 0.81 0.42 -0.005 -0.96 0.34
Owner Mgr -0.160 -1.77 0.08 -5.209 -1.94 0.05 0.028 0.17 0.86
Owner Exp 0.009 3.51 0.00 0.263 3.00 0.00 0.000 0.07 0.95
Manager Ownership -0.002 -1.40 0.16 -0.061 -1.72 0.09 0.003 1.29 0.20
Proprietorship -0.229 -3.96 <.0001 -4.957 -2.60 0.01 -0.095 -0.83 0.41
Partnership -0.098 -0.92 0.36 -0.745 -0.23 0.82 0.174 0.86 0.39
Mining 1.050 2.75 0.01 32.549 2.59 0.01 1.580 2.55 0.01
Construction 0.585 5.87 <.0001 30.887 8.88 <.0001 -0.133 -0.71 0.47
Manufacturing 0.629 5.53 <.0001 17.419 4.79 <.0001 0.253 1.45 0.15
Wholesales 0.440 4.57 <.0001 13.435 4.37 <.0001 -0.278 -1.58 0.11
Service 0.049 0.58 0.56 1.150 0.40 0.69 -0.028 -0.18 0.86
Intercept -1.120 -5.15 <.0001 -16.887 -2.31 0.02 6.537 12.71 <.0001
Observations 4053 4053 2816
F-statistics (p-value) F = 251.48 (p < 0.01) F = 243.43 (p < 0.01) F = 1550.20 (p < 0.01)

44
Table 7
Use of Accrual Accounting and Arm’s Length Financing This table examines the association between the firm’s use of accrual accounting (Accrual) and its relationship with financial institutions. Dependent
variables include the total number of financing institutions that the firm dealt with during the most recent year (# of Fin. Institutions), the natural
log of the average distance between the between the main office of the firm and its financial institutions (Distance), the average number of months
the firm has done business with its financial institutions (Duration), and the average value of the most frequent method of conducting business with
the firm’s financial institutions (Contact Mode) – lowest value indicates contact in person, while highest value indicates most remote form of contact
(internet).
# of Fin. Institutions log(1+ Distance) Duration Contact Mode
Estimate t-stat p-value Estimate t-stat p-value Estimate t-stat p-value Estimate t-stat p-value
Accrual 0.176 2.37 0.02 0.177 1.65 0.10 -11.193 -3.25 0.00 0.140 2.42 0.02
Financial Report 0.119 0.95 0.34 -0.215 -1.27 0.20 -0.999 -0.18 0.86 0.089 0.87 0.39
Leverage 0.090 4.70 <.0001 0.127 4.51 <.0001 -2.658 -3.00 0.00 0.000 0.03 0.97
Credit Rating -0.027 -1.18 0.24 -0.021 -0.58 0.56 4.033 3.29 0.00 0.057 2.55 0.01
ROA -0.027 -4.50 <.0001 -0.027 -2.92 0.00 -0.034 -0.10 0.92 0.014 1.59 0.11
Log(1+Sales) 0.188 9.50 <.0001 0.128 5.80 <.0001 -1.254 -1.35 0.18 0.017 1.31 0.19
Total # of Employees 0.008 7.09 <.0001 0.004 4.14 <.0001 -0.146 -3.61 0.00 0.003 4.32 <.0001
# of Business Sites 0.012 1.09 0.28 0.002 0.43 0.67 0.273 0.76 0.45 0.008 0.96 0.34
Firm Age -0.001 -0.35 0.72 -0.011 -2.18 0.03 4.070 15.59 <.0001 -0.009 -3.31 0.00
Owner Mgr -0.137 -1.23 0.22 -0.318 -2.09 0.04 10.093 2.08 0.04 -0.109 -1.04 0.30
Owner Exp 0.002 0.65 0.52 0.003 0.53 0.59 1.070 4.87 <.0001 -0.001 -0.41 0.68
Manager Ownership 0.000 0.12 0.91 0.000 0.22 0.82 -0.099 -1.57 0.12 0.002 1.64 0.10
Proprietorship -0.193 -2.82 0.00 -0.087 -0.82 0.41 11.127 3.02 0.00 -0.080 -1.39 0.16
Partnership -0.130 -1.23 0.22 -0.390 -2.40 0.02 -1.339 -0.25 0.80 0.057 0.46 0.64
Mining 0.003 0.01 1.00 0.098 0.16 0.87 37.035 1.28 0.20 -0.334 -1.49 0.14
Construction -0.372 -2.97 0.00 -0.187 -1.00 0.32 -2.487 -0.35 0.73 -0.184 -1.70 0.09
Manufacturing -0.322 -2.42 0.02 -0.262 -1.42 0.16 -8.546 -1.28 0.20 0.068 0.56 0.58
Wholesales -0.200 -1.79 0.07 -0.236 -1.47 0.14 -1.191 -0.22 0.83 -0.067 -0.68 0.50
Service -0.205 -1.93 0.05 -0.223 -1.46 0.14 -7.266 -1.47 0.14 0.098 1.00 0.32
Intercept 0.471 1.28 0.20 2.009 4.88 <.0001 29.899 2.05 0.04 1.667 7.14 <.0001
Observations 3986 3986 3986 3986
F-statistics (p-value) F = 442.19 (p < 0.01) F = 356.48 (p < 0.01) F = 354.40 (p < 0.01) F = 491.91 (p < 0.01)

45
Table 8
Use of Accrual Accounting and Access to External Credit – 2SLS Estimation This table examines the association between the use of accrual accounting and key measures of access to
external credit using the following models:
Accrual = a0 + a1*Credit-Sale + e
Financing (or Financial Inst.) = b0+ b1*Accrual + Σ Control variable + v
Credit-Sale is an indicator variable coded as 1 if the firm offer credit sales, and 0 otherwise. Financing is
measured by the natural log of total amount available through lines of credit (Total LC Amount) and
Percentage of total purchases made by the firm using trade credit (% of Purchases with TC). Financial Inst. is
measured as the number of financial institutions (# of Fin. Institutions) or natural log of average miles
between the main office of the business and to its financial institutions (Distance). Panel A (B) reports the
reduced form 2nd stage estimation results for external financing (arm’s length financing). Estimation results
of the 1st stage regression for the Accrual equation with only instruments variables are reported in
Appendix B.
Panel A: External Financing
log(1+Total LC Amount) % of Purchases with TC
Estimate t-stat P-value Estimate t-stat P-value
Accrual 5.288 5.47 <0.01 35.225 5.44 <0.01
Financial Report 0.372 1.07 0.29 -0.320 -0.14 0.89
Leverage 0.230 3.76 0.00 1.056 2.60 0.01
Credit Rating 0.294 4.14 <0.01 0.964 2.03 0.04
ROA -0.111 -4.60 <0.01 -0.932 -5.98 <0.01
log(1+Sales) 0.582 10.10 <0.01 3.199 8.31 <0.01
Total # of Employees 0.010 4.34 <0.01 -0.023 -1.61 0.11
# of Business Sites 0.010 1.03 0.30 -0.004 -0.06 0.95
Firm Age 0.005 0.50 0.62 0.058 0.91 0.36
Owner Mgr 0.682 2.35 0.02 -0.359 -0.19 0.85
Owner Exp -0.004 -0.45 0.65 0.208 3.22 0.00
Manager Ownership 0.001 0.28 0.78 -0.022 -0.88 0.38
Proprietorship 0.088 0.29 0.77 -0.654 -0.33 0.75
Partnership -0.394 -1.11 0.27 2.730 1.16 0.25
Mining 5.936 3.48 0.00 25.391 2.25 0.02
Construction 0.611 1.54 0.12 26.621 10.12 <0.01
Manufacturing 0.040 0.09 0.92 18.778 6.60 <0.01
Wholesales -0.733 -2.17 0.03 11.529 5.12 <0.01
Service -0.234 -0.76 0.44 1.811 0.89 0.37
Intercept -6.017 -7.45 <0.01 -21.306 -4.00 <0.01
F = 278.33 (p < 0.01) F=561.61 (p < 0.01)

46
Table 8 - Continued
Panel B: Arm’s Length Financing
# of Fin. Institutions log(1+Distance)
Estimate t-stat P-value Estimate t-stat P-value
Accrual 1.574 5.30 <0.01 1.005 2.97 <0.01
Financial Report 0.112 1.05 0.29 -0.118 -0.97 0.33
Leverage 0.103 5.45 <0.01 0.125 5.78 <0.01
Credit Rating -0.024 -1.11 0.27 0.022 0.87 0.38
ROA -0.026 -3.57 0.00 -0.026 -3.17 <0.01
log(1+Sales) 0.164 9.32 <0.01 0.103 4.94 <0.01
Total # of Employees 0.004 5.81 <0.01 0.002 3.09 <0.01
# of Business Sites 0.006 2.16 0.03 -0.002 -0.51 0.61
Firm Age -0.003 -1.04 0.30 -0.009 -2.51 0.01
Owner Mgr 0.239 2.67 0.01 -0.111 -1.10 0.27
Owner Exp -0.003 -1.10 0.27 -0.004 -1.09 0.27
Manager Ownership -0.001 -1.09 0.27 0.000 0.18 0.86
Proprietorship 0.076 0.81 0.42 0.032 0.30 0.76
Partnership -0.167 -1.52 0.13 -0.290 -2.30 0.02
Mining 0.050 0.10 0.92 0.754 1.27 0.20
Construction -0.583 -4.78 <0.01 -0.195 -1.40 0.16
Manufacturing -0.722 -5.49 <0.01 -0.164 -1.09 0.28
Wholesales -0.353 -3.40 <0.01 -0.030 -0.26 0.80
Service -0.268 -2.85 <0.01 -0.067 -0.61 0.54
Intercept 0.323 1.30 0.19 1.651 5.58 <0.01
F = 610.67 (p < 0.01) F = 559.19 (p < 0.01)

47
Table 9
Use of Accrual Accounting and Loan Financing This table examines the association between the firm’s use of accrual accounting and its loans. Loans for
this test include mortgages, car loans, equipment loans, capital leases and various other loans the firms
have during the most recent fiscal year.
Panel A: Number and Value of Loans Dependent variables include the natural log of the number of loans (# of loans) and the natural log of total
value of the loans (Total Loan Value).
log(1+# of Loans) log(1+Total Loan Value)
Estimate t-stat p-value Estimate t-stat p-value
Accrual 0.061 2.05 0.04 0.752 2.78 0.01
Financial Report 0.049 0.88 0.38 0.298 0.63 0.53
Leverage 0.060 6.94 <0.01 0.641 8.43 <0.01
Credit Rating -0.037 -3.82 0.00 -0.286 -3.30 0.00
ROA -0.014 -6.33 <0.01 -0.129 -5.85 <0.01
Log(1+Sales) 0.064 10.07 <0.01 0.596 9.58 <0.01
Total # of Employees 0.004 9.05 <0.01 0.023 6.28 <0.01
# of Business Sites 0.002 0.47 0.64 0.019 0.84 0.40
Firm Age -0.003 -2.14 0.03 -0.042 -3.20 0.00
Owner Mgr -0.050 -1.07 0.28 -0.548 -1.37 0.17
Owner Exp 0.001 0.56 0.58 0.013 0.99 0.32
Manager Ownership 0.000 -0.16 0.87 -0.001 -0.27 0.79
Proprietorship -0.005 -0.18 0.86 0.161 0.60 0.55
Partnership 0.028 0.61 0.54 0.648 1.50 0.13
Mining 0.599 1.26 0.21 -0.267 -0.13 0.90
Construction 0.034 0.59 0.56 -0.496 -1.00 0.32
Manufacturing -0.128 -2.3 0.02 -1.277 -2.46 0.01
Wholesales -0.218 -4.71 <0.01 -2.311 -5.48 <0.01
Service -0.156 -3.6 0.00 -1.576 -3.91 <0.01
Intercept 0.015 0.13 0.90 0.741 0.70 0.48
Observations 4053 4053
F-statistics (p-value) F = 128.33 (p < 0.01) F = 175.63 (p < 0.01)

48
Table 9 – Continued
Panel B: New Loans This table examines the association between the firm’s use of accrual accounting (Accrual) and the
likelihood of all new loan applications being approved (New Loans Approved) and the average interest rate
of the newly approved loans (New Loan Interest). Firms that did not apply for new loans are excluded in
this test.
Prob.(New Loans Approved = 1) New Loan Interest
Estimate t-stat p-value Estimate t-stat p-value
Accrual 0.615 2.31 0.02 -0.725 -2.76 0.01
Financial Report -0.159 -0.42 0.67 0.491 1.29 0.20
Leverage -0.102 -1.90 0.06 0.027 0.32 0.75
Credit Rating 0.571 6.88 <0.01 -0.223 -2.31 0.02
ROA 0.026 0.85 0.40 0.006 0.17 0.86
Log(1+Sales) 0.117 2.28 0.02 -0.135 -1.88 0.06
Total # of Employees 0.002 0.60 0.55 -0.005 -2.66 0.01
# of Business Sites 0.055 0.87 0.38 0.000 0.00 1.00
Firm Age 0.002 0.11 0.91 -0.013 -0.92 0.36
Owner Mgr -1.091 -2.20 0.03 0.084 0.26 0.79
Owner Exp 0.024 1.91 0.06 -0.021 -1.44 0.15
Manager Ownership 0.002 0.35 0.73 -0.005 -0.74 0.46
Proprietorship 0.473 1.83 0.07 0.550 1.49 0.14
Partnership 0.368 0.87 0.38 -0.351 -0.98 0.33
Mining 13.561 18.21 <0.01 0.236 0.32 0.75
Construction 0.681 1.36 0.17 -0.743 -1.55 0.12
Manufacturing 0.256 0.50 0.62 0.015 0.04 0.97
Wholesales 0.145 0.34 0.73 -0.135 -0.34 0.73
Service 0.472 1.17 0.24 0.413 1.00 0.32
Intercept -1.782 -1.89 0.06 10.085 8.21 <.0001
Observations 1820 1693
F-statistics (p-value) F = 48.36 (p < 0.01) F = 294.15 (p < 0.01)
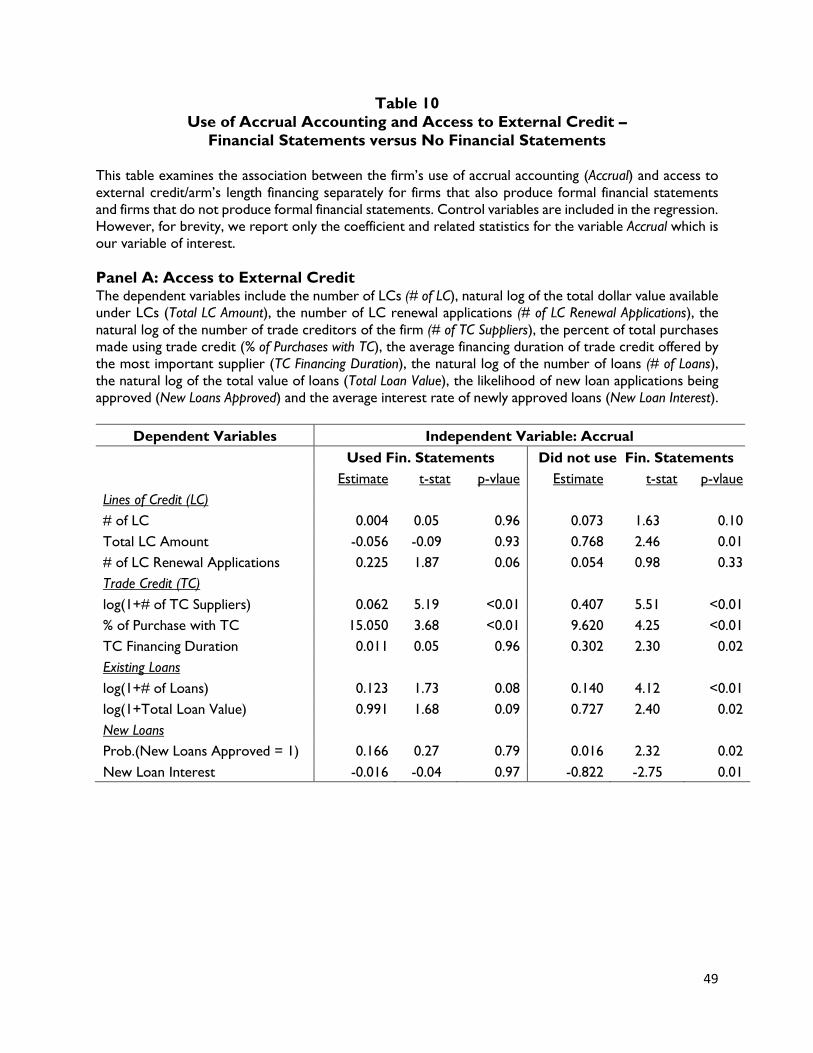
49
Table 10
Use of Accrual Accounting and Access to External Credit –
Financial Statements versus No Financial Statements
This table examines the association between the firm’s use of accrual accounting (Accrual) and access to
external credit/arm’s length financing separately for firms that also produce formal financial statements
and firms that do not produce formal financial statements. Control variables are included in the regression.
However, for brevity, we report only the coefficient and related statistics for the variable Accrual which is
our variable of interest.
Panel A: Access to External Credit The dependent variables include the number of LCs (# of LC), natural log of the total dollar value available
under LCs (Total LC Amount), the number of LC renewal applications (# of LC Renewal Applications), the
natural log of the number of trade creditors of the firm (# of TC Suppliers), the percent of total purchases
made using trade credit (% of Purchases with TC), the average financing duration of trade credit offered by
the most important supplier (TC Financing Duration), the natural log of the number of loans (# of Loans),
the natural log of the total value of loans (Total Loan Value), the likelihood of new loan applications being
approved (New Loans Approved) and the average interest rate of newly approved loans (New Loan Interest).
Dependent Variables Independent Variable: Accrual
Used Fin. Statements Did not use Fin. Statements
Estimate t-stat p-vlaue Estimate t-stat p-vlaue
Lines of Credit (LC)
# of LC 0.004 0.05 0.96 0.073 1.63 0.10
Total LC Amount -0.056 -0.09 0.93 0.768 2.46 0.01
# of LC Renewal Applications 0.225 1.87 0.06 0.054 0.98 0.33
Trade Credit (TC)
log(1+# of TC Suppliers) 0.062 5.19 <0.01 0.407 5.51 <0.01
% of Purchase with TC 15.050 3.68 <0.01 9.620 4.25 <0.01
TC Financing Duration 0.011 0.05 0.96 0.302 2.30 0.02
Existing Loans
log(1+# of Loans) 0.123 1.73 0.08 0.140 4.12 <0.01
log(1+Total Loan Value) 0.991 1.68 0.09 0.727 2.40 0.02
New Loans
Prob.(New Loans Approved = 1) 0.166 0.27 0.79 0.016 2.32 0.02
New Loan Interest -0.016 -0.04 0.97 -0.822 -2.75 0.01
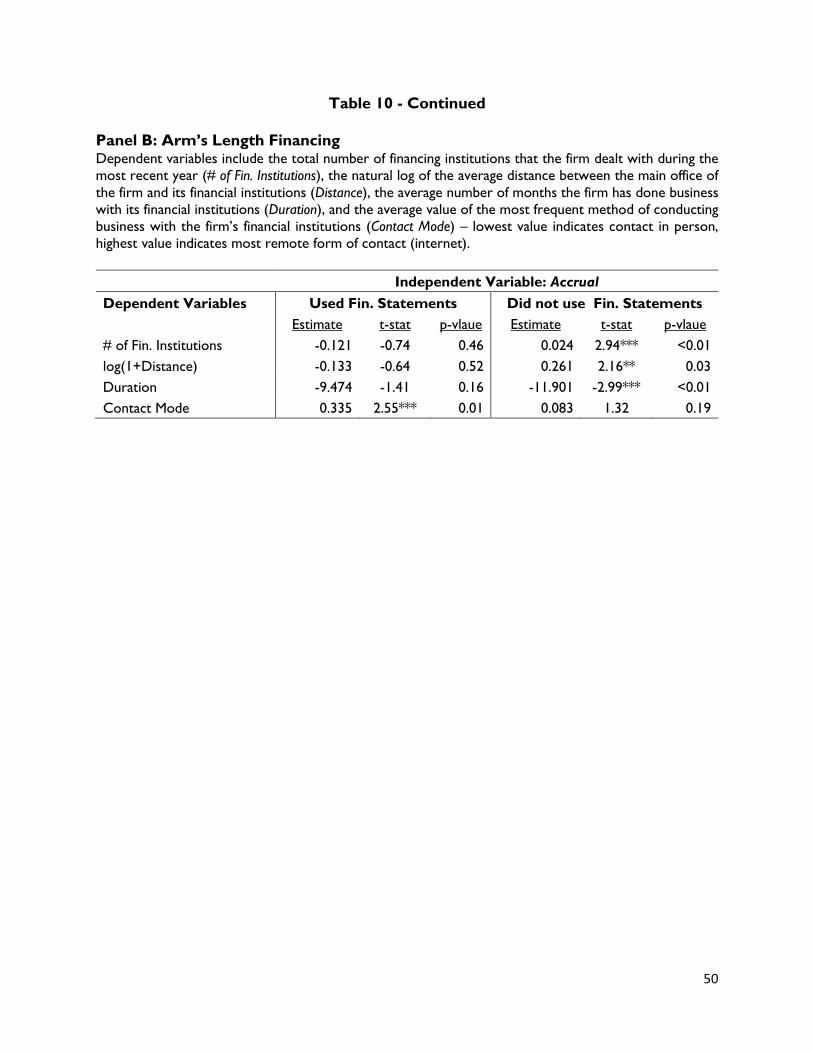
50
Table 10 - Continued
Panel B: Arm’s Length Financing Dependent variables include the total number of financing institutions that the firm dealt with during the
most recent year (# of Fin. Institutions), the natural log of the average distance between the main office of
the firm and its financial institutions (Distance), the average number of months the firm has done business
with its financial institutions (Duration), and the average value of the most frequent method of conducting
business with the firm’s financial institutions (Contact Mode) – lowest value indicates contact in person,
highest value indicates most remote form of contact (internet).
Independent Variable: Accrual
Dependent Variables Used Fin. Statements Did not use Fin. Statements
Estimate t-stat p-vlaue Estimate t-stat p-vlaue
# of Fin. Institutions -0.121 -0.74 0.46 0.024 2.94*** <0.01
log(1+Distance) -0.133 -0.64 0.52 0.261 2.16** 0.03
Duration -9.474 -1.41 0.16 -11.901 -2.99*** <0.01
Contact Mode 0.335 2.55*** 0.01 0.083 1.32 0.19