accounting for managerial decisions commerce duniya
DESCRIPTION
Accounting for managerial decisisonTRANSCRIPT
5
Accounting:An OverviewUNIT 1 ACCOUNTING: AN OVERVIEW
Structure
1.0 Objectives1.1 Introduction1.2 Need for Accounting1.3 Definition of Accounting1.4 Objectives of Accounting1.5 Accounting as Part of the Information System1.6 Branches of Accounting
1.6.1 Financial Accounting1.6.2 Cost Accounting1.6.3 Management Accounting
1.7 Role of Management Accountant1.8 Financial Accounting Process1.9 Accounting Equation1.10 Accounting Concepts
1.10.1 Concepts to be Observed at the Recording Stage1.10.2 Concepts to be Observed at the Reporting Stage
1.11 Accounting Standards1.12 Accounting Assumptions and Policies as per Accounting Standards of India1.13 Let Us Sum Up1.14 Key Words1.15 Answers to Check Your Progress1.16 Terminal Questions1.17 Some Useful Books
1.0 OBJECTIVESAfter studying this unit you should be able to appreciate:
l the need for accounting;l definition of accounting and its objectives;l describe the advantages and limitations of branches of accounting;l identify the parties interested in accounting information;l activities of a management accountant;l identify the stages involved in accounting process;l explain the accounting concepts to be observed at the recording and reporting
stages; andl understand and appreciate the Generally Accepted Accounting Principles.
1.1 INTRODUCTIONIn business numerous transactions take place every day. It is humanly impossible toremember all of them. With the help of accounting records the businessman is able toascertain the profit or loss and the financial position of the business at a given period

6
Fundamentals ofAccounting
and communicate such information to all interested parties. In this unit you will learnabout an overview of accounting and the basic concepts which are to be observed atthe recording and reporting stage. You will also learn different stages involved inaccounting process and importance of accounting standards to maintain uniformity inthe practice of accounting.
1.2 NEED FOR ACCOUNTINGIn early days the business organisations and transactions were small and easilymanageable by the owners of the business themselves. The businessmen used toremember the transactions by memorizing them. In those days accounting developedas a result of the needs of the business to keep relationship with the outsiders, listingof their assets and liabilities. The advent of industrial revoluation and technologicalchanges have widened the market opportunities. Most of the business concerns inthese days are run by company type of organisation. The business concern hasconstantly enter into transactions with outsiders. A transaction involves transfer ofmoney or money’s worth (goods or services) from one person to another. In additionto the transactions with outsiders, there are also events requiring monetary record.It is not possible for a human being to keep in memory all the transactions. Therefore,it is necessary to record all these transactions properly to get required financialinformation. With the help of accounting records the businessman would be able toascertain the profit or loss and the financial position of his business at the end of agiven period and would be able to communicate the results of business operations tovarious interested parties. It is, therefore, necessary to record all the transactionssystematically from time to time irrespective of the form of business organisation.The accounting information is useful both for the management and the outsideagencies. The management needs it for the purpose of planning , controlling anddecision making. The outsiders like banks, creditors etc. also require it for assessingthe financial solvency of the business and the tax authorities use it for determining theamount of tax liability. Infact accounting is necessary not only for businessorganisations but also for non-business organisations like schools, colleges, hospitals,clubs etc.
1.3 DEFINITION OF ACCOUNTINGAccounting as said earlier, involves the collection, recording, classification andpresentation of financial data for the benefit of management and outside agencies suchas shareholder, creditors, investors, government and other interested parties.Accounting has been defined in different ways by different authorities on the subject.The following are some of the important definitions of accounting:
According to the Committee on Terminology of American Institute of Certified PublicAccountants (AICPA), “Accounting is the art of recording, classifying andsummarizing in a significant manner and in terms of money, transactions and eventswhich are in part at least, of a financial character, and interpreting the results thereof”.
Eric L. Kohlen (A Dictionary for Accountants) defines accounting as “the procedureof analysing, classifying and recording transactions in accordance with a pre-conceived plan for the benefit of : (a) providing a means by which an enterprise can beconducted in orderly fashion, and (b) establishing a basis for reporting the financialcondition of enterprise and the results of its operations.”
The former definition denotes that accounting is concerned with the recording oftransactions which are measurable in monetary terms in such a way that analysis andinterpretation of business activities is possible. According to the latter definition
7
Accounting:An Overview
accounting is concerned with the recording of business transactions for bettermanagement of the concern and also reporting the true financial position of theconcern.
The American Accounting Association (AAA) defines accounting as “the process ofidentifying, measuring and communicating economic information to permit informedjudgements and decisions by users of information.”
Smith and Ashburne define accounting as “the science of recording and classifyingbusiness transactions and events, primarily of a financial character, and the art ofmaking significant summaries, analysis and interpretations of those transactions andevents and communicating the results to persons who must make decisions or formjudgments.” Thus this definition emphasises financial reporting and decision makingaspects of accounting.
From the above definitions it is clear that accounting is a science of recordingtransactions of economic nature in a systematic manner and also an art of analysingand interpreting the same.
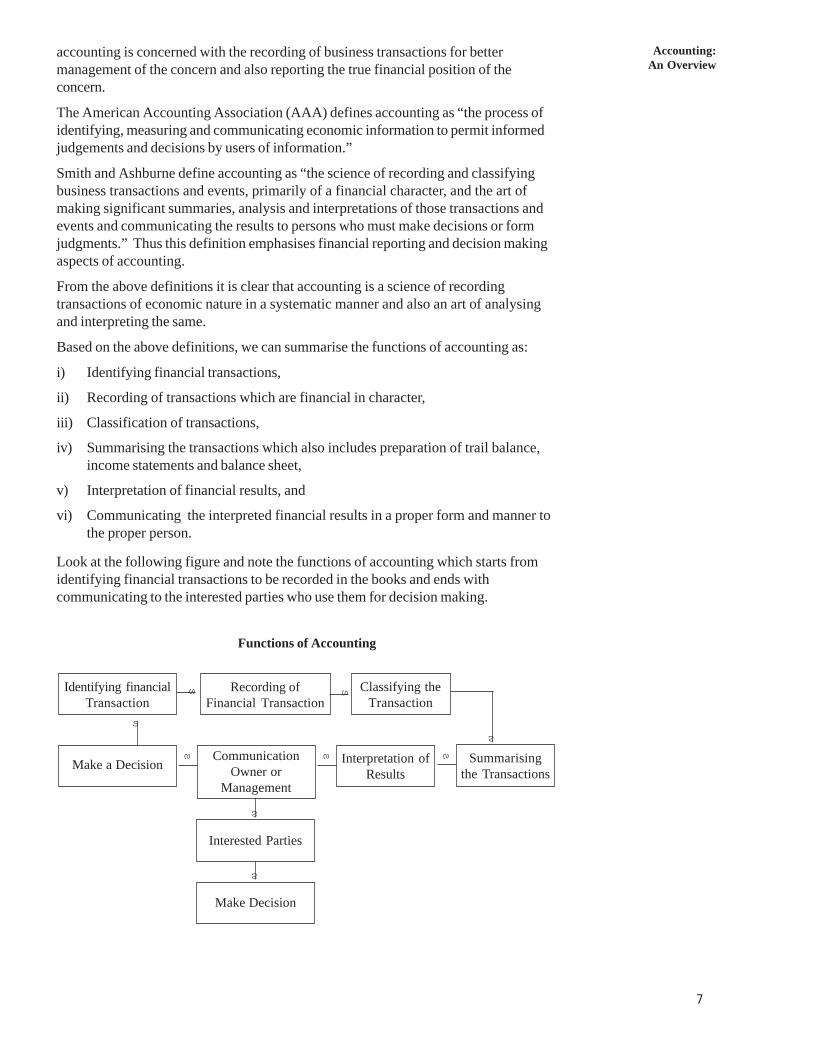
Based on the above definitions, we can summarise the functions of accounting as:
i) Identifying financial transactions,
ii) Recording of transactions which are financial in character,
iii) Classification of transactions,
iv) Summarising the transactions which also includes preparation of trail balance,income statements and balance sheet,
v) Interpretation of financial results, and
vi) Communicating the interpreted financial results in a proper form and manner tothe proper person.
Look at the following figure and note the functions of accounting which starts fromidentifying financial transactions to be recorded in the books and ends withcommunicating to the interested parties who use them for decision making.
Functions of Accounting
Identifying financialTransaction
Make a Decision
Recording ofFinancial Transaction
CommunicationOwner or
Management
Interested Parties
Make Decision
Classifying theTransaction
Interpretation ofResults
Summarisingthe Transactions
s s
s s
s
s
s
s
s
8
Fundamentals ofAccounting 1.4 OBJECTIVES OF ACCOUNTING
The basic objectives of accounting is to provide necessary information to the personsinterested who will make relevant decisions and form judgement. The personsinterested in the business are classified into two types : i) Internal users, andii) External users. Internal users are those who manage the business. External usersare those other than the internal users such as investors, creditors, Government, etc.Information required by the external users are provided through Profit and Lossaccount and Balance sheet whereas the internal users get required information fromthe records of the business. Thus the main objectives of accounting are as follows:1) To keep systematic records of the business : Accounting keeps a systematic
record of all financial transactions like purchase and sale of goods, cash receiptsand cash payments etc. It is also used for recording all assets and liabilities ofthe business. In the absence of accounting it is impossible to a human being tokeep in memory all business transactions.
2) To ascertain profit or loss of the business : By keeping a proper record ofrevenues and expenses of business for a particular period, accounting helps inascertaining the profit or loss of the business through the preparation of profitand loss account. Profit and Loss account helps the interested parties inassessing the profit or loss made by the business during a particular period. Italso helps the management to take remedial action in case the business has notproved remunerative or profitable. A proper record of all incomes and expenseshelps in preparing a profit and loss account and in ascertaining net operatingresults of a business during a particular period.
3) To ascertain the financial position of business : The business man is alsointerested to know the financial position of his business apart from operatingresults of the business during a particular period. In other words, he wants toknow how much he owns and how much owes to others. He would also like toknow what happened to his capital, whether it has increased or decreased orremained constant. A systematic record of assets and liabilities facilitates thepreparation of a position statement called Balance Sheet which providesnecessary information to the above questions. Balance Sheet serves as barometerfor ascertaining the financial solvency of the business.
4) To provide accounting information to interested parties : Apart from ownersthere are various parties who are interested in the accounting information. Theseare bankers, creditors, tax authorities, prospective investors etc. They need suchinformation to assess the profitability and the financial soundness of thebusiness. The accounting information is communicated to them in the form of anannual report.
Parties Interested in Accounting InformationMany people are interested in examining the financial information provided in thefinancial statements besides a owner or management of the concern. These financialstatements help them to know the following :i) To study the present financial position of business,ii) To compare its present performance with that of past years, andiii) To compare its performance with similar enterprises.
The following are the various parties interested in the financial statements:i) Owners/Shareholders : Shareholders are the real owners of the company
because they contribute the required capital and take the risk of business.Obviously they are interested to know the result of operations and financialposition of the company. The shareholders are also interested to use theaccounting information to evaluate the performance of the managers because incompany type of organisation management of business is vested in the hands ofpaid managers.
9
Accounting:An Overview
ii) Prospective Investors : The persons who are interested in buying shares of acompany or who want to advance money to the company, would like to knowhow safe and rewarding the investments already made or proposed investmentswould be.
iii) Lenders : Initially the required funds of the business are provided by the owners.When business is going on, it requires more funds. These funds are usuallyprovided by banks and other money lenders. Before lending money they wouldlike to know about the solvency of the enterprise so as to satisfy themselves thattheir money will be safe and repayments will be made on time.
iv) Creditors : The creditors are those who supply goods and services on credit.These creditors like other money lenders are also interested to know the creditworthiness of the business. The accounting information greatly helps them inassessing the ability of the enterprise to what extent credit can be granted.
v) Managers : Accounting information is very much useful to managers. It helpsthem to plan, control and evaluate all business activities. They also need suchinformation for making various decisions relating to the business.
vi) Government : The Government may be interested in accounting information of abusiness on account of taxation, labour and corporate laws. The financialstatements are of great importance for assessing the tax liability of the enterprise.
vii) Employees : The employees of the enterprise are also interested in knowing thestate of affairs of the organisation in which they are working, so as to know howsafe their interests are in the organisation. The knowledge of accountinginformation helps them in conducting negotiations with the management.
viii) Researchers : The accounting information is of immense value to theresearchers undertaking research in accounting theory and practices.
ix) Citizen : An ordinary citizen as a voter and tax payer may be interested to knowthe accounting information to measure the performance of Government Companyor a public utility concern like banks, gas, transport, electricity companies etc.
1.5 ACCOUNTING AS PART OF THE INFORMATIONSYSTEM
Accounting is part of an organisation’s information system, which includes bothfinancial and non-financial data. Accounting is the process of identifying, measuringand communicating economic information to permit judgment and decisions by usersof the information. The main objective of accounting is to provide information to theusers. Accounting is also required to serve some broad social obligations since theaccounting information is used by a large body of people such as customers,employees, investors, creditors and government.Accounting is commonly divided into (1) Financial Accounting, and (2) ManagerialAccounting. Financial accounting refers to the preparation of general purpose reportsfor use by persons outside an organisation. Such users include shareholders,creditors, financial analysts, labour unions, government regulations etc. Externalusers are interested primarily in reviewing and evaluating the operations and financialstatus of the business as a whole.Managerial accounting, on the other hand, refers to providing of information tomanagers inside the organisation. For example a production manager may want areport on the number of units of product manufactured by various workers in order toevaluate their performance. A sales manager might want a report showing therelative profitability of two products in order to pinpoint selling efforts. The financialreports are available from the libraries or companies themselves where as managerial
1 0
Fundamentals ofAccounting
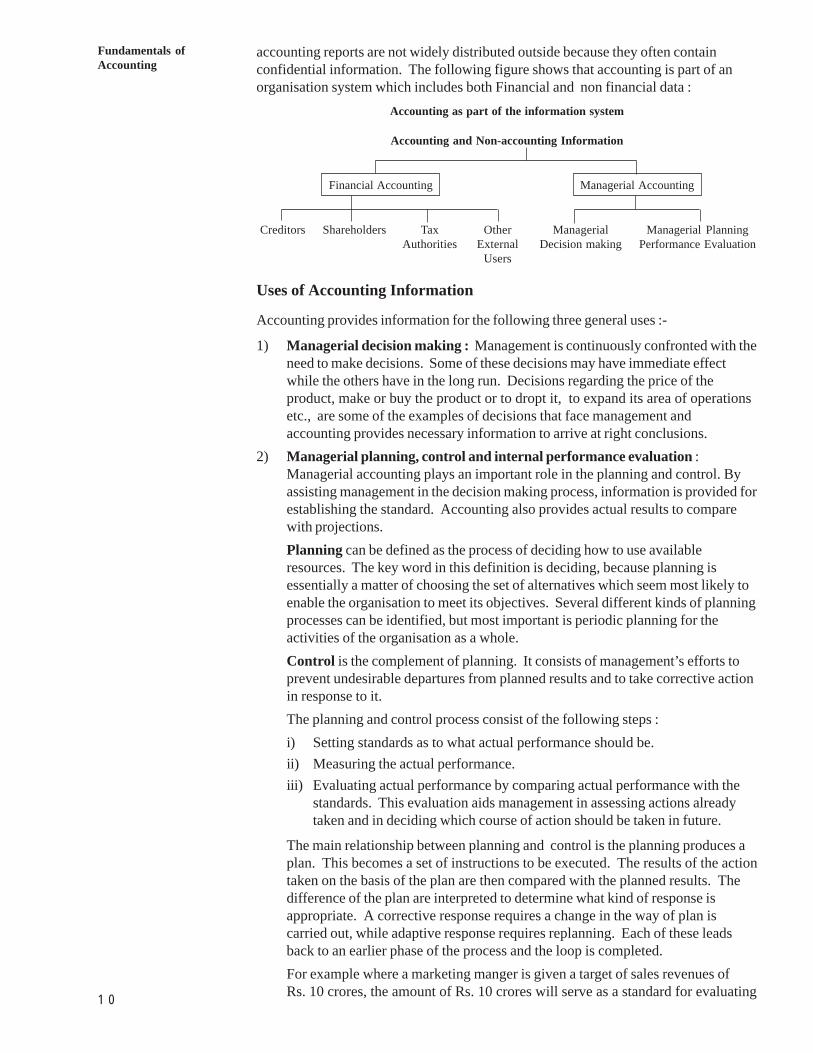
accounting reports are not widely distributed outside because they often containconfidential information. The following figure shows that accounting is part of anorganisation system which includes both Financial and non financial data :
Accounting as part of the information system
Accounting and Non-accounting Information
Financial Accounting Managerial Accounting
Creditors Shareholders Tax Other Managerial Managerial PlanningAuthorities External Decision making Performance Evaluation
Users
Uses of Accounting Information
Accounting provides information for the following three general uses :-
1) Managerial decision making : Management is continuously confronted with theneed to make decisions. Some of these decisions may have immediate effectwhile the others have in the long run. Decisions regarding the price of theproduct, make or buy the product or to dropt it, to expand its area of operationsetc., are some of the examples of decisions that face management andaccounting provides necessary information to arrive at right conclusions.
2) Managerial planning, control and internal performance evaluation :Managerial accounting plays an important role in the planning and control. Byassisting management in the decision making process, information is provided forestablishing the standard. Accounting also provides actual results to comparewith projections.Planning can be defined as the process of deciding how to use availableresources. The key word in this definition is deciding, because planning isessentially a matter of choosing the set of alternatives which seem most likely toenable the organisation to meet its objectives. Several different kinds of planningprocesses can be identified, but most important is periodic planning for theactivities of the organisation as a whole.Control is the complement of planning. It consists of management’s efforts toprevent undesirable departures from planned results and to take corrective actionin response to it.The planning and control process consist of the following steps :i) Setting standards as to what actual performance should be.ii) Measuring the actual performance.iii) Evaluating actual performance by comparing actual performance with the
standards. This evaluation aids management in assessing actions alreadytaken and in deciding which course of action should be taken in future.
The main relationship between planning and control is the planning produces aplan. This becomes a set of instructions to be executed. The results of the actiontaken on the basis of the plan are then compared with the planned results. Thedifference of the plan are interpreted to determine what kind of response isappropriate. A corrective response requires a change in the way of plan iscarried out, while adaptive response requires replanning. Each of these leadsback to an earlier phase of the process and the loop is completed.For example where a marketing manger is given a target of sales revenues ofRs. 10 crores, the amount of Rs. 10 crores will serve as a standard for evaluating
1 1
Accounting:An Overview
the performance of the marketing manager. If annual sales revenues varysignificantly from Rs. 10 crores, steps will be taken to ascertain the causes forthe difference. When the factors leading to the variance are not under the controlof the marketing manager, then the marketing manager would not be heldresponsible for it. On the other hand the cause for variance is under the controlof marketing manager then he will be held responsible in evaluating theperformance of marketing manager.
3) External Financial reporting and performance evaluation : Accounting hasalways been used to supply information to those who are interested in the affairsof the company. Various laws have been passed under which financialstatements should be prepared in such way that required information is suppliedto shareholders, creditors, government etc. For example, the investors may beinterested in the financial strength of the business, creditors may requireinformation about the liquidity position, government may be interested to collectdetails about sales, profit, investment, liquidity, dividend policy, prices etc. indeciding social and economic policies. Information is required in accordancewith generally accepted accounting principles so that it is useful in takingimportant decisions.
1.6 BRANCHES OF ACCOUNTINGTo meet the requirements of different people interested in accounting information,accounting can be broadly classified into three categories :
1) Financial Accounting,2) Cost Accounting, and3) Management Accounting
1.6.1 Financial AccountingThe American Institute of Certified Public Accountants has defined FinancialAccounting as “the art of recording, classifying and summarizing in a significantmanner in terms of money transactions and events which are in part at least of afinancial character, and interpreting the results thereof”. Accounting is the languageeffectively employed to communicate the financial information of a business unit ofvarious parities interested in its progress.
The object of financial accounting is to find out the profitability and to provideinformation about the financial position of the concern. Two important statements offinancial accounting are Income and Expenditure Statement and Balance Sheet.All revenue transactions relating to a particular period are recorded in this statementto decide the profitability of the concern. The balance sheet is prepared at a particulardate to determine the financial position of the concern.
Functions of Financial AccountingFinancial accounting provides information regarding the status of the business andresults of its operations to management as well as to external parties. The followingare some of the important functions of financial accounting :
a) Recording of InformationIn business, it is not possible to keep in memory all the transactions. Thesetransactions need to be systematically recorded and pass through the journals,ledgers and worksheets before they could take the form of final accounts. Onlythose transactions are recorded which are measurable in terms of money. Thetransactions which cannot be expressed in monetary terms does not form part offinancial accounting even though such transactions have a significant bearing onthe working of a business.
1 2
Fundamentals ofAccounting
b) Managerial Decision MakingFinancial accounting is greatly helpful for managers in taking decisions.Without accounting, the managerial functions and decision making programmesmay mislead. The performance of daily activities are to be compared with thepredetermined standards. The variations of actual operations and their analysisare possible only with the help of financial accounting.
c) Interpreting Financial InformationInterpretation of financial information is very important for decision making.The recorded financial data is interpreted in such a manner that the end userssuch as creditors, investors, bankers etc., can make a meaningful judgment aboutthe financial position and profitability of the business operations.
d) Communicating ResultsFinancial accounting is not only concerned with the recording of facts andfigures but it is also connected with the communication of results. In factaccounting is the source of business operation. Therefore, the informationaccumulated and measured should be periodically communicated to the users.The information is communicated through statements and reports. The financialstatements and reports should be reliable and accurate. A variety of reports areneeded for internal management depending upon its requirement. Incommunicating reports to outsiders, standard criteria of full disclosure,materiality, consistency and fairness should be adhered to.
Limitations of Financial AccountingFinancial accounting was able to cope up with the needs of business in the initialstages when business was not so complex. This is because financial accounting ismainly concerned with the preparation of final accounts, i.e., profit and loss accountand balance sheet. But the growth and complexities of modern business have madefinancial accounting highly inadequate. The management needs information forplanning, controlling and coordinating business activities.
The limitations of financial accounting are as follows :
1) Historic nature : Financial accounting is the record of all those transactionswhich have taken place in the business during a particular period. Asmanagement’s decisions relates to future course of action, they are made on thebasis of estimates and projections. Financial accounting provides informationabout the past data and not about the future. It does not suggest the measuresabout what should be done to improve efficiency of the business. Past data areneeded for making future decisions but that does not alone sufficient.
2) It records only actual costs : Financial accounting has always been concernedwith figures treating them as single, simple and silent items because it recordsonly actual cost figures. The price of goods and assets changes frequently. Thecurrent prices may be different from recorded costs. Financial accounts do notrecord these price fluctuations. Therefore, the recorded information may not givecorrect information.
3) It provides quantitative information : Financial accounting considers onlythose factors which are quantitatively expressed. Anything which cannot bemeasured quantitatively will not constitute a part of financial accounting. Todaybusiness decisions are influenced by a number of social considerations.Governments polices have a direct bearing on the working of business.Therefore, in addition to social consideration the management has also to takeinto account, the impact of government policies on the business. But thesefactors cannot be measured quantitatively so their impact will not reflect infinancial statement.
1 3
Accounting:An Overview
4) It provides information about the whole concern : Financial accountingprovides information about the concern as a whole. It discloses only net resultsof the collective activities of a business. Detailed information regarding product-wise, process-wise, department wise, etc. is not recorded in financial accounts.Thus, product wise or job wise cost of production cannot be determined. It isessential to record the transactions activity wise for cost determination and costcontrol purpose.
5) Difficulty in price fixation : The cost of the product can be obtained only whenall expenses have been incurred. It is not possible to determine the prices inadvance. Price fixation requires detailed information about variable and fixedcosts, direct and indirect costs. Financial accounting cannot supply suchinformation and therefore, it is difficult to quote the prices during the periods ofinflation or depression in trade.
6) Appraisal of policies is not possible : Financial accounting do not provide datafor evaluation of business policies and plans. There is no technique forcomparing actual performance with the budgeted targets. Financial accountingdo not provide any measure to judge the efficiency of a business. The onlycriteria for determining efficiency is the profit at the end of financial period.Therefore, the only yardstick for measuring the managerial performance is profitand loss account which is not a reliable test for ascertaining efficiency of themanagement.
7) It is not helpful in Decision Making : Financial accounting do not help themanagement in taking strategic decisions because they do not provide adequateinformation to compare the probable effect of alternative courses of action suchas replacement of labour by machinery, introduction of new product line,expansion of capacity etc. The impact of these decisions and cost involved is tobe ascertained in advance. Due to historic nature of accounting data availablefrom financial accounts, it is not of much helpful to the management.
8) Lack of uniformity in accounting principles : Accounting policies differ onthe use of accounting principles. There is lack of unanimity on the use ofaccounting principles and procedures. The financial statements prepared by twodifferent persons of the same concern gives different results due to varyingpersonal judgment in applying a particular convention. The methods of valuinginventory, methods of depreciation, allocation of expenses between revenue andcapital etc. are the most controversial issues on which unanimity is not possible.The use of different accounting methods reduces the usefulness and reliability offinancial accounting.
9) It is not possible to control costs : Another limitation of financial accounting isthat the cost figures are known only at the end of financial period. When the costhas already been incurred then nothing can be done to control the cost. Aconstant review of actual costs from time to time is required for cost control andthis is not possible in financial accounting.
10) Possibility of manipulation of accounts : The over and under valuation ofinventory may affect the profit figures. The profit may be shown more or less toget more remuneration, to pay more dividend or to raise the share prices, or tosave taxes or not to pay bonus to workers, etc. The possibility of manipulatingfinancial accounts reduces their reliability.
11) Technological revolution : With the advancement in science and technology veryminute and detailed break-up of all types of data relating to various parts of abusiness unit have become a must for the management of its day to dayfunctioning. It is clear that financial accounting with its simple structure is notin a position to cater the needs of the management because it supplies onlyelementary information.
1 4
Fundamentals ofAccounting
The limitations of financial accounting have given scope for the development ofCosting and Management accounting.
1.6.2 Cost Accounting
Cost accounting is one of the important elements of accounting information about theproblems of internal managerial control. Financial accounts are unable to meetinformation needs about the cost structure of a product. The need for costdetermination and controls necessitated new set of principles of accounting and thusemerged ‘Cost accounting’ as a specialised branch of accounting. Cost accounting isthe process of accounting for costs. It includes the accounting procedures relating torecording of all income and expenditure and preparation of periodical statements andreport with the object of ascertaining and controlling costs. Such cost accounting is agood technique for ascertaining profitability and for decision making. The Institute ofCost and Management, London defines cost accounting as “the application of costingand costing principles, methods and techniques to the science, art and practice of costcontrol and ascertainment of profitability. It includes presentation of informationderived therefrom for the purpose of managerial decision making.”
Functions of Cost Accounting
The main functions of cost accounting can be briefed as follows :
a) Cost accounting enables the management to ascertain the cost of product, job,contract, service or unit of production.
b) It helps in price fixation or quotation.c) It provides information for the preparation of estimates and tenders.d) It helps in minimizing the cost of manufacture.e) It helps in determining profitability of each product, process, department etc.f) It is a useful tool for managerial control and helps in cost reduction and cost
control.g) It increases efficiency and reduces wastages and costs.h) It provides cost data for comparison in different periods.
Limitations of Cost Accounting
Cost accounting lacks a uniform procedure. It is developed through theories andaccounting practices based on reasoning and common sense. There is no commonsystem of cost accounting applicable to all industries. A limitation of cost accountingis its emphasis on cost data and largely based on estimates. Hence, it is consideredvery narrow in its perspective as it fails to consider the revenue aspect in detail.Moreover, cost accounting can be used only in big organisations.
1.6.3 Management Accounting
Cost accounting helps the internal management by directing their attention oninefficient operations and assisting in a day-to-day control of business activities.The costing data needs to be arranged, re-analysed and processed further for effectiverole in managerial process. In addition to costing and accounting data, managerialfunctions need the use of socio-economic and statistical data (e.g., populationbreak-ups, income structure, etc.). Cost and financial accounting do not provide suchinformation and this limitation pave the way for the emergence of managementaccounting. Management accounting is a systematic approach to planning and controlfunctions of management. It generates information for establishing plans and
1 5
Accounting:An Overview
controls. It provides for a system of setting standards, plans, or targets and reportingvariances between planned and actual performances for corrective actions. Thus,Management accounting consists of cost accounting, budgetory control, inventorycontrol, statistical methods, internal auditing and reporting. It also covers financialaccounting.
Management accounting is the process of identification, measurement, accumulation,analysis, preparation, interpretation and accumulation of financial information usedby management to plan, evaluate, and control within an organisation and to assureappropriate use of and accountability for its resources. Management accounting alsocomprises the preparation of financial reports for management groups such asshareholders, creditors, regulator agencies and tax authorities.Thus it is theapplication of professional information to assist the management in the formation ofpolicies and in planning and control of the operations of the business enterprise.
Thus Management accounting helps an organisation to accomplish its goals in thefollowing ways :
1) It provides a way to communicate expectations to managers throughout theorganisation.
2) It provides feedback which enables a manager to monitor the day to dayoperations of the company for which he is responsible. If actuals differsignificantly from targeted results, the manager is alerted, can look for causes fordeviation and can take corrective actions.
3) It provides a set of prescribed tools and techniques for use in decision making.
Limitations of Management Accounting
Though Management Accounting is a useful tool for planning, directing andcontrolling functions still it suffers from the following limitations :
1) Based on Cost and Financial Information: Management accounting derivesinformation from financial and cost accounting and other records. Theaccounting statements and records suffer from certain limitations as they areprepared on the basis of certain accounting concepts and conventions. Thecorrectness and effectiveness of managerial decisions will depend upon thequality of data on which these decisions are based. If financial data is notreliable then management accounting will not provide correct analysis. Thelimitations of financial statements and records may be transmitted to themanagement accounting system. This may limit its effectiveness and make theinformation a substandard one.
2) Persistence of Intuitive Decision Making: Management accounting providesfacts and figures of various situations and assists management in takingdecisions scientifically. It includes decision tools such as marginal costing,differential costing and OR techniques like linear programming, decision theory,etc. Despite the facilities provided, the management mostly resorts to simplemethods of decision making by intuition. Intuitive decisions limit the usefulnessof management accounting.
3) It has a very Wide Scope: For taking decision, management requiresinformation from both accounting as well as non-accounting sources and alsoquantitative as well as qualitative information. This creates many problems andbrings a degree of inexactness and subjectivity in the conclusions obtainedthrough it .
4) Lack of Knowledge: The use of Management accounting requires theknowledge of a number of related subjects. Lack of knowledge in the relatedsubjects limits the use of management accounting
1 6
Fundamentals ofAccounting
5) It is very Costly System: The installation of Management accounting systemneeds a very elaborate organisational system. A large number of rules andregulations are also required to make this system workable and effective. Thisresults in heavy investment which only big concerns can afford.
6) Scope for Personal Bias: The interpretation of financial information dependsupon the capability of interpreter as one has to make a personal judgment. Thereis every possibility of personal bias in analysis and interpretation. Personal biaswill affect the quality of decision making.
7) It invites Resistance within the Organisation: The installation of managementaccounting needs a radical change in the accounting organisation. New rules andregulations are also to be framed. It demands rearrangement of personnel andtheir activities. This will affect a number of personnel and therefore, there is apossibility of resistance by some of the people of the organisation concerned.
Check Your Progress A1. What is Accounting ?
...............………………..………………………………………………………..
...............………………..………………………………………………………..
...............………………..………………………………………………………..
2. List out various Accounting activities in an organisation................………………..………………………………………………………..
...............………………..………………………………………………………..
...............………………..………………………………………………………..
3. What are the limitations of Accounting ?...............………………..………………………………………………………..
...............………………..………………………………………………………..
...............………………..………………………………………………………..
4. Name the parties interested in accounting information................………………..………………………………………………………..
...............………………..………………………………………………………..
...............………………..………………………………………………………..
5. What is the main purpose of Financial Accounting and Management Accounting ?...............………………..………………………………………………………..
...............………………..………………………………………………………..
...............………………..………………………………………………………..
6. State whether each of the following statements is True or False :
i) Accounting is concerned only with the recording of transactions.ii) Accounting is the language of the business.iii) Accounting records both financial and non financial transactions.iv) Management accounting provide necessary information to outsiders only.v) Cost accounting helps in ascertaining and controlling costs.vi) The main objective of financial accounting is to ascertain the operating
results and financial position of a concern.vii) Management accounting provides decision to the management.
1 7
Accounting:An Overview1.7 ROLE OF MANAGEMENT ACCOUNTANT
The term Management Accountant has been applied to any one who performsaccounting work within a firm and it encompasses persons performing activities whichrange from :
i) Posting customers’ receivable accounts,ii) Doing financial analysis for decision making, andiii) Making high-level decisions in a large scale organisation.
There is no particular academic or professional accomplishments have been associatedwith the term. He plays a significant role in the decision making process of anorganisation. The positional status of management accountant in an organisationvaries from concern to concern depending upon the pattern of management system inthe concern. He plays a significant role in the decision making process of theorganisation heading the accounting department. In large organizations he is knownas Financial Controller, Financial Advisor, Chief Accounts officer etc. He isresponsible for installation, development and efficient functioning of the managementaccounting system. He plays an important role in collecting, compiling, reporting andinterpreting internal accounting information. He prepares the financial and costcontrol reports to satisfy the requirements of different levels of management. Hecomputes variances by comparing the actuals with the standards and interprets theresults of operations to different levels of the organisation and to the owners of thebusiness.
Thus, the management accountant occupies an important position in the organization.He performs a staff function and also has line authority over the accountants. If heparticipates in planning and execution of policies, he is equal to other functionalmanagers. In most of the organisations, management accountant performs stafffunctions. He supplies information and gives his views about the data and leaves thefinal decision making to functional heads. If management accountant provides thefacts accurately and are presented in a manner which allows proper analysis andinterpretation then he cannot be held responsible for any wrong judgment by themanagement. On the other hand, if the information provided by the managementaccountant is biased, inaccurate and is not presented properly then he is responsible tothe management for wrong decision making.
Functions of Management AccountantThe functions of the Management Accountant depends upon the position he occupiesin the organisation and requirements of the organisation. The functions of thecontroller, by whatever name he is called, have been laid down by the controllers’Institute of America which are as follows :
1) Planning and Control : Management accountant establishes, coordinates andmaintains an integrated plan for the control of operations. Such a plan wouldprovide, to the extent required in the business cost standards, profit planning,programmes for capital investing and for financing, sales forecast and theexpense budgets, together with necessary procedures to effectuate the plan.
2) Reporting and Interpreting : Management accountant measures theperformance against given plans and standards. The results of the operations areinterpreted to all levels of management and to the owners of the business. Thisalso includes installation of accounting and costing system and recording ofactual performance to find out deviation, if any.
3) Evaluation of Policies and Programmes : He is responsible to evaluate variouspolicies and programmes. The effectiveness of policies, programmes and
1 8
Fundamentals ofAccounting
organisation structure to attain the objectives of the organisation to a large extentdepends upon the caliber of the management accountant.
4) Tax administration : It is also the function of management accountant to reportto the government as required under different laws in force and to establish andadminister tax policies and procedures. He has also to supervise and coordinatepreparation of reports to government agencies.
5) Protection of assets : The management accountant has to assure fiscalprotection for the assets of the business through adequate internal control andproper insurance coverage.
6) Appraisal of External Effects : He has to assess continuously the effect ofvarious economic and social forces and government policies and interpret theireffect upon the business towards the attainment of common goals.The functions as stated above can also prove to be useful under the Indiancontext. Some of the above functions, in India are performed by CompanySecretary, top level management, statistical department etc.
1.8 FINANCIAL ACCOUNTING PROCESSAccounting may be defined as the process of recording, classifying, summarizing,analysing, and interpreting the financial transactions and communicating the resultsthereof to the persons interested in such information.
Thus the accounting process consists of the following five stages :
1) Recording the Transactions,2) Classifying the Transactions,3) Summarizing the Transactions, and4) Interpreting the Tesults.
Let us discuss briefly these stages:
1) Recording the Transactions : The accounting process begins with the basicfunction of recording all the transactions in the book of original entry. This bookis called ‘Journal’. The journal is a daily record of business transactions. Allbusiness transactions of financial character are recorded in the journal in achronological order (date wise) with the help of various vouchers such as cashmemos, cash receipts, invoices, etc. The process of recording a transaction inthe journal is called journalising. The journal may be further sub-divided intovarious subsidiary books such as cash journal for recording cash transactions,Purchase Journal for recording purchase of goods, Sales Journal for recodingsale of goods, etc. The number of subsidiary books to be maintained will dependupon the nature and size of the business.
2) Classifying the Transactions : The journal is just a chronological record of allbusiness transactions and it does not provide all information regarding aparticular item at one place. To overcome this difficulty we maintain anotherbook called ‘Ledger’. It consists of systematic analysis of the recorded data witha view to group the transactions of similar nature and posting them to theconcerned accounts. It contains different pages of individual account headsunder which all financial transactions of similar nature are collected. Forexample, all transactions related to cash are posted to cash account andtransactions related to different persons are entered separately in the account ofeach person. The objective of classifying the transaction in this manner is toascertain the combined effect of all transactions of a given period in respect ofeach account. For this purpose all accounts are balanced periodically.
1 9
Accounting:An Overview
3) Summarising the Transactions : The third step is presenting the classified datain a manner which is understandable and useful to the internal as well as externalend users of accounting information. This can be done through the preparationof a year end summary known as ‘Final Accounts’. Before proceeding to finalaccounts one has to prepare a statement called ‘Trial Balance’ in order to checkthe arithmetical accuracy of the books of accounts. If the Trial Balance tallies,more or less it means that the transactions have been accurately recorded andposted into the ledgers. Then with the help of the Trial Balance and some otheradditional information, final accounts are prepared. The objective of preparingfinal accounts are :i) To know the net operating results of the business, andii) To ascertain the financial position of the business at a particular date.The operating results of the business can be ascertained by preparing an incomestatement called Trading and Profit and Loss Account and financial position ofthe business can be known by preparing a position statement called ‘BalanceSheet’. The Trading and Profit and Loss account gives information about theprofit or loss made during the year and the Balance Sheet shows the position ofassets and liabilities of the business at a particular time.
4) Interpreting the Results : The final stage of accounting is analysing andinterpreting the results shown by the final accounts. The recorded financial datais analysed and interpreted in a manner that the end users can make ameaningful judgement about the financial position and profitability of thebusiness operations. This involves computation of various accounting ratios toassess the liquidity, solvency and profitability of the business. The balance onvarious accounts appearing in the Balance Sheet will then be transferred to thenew books of account for the next year. Thereafter the process of recordingtransactions for the next year starts again.
The accounting information after being meaningfully analysed and interpreted has tobe communicated in the proper form and manner to the proper person. This is donethrough preparation and distribution of accounting reports which includes besides thefinal accounts, in the form of ratios, graphs, diagrams, funds flow statements, etc.
1.9 ACCOUNTING EQUATIONThe recording of transactions in the books of accounts is based on accountingequation. Each transaction has double effect on the financial profit of a concern.Accounting equation is a formula expressing equivalence of the two expressions ofassets and liabilities. Thus, the total claims will equal to the total assets of the firm.The total claims may be to outsiders and the proprietor. In the beginning the owner ofthe firm provides funds to the business in the form of ‘capital’ which is also known as‘owners equity’. Initially the capital contributed by the owner to the business will bein the form of cash and this cash is treated as an asset of the firm. At the same time aliability will be created in the form of owners’ equity according to business entityconcept (i.e., business and the owner are two separate entities). Thus, the asset is(cash) balanced against liability (capital).The accounting equation can thus be expressed as follows :
Cash (Asset) = Capital (Liabilities)Total Assets = Total Liabilities (Capital + Liabilities)
ORFixed Assets + Current Assets = Internal Liabilities + External Liabilities
Capital = Assets – LiabilitiesOR
Liabilities = Assets – Capital
2 0
Fundamentals ofAccounting
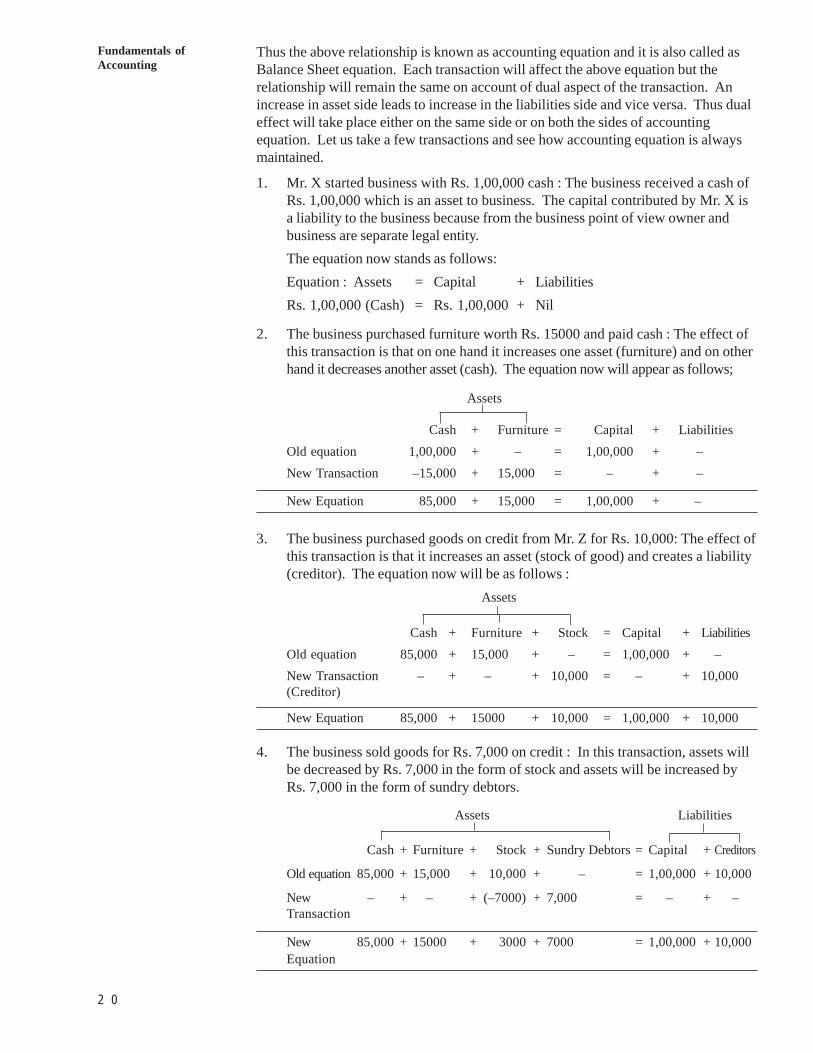
Thus the above relationship is known as accounting equation and it is also called asBalance Sheet equation. Each transaction will affect the above equation but therelationship will remain the same on account of dual aspect of the transaction. Anincrease in asset side leads to increase in the liabilities side and vice versa. Thus dualeffect will take place either on the same side or on both the sides of accountingequation. Let us take a few transactions and see how accounting equation is alwaysmaintained.
1. Mr. X started business with Rs. 1,00,000 cash : The business received a cash ofRs. 1,00,000 which is an asset to business. The capital contributed by Mr. X isa liability to the business because from the business point of view owner andbusiness are separate legal entity.The equation now stands as follows:Equation : Assets = Capital + LiabilitiesRs. 1,00,000 (Cash) = Rs. 1,00,000 + Nil
2. The business purchased furniture worth Rs. 15000 and paid cash : The effect ofthis transaction is that on one hand it increases one asset (furniture) and on otherhand it decreases another asset (cash). The equation now will appear as follows;
Assets
Cash + Furniture = Capital + LiabilitiesOld equation 1,00,000 + – = 1,00,000 + –New Transaction –15,000 + 15,000 = – + –
New Equation 85,000 + 15,000 = 1,00,000 + –
3. The business purchased goods on credit from Mr. Z for Rs. 10,000: The effect ofthis transaction is that it increases an asset (stock of good) and creates a liability(creditor). The equation now will be as follows :
Assets
Cash + Furniture + Stock = Capital + LiabilitiesOld equation 85,000 + 15,000 + – = 1,00,000 + –New Transaction – + – + 10,000 = – + 10,000(Creditor)
New Equation 85,000 + 15000 + 10,000 = 1,00,000 + 10,000
4. The business sold goods for Rs. 7,000 on credit : In this transaction, assets willbe decreased by Rs. 7,000 in the form of stock and assets will be increased byRs. 7,000 in the form of sundry debtors.
Assets Liabilities
Cash + Furniture + Stock + Sundry Debtors = Capital + Creditors
Old equation 85,000 + 15,000 + 10,000 + – = 1,00,000 + 10,000
New – + – + (–7000) + 7,000 = – + –Transaction
New 85,000 + 15000 + 3000 + 7000 = 1,00,000 + 10,000Equation
2 1
Accounting:An Overview
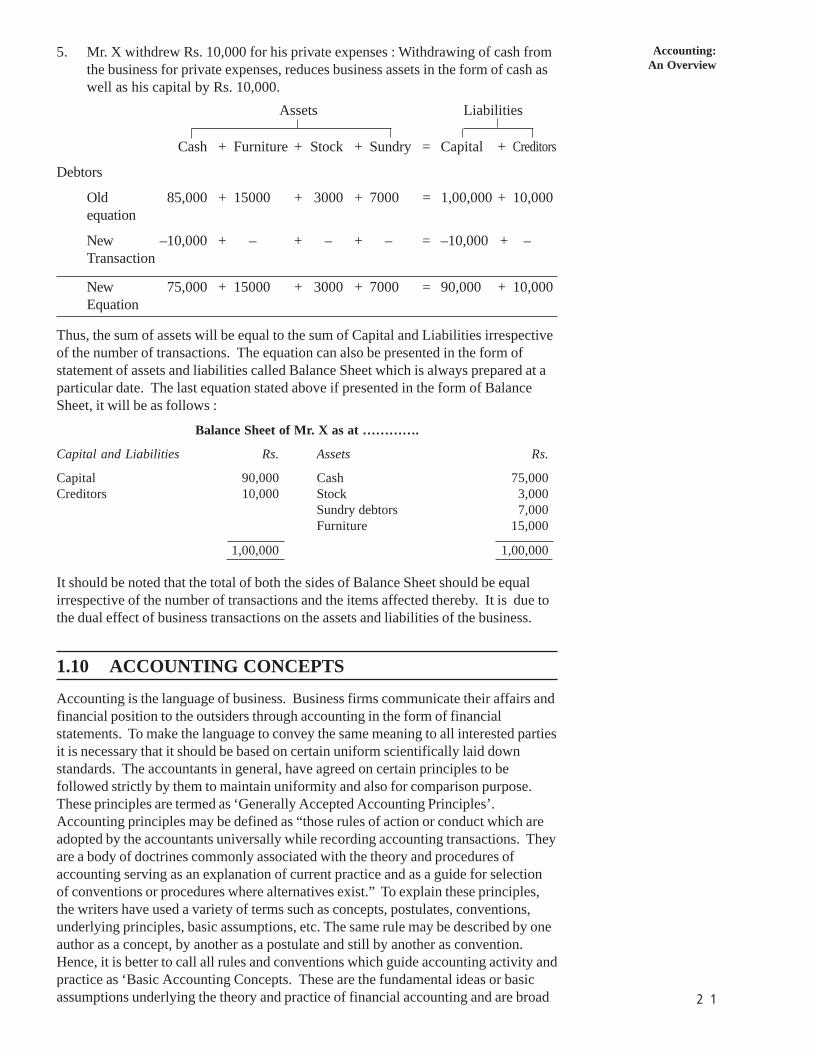
5. Mr. X withdrew Rs. 10,000 for his private expenses : Withdrawing of cash fromthe business for private expenses, reduces business assets in the form of cash aswell as his capital by Rs. 10,000.
Assets Liabilities
Cash + Furniture + Stock + Sundry = Capital + Creditors
Debtors
Old 85,000 + 15000 + 3000 + 7000 = 1,00,000 + 10,000equation
New –10,000 + – + – + – = –10,000 + –Transaction
New 75,000 + 15000 + 3000 + 7000 = 90,000 + 10,000Equation
Thus, the sum of assets will be equal to the sum of Capital and Liabilities irrespectiveof the number of transactions. The equation can also be presented in the form ofstatement of assets and liabilities called Balance Sheet which is always prepared at aparticular date. The last equation stated above if presented in the form of BalanceSheet, it will be as follows :
Balance Sheet of Mr. X as at ………….
Capital and Liabilities Rs. Assets Rs.
Capital 90,000 Cash 75,000Creditors 10,000 Stock 3,000
Sundry debtors 7,000Furniture 15,000
1,00,000 1,00,000
It should be noted that the total of both the sides of Balance Sheet should be equalirrespective of the number of transactions and the items affected thereby. It is due tothe dual effect of business transactions on the assets and liabilities of the business.
1.10 ACCOUNTING CONCEPTSAccounting is the language of business. Business firms communicate their affairs andfinancial position to the outsiders through accounting in the form of financialstatements. To make the language to convey the same meaning to all interested partiesit is necessary that it should be based on certain uniform scientifically laid downstandards. The accountants in general, have agreed on certain principles to befollowed strictly by them to maintain uniformity and also for comparison purpose.These principles are termed as ‘Generally Accepted Accounting Principles’.Accounting principles may be defined as “those rules of action or conduct which areadopted by the accountants universally while recording accounting transactions. Theyare a body of doctrines commonly associated with the theory and procedures ofaccounting serving as an explanation of current practice and as a guide for selectionof conventions or procedures where alternatives exist.” To explain these principles,the writers have used a variety of terms such as concepts, postulates, conventions,underlying principles, basic assumptions, etc. The same rule may be described by oneauthor as a concept, by another as a postulate and still by another as convention.Hence, it is better to call all rules and conventions which guide accounting activity andpractice as ‘Basic Accounting Concepts. These are the fundamental ideas or basicassumptions underlying the theory and practice of financial accounting and are broad
2 2
Fundamentals ofAccounting
working rules for all accounting activities developed and accepted by the accountingprofession. It brings about uniformity in the practice of accounting.
These concepts can be classified into two broad groups which are as follows :
1) Concepts to be observed at the recording stage i.e., while recording thetransactions, and
2) Concepts to be observed at the reporting stage i.e., at the time of preparing finalaccounts.
It must however be remembered that some of them are overlapping and evencontradictory.
1.10.1 Concepts to be Observed at the Recording Stage
The concept which guide us in identifying, measuring and recording the transactionsare :
1) Business Entity Concept2) Money Measurement Concept3) Objective Evidence Concept4) Historical Record Concept5) Cost Concept6) Dual Aspect Concept
Let us explain them one by one and learn the accounting implications of eachconcept.
1) Business Entity Concept
According to this concept business is treated as a separate entity from its owners. Alltransactions of the business are recorded in the books of the firm. Businesstransactions and business property are different from personal transactions andpersonal property. If business affairs are mixed with private affairs, the true pictureof the business is not available. The owner of the firm is treated as a creditor to theextent of his capital. From the accounting point of view the owner is different and thebusiness is different. Therefore, under this concept the capital contributed by theowner of the firm is the liability to the firm and the owner is regarded as the creditorof the firm. However, personal expenditure of the owner is met from business funds itshall be recorded in the business books as drawings by the owner and not as businessexpenditure.
The business entity concept is applicable to all form of business organisation. Thisdistinction can be easily maintained in the case of a limited company because thecompany has a separate legal entity of its own. But such distinction becomes difficultin case of a sole proprietorship or partnership, because in the eyes of law soleproprietor or partners are not considered separate entities. They are personally liablefor all business transactions. But for accounting purpose they are treated as separateentities. This enables them to ascertain the profit or loss of the business moreconveniently and accurately.
2) Money Measurement Concept
Usually business deals in a variety of items having different physical units such askilograms, quintals, tons, metres, liters, etc. If the sales and purchase of differentitems are recorded in the physical terms, it will pose problems. But if these arerecorded in common denomination their total become homogeneous and meaningful.Therefore, we need a common unit of measurement. Money does this function. It isadopted a common measuring unit for the purpose of accounting. All recording,
2 3
Accounting:An Overview
therefore, is done in terms of the standard currency of the country where business isset up. For example, in India, it is done in terms of Rupees. In USA it is done interms of US dollars and so on.
Another implication of money measurement concept is that only those transactionsand events are recorded in the books of accounts which can be expressed in terms ofmoney such as purchases, sales, salaries etc. Other happenings (non-monetary) likelabour management relations, sales policy, labour unrest, effectiveness of competition,a team of dedicated and trusted employees etc., which are vital importance to thebusiness concern do not find place in accounting. This is because their effect is notmeasurable and quantifiable in terms of money.
Another limitation of this concept is that it is based on the assumption that the moneyvalue is constant which is not true. The value of money changes over a period oftime. The value of rupee today is much less than what it was in 1971. This is due toa fall in money value. Thus this concept ignores the qualitative aspect of things andthe impact of inflationary changes is not adjustable in this principle. That is whyaccounting data does not reflect the true and fair view of the affairs of business.
Now-a-days it is considered desirable to provide additional data showing the effect ofchanges in the price level on the reported income and the assets and liabilities of thebusiness.
3) Objective Evidence Concept
The term objectivity refers to being free from bias or free from subjectivity.Accounting measurements are to be unbiased and verifiable independently. For thispurpose all accounting transactions should be evidenced and supported by documentssuch as invoices, receipts, cash memos etc. These supporting documents (Vouchers)form the basis for making entries in the books of account and for their verification byauditors. As per the items like depreciation and the provision for doubtful debtswhere no documentary evidence is available, the policy statements made by themanagement are treated as the necessary evidence.
4) Historical Record Concept
Recording the transactions in the books of account will be done only after identifyingthe transactions and measuring them in terms of money. According to the historicrecord concept we record only those transactions which have actually taken place inthe business during a particular period of time and not those transactions which maytake place in future. It is because accounting record presupposes that the transactionsare to be identified and objectively evidenced. This is possible only in the case of past(actually happened) transactions. The future transactions can hardly be identified andmeasured accurately. You also know that all transactions are to be recorded inchronological (date wise) order. This leads to the preparation of a historical record ofall transactions. It also implies that we simply record the facts and nothing else.
One limitation of this concept is that the impact of future uncertainties has no place inaccounting. Management needs information for future planning not only of the pastbut also for future. You know that we will also make a provision for some expectedlosses such as doubtful debts at the time of ascertaining profit or loss of the businesswhich is contrary to the historic record concept. But it is not a routine item. This isdone in accordance with another concept called conservation concept which you willstudy later.
5) Cost Concept
The price paid (or agreed to be paid in case of a credit transaction) at the time ofpurchase is called cost. Under this concept fixed assets are recorded in the books of
2 4
Fundamentals ofAccounting
account at the price at which they are acquired. This cost is the basis for allsubsequent accounting for the asset. For example, when an asset is acquired forRs. 1,00,000, it is recorded in the books of account at Rs. 1,00,000 even though themarket value may be different later. But the asset is shown in the books at cost price.
You know that with passage of time the value of an asset decreases. Hence, it maysystematically be reduced from year to year by charging depreciation and the assets beshown in the balance sheet at the depreciated value. The depreciation is usuallycharged at a fixed percentage on cost. It bears no relationship with the changes in itsmarket value. This makes it difficult to assess the true financial position of theconcern and it is, therefore, considered an important limitation of the cost concept.
Another limitation of the cost concept is that if the business pays nothing for an item itacquired, then this will not appear in the accounting records as an asset. Thus, allsuch events are ignored which affect the business but have no cost. Examples are : afavourable location, a good reputation with its customers, market standing etc. Thevalue of an asset may change but the cost remains the same in the books of account.As such the book value of an asset as recorded do not reflect their real value.It should, however, be noted that the cost concept is applicable to the fixed assets andnot to the current assets.
In spite of the above limitations the cost concept is preferred because firstly, it isdifficult and time consuming to ascertain the market values and secondly, there will betoo much of subjectivity in assessing current values. However, this limitation can beovercome with the help of inflation accounting.
6) Dual Aspect Concept
This is a basic concept of accounting. According to this concept every businesstransaction has a two-fold effect. In commercial context it is a famous dictum that“every receiver is also a giver and every giver is also a receiver”. For example, if youpurchase a machine for Rs. 8,000, you receive machine on the one hand and giveRs. 8,000 on the other. Thus, this transaction has a two-fold effect i.e.,(i) increase inone asset, and (ii) decrease in another asset. Similarly, if you buy goods worthRs. 500 on credit, it will increase an asset (stock of goods) on the one hand andincrease a liability(creditors) on the other. Thus, every business transaction involvestwo aspects (i) the receiving aspect, and (ii) the giving aspect. In case of the firstexample you find that the receiving aspect is machinery and the giving aspect is cash.In the second example the receiving aspect is goods and the giving aspect is thecreditor. If complete record of transactions is to be made, it would be necessary torecord both the aspects in books of account. This principle is the core of double entrybook-keeping and if this is strictly followed, it is called “Double Entry System ofBook-keeping’.
Let us understand another accounting implication of the dual aspect concept. To startwith, the initial funds (capital) required by the business are contributed by the owner.If necessary, additional funds are provided by the outsiders (creditors). As per thedual aspect concept all these receipts create corresponding obligations for theirrepayment, In other words, a contribution to the business, either in cash or kind, notonly increases its resources (assets), but also its obligations (liabilities/equities)correspondingly. Thus, at any given point of time, the total assets and the totalliabilities must be equal.
This equality is called ‘balance sheet equation’ or ‘accounting equation’. It is statedas under :
Liabilities (Equities) = AssetsCapital +Outside Liabilities = Assets
2 5
Accounting:An Overview
The term ‘assets’ denotes the resources (property) owned by the business while theterm ‘equities’ denotes the claims of various parties against the business assets.Equities are of two types : (i) Owners’ equity, and (ii) outsiders’ equity. Owners’equity called capital is the claim of owners against the assets of the businessoutsiders’ equity called liabilities is the claim of outside parties like creditors, bank,etc. against the assets of the business. Thus, all assets of the business are claimedeither by the owners or by the outsiders. Hence, the total assets of a business willalways be equal to its liabilities.
When various business transactions take place, they effect the assets and liabilities insuch a way that this equity is maintained. You will study later in detail under ‘1.9Accounting Equation’ of this unit how the equity is maintained.
1.10.2 Concept to be Observed at the Reporting Stage
The following concepts have to be kept in mind while preparing the final accounts:
1. Going concern concept2. Accounting period concept3. Matching concept4. Conservatism concept5. Consistency concept6. Full disclosure concept7. Materiality concept
Let us discuss the above concepts one by one.
1) Going Concern Concept
According to this concept it is assumed that every business would continue for a longperiod. Keeping this in view, the investors lend money and the creditors supply goodsand services to the concern. For all practical purpose the business is normally treatedas a going concern unless there is a strong evidence to the contrary. The currentdisposal value is irrelevant for a continuing business. Recording of transactions inaccounting is judged whether the benefits from expenses are immediate (short period,say less than one year) or a long term. If the benefits from expenses are immediate itis treated as a revenue or if the benefits are for long term, it is to be treated as capitaldepending upon the nature of expenses. Short term benefits expenses like rent, repairsetc. are limited to one year therefore such expenses are fully debited to profit and lossaccount of that year. On the other hand, if the benefit of expenditure is available for alonger period, it must be spread over a number of years. Therefore, only a portion ofsuch expenditure will be debited to profit and loss account. The balance ofexpenditure is shown as an asset in the Balance Sheet. Similarly fixed assets arerecorded at original cost and are depreciated in a proper manner and while preparingthe balance sheet, market price of fixed asset are not considered. For example, a firmpurchased a delivery van for Rs. 1,00,000 and its expected life is 10 years. Theaccountant has to spread the cost of the van for 10 years and charges Rs. 10,000being 1/10th of its cost to the profit and loss account every year in the form ofdepreciation and show the balance in the balance sheet as an asset. While preparingfinal accounts, a record will also be made for outstanding expenses and prepaidexpenses on the assumption that the business will continue for an indefinite period andthe assets will be used for its expected life.
This concept will not apply in case of a concern when it has gone into liquidation or ithas become insolvent. In such as case the assets are valued at their current values andthe liabilities at the value at which they are to be met.
2 6
Fundamentals ofAccounting
2) Accounting Period ConceptYou know that the going concern concept assumes that life of the business is indefiniteand the preparation of income and positional statements after a long period would notbe helpful in taking appropriate steps at the right time. Therefore, it is necessary toprepare the financial statements periodically to find out the profit or loss and financialposition of the business. It also helps the interested parties to make periodicalassessment of its performance. Therefore, accountants choose some shorter period tomeasure the results and one year has been generally accepted as the accounting period.However, accounts can also be prepared even for a shorter period for internalmanagement purposes. But one year accounting period is recognised by law andtaxation is assessed annually. Acconting period may be a calender year i.e., January 1to December 31 or any other period of twelve months, say April 1 to March 31 orDiwali to Diwali or Dasara to Dasara. The final accounts are prepared at the end ofeach accounting period and the financial reports thus, prepared facilitate to make gooddecision, corrective measures, business expansion etc. and also enable the end users tomake an assessment of the progress of the enterprise.
3) Matching ConceptMatching concept is based on the accounting period concept. The matching concept isalso called Matching of costs against revenue concepts. To ascertain the profit madeby the business during a particular period, the expenses incurred in an accounting yearshould be matched with the revenue earned during that year. The term ‘matching’means appropriate association of related revenues and expenses. For this purpose,first we have to recognize the revenues during an accounting period and the costsincurred in securing those revenues. Then the sum of costs should be deducted fromthe sum of revenues to get the net result of that period. The question when thepayment was received or made is irrelevant. In other words, all revenues earnedduring an accounting period, whether received or not and all costs incurred, whetherpaid or not have to be taken into account while preparing the final accounts.Similarly, any amount received or paid during the accounting period which actuallyrelates to the previous accounting period or the following accounting period must beeliminated from the current accounting period’s revenues and costs. Therefore,adjustments are to be made for all outstanding expenses, accrued incomes, preparedexpenses and unearned incomes, etc., while preparing the final accounts at the end ofthe accounting period. By application of this concept, the owner of the business easilyknow about the operating results of his business and can make effort to increaseearning capacity.
4) Conservation Concept
This concept is also known as Prudent Concept. It ensures that uncertainties and risksinherent in business transactions should be given a proper consideration.Conservatism refers to the policy of choosing the procedure that leads tounderstatement of assets or revenues, and over statement of liabilities or costs. Theconsequence of an error of understatement is likely to be less serious than that of anerror of over statement. On account of this reason, accountants generally follow therule ‘anticipate no profit but provide for all possible losses. In other words, profitsare taken into account only when they are actually realized but in case of losses, eventhe losses which may arise due to a remote possibility should also be taken intoaccount. That is the reason why the closing stock is valued at cost price or marketprice whichever is less. Similarly, provision for doubtful debts and provision fordiscounts on debtors are also made. This reflects a generally pessimistic attitude ofthe accountant, but it is regarded as the best way of dealing with uncertainty andprotecting creditors against an unwarranted distribution of the firm’s assets asdividends.
2 7
Accounting:An Overview
This concept is subject to criticism that it is against the convention of full disclosure.It encourages creation of secret reserves and financial statements do not reflect a trueand fair view of the affairs of the business.
5) Consistency Concept
The principle of consistency means that the same accounting principles should be usedfor preparing financial statement for different periods. It means that there should notbe a change in accounting methods from year to year. Comparisons are possible onlywhen a consistent policy of accounting is followed. If there are frequent changes inthe accounting treatment there is little scope for reliability. For example, if stock isvalued at ‘cost or market price whichever is less, this principle should be followedyear to year. Similarly if deprecation on fixed assets is provided on straight line basis,it should be followed consistently year after year. Consistency eliminates personalbias and helps in achieving comparable results. If this principle of consisting is notfollowed, the accounting information about an enterprise cannot be usefully comparedwith similar information about other enterprises and so also within the same enterprisefor some other period. Consistency principle enhances the utility of the financialstatements.
However, consistency does not prohibit change. When a change is desirable, thechange and its affect should be clearly stated in financial accounts.
6) Full Disclosure ConceptThis concept states that the financial statements are to be prepared honestly and allsignificant information should be incorporated there in because these statements arethe basic means of communicating financial information to all interested parties.Therefore, these statements should be prepared in such a way that all materialinformation is clearly disclosed to the persons interested in its affairs . The purpose ofthis concept is that any body who wants to study the financial statements should notbe prejudiced by concealing any facts. It is, therefore, necessary that the disclosureshould be fair and adequate to make impartial judgement.
This concept assumes greater importance in respect of Joint Stock Company type oforganisations where ownership is divorced from management. The Joint StockCompanies Act, 1956 requires that Profit and Loss Account and Balance Sheet of acompany must give a true and fair view of the state of affairs of the company and alsoprovided prescribed form in which these statements are to be prepared so thatsignificant information may not be left out.
7) Materiality Concept
This concept is closely related to the full disclosure concept. Full disclosure does notmean that everything should be disclosed. It only means that relevant and materialinformation must be disclosed. American Accounting Association defines the termmateriality as “An item should be regarded as material if there is reason to believe thatknowledge of it would influence the decisions of informed investor”. Materialityprimarily relates to the relevance and reliability of information. All materialinformation should be disclosed through the financial statements accompanied bynecessary notes. For example commission paid to sole selling agents, and a change inthe method of rate of depreciation, if any, must be duly reported in the financialstatements.
Further strict adherence to accounting principles is not required for items of littleimportance or non-material nature. For example, erasers, pencils, stapler, pins, scalesetc., are used for a long period, but they are not treated as assets. They are treated asexpenses. This does not affect the amounts of profit or loss materially. Similarly,while showing the amounts of various items in financial statements, they can be
2 8
Fundamentals ofAccounting
rounded off to the nearest rupee or hundreds. There may not be any material effect.For example if an amount of Rs. 145,923.28 is shown as Rs. 1,45,923 orRs. 1,45,900 it does not make much difference for assessment of the performance ofthe enterprise.
The materiality and immateriality convention varies according to the company, thecircumstances of the transaction and economic significance. An item considered to bematerial for one business, may be immaterial for another. Similarly, an item ofmaterial in one year may not be material in the subsequent years. However, there areno specific rules for ascertaining material or non-material items. They are rather inthe category of conventions or rules developed from experience to fulfil the essentialand useful needs and purposes in establishing reliable financial and operatinginformation control for business entities. What is required is just a matter of personaljudgment.
Check Your Progress B
1) What do you understand by money measurement concept ?
............……………………….....………………………………………………..
............……………………….....………………………………………………..
............……………………….....………………………………………………..
............……………………….....………………………………………………..
2) Explain dual aspect concept.............……………………….....………………………………………………..
............……………………….....………………………………………………..
............……………………….....………………………………………………..
............……………………….....………………………………………………..
3) List the concepts to be observed at the reporting stage.............……………………….....………………………………………………..
............……………………….....………………………………………………..
............……………………….....………………………………………………..
............……………………….....………………………………………………..
4) What are the stages in accounting process ?............……………………….....………………………………………………..
............……………………….....………………………………………………..
............……………………….....………………………………………………..
............……………………….....………………………………………………..
6) State whether each of the following statements is True or False :
i) In accounting all business transactions are recorded which are having adual effect.
ii) It is the basis of a going concern concept that the assets are always valuedat cost price.
iii) Accounting principles are the rules which are adopted by accountantsuniversally while recording transactions.
iv) A controller is entrusted with the responsibilities of raising funds.v) Money measurement concept ignores qualitative aspect of things.
2 9
Accounting:An Overview1.11 ACCOUNTING STANDARDS
Accounting standards are generally accepted accounting principles which provides thebasis for accounting policies and for preparation of financial statements.The object of these standards is to provide a uniformity in financial reporting and toensure consistency and comparability of the information provided by the businessfirms. Therefore, the standards set for must be easily understandable as well asacceptable by all and significantly reduce manipulation of information in thebooks of accounts.
Thus, accounting standards provide useful information to the users to interpretpublished reports. It provides information about the basis on which accounts havebeen provided and the rules followed while preparing financial statements.
Importance of Accounting Standards
1) It helps the investors in assessing the return and possible risk involved inevaluating the various investment proposals in different enterprises.
2) It raises the standards of audit while reporting the financial statements to themanagement.
3) It helps the government and other interested parties in formulating economicpolicies, tax planning, market analysis, investment decisions etc.
4) It helps the Chartered Accountants to deal with their client, in preparing financialstatements on a true and fair basis. They can refuse the reports of their clientswhich are found to be incorrect or misleading.
5) It helps the interested parities to understand the information properly and makemeaningful comparisons and interpretations for decision-making purposes.
6) It facilitates inter firm comparison of the financial position and operating resultsof similar enterprises.
7) It will reduce the scope of manipulation of accounts to suit the requirement ofmanagement.
8) It would facilitate the development of international trade and commerce asfinancial statements are clearly understandable.
Compliance with the accounting standards has been made mandatory. Section 211(3A)of the Companies Act, 1956 requires that every financial statement i.e., profit and lossaccount and balance sheet shall comply with the accounting standards. For thepurpose of this section the accounting standards issued by the Institute of CharteredAccountants of India (ICAI) shall be deemed to be the accounting standards.According section 211 (2B), If the financial statements of any company do notcomply with requirements of the accounting standards, it should state the reasons forsuch deviations from the accounting standards together its financial effect, if any,arising due to such deviation. Therefore, it is advisable for the companies as far aspossible to comply with the accounting standards in view of its mandatory nature. Incase the mandatory accounting standards are not complied with, it is in contraventionof provisions of the Companies Act and the financial statements prepared andpresented will not reflect a true and fair view of the state of affairs of the company.These accounting standards also apply in respect of financial statements audited fortax purpose under section 44 AB of Income Tax Act 1961.
These accounting standards are applicable to all commercial, industrial or businessactivities of any enterprise but not to those enterprises which are not commercial,industrial or business in nature.
3 0
Fundamentals ofAccounting 1.12 ACCOUNTING ASSUMPTIONS AND POLICIES AS
PER ACCOUNTING STANDARDS OF INDIAAccounting measurements are not always uniform. Some financial quantities can bemeasured in two or more different ways. The management with the help of company’saccountant decides which measurement alternatives are to be used. These choices areknown as ‘accounting policies’. These accounting polices differ from company tocompany. Therefore, it is advisable to each company to state in the notes of itsfinancial statements which accounting policy it has followed. The company shouldnot change its policy frequently and when there is a change in the policy, thecompany should justify the reason for such a change.
The management is not completely free in choosing any accounting policies becauseselection of policy must fit within the limits set by the measurement guidelines knownas ‘generally accepted accounting principles’ as well as to comply statutoryrequirements. For example, The Central Board of Direct Taxes requires the followinginformation to be disclosed in respect of change in accounting polices :
1) A change in accounting policy shall be made only if the adoption of differentaccounting policy is required by statute or if it is considered that the changewould result in more appropriate in preparation or presentation of the financialstatements of an assessee.
2) Any change in accounting policy which has material effect shall be disclosed inthe financial statements of the period in which such change is made. Where theeffect of such change is not ascertainable or such change has no material effecton the financial statements for the previous year but has material effect in yearssubsequent to the previous year, the fact shall be stated in the previous year inwhich such change is adopted.
Materiality of an item depends on its amount and nature. An item should also beconsidered material if the knowledge of it would influence the decisions of theinvestors. Materiality varies from one business to another business. Similarly, an itemwhich is material in one year may not be material in the next year. While preparingfinancial statements it is, therefore, necessary to give emphasis only on those matterswhich are significant and thereby ignoring insignificant matters.
In order to bring uniformity for the presentation of accounting results, the Institute ofChartered Accountants of India, established an Accounting Standard Board (ASB) inApril, 1977. The Board consists of representatives from industry and government.The main function of ASB is to formulate accounting standards to be followed whilepreparing and interpreting the financial results. While framing the accountingstandards, the ASB will pay due attention to the International Accounting Standardsand try to integrate them to the possible extent. It also takes into account theprevailing laws, customs and business environment prevailing in India. To improvequality and bring parity with the presentation of financial statements in India, theASB has formulated the following accounting standards:
No. Title
AS 1 Disclosure of Accounting PoliciesAS 2 Valuation of InventoriesAS 3 Cash Flow StatementsAS 4 Contingencies and Events occurring after Balance Sheet DateAS 5 Net Profit or Loss, Prior Period Items and Changes in Accounting PoliciesAS 6 Depreciation AccountingAS 7 Accounting for Construction Contracts
3 1
Accounting:An Overview
AS 8 Accounting for Research and DevelopmentAS 9 Revenue RecognitionAS 10 Accounting for Fixed AssetsAS 11 Accounting for the Effect of Changes in Foreign Exchange RatesAS 12 Accounting for Government GrantsAS 13 Accounting for InvestmentsAS 14 Accounting for AmalgamationsAS 15 Accounting for Retirements Benefits in the Financial Statements of EmployersAS 16 Borrowing CostsAS 17 Segment ReportingAS 18 Related Party DisclosuresAS 19 LeasesAS 20 Consolidated Financial StatementAS 21 Earnings per ShareAS 22 Accounting for Taxes on IncomeAS 23 Accounting for Investments in Consolidated Financial StatementsAS 24 Discounting OperationsAS 25 Interim Financial ReportingAS 26 Intangible AssetsAS 27 Financial Reporting of Interest in Joint Ventures
Check Your Progress C
1) Why accounting practices should be standardised ?
..........……….......………………………………………………………………..
..........……….......………………………………………………………………..
..........……….......………………………………………………………………..
.........……….......………………………………………………………………...
2) State whether each of the following statements is True or False:
i) A management accountant is not the custodian of properties and financialinterests of a business enterprise.
ii) ‘Statement of Standard Accounting Practice’ were formulated by anAccounting Standard Board in India.
iii) The generally accepted accounting principles prescribe a uniformaccounting practice.
iv) The materiality concept refers to the state of ignoring small items andvalues from accounts.
vi) The avoidance of insignificant things will not affect accounting results.
1.13 LET US SUM UPIn business a number of transactions take place every day. It is not possible toremember all of them. Hence there is a need to record them. The recording ofbusiness transactions in a systematic manner is the main function of accounting. Itenables to ascertain the profit and loss and the financial position of the business. Italso provides necessary financial information to all interested parties.
3 2
Fundamentals ofAccounting
Accounting is the process of identifying, measuring, recording, classifying andsummarizing the transactions and analysing, interpreting and communicating theresults thereof. Accounting provides information for three general uses such asi) managerial decision-making, ii) managerial planning control, and internalperformance evaluation, and iii) financial reporting and external performanceevaluation. To meet the requirements of different people interested in accountinginformation, accounting is classified as financial accounting, cost accounting andmanagement accounting. Financial accounting refers to the preparation of reports forgeneral purpose whereas management accounting provides information to inside theorganisation. Cost accounting provides information about the problems of internalmanagerial control.
Management accountant plays a significant role in the decision making process and itdepends upon his position and requirements of the organisation. The accountingprocess is divided into four stages: (i) recording the transactions, (ii) classifying thetransactions, (iii) summarizing the transactions, and (iv) interpreting the results. Therecording of transactions in the books of accounts is based on accounting equation.Accounting equation is a formula expressing equivalence of the two expressions ofassets and liabilities. The relationship will remain the same on account of dual aspectof the transaction.
The accountants over a period of time, have developed certain guidelines for allaccounting work. These are called basic concepts of accounting. Certain conceptsare to be observed at the time of recording the transactions, while others are relevantat the summarizing and reporting stages. The concepts to be observed at the recordingstage are : business entity, money measurement, objective evidence, historical record,cost and the dual aspect concept. Concepts to be observed at the reporting stage are :going concern concept, accounting period concept, matching concept, conservatismconcept, consistency concept, full disclosure concept and materiality concept. Lack ofuniformity in accounting practice makes it difficult to compare the financial reports ofdifferent companies. The multiplicity of accounting practices makes it possible formanagement to conceal material information. To avoid this problem accountingstandards are developed by various professional bodies. The object of accountingstandards is to provide uniformity in financial reporting and to ensure consistency andcomparability of the information provided by the business firms. The management isnot absolutely free in choosing any accounting policy. The accounting policy selectedmust fit within the limits set by generally accepted accounting principles and alsocomply to the statutory requirements. The Accounting Standard Board (ASB) ofIndia, has developed so far 27 standards to improve quality and parity with thepreparation of financial statements.
1.14 KEY WORDSAccounting Period : A period of twelve months for which the accounts are usuallykept.
Balance Sheet : A statement of assets and liabilities as at the end of an accountingperiod.
Books of Accounts : Books in the form of bound registers or loose sheets whereintransactions are recorded.
Business Unit : A unit formed for the purpose of carrying on some kind of businessactivity.
Financial Position : Position of assets and liabilities of a business at a given point oftime.
3 3
Accounting:An Overview
Financial Statement : Summary of accounting information such as profit and lossaccount and Balance Sheet prepared at the end of accounting period.
Profit and Loss Account: An account showing profit or loss of the business duringan accounting period.
Transaction : Transfer of money or money’s worth between the two business units.
Management Accountant : A staff-functionary who uses accounting information formanagement planning and control.
Staff Function : It is performed in an advisory capacity without line or decision-making.
Accounting Conventions : Methods or procedures used in accounting
Accounting Equation : Assets = Owners’ equity + Liabilities
Accounting Principles : The methods or procedures used in accounting for eventsreported in the financial statements.
Accounting Standards : Accounting Principles.
Cost Accounting : Classifying, Summarizing, recording, reporting and allocatingcurrent or predicted costs.
Double Entry : The system of recording transactions that maintains the equality ofthe accounting equation.
Generally Accepted Accounting Principles (GAAP) : The conventions, rules andprocedures necessary to define accepted accounting practice at a particular time;includes both broad guidelines and relatively detailed practices and procedures.
Internal Reporting : Reporting for management’s use in planning and control.
Materiality : The concept that accounting should disclose separately onlythose events that are relatively important for the business or for understanding itsstatement.
External Reporting : Production of financial statements for the use of externalinterest groups like shareholders, investors, creditors, government etc.
1.15 ANSWERS TO CHECK YOUR PROGRESSA) 6 (i) False (ii) True (iii) False (iv) False (v) True (vi) True (vii) True
B) 5 (i) True (ii) True (iii) True (iv) False (v) True
C) 2 (i) False (ii) True (iii) True (iv) False (v) True
1.16 TERMINAL QUESTIONS1) What are the objectives of Accounting ? Name the different parties interested in
accounting information and state why they want it.2) Briefly explain the accounting concepts which guide the accountant at the
recording stage.3) What do you understand by Dual Aspect Concept ? Explain the accounting
implications.4) Explain the role of Management Accountant in a modern business organisation.5) What are the accounting concepts to be observed at the reporting stage ?
Explain any two in detail.
3 4
Fundamentals ofAccounting
6) Discuss in brief the basic accounting concepts and fundamental accountingassumptions.
7) Why do accounting practices be standardized ? What progress has been made inIndia regarding standardization of accounting ?
8) Is it possible to give a true and fair view of a company’s position using account-ing information ? Explain.
9) Explain the following :i) Accounting equationii) Convention of materialityiii) Accounting standardsiv) Accounting processv) Branches of accountingvi) Accounting a source of financial information.
1.17 SOME USEFUL BOOKSHarold Bierman Jr. and Allan R. Drebin, 1978. Financial Accounting : AnIntroduction, W. B. Sounders Company, Philadelphion, London (Chapter 1-3).
Maheswari, S. N., 2002, An Introduction to Accounting, Vikas Publishing House :New Delhi (Chapter 1 and 2)
Patil, V.A.,and J. S. Korlahalli, 1986. Principles and Practice of Accounting,R. Chand and Co., New Delhi (Chapter 1-3)
Gupta, R. L. and M. Radhaswamy, 1986. Advanced Accountancy, Sultan Chand andSons : New Delhi (Chapter I and II)
Anthony, Robert, N. and James Reece, 1987. Accounting Principles, All IndiaTraveler Book Seller, New Delhi (Chapter 1-3)
Meigs, Walter, B. and Robert F. Meirgs, 1987. Accounting : The Basis for BusinessDecisions, MC Graw Hill : New York (Chapter I)
Sidney Davidson, Michael W. Maher, Clyde P. Stickney, Roman L Weil, 1985.Managerial Accounting, An Introduction to Concepts, Methods, and Uses, Holt-Saunders International Editors, Japan. (Chapter I)
3 5
Basic Cost ConceptsUNIT 2 BASIC COST CONCEPTS
Structure
2.0 Objectives
2.1 Introduction
2.2 Need for Cost Data
2.3 Cost Concept
2.4 Classification of Costs2.4.1 Functional Classification2.4.2 On the Basis of Identifiability with Products2.4.3 On the Basis of Variability2.4.4 On the Basis of Product or Period2.4.5 On the Basis of Controllable and Non-Controllable Costs2.4.6 On the Basis of Relevance to Decision-Making
2.5 Concepts of Cost Unit and Cost Centre2.5.1 Cost Unit2.5.2 Cost Centre
2.6 Elements of Cost2.6.1 Materials2.6.2 Labour2.6.3 Expenses
2.7 Total Cost Build-Up
2.8 Cost Sheet
2.9 Calculation of Recovery Rates
2.10 Statement of Quotation
2.11 Methods of Costing2.11.1 Job Costing2.11.2 Contract Costing2.11.3 Batch Costing2.11.4 Unit Costing2.11.5 Bocess Costing2.11.6 Operating Costing2.11.7 Multiple Costing2.11.8 Uniform Costing
2.12 Types of Costing2.12.1 Marginal Costing2.12.2 Absorption Costing2.12.3 Historical Costing2.12.4 Standard Costing
2.13 Let Us Sum Up
2.14 Key Words
2.15 Answers to Check Your Progress
2.16 Terminal Questions
2.17 Some Useful Books
3 6
Fundamentals ofAccounting 2.0 OBJECTIVES
After studying this unit, you should be able to :
l describe the need for cost data;l meaning and classification of costs;l explain the concept of cost unit and cost centre;l describe the elements of cost;l prepare a Proforma of Cost Sheet and identify the components of total cost;l prepare a statement of quotation and ascertain the price of a tender; andl describe different methods of costing and identify the industries to which each
method is applicable.
2.1 INTRODUCTIONIn this unit you will learn about certain basic cost concepts like cost, cost unit, costcentre, classification of costs, elements of costs and components of total cost.Apart from these aspects, the unit also covers preparation of cost sheet showingdetails of various components of total cost. You will also study about thepreparation of statement of quotation. The unit also discusses various methods andtypes of costing.
2.2 NEED FOR COST DATAEnterprises may be either profit making or non-profit making organisations. If theyare profit making organisations, one of their primary objectives is to operate at aprofit. Non profit organisations are generally providers of service. Cost data isrequired to know how much profit the enterprise is earned. To properly set theirprices at a level to ensure a profit for the entity as a whole, the enterprise must knowwhat their costs are. Similarly, decisions regarding adding new products or droppingold products, etc., knowledge of cost data is essential to know how profit changes withvarious alternatives. In case of non-profit institution, cost data helps to know whatlevel of funding is needed to provide the services. It also helps the management todecide what kind of activities can engage in most efficiently. Thus the managementof an organisation requires cost data for the following purposes :
1) To ascertain profit or loss periodically,2) To plan the operations and performance evaluation,3) For cost control,4) To price the products or services,5) To value inventory and measure the expenses in external financial reports, and6) In day to day operations of plans and policies,
2.3 COST CONCEPTIn principle, a cost is a sacrifice of resources. According to the terminology of BritishInstitute of Cost and Works Accountants, ‘‘Cost is the amount of expenditure (actualor notional) incurred on or attributable to a given thing’’. In other words, costindicates, (i) an actual or estimated expenditure (ii) a direct or indirect expenditure,and (iii) it relates to a job, process, product or service. Examples of such costs are :Material, labour, factory overheads, administrative overheads, selling and distributionoverheads.
3 7
Basic Cost ConceptsCost is a very broad and flexible term. It does not give an exact meaning unless it isused in some particular context. It varies with time, volume, firm, method or purpose.The meaning of cost may change according to its interpretation and the manner inwhich it is ascertained. It does not mean the same thing under all circumstances.Therefore, cost must indicate its purpose and the conditions under which it iscomputed.
Costs and Expenses
Cost information is necessary both for managerial accounting and financialaccounting. When costs are used inside the organisation to evaluate its performancewe say that costs are used for managerial accounting purposes. On the other handwhen costs are used by outsiders (interested parties) to evaluate the performance ofmanagement and make investment decisions in the organisation, then costs are usedfor financial accounting purpose.
It is also important to distinguish between cost as used in managerial accounting, fromexpense, as used in financial accounting. A cost is a sacrifice of resource to achievespecific objective which has been deferred or not yet utilized for the realisation ofrevenues. The price paid for the acquisition of fixed assets, materials, etc. are theexamples of such deferred costs.
An expense is a cost that is charged against revenue in an accounting periodand hence expenses are deduced from revenue in that accounting period.Examples are : Salaries, rent rates, etc. Generally Accepted AccountingPrinciples and Regulations specify when costs are treated as expenses to becharged to revenues.
In accounting for managerial decisions the focus is on costs, and not on expenses. Forexternal reporting, the term expense is used as defined by Generally AcceptedAccounting Principles. But in practice, the terms cost and expenses are sometimesused synonymously.
Cost and Loss : There is difference between ‘cost’ and ‘loss’. You know that costsignifies an expenditure incurred for recurring some benefit to the enterprise. If nobenefit is derived from a particular expenditure, it is treated as a loss. Cost ofmaterial destroyed by fire, salary paid to a foreman during the period of strike etc.,are the examples of loss to the business.
2.4 CLASSIFICATION OF COSTS
Costs may be classified into different categories depending upon the purpose.The following are the various bases according to which costs have been classified :
1) According to functions to which they relate,
2) According to their identifiability with jobs, products, or services,
3) According to their variability with changes in output,
4) According to the association with product or period,
5) According to their controllability, and
6) According to their relevance to decision-making
Let us discuss all the above in detail.
3 8
Fundamentals ofAccounting
2.4.1 Functional ClassificationThe most common classification of costs in a manufacturing establishment is on thebasis of functions to which they relate because costs have to be ascertained for each ofthese functions. On the basis of functions, costs are classified into four categories.They are :
i) Manufacturing Costsii) Administrative Costsiii) Selling Costsiv) Distribution Costs
Manufacturing Costs : Manufacturing costs are those costs related to factoryoperations which are essential to the completion of the product. It includes directmaterial costs, direct labour costs and manufacturing overheads. Direct materials arethe major components of the finished product and can be easily identified with theproduct. Direct labour is the labour which is used in actually producing the product.Manufacturing overheads consist of all other costs related to the manufacturingprocess. These are also termed as ‘production costs’.
Administrative Costs: Administrative costs includes all those costs incurred on thegeneral administration and control of the firm. Examples of such costs are : salariesof the office staff, rent of the office building, depreciation and repairs of the officefurniture etc. Infact any expenditure which is not related directly to production,selling, distribution, research and development forms part of the administrative costs.
Selling Costs: Selling costs are those costs which are incurred in connection with thesale of goods. Some examples of such costs are : Cost of warehousing, advertising,salesmen salaries etc.
Distribution Costs: Distribution costs are those costs which are incurred on despatchof finished products to customer including transportation. Examples of such costs are:packing, carriage, insurance, freight outwards, etc.
2.4.2 On the Basis of Identifiability with ProductsOn this basis costs are divided into (i) Direct Costs, and (ii) Indirect Costs:
Direct Costs : Direct costs are those costs which are the major components of thefinished products and can be clearly identified with the product being produced. Theexamples of direct costs are : raw materials, labour and other direct expenses whichare exclusively incurred for a particular job, product or process.
Indirect Costs : indirect costs are those costs which cannot be assigned to anyparticular product, job or process. These costs are usually incurred for the business asa whole and therefore, are to be allocated to various products manufactured in thefactory on some reasonable basis. Examples of indirect costs are : factory lighting,rent of factory building, salaries of foreman, etc, Indirect costs are also called as‘overheads’ or ‘on costs’. These overheads can be further subdivided into factoryoverheads, administrative overheads, selling and distribution overheads.
2.4.3 On the Basis of VariabilityAnother classification is based on the cost behaviour. On this basis costs areclassified into (i) Fixed Costs, (ii) Variable Costs, and (iii) Semi-variable(or semi-fixed) Costs, (iv) Step Costs.
Fixed Costs: These costs remain fixed irrespective of a change in the volume ofoutput. But fixed cost varies when it is expressed on per unit basis. In other wordsfixed cost per unit decreases when the volume of production increases and vice versa.
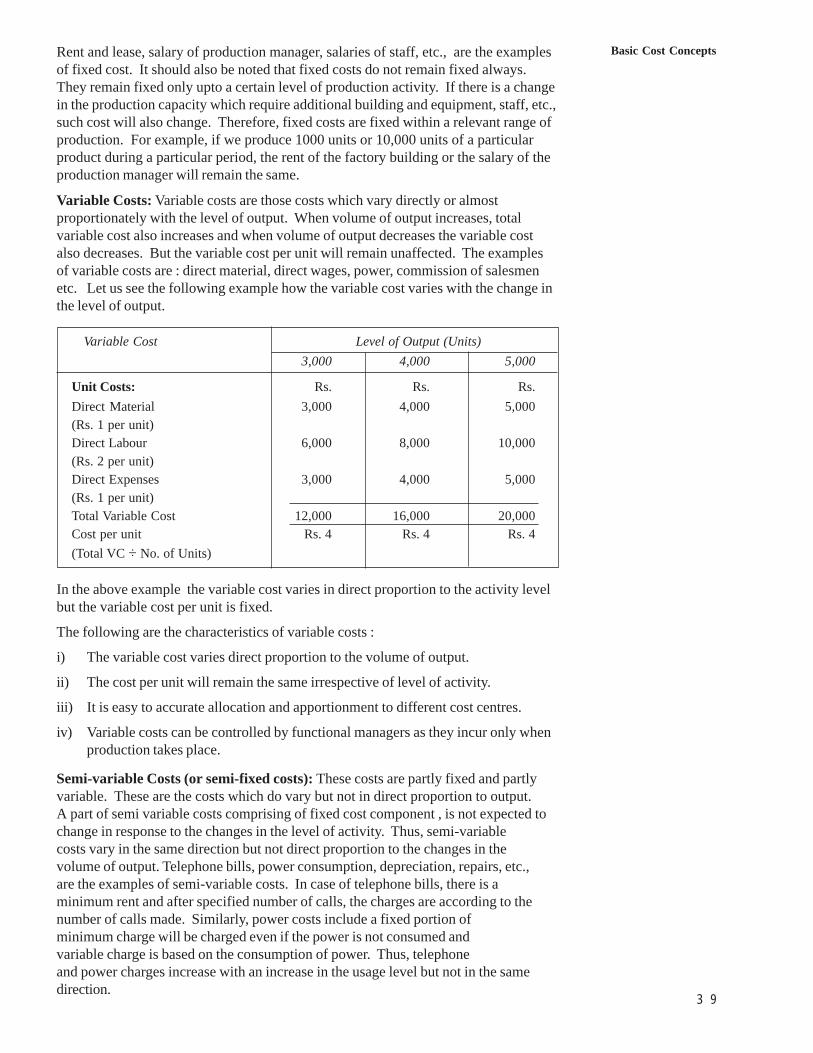
3 9
Basic Cost ConceptsRent and lease, salary of production manager, salaries of staff, etc., are the examplesof fixed cost. It should also be noted that fixed costs do not remain fixed always.They remain fixed only upto a certain level of production activity. If there is a changein the production capacity which require additional building and equipment, staff, etc.,such cost will also change. Therefore, fixed costs are fixed within a relevant range ofproduction. For example, if we produce 1000 units or 10,000 units of a particularproduct during a particular period, the rent of the factory building or the salary of theproduction manager will remain the same.
Variable Costs: Variable costs are those costs which vary directly or almostproportionately with the level of output. When volume of output increases, totalvariable cost also increases and when volume of output decreases the variable costalso decreases. But the variable cost per unit will remain unaffected. The examplesof variable costs are : direct material, direct wages, power, commission of salesmenetc. Let us see the following example how the variable cost varies with the change inthe level of output.
Variable Cost Level of Output (Units)3,000 4,000 5,000
Unit Costs: Rs. Rs. Rs.Direct Material 3,000 4,000 5,000(Rs. 1 per unit)Direct Labour 6,000 8,000 10,000(Rs. 2 per unit)Direct Expenses 3,000 4,000 5,000(Rs. 1 per unit)Total Variable Cost 12,000 16,000 20,000Cost per unit Rs. 4 Rs. 4 Rs. 4(Total VC ÷ No. of Units)
In the above example the variable cost varies in direct proportion to the activity levelbut the variable cost per unit is fixed.
The following are the characteristics of variable costs :
i) The variable cost varies direct proportion to the volume of output.
ii) The cost per unit will remain the same irrespective of level of activity.
iii) It is easy to accurate allocation and apportionment to different cost centres.
iv) Variable costs can be controlled by functional managers as they incur only whenproduction takes place.
Semi-variable Costs (or semi-fixed costs): These costs are partly fixed and partlyvariable. These are the costs which do vary but not in direct proportion to output.A part of semi variable costs comprising of fixed cost component , is not expected tochange in response to the changes in the level of activity. Thus, semi-variablecosts vary in the same direction but not direct proportion to the changes in thevolume of output. Telephone bills, power consumption, depreciation, repairs, etc.,are the examples of semi-variable costs. In case of telephone bills, there is aminimum rent and after specified number of calls, the charges are according to thenumber of calls made. Similarly, power costs include a fixed portion ofminimum charge will be charged even if the power is not consumed andvariable charge is based on the consumption of power. Thus, telephoneand power charges increase with an increase in the usage level but not in the samedirection.
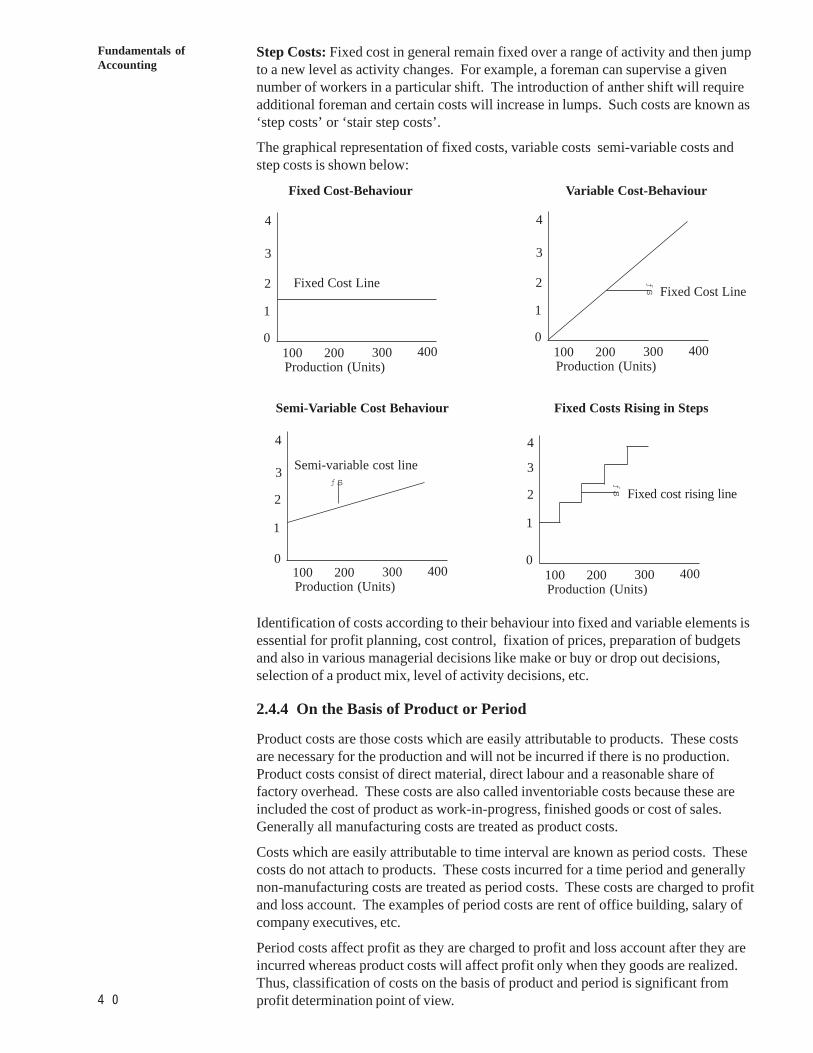
4 0
Fundamentals ofAccounting
Step Costs: Fixed cost in general remain fixed over a range of activity and then jumpto a new level as activity changes. For example, a foreman can supervise a givennumber of workers in a particular shift. The introduction of anther shift will requireadditional foreman and certain costs will increase in lumps. Such costs are known as‘step costs’ or ‘stair step costs’.
The graphical representation of fixed costs, variable costs semi-variable costs andstep costs is shown below:
Fixed Cost-Behaviour Variable Cost-Behaviour
Semi-Variable Cost Behaviour Fixed Costs Rising in Steps
Identification of costs according to their behaviour into fixed and variable elements isessential for profit planning, cost control, fixation of prices, preparation of budgetsand also in various managerial decisions like make or buy or drop out decisions,selection of a product mix, level of activity decisions, etc.
2.4.4 On the Basis of Product or Period
Product costs are those costs which are easily attributable to products. These costsare necessary for the production and will not be incurred if there is no production.Product costs consist of direct material, direct labour and a reasonable share offactory overhead. These costs are also called inventoriable costs because these areincluded the cost of product as work-in-progress, finished goods or cost of sales.Generally all manufacturing costs are treated as product costs.
Costs which are easily attributable to time interval are known as period costs. Thesecosts do not attach to products. These costs incurred for a time period and generallynon-manufacturing costs are treated as period costs. These costs are charged to profitand loss account. The examples of period costs are rent of office building, salary ofcompany executives, etc.
Period costs affect profit as they are charged to profit and loss account after they areincurred whereas product costs will affect profit only when they goods are realized.Thus, classification of costs on the basis of product and period is significant fromprofit determination point of view.
4
3
2
1
0100 200 300 400Production (Units)
Fixed cost rising line
ƒs
4
3
2
1
0100 200 300 400Production (Units)
Semi-variable cost lineƒs
4
3
2
1
0100 200 300 400Production (Units)
Fixed Cost Line
ƒs
4
3
2
1
0100 200 300 400Production (Units)
Fixed Cost Line
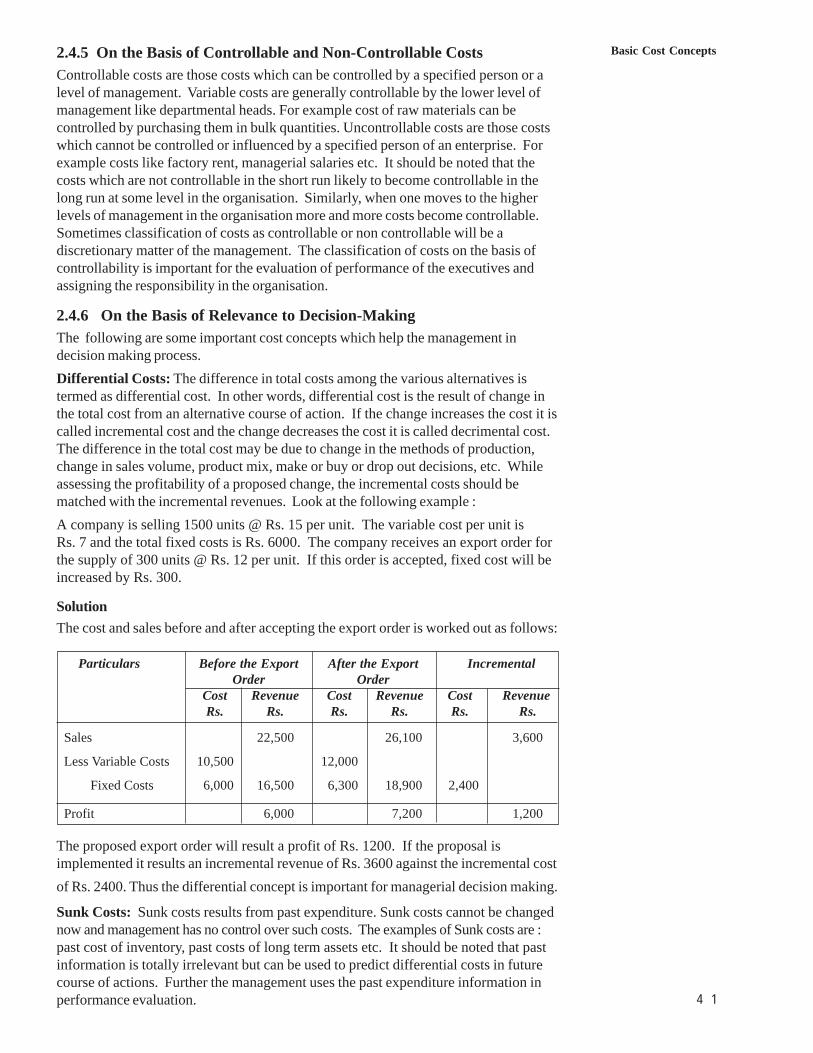
4 1
Basic Cost Concepts2.4.5 On the Basis of Controllable and Non-Controllable CostsControllable costs are those costs which can be controlled by a specified person or alevel of management. Variable costs are generally controllable by the lower level ofmanagement like departmental heads. For example cost of raw materials can becontrolled by purchasing them in bulk quantities. Uncontrollable costs are those costswhich cannot be controlled or influenced by a specified person of an enterprise. Forexample costs like factory rent, managerial salaries etc. It should be noted that thecosts which are not controllable in the short run likely to become controllable in thelong run at some level in the organisation. Similarly, when one moves to the higherlevels of management in the organisation more and more costs become controllable.Sometimes classification of costs as controllable or non controllable will be adiscretionary matter of the management. The classification of costs on the basis ofcontrollability is important for the evaluation of performance of the executives andassigning the responsibility in the organisation.
2.4.6 On the Basis of Relevance to Decision-MakingThe following are some important cost concepts which help the management indecision making process.Differential Costs: The difference in total costs among the various alternatives istermed as differential cost. In other words, differential cost is the result of change inthe total cost from an alternative course of action. If the change increases the cost it iscalled incremental cost and the change decreases the cost it is called decrimental cost.The difference in the total cost may be due to change in the methods of production,change in sales volume, product mix, make or buy or drop out decisions, etc. Whileassessing the profitability of a proposed change, the incremental costs should bematched with the incremental revenues. Look at the following example :A company is selling 1500 units @ Rs. 15 per unit. The variable cost per unit isRs. 7 and the total fixed costs is Rs. 6000. The company receives an export order forthe supply of 300 units @ Rs. 12 per unit. If this order is accepted, fixed cost will beincreased by Rs. 300.
SolutionThe cost and sales before and after accepting the export order is worked out as follows:
Particulars Before the Export After the Export IncrementalOrder Order
Cost Revenue Cost Revenue Cost RevenueRs. Rs. Rs. Rs. Rs. Rs.
Sales 22,500 26,100 3,600
Less Variable Costs 10,500 12,000
Fixed Costs 6,000 16,500 6,300 18,900 2,400
Profit 6,000 7,200 1,200
The proposed export order will result a profit of Rs. 1200. If the proposal isimplemented it results an incremental revenue of Rs. 3600 against the incremental costof Rs. 2400. Thus the differential concept is important for managerial decision making.
Sunk Costs: Sunk costs results from past expenditure. Sunk costs cannot be changednow and management has no control over such costs. The examples of Sunk costs are :past cost of inventory, past costs of long term assets etc. It should be noted that pastinformation is totally irrelevant but can be used to predict differential costs in futurecourse of actions. Further the management uses the past expenditure information inperformance evaluation.
4 2
Fundamentals ofAccounting
Imputed Costs : These costs are also called hypothetical costs or notional costs.These costs are included in cost accounts only for the purpose of taking managerialdecisions. For example, interest on capital, rent of own building should be taken intoaccount while evaluating the relative profitability of the projects.
Opportunity Costs : Opportunity cost refers to the benefit foregone as a result ofaccepting one course of action. The manager, while taking a decision should not onlytake into account the costs and benefits of the proposed alternative but also the profitscarified by making the decision. For example, if an owned building is proposed to beutilized for housing a new project plant, the likely revenue which the building couldfetch, if it is let out, is the opportunity cost which should be taken into account whileevaluating the profitability of the project.
2.5 CONCEPTS OF COST UNIT AND COST CENTRE
2.5.1 Cost Unit
The main function of costing is to ascertain cost per unit of output. Each economicactivity has to be measured in identifiable units which may serve as the basis ofaccounting. Such units for the purpose of costing may be as follows :
1) Unit of product, or a group of products (e.g., pair of shoes or one batch of shoessay one dozen)
2) Unit of operating service (e.g., cost of running a bus per one kilometer)3) Unit of time (e.g., cost of generating electricity per hour)4) Unit of weight (e.g., cost per one tonne of steel)5) Unit of measurement (e.g., cost per meter of cloth or one litre of petrol)Thus a cost unit is ‘a unit of product, service or time in relation to which costs may beascertained or expressed’. In other words cost unit is unit of measurement of cost. Itwill be normally the quantity of product for which price is quoted to the consumers.The selection of cost unit must be appropriate, natural to the business, easilyunderstandable and acceptable to all concerned. Firstly, it should offer convenience incost ascertainment. Secondly, it should be easier to associate expenses with cost units.Thirdly, it should be according to the nature and prevailing practice of the business.
Some examples of cost unit for different products and services are given below:
Product/Activity Cost Unit
Cement Per-tonne/per bagIron Per-tonne/quintalChemicals Per-tonne/kilogram/litre, etcPower Per-kilowatt hourCoal Per tonne/kilogramBricks Per thousandPrinting press Per thousand copiesPaper Per ream/per kilogramTransport Per passenger per kilometer/per
kilogram per kilometerTelephone Per callTimber Per cubic foot/square footPencils Per dozen or gross
4 3
Basic Cost ConceptsPetrol Per litreTelevision Per setGold Per gramHotel Per room per dayNursing Homes Per bed per dayCars Per car
2.5.2 Cost CentreA cost centre is ‘location, person, or item of equipment (or group of these) for whichcosts may be ascertained and used for the purpose of control’. Thus a cost centrerefers to a section of business to which costs can be charged. It may consist of eitheror a combination of the following :
Location : Factory, Department, Office, Warehouse, Stores, Sales Depot, etc.Person : Salesman, a machine operator, customer, etc.Equipment : Machine, Car, Truck, etc.
Types of Cost Centres : Cost centres may be divided into the following four types :
1) Process Cost Centre (Based on sequence of operations)2) Production Cost centre (for regular production in a factory)3) Operation Cost Centre (where various operations are involved in the production
process)4) Service Cost Centre (for activities supporting the main production)
Thus identification or selection of cost centres depends on the nature and types ofindustry. The identification of cost centres helps us in :
i) ascertaining the centre-wise costs,ii) comparing the centre-wise costs periodically,iii) finding out the major trends of variance, andiv) applying the techniques of control to check undue, undesirable or unexpected
movements in cost.
A cost centre segregates operations, democrats activities, and distributes expenses.This also helps in fixing responsibilities for every cost centre.
Check Your Progress A
1. What is the concept of Cost ?..........................................................................................................................
..........................................................................................................................
..........................................................................................................................
2. Distinguish between direct and indirect costs...........................................................................................................................
..........................................................................................................................
..........................................................................................................................
3. Give four examples of indirect expenses...........................................................................................................................
..........................................................................................................................
..........................................................................................................................
4 4
Fundamentals ofAccounting
4. Distinguish between cost and loss.
..........................................................................................................................
..........................................................................................................................
..........................................................................................................................
5. Give two examples of semi-variable costs.
..........................................................................................................................
..........................................................................................................................
..........................................................................................................................
6. State whether each of the following statements is True or False
i) Variable cost remains fixed per unit but varies direct proportion to thevolume of output.
ii) Variable costs are controllable.iii) Operating costing is used in transport industry.iv) Semi-variable costs vary in the same direction to the volume of output but
not direct proportion to the changes in the volume of output.v) Fixed costs are also known as period costs.vi) Direct Material + Direct wages + Direct expenses = Works cost.vii) Works cost + Office overheads = Cost of production.
2.6 ELEMENTS OF COSTIn order to understand and interpret the term ‘cost’, it will be necessary tounderstand about the elements of cost. The following are the three elementsof costs: (1) Materials, (2) Labour, (3) Expenses
These can be further sub-dividend into as direct or indirect as follows :
Direct IndirectMaterial MaterialLabour LabourExpenses Expenses
2.6.1 Materials
The term ‘materials’ refers to those commodities which are used as raw materials,components, or consumables for manufacturing a product. In other words, thesubstance from which the product is made is known as ‘materials’. Materials can bedirect or indirect.
Direct Materials: All materials which become an integral part of the finished productand which can be conveniently assigned to specific physical units is termed as ‘DirectMaterials’. Direct material generally becomes a part of the finished product. Thefollowing are some examples of direct material :
i) All materials or components specifically purchased, produced or requisitionedfrom stores (e.g., sugar can for sugar, cloth for ready-made garments, cotton forcloth, tyres for car, etc.)
ii) Primary packing material (e.g., wrapping, cardboard, boxes etc.)iii) Partly produced or purchased components
4 5
Basic Cost ConceptsIndirect Materials: All materials which are used for purposes ancillary to thebusiness and which cannot conveniently be assigned to specific physical units istermed as ‘indirect materials’. These materials cannot be conveniently identified withindividual cost units. Their cost is insignificant in the finished product. Pins, screws,nuts, bolts etc., are some examples. There are some other items which do notphysically become part of the finished product. Examples are : Consumable stores,lubricating oil, Greece, printing and stationery etc., These items do not form part ofthe finished product.
2.6.2 Labour
The workers employed for converting material into finished product or doing variousodd jobs in the business are known as ‘Labour’. Labour can be direct as well asindirect.
Direct Labour: The workers who are directly involved, in the production of goodsare known as ‘direct labour’. They may be labourers producing manually or workersoperating machinery. Direct labour costs can be conveniently identified with aparticular product, job or process. For example, the wages paid to a machineoperator engaged in the manufacture of goods. The wages paid to such workers areknown as ‘manufacturing wages’.
Indirect labour : The workers employed for carrying out tasks incidental toproduction of goods or those engaged for office work and selling and distributionactivities are known as indirect labourí. The wages paid to such workers are knownas ‘indirect wages’. Indirect labour is of general character in nature and cannot beconveniently identified with a particular unit of output. The examples of indirectlabour costs are : wages of storekeepers, foremen, directors’ fees, salaries ofsalesman, etc.
2.6.3 Expenses
All expenses other than material and labour are termed as ‘expenses’. Expenses maybe direct or indirect.
Direct Expenses : Expenses which can be identified with and allocated to costcentres or units are called direct expenses. These are the expenses which arespecifically incurred in connection with a particular cost unit. Direct expenses arealso called as ‘chargeable expenses’. The examples of such expenses are : Carriageinwards, production royalty, hire charges of special equipment, cost of specialdrawings, designs and layouts, experimental costs, etc.
Indirect Expenses : These are expenses which cannot be directly or wholly allocatedto cost centres or cost units. In other words, all expenses other than indirect materialand labour which cannot be directly attribute to a particular product, job or serviceare called indirect expenses. Examples of such expenses are : Rent and Rates,lighting and heating, advertising, insurance, repairs, carriage, etc.
The above elements of cost may be shown in the form of a chart as shown below:
Elements of Cost
Cost
Materials Labour Expenses
Direct Indirect Direct Indirect Direct Indirect
Overheads
ss
s s s s
s
s s
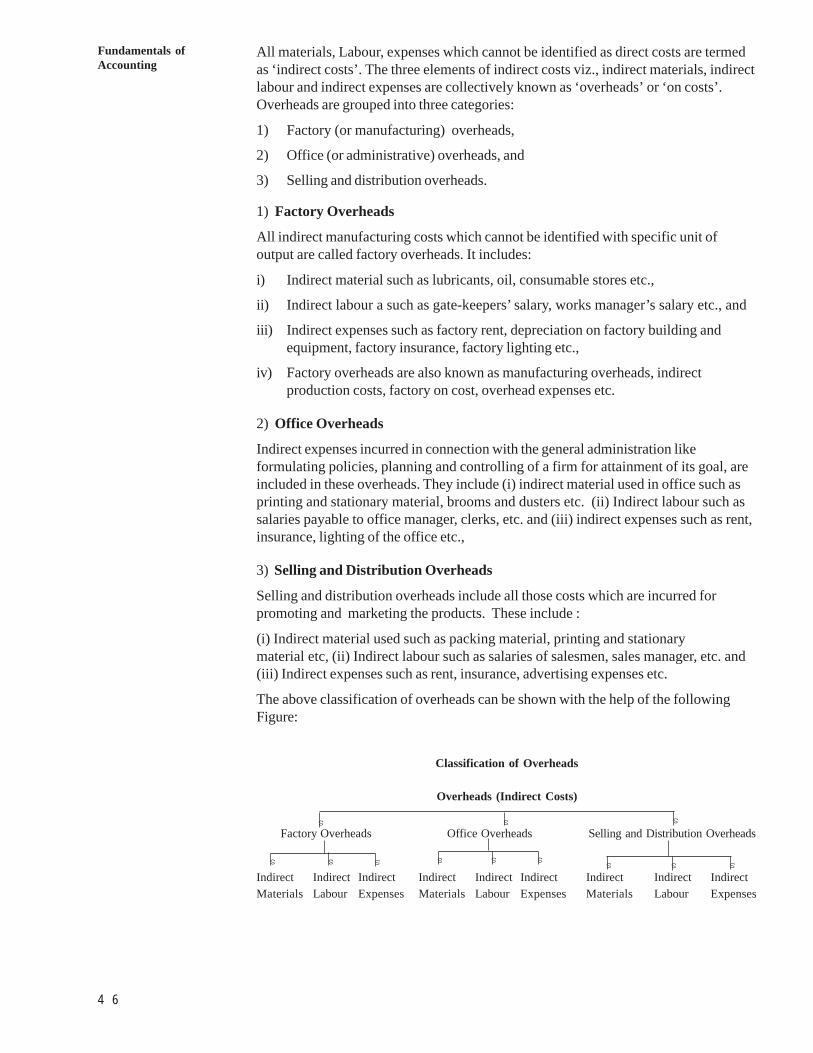
4 6
Fundamentals ofAccounting
All materials, Labour, expenses which cannot be identified as direct costs are termedas ‘indirect costs’. The three elements of indirect costs viz., indirect materials, indirectlabour and indirect expenses are collectively known as ‘overheads’ or ‘on costs’.Overheads are grouped into three categories:
1) Factory (or manufacturing) overheads,
2) Office (or administrative) overheads, and
3) Selling and distribution overheads.
1) Factory Overheads
All indirect manufacturing costs which cannot be identified with specific unit ofoutput are called factory overheads. It includes:
i) Indirect material such as lubricants, oil, consumable stores etc.,
ii) Indirect labour a such as gate-keepers’ salary, works manager’s salary etc., and
iii) Indirect expenses such as factory rent, depreciation on factory building andequipment, factory insurance, factory lighting etc.,
iv) Factory overheads are also known as manufacturing overheads, indirectproduction costs, factory on cost, overhead expenses etc.
2) Office Overheads
Indirect expenses incurred in connection with the general administration likeformulating policies, planning and controlling of a firm for attainment of its goal, areincluded in these overheads. They include (i) indirect material used in office such asprinting and stationary material, brooms and dusters etc. (ii) Indirect labour such assalaries payable to office manager, clerks, etc. and (iii) indirect expenses such as rent,insurance, lighting of the office etc.,
3) Selling and Distribution Overheads
Selling and distribution overheads include all those costs which are incurred forpromoting and marketing the products. These include :
(i) Indirect material used such as packing material, printing and stationarymaterial etc, (ii) Indirect labour such as salaries of salesmen, sales manager, etc. and(iii) Indirect expenses such as rent, insurance, advertising expenses etc.
The above classification of overheads can be shown with the help of the followingFigure:
Classification of Overheads
Overheads (Indirect Costs)
Factory Overheads Office Overheads Selling and Distribution Overheads
Indirect Indirect Indirect Indirect Indirect Indirect Indirect Indirect IndirectMaterials Labour Expenses Materials Labour Expenses Materials Labour Expenses
s s s
s s s s s s s s s
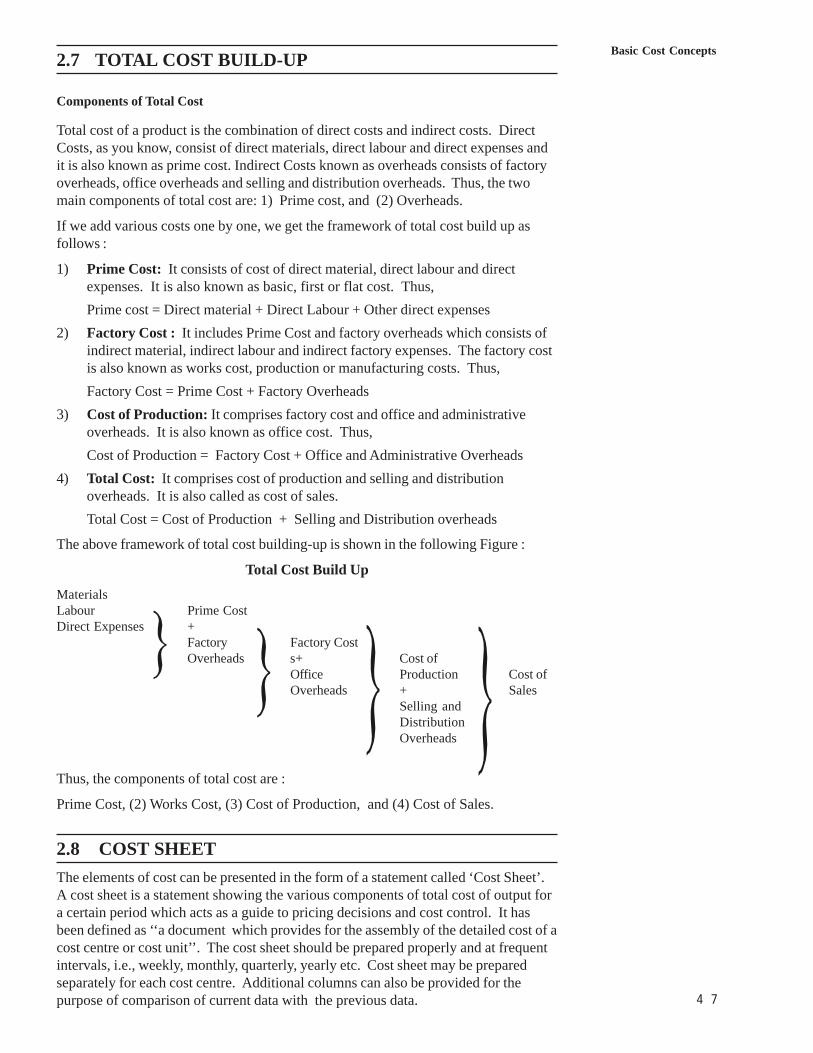
4 7
Basic Cost Concepts2.7 TOTAL COST BUILD-UP
Components of Total Cost
Total cost of a product is the combination of direct costs and indirect costs. DirectCosts, as you know, consist of direct materials, direct labour and direct expenses andit is also known as prime cost. Indirect Costs known as overheads consists of factoryoverheads, office overheads and selling and distribution overheads. Thus, the twomain components of total cost are: 1) Prime cost, and (2) Overheads.
If we add various costs one by one, we get the framework of total cost build up asfollows :
1) Prime Cost: It consists of cost of direct material, direct labour and directexpenses. It is also known as basic, first or flat cost. Thus,Prime cost = Direct material + Direct Labour + Other direct expenses
2) Factory Cost : It includes Prime Cost and factory overheads which consists ofindirect material, indirect labour and indirect factory expenses. The factory costis also known as works cost, production or manufacturing costs. Thus,Factory Cost = Prime Cost + Factory Overheads
3) Cost of Production: It comprises factory cost and office and administrativeoverheads. It is also known as office cost. Thus,Cost of Production = Factory Cost + Office and Administrative Overheads
4) Total Cost: It comprises cost of production and selling and distributionoverheads. It is also called as cost of sales.Total Cost = Cost of Production + Selling and Distribution overheads
The above framework of total cost building-up is shown in the following Figure :
Total Cost Build UpMaterialsLabour Prime CostDirect Expenses +
Factory Factory CostOverheads s+ Cost of
Office Production Cost ofOverheads + Sales
Selling andDistributionOverheads
Thus, the components of total cost are :
Prime Cost, (2) Works Cost, (3) Cost of Production, and (4) Cost of Sales.
2.8 COST SHEETThe elements of cost can be presented in the form of a statement called ‘Cost Sheet’.A cost sheet is a statement showing the various components of total cost of output fora certain period which acts as a guide to pricing decisions and cost control. It hasbeen defined as ‘‘a document which provides for the assembly of the detailed cost of acost centre or cost unit’’. The cost sheet should be prepared properly and at frequentintervals, i.e., weekly, monthly, quarterly, yearly etc. Cost sheet may be preparedseparately for each cost centre. Additional columns can also be provided for thepurpose of comparison of current data with the previous data.
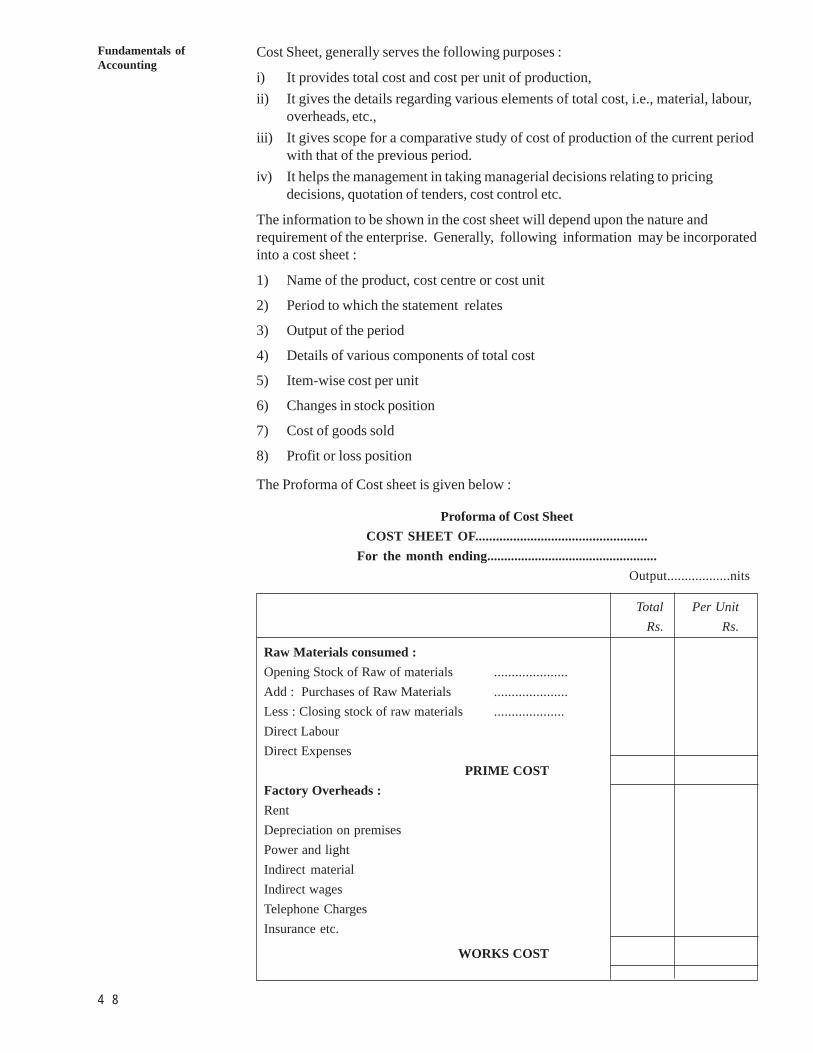
4 8
Fundamentals ofAccounting
Cost Sheet, generally serves the following purposes :
i) It provides total cost and cost per unit of production,ii) It gives the details regarding various elements of total cost, i.e., material, labour,
overheads, etc.,iii) It gives scope for a comparative study of cost of production of the current period
with that of the previous period.iv) It helps the management in taking managerial decisions relating to pricing
decisions, quotation of tenders, cost control etc.
The information to be shown in the cost sheet will depend upon the nature andrequirement of the enterprise. Generally, following information may be incorporatedinto a cost sheet :
1) Name of the product, cost centre or cost unit
2) Period to which the statement relates
3) Output of the period
4) Details of various components of total cost
5) Item-wise cost per unit
6) Changes in stock position
7) Cost of goods sold
8) Profit or loss position
The Proforma of Cost sheet is given below :
Proforma of Cost SheetCOST SHEET OF..................................................
For the month ending..................................................Output..................nits
Total Per UnitRs. Rs.
Raw Materials consumed :Opening Stock of Raw of materials .....................Add : Purchases of Raw Materials .....................Less : Closing stock of raw materials ....................Direct LabourDirect Expenses
PRIME COSTFactory Overheads :RentDepreciation on premisesPower and lightIndirect materialIndirect wagesTelephone ChargesInsurance etc.
WORKS COST
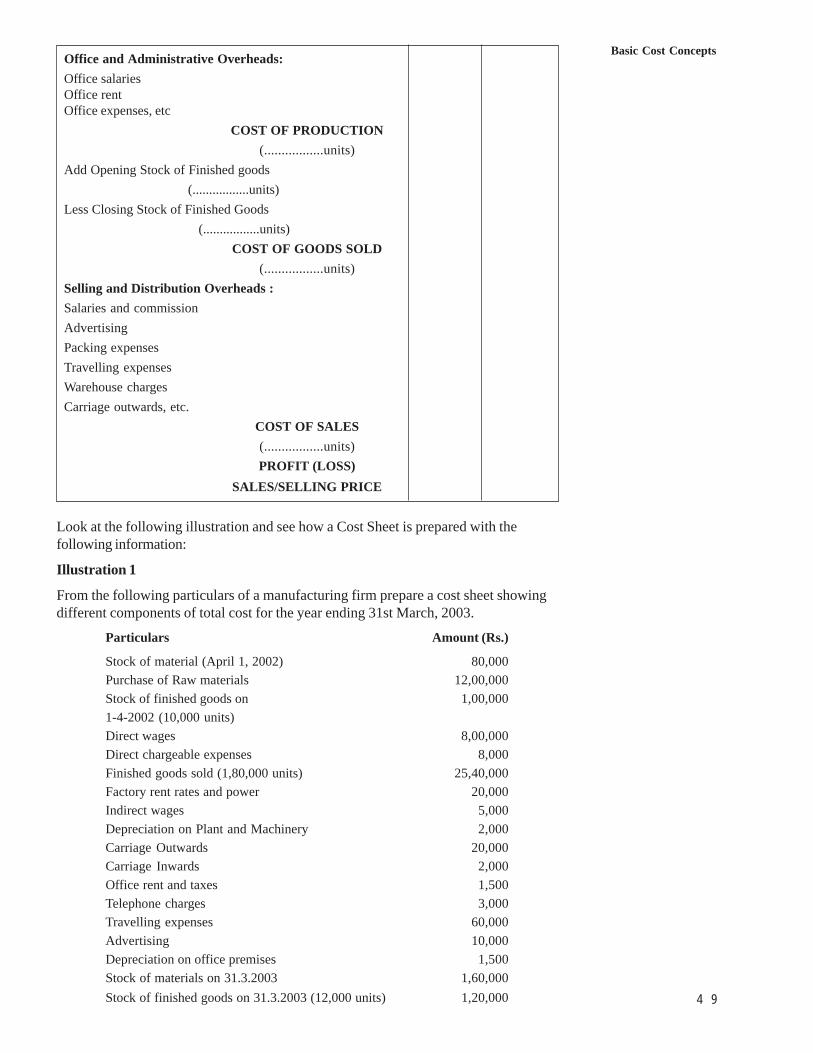
4 9
Basic Cost ConceptsOffice and Administrative Overheads:Office salariesOffice rentOffice expenses, etc
COST OF PRODUCTION(.................units)
Add Opening Stock of Finished goods (.................units)Less Closing Stock of Finished Goods (.................units)
COST OF GOODS SOLD(.................units)
Selling and Distribution Overheads :Salaries and commissionAdvertisingPacking expensesTravelling expensesWarehouse chargesCarriage outwards, etc.
COST OF SALES(.................units)PROFIT (LOSS)
SALES/SELLING PRICE
Look at the following illustration and see how a Cost Sheet is prepared with thefollowing information:
Illustration 1
From the following particulars of a manufacturing firm prepare a cost sheet showingdifferent components of total cost for the year ending 31st March, 2003.
Particulars Amount (Rs.)
Stock of material (April 1, 2002) 80,000Purchase of Raw materials 12,00,000Stock of finished goods on 1,00,0001-4-2002 (10,000 units)Direct wages 8,00,000Direct chargeable expenses 8,000Finished goods sold (1,80,000 units) 25,40,000Factory rent rates and power 20,000Indirect wages 5,000Depreciation on Plant and Machinery 2,000Carriage Outwards 20,000Carriage Inwards 2,000Office rent and taxes 1,500Telephone charges 3,000Travelling expenses 60,000Advertising 10,000Depreciation on office premises 1,500Stock of materials on 31.3.2003 1,60,000Stock of finished goods on 31.3.2003 (12,000 units) 1,20,000
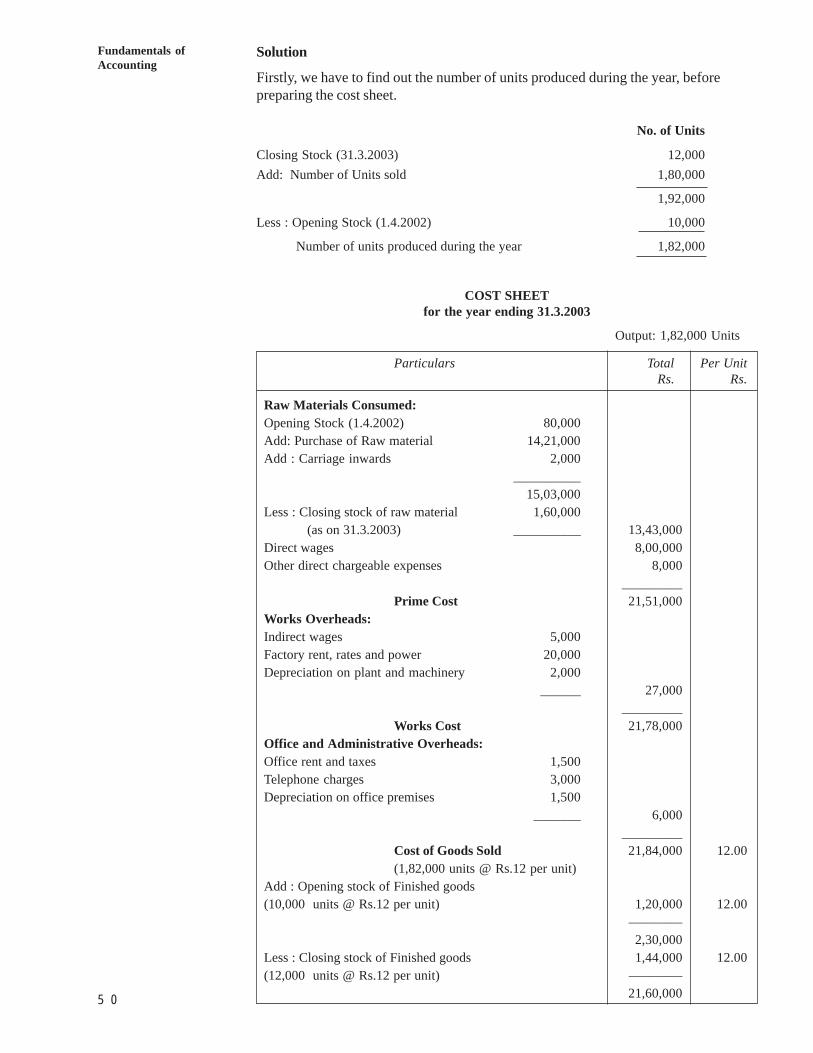
5 0
Fundamentals ofAccounting
Solution
Firstly, we have to find out the number of units produced during the year, beforepreparing the cost sheet.
No. of Units
Closing Stock (31.3.2003) 12,000Add: Number of Units sold 1,80,000
1,92,000
Less : Opening Stock (1.4.2002) 10,000
Number of units produced during the year 1,82,000
COST SHEETfor the year ending 31.3.2003
Output: 1,82,000 Units
Particulars Total Per UnitRs. Rs.
Raw Materials Consumed:Opening Stock (1.4.2002) 80,000Add: Purchase of Raw material 14,21,000Add : Carriage inwards 2,000
__________15,03,000
Less : Closing stock of raw material 1,60,000 (as on 31.3.2003) __________ 13,43,000Direct wages 8,00,000Other direct chargeable expenses 8,000
_________Prime Cost 21,51,000
Works Overheads:Indirect wages 5,000Factory rent, rates and power 20,000Depreciation on plant and machinery 2,000
______ 27,000_________
Works Cost 21,78,000Office and Administrative Overheads:Office rent and taxes 1,500Telephone charges 3,000Depreciation on office premises 1,500
_______ 6,000_________
Cost of Goods Sold 21,84,000 12.00(1,82,000 units @ Rs.12 per unit)
Add : Opening stock of Finished goods(10,000 units @ Rs.12 per unit) 1,20,000 12.00
––––––––2,30,000
Less : Closing stock of Finished goods 1,44,000 12.00(12,000 units @ Rs.12 per unit) ––––––––
21,60,000
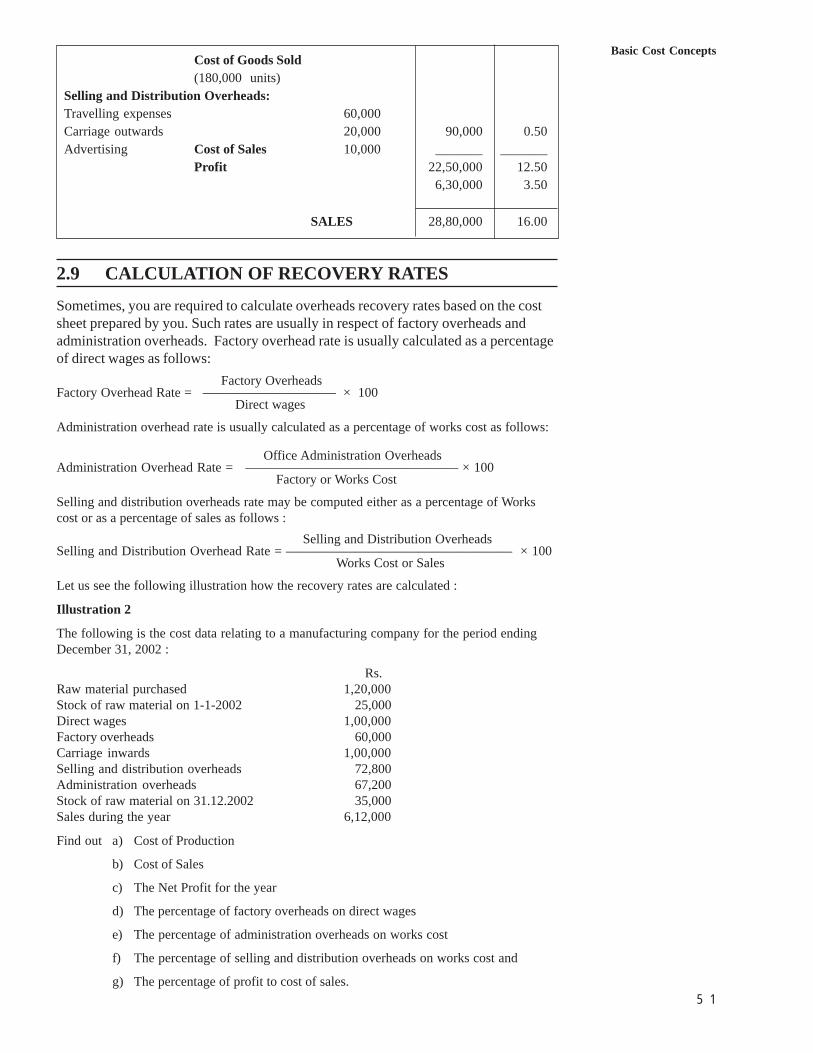
5 1
Basic Cost ConceptsCost of Goods Sold(180,000 units)
Selling and Distribution Overheads:Travelling expenses 60,000Carriage outwards 20,000 90,000 0.50Advertising Cost of Sales 10,000 _______ _______
Profit 22,50,000 12.506,30,000 3.50
SALES 28,80,000 16.00
2.9 CALCULATION OF RECOVERY RATESSometimes, you are required to calculate overheads recovery rates based on the costsheet prepared by you. Such rates are usually in respect of factory overheads andadministration overheads. Factory overhead rate is usually calculated as a percentageof direct wages as follows:
Factory OverheadsFactory Overhead Rate = —————————— × 100
Direct wages
Administration overhead rate is usually calculated as a percentage of works cost as follows:
Office Administration OverheadsAdministration Overhead Rate = —————————————––––— × 100
Factory or Works Cost
Selling and distribution overheads rate may be computed either as a percentage of Workscost or as a percentage of sales as follows :
Selling and Distribution OverheadsSelling and Distribution Overhead Rate = ————————————————— × 100
Works Cost or Sales
Let us see the following illustration how the recovery rates are calculated :
Illustration 2
The following is the cost data relating to a manufacturing company for the period endingDecember 31, 2002 :
Rs.Raw material purchased 1,20,000Stock of raw material on 1-1-2002 25,000Direct wages 1,00,000Factory overheads 60,000Carriage inwards 1,00,000Selling and distribution overheads 72,800Administration overheads 67,200Stock of raw material on 31.12.2002 35,000Sales during the year 6,12,000
Find out a) Cost of Production
b) Cost of Sales
c) The Net Profit for the year
d) The percentage of factory overheads on direct wages
e) The percentage of administration overheads on works cost
f) The percentage of selling and distribution overheads on works cost and
g) The percentage of profit to cost of sales.
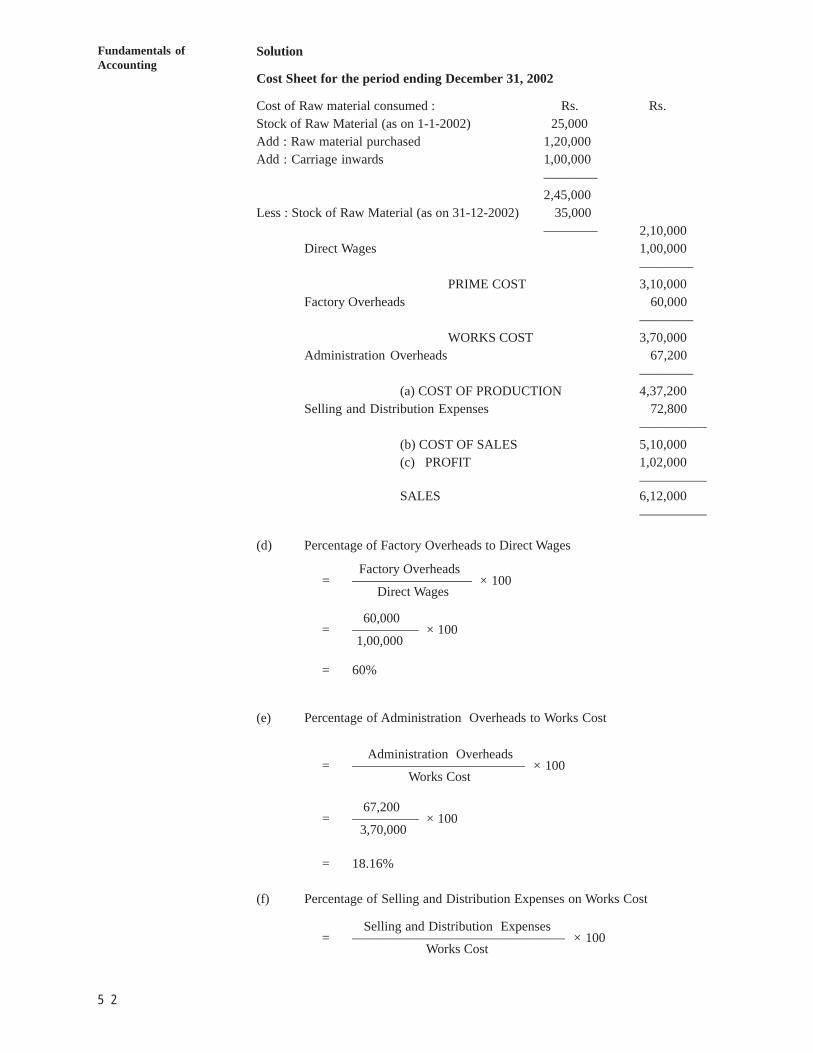
5 2
Fundamentals ofAccounting
Solution
Cost Sheet for the period ending December 31, 2002
Cost of Raw material consumed : Rs. Rs.Stock of Raw Material (as on 1-1-2002) 25,000Add : Raw material purchased 1,20,000Add : Carriage inwards 1,00,000
––––––––2,45,000
Less : Stock of Raw Material (as on 31-12-2002) 35,000–––––––– 2,10,000
Direct Wages 1,00,000––––––––
PRIME COST 3,10,000Factory Overheads 60,000
––––––––WORKS COST 3,70,000
Administration Overheads 67,200––––––––
(a) COST OF PRODUCTION 4,37,200Selling and Distribution Expenses 72,800
—————(b) COST OF SALES 5,10,000(c) PROFIT 1,02,000
—————SALES 6,12,000
—————
(d) Percentage of Factory Overheads to Direct Wages
Factory Overheads = ————————— × 100
Direct Wages
60,000 = ————— × 100
1,00,000
= 60%
(e) Percentage of Administration Overheads to Works Cost
Administration Overheads = ————————————— × 100
Works Cost
67,200 = ————— × 100
3,70,000
= 18.16%
(f) Percentage of Selling and Distribution Expenses on Works Cost
Selling and Distribution Expenses = ———————————————— × 100
Works Cost
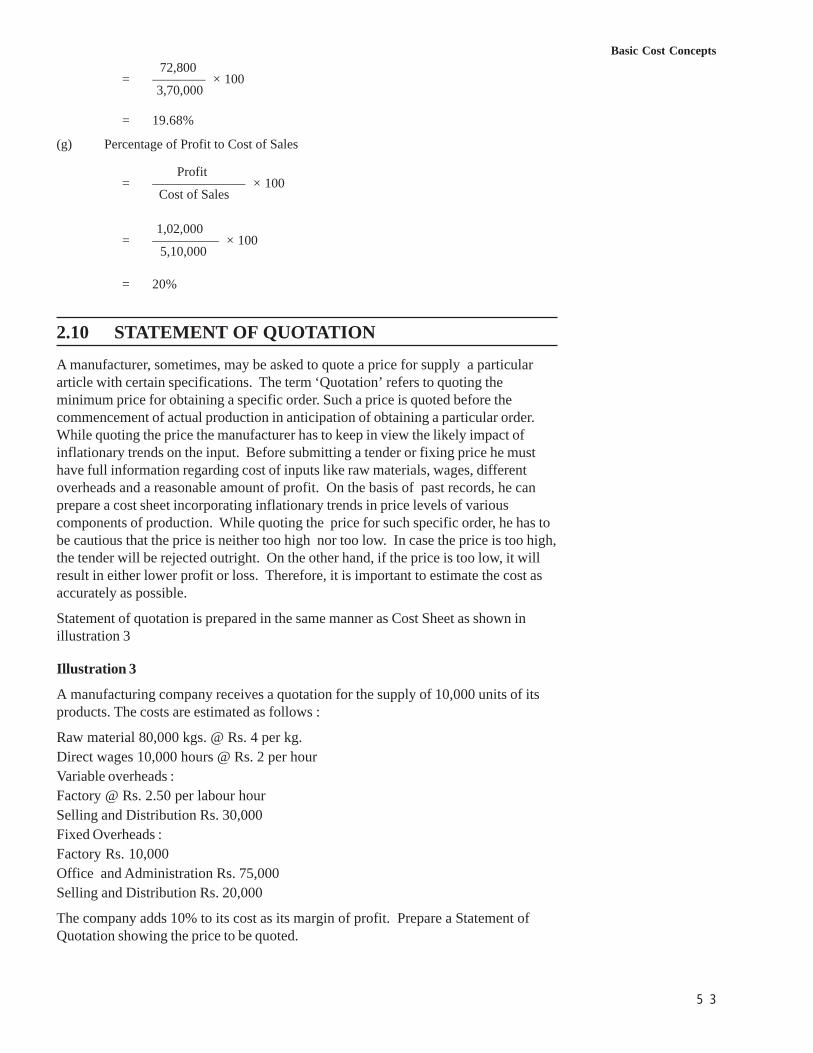
5 3
Basic Cost Concepts 72,800
= ———— × 100 3,70,000
= 19.68%
(g) Percentage of Profit to Cost of Sales
Profit = ——————— × 100
Cost of Sales
1,02,000 = ————— × 100
5,10,000
= 20%
2.10 STATEMENT OF QUOTATIONA manufacturer, sometimes, may be asked to quote a price for supply a particulararticle with certain specifications. The term ‘Quotation’ refers to quoting theminimum price for obtaining a specific order. Such a price is quoted before thecommencement of actual production in anticipation of obtaining a particular order.While quoting the price the manufacturer has to keep in view the likely impact ofinflationary trends on the input. Before submitting a tender or fixing price he musthave full information regarding cost of inputs like raw materials, wages, differentoverheads and a reasonable amount of profit. On the basis of past records, he canprepare a cost sheet incorporating inflationary trends in price levels of variouscomponents of production. While quoting the price for such specific order, he has tobe cautious that the price is neither too high nor too low. In case the price is too high,the tender will be rejected outright. On the other hand, if the price is too low, it willresult in either lower profit or loss. Therefore, it is important to estimate the cost asaccurately as possible.
Statement of quotation is prepared in the same manner as Cost Sheet as shown inillustration 3
Illustration 3
A manufacturing company receives a quotation for the supply of 10,000 units of itsproducts. The costs are estimated as follows :
Raw material 80,000 kgs. @ Rs. 4 per kg.Direct wages 10,000 hours @ Rs. 2 per hourVariable overheads :Factory @ Rs. 2.50 per labour hourSelling and Distribution Rs. 30,000Fixed Overheads :Factory Rs. 10,000Office and Administration Rs. 75,000Selling and Distribution Rs. 20,000
The company adds 10% to its cost as its margin of profit. Prepare a Statement ofQuotation showing the price to be quoted.
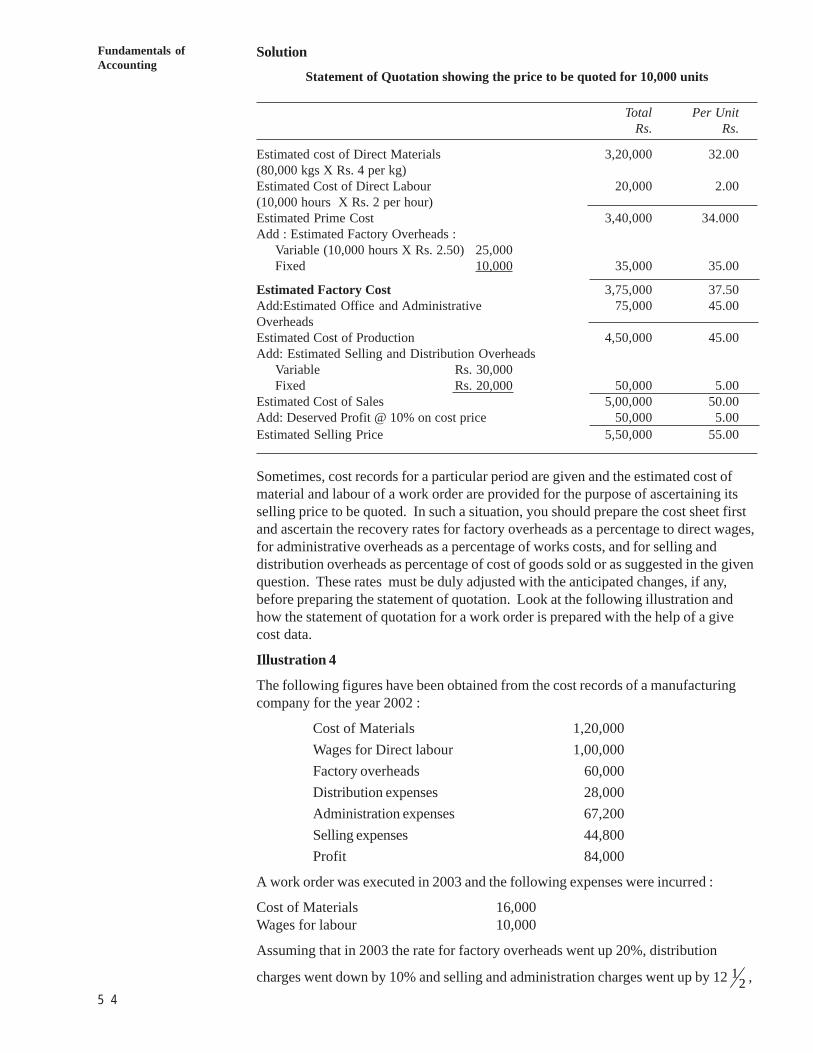
5 4
Fundamentals ofAccounting
Solution
Statement of Quotation showing the price to be quoted for 10,000 units
Total Per UnitRs. Rs.
Estimated cost of Direct Materials 3,20,000 32.00(80,000 kgs X Rs. 4 per kg)Estimated Cost of Direct Labour 20,000 2.00(10,000 hours X Rs. 2 per hour)Estimated Prime Cost 3,40,000 34.000Add : Estimated Factory Overheads :
Variable (10,000 hours X Rs. 2.50) 25,000Fixed 10,000 35,000 35.00
Estimated Factory Cost 3,75,000 37.50Add:Estimated Office and Administrative 75,000 45.00OverheadsEstimated Cost of Production 4,50,000 45.00Add: Estimated Selling and Distribution Overheads
Variable Rs. 30,000Fixed Rs. 20,000 50,000 5.00
Estimated Cost of Sales 5,00,000 50.00Add: Deserved Profit @ 10% on cost price 50,000 5.00Estimated Selling Price 5,50,000 55.00
Sometimes, cost records for a particular period are given and the estimated cost ofmaterial and labour of a work order are provided for the purpose of ascertaining itsselling price to be quoted. In such a situation, you should prepare the cost sheet firstand ascertain the recovery rates for factory overheads as a percentage to direct wages,for administrative overheads as a percentage of works costs, and for selling anddistribution overheads as percentage of cost of goods sold or as suggested in the givenquestion. These rates must be duly adjusted with the anticipated changes, if any,before preparing the statement of quotation. Look at the following illustration andhow the statement of quotation for a work order is prepared with the help of a givecost data.
Illustration 4
The following figures have been obtained from the cost records of a manufacturingcompany for the year 2002 :
Cost of Materials 1,20,000Wages for Direct labour 1,00,000Factory overheads 60,000Distribution expenses 28,000Administration expenses 67,200Selling expenses 44,800Profit 84,000
A work order was executed in 2003 and the following expenses were incurred :
Cost of Materials 16,000Wages for labour 10,000
Assuming that in 2003 the rate for factory overheads went up 20%, distribution
charges went down by 10% and selling and administration charges went up by 12 21 ,
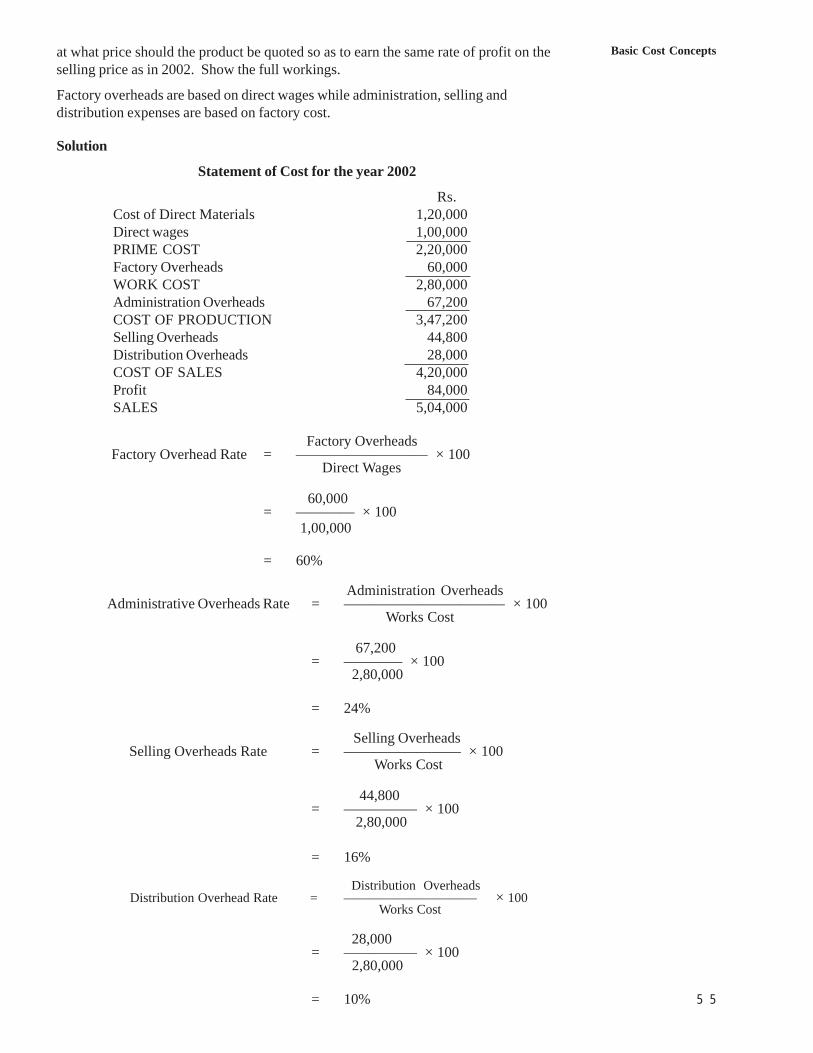
5 5
Basic Cost Conceptsat what price should the product be quoted so as to earn the same rate of profit on theselling price as in 2002. Show the full workings.
Factory overheads are based on direct wages while administration, selling anddistribution expenses are based on factory cost.
Solution
Statement of Cost for the year 2002
Rs.Cost of Direct Materials 1,20,000Direct wages 1,00,000PRIME COST 2,20,000Factory Overheads 60,000WORK COST 2,80,000Administration Overheads 67,200COST OF PRODUCTION 3,47,200Selling Overheads 44,800Distribution Overheads 28,000COST OF SALES 4,20,000Profit 84,000SALES 5,04,000
Factory Overheads Factory Overhead Rate = ————————— × 100
Direct Wages
60,000 = ———— × 100
1,00,000
= 60%
Administration Overheads Administrative Overheads Rate = ——————————— × 100
Works Cost
67,200 = ———— × 100
2,80,000
= 24%
Selling Overheads Selling Overheads Rate = ———————— × 100
Works Cost
44,800 = ————— × 100
2,80,000
= 16%
Distribution Overheads Distribution Overhead Rate = —————————— × 100
Works Cost
28,000 = ————— × 100
2,80,000
= 10%
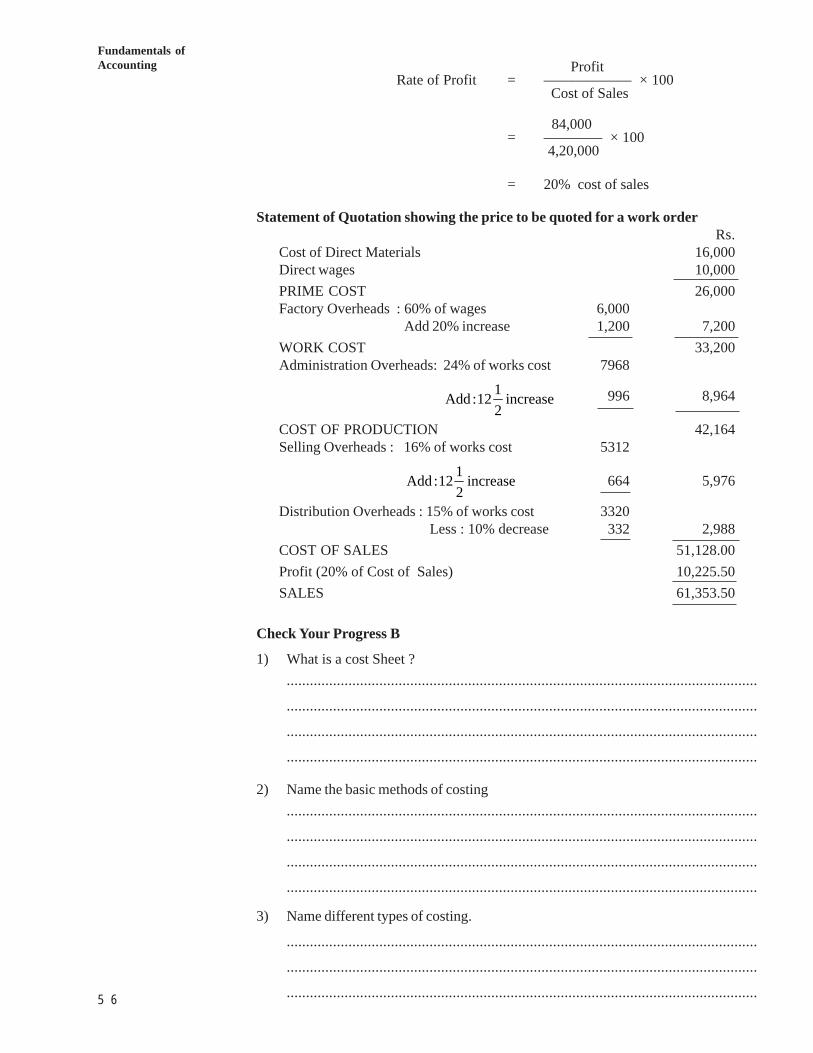
5 6
Fundamentals ofAccounting Profit
Rate of Profit = —————— × 100 Cost of Sales
84,000 = ———— × 100
4,20,000
= 20% cost of sales
Statement of Quotation showing the price to be quoted for a work orderRs.
Cost of Direct Materials 16,000Direct wages 10,000PRIME COST 26,000Factory Overheads : 60% of wages 6,000
Add 20% increase 1,200 7,200WORK COST 33,200Administration Overheads: 24% of works cost 7968
increase2112:Add 996 8,964
COST OF PRODUCTION 42,164Selling Overheads : 16% of works cost 5312
increase2112:Add 664 5,976
Distribution Overheads : 15% of works cost 3320 Less : 10% decrease 332 2,988
COST OF SALES 51,128.00Profit (20% of Cost of Sales) 10,225.50SALES 61,353.50
Check Your Progress B
1) What is a cost Sheet ?..........................................................................................................................
..........................................................................................................................
..........................................................................................................................
..........................................................................................................................
2) Name the basic methods of costing..........................................................................................................................
..........................................................................................................................
..........................................................................................................................
..........................................................................................................................
3) Name different types of costing.
..........................................................................................................................
..........................................................................................................................
..........................................................................................................................
5 7
Basic Cost Concepts4) What do you mean by quotation? Why is it necessary ?
..........................................................................................................................
..........................................................................................................................
..........................................................................................................................
5) State whether each of the following statement is True or False
i) Selling and distribution overheads are recovered on the basis ofpercentage to cost of production.
ii) Office and administrative overheads are recovered usually on the basis ofpercentage to factory cost.
iii) Factory overheads rate is usually calculated as a percentage of directwages.
iv) Cost of sales = Factory cost + Selling and Distribution overheads.v) Selling price = Cost of sales + Profit.
2.11 METHODS OF COSTINGBusiness enterprises are not alike. They are different from another in some way orother. The basic principles and procedures of costing remains the same in allindustries but the method of analysis and presentation of cost of their products andservices vary from industry to industry. Therefore, the choice of a particular methodof costing depends upon the nature and types of the product or service provided by abusiness unit. The various methods of costing can be summarized as follows :
2.11.1 Job CostingUnder this method, costs are ascertained for each job or work order separately. Thejob may consist of a single unit or it may consist of identical or similar products undera single work order. This method applies where work is undertaken againstcustomers’ requirements. Job costing is suitable to industries like printing, repairs,foundries, interior decorators, building construction etc. Non profit organisations likerehabilitation or street repair programmes also use job costing to ascertain cost ofindividual projects. It can also be used in industries where different product lines aremanufactured. For example, a furniture manufacturer may produce a batch of similarchairs, a batch of tables and so on. Each batch can be treated as a job for accountingpurposes. Job costing also found in service organisations like engineering,consultancy and accounting firms. Job costing procedure is the same both inmanufacturing and service organisations, except that service units use no directmaterial.
The purpose of job costing is to ascertain the cost of production of each job for fixingselling prices, bidding, controlling costs and evaluating performance. It also providesinformation for negotiating price increase with the customers.
2.11.2 Contract CostingThis method is used in case of big jobs and therefore, the principles of job costing areapplied to contract costing The contract work usually involves heavy expenditure,spreads over a long period and is usually undertaken at different sites. Hence, eachcontract is treated as a separate unit for the purpose of cost ascertainment and control.Contract costing is also termed as terminal costing as the cost can be terminated atsome point and related to a particular job. Contract costing is employed in businessundertakings engaged in construction of buildings, roads, bridges, ship building andother civil and mechanical engineering works.
5 8
Fundamentals ofAccounting
2.11.3 Batch CostingThis method of costing is used in industries where the production is carried on inbatches. Each batch consist of identical products which maintains its identitythroughout one or more stages of production. Each batch cost is used to determine theunit of cost of products. On completion of the batch the cost per unit can becalculated by dividing the ‘total batch cost’ by the number of units produced. Thismethod of costing is suitable to industries where production consists of repetitiveproduction in nature and specified number of products are produced in one batch. Itis generally used in industries like engineering component industry, pharmaceuticals,footwear, bakery, readymade garments, toy manufacturing, bicycle parts etc.
2.11.4 Unit CostingUnit Costing is a method of cost accounting where costs are determined per unit of asingle product. This method is also called single or output costing. This method issuitable to industries where production is continuous and uniform and engaging in theproduction of a single product in two or three varieties. The cost per unit is found bydividing the total cost by the total number of units produced. Where the product isproduced in different grades, costs are ascertained grad wise. It is suitable forindustries like collieries, quarries, brick works, flour mills, paper mills, cement, textilemills, diaries etc.
2.11.5 Process CostingWhere a product passes through different processes and each process is distinct andwell defined the method employed for ascertaining the cost at each stage of productionis called process costing. Process costing is used in those industries where theproduction is continuous and the final product is the result of sequence of operationsor processes. The finished product of one process will become the raw material of thenext process and the output of the last process will be the finished stock. The cost perunit at each process will be calculated by dividing the total cost by the number of unitsproduced at each stage and the cost per unit of the final product is the average cost ofall the processes. During the course of processing of raw material, loss of some rawmaterial is unavoidable or it may give rise to the production of several products calledjoint products or by products. Process costing is used in case of chemicals, paints,textiles, bakeries, oil refining, food products, etc. Standardization of processes helpsthe management to submit quotations in time without any delay. As actual andbudgeted costs are available in each process it facilitates managerial control byevaluating the performance at each process level.
2.11.6 Operating CostingOperating Costing is also called as ‘service costing’ because this method is used inthose undertakings which provide services and are not engaging in manufacturingtangible products. It is used for ascertaining the cost of operating a service such asrailways, roadways, airways, hotels, nursing homes, power supply, water supply etc.In these undertakings the cost unit is a service unit which is as follows:
Undertaking Cost UnitCanteen per cup of teaCinema per seatElectricity per kilo wattHospital per bedSchool/College per studentTransport per passenger kilometer/per tonne kilometer
5 9
Basic Cost ConceptsA large amount of capital is invested in fixed assets and comparatively lessworking capital is required in these industries. Operating costing is different fromoperation costing. Operating costing is used to determine the cost of providing aservice whereas operation costing is used to find out cost of each operationin those of industries which produce goods consisting of a number ofoperations.
2.11.7 Multiple Costing
It is an application of more than one method of costing in respect of the sameproduct. This method is suitable in industries where a number of components aremanufactured separately and then assembled into a finished product. In cases ofmotor car, type writer, television, refrigerators, etc., costs are to be ascertained foreach component as well as for finished product. This involves use of differentmethods of costing for different components and so it is known as ‘multiple’ or‘composite costingí.
2.11.8 Uniform Costing
The practice of using a common method of costing by a number of firms in the sameindustry is known as ‘uniform costing’. Thus it is not a separate method of costing. Itsimply refers to a common system using agreed concepts, principles and standardaccounting practices. This helps in making inter-firm comparisons and fixation ofprices.
It should be noted that there are two basic methods of costing. They are : (i) Jobcosting, and (ii) Process costing. The other methods discussed above are simplyvariants of these two methods.
2.12 TYPES OF COSTING
2.12.1 Marginal Costing
It is also known as Variable Costing. It may be defined which methods of costingrebers to the process and practice of ascertaining costs of products and serrices, thetypes of costing rebers to the techniqu of analysing and presenting costs for thepurpose of control and managerial decisions. The hypes of costing (also known astechniques of costing) generally used are as follows:
as ‘‘the ascertainment of marginal costs and of the effect on profit of changes involume or type of output by differentiating between fixed costs and variable costs.’’ Itis a technique of costing which emphasizes the distinction between product costs andperiod costs. Only variable costs (direct material, direct labour, other direct expensesand variable overheads) are allocated to products without taking into account fixedcosts. Fixed costs are treated as period costs and are charged to costing profit andloss account of the period in which they are incurred. The profitability of the productis based on the amount of contribution made by each product. Contribution is thedifference between selling price and marginal cost of sales. The price of a productwill be determined on the basis of marginal cost plus contribution. The differencebetween the total contribution and total fixed cost represents the profit (Profit =Contribution – Fixed cost).
The technique of marginal costing is a valuable tool to management in makingmanagerial decisions like fixation of selling price, selection of suitable product mix,selection of alternative methods of production, make or buy decisions, and also forcost control.
6 0
Fundamentals ofAccounting
2.12.2 Absorption Costing
Absorption costing is a principle whereby fixed as well as variable costs are allottedto cost units. It is a technique of charging all costs, both fixed and variable costs, toproduction of a product. Absorption costing does not require a break-down of costsinto fixed and variable costs. As such fixed costs are treated as product costs underabsorption costing. The reports prepared under absorption costing can be used forexternal use.
2.12.3 Historical Costing
It refers to a system of cost accounting under which costs are ascertained only afterthey have been incurred. In other words, accounting is done in terms of actual costsand not in terms of predetermined and standard costs. In the initial stages ofdevelopment of cost accounting, historical costing is the only system available forascertaining costs. This system is not useful for cost control and measuring theperformance efficiency of the concern. Moreover, it is not useful in price quotationsand production planning.
2.12.4 Standard Costing
It refers to the system of cost accounting under which costs are determined in advanceon certain predetermined standards. These are known as standards which indicate thelevel of costs that should be attained under a given set of operating conditions. Thestandard costs are compared periodically with the actual costs and underlying causesfor variances are analysed so that corrective action may be taken in time wherevernecessary. The Standard Costing is helpful to the management for cost control,production planning, formulation of policies, measuring efficiencies, eliminatinginefficiencies, etc.
2.13 LET US SUM UPCost data is required by an organisation for the purpose of ascertaining profit or lossperiodically, to plan its future operations as well as to evaluate its performance andcost control. It also requires to price its products or services, to value its inventory andday to day operations of plans and policies. Costs indicates (i) an actual or estimatedexpenditure (ii) a direct or indirect expenditure and (iii) it relates to a job, process,product or services. Cost is a flexible concept. It varies with time, volume, firm,method or purpose. There is difference between ‘cost’ and ‘loss’. Cost signifies anexpenditure incurred for recurring some benefit and if no benefit is desired from aparticular expenditure, it is treated as loss.
Cost can be classified in various ways. On the basis of functions to which they relate,costs are classified into manufacturing costs, administrative costs, selling anddistribution costs. On the basis of Identifiability with products costs can be classifiedinto direct costs and indirect costs. On the basis variability costs can be classified intofixed costs, variable costs and semi variable costs. Costs can also be classified on thebasis of product or period. Product costs are those costs which are easily attributableto products where as costs which are easily attribute to time interval are known asperiod costs. Costs can also be classified on the basis of controllable and non-controllable costs.
A cost unit is a unit of product, service or time in relation to which costs may beascertained or expressed. A cost centre is a location, person or item of equipment (orgroup of these) for which costs may be ascertained and used for the purpose ofcontrol. There are three elements of costs : (i) Materials (ii) Labour and (iii)
6 1
Basic Cost ConceptsExpenses. These costs can be further sub-dividend into as direct or indirect costs.Indirect costs are : indirect material, indirect labour, and indirect expenses. Indirectcosts are known as ‘overheads’. Overheads can be classified into factory overheads,office overheads, selling and distribution overheads.
The main components of total cost are prime cost, works cost, cost of production andcost of sales. The elements of cost can be presented in the form of a statement called‘cost sheet’ A cost sheet is a statement showing the various components of total costof output for a certain period which acts as a guide to pricing decisions and costcontrol. Overhead recovery rates are based on the cost sheet. Sometimes, a statementof quotations is required to be prepared in order to find out the price to be quoted tothe prospective buyer for obtaining a specific order. Such a price is quoted before thecommencement of actual production after taking into consideration the inflationarytrends in the price levels of various components of production.
There are various methods of costing. These are: (i) Job costing (ii) Contract costing(iii) Batch costing (iv) Unit costing (v) Process costing (vi) Operating costing (vii)Multiple costing (viii) Uniform costing. The types of costing refers to the techniquesof analysing and presenting costs for the purpose of control and managerial decisions.The types of costing generally used are: (i) Marginal costing (ii) Absorption costing(iii) Historical costing, and (iv) Standard costing.
2.14 KEY WORDSAllocation: Distribution of expenditure among various cost centres.
Costing: The technique and process of ascertaining costs.
Cost Sheet: A statement showing different elements of cost relating to a particularproduct or a job for a particular period.
Cost Centre: A location, person, equipment or department for which costs may beascertained and used for purpose of control.
Direct Expenses: Expenses or decrease in the same proportion on the increase ordecrease in the output.
Cost of Sales: Total cost of a product including selling and distribution expenses.
Prime Cost: Cost of direct expenses including direct materials and wages.
Semi-variable costs: Expenses which change with changes in output, but not in thesame proportion.
Works cost: Prime cost plus factory overheads.
Chargeable expenses: Other direct expenses.
By-product: A product of relatively small value produced incidentally fromprocessing the raw material for the main product.
Joint Product: Two or more products resulting from processing a particular rawmaterial.
Process Costing: A method of ascertaining the cost of a product at each stage orprocess of manufacturing.
Contract Costing: A special form of job costing applicable to big projects whichinvolves huge cost to complete and is usually site-based.
Job Costing: Specific order costing involving accumulation of costs relating to asingle cost unit - the job - when each order is of comparatively short duration.
6 2
Fundamentals ofAccounting 2.15 ANSWERS TO CHECK YOUR PROGRESS
A) 6 i) True (ii) False iii) True (iv) True (v) True (vi) False (vii)True
B) 4 i) False (ii) True iii) True iv) False v) True
2.16 TERMINAL QUESTIONS1) Distinguish among variable, fixed and semi-variable costs. Why is this distinc-
tion important?2) ‘‘fixed Costs are really variable. The more you produced the less they become’’.
Comment the statement.3) Describe briefly the different methods of costing and state the particular indus-
tries to which they can be applied.4) Distinguish between the following :
i) Product cost and period costii) Controllable and uncontrollable costiii) Variable and fixed costsiv) Direct and indirect costs
5) Costs may be classified according to their nature and characteristics’ Explain.6) Cooling Ltd manufactured and sold 1,000 refrigerators in the year ending 31st
March, 2002. The summarized Trading and Profit & Loss Account is set outbelow :
Rs. Rs.
To Cost of Sales 8,00,000 By Sales 40,00,000To Direct Wages 12,00,000To Other Manufacturing Cost 5,00,000To Gross Profit c/d 15,00,000
40,00,000 40,00,000To Management and Staff Salaries 6,00,000 By Gross Profit b/d 15,00,000To Rent, Rates and Insurance 1,00,000To Selling Expenses 3,00,000To General Expenses 2,00,000To Net Profit 3,00,000
15,00,000 15,00,000
For the year ending 31st March, 2003, it is estimated that
a) Output and sales will be 1,200 refrigerators.b) Prices of Material will go up by 20% on the level of previous year.c) Wages will rise by 5%d) Manufacturing costs will rise in proportion to the combined cost of Material and
wages.e) Selling cost per unit will remain unaffectedf) Other expenses will also remain constantYou are required to submit a statement to the Board of Directors showing the price atwhich the refrigerators should be marketed so as to show profit of 10% on sellingprice.
(Answer : Estimated selling price Rs. 51,00,000 Profit Rs. 5,10,000)
6 3
Basic Cost Concepts7) The following particulars have been made available from the Cost Ledger of aCompany :
Rs.Stock of Raw materials on 31.12.2000 25,600Stock of finished Goods on 31.12.2000 56,000Purchase of Raw materials 5,84,000Direct wages 3,97,000Sales 11,84,000Stock of Raw Materials on 31.12.2001 27,200Stock of Finished goods on 31.12.2001 60,000Works Overheads 88,072Office and general Charges 71,048
The company is required to submit a tender for a large machine. The CostDepartment estimates that the materials will cost Rs. 40,000 and wages to fabricatethe machine Rs. 24,000. The tender is to be made at a net profit of 20% on sellingprice.
Prepare a statement showing a) Cost of materials used, b) total cost, c) percentage offactory overheads to direct wages, and d) percentage of office overheads to workscost.
Also prepare a statement of quotation showing the price at which the tender of themachine can be submitted.
(Answer : Cost of materials used Rs. 5,82,400; Total Cost Rs. 11,38,520;Percentage of Factory overheads to Direct Wages 22%; Percentage of OfficeOverheads to Works Cost 6.65%; Price to be quoted in tender : Rs. 92,360)
Note : These questions will help you to understand the unit better.Try to write answers for them. But do not submit youranswers to the University. These are for your practice only.
2.17 SOME USEFUL BOOKSArora, M. N. 2000, A Text Book of Cost Accountancy. Vikas Publishing House Pvt.Ltd., New Delhi (Chapter 1-2).
Bhar, B. K. 1990. Cost Accounting : Methods and Problems. Academic Publishers,Calcutta (Chapter 1-2)
Maheswari, S. N. and Mittal, S. N. 1990. Cost Accounting : Theory and Problems.Shree Mahavir Book Dept, Delhi (Chapter I)
Nigam B. M. L. and Sharma G. L. 1990. Theory and Techniques of Cost Accounting.Himalaya Publishing House, Bombay (Chapter 1-3)
Owler. L. W. J. and J. L. Brown 1984. Wheldon’s Cost Accounting. ELBS, London(Chapter 1-2)
6 4
Fundamentals ofAccounting UNIT 3 FINANCIAL STATEMENTS
Structure
3.0 Objectives3.1 Introduction3.2 Natural of Financial Statements3.3 Contents of Financial Statements
3.3.1 Manufacturing Account3.3.2 Trading Account3.3.3 Profit and Loss Account3.3.4 Profit and Loss Appropriation Account3.3.5 Balance Sheet
3.4 Concept of Capital and Revenue3.5 Revenue Recognition
3.5.1 Revenue Recognition in Case of Sale of Goods3.5.2 Revenue Recognition in Case of Rendering of Services
3.6 Format of Financial Statements – Non-corporate Entities3.6.1 Conventional Format3.6.2 Vertical Format
3.7 Corporate Financial Statements3.7.1 Items Peculiar to Corporate Balance Sheet3.7.2 Items Peculiar to Corporate Income Statement
3.8 Requirements for Corporate Financial Statements as per Schedule VI3.9 Basic Principles Governing the Preparation of Financial Statements
3.10 Preparation of Corporate Financial Statements
3.11 Let Us Sum Up
3.12 Key Words
3.13 Terminal Questions
3.0 OBJECTIVESAfter studying this unit you should be able to:
l state the nature and contents of financial statements;l know the differences between capital and revenue;l know the prepration of non-corporate financial statements;l be acquainted with the items peculiar to corporate financial statements; andl prepare the profit and loss account and the balance sheet of a company as per the
requirements of the Companies Act.
3.1 INTRODUCTIONAccounting involves the collection, recording, classification and presentation offinancial data for the benefit of management and external agencies. For this purpose,the transactions recorded in the books of accounts are periodically summarised andpresented in the form of two financial statements. One is the Balance Sheet orPositional Statement and the other is Profit and Loss Account or Income Statement.
6 5
Financial StatementsThese are periodical reports which reflect the financial position and operating resultsof the entire business for an accounting period, generally one year. These financialstatements are the basis for decision making by the management as well as outsiders.However, the information presented in these statements must be analysed andinterpreted carefully before drawing conlcusions. In this unit we shall study thepreparation of financial statements both corporate and non-corporate entities as wellas the salient points involved in the preparation of these statements in the light ofSections 210 to 223 and Part I and II of Schedule VI of the Companies Act, 1956.
3.2 NATURE OF FINANCIAL STATEMENTSFinancial Statements are prepared by all forms of business organizations to ascertainthe result of operating, financial and investment activities and to know the financialposition on the date of closing of books of accounts. In case of sole trade or apartnership firm, maintenance and preparation of financial statements is notmandatory but desirable. However, in case of Joint Stock Company, Sections 209 and210 of the Companies’ Act 1956 make it obligatory and compulsory to maintain andprepare financial statements by the end of each accounting period. Thus, mainobjective of financial statements is to serve the information needs of users ofaccounting information. These financial statements are the basis for decision makingby the management as well as to the outsiders like investors and share holders,creditors and Financiers, government authorities, etc.
Objectives of Financial Statements
The primary objective of financial statement is to assist in decision making.These statements enable the users:
i) To make rational investment, credit and similar other financial decisions.ii) To estimate future cash flow and bankruptcy risk assessment.iii) To ascertain NAV (Net Assets Value) or Net worth of the enterprise after
evaluating the value of assets, resources owned and the claims thereon(liabilities) in order to make share purchase and sale decisions, takeovers andmerger decisions.
iv) Collective bargaining decision relating to wages, working conditions and job security.v) To make assessment of economic and financial decisions.(vi) To form appropriate taxation and subsidy policy, regulatory policy and
employment policy.
Besides, the financial statements are tools of judging earning capacity and managerialefficiency to facilitate comparison and help evaluate its own performance. Thus, theseprovide necessary inputs for forecasting and other relevant decision-making purposes.
According to American Institute of Certified Public Accountants “Financialstatements are prepared for the purpose of presenting periodical review or report onprogress by management and deal with the status of the investment in the business andthe results achieved during the period under review. Financial statements reflect acombination of recorded facts, accounting-conventions and the personal judgmentand the judgments and conventions applied affect them materially. The soundness ofthe judgments necessarily depends on the competence and integrity of those who makethem and on their adherence to generally accepted accounting principles andconventions.
Hence, these financial statements must give sufficient analysis of the figures, withoutunnecessary details to enable the users to understand its financial implications. Thiscalls forth for “convention of materiality” i.e. every material fact has to be disclosed
6 6
Fundamentals ofAccounting
which affect the decisions of the users of financial statements. It also demands thatany departure from previous year’s practice should clearly be indicated. In otherwords the “convention of consistency” should strictly be adhered to. An enterprise hasto be consistent with reference to depreciation policy, inventory valuation policy andother policy to facilitate horizonal and vertical comparison. Financial statements arebased on fundamental accounting assumptions of “going concern”, “consistency” andaccrual and are guided by major considerations governing the selection andapplication of accounting policies.
3.3 CONTENTS OF FINANCIAL STATEMENTS
3.3.1 Manufacturing Account
Business concerns engaged in the activities of manufacturing or production of goodswhich involves purchase of raw materials and in incurring of other manufacturingexpenses, prepare Manufacturing Account which shows the cost of raw materialsconsumed, cost of conversion of raw materials into finished product and the cost ofgoods produced. The cost of goods produced charged to Trading Account. The cost ofconversion includes–Direct Expenses, Frieght or Carriage Inward, direct labour.Productive wages/Factory wages and factory expenses, such as factory rent, fuel,power and gas, etc.
Cost of goods produced = Raw materials consumed + Cost of conversion
If, however, there is opening and closing work in progress due adjustment is madeaccordingly. Similarly, value of material residue, which is sold as scrap, is credited toManufacturing Account.
Thus, we can say
Cost of goods produced = opening work-in-progress = cost of raw materialsconsumed + cost of conversion – closing work inprogress – sale of scrap
Points to note regarding Manufacturing Account
1) Work in progress: It refers to the value of incomplete or semi-finished goodswhich includes cost of raw materials, and proportionate wages and direct ex-pense incurred till this stage of semi completion. Opening and closing balances ofthe same are shown to the debit and credit side respectively.
2) Raw materials consumed: This shows the cost of materials used in the produc-tion process. This is arrived at by Adding the net purchases to the openingbalance of raw materials and deducting the closing balance of raw materials athand by the end of accounting period.
3) Direct expenses: These expenses are incurred either on procurement or pur-chases of raw materials and on conversion thereof into finished product. Itincludes productive wages, freight inward, cartage or carriage inward, etc. Thatis, it includes direct labour and direct expenses (factory).
4) Factory overheads or indirect expenses: Factory overheads refer to indirectmaterial, indirect labour and indirect expenses. These include cotton waste,lubricating of machine oil, works manager, supervisor or foreman’s salary, fueland power, repairs and maintenance of factory machine, depreciation of factoryassets, rent, rates and taxes of the factory building, factory insurance, etc.
5) Scrap: It denotes the value of material residue coming out of certain types ofprocesses. It is sold as scrap and credited to Manufacturing Account to arrive atthe correct cost of production.
6 7
Financial Statements6) Cost of production: Manufacturing Account ascertains the cost of goodsmanufactured during any accounting period as shown in the format of Manufac-turing Account. The cost of production of goods produced is transferred toTrading Account.
3.3.2 Trading Account
Trading Account is prepared to know the result of trading operations. It shows thegross profit or gross loss arising from buying and selling of goods in which thebusiness enterprise deals in. Gross profit or gross loss is the difference between ‘sales’and ‘cost of goods sold’.
Cost of goods sold = opening stock + purchases (less returns) + direct expenses – closing stock
It is to be noted that Trading Account shows the result of trading operations undernormal conditions only. Abnormal losses (items) if any – such as loss of stock due tofire, theft or accident are credited to Trading Account, at cost.
Analysis of Items Appearing to the Debit Side of Trading Account
1) Opening Stock: It refers to the value of goods at hand at the end of lastaccounting year. It becomes the opening stock for the current accounting year. Itrepresents the value of goods in which business deals in.
2) Purchases: It denotes the value of goods (in which the concern deals in) purchasedeither for cost or on credit for the purpose of resale. However, if the goods sopurchased are returned or used by proprietor for self consumption, or distributed asfree samples or taken up by the employer for their use, or given as charity, or to besent on consignment, or used for any other purpose, except for resale, such amountsshall be deducted from the total purchases.
3) Director Expenses: These expenses are incurred in connection with purchase,procurement or production of goods. It also includes expenses which bring the goodsup to the point of sale. Examples of direct expenses are:
a) Carriage Inwards (carriage paid on purchases)b) Freight – Railways, Airways and Shippingc) Transit – Insuranced) Loading chargese) Packingf) Import dutyg) Export dutyh) Custom dutyi) Dock duesj) Octroik) Warehousing wages
However, for a manufacturer in addition to above direct expenses include –
l) Wages and salariesm) Fuel, coal, power, gas and watern) Factory heating*o) Factory insurance*p) Factory lighting*
6 8
Fundamentals ofAccounting
q) Foreman’s and Supervisor’s salary*r) Other factory expenses*s) Royalty on production*t) Depreciation on Factory Building and machine*
* These are also known as Factory overheads or Factory indirect expenses from costaccounting point of view but for financial accounting purposes these are treated asdirect expenses.
It is to be noted that a manufacturer prepares a Manufacturing Accountwhere all the above mentioned direct expenses are debited. However, if inany case Manufacturing Account is not prepared, then all such expenseswill be charged to Trading Account.
Analysis of Items Appearing to the Credit Side of Trading Account
1) Sale: It refers to the sale of goods in which business deals and includes both cashand credit sales. It does not include sale of old, obsolete or depreciated assets whichwere acquired for use in business. Similarly, goods returned by customers or goodssent to customers on approval basis or sales tax, if any, included in sales price shouldbe excluded.
2) Abnormal Loss: It refers to abnormal loss of stock due to fire, theft or accident.Since Training Account is prepared under normal conditions of the business, abnormalloss, if any, is credited fully to the Trading Account.
3) Closing Stock: It refers to the value of goods lying unsold at the end of anyaccounting year. The stock at the end is valued either at cost or market price,whichever is less. Since Trial Balance generally does not include closing stock, thefollowing entry is recorded to incorporate the effect of closing stock in the TradingAccount.
Closing Stock A/c Dr To Trading A/c
However, if closing stock forms the part of Trial Balance it will not betransferred to Trading Account but taken to Balance Sheet only.
In case goods have been sent to customer on approval (Sale/Return) basis, such goodsshould be included in the value of closing stock if no approval has been received fromthem.
Constituents of closing stock are:
i) Stock of Raw materialsii) Work-in-progress or semi-finished goodsiii) Finished goods – remaining unsold at the end of the year,
– lying unsold at different branches, if any,– lying unsold with the consignee
iv) Stores supplies = goods, materials required for converting the raw materialsinto finished product, such as machine oil, cotton waste,chemicals and machine spares (as per As-2)
6 9
Financial StatementsPoints to Remember
l It is to be noted that Income Statement + (viz. Manufacturing/Trading/Profit and Loss Account) is parepared on Accrual)(Mercantile) basis (Accrual concept) covering an accounting period(accounting period concept) during which expenses are matched withrevenue (Matching Concept) to ascertain the profit or loss of anenterprise. That is why unpaid expenses are added as outstanding inthe Income Statement and shown as liability in the Balance Sheet.Similarly income accrued but not received are credited to IncomeStatement and shown as asset in the Balance Sheet.
l It is important to remember that “Outstanding” Accrued or “Prepaid”,if forming part of Trial Balance, then such items will be shown in theBalance Sheet only and no treatment required in the IncomeStatement.
l Conversely, “prepaid expenses” are shown by way of deduction inthe Income Statement and treated as an asset in the Balance Sheet,whereas income received in advance are subtracted from the incomereceived and shown as a liability in the Balance Sheet.
3.3.3 Profit and Loss AccountThis account is prepared to ascertain the net profit earned or net loss incurred by thebusiness concern during an accounting period. It starts with gross profit or gross lossas disclosed by the Trading Account. It takes into account all the remaining direct(normal and abnormal) expenses and losses related to or incidental to business. Theseoperating and non-operating expenses are charged to Profit and Loss Account andshown to the debit side of the Profit and Loss Account.
The operating expenses include:
i) All office or Administrative overheads such as rent, rates and taxes, office staffsalaries, printing and stationary, postage, telephone, office lighting, depreciationon office equipment, etc.
ii) Selling and Distribution overheads such as Salesmen’s salaries, commission onsales, travelling expenses, advertisement and publicity, trade expenses, carriageoutward, bad debts, warehouse expenses, delivery van expenses, packing ex-penses and rebate to customers.
Non-operating expenses include financial expenses such as interest, bankcharges, discount on bill, abnormal losses (loss of goods due to fire, theft oraccident) and loss on sale of fixed assets, etc.
Whereas Non-operating incomes include income from investment and financingactivities, such as Interest Received, Rent Received, Dividend Received, Profiton Sale of Investment, and Insurance Claims and other Miscellaneous Receipts,like duty drawback and subsidy and apprenticeship premiums, etc. Theseincomes are credited to Profit and Loss Account.
It is to be noted that if an enterprise prepares a Manufacturing Account, the factoryexpenses (both direct and indirect) are charged to Manufacturing Account. If aManufacturing Account is not prepared, then direct factory expenses are charged to
7 0
Fundamentals ofAccounting
Trading Account and indirect factory expenses to Profit and Loss Account. Royalltiespaid on production should be treated as direct expenses and royalties based on salesas indirected expenses.
Some Important Points
1) Salaries: Salaries paid/payable to employees including Directors’ salaries,Managers’ salaries (except Work Managers salaries) should be debited toManufacturing Account. In case a concern does not prepare ManufacturingAccount, the same should be charged to Trading Account. Similarly, salaries andwages should also be charged to Profit and Loss Account. But wages andsalaries be charged to Trading Account.
2) Brokerge: This refers to brokerage paid on the items in which the businesstrades in. Such as brokerage on buying and selling of goods in which the enter-prise deals in is shown to the debit of Profit and Loss Account. However, anybrokerage paid on sale or purchase of assets is treated as of capital nature andhence it is deducted from sale proceeds of the asset sold or added to the cost ofthe asset required.
3) Trade Expenses: These expenses are of miscellaneous nature and ofsmall amount and sometimes termed as Sundry expenses or Miscellaneousexpenses or even Petty expenses. These are debited to Profit andLoss Account.
4) Advertisement: Expenses on advertisement which are of revenue and recurringnature are charged to Profit and Loss Account. Whereas cost of heavy advertise-ment the benefit of which is likely to cover more than one accounting year istreated as deferred revenue expenditure. For example, a company incursRs. 1,00,000 on advertisement and it is estimated that the benefit of thisadvertisement expenditure is likely to extend over a period of four years. In thiscase Rs. 25,000, i.e. one-fourth of total cost of advertisement will be charged tocurrent year’s Profit and Loss Account whereas three-fourths, i.e. Rs. 75,000,will be taken to Balance Sheet to be treated as ‘Deferred Revenue Expenditure’.However, advertisement expenses incurred for purchase of goods should becharged to Trading Account. Advertisement expenses paid for acquiring a capitalasset are capitalised. Again, cost of advertisement in respect of sale of anycapital asset is deducted from the sale proceeds of the asset concerned and hencenot charged to profit and loss account.
5) Rebate to Customers: It is an allowance given to a customer when hispurchases from the concern exceeds the certain limits say Rs. 200. In such casesall those customers who make purchases from the company exceeding Rs. 200will be entitled to rebate of 1% or 2% depending upon the policy declaredby the company. The amount of rebate so allowed is charged to Profit and LossAccount.
6) Duty drawback and subsidy: It is a refund of duties levied on purchases madeby exporter. It serves as an incentive to exporter. The duty drawback and cashsubsidy should be deducted from the purchases. But in practice it is treated as‘income’.
7) Apprenticeship Premium: It is the fee charged by the business enterprise to trainpersons in various trades. It is treated as revenue receipts and credited to Profitand Loss Account.
8) Factory Expenses: Factory expenses are of two types, viz. direct and indirect,and both are shown in the Manufacturing Account. If a concern does not prepareManufacturing Account, then direct expenses are charged to Trading Accountand indirect expenses are debited to Profit and Loss Account.
7 1
Financial Statements9) Royalties: Royalties are paid by the business concerns to the landlord, author ofa patentee for the right to use their land, copyrights or patents right. Payment ofsuch royalty sum based on sales is debited to Profit and Loss Account.However, if royalty is paid on the basis of production, it is charged to TradingAccount.
10) Free Samples and Publicity Expenses: These expenses are incurred to attractcumtomers for increasing the volume of sale and as such are charged to Profitand Loss Account. Similarly, money spent on prizes given to customers under thescheme of ‘sales promotion’ such as ‘Bumper sales’, ‘Dhamaka sales’ are treatedas selling and distribution expenses. If a large sum is incurred on heavyadvertisement under a contract or whose benefits may accrue over a period ofmore than one year, say four years, such expenses are spread over the period ofits benefits and a proportionate part is charged to Profit and Loss Account andremaining is taken to Balance Sheet as deferred revenue expenditure.
11) Abnornal Losses and Insurance Claims: As a rule, the entire amount ofabnormal losses either arising from accident, fire or tgheft are credited toTrading Account and debited to profit and loss account irrespective of theinsurance claims. The amount so received/settled/receivable from the insurancecompany is credited to Profit and Loss Account.Alternatively, Trading Account may be credited with the net abnormal loss(abnormal loss insurance claim, if any) and insuracne claims and Profit and LossAccount may be debited by net abnormal loss only.
3.3.4 Profit and Loss Appropriation Account
This account shows the distribution or appropriation of profit after the same has beenearned and computed. In case of sole proprietor, since entire amount of profit belongsto him, no Profit and Loss Appropriation is prepared. However, this account isprepared by partnership firms and Joint Stock Companies where there are severalclaimants in the net profit. A partner shares earnings of the firm in the form of salary,commission, interest and profit and credited to Profit and Loss AppropriationAccount.
However, a company’s Profit and Loss Appropriation account shows the transfer fromProfit and Loss Account an amount equivalent to “currnet year’s profit after tax”.This account is further credited by the reserves and provisions made last year, now nolonger required, such as Development Rebate Reserve and Provision for Tax, etc. Thefollowing items are debited to Profit and Loss Appropriation Account:
– Transfer to General Reserve– Transfer to Capital Reserve– Dividend Paid– Proposed Dividends– Bonus to Shareholders– Excess of actual tax liability over the provisions made last year– Corporate Dividend Tax, if any.
However, a detailed explanation of Profit and Loss Appropriation Account is to bemade under Corporate Financial Statements under 3.7 of this unit.
3.3.5 Balance SheetBalance sheet is a statement of assets and liabilities which helps us to ascertain thefinancial position of a concern on a particular date, i.e. on a date when financial
7 2
Fundamentals ofAccounting
statements or final accounts are prepared or books of accounts are closed. In fact, ittreats the balances of all those ledger accounts standing to the debit or credit columnof the Trial Balance and which have not been squared up. These accounts relate toassets owned, expensed incurred but not paid or not due, expenses due but not paid,incomes accrued but not received or certain receipts which are not due or accrued. Infact it deals with all those “real” and “personal accounts” which have not beenaccounted for in the Manufacturing, Trading and Profit and Loss Accounts. Besides,the balance sheet also treats all those items in the adjustments, whch affect Real orPersonal Accounts. The Nominal Accounts are treated in the Income Statement(P&L A/c). A Balance Sheet aims to ascertain nature and amount of different assetsand liabilities so that the financial position could clearly be known to all thoseconcerned. Thus, the main function of the Balance Sheet is to depict the true picture ofthe concern on a particular date.
Preparation and Presentation of Balance SheetThe process of preparation and presentation of balance sheet involves two steps:(i) Grouping and (ii) Marshalling. The first step refers to proper grouping of thevarious items, which are of similar nature. For example, amount due from personswho were sold goods on credit basis must be shown under the heading ‘TradeDebtors’ and must be distringuished from money owing other than due to credit salesof goods. The second step involves ‘marhsalling’ of assets and liabilities. It meansorderly arrangement in which assets and liabilities are presented or shown in theBalance Sheet. There are two methods of presentation: (i) In order of “Liquidity, and(ii) In order of “permanence”.
Under the “Liquidity Order”, assets are shown on the basis of liquidity or realisability.These are arranged in order of “most liquid”, more liquid”, “liquid”, “least liquid” and“not liquid” (fixed) assets. Similarly, liabilities are arranged in the order in whichthese are to be paid or discharged. The liquility form is suiable for banking and otherfinancial companies.
Under the ‘‘Order of Permanence”, the assets are arranged on the basis of their usefullife. The assets which are to serve business for the longest period of time are shownfirst, i.e. Fixed Assets, Semi Fixed, Current, Liquid and Most Liquid. Similarly, incase of liabilities, after Capital, the liabilities are arranged as long term, medium term,short term and current liabilites. The Companies Act has adapted permanency formpreparing balance sheet.
Some Important Items1) Fixed Assets: Fixed assets are those assets, which are reuired for the purposes of
producing goods or rendering services. These are not held for resale in normalcourse of business. Fixed assets are used for the purpose of earning revenue andthese are held for a longer period of time. These are also treated as ‘Gross Block’(Fixed assets after depreciation) and ‘Net Block’ (Fixed assets after deprecia-tion). Investment in these assets is known as ‘Sunk Cost’. Examples of fixedassets are Land and Building, Plant and Machinery, Furniture and Fixtures,Tools and Equipments, Motor Vehicles, etc. All fixed assets are ‘tangible’ bynature.
2) Intangible Assets: Intangible assets are those capital assets which do not haveany physical existence. Though cannot be touched or seen yet they have long lifeand help to generate income. Such assets have value by virtue of the rightsconferred upon the owner by mere possession. Goodwill, trademarks, copyrightsand patents are the examples of intengible assets.
3) Current Assets: Current assets include cash and other assets which are con-verted or realized into cash within a normal operating cycle or say within a year.
7 3
Financial StatementsThese are acquired either for the purpose of resale, or assisting and helpingprocess of production or rendering of service or supplying of goods. These assetsconstantly keep on changing their form and contribute to routine transactions andoperations of business. Examples are, Cash in Bank, Bills Receivables, Debtors,Stock, Prepaid Expenses, etc. Current assets are also known as floating assets orcirculating assets.
4) Liquid or Quick Assets: Those current assets whch can be converted into cashat a very short notice or immediately without incurring much loss or exposing tohigh risk. Quick assets can be worked out by deducting Stock (Raw materials,work in progress or finished goods) and prepaid expenses out of total current assets.
5) Fictitious Assets: These are the non-existent worthless items which representunwritten off losses or cost incurred in the past which cannot be recovered infuture or realized in cash. Examples of such assets are preliminary expenses(formation expense), Advertisement suspense, Underwriting - commission,discount on issue of shares and debentures, Loss on issue of debentures and debitbalance of Profit and Loss Account. These fictitious assets are written off orwiped out by debiting to Profit and Loss Account.
6) Wasting Assets: Assets with limited useful life by nature deplete over a limitedperiod of time are called wasting assets. These assets become worthless once itsutility is over or exhaust fully. Such assets are natural resources like, timer, coaloil, mineral deposits, etc.
7) Contingent Assets: Contingent assets are probable assets which may or may notbecome assets as it depends upon occurrence or non-occurrence of a specifiedevent or performance of a specified act. For example, a suit is pending in thecourt of law against ownership title of any dispsuted property and if the suit isdecided in favour of the business concern it becomes the asset of the concern. Onthe other hand, if the decision goes against the concern, the company cannotclaim to enjoy ownership rights. Thus, it remains a contingent asset as long asthe judgment is not pronounced by court. Such assets are shown by means offootnote and hence do not form part of assets shown in the Balance Sheet. Besidethis hire purchase contract, uncalled share capital etc. are the other examples ofcontingent assets.
8) Classification of Liabilities
Long Term Liabilities: These are the obligations which are to be met by the businessenterprise after a relatively long period of time. Such liabilities do not become due forpayment in the ordinary course of business operation or within normal operatingcycle. Debentgures, long term loans from Bank or financial institutions are theexamples of long-term liabilities.Current Liabilities: Current liabilities are those liabilities which are payable withinnormal operating cycle, i.e. within an accounting year. These may arise either out ofrealization from current assets or by creating fresh current liability (obligation). Tradecreditors, Bill payable, Bank overdraft, Outstanding expenses, Short-term loan(payable within twelve months or within accounting year) are examples of currentliabilities.Contingent Liability: It is not an actual liability but an anticipated (probable liabilitywhich may or may not become payable). It depends upon happending of certain eventsor performance of certain acts. An element of uncertainty is always attached. Acontingent liability, thus, may or may not become a sure liability. Examples are,liability for bills discounted, liability for acting as surety, liability arising on a suit fordamages pending in the court of law, liability for calls on partly paid shares, etc.Contingent liabilities are shown as footnote under the Balance Sheet.
7 4
Fundamentals ofAccounting 3.4 CONCEPTS OF CAPITAL AND REVENUE
You know that a firm prepares Profit and Loss Account for ascertaining the net resultof business operations and the Balance sheet for determining the financial position ofthe business. These are prepared with the help of Trial Balance which shows the finalposition of all ledger accounts. All items appearing in the Trial Balance are transferrdeither to the Profit and Loss Account or to the Balance Sheet. As per rules, the itemsof revenue nature are taken to the Profit and Loss Account and the items of capitalnature are shown in the Balance Sheet. In other words whether an item appearing inthe Trial Balance is to be taken to the Profit and Loss Account or the Balance Sheetdepends upon the capital and revenue nature of the item. If any item is wronglyclassified i.e., if an item of revenue nature is treated as a capital item or vice versa, theProfit and Loss Account will not reveal the correct amount of profit and the BalanceSheet will not reflect the true and fair view of the affairs of the business. It is thereforenecessary to determine correctly whether an item is of capital nature or of a revenuenature and record it in the books accordingly. There are certain rules governing theallocation of expenditures and receipts between capital and revenue which should beclearly understood.
Capital and Revenue ExpendituresYou incur expenditure on various items every day. You buy food items, stationery,cosmetics, utensils, furniture, etc. Some of them are consumables and some aredurables. The benefit of expenditure on consumables like stationery, cosmetics, etc. isderived over a short period. But in case of durables like furniture, utensils, etc., thebenefit spreads over a number of years. Same is true of business also. In business youincur expenditure on two types of items: (i) routine items like stationery, and (ii) fixedassets like machinery, builing, furniture, etc., whose benefit is available over a numberof years. In accounting terminology the first category of expenditure is called revenueexpenditure and the second one is called capital expenditure. Let us now study theexact nature of capital and revenue expenditures.
Capital Expenditure: As stated above, when the benefit of an expenditure is notexhausted in the year in which it is incurred but is available over a number of years itis considered as capital expenditure. The following expenditures are usually treated ascapital expenditures:1) Any expenditure which results in the acquisition of fixed assets such as land,
buildings, plant and machinery, furniture and fixures, office equipment,copyright etc. you should note that such capital expenditure includes not only thepurchase price of the fixed asset but also the expenses incurred in connectionwith their acquisition. Thus, the brokerage or commission paid in connectionwith the acquisition of an asset, the freight and cartage paid for transportation ofmachinery, the expenses incurred on its installation, the legal fees andregistration charges incurred in connection with purchase of land and buildingsare also treated as capital expenditure.
2) Any expenditure incurred on a fixed asset which results in (a) its expansion,(b) substantial increase in its life, or (c) improvement in its revenue earningcapacity. Improvement in the revenue earning capacity can be in the form of(i) increased production capacity, (ii) reduced cost of production, or(iii) increased sales of the firm. Thus, cost of making additions to buildings andthe amount spent on renovation of the old machinery are also regarded as capitalexpenditures. If you buy a second hand machinery and incur heavy expenditureon reconditioning it, such expenditure is also to be treated as capital expenditure.Similarly, expenditure on structural improvements or alterations to existing fixedassets whereby their revenue earning capacity is increased, is also treated ascapital expenditure.
7 5
Financial Statements3) Expenditure incurred, during the early years, on development of mines and landfor plantations till they become operational.
4) Cost of experiments which ultimately result in the acquisition of a patent. Thecost of experiments which are not successful is not to be treated as capitalexpenditure. It is treated as a deferred revenue expenditure which is written offwithin two to three years.
5. Legal charges incurred in connection with acquiring or defending suits forprotecting fixed assets, rights, etc.
Revenue Expenditure: When the benefit of an expenditure is not likely to beavailable for more than one year, it is treated as revenue expenditure. So all expenseswhich are incurred during the regular course of business are regarded as revenueexpenditures. The examples of such expenses are:
1) Expenses incurred in day-to-day conduct of the business such as wages, salaries,rent, postage, stationery, insurance, electricity, etc.
2) Expenditure incurred for buying goods for resale or raw materials formanufacturing.
3) Expenditure incurred for maintaining the fixed assets such as repairs andrenewals of building, machinery, etc.
4) Depreciation on fixed assets. This can also be termed as revenue loss.
5) Interest on loans borrowed for running the business. You should note thatany interest of loan paid during the initial period before productioncommences, is not treated as revenue expenditure. It is treated as capitalexpenditure.
6) Legal charges incurred during the regular course of business such as legalexpenses incurred on collection from debtors, legal charges incurred ondefending a suit for damages, etc.
Deferred Revenue Expenditure
Sometimes, certain expenditure which is normally treated as revenue may beunusually heavy and its benefit is likely to be available for more than one year. In sucha situation, it is considered appropriate to spread the cost of the expenditure over anumber of accounting years. Hence, it is capitalised and only a portion of the totalamount spent is charged to the Profit and Loss Account of the current year. Thebalance is shown as an asset which wil be written off during the subsequentaccounting years. Such expenditure is called a Deferred Revenue Expenditure becauseits charge to Profit and Loss Account has been deferred to future years. Some exampleof such expenditure are:
1) Expenditure incurred on advertising campaign to introduce a new product in themarket.
2) Expenditure incurred on formation of a new company (preliminary expenses)
3) Brokerage charges, underwriting commission paid and other expenses incurred inconnection with the issue of shares and debentures.
4) Cost of shifting the plant and machinery to a new site which may involvedismantling, removing and re-erection of the plant and machinery.
Let us take the case of expenditure on advertising campaign. It is not a routineadvertisement and the amount involved is unusually heavy. Its benefit will notcompletely exhaust in one accounting year but will contunue over two to three years.Hence, it is not proper to charge such expenditure to the Profit and Loss Account of
7 6
Fundamentals ofAccounting
one year. It is better to distribute it carefully over three years. So, in the first year wemay charge one-third of the amount spent to the Profit and Loss Account and showthe balance in the Balance Sheet as an asset. In the second year again we may chargea similar amount to the Profit and Loss Account and show the balance as an asset. Inthe third year. we may charge this balance to the Profit and Loss Account. Everyexpenditure which is regarded as deferred revenue is treated in this way in the finalaccounts.
Look at Illustration 1 and note how each expenditure has been treated and why.
Illustration 1
State whether the following items of expenditure would be treated as (a) capitalexpenditure, (b) revenue expenditure, or (c) deferred revenue expenditure:
i) Carriage on goods purchased Rs. 25.
ii) Rs. 2,000 spent on repairs of machinery.
iii) Rs. 5,000 spent on white washing.
iv) Rs. 8,000 paid for import duty and cartage on the purchase of machinery fromwest Germany.
v) Rs. 25,000 spent on issue of equity shares.
vi) Rs. 14,000 spent on spreading new tiles on factory floors.
vii) Rs. 4,000 spent on dismantling, transportation and reinstalling plant andmachinery to new site.
viii) Rs. 60,000 spent on construction of railway siding.
ix) Rs. 20,000 spent on some major alterations to a theatre which made it morecomfortable and attractive.
x) A second hand maching was bought for Rs. 10,000 and an amount of Rs. 6,000was spent on its overhauling.
Solution
i) It is a revenue expenditure as it relates to the goods for resale.
ii) It is a revenue expenditure as it relates to the maintenance of a fixed asset.
iii) Same as no. (ii).
iv) It is a capital expenditure as it is spent in connection with the purchase of a fixedassets.
v) It would be treated as deferred revenue expenditure. It is a heavy amount in-curred in connection with reising of capital for the company and so capitalised.Even under the Indian Companies Act and the Indian Income Tax Act thisexpenditure is allowed to be written off over a number of years.
vi) It is a revenue expenditure so it is treated as a sort of repairs not leading to anyincrease in the earning capacity of a fixed asset.
vii) Normall expenditure on transportation etc. is revenue in nature. But this expendi-ture has been incurred on shifting to new site which is non-recurring in natureand involves a heavy amount. Hence it shall be treated as a deferred revenueexpenditure.
viii) It is a capital expenditure as it is incurred on the construction of railway siding, afixed asset.
7 7
Financial Statementsix) It is a capital expenditure as the alterations made the theatre more comfortableand attractive which is likely to increase its collections.
x) It is a capital expenditure as it is incurred on making the newly bought secondhand machinery operational.
Capital and Revenue Receipts
Receipts refer to amounts received by a business i.e., cash inflows. Receipts may beclassified as Capital Receipts and Revenue Receipts. It is necessary to note thisdistinction clearly because only the revenue receipts are taken to the Profit and LossAccount and not the capital receipts.
Capital Receipts: Capital receipts are the amounts received in the form of (a)additional capital introduced in the business, (b) loans received, and (c) sale proceedsof fixed assets. You are aware that a loan taken by the business is repayable sooner orlater. Similarly, additional capital received represents an increase in the proprietor’sclaim over the business assets. Thus these two items represent increase in liabilities ofthe business and obviously are not incomes or revenues. These are capital receipts andshould be treated as such. The sale proceeds of a fixed asset are also treated as acapital receipt because the amount received is not revenue earned in the normal courseof business. The capital receipts increase the liabilities or reduce the assets. They donot affect the profit or loss.
Revenue Recipts: Revenue receipts are the amounts recived in the normal and regualrcourse of business. They take the form of (a) sale proceeds of goods, and (b) incomessuch as interest earned, commission earned, rent received, etc. These receipts are onaccount of goods sold or some services rendered by the business and as such they arenot repayable. All revenue receipts are treated as incomes and shown on the credit sideof the Profit and Loss Account.
3.5 REVENUE RECOGNITIONRevenue arises in the ordinary course of business activities of an enterprise from:– sales of goods,– rendering of services, and– use by others of enterprise resources yielding interest, royalties and dividends.
Revenue recognition is mainly concerned with the timing of recognition revenue in thestatement of profit and loss. According to AS-9, “revenue is the gross in flow of cash,receivables, or other consideration arising in the course of ordinary activities of anenterprise.”
The basic problem of revenue recognition lies in identifying of the “accountingperiod” during which revenues are earned. There are several stages or activities in abusiness before the revenues are earned and realized. Hence the problem arises –should revenue be recognized at the point of production, sale, delivery or receipt ofcash. According to “Realisation Concept” revenues are recognized at the point ofsale or services are rendered. However, there is no single uniform practice torecognize various types of revenues according to one common principle. There areguidelines, which help us in recognizing operating revenues and non-operatingrevenues. Non-operating revenues include interest, dividend and rent and otherincomes which are not related to normal course of operation of the enterprise.It is advisable to show operating and non-operating revenues separately in theProfit and Loss Account.
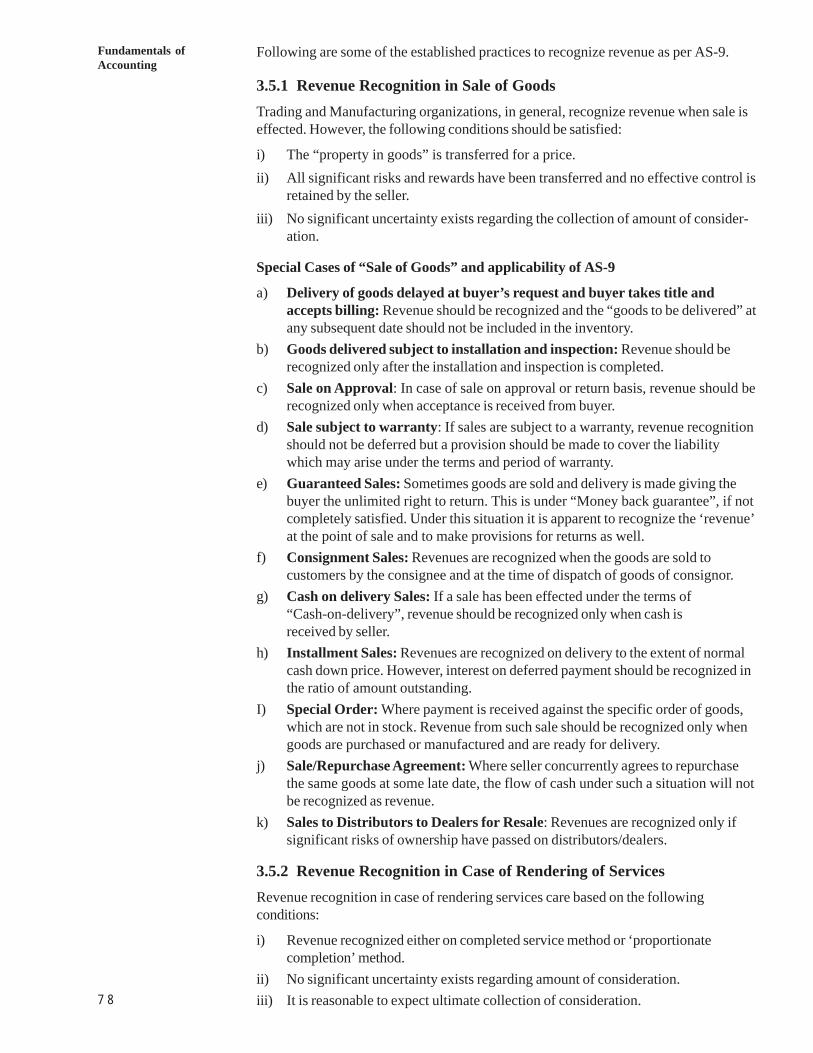
7 8
Fundamentals ofAccounting
Following are some of the established practices to recognize revenue as per AS-9.
3.5.1 Revenue Recognition in Sale of GoodsTrading and Manufacturing organizations, in general, recognize revenue when sale iseffected. However, the following conditions should be satisfied:
i) The “property in goods” is transferred for a price.ii) All significant risks and rewards have been transferred and no effective control is
retained by the seller.iii) No significant uncertainty exists regarding the collection of amount of consider-
ation.
Special Cases of “Sale of Goods” and applicability of AS-9
a) Delivery of goods delayed at buyer’s request and buyer takes title andaccepts billing: Revenue should be recognized and the “goods to be delivered” atany subsequent date should not be included in the inventory.
b) Goods delivered subject to installation and inspection: Revenue should berecognized only after the installation and inspection is completed.
c) Sale on Approval: In case of sale on approval or return basis, revenue should berecognized only when acceptance is received from buyer.
d) Sale subject to warranty: If sales are subject to a warranty, revenue recognitionshould not be deferred but a provision should be made to cover the liabilitywhich may arise under the terms and period of warranty.
e) Guaranteed Sales: Sometimes goods are sold and delivery is made giving thebuyer the unlimited right to return. This is under “Money back guarantee”, if notcompletely satisfied. Under this situation it is apparent to recognize the ‘revenue’at the point of sale and to make provisions for returns as well.
f) Consignment Sales: Revenues are recognized when the goods are sold tocustomers by the consignee and at the time of dispatch of goods of consignor.
g) Cash on delivery Sales: If a sale has been effected under the terms of“Cash-on-delivery”, revenue should be recognized only when cash isreceived by seller.
h) Installment Sales: Revenues are recognized on delivery to the extent of normalcash down price. However, interest on deferred payment should be recognized inthe ratio of amount outstanding.
I) Special Order: Where payment is received against the specific order of goods,which are not in stock. Revenue from such sale should be recognized only whengoods are purchased or manufactured and are ready for delivery.
j) Sale/Repurchase Agreement: Where seller concurrently agrees to repurchasethe same goods at some late date, the flow of cash under such a situation will notbe recognized as revenue.
k) Sales to Distributors to Dealers for Resale: Revenues are recognized only ifsignificant risks of ownership have passed on distributors/dealers.
3.5.2 Revenue Recognition in Case of Rendering of ServicesRevenue recognition in case of rendering services care based on the followingconditions:
i) Revenue recognized either on completed service method or ‘proportionatecompletion’ method.
ii) No significant uncertainty exists regarding amount of consideration.iii) It is reasonable to expect ultimate collection of consideration.
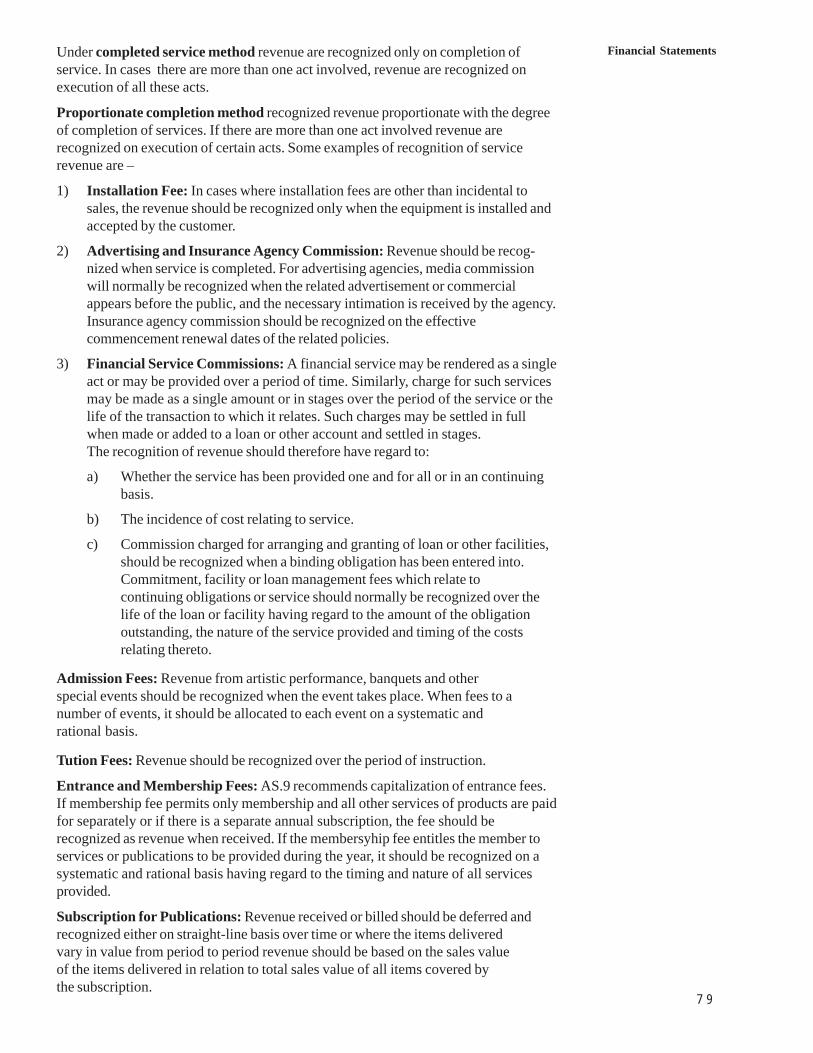
7 9
Financial StatementsUnder completed service method revenue are recognized only on completion ofservice. In cases there are more than one act involved, revenue are recognized onexecution of all these acts.
Proportionate completion method recognized revenue proportionate with the degreeof completion of services. If there are more than one act involved revenue arerecognized on execution of certain acts. Some examples of recognition of servicerevenue are –
1) Installation Fee: In cases where installation fees are other than incidental tosales, the revenue should be recognized only when the equipment is installed andaccepted by the customer.
2) Advertising and Insurance Agency Commission: Revenue should be recog-nized when service is completed. For advertising agencies, media commissionwill normally be recognized when the related advertisement or commercialappears before the public, and the necessary intimation is received by the agency.Insurance agency commission should be recognized on the effectivecommencement renewal dates of the related policies.
3) Financial Service Commissions: A financial service may be rendered as a singleact or may be provided over a period of time. Similarly, charge for such servicesmay be made as a single amount or in stages over the period of the service or thelife of the transaction to which it relates. Such charges may be settled in fullwhen made or added to a loan or other account and settled in stages.The recognition of revenue should therefore have regard to:
a) Whether the service has been provided one and for all or in an continuingbasis.
b) The incidence of cost relating to service.
c) Commission charged for arranging and granting of loan or other facilities,should be recognized when a binding obligation has been entered into.Commitment, facility or loan management fees which relate tocontinuing obligations or service should normally be recognized over thelife of the loan or facility having regard to the amount of the obligationoutstanding, the nature of the service provided and timing of the costsrelating thereto.
Admission Fees: Revenue from artistic performance, banquets and otherspecial events should be recognized when the event takes place. When fees to anumber of events, it should be allocated to each event on a systematic andrational basis.
Tution Fees: Revenue should be recognized over the period of instruction.
Entrance and Membership Fees: AS.9 recommends capitalization of entrance fees.If membership fee permits only membership and all other services of products are paidfor separately or if there is a separate annual subscription, the fee should berecognized as revenue when received. If the membersyhip fee entitles the member toservices or publications to be provided during the year, it should be recognized on asystematic and rational basis having regard to the timing and nature of all servicesprovided.
Subscription for Publications: Revenue received or billed should be deferred andrecognized either on straight-line basis over time or where the items deliveredvary in value from period to period revenue should be based on the sales valueof the items delivered in relation to total sales value of all items covered bythe subscription.
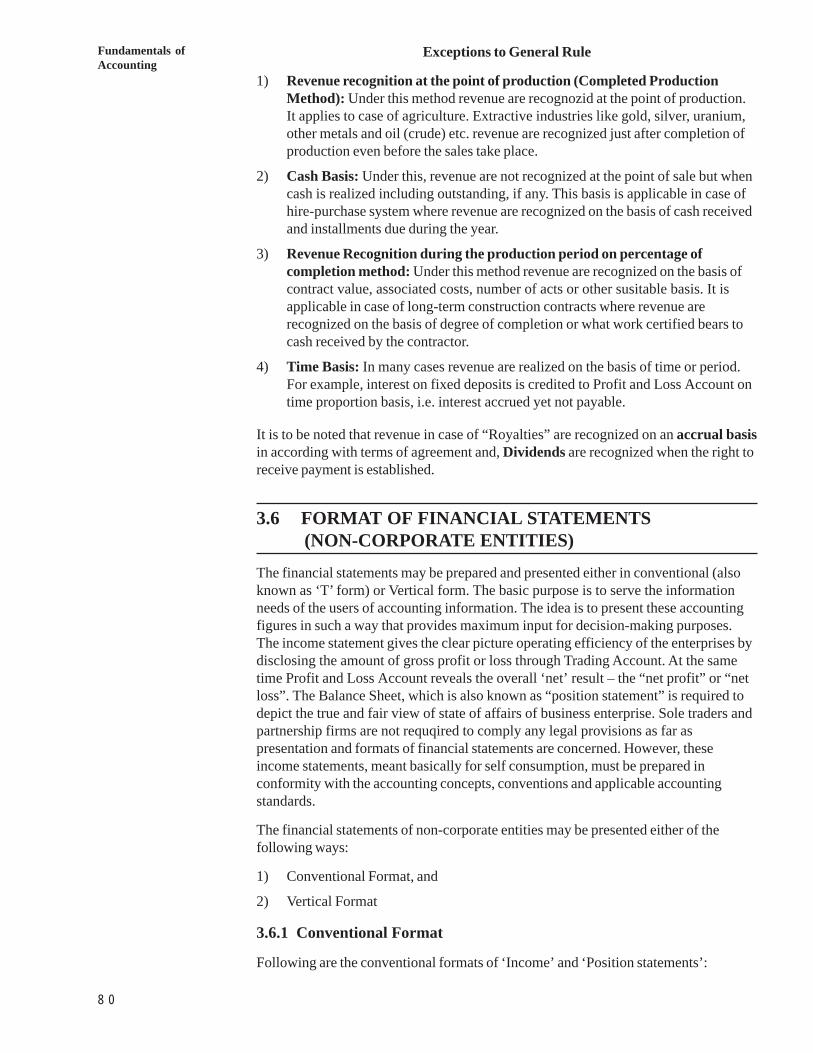
8 0
Fundamentals ofAccounting
Exceptions to General Rule
1) Revenue recognition at the point of production (Completed ProductionMethod): Under this method revenue are recognozid at the point of production.It applies to case of agriculture. Extractive industries like gold, silver, uranium,other metals and oil (crude) etc. revenue are recognized just after completion ofproduction even before the sales take place.
2) Cash Basis: Under this, revenue are not recognized at the point of sale but whencash is realized including outstanding, if any. This basis is applicable in case ofhire-purchase system where revenue are recognized on the basis of cash receivedand installments due during the year.
3) Revenue Recognition during the production period on percentage ofcompletion method: Under this method revenue are recognized on the basis ofcontract value, associated costs, number of acts or other susitable basis. It isapplicable in case of long-term construction contracts where revenue arerecognized on the basis of degree of completion or what work certified bears tocash received by the contractor.
4) Time Basis: In many cases revenue are realized on the basis of time or period.For example, interest on fixed deposits is credited to Profit and Loss Account ontime proportion basis, i.e. interest accrued yet not payable.
It is to be noted that revenue in case of “Royalties” are recognized on an accrual basisin according with terms of agreement and, Dividends are recognized when the right toreceive payment is established.
3.6 FORMAT OF FINANCIAL STATEMENTS (NON-CORPORATE ENTITIES)The financial statements may be prepared and presented either in conventional (alsoknown as ‘T’ form) or Vertical form. The basic purpose is to serve the informationneeds of the users of accounting information. The idea is to present these accountingfigures in such a way that provides maximum input for decision-making purposes.The income statement gives the clear picture operating efficiency of the enterprises bydisclosing the amount of gross profit or loss through Trading Account. At the sametime Profit and Loss Account reveals the overall ‘net’ result – the “net profit” or “netloss”. The Balance Sheet, which is also known as “position statement” is required todepict the true and fair view of state of affairs of business enterprise. Sole traders andpartnership firms are not requqired to comply any legal provisions as far aspresentation and formats of financial statements are concerned. However, theseincome statements, meant basically for self consumption, must be prepared inconformity with the accounting concepts, conventions and applicable accountingstandards.
The financial statements of non-corporate entities may be presented either of thefollowing ways:
1) Conventional Format, and
2) Vertical Format
3.6.1 Conventional Format
Following are the conventional formats of ‘Income’ and ‘Position statements’:
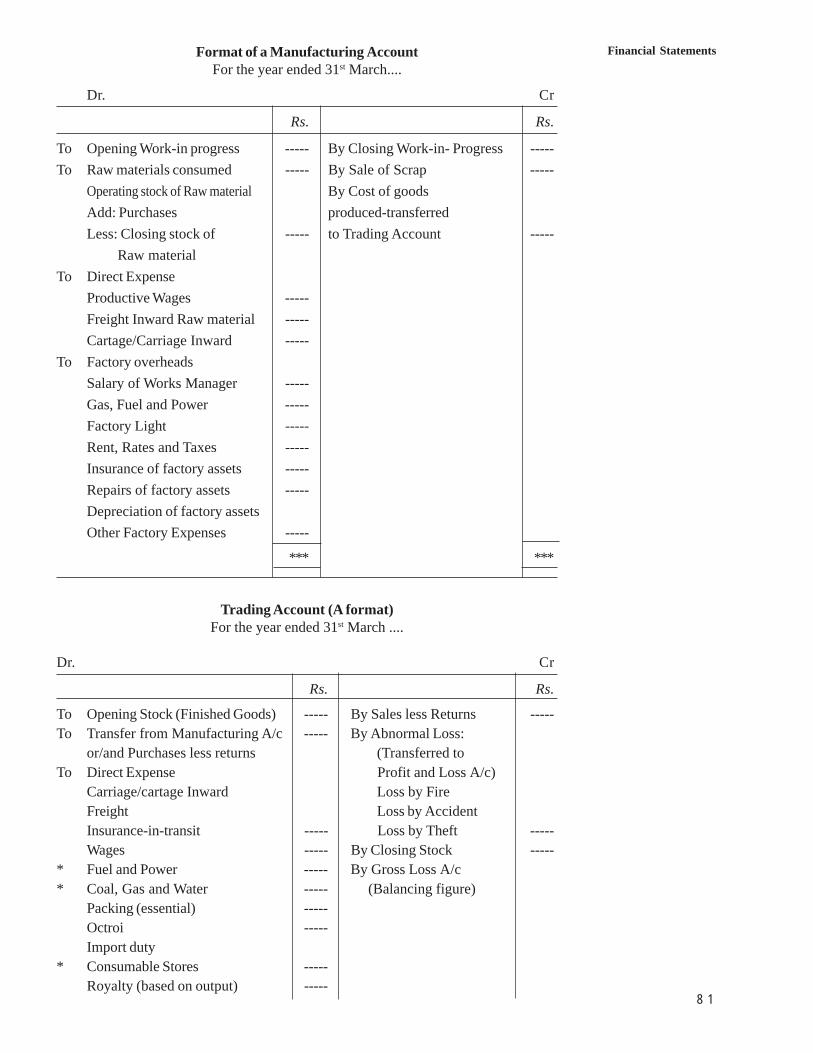
8 1
Financial StatementsFormat of a Manufacturing AccountFor the year ended 31st March....
Dr. Cr
Rs. Rs.
To Opening Work-in progress ----- By Closing Work-in- Progress -----To Raw materials consumed ----- By Sale of Scrap -----
Operating stock of Raw material By Cost of goodsAdd: Purchases produced-transferredLess: Closing stock of ----- to Trading Account ----- Raw material
To Direct ExpenseProductive Wages -----Freight Inward Raw material -----Cartage/Carriage Inward -----
To Factory overheadsSalary of Works Manager -----Gas, Fuel and Power -----Factory Light -----Rent, Rates and Taxes -----Insurance of factory assets -----Repairs of factory assets -----Depreciation of factory assetsOther Factory Expenses -----
*** ***
Trading Account (A format)For the year ended 31st March ....
Dr. Cr
Rs. Rs.
To Opening Stock (Finished Goods) ----- By Sales less Returns -----To Transfer from Manufacturing A/c ----- By Abnormal Loss:
or/and Purchases less returns (Transferred toTo Direct Expense Profit and Loss A/c)
Carriage/cartage Inward Loss by FireFreight Loss by AccidentInsurance-in-transit ----- Loss by Theft -----Wages ----- By Closing Stock -----
* Fuel and Power ----- By Gross Loss A/c* Coal, Gas and Water ----- (Balancing figure)
Packing (essential) -----Octroi -----Import duty
* Consumable Stores -----Royalty (based on output) -----
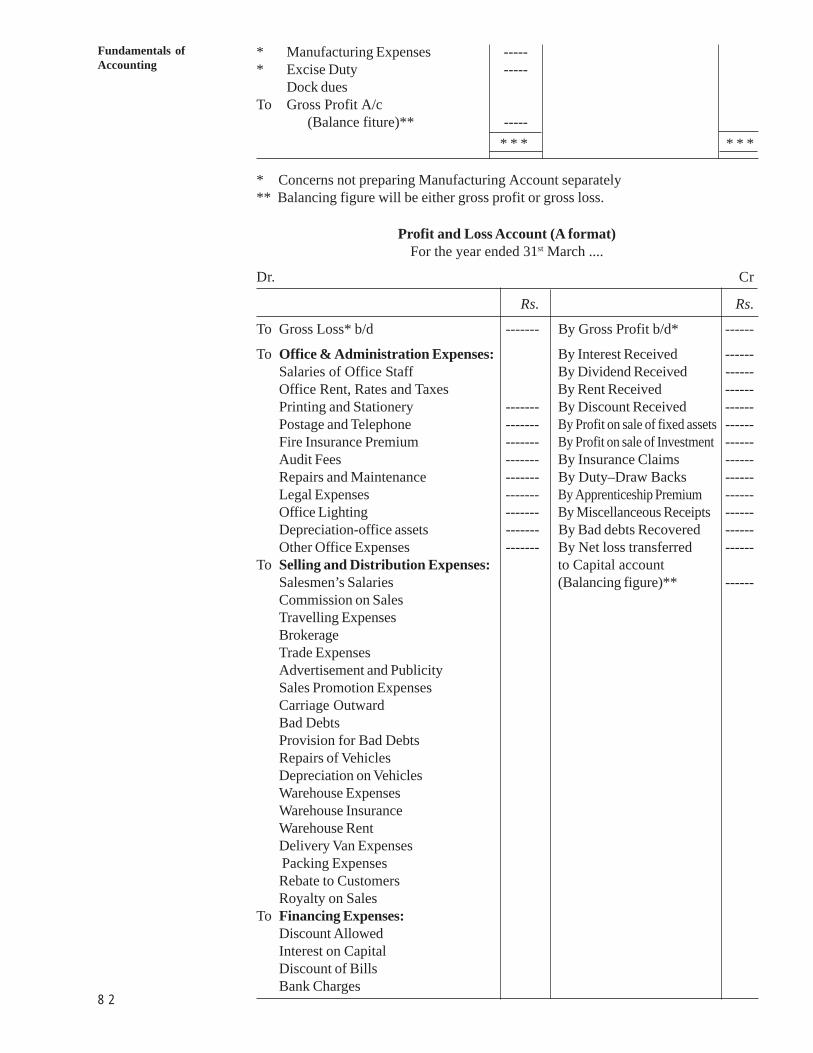
8 2
Fundamentals ofAccounting
* Manufacturing Expenses -----* Excise Duty -----
Dock duesTo Gross Profit A/c
(Balance fiture)** -----* * * * * *
* Concerns not preparing Manufacturing Account separately** Balancing figure will be either gross profit or gross loss.
Profit and Loss Account (A format)For the year ended 31st March ....
Dr. Cr
Rs. Rs.
To Gross Loss* b/d ------- By Gross Profit b/d* ------
To Office & Administration Expenses: By Interest Received ------Salaries of Office Staff By Dividend Received ------Office Rent, Rates and Taxes By Rent Received ------Printing and Stationery ------- By Discount Received ------Postage and Telephone ------- By Profit on sale of fixed assets ------Fire Insurance Premium ------- By Profit on sale of Investment ------Audit Fees ------- By Insurance Claims ------Repairs and Maintenance ------- By Duty–Draw Backs ------Legal Expenses ------- By Apprenticeship Premium ------Office Lighting ------- By Miscellanceous Receipts ------Depreciation-office assets ------- By Bad debts Recovered ------Other Office Expenses ------- By Net loss transferred ------
To Selling and Distribution Expenses: to Capital accountSalesmen’s Salaries (Balancing figure)** ------Commission on SalesTravelling ExpensesBrokerageTrade ExpensesAdvertisement and PublicitySales Promotion ExpensesCarriage OutwardBad DebtsProvision for Bad DebtsRepairs of VehiclesDepreciation on VehiclesWarehouse ExpensesWarehouse InsuranceWarehouse RentDelivery Van Expenses Packing ExpensesRebate to CustomersRoyalty on Sales
To Financing Expenses:Discount AllowedInterest on CapitalDiscount of BillsBank Charges
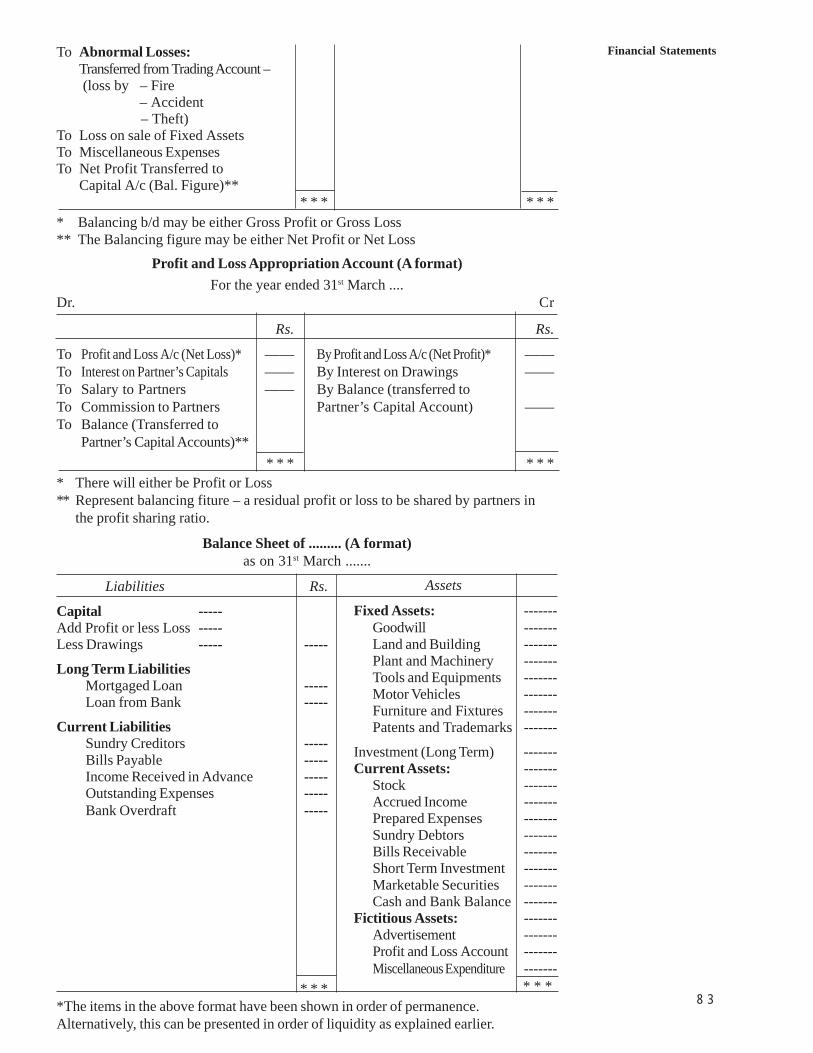
8 3
Financial StatementsTo Abnormal Losses:Transferred from Trading Account – (loss by – Fire
– Accident – Theft)To Loss on sale of Fixed AssetsTo Miscellaneous ExpensesTo Net Profit Transferred to
Capital A/c (Bal. Figure)*** * * * * *
* Balancing b/d may be either Gross Profit or Gross Loss** The Balancing figure may be either Net Profit or Net Loss
Profit and Loss Appropriation Account (A format)For the year ended 31st March ....
Dr. Cr
Rs. Rs.
To Profit and Loss A/c (Net Loss)* —— By Profit and Loss A/c (Net Profit)* ——To Interest on Partner’s Capitals —— By Interest on Drawings ——To Salary to Partners —— By Balance (transferred toTo Commission to Partners Partner’s Capital Account) ——To Balance (Transferred to
Partner’s Capital Accounts)*** * * * * *
* There will either be Profit or Loss** Represent balancing fiture – a residual profit or loss to be shared by partners in
the profit sharing ratio.
Balance Sheet of ......... (A format)as on 31st March .......
Liabilities Rs.
Capital -----Add Profit or less Loss -----Less Drawings ----- -----
Long Term LiabilitiesMortgaged Loan -----Loan from Bank -----
Current LiabilitiesSundry Creditors -----Bills Payable -----Income Received in Advance -----Outstanding Expenses -----Bank Overdraft -----
* * **The items in the above format have been shown in order of permanence.Alternatively, this can be presented in order of liquidity as explained earlier.
Assets
Fixed Assets: -------Goodwill -------Land and Building -------Plant and Machinery -------Tools and Equipments -------Motor Vehicles -------Furniture and Fixtures -------Patents and Trademarks -------
Investment (Long Term) -------Current Assets: -------
Stock -------Accrued Income -------Prepared Expenses -------Sundry Debtors -------Bills Receivable -------Short Term Investment -------Marketable Securities -------Cash and Bank Balance -------
Fictitious Assets: -------Advertisement -------Profit and Loss Account -------Miscellaneous Expenditure -------
* * *
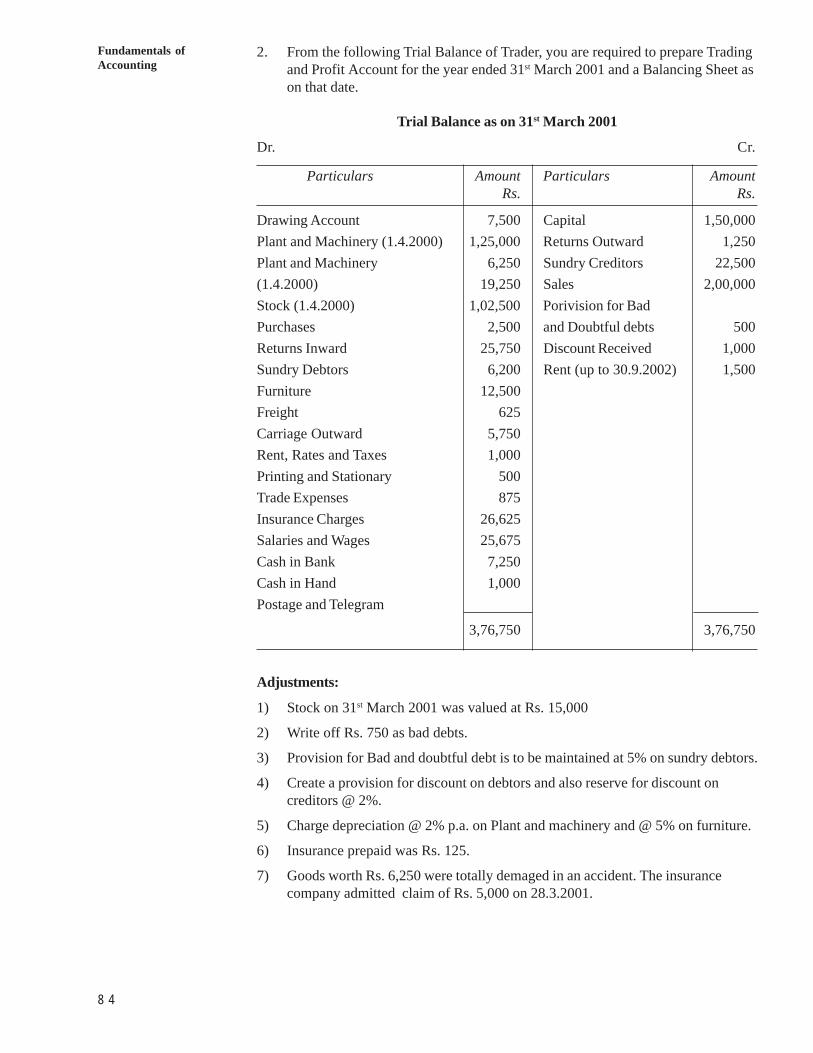
8 4
Fundamentals ofAccounting
2. From the following Trial Balance of Trader, you are required to prepare Tradingand Profit Account for the year ended 31st March 2001 and a Balancing Sheet ason that date.
Trial Balance as on 31st March 2001
Dr. Cr.
Particulars Amount Particulars AmountRs. Rs.
Drawing Account 7,500 Capital 1,50,000Plant and Machinery (1.4.2000) 1,25,000 Returns Outward 1,250Plant and Machinery 6,250 Sundry Creditors 22,500(1.4.2000) 19,250 Sales 2,00,000Stock (1.4.2000) 1,02,500 Porivision for BadPurchases 2,500 and Doubtful debts 500Returns Inward 25,750 Discount Received 1,000Sundry Debtors 6,200 Rent (up to 30.9.2002) 1,500Furniture 12,500Freight 625Carriage Outward 5,750Rent, Rates and Taxes 1,000Printing and Stationary 500Trade Expenses 875Insurance Charges 26,625Salaries and Wages 25,675Cash in Bank 7,250Cash in Hand 1,000Postage and Telegram
3,76,750 3,76,750
Adjustments:
1) Stock on 31st March 2001 was valued at Rs. 15,000
2) Write off Rs. 750 as bad debts.
3) Provision for Bad and doubtful debt is to be maintained at 5% on sundry debtors.
4) Create a provision for discount on debtors and also reserve for discount oncreditors @ 2%.
5) Charge depreciation @ 2% p.a. on Plant and machinery and @ 5% on furniture.
6) Insurance prepaid was Rs. 125.
7) Goods worth Rs. 6,250 were totally demaged in an accident. The insurancecompany admitted claim of Rs. 5,000 on 28.3.2001.
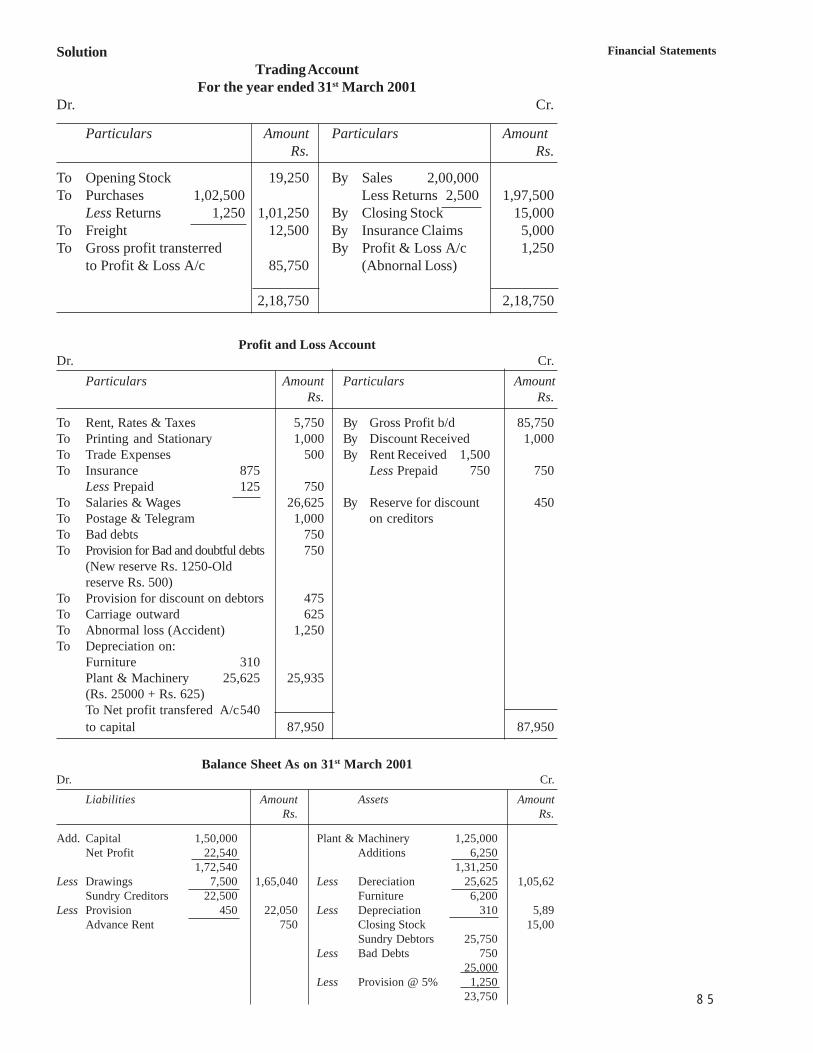
8 5
Financial StatementsSolutionTrading Account
For the year ended 31st March 2001Dr. Cr.
Particulars Amount Particulars AmountRs. Rs.
To Opening Stock 19,250 By Sales 2,00,000To Purchases 1,02,500 Less Returns 2,500 1,97,500
Less Returns 1,250 1,01,250 By Closing Stock 15,000To Freight 12,500 By Insurance Claims 5,000To Gross profit transterred By Profit & Loss A/c 1,250
to Profit & Loss A/c 85,750 (Abnornal Loss)
2,18,750 2,18,750
Profit and Loss AccountDr. Cr.
Particulars Amount Particulars AmountRs. Rs.
To Rent, Rates & Taxes 5,750 By Gross Profit b/d 85,750To Printing and Stationary 1,000 By Discount Received 1,000To Trade Expenses 500 By Rent Received 1,500To Insurance 875 Less Prepaid 750 750
Less Prepaid 125 750To Salaries & Wages 26,625 By Reserve for discount 450To Postage & Telegram 1,000 on creditorsTo Bad debts 750To Provision for Bad and doubtful debts 750
(New reserve Rs. 1250-Oldreserve Rs. 500)
To Provision for discount on debtors 475To Carriage outward 625To Abnormal loss (Accident) 1,250To Depreciation on:
Furniture 310Plant & Machinery 25,625 25,935(Rs. 25000 + Rs. 625)To Net profit transfered A/c540to capital 87,950 87,950
Balance Sheet As on 31st March 2001Dr. Cr.
Liabilities Amount Assets AmountRs. Rs.
Add. Capital 1,50,000 Plant & Machinery 1,25,000Net Profit 22,540 Additions 6,250
1,72,540 1,31,250Less Drawings 7,500 1,65,040 Less Dereciation 25,625 1,05,62
Sundry Creditors 22,500 Furniture 6,200Less Provision 450 22,050 Less Depreciation 310 5,89
Advance Rent 750 Closing Stock 15,00Sundry Debtors 25,750
Less Bad Debts 75025,000
Less Provision @ 5% 1,25023,750
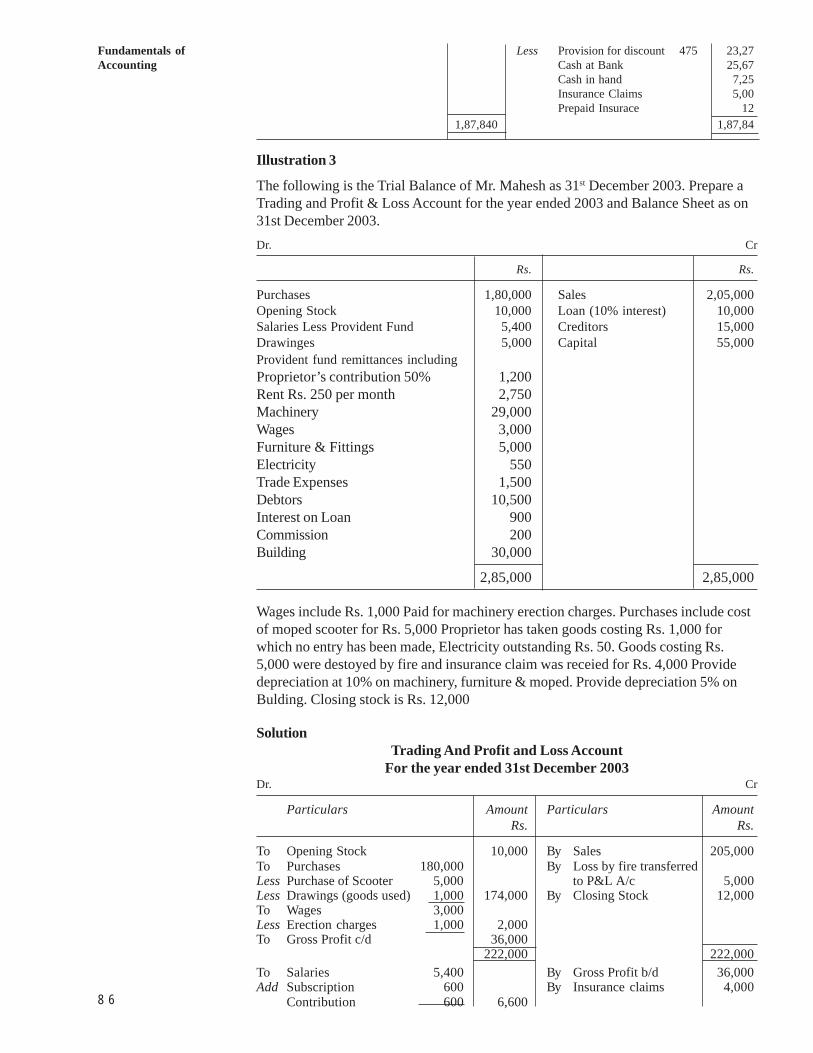
8 6
Fundamentals ofAccounting
Less Provision for discount 475 23,27Cash at Bank 25,67Cash in hand 7,25Insurance Claims 5,00Prepaid Insurace 12
1,87,840 1,87,84
Illustration 3
The following is the Trial Balance of Mr. Mahesh as 31st December 2003. Prepare aTrading and Profit & Loss Account for the year ended 2003 and Balance Sheet as on31st December 2003.Dr. Cr
Rs. Rs.
Purchases 1,80,000 Sales 2,05,000Opening Stock 10,000 Loan (10% interest) 10,000Salaries Less Provident Fund 5,400 Creditors 15,000Drawinges 5,000 Capital 55,000Provident fund remittances includingProprietor’s contribution 50% 1,200Rent Rs. 250 per month 2,750Machinery 29,000Wages 3,000Furniture & Fittings 5,000Electricity 550Trade Expenses 1,500Debtors 10,500Interest on Loan 900Commission 200Building 30,000
2,85,000 2,85,000
Wages include Rs. 1,000 Paid for machinery erection charges. Purchases include costof moped scooter for Rs. 5,000 Proprietor has taken goods costing Rs. 1,000 forwhich no entry has been made, Electricity outstanding Rs. 50. Goods costing Rs.5,000 were destoyed by fire and insurance claim was receied for Rs. 4,000 Providedepreciation at 10% on machinery, furniture & moped. Provide depreciation 5% onBulding. Closing stock is Rs. 12,000
SolutionTrading And Profit and Loss Account
For the year ended 31st December 2003Dr. Cr
Particulars Amount Particulars AmountRs. Rs.
To Opening Stock 10,000 By Sales 205,000To Purchases 180,000 By Loss by fire transferredLess Purchase of Scooter 5,000 to P&L A/c 5,000Less Drawings (goods used) 1,000 174,000 By Closing Stock 12,000To Wages 3,000Less Erection charges 1,000 2,000To Gross Profit c/d 36,000
222,000 222,000To Salaries 5,400 By Gross Profit b/d 36,000Add Subscription 600 By Insurance claims 4,000
Contribution 600 6,600
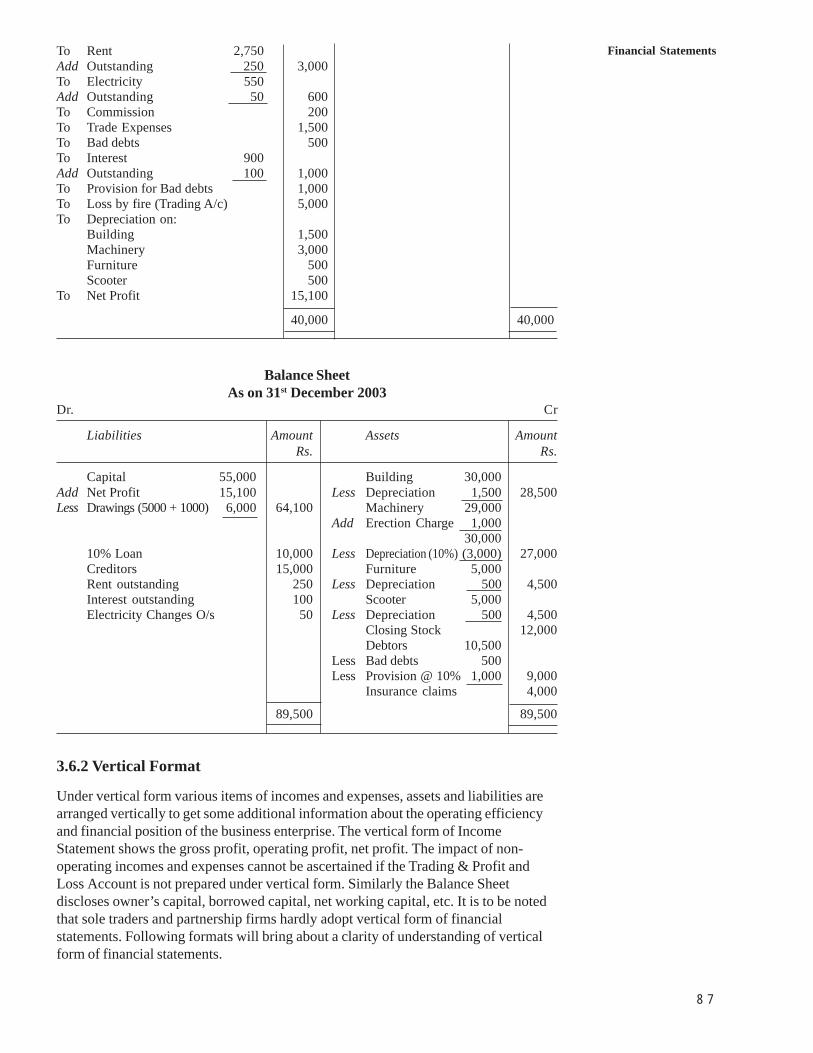
8 7
Financial StatementsTo Rent 2,750Add Outstanding 250 3,000To Electricity 550Add Outstanding 50 600To Commission 200To Trade Expenses 1,500To Bad debts 500To Interest 900Add Outstanding 100 1,000To Provision for Bad debts 1,000To Loss by fire (Trading A/c) 5,000To Depreciation on:
Building 1,500Machinery 3,000Furniture 500Scooter 500
To Net Profit 15,100
40,000 40,000
Balance SheetAs on 31st December 2003
Dr. Cr
Liabilities Amount Assets AmountRs. Rs.
Capital 55,000 Building 30,000Add Net Profit 15,100 Less Depreciation 1,500 28,500Less Drawings (5000 + 1000) 6,000 64,100 Machinery 29,000
Add Erection Charge 1,00030,000
10% Loan 10,000 Less Depreciation (10%) (3,000) 27,000Creditors 15,000 Furniture 5,000Rent outstanding 250 Less Depreciation 500 4,500Interest outstanding 100 Scooter 5,000Electricity Changes O/s 50 Less Depreciation 500 4,500
Closing Stock 12,000Debtors 10,500
Less Bad debts 500Less Provision @ 10% 1,000 9,000
Insurance claims 4,000
89,500 89,500
3.6.2 Vertical Format
Under vertical form various items of incomes and expenses, assets and liabilities arearranged vertically to get some additional information about the operating efficiencyand financial position of the business enterprise. The vertical form of IncomeStatement shows the gross profit, operating profit, net profit. The impact of non-operating incomes and expenses cannot be ascertained if the Trading & Profit andLoss Account is not prepared under vertical form. Similarly the Balance Sheetdiscloses owner’s capital, borrowed capital, net working capital, etc. It is to be notedthat sole traders and partnership firms hardly adopt vertical form of financialstatements. Following formats will bring about a clarity of understanding of verticalform of financial statements.
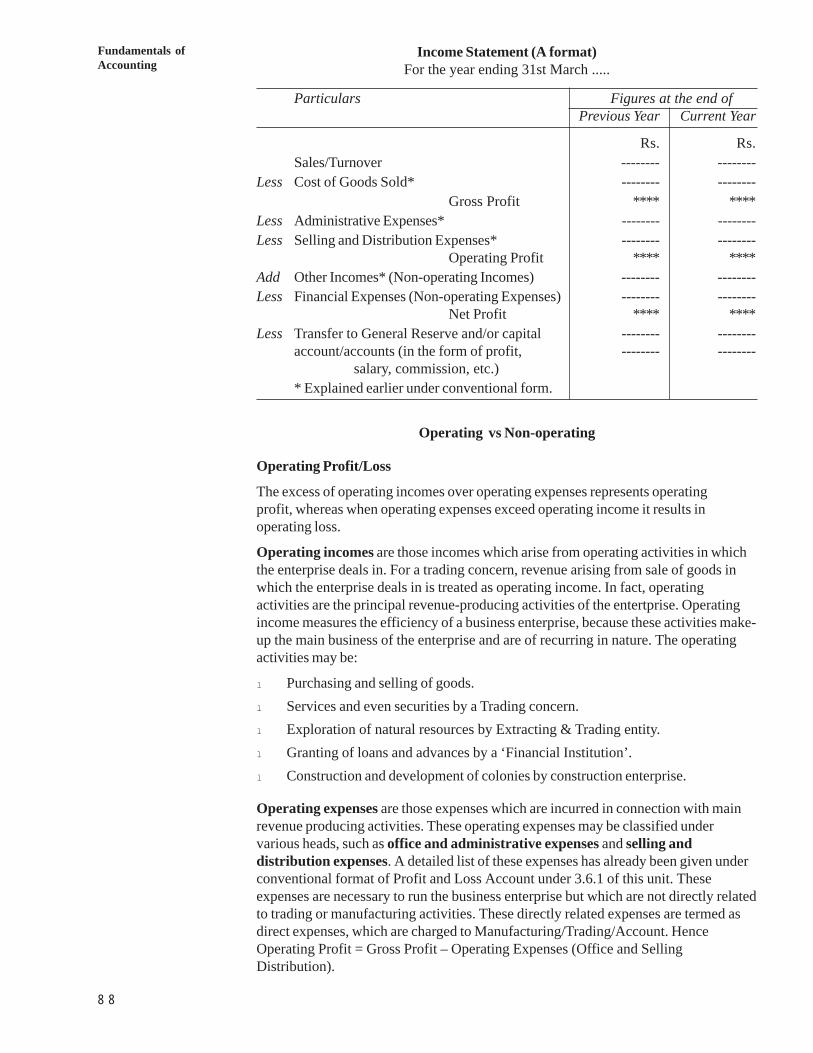
8 8
Fundamentals ofAccounting
Income Statement (A format)For the year ending 31st March .....
Particulars Figures at the end ofPrevious Year Current Year
Rs. Rs.Sales/Turnover -------- --------
Less Cost of Goods Sold* -------- --------Gross Profit **** ****
Less Administrative Expenses* -------- --------Less Selling and Distribution Expenses* -------- --------
Operating Profit **** ****Add Other Incomes* (Non-operating Incomes) -------- --------Less Financial Expenses (Non-operating Expenses) -------- --------
Net Profit **** ****Less Transfer to General Reserve and/or capital -------- --------
account/accounts (in the form of profit, -------- -------- salary, commission, etc.)* Explained earlier under conventional form.
Operating vs Non-operating
Operating Profit/Loss
The excess of operating incomes over operating expenses represents operatingprofit, whereas when operating expenses exceed operating income it results inoperating loss.
Operating incomes are those incomes which arise from operating activities in whichthe enterprise deals in. For a trading concern, revenue arising from sale of goods inwhich the enterprise deals in is treated as operating income. In fact, operatingactivities are the principal revenue-producing activities of the entertprise. Operatingincome measures the efficiency of a business enterprise, because these activities make-up the main business of the enterprise and are of recurring in nature. The operatingactivities may be:
l Purchasing and selling of goods.l Services and even securities by a Trading concern.l Exploration of natural resources by Extracting & Trading entity.l Granting of loans and advances by a ‘Financial Institution’.l Construction and development of colonies by construction enterprise.
Operating expenses are those expenses which are incurred in connection with mainrevenue producing activities. These operating expenses may be classified undervarious heads, such as office and administrative expenses and selling anddistribution expenses. A detailed list of these expenses has already been given underconventional format of Profit and Loss Account under 3.6.1 of this unit. Theseexpenses are necessary to run the business enterprise but which are not directly relatedto trading or manufacturing activities. These directly related expenses are termed asdirect expenses, which are charged to Manufacturing/Trading/Account. HenceOperating Profit = Gross Profit – Operating Expenses (Office and SellingDistribution).
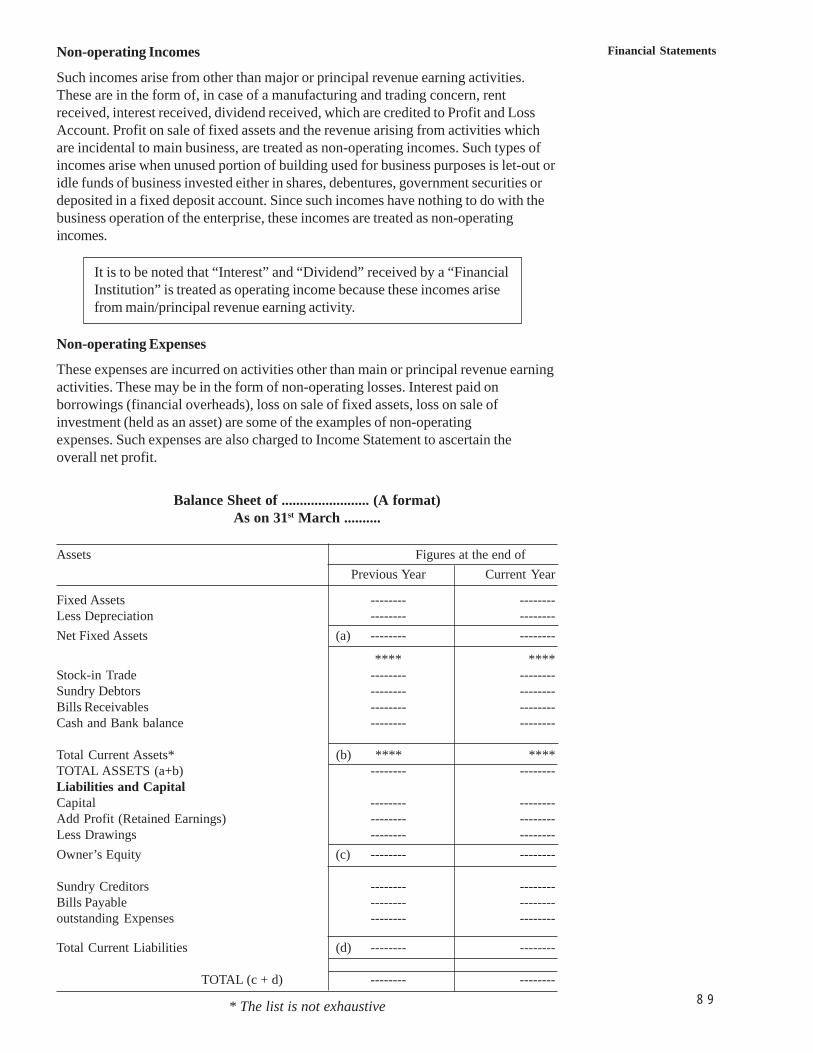
8 9
Financial StatementsNon-operating Incomes
Such incomes arise from other than major or principal revenue earning activities.These are in the form of, in case of a manufacturing and trading concern, rentreceived, interest received, dividend received, which are credited to Profit and LossAccount. Profit on sale of fixed assets and the revenue arising from activities whichare incidental to main business, are treated as non-operating incomes. Such types ofincomes arise when unused portion of building used for business purposes is let-out oridle funds of business invested either in shares, debentures, government securities ordeposited in a fixed deposit account. Since such incomes have nothing to do with thebusiness operation of the enterprise, these incomes are treated as non-operatingincomes.
It is to be noted that “Interest” and “Dividend” received by a “FinancialInstitution” is treated as operating income because these incomes arisefrom main/principal revenue earning activity.
Non-operating Expenses
These expenses are incurred on activities other than main or principal revenue earningactivities. These may be in the form of non-operating losses. Interest paid onborrowings (financial overheads), loss on sale of fixed assets, loss on sale ofinvestment (held as an asset) are some of the examples of non-operatingexpenses. Such expenses are also charged to Income Statement to ascertain theoverall net profit.
Balance Sheet of ........................ (A format)As on 31st March ..........
Assets Figures at the end ofPrevious Year Current Year
Fixed Assets -------- --------Less Depreciation -------- --------Net Fixed Assets (a) -------- --------
**** ****Stock-in Trade -------- --------Sundry Debtors -------- --------Bills Receivables -------- --------Cash and Bank balance -------- --------
Total Current Assets* (b) **** ****TOTAL ASSETS (a+b) -------- --------Liabilities and CapitalCapital -------- --------Add Profit (Retained Earnings) -------- --------Less Drawings -------- --------Owner’s Equity (c) -------- --------
Sundry Creditors -------- --------Bills Payable -------- --------outstanding Expenses -------- --------
Total Current Liabilities (d) -------- --------
TOTAL (c + d) -------- --------
* The list is not exhaustive
9 0
Fundamentals ofAccounting
Activity
1) What are operating and non-operating profits?2) What do you understand by “Grouping” and “Marshalling” of assets and liabili-
ties?3) Write short notes on the following:
a) Outstanding of Expensesb) Accrued Incomesc) Intangible Assetsd) Fictitious Assetse) Cost of Conversionf) Cost of Goods Soldg) Direct vs Indirect Expenses
4) Draw an imaginary Balance Sheet.
3.7 CORPORATE FINANCIAL STATEMENTSThe process of preparation of financial statements of companies is similar to that ofnon-corporate entities except for certain peculiar items and legal requirements. Thecorporate reporting has assumed great importance in recent years. The Company LawBoard, the Institute of Chartered Accountants of India and whole corporate world aretrying to bring about a total transparency in the matter of reporting. The fundamentalobjective of corporate reporting is to communicate economic information about theresources and performance of the reporting entity to the users of financial statements.The professional bodies have also developed several (till date – 28) accountingstandards for the purpose of preparing and disclosing accounting information in order:
1) To serve the varied needs of users for decision-making purposes.
2) To harmonise the diverse accounting practices.
3) To ensure transparency, consistency, comparability, adequacy andreliability of information-contents.
4) To make accounting information more meaningful and useful.
5) And to improve overall quality of presentation and reporting.Since every interested party has a right to information which is merely not theoutcome of statue but is based on the principle of public accountability. The financialstatements which are prepared on the basis of various accounting postulates, conceptsand conventions, are supposed to endowed with many qualitative characteristics, viz.understandability, relevance, materiality, reliability, faithful representation, substanceover form, neutrality, prudence, completeness and comparability.
General and Legal Requirements
Section 209 to 223 of the Companies Act, 1956 deal with provision governingmaintenance and preparation of financial statements.
Section 209 deals with the maintenance of proper books of accounts in respect of
1) Receipts and disbursements of money,2) Sales and purchases of raw materials/goods,3) Description peratining to usage of raw material and labout, etc., and4) All assets and liabilities.
9 1
Financial StatementsSection 209 also requires that books of accounts must show the “True and fair” viewof state of affairs of the company. Section 211 requires that the Balance Sheet mustgive true and fair view of the results of operations. It simply implies that financialstatements should disclose every material information without any concealment offacts and figures and in such a manner that working results and financial position ofthe reporting enterprise, may correctly be interpreted in true spirits. It should be freefrom personal biases and mis-statements. It will be possible only if financialstatements are prepared in accordance with generally accepted accounting principlesand in conformity with the various accounting standards as applicable to the reportingenterprise. Companies (Amendment) Act 1999 has made it mandatory for companiesto comply with accounting standards set by ICAI. In case company fails to complywith any of generally accepted accounting assumptions or standards, the fact shouldbe disclosed.
Section 210 requires that financial statements should be presented to shareholders atevery Annual General Meeting along with the Auditor’s and Directors’ Reports. EveryBalance Sheet and Profit and Loss Account must be duly authenticated. Thesestatements must be signed by Manager or Secretary and by two directors, at least oneof whom must be managing director (Section 215).
3.7.1 Items Peculiar to Corporate Balance Sheet
Share Capital: Under this head following details are required to be disclosed:
1) Details of Authorised, Issued and Subscribed Capital along with number andnominal value of the shares with respect to preference and equity shares.
2) Calls-in-Arrears must be deducted from Called-up Capital. However, Calls-in-arrears on shares held by directors are to be shown separately. Similarly, Calls-in-Advance should be treated as a separate items and shown accordingly.
3) Forfeited Shares Account, if any, should be added to paid-up Capital whichforms the part of total of Balance Sheet. It is to be noted that the Authorised,Issued and Subscribed capitals are not considered for the purpose of total ofBalance Sheet.
4) Shares issued for consideration other than cash must be disclosed. Such asshares allotted to transferor company under the agreement of takeover/merger,Issue of bonus shares and the source thereof.
5) If preference shares have been issued, the terms of redemption or conversionalong with the earliest date of redemption/conversion must be specified.
6) Excess application money on account of over-subscription not requiring anyadjustment, should be refunded. If not, the money refundable must be shown aspart of current liabilities.
3.7.2 Reserves and Surplus
This may be in the following forms:
i) Capital Reserves: It refers to those profits which are not earned from normalbusiness operations. Such profits are not available for the purpose of distributionas dividend. It is created out of profit on sale of-fixed assets or investments heldas asset, profit on reissue of forfeited shares, pre-incorporation profit, profit onrevaluation of fixed assets, profit on purchase/acquisition of assets or profit onpurchase of business (excess of net assets over purchase price).
ii) Capital Redemption Reserve: It is created when fully paid preference sharesare redeemed out of divisible profits of the company. This reserve may beutilized for the purpose of issuing fully paid bonus shares to the members of thecompany.
9 2
Fundamentals ofAccounting
iii) Securities Premium: When a company issues shares or debentures at a pricewhich is more than its face value, it is said to have issued shares/debentures at apremium. The premium so received is transferred to “Securities PremiumAccount”.According to Section 78 of Companies Act, the premium may be utilized for –issuing fully paid bonus shares, writing off preliminary expenses, discount onissue of shares or debentures, and providing premium on redemption ofpreference shares or debentures.
iv) Revenue Reserves: These may be in the form of specific reserves or freereserves and are created out of revenue profits of the company. Usually suchreserves are formed from annual appropriation. Specific Reserves are createdfor specific purpose. For example, Dividend Equalisation Reserve is created tomeet the shortfall in the divisible profits of the company intends to follow astable dividend policy. Or to redeem the debentures, a sinking fund or a deben-ture redemption reserve may be created. Other specific reserves are DevelopmentRebate Reserve, Investment Allowance Reserve, Export Incentive Reserve, etc.The term ‘Fund’ is used when the money earmarked for any specific purpose isinvested in ourside securities. For example, if money appropriated for thepurpose of redemption of debentures is invested outside and business is termed asDebenture Redemption Fund, if not invested outside but retained or ploughedback in the business, it is called Debenture Redemption Reserve.
Surplus
The Credit balance of Profit and Loss Account or P&L Appropriation Account (i.e.after making necessary transfer to reserves and appropriating for proposed interim orfinal dividend including bonus, if any) is shown under the heading as surplus. If acompany has a debit balance of Profit & Loss Account, the same should be adjustedunder this head.
3) Secured Loans: This refers to mortgaged loan or other loans, which are fullysecured either by a fixed or floating charge on the assets of the Company. Itincludes loans from bank, financial institutions or from other companies pro-vided these are secured against the specific or all assets of the company. Deben-tures are assumed to have first floating charge on the assets of the company. It isto be noted that interest accrued and due on secured loans is to be treated as andshown under Secured Loans. Loan from or guaranteed by directors should bedisclosed and shown separately. In case of debentures, the terms of redemption/conversion and its earliest date of redemption/conversion be stated.
4) Unsecured Loans: These are the loans against which no security stands apledged or mortgaged. It also includes amount not covered by the value ofsecurity provided in respect of partly secured loans. It covers all loans which arenot at all secured such as –– Fixed Deposits from public– Loans and Advances from Subsidiaries– Short-term loans and Advances from Banks and others– Other Loans and Advances– It may include creditors for purchase of an asset.
5) Current Liabilities and Provisions: This heading is split in two sub-headings :current liabilities and prosvisions.
Current Liabilities: It refers to those liabilities which are to be paid or payable withina period of twelve months. It includes, Sundry Creditors, Bills Payable, OutstandingExpenses, Income Received in Advance, Amount payable to Subsidiaries.
9 3
Financial StatementsIt is to be noted that short-term loans and interest outstanding thereon are to be shownunder “Secured” or “Unsecured Loan” as the case may be and not under CurrentLiabilities.
Provisions: Provisions such as Proposed dividend, Provision for Depreciation,Repairs and Renewals, Provision for Doubtful Debts, Investment Fluctuation Reserve,Provident Fund, Pension Fund etc. are shown separately under this head.
* Provision for Depreciation and Provision for Doubtful Debts may beshown on the “Assets side” as a deduction from the asset concerned.
Contingent liabilities: As explained earlier, these liabilities are shown as a footnoteand include the following:
l Liability for bills discountedl Claims against the company not acknowledged as debtl Uncalled liability on partly paid sharesl Arrears of fixed cumulative preference dividendsl Guarantee given by the Company on behalf of directors or other officers of the
Companyl Estimated amount of contracts remaining to be executed on capital account not
provided for, andl Other money for which company is contingently liable.
It is to be noted that if any provision is made against any contingentliability, the same is to be shown under the head provisions.
Fixed Assets
Under this head there are eleven types of “fixed assets” starting from goodwill tovehicles. According to AS-10 a fixed asset is an “asset held with the intention of beingused for the purpose of producing or providing goods or services and is not held forsale in the normal course of business.” Even assets which are not legally owned butheld for the purpose of production are treated and shown under this head. Theseinclude assets acquired under hire-purchase agreement and assets taken on lease, afterconsidering the addition and disposal, if any. Valuation of fixed assets is made at costless depreciation after considering the addition and disposal, if any.
It is worth remembering that “goodwill” should be shown in the books only when it isacquired for some consideration. According to AS–26 internally generated goodwillshould not be recognized as an asset.
*As per Schedule VI the fixed assets are classified as follows:1) Goodwill2) Land3) Building4) Leasehold5) Railway Slidings6) Plant and Machinery7) Furniture and Fittings8) Development of Property9) Patents, Trade Marks and Designs10) Live Stock11) Vehicles
9 4
Fundamentals ofAccounting
In case of revaluation of fixed assets, every balance sheet subsequent to suchrevaluation must show the revised figures with the date of increase or decrease inplace of original cost. In ascertaining the cost of an asset all expenditures incurred inbringing the asset to its working condition should be included. This includes cost oftransportation, expenditure on trial runs. In case of land and building, stamp duty,registration fee and architects fees should be capitalised.
Investments
As per AS-13 (Accounting for Investments), “Investments are assets held by anenterprise for earning income by way of dividends, interest and rentals, for capitalappreciation or for other benefits to the investing enterprise”. Assets held as stock-in-trade are not investments. Money invested outside business is termed as investmentswhich may be long term, current investment or an investment property.
According to AS-13, a “current investment ” by its nature as readily realizable isintended to be held for not more than one year, whereas an “investment propery” is aninvestment in land or building that are not intended to be occupied substantially foruse by the enterprises.
Schedule VI requires investments to be shown as follows:
i) Investments in Government or Trust Securities.ii) Investments in shares, debentures or bonds, fully paid up and partly paid
up and also different classes of shares.iii) Immovable propertiesiv) Investments in the Capital of partnership firms.
The following details about the investments must be given:a) Nature of investment.b) Mode of valuation of Investments.c) Aggregate amount of company’s quoted investments and its market value.d) Aggregate amount of company’s unquoted investments.e) Amount of fully paid and partly paid shares.f) Investment in subsidiary companies.
Current Assets, Loans and AdvancesThis is subdivided in two sub-headings:
A) Current Assets: As per the Guidance note issued by ICAI, “current assets meanscash and other assets that are expected to be converted into cash or consumed in theproduction of goods or rendering or services in the normal course of business andinclude:
i) Stock-in-trade (inventories of raw materials, work-in-progress finishedgoods, stores and spare parts to be shown separately) including mode ofvaluation.
ii) Debtors should show the age-wise and security-wise classification such asDebts outstanding for a period of more than six months and other debts.Debtors considered good in respect of which company holds no securityother than the debtor’s personal security.Debts considered doubtful or bad.Debts due by directors on other officersDebts due from other companies (subsidiaries)
9 5
Financial StatementsMaximum amount due by directors or other officers of the company(footnote through)Provision for doubtful debts is required to be deducted from sundry debtorsProvision should not exceed the amount considered from sundry debtors.Provision should not exceed the amount considered doubtful or bad. Anyexcess provision be shown under “Reserve and Surplus”.
iii) Cash and Bank balances should be shown separately. Bank balancesshould be classified into balances with scheduled banks and other banksalong with details of current account, saving bank and fixed deposits. Bankoverdraft, if any, should be shown under Sundry Creditors. This informa-tion of inclusion be disclosed in a footnote that the Sundry Creditorsinclude bank overdraft amounting to Rs....
B) Loans and Advances
The disclosure rules which are applicable to sundry debtors, the same should beapplied to “Loans and Advances”, i.e. these should be shown in age-wise, security-wise and reliability-wise classification. In addition the following should be shown:
i) Advances and loans to subsidiariesii) Advances and loans to partnership firms in which the company or subsid-
iary is a partneriii) Bills of Exchangeiv) Advances recoverable in cash or kind or for value (Rent, Rates and Insur-
ance)v) Balance with customers, port trust, etc. which are payable on demand
Miscellaneous ExpenditureThese are the expenses incurred in earlier years but not written off. These include:i) Preliminary expenses (Formation expenses incurred on preparation of Memoran-
dum and Articles of Association, legal fees, registration fee, etc.)ii) Share and Debentures issue expenses, such as brokerage, underwriting commis-
sion, discount on issue of share and debentures.iii) Interest paid out of Capital during construction.Such miscellaneous expenditure is written off over a period for which benefit isavailable.
Profit and Loss Account (Debit balance)
This represents past unwritten-off losses. These are adjusted and written off againstthe free reserves (divisible profits/revenue profits) to the available extent. Unabsorbedamount is shown under this head.
3.7.2 Items Peculiar to Corporate Income Statement
Salient Features
Though the procedure and the process of preparation of “Income Statement” of aCompany and that of non-corporate entities are similar in principles, there are somedifferences in the method of presentation and some additional items which form thepart of a corporate income statement. These differences are as under:
1) Heading: Non-corporate entities name income statement as “Trading and Profitand Loss Account”, while companies call it “Income Statement” or Profit andLoss Account only. The items of Trading Account become the part of “IncomeStatement”. No separate Trading Account is prepared.
9 6
Fundamentals ofAccounting
2) Appropriation: Sole trader does not prepare any appropriation account, whilepartnership firms and companies do. A company’s Profit and Loss Account issplit up in to two parts – “above the line” and “below the line”. All items ofappropriations are shown “below the line” and the remaining balance is trans-ferred to the liabilities side of the balance sheet. A partnership firm prepares aseparate Profit and Loss Appropriation Account.
3) As per AS–5 extraordinary items (abnormal nature), prior period items areshown separately whereas in case of non-corporate entities, such items are statedalong with the normal and routine items.
4) Requirement: The Profit and Loss Account of a company should conform to therequirements of Schedule VI of Companies Act 1956 and adhere to AS–1; AS–4and AS–5 recommendations, whereas non-corporate enterprises are not requiredto do so.
5) Income Tax: It is treated as an expense for the companies while for firms andsole trade enterprise, it is treated as drawings.
6) Companies’ Profit and Loss Account should disclose the figures for the previousyear along with the current year’s whereas non-company enterprises are notrequired to show figures relating to previous year.
Treatment of Special Items of Profit and Loss Account
1) Interest on Debenture and Loans: This item includes interest paid and payablefor the financial period for which accounts are prepared and shown to the debitside of Profit and Loss Account. Likewise, interest due but remaining outstand-ing is taken to the liability side of the Balance Sheet. Interest on Debentures andinterest on secured loan outstanding, if any, is shown under the heading “SecuredLoans” whereas interest outstanding on unsecured loan is shown under “unse-cured loans”.
It is to be noted that interest on loan for the construction period should becapitalized and added to the cost of the asset concerned.
2) Tax on Interest on Debentures: As per Income Tax Act 1961, every companymust deduct tax at source (TDS) while paying interest to the debenture holders. Theamount so deducted shall be deposited with the Government treasury. The currentrates for TDS are as follows:
Debentures (listed) 10.5% including surchargeDebentures (unlisted) 21% including surcharge
If A ltd. has to pay interest on its 9% debentures (listed) of the face value of Rs.5,00,000, then gross interest will be Rs. 45,000 and tax deducted at source Rs. 4,725balance shall be paid to the Debenture holders Rs. 40,275. The following entry isrecorded –
Interest on Debentures A/c Dr 45,000 To Debenture Holders A/c 40,275 To Income Tax Payable A/c 4,725
Income Tax deducted but not deposited with the Government is to be shown in theBalance Sheet under the heading “Current Liabilities”.
It should be remembered that Profit and Loss Account will always bedebited with the gross amount of interest.
9 7
Financial Statements3) Discount on Debentures/Loss on Issue/Debenture Issue Expenses: Discounton issue of debentures, debenture issue expenses such as commission, brokerage,etc. are premium payable on redemption (treated as loss on issue which mayinclude discount also) are to be written off as early as possible, or over the lifespan of the debentures, depending upon the policy of the company in the absenceof any specific instructions in the question, such amount should be written off onthe basis of debentures outstanding. The unwritten off balance is to be shown onthe assets side of the Balance Sheet under the heading of ‘Miscellaneous Expen-diture’.
It should be remember that only written off amount is charged to Profit and LossAccount.
4) Prelimiary Expenses: As already explained under Balance Sheet items, itappears on the assets side of the Balance Sheet under the heading ‘MiscellaneousExpenditure’ as long as it is not written off. The amount written off is charged toProfit and Loss Account. If there is no specific instructions relating to theamount to be written off, then the entire amount should be shown in theBalance Sheet.
5) Corporate Income Tax: This is shown under three stages.i) Advance Income Tax: As per Income Act 1961, the companies are required
to pay income tax on the profits earned. They have to deposit advance taxunder PAYE (Pay As You Earn) scheme on specific dates during the finan-cial year. The advance tax so paid is adjusted against income tax liability.The unadjusted amount of advance income tax is shown as an asset underthe heading Current Assets, Loans and Advances.
ii) Provision for Taxation: While preparing Profit and Loss Account, aprovision for income tax is created on the basis of current year’s profit tomeet the actual tax liability. The amount so provided depends on the prevail-ing tax rate. The current rate of corporate tax is 35% plus 5% surcharge fordomestic companies and 40% plus 5% surcharge for foreign companies. Thefollowing entry is recorded.
Profit and Loss Account Dr.To Provision for Taxation A/c
AS–22 “Accounting for Taxes on Income” recommends that the net balance, i.e.excess of “Advance Tax” may be shown on the assets side or liabilities side of theBalance Sheet as the case may be, till the final assessment is made and actual taxliability is determined by the tax authorities.
iii) Determination of Actual Tax Liability: As per Income Tax rules, income(profits) for the previous year is assessed and taxed in the assessment year.When the assessment is completed the provision for taxation so createdmay either fall short of actual tax liability or may exceed the tax liability.Such a shortfall or excess is treated as prior period item (AS–5) andtherefore its adjustment is made in the Profit and Loss Account but“below the line”, either to the debit side (for shortfall) or to the creditside (for excess).On the other hand, the actual tax liability is compared with advance incometax paid. In case actual tax liability is more than the amount of advancetax paid the same may be paid or shown as a current liability in theBalance Sheet and if advance tax paid exceeds, the difference beingrefund should be stated under Current Assets Loans and Advances in theBalance Sheet.
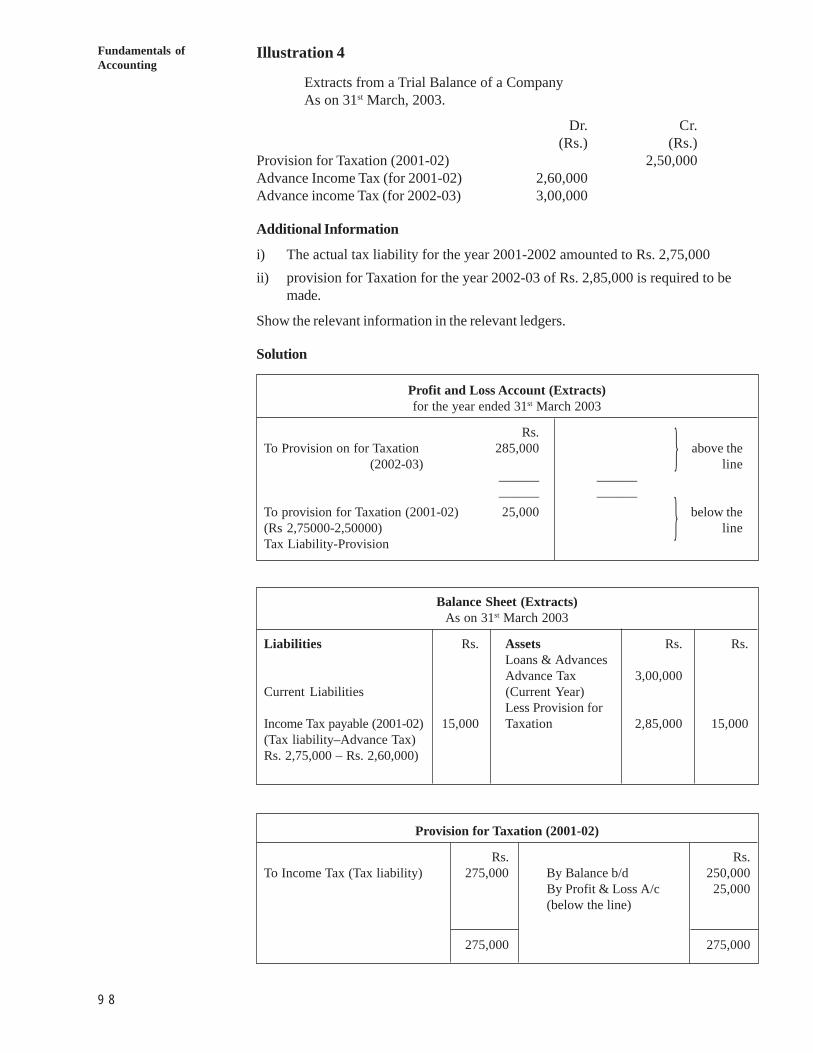
9 8
Fundamentals ofAccounting
Illustration 4
Extracts from a Trial Balance of a CompanyAs on 31st March, 2003.
Dr. Cr.(Rs.) (Rs.)
Provision for Taxation (2001-02) 2,50,000Advance Income Tax (for 2001-02) 2,60,000Advance income Tax (for 2002-03) 3,00,000
Additional Information
i) The actual tax liability for the year 2001-2002 amounted to Rs. 2,75,000ii) provision for Taxation for the year 2002-03 of Rs. 2,85,000 is required to be
made.
Show the relevant information in the relevant ledgers.
Solution
Profit and Loss Account (Extracts)for the year ended 31st March 2003
Rs.To Provision on for Taxation 285,000 above the (2002-03) line
–––––– –––––––––––– ––––––
To provision for Taxation (2001-02) 25,000 below the(Rs 2,75000-2,50000) lineTax Liability-Provision
Balance Sheet (Extracts)As on 31st March 2003
Liabilities Rs. Assets Rs. Rs.Loans & AdvancesAdvance Tax 3,00,000
Current Liabilities (Current Year)Less Provision for
Income Tax payable (2001-02) 15,000 Taxation 2,85,000 15,000(Tax liability–Advance Tax)Rs. 2,75,000 – Rs. 2,60,000)
Provision for Taxation (2001-02)
Rs. Rs.To Income Tax (Tax liability) 275,000 By Balance b/d 250,000
By Profit & Loss A/c 25,000(below the line)
275,000 275,000
}}
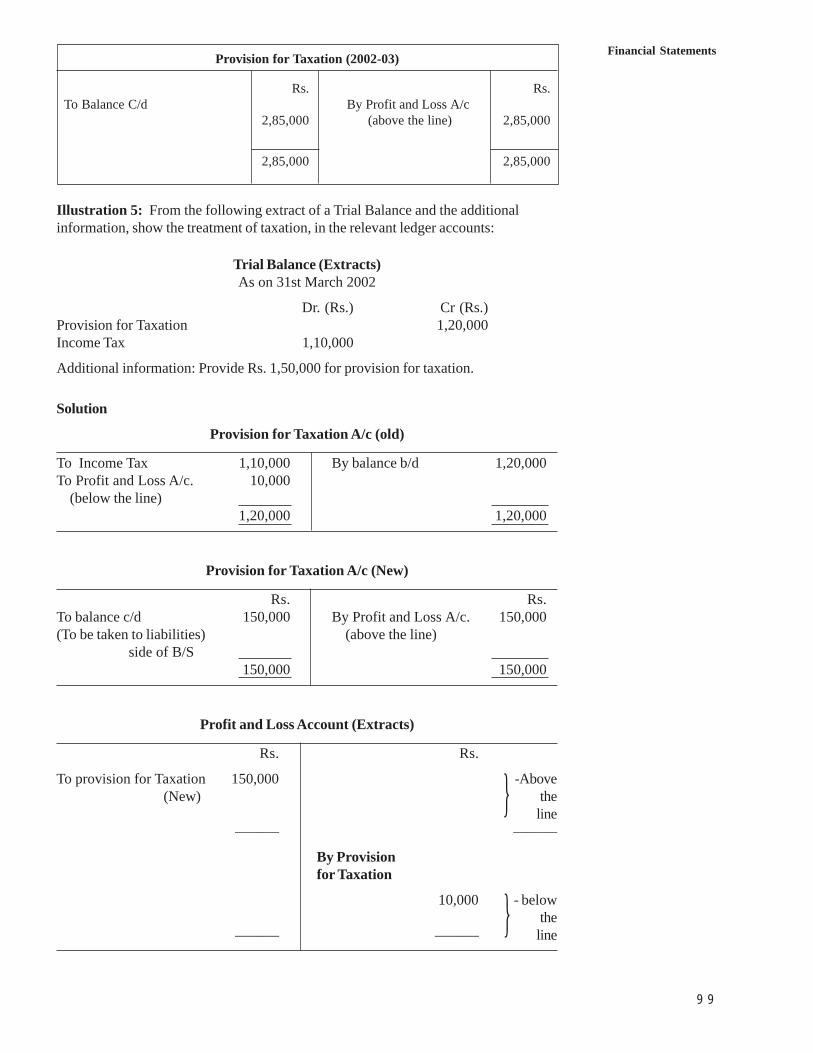
9 9
Financial StatementsProvision for Taxation (2002-03)
Rs. Rs.To Balance C/d By Profit and Loss A/c
2,85,000 (above the line) 2,85,000
2,85,000 2,85,000
Illustration 5: From the following extract of a Trial Balance and the additionalinformation, show the treatment of taxation, in the relevant ledger accounts:
Trial Balance (Extracts)As on 31st March 2002
Dr. (Rs.) Cr (Rs.)Provision for Taxation 1,20,000Income Tax 1,10,000
Additional information: Provide Rs. 1,50,000 for provision for taxation.
Solution
Provision for Taxation A/c (old)
To Income Tax 1,10,000 By balance b/d 1,20,000To Profit and Loss A/c. 10,000 (below the line)
1,20,000 1,20,000
Provision for Taxation A/c (New)
Rs. Rs.To balance c/d 150,000 By Profit and Loss A/c. 150,000(To be taken to liabilities) (above the line) side of B/S
150,000 150,000
Profit and Loss Account (Extracts)
Rs. Rs.
To provision for Taxation 150,000 -Above (New) the
line–––––– ––––––
By Provisionfor Taxation
10,000 - belowthe
–––––– –––––– line}
}
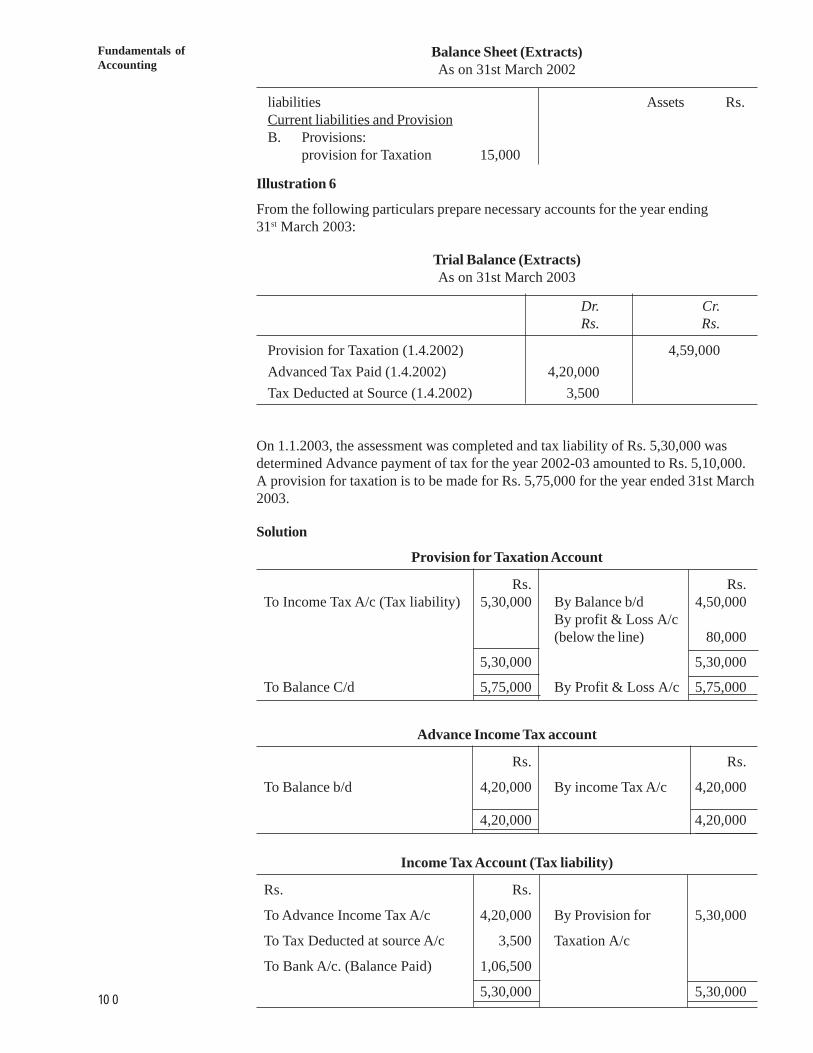
1 0 0
Fundamentals ofAccounting
Balance Sheet (Extracts)As on 31st March 2002
liabilities Assets Rs.Current liabilities and ProvisionB. Provisions:
provision for Taxation 15,000
Illustration 6
From the following particulars prepare necessary accounts for the year ending31st March 2003:
Trial Balance (Extracts)As on 31st March 2003
Dr. Cr.Rs. Rs.
Provision for Taxation (1.4.2002) 4,59,000Advanced Tax Paid (1.4.2002) 4,20,000Tax Deducted at Source (1.4.2002) 3,500
On 1.1.2003, the assessment was completed and tax liability of Rs. 5,30,000 wasdetermined Advance payment of tax for the year 2002-03 amounted to Rs. 5,10,000.A provision for taxation is to be made for Rs. 5,75,000 for the year ended 31st March2003.
Solution
Provision for Taxation Account
Rs. Rs.To Income Tax A/c (Tax liability) 5,30,000 By Balance b/d 4,50,000
By profit & Loss A/c(below the line) 80,000
5,30,000 5,30,000
To Balance C/d 5,75,000 By Profit & Loss A/c 5,75,000
Advance Income Tax account
Rs. Rs.
To Balance b/d 4,20,000 By income Tax A/c 4,20,000
4,20,000 4,20,000
Income Tax Account (Tax liability)
Rs. Rs.
To Advance Income Tax A/c 4,20,000 By Provision for 5,30,000
To Tax Deducted at source A/c 3,500 Taxation A/c
To Bank A/c. (Balance Paid) 1,06,500
5,30,000 5,30,000
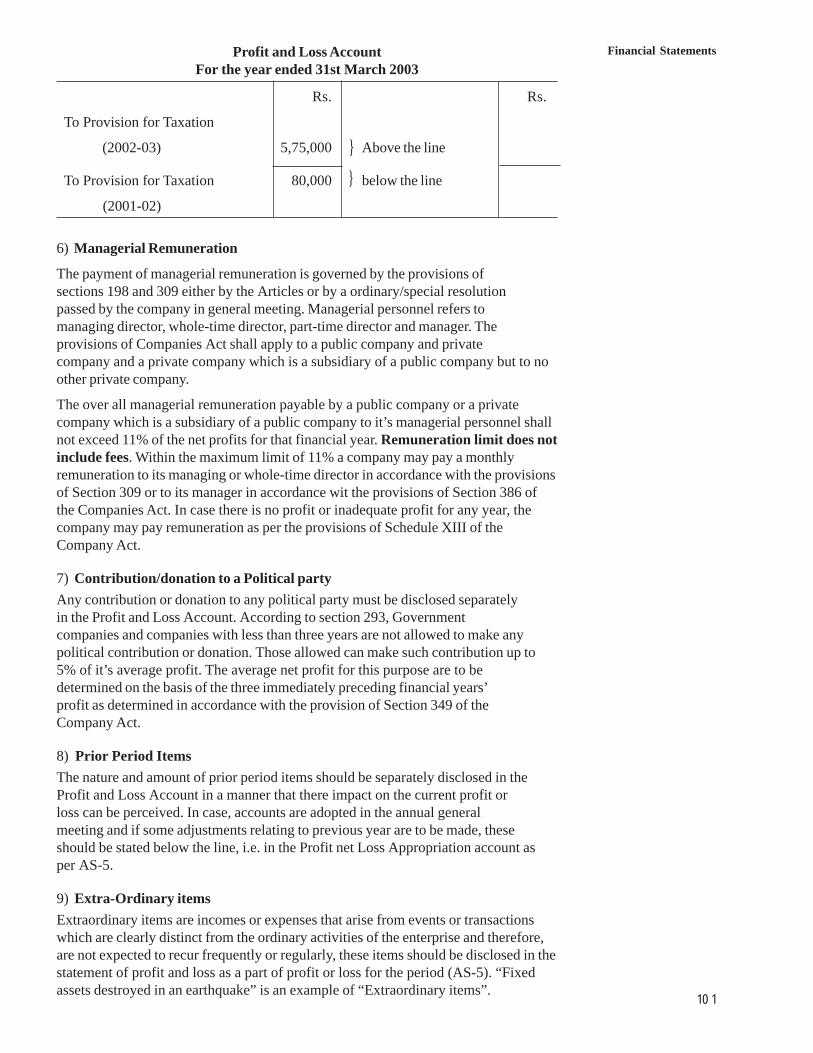
1 0 1
Financial StatementsProfit and Loss AccountFor the year ended 31st March 2003
Rs. Rs.
To Provision for Taxation
(2002-03) 5,75,000 Above the line
To Provision for Taxation 80,000 below the line
(2001-02)
6) Managerial Remuneration
The payment of managerial remuneration is governed by the provisions ofsections 198 and 309 either by the Articles or by a ordinary/special resolutionpassed by the company in general meeting. Managerial personnel refers tomanaging director, whole-time director, part-time director and manager. Theprovisions of Companies Act shall apply to a public company and privatecompany and a private company which is a subsidiary of a public company but to noother private company.
The over all managerial remuneration payable by a public company or a privatecompany which is a subsidiary of a public company to it’s managerial personnel shallnot exceed 11% of the net profits for that financial year. Remuneration limit does notinclude fees. Within the maximum limit of 11% a company may pay a monthlyremuneration to its managing or whole-time director in accordance with the provisionsof Section 309 or to its manager in accordance wit the provisions of Section 386 ofthe Companies Act. In case there is no profit or inadequate profit for any year, thecompany may pay remuneration as per the provisions of Schedule XIII of theCompany Act.
7) Contribution/donation to a Political partyAny contribution or donation to any political party must be disclosed separatelyin the Profit and Loss Account. According to section 293, Governmentcompanies and companies with less than three years are not allowed to make anypolitical contribution or donation. Those allowed can make such contribution up to5% of it’s average profit. The average net profit for this purpose are to bedetermined on the basis of the three immediately preceding financial years’profit as determined in accordance with the provision of Section 349 of theCompany Act.
8) Prior Period ItemsThe nature and amount of prior period items should be separately disclosed in theProfit and Loss Account in a manner that there impact on the current profit orloss can be perceived. In case, accounts are adopted in the annual generalmeeting and if some adjustments relating to previous year are to be made, theseshould be stated below the line, i.e. in the Profit net Loss Appropriation account asper AS-5.
9) Extra-Ordinary itemsExtraordinary items are incomes or expenses that arise from events or transactionswhich are clearly distinct from the ordinary activities of the enterprise and therefore,are not expected to recur frequently or regularly, these items should be disclosed in thestatement of profit and loss as a part of profit or loss for the period (AS-5). “Fixedassets destroyed in an earthquake” is an example of “Extraordinary items”.
}}
1 0 2
Fundamentals ofAccounting
10) Contingencies and Events occurring after balance Sheet Date
As per AS-4, the amount of a contingent loss should the be provided for by a chargein the statement of Profit and loss if:
i) it is possible that future events will confirm that an asset has been impaired or aliability has been incurred as at the Balance Sheet date and
ii) A reasonable estimate of the amount of the resulting loss can be made.
The existence of a contingent loss should be disclosed in the financial statements ifeither of the above condition is not met, unless the possibility of loss is remote.Contingent gains should not be disclosed in the financial statements. Only virtuallycertain gains should be recognized.
11) Appropriation and Disposition of Profits
Once the profits have been ascertained as per the statement of profit and loss, the nextstep is the appropriation and disposition of the available profit. It includes:
i) Transfer to general reserve and other reserves such as capital redemption reserve.Development rebate reserve etc.
ii) Transfer to sinking fund.iii) Transfer to Dividend Equalization fund.iv) Providing for interim or final dividend, andv) Paying bonus to share holders.
All these items are treated “below the line” or a separate “Profit and lossAppropriation Account” is prepared.
12) Dividends
Dividends refers to that amount of divisible profits which is distributed among theshare holders of the company. A member (shareholder) is entitled to receive dividendwhen it is declared by the Board of directors as per the provisions of the Article. TheBoard has absolute right to recommend the rate of dividend to the declared subject tothe approval of shareholders and provisions of Articles of Association. However, theshareholders cannot compel the Board recommend & declare dividend. It is to benoted that dividend is always declared for the working of one financial year at theannual general meeting. In case the dividend could not be declared at the annualgeneral meeting the same can be declared at the Extraordinary meeting. The power todeclare dividend is implied and does not require express authority either in the Articlesor Memorandum of Association. It should be remembered that, where a dividend hasbeen declared at Annual General Meeting, neither he company nor the directors candeclare a further dividend for the same year at the subsequent general meeting. It isknown as Final Dividend.
No devidend should be paid out of capital. Dividends should be paid in proportion tothe amount paid up on each share. No dividend shall be payable on calls in advanceunless authorised by the Articles. Dividend should be payable in cash except when itis adjusted towards unpaid amount on shares or where bonus shares are issued.According to Section 205 (2A) no company shall declare or pay dividend for anyfinancial year out of the profits from that year unless certain percentage of profit asprescribed by Central Government not exceeding 10% has been transferred to reserve.However, the company may voluntarily transfer higher percentage of the profit to itsrevenue subject to the rules laid down under the Companies (Transfer of Profits toRevenue) Rules 1975 as amended in 1976. A newly incorporated company isprohibited to transfer more than 10% of its profits to revenue for the initialthree years.
1 0 3
Financial Statementsi) Preference Dividend: The preference dividend is paid to Preferenceshareholders at a pre-determined fixed rate on priority basis. These holders areentitled dividend in preference to equity shareholders. However the preferenceshareholders can claim dividend only out of profits and if it is declared at theannual general meeting. If preference shares are of cumulative nature, thearrears of preference dividend if any, shall be payable to preferenceshareholders before any equity dividend. It should be noted that preferenceshareholders cannot force the company to pay all the dividends includingarrears. If equity shareholders are not paid any dividend, preferenceshareholders cannot claim any dividend from the company. It is to be notedthat the arrears of preference dividend are treated as a contingent liabilitywhich appears as a foot note under the Balance Sheet.Not–cumulative preference shares are not entitled to any arrears resulting fromnon-payment of dividend due to losses or inadequate profits. If a company has issuedparticipating preference shares with a right to participate in the balance of profits, leftafter paying fixed preference dividend and a certain percentage of equity dividend,then the participating preference shareholders are entitled against a certain percentageout of the balance (residua) profit as per the items of issue. For example 9%preference shares may be issued with a further right to 40% of the excess dividendover 20% paid to equity shareholders. If a company declares 25% dividend to equityto equity shareholders, the preference shareholders will get 11% dividend. (9% plus40% of (25%-20%) i.e., 2%).
ii) Unclaimed Dividend: According to Section 205 A of the companies Act 1956dividends remaining unpaid must be deposited in the “unpaid unclaimed Dividendaccount within 42 days of declaration of dividend. Any claim thereafter, must be metout of the unclaimed dividend account. Money so transferred to the aforesaid accountwhich remains unpaid or unclaimed for a period of seven years from the date of suchtransfer, shall be transferred to “Investor Education and Protection Fund” maintainedu/s 205 of Companies (Amendment) Act 1999.
Unclaimed dividend appears on the liabilities side of Balance Sheet under the head“Current liabilities & Provisions”.
iii) Proposed Dividend: Dividend recommended by the directors to be paid toshareholders for any accounting period on or after the close of books of accounts butbefore the Annual General Meeting, is known as proposed dividend. Once it isapproved by the shareholders in the General meeting, it becomes final dividend. It is tobe noted that rate of dividend declared cannot exceed the proposed dividend. Proposeddividend is an appropriation of profit, hence it is shown to the debit side of profit andloss Appropriation Account and on the liabilities side of balance sheet under theheading “Current liabilities and Provisions”.
iv) Final Dividend: It is a dividend which is declared at the annual general meeting ofthe shareholders. Such dividend is declared only after the close of books of accounts;the share holders may reduce the rate of final dividend but cannot increase it. Once thefinal dividend is declared it becomes the liability of the company. It should be notedthat when a final dividend is declared then interim dividend is not adjusted unless thereis any specific resolution for such adjustment. Final dividend is paid on paid upCapital for the whole year as against the interim dividend, which is usually paid onlyfor six months. For example N Ltd. has 5,00,000 shares of 10 each Rs. 8 paid,declares 5% p.a. interim dividend and final dividend @ 10% p.a., then the totaldividend will be Rs. 5,00,000 i.e. (Rs. 1,00,000 interim dividend + Rs. 4,00,000 finaldividend)
I.D. = (4, 00,000 5/100 × 6/12 = 1,00,000) + F.D. = (4,00,000 × 10/100)
1 0 4
Fundamentals ofAccounting
v) Interim Dividend: A dividend declared by the Directors between two annualgeneral meetings of the company is known as interim dividend, where the directorsbelieve that the company will have sufficient profits available for dividends at the endof the year, they may distribute a part of the profit as a part payment on account.Payment so made in anticipation and on account of total dividend to be paid for theyear is treated as interim dividend. However, such payment must be authorised by theArticles. Interim dividend should be declared only when the company has even a betterprospects for the second half as well. Regulation 86 of Table–A provides that “Boardmay from time to time pay to the members such interim dividend as it appears to bejustified by the profits of the company.” Thus, there is no limit on the number ofinterim dividend the company may pay in a year. The payment of interim dividenddoes not require approval of general meeting.
Companies (Amendment) Act 2000 has granted statutory recognition to the right ofdirectors to declare interim dividend. The term dividend now includes interim dividendalso. All provisions the Companies Act which apply to dividends have now becomeapplicable to interim dividends also. A company cannot declare any interim dividendunless it has made:
i) necessary provision for depreciation for the whole year.ii) prior adjustment of accumulated losses, if anyiii) and transfer to general reserve as required u/s 205 (2A)
Once an interim dividend is declared it becomes legally enforceable debtagainst the Company. Prior to the Amendment Act 2000 the interim dividendwas not an enforceable debt Board had right to rescind the resolutionalready passed.
The period, for which an interim divided is paid, is usually six months. However,students should note that whether the rate of dividend includes the words “perannum” or not. For example the directors of a company declare an interim dividend @12% per annum, the interim dividend shall be calculated only for six months. If therate declared by directors is 12% and the words “per annum” are not mentioned, thenthe dividend shall be calculated @ 12% without reference to time. i.e. 12% x amountof paid up Capital. If the Capital of the company is Rs. 10,00,000 thenin the first case interim dividend will amount to Rs. 60,00 and in the secondcase Rs. 1,20,000.
vi) Corporate Dividend Tax
Finance Act 1997 had exempted the dividend in the hands of shareholders andintroduced corporate dividend tax to be paid by the dividend paying company.Thereafter, the corporate dividend tax was withdrawn by the Finance Act 2002and the burden of tax was shifted on the shareholders and hence company was notliable to pay any tax on dividend declared, distributed or paid between 1.4.2002. to31.3.2003.
The Finance Act 2003 has again shifted the liability of such tax on the domesticcompanies who shall be liable to pay additional tax on the amount declared,distributed or paid by way of dividends on or after 1.4.2003. The rate of tax being12.5% plus surcharge @ 2.5% which is equal to 12.8125%* This rate is applicablefor the financial year 2003-04.
Note: Students should verify the rate applicable because this rate may be changed bythe Finance Act 2004 or by the subsequent Finance Act. It is further to be noted thatdividends from domestic companies in the hands of shareholders are totally exemptagain. As per guidance not it is be treated as appropriation.
1 0 5
Financial Statements13) Transfer to General Reserve
According to section 205 (2A) no company shall declare or pay dividend for anyfinancial year out of the profits for that unless a certain percentage of profits asprescribed by the Central government not exceeding 10%, has been transferred toreserve. As per the Central Government rules transfer to revenue should be made asfollows:
The Central Government has prescribed the following rules under the companies(Transfer of profits to reserve) Rules 1975 as amended in 1976.
Rate of Dividend Percentage of profits* tobe transferred to reserve
(i) If the rate of 10% but not 12.5% 2.5% dividend exceeds
(ii) “ 12.5% to 15% 5%(iii) “ 15% to 20% 7.5%(iv) If the rate of 20% 10% dividend exceeds
Accounting Treatment of Dividend
Illustration 7X Ltd. has a paid up capital of Rs. 30,00,000 dividend into 2,00,000 equity shares ofRs. 10 each and 10% 1,00,000 preference shares of Rs. 10 each. Other particularswere as under.
Rs.Opening balance of Profits and loss Appropriation Account 57,500Net profit earned during the year (after Tax) 7,50,000Dividend Declared for the year 22%
Prepare Profit and Loss Appropriation Account. Comply with necessary statutoryprovisions.
SolutionProfit and Loss Appropriation Account
Rs. Rs.To General Reserve (1) 75,000 By Balance b/d 57,500To Preference Dividend (2) 1,00,000 By Net Profit 7,50,000To Equity Dividend 4,40,000To Corporate Dividend (3) 67,500
Tax 1,25,000To Balance c/d
8,07,500 8,07,500
Working notes
(1) As per the provisions of the section 205 on a dividend of 22% a statutorytransfer of 10% on the net profit to be made.
(2) Declaration of equity dividend will automatically make the company liable to paypreference dividend. No equity dividend can be paid without paying preferencedividend.
(3) A corporate dividend Tax (C.D.T.) @ 12.5% has been provided. A surcharge of2.5% has been ignored for the sake of simplicity. However, the effective rate ofC.D.T. is 12.8123% including surcharge.
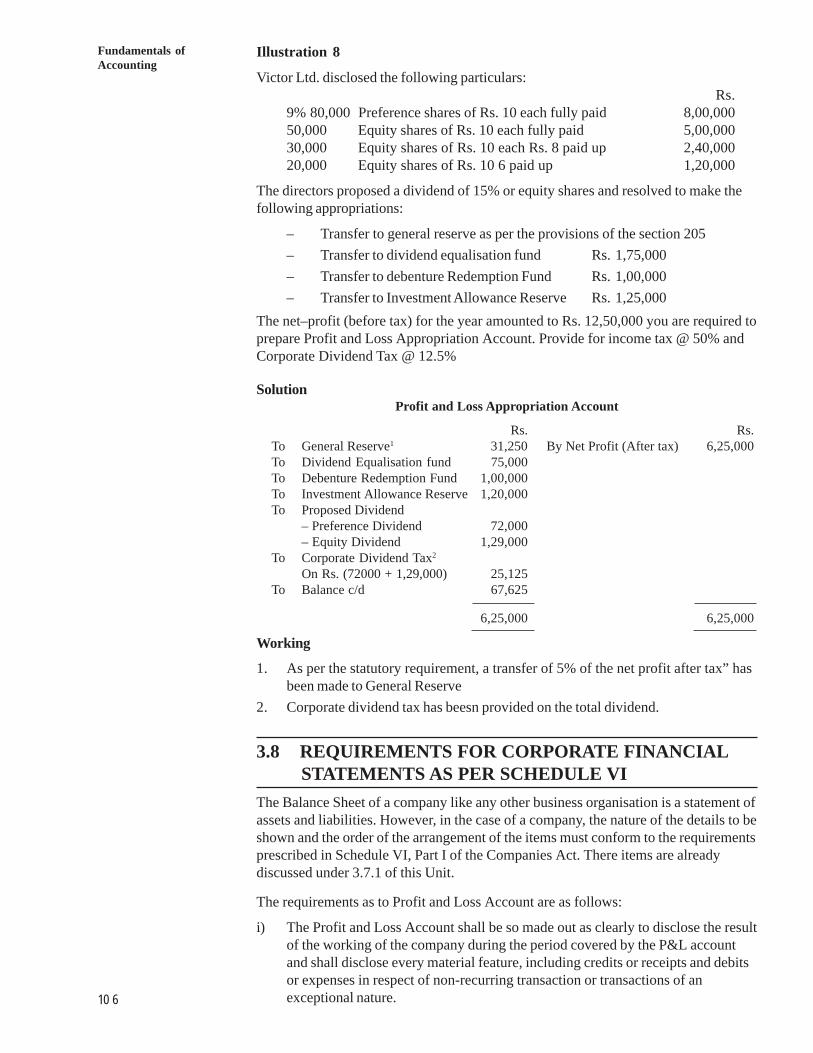
1 0 6
Fundamentals ofAccounting
Illustration 8
Victor Ltd. disclosed the following particulars:Rs.
9% 80,000 Preference shares of Rs. 10 each fully paid 8,00,00050,000 Equity shares of Rs. 10 each fully paid 5,00,00030,000 Equity shares of Rs. 10 each Rs. 8 paid up 2,40,00020,000 Equity shares of Rs. 10 6 paid up 1,20,000
The directors proposed a dividend of 15% or equity shares and resolved to make thefollowing appropriations:
– Transfer to general reserve as per the provisions of the section 205– Transfer to dividend equalisation fund Rs. 1,75,000– Transfer to debenture Redemption Fund Rs. 1,00,000– Transfer to Investment Allowance Reserve Rs. 1,25,000
The net–profit (before tax) for the year amounted to Rs. 12,50,000 you are required toprepare Profit and Loss Appropriation Account. Provide for income tax @ 50% andCorporate Dividend Tax @ 12.5%
SolutionProfit and Loss Appropriation Account
Rs. Rs.To General Reserve1 31,250 By Net Profit (After tax) 6,25,000To Dividend Equalisation fund 75,000To Debenture Redemption Fund 1,00,000To Investment Allowance Reserve 1,20,000To Proposed Dividend
– Preference Dividend 72,000– Equity Dividend 1,29,000
To Corporate Dividend Tax2
On Rs. (72000 + 1,29,000) 25,125To Balance c/d 67,625
6,25,000 6,25,000
Working
1. As per the statutory requirement, a transfer of 5% of the net profit after tax” hasbeen made to General Reserve
2. Corporate dividend tax has beesn provided on the total dividend.
3.8 REQUIREMENTS FOR CORPORATE FINANCIAL STATEMENTS AS PER SCHEDULE VIThe Balance Sheet of a company like any other business organisation is a statement ofassets and liabilities. However, in the case of a company, the nature of the details to beshown and the order of the arrangement of the items must conform to the requirementsprescribed in Schedule VI, Part I of the Companies Act. There items are alreadydiscussed under 3.7.1 of this Unit.
The requirements as to Profit and Loss Account are as follows:
i) The Profit and Loss Account shall be so made out as clearly to disclose the resultof the working of the company during the period covered by the P&L accountand shall disclose every material feature, including credits or receipts and debitsor expenses in respect of non-recurring transaction or transactions of anexceptional nature.
1 0 7
Financial Statementsii) The Income Statement is not required to be split in the parts, such asTrading Account, profit earned and appropriated. Schedule VI onlyrecommends to disclose gross profit, net profit and it’s appropriation there of.This may be shown under one head of Income Statement or Profit and LossAccount. Chargeable items are shown “above the line” whereas appropriations“below the line”.
iii) Figures relating to previous year should also be shown along with the currentyear’s figures in a separate column.
iv) As far as possible information given in the statement must be complete in allrespects. Such as the details of “turnover” made by the company should disclosesales in respect of each class of goods & their quantities separately. Likewisecommission paid to sole selling agents and to other agents should be shown alongwith the brokerage.
v) The Account should disclose quantities and values of various types of raw-material purchased and quantities and values of various products produced/purchased including opening and closing balances there of and that of work-in-progress.
vi) The amount provided for depreciation, renewals or diminution in value of fixedassets and the method adopted for making such provisions.If no such provision has been made- the fact should be disclosed by way of noteincluding arrears of depreciation.
vii) The amount of interest on company’s debentures and on other fixed period loansbe stated separately, including interest paid or payable to directors.
viii) The amount of Income Tax on profits as per Income Tax Act 1961 at the pre-scribed rate including other taxes if any, should be shown separately.
ix) Expenditure incurred on each of the following items be disclosed separately–a) Consumption of stores and spare partsb) Power and fuelc) Rentd) Repairs to Buildinge) Repairs to Machineryf) i) Salaries, Wages and bonus
ii) Contribution to provident and other fundsiii) Workmen and staff welfare expenses
g) Insuranceh) Rates and Taxes (excluding income tax)
i) Miscellaneous expenses provided any item exceeds 1% of revenue ofRs. 5,000Whichever is higher be shown separately.
j) Payment to Auditora) as auditorb) as advisor in respect of
i) Taxation matterii) Company law mattersiii) Management services
k) Remuneration received by managing directors or managers either from thecompany or it’s subsidiaries should be indicated separately including it’scomputation.
1 0 8
Fundamentals ofAccounting
x) The Profit and Loss Account should disclose the various items of incomesarranged under appropriate heads.a) Turnover giving details in respect of each class of goods indicating
quantities of such sales for each class separately.b) Amount of income from interest specifying the nature of the incomec) Income from investment stating from trade investments & other investmentsd) Profit or losses or investmentse) Dividends including dividends from subsidiary companiesf) Miscellaneous incomes such as royalty, fees etc.g) Foreign exchange earnings, if any
The Profit and Loss Account must be made out in such a manner that discloses “trueand fair” view of the profit or loss of the company for the current accounting year.This means that items of extraordinary nature or those unrelated to company’sbusiness or items relating to previous years (Prior Period items) should be separatelystated, if these are material.
Similarly amount drawn from reserves, profits from revaluation of assets or profitsarising due to change in method of accounting or major policy change in the method ofvaluation higher the operating efficiency or position much better that it actually iswould be contraray to the spirit of law.
3.9 BASIC PRINCIPLES GOVERNING THE PREPARATION OF FINANCIAL STATEMENTS1) Materiality: It is a relative term. What is material for one company may beimmaterial for other. According to American Accounting Association (AAA) an itemshould be regarded as material if there is reason to believe that knowledge of it wouldinfluence the decision of informed investors, banks, creditors & other interestedparties. AS-5 sates that all material information and items should be disclosed whichare necessary and vital to make the financial statements more clear andunderstandable – operating efficiency — wise and financial-position-wise. Treatmentof certain expenditure as capital by one company and revenue by the other is a clearexample of it. Hence materiality is purely matter of personal judgment which is guidedby size and nature of enterprise.
2) Prior Period Items: (AS-5)As a matter of fact the Profit and Loss Account should disclose the profit or loss forthe period for which accounts are prepared, that is for the reported (current) period. If,however, some items were omitted to be accounted for in the preparation of financialstatements then it is not possible to reopen the accounts for the previous year after ithas been adopted by the shareholders in the annual general meeting. The ICAI defines“Prior Period Items” as incomes or expenses which arise in the current period as aresult of errors or omissions in the preparation financial statements of one or moreperiods”. The errors may occur as a result of mathematical mistakes, oversight(omissions), misinterpretation of facts and wrong application of accounting policies ora wrong or inaccurate estimate. Hence these items should be shown “below the line”i.e. in the Profit and Loss Appropriation Account. However, prior period adjustmentsdo not cover–
– Minor omissions of accruals and prepayments– Prior period’s revenue which was not accounted for on the ground of
prudential practice.– Recovery of bad debts written off earlier– Adjustments to the useful life of the depreciable assets
1 0 9
Financial Statements3) Extra Ordinary Items: (AS–5)Extraordinary items are income or expenses that arise from events or transactions thatare clearly distinct from the ordinary activities of the enterprise and, therefore, are notexpected to recur frequently and regularly (AS-5). These items are shown in the Profitand Loss Account for the period but the nature of such items should be disclosedseparately. These include
– Write down of inventories to “net realizable value”– Profit or loss on sale of fixed assets or long-term investments.– Reversals of provisions– Reversals of writing off of the fixed assets– Losses sustained on account of an earthquake.
4) Change in Accounting Policies: (AS-5)Accounting policies are the specific accounting principles and the methods of applyingthese principles adopted by an enterprise in the preparation and presentation offinancial statements. A change in accounting policy is required by statue or by theaccounting standard setting body or if it is considered that the change will result in amore appropriate presentation of the financial statements of the enterprise. Anymaterial effect of such a change in the current or subsequent periods should bequantified and disclosed together with the reasons for the change. Following are thechange in policy:– A change in the method of charging depreciation from written down value
(WDV) to straight line method (SLM) and vice versa.– A change in the method of valuation of inventories.
However, a change in the estimated life of a machine is not a change in policybut a change in estimate.
3.10 PREPARATION OF CORPORATE FINANCIAL STATEMENTS
As already stated, the Board of Directors of the company shall present a BalanceSheet as at the end of the period; and a Profit and Loss Account for that period at theannual general meeting. In case of company not carrying on business for profit, anIncome and Expenditure Account shall be laid at the annual general meeting instead ofProfit and Loss Account. Every Profit and Loss Account shall also give a “true andfair” view of profit or loss of the company for the financial year and shall comply withthe requirements of schedule VI. Every Insurance or Banking company or anycompany engaged in the generation of electricity or any other class of company forwhich the Profit and Loss Account has been specified under the Act governing suchclass of company need not follow the Form given in Schedule VI to this Act. Similarlyevery Balance Sheet shall give a “true & fair” view of the state of affairs of thecompany as per Schedule VI. Any Insurance or Banking company or any companyengaged in generation or supply of electricity or any other class of company for whicha form of Balance Sheet has been prescribed under the Act governing such class ofcompany need not to follow such form.Recently the Companies (Amendment) Act 1999 has made the compliance ofaccounting standards mandatory. Accordingly every Profit and Loss Account andBalance Sheet of the Company shall comply with the “Accounting Standards”.However, in case of non-compliance the company must disclose the ‘deviation’ fromthe accounting standards. It should also state “reasons” for such deviation; and“financial effect” if any, due to such deviation.On the basis of requirements of Schedule VI and accounting standards following is theformat of Profit and Loss Account of a Company.
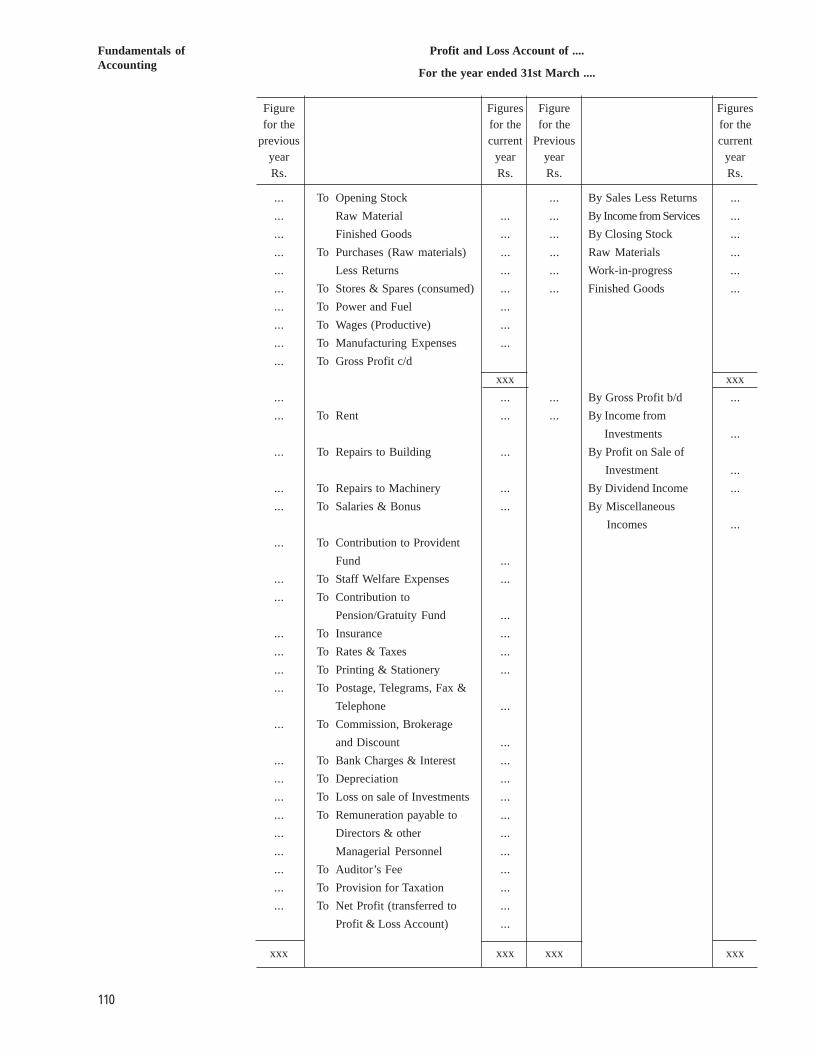
1 1 0
Fundamentals ofAccounting
Profit and Loss Account of ....
For the year ended 31st March ....
Figure Figures Figure Figuresfor the for the for the for the
previous current Previous currentyear year year yearRs. Rs. Rs. Rs.
... To Opening Stock ... By Sales Less Returns ...
... Raw Material ... ... By Income from Services ...
... Finished Goods ... ... By Closing Stock ...
... To Purchases (Raw materials) ... ... Raw Materials ...
... Less Returns ... ... Work-in-progress ...
... To Stores & Spares (consumed) ... ... Finished Goods ...
... To Power and Fuel ...
... To Wages (Productive) ...
... To Manufacturing Expenses ...
... To Gross Profit c/dxxx xxx
... ... ... By Gross Profit b/d ...
... To Rent ... ... By Income from Investments ...
... To Repairs to Building ... By Profit on Sale of Investment ...
... To Repairs to Machinery ... By Dividend Income ...
... To Salaries & Bonus ... By Miscellaneous Incomes ...
... To Contribution to ProvidentFund ...
... To Staff Welfare Expenses ...
... To Contribution toPension/Gratuity Fund ...
... To Insurance ...
... To Rates & Taxes ...
... To Printing & Stationery ...
... To Postage, Telegrams, Fax &Telephone ...
... To Commission, Brokerageand Discount ...
... To Bank Charges & Interest ...
... To Depreciation ...
... To Loss on sale of Investments ...
... To Remuneration payable to ...
... Directors & other ...
... Managerial Personnel ...
... To Auditor’s Fee ...
... To Provision for Taxation ...
... To Net Profit (transferred to ...Profit & Loss Account) ...
xxx xxx xxx xxx
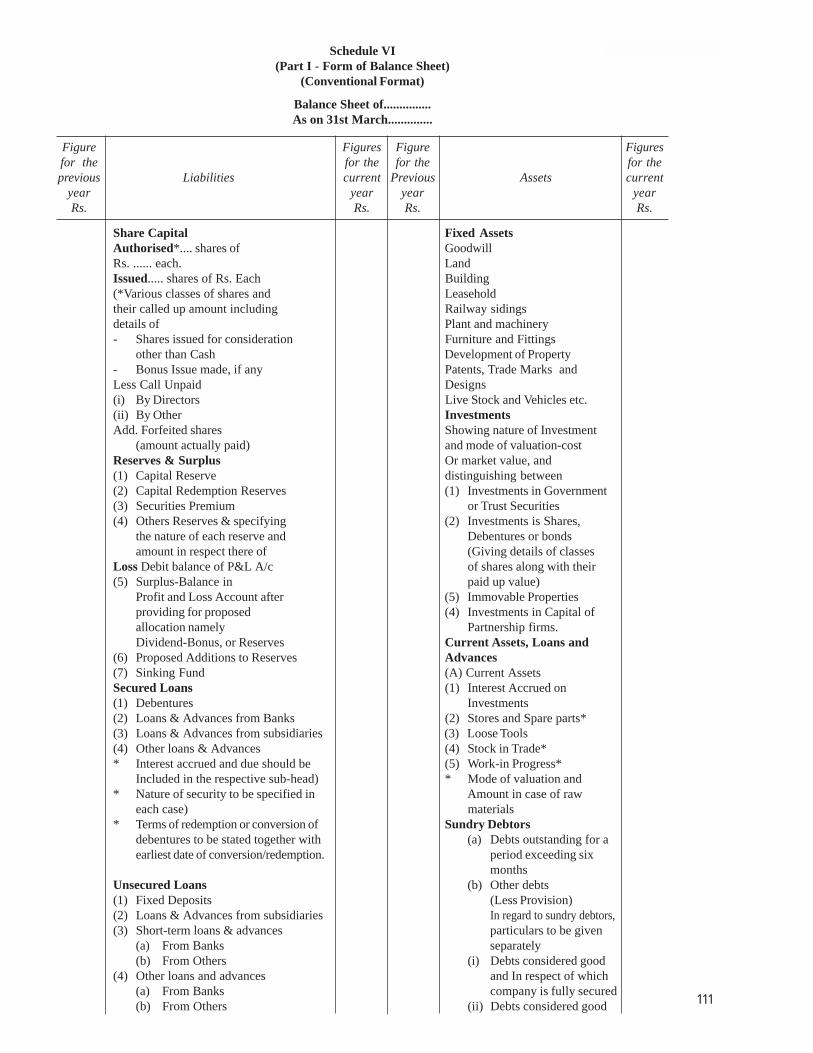
1 1 1
Financial StatementsSchedule VI(Part I - Form of Balance Sheet)
(Conventional Format)
Balance Sheet of...............As on 31st March..............
Figure Figures Figure Figuresfor the for the for the for theprevious Liabilities current Previous Assets current
year year year yearRs. Rs. Rs. Rs.
Share Capital Fixed AssetsAuthorised*.... shares of GoodwillRs. ...... each. LandIssued..... shares of Rs. Each Building(*Various classes of shares and Leaseholdtheir called up amount including Railway sidingsdetails of Plant and machinery- Shares issued for consideration Furniture and Fittings
other than Cash Development of Property- Bonus Issue made, if any Patents, Trade Marks andLess Call Unpaid Designs(i) By Directors Live Stock and Vehicles etc.(ii) By Other InvestmentsAdd. Forfeited shares Showing nature of Investment
(amount actually paid) and mode of valuation-costReserves & Surplus Or market value, and(1) Capital Reserve distinguishing between(2) Capital Redemption Reserves (1) Investments in Government(3) Securities Premium or Trust Securities(4) Others Reserves & specifying (2) Investments is Shares,
the nature of each reserve and Debentures or bondsamount in respect there of (Giving details of classes
Loss Debit balance of P&L A/c of shares along with their(5) Surplus-Balance in paid up value)
Profit and Loss Account after (5) Immovable Propertiesproviding for proposed (4) Investments in Capital ofallocation namely Partnership firms.Dividend-Bonus, or Reserves Current Assets, Loans and
(6) Proposed Additions to Reserves Advances(7) Sinking Fund (A) Current AssetsSecured Loans (1) Interest Accrued on(1) Debentures Investments(2) Loans & Advances from Banks (2) Stores and Spare parts*(3) Loans & Advances from subsidiaries (3) Loose Tools(4) Other loans & Advances (4) Stock in Trade** Interest accrued and due should be (5) Work-in Progress*
Included in the respective sub-head) * Mode of valuation and* Nature of security to be specified in Amount in case of raw
each case) materials* Terms of redemption or conversion of Sundry Debtors
debentures to be stated together with (a) Debts outstanding for aearliest date of conversion/redemption. period exceeding six
monthsUnsecured Loans (b) Other debts(1) Fixed Deposits (Less Provision)(2) Loans & Advances from subsidiaries In regard to sundry debtors,(3) Short-term loans & advances particulars to be given
(a) From Banks separately(b) From Others (i) Debts considered good
(4) Other loans and advances and In respect of which(a) From Banks company is fully secured(b) From Others (ii) Debts considered good
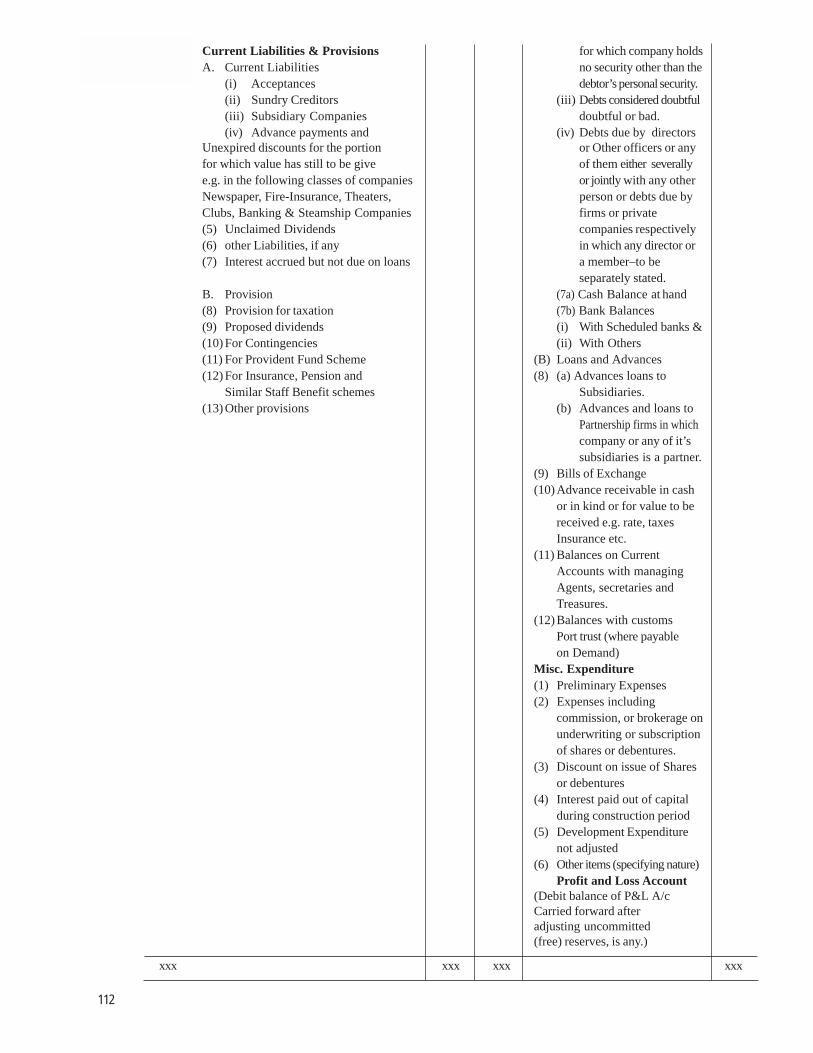
1 1 2
Fundamentals ofAccounting
Current Liabilities & Provisions for which company holdsA. Current Liabilities no security other than the
(i) Acceptances debtor’s personal security.(ii) Sundry Creditors (iii) Debts considered doubtful(iii) Subsidiary Companies doubtful or bad.(iv) Advance payments and (iv) Debts due by directors
Unexpired discounts for the portion or Other officers or anyfor which value has still to be give of them either severallye.g. in the following classes of companies or jointly with any otherNewspaper, Fire-Insurance, Theaters, person or debts due byClubs, Banking & Steamship Companies firms or private(5) Unclaimed Dividends companies respectively(6) other Liabilities, if any in which any director or(7) Interest accrued but not due on loans a member–to be
separately stated.B. Provision (7a) Cash Balance at hand(8) Provision for taxation (7b) Bank Balances(9) Proposed dividends (i) With Scheduled banks &(10) For Contingencies (ii) With Others(11) For Provident Fund Scheme (B) Loans and Advances(12) For Insurance, Pension and (8) (a) Advances loans to
Similar Staff Benefit schemes Subsidiaries.(13) Other provisions (b) Advances and loans to
Partnership firms in whichcompany or any of it’ssubsidiaries is a partner.
(9) Bills of Exchange(10) Advance receivable in cash
or in kind or for value to bereceived e.g. rate, taxesInsurance etc.
(11) Balances on CurrentAccounts with managingAgents, secretaries andTreasures.
(12) Balances with customsPort trust (where payableon Demand)
Misc. Expenditure(1) Preliminary Expenses(2) Expenses including
commission, or brokerage onunderwriting or subscriptionof shares or debentures.
(3) Discount on issue of Sharesor debentures
(4) Interest paid out of capitalduring construction period
(5) Development Expenditurenot adjusted
(6) Other items (specifying nature)Profit and Loss Account
(Debit balance of P&L A/cCarried forward afteradjusting uncommitted(free) reserves, is any.)
xxx xxx xxx xxx
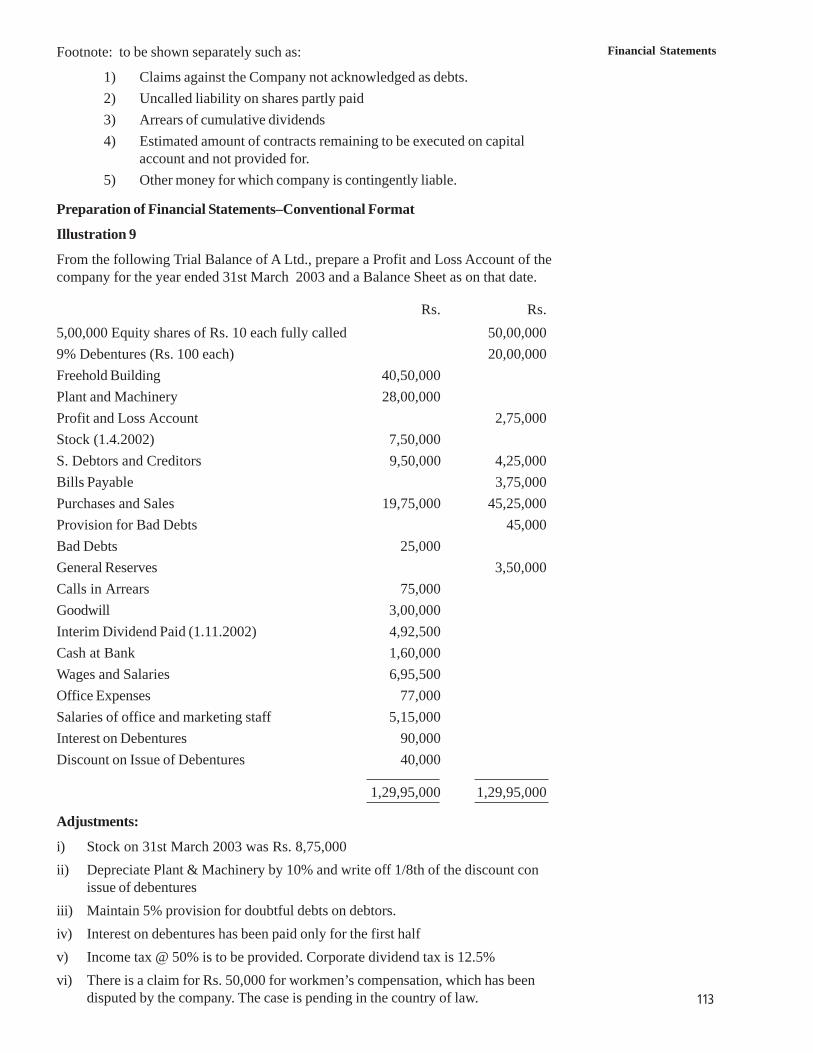
1 1 3
Financial StatementsFootnote: to be shown separately such as:
1) Claims against the Company not acknowledged as debts.2) Uncalled liability on shares partly paid3) Arrears of cumulative dividends4) Estimated amount of contracts remaining to be executed on capital
account and not provided for.5) Other money for which company is contingently liable.
Preparation of Financial Statements–Conventional Format
Illustration 9
From the following Trial Balance of A Ltd., prepare a Profit and Loss Account of thecompany for the year ended 31st March 2003 and a Balance Sheet as on that date.
Rs. Rs.5,00,000 Equity shares of Rs. 10 each fully called 50,00,0009% Debentures (Rs. 100 each) 20,00,000Freehold Building 40,50,000Plant and Machinery 28,00,000Profit and Loss Account 2,75,000Stock (1.4.2002) 7,50,000S. Debtors and Creditors 9,50,000 4,25,000Bills Payable 3,75,000Purchases and Sales 19,75,000 45,25,000Provision for Bad Debts 45,000Bad Debts 25,000General Reserves 3,50,000Calls in Arrears 75,000Goodwill 3,00,000Interim Dividend Paid (1.11.2002) 4,92,500Cash at Bank 1,60,000Wages and Salaries 6,95,500Office Expenses 77,000Salaries of office and marketing staff 5,15,000Interest on Debentures 90,000Discount on Issue of Debentures 40,000
1,29,95,000 1,29,95,000
Adjustments:
i) Stock on 31st March 2003 was Rs. 8,75,000ii) Depreciate Plant & Machinery by 10% and write off 1/8th of the discount con
issue of debenturesiii) Maintain 5% provision for doubtful debts on debtors.iv) Interest on debentures has been paid only for the first halfv) Income tax @ 50% is to be provided. Corporate dividend tax is 12.5%vi) There is a claim for Rs. 50,000 for workmen’s compensation, which has been
disputed by the company. The case is pending in the country of law.
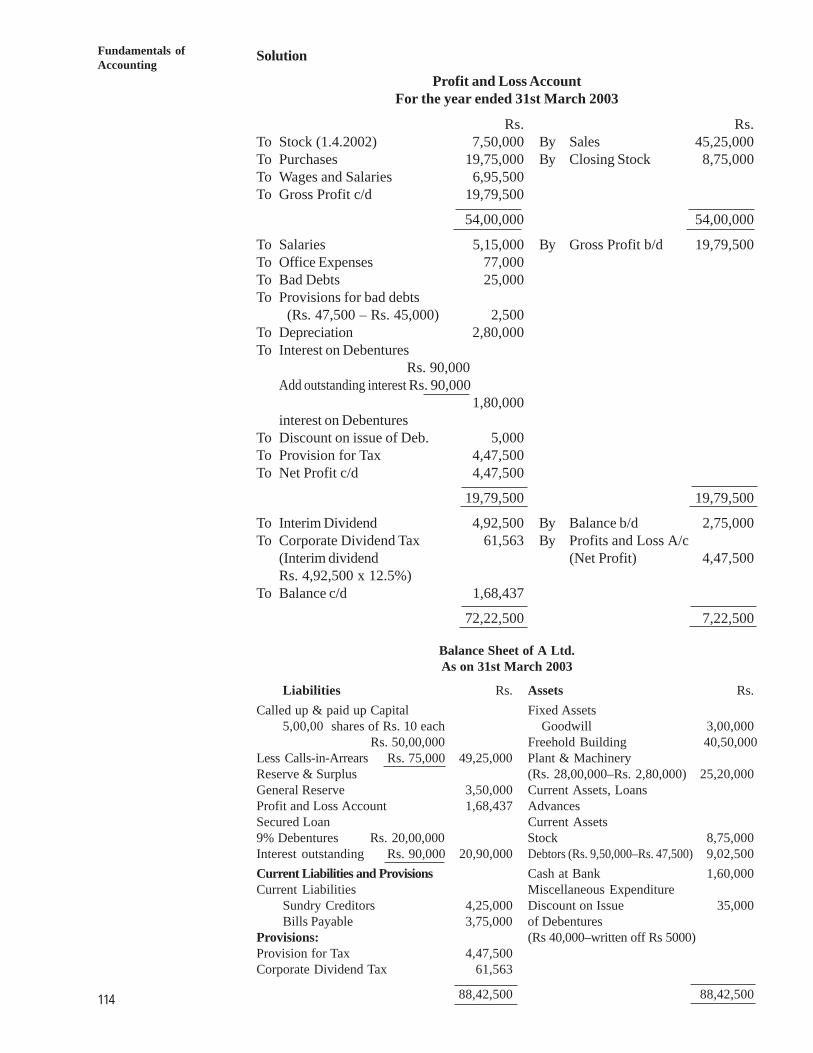
1 1 4
Fundamentals ofAccounting
Solution
Profit and Loss AccountFor the year ended 31st March 2003
Rs. Rs.To Stock (1.4.2002) 7,50,000 By Sales 45,25,000To Purchases 19,75,000 By Closing Stock 8,75,000To Wages and Salaries 6,95,500To Gross Profit c/d 19,79,500
54,00,000 54,00,000
To Salaries 5,15,000 By Gross Profit b/d 19,79,500To Office Expenses 77,000To Bad Debts 25,000To Provisions for bad debts
(Rs. 47,500 – Rs. 45,000) 2,500To Depreciation 2,80,000To Interest on Debentures
Rs. 90,000Add outstanding interest Rs. 90,000
1,80,000interest on Debentures
To Discount on issue of Deb. 5,000To Provision for Tax 4,47,500To Net Profit c/d 4,47,500
19,79,500 19,79,500
To Interim Dividend 4,92,500 By Balance b/d 2,75,000To Corporate Dividend Tax 61,563 By Profits and Loss A/c
(Interim dividend (Net Profit) 4,47,500Rs. 4,92,500 x 12.5%)
To Balance c/d 1,68,437
72,22,500 7,22,500
Balance Sheet of A Ltd.As on 31st March 2003
Liabilities Rs. Assets Rs.Called up & paid up Capital Fixed Assets
5,00,00 shares of Rs. 10 each Goodwill 3,00,000 Rs. 50,00,000 Freehold Building 40,50,000
Less Calls-in-Arrears Rs. 75,000 49,25,000 Plant & MachineryReserve & Surplus (Rs. 28,00,000–Rs. 2,80,000) 25,20,000General Reserve 3,50,000 Current Assets, LoansProfit and Loss Account 1,68,437 AdvancesSecured Loan Current Assets9% Debentures Rs. 20,00,000 Stock 8,75,000Interest outstanding Rs. 90,000 20,90,000 Debtors (Rs. 9,50,000–Rs. 47,500) 9,02,500Current Liabilities and Provisions Cash at Bank 1,60,000Current Liabilities Miscellaneous Expenditure
Sundry Creditors 4,25,000 Discount on Issue 35,000Bills Payable 3,75,000 of Debentures
Provisions: (Rs 40,000–written off Rs 5000)Provision for Tax 4,47,500Corporate Dividend Tax 61,563
88,42,500 88,42,500
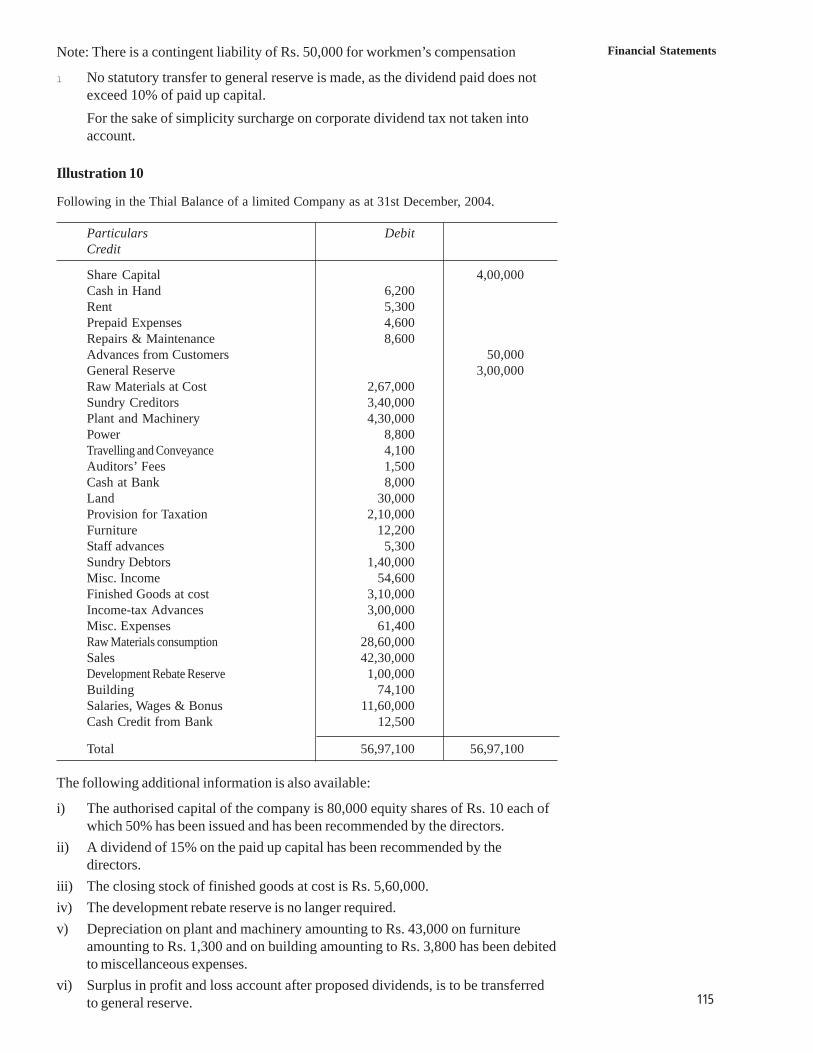
1 1 5
Financial StatementsNote: There is a contingent liability of Rs. 50,000 for workmen’s compensation
l No statutory transfer to general reserve is made, as the dividend paid does notexceed 10% of paid up capital.For the sake of simplicity surcharge on corporate dividend tax not taken intoaccount.
Illustration 10
Following in the Thial Balance of a limited Company as at 31st December, 2004.
Particulars DebitCredit
Share Capital 4,00,000Cash in Hand 6,200Rent 5,300Prepaid Expenses 4,600Repairs & Maintenance 8,600Advances from Customers 50,000General Reserve 3,00,000Raw Materials at Cost 2,67,000Sundry Creditors 3,40,000Plant and Machinery 4,30,000Power 8,800Travelling and Conveyance 4,100Auditors’ Fees 1,500Cash at Bank 8,000Land 30,000Provision for Taxation 2,10,000Furniture 12,200Staff advances 5,300Sundry Debtors 1,40,000Misc. Income 54,600Finished Goods at cost 3,10,000Income-tax Advances 3,00,000Misc. Expenses 61,400Raw Materials consumption 28,60,000Sales 42,30,000Development Rebate Reserve 1,00,000Building 74,100Salaries, Wages & Bonus 11,60,000Cash Credit from Bank 12,500
Total 56,97,100 56,97,100
The following additional information is also available:
i) The authorised capital of the company is 80,000 equity shares of Rs. 10 each ofwhich 50% has been issued and has been recommended by the directors.
ii) A dividend of 15% on the paid up capital has been recommended by thedirectors.
iii) The closing stock of finished goods at cost is Rs. 5,60,000.iv) The development rebate reserve is no langer required.v) Depreciation on plant and machinery amounting to Rs. 43,000 on furniture
amounting to Rs. 1,300 and on building amounting to Rs. 3,800 has been debitedto miscellanceous expenses.
vi) Surplus in profit and loss account after proposed dividends, is to be transferredto general reserve.
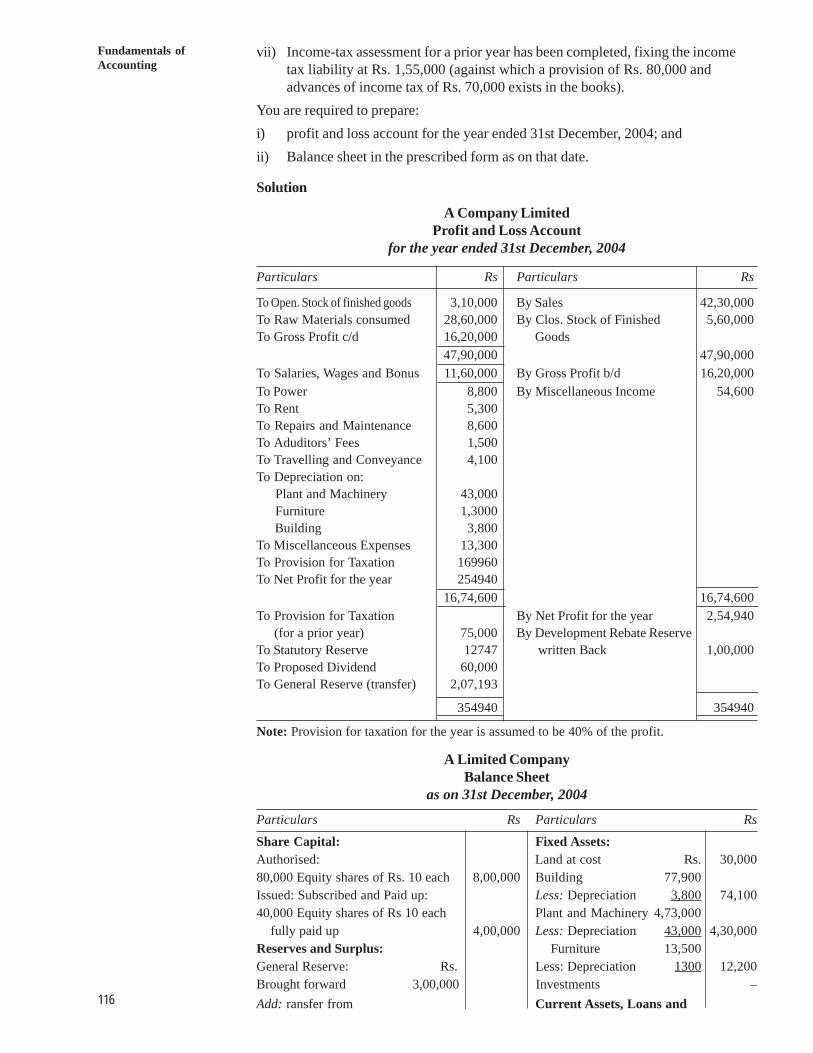
1 1 6
Fundamentals ofAccounting
vii) Income-tax assessment for a prior year has been completed, fixing the incometax liability at Rs. 1,55,000 (against which a provision of Rs. 80,000 andadvances of income tax of Rs. 70,000 exists in the books).
You are required to prepare:i) profit and loss account for the year ended 31st December, 2004; andii) Balance sheet in the prescribed form as on that date.
Solution
A Company LimitedProfit and Loss Account
for the year ended 31st December, 2004
Particulars Rs Particulars Rs
To Open. Stock of finished goods 3,10,000 By Sales 42,30,000To Raw Materials consumed 28,60,000 By Clos. Stock of Finished 5,60,000To Gross Profit c/d 16,20,000 Goods
47,90,000 47,90,000To Salaries, Wages and Bonus 11,60,000 By Gross Profit b/d 16,20,000To Power 8,800 By Miscellaneous Income 54,600To Rent 5,300To Repairs and Maintenance 8,600To Aduditors’ Fees 1,500To Travelling and Conveyance 4,100To Depreciation on: Plant and Machinery 43,000 Furniture 1,3000 Building 3,800To Miscellanceous Expenses 13,300To Provision for Taxation 169960To Net Profit for the year 254940
16,74,600 16,74,600To Provision for Taxation By Net Profit for the year 2,54,940 (for a prior year) 75,000 By Development Rebate ReserveTo Statutory Reserve 12747 written Back 1,00,000To Proposed Dividend 60,000To General Reserve (transfer) 2,07,193
354940 354940
Note: Provision for taxation for the year is assumed to be 40% of the profit.
A Limited CompanyBalance Sheet
as on 31st December, 2004
Particulars Rs Particulars RsShare Capital: Fixed Assets:Authorised: Land at cost Rs. 30,00080,000 Equity shares of Rs. 10 each 8,00,000 Building 77,900Issued: Subscribed and Paid up: Less: Depreciation 3,800 74,10040,000 Equity shares of Rs 10 each Plant and Machinery 4,73,000 fully paid up 4,00,000 Less: Depreciation 43,000 4,30,000Reserves and Surplus: Furniture 13,500General Reserve: Rs. Less: Depreciation 1300 12,200Brought forward 3,00,000 Investments –Add: ransfer from Current Assets, Loans and
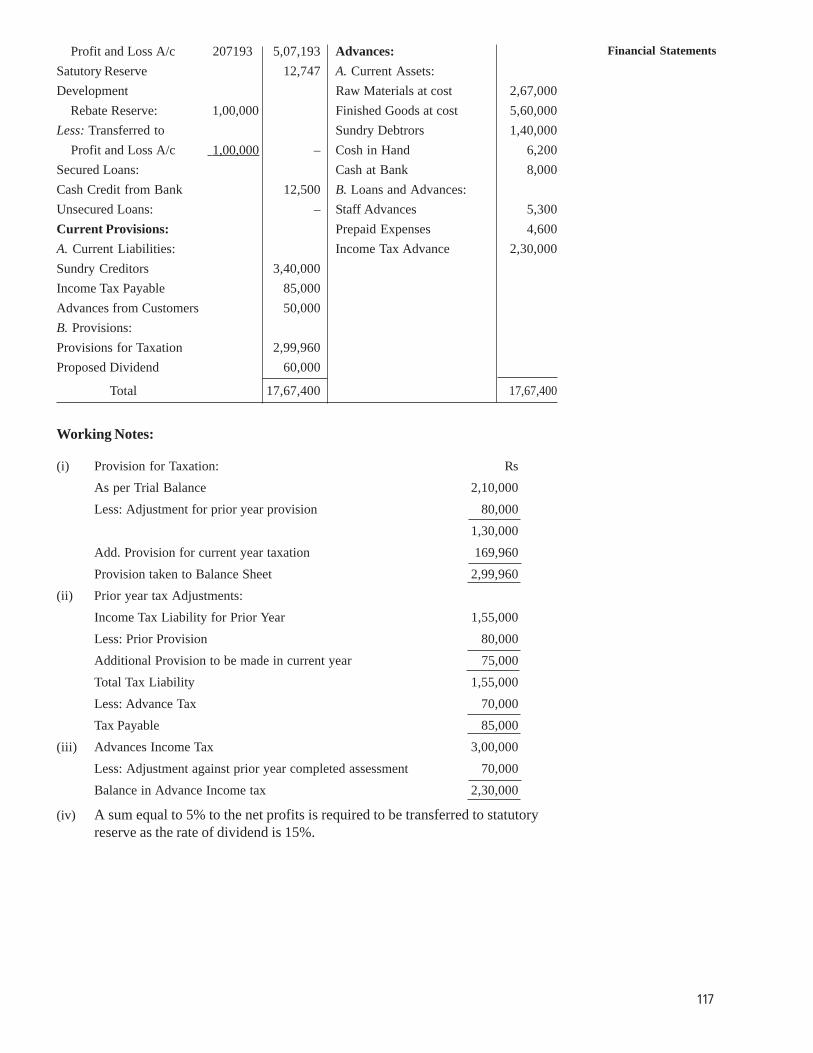
1 1 7
Financial Statements Profit and Loss A/c 207193 5,07,193 Advances:Satutory Reserve 12,747 A. Current Assets:Development Raw Materials at cost 2,67,000 Rebate Reserve: 1,00,000 Finished Goods at cost 5,60,000Less: Transferred to Sundry Debtrors 1,40,000 Profit and Loss A/c 1,00,000 – Cosh in Hand 6,200Secured Loans: Cash at Bank 8,000Cash Credit from Bank 12,500 B. Loans and Advances:Unsecured Loans: – Staff Advances 5,300Current Provisions: Prepaid Expenses 4,600A. Current Liabilities: Income Tax Advance 2,30,000Sundry Creditors 3,40,000Income Tax Payable 85,000Advances from Customers 50,000B. Provisions:Provisions for Taxation 2,99,960Proposed Dividend 60,000
Total 17,67,400 17,67,400
Working Notes:
(i) Provision for Taxation: RsAs per Trial Balance 2,10,000Less: Adjustment for prior year provision 80,000
1,30,000Add. Provision for current year taxation 169,960Provision taken to Balance Sheet 2,99,960
(ii) Prior year tax Adjustments:Income Tax Liability for Prior Year 1,55,000Less: Prior Provision 80,000Additional Provision to be made in current year 75,000Total Tax Liability 1,55,000Less: Advance Tax 70,000Tax Payable 85,000
(iii) Advances Income Tax 3,00,000Less: Adjustment against prior year completed assessment 70,000Balance in Advance Income tax 2,30,000
(iv) A sum equal to 5% to the net profits is required to be transferred to statutoryreserve as the rate of dividend is 15%.
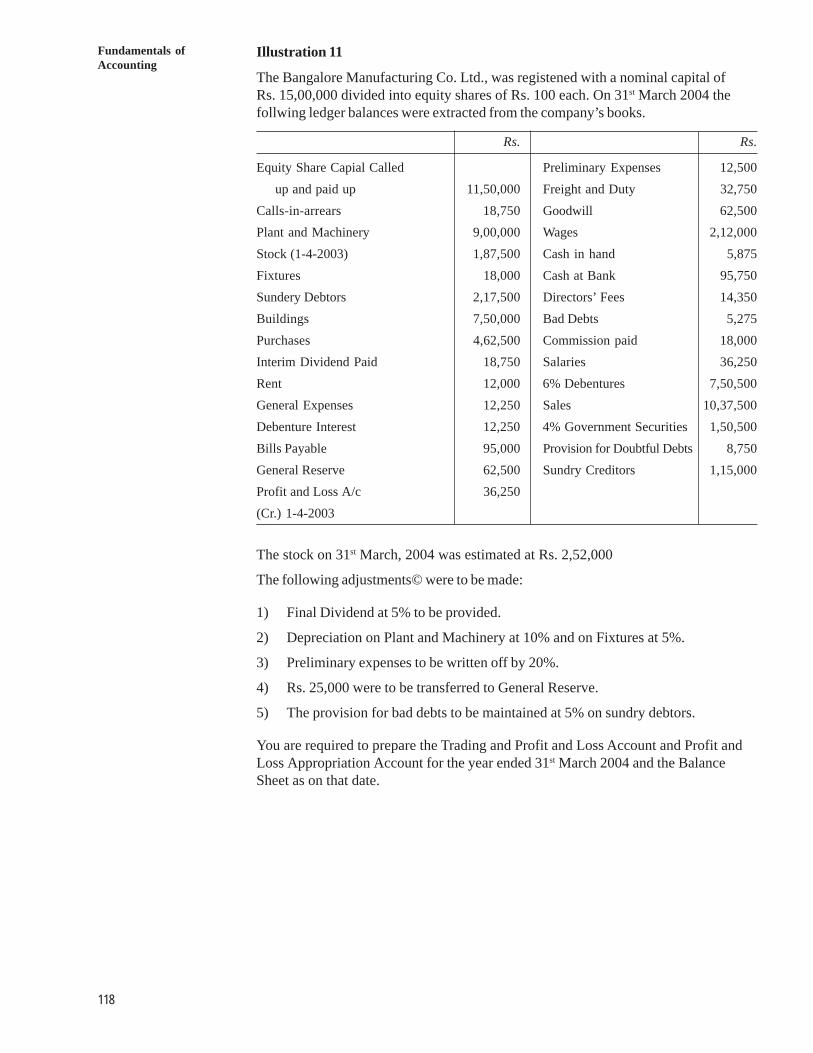
1 1 8
Fundamentals ofAccounting
Illustration 11
The Bangalore Manufacturing Co. Ltd., was registened with a nominal capital ofRs. 15,00,000 divided into equity shares of Rs. 100 each. On 31st March 2004 thefollwing ledger balances were extracted from the company’s books.
Rs. Rs.
Equity Share Capial Called Preliminary Expenses 12,500up and paid up 11,50,000 Freight and Duty 32,750
Calls-in-arrears 18,750 Goodwill 62,500Plant and Machinery 9,00,000 Wages 2,12,000Stock (1-4-2003) 1,87,500 Cash in hand 5,875Fixtures 18,000 Cash at Bank 95,750Sundery Debtors 2,17,500 Directors’ Fees 14,350Buildings 7,50,000 Bad Debts 5,275Purchases 4,62,500 Commission paid 18,000Interim Dividend Paid 18,750 Salaries 36,250Rent 12,000 6% Debentures 7,50,500General Expenses 12,250 Sales 10,37,500Debenture Interest 12,250 4% Government Securities 1,50,500Bills Payable 95,000 Provision for Doubtful Debts 8,750General Reserve 62,500 Sundry Creditors 1,15,000Profit and Loss A/c 36,250(Cr.) 1-4-2003
The stock on 31st March, 2004 was estimated at Rs. 2,52,000
The following adjustments© were to be made:
1) Final Dividend at 5% to be provided.
2) Depreciation on Plant and Machinery at 10% and on Fixtures at 5%.
3) Preliminary expenses to be written off by 20%.
4) Rs. 25,000 were to be transferred to General Reserve.
5) The provision for bad debts to be maintained at 5% on sundry debtors.
You are required to prepare the Trading and Profit and Loss Account and Profit andLoss Appropriation Account for the year ended 31st March 2004 and the BalanceSheet as on that date.
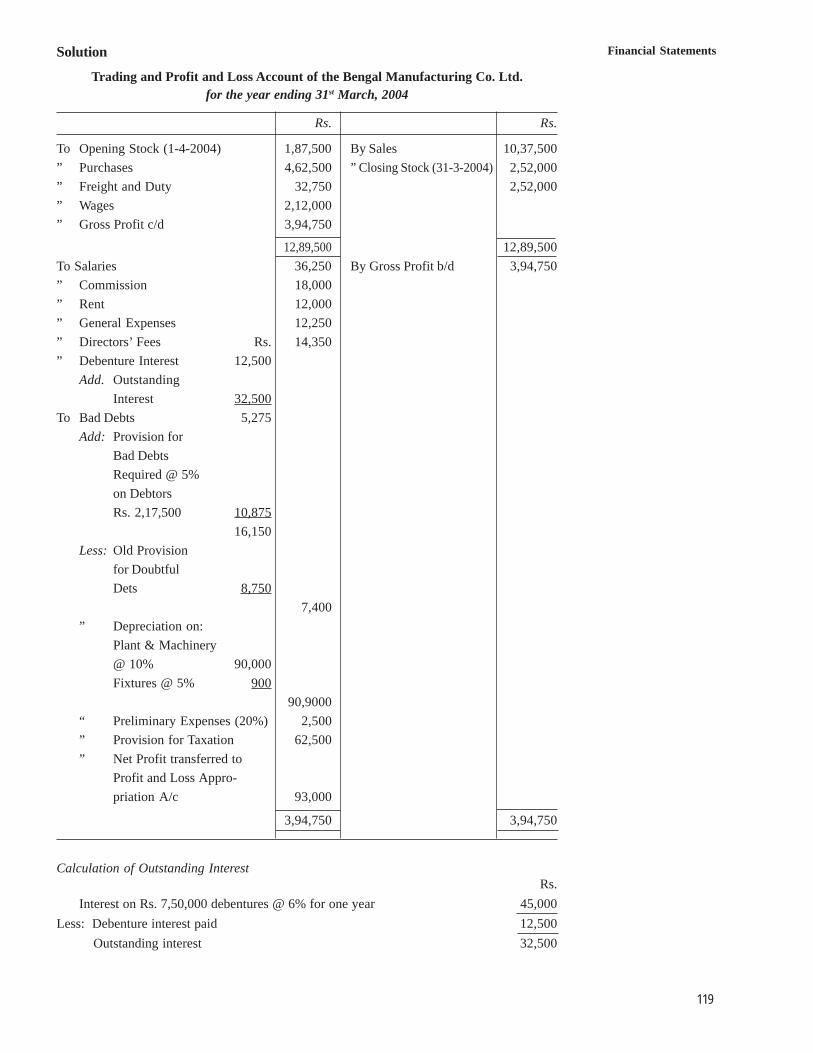
1 1 9
Financial StatementsSolution
Trading and Profit and Loss Account of the Bengal Manufacturing Co. Ltd.for the year ending 31st March, 2004
Rs. Rs.
To Opening Stock (1-4-2004) 1,87,500 By Sales 10,37,500” Purchases 4,62,500 ” Closing Stock (31-3-2004) 2,52,000” Freight and Duty 32,750 2,52,000” Wages 2,12,000” Gross Profit c/d 3,94,750
12,89,500 12,89,500To Salaries 36,250 By Gross Profit b/d 3,94,750” Commission 18,000” Rent 12,000” General Expenses 12,250” Directors’ Fees Rs. 14,350” Debenture Interest 12,500
Add. OutstandingInterest 32,500
To Bad Debts 5,275Add: Provision for
Bad DebtsRequired @ 5%on DebtorsRs. 2,17,500 10,875
16,150Less: Old Provision
for DoubtfulDets 8,750
7,400” Depreciation on:
Plant & Machinery@ 10% 90,000Fixtures @ 5% 900
90,9000“ Preliminary Expenses (20%) 2,500” Provision for Taxation 62,500” Net Profit transferred to
Profit and Loss Appro-priation A/c 93,000
3,94,750 3,94,750
Calculation of Outstanding InterestRs.
Interest on Rs. 7,50,000 debentures @ 6% for one year 45,000Less: Debenture interest paid 12,500
Outstanding interest 32,500
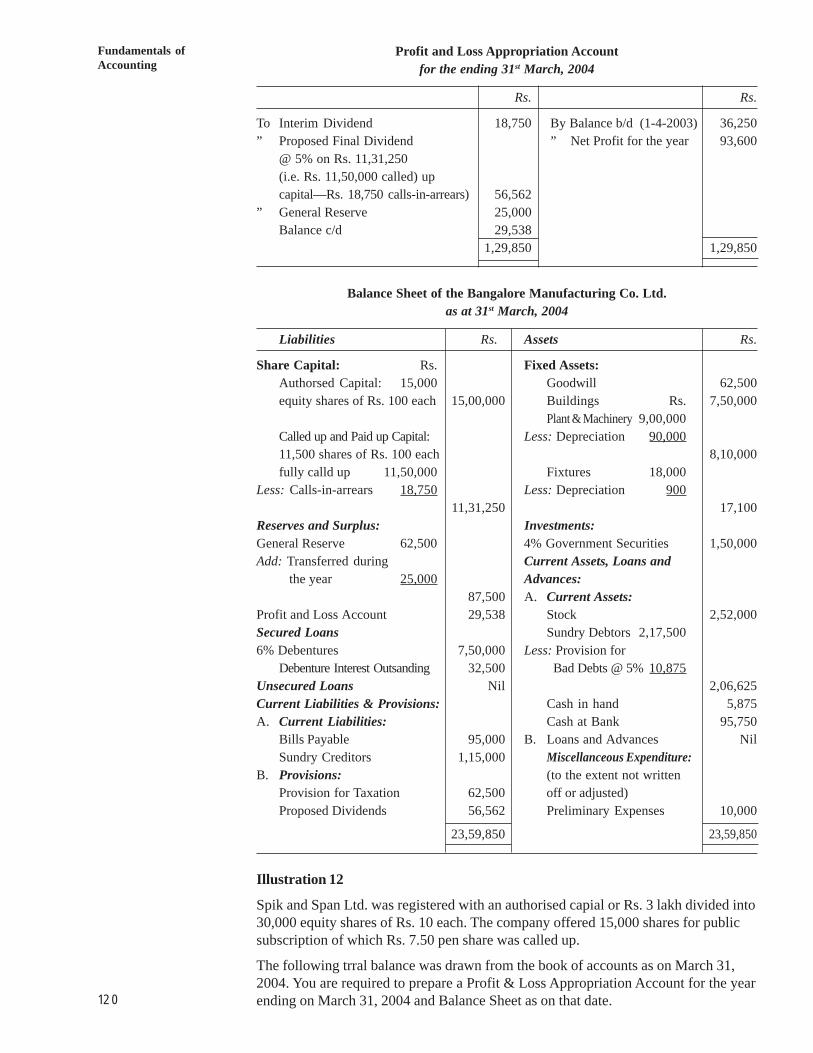
1 2 0
Fundamentals ofAccounting
Profit and Loss Appropriation Accountfor the ending 31st March, 2004
Rs. Rs.
To Interim Dividend 18,750 By Balance b/d (1-4-2003) 36,250” Proposed Final Dividend ” Net Profit for the year 93,600
@ 5% on Rs. 11,31,250(i.e. Rs. 11,50,000 called) upcapital—Rs. 18,750 calls-in-arrears) 56,562
” General Reserve 25,000Balance c/d 29,538
1,29,850 1,29,850
Balance Sheet of the Bangalore Manufacturing Co. Ltd.as at 31st March, 2004
Liabilities Rs. Assets Rs.
Share Capital: Rs. Fixed Assets:Authorsed Capital: 15,000 Goodwill 62,500equity shares of Rs. 100 each 15,00,000 Buildings Rs. 7,50,000
Plant & Machinery 9,00,000Called up and Paid up Capital: Less: Depreciation 90,00011,500 shares of Rs. 100 each 8,10,000fully calld up 11,50,000 Fixtures 18,000
Less: Calls-in-arrears 18,750 Less: Depreciation 90011,31,250 17,100
Reserves and Surplus: Investments:General Reserve 62,500 4% Government Securities 1,50,000Add: Transferred during Current Assets, Loans and
the year 25,000 Advances:87,500 A. Current Assets:
Profit and Loss Account 29,538 Stock 2,52,000Secured Loans Sundry Debtors 2,17,5006% Debentures 7,50,000 Less: Provision for
Debenture Interest Outsanding 32,500 Bad Debts @ 5% 10,875Unsecured Loans Nil 2,06,625Current Liabilities & Provisions: Cash in hand 5,875A. Current Liabilities: Cash at Bank 95,750
Bills Payable 95,000 B. Loans and Advances NilSundry Creditors 1,15,000 Miscellanceous Expenditure:
B. Provisions: (to the extent not writtenProvision for Taxation 62,500 off or adjusted)Proposed Dividends 56,562 Preliminary Expenses 10,000
23,59,850 23,59,850
Illustration 12
Spik and Span Ltd. was registered with an authorised capial or Rs. 3 lakh divided into30,000 equity shares of Rs. 10 each. The company offered 15,000 shares for publicsubscription of which Rs. 7.50 pen share was called up.
The following trral balance was drawn from the book of accounts as on March 31,2004. You are required to prepare a Profit & Loss Appropriation Account for the yearending on March 31, 2004 and Balance Sheet as on that date.
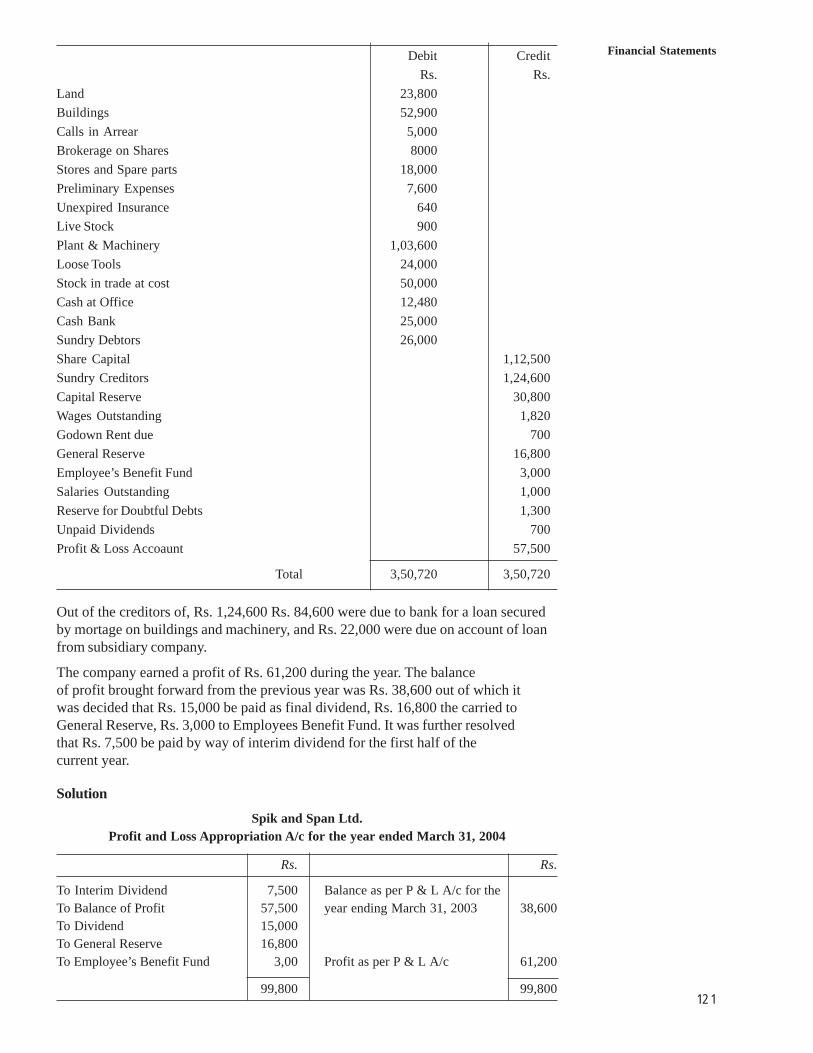
1 2 1
Financial StatementsDebit CreditRs. Rs.
Land 23,800Buildings 52,900Calls in Arrear 5,000Brokerage on Shares 8000Stores and Spare parts 18,000Preliminary Expenses 7,600Unexpired Insurance 640Live Stock 900Plant & Machinery 1,03,600Loose Tools 24,000Stock in trade at cost 50,000Cash at Office 12,480Cash Bank 25,000Sundry Debtors 26,000Share Capital 1,12,500Sundry Creditors 1,24,600Capital Reserve 30,800Wages Outstanding 1,820Godown Rent due 700General Reserve 16,800Employee’s Benefit Fund 3,000Salaries Outstanding 1,000Reserve for Doubtful Debts 1,300Unpaid Dividends 700Profit & Loss Accoaunt 57,500
Total 3,50,720 3,50,720
Out of the creditors of, Rs. 1,24,600 Rs. 84,600 were due to bank for a loan securedby mortage on buildings and machinery, and Rs. 22,000 were due on account of loanfrom subsidiary company.
The company earned a profit of Rs. 61,200 during the year. The balanceof profit brought forward from the previous year was Rs. 38,600 out of which itwas decided that Rs. 15,000 be paid as final dividend, Rs. 16,800 the carried toGeneral Reserve, Rs. 3,000 to Employees Benefit Fund. It was further resolvedthat Rs. 7,500 be paid by way of interim dividend for the first half of thecurrent year.
Solution
Spik and Span Ltd.Profit and Loss Appropriation A/c for the year ended March 31, 2004
Rs. Rs.
To Interim Dividend 7,500 Balance as per P & L A/c for theTo Balance of Profit 57,500 year ending March 31, 2003 38,600To Dividend 15,000To General Reserve 16,800To Employee’s Benefit Fund 3,00 Profit as per P & L A/c 61,200
99,800 99,800
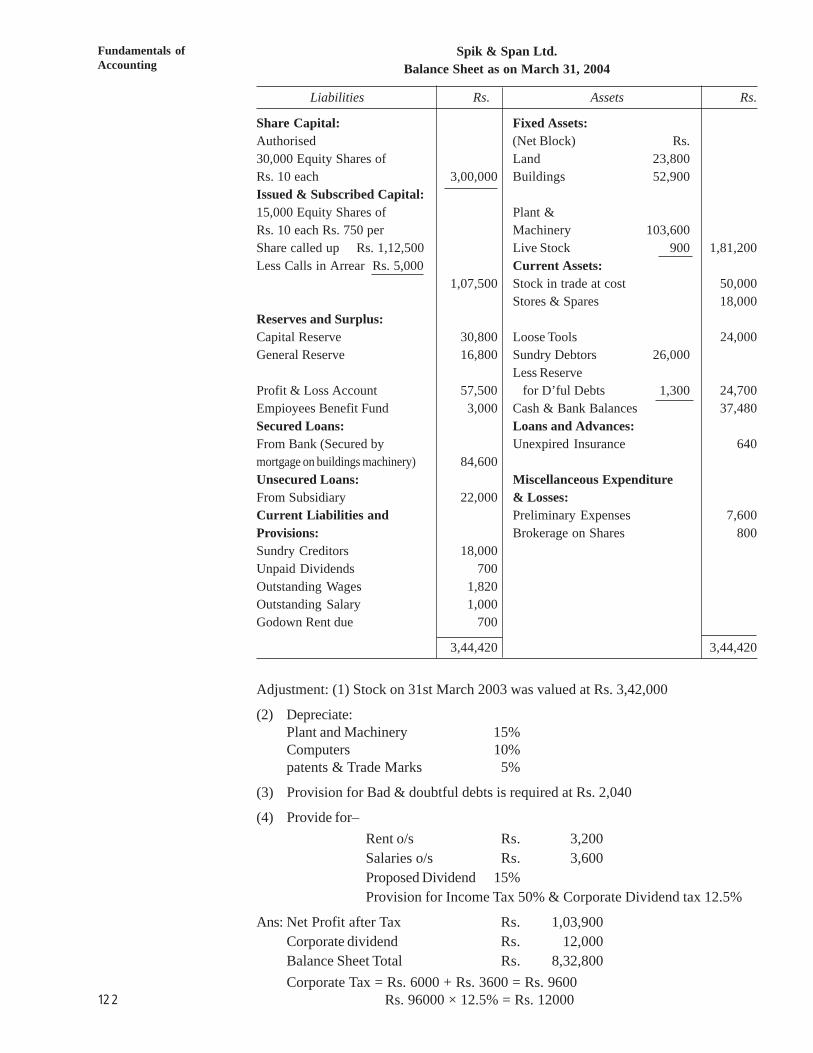
1 2 2
Fundamentals ofAccounting
Spik & Span Ltd.Balance Sheet as on March 31, 2004
Liabilities Rs. Assets Rs.
Share Capital: Fixed Assets:Authorised (Net Block) Rs.30,000 Equity Shares of Land 23,800Rs. 10 each 3,00,000 Buildings 52,900Issued & Subscribed Capital:15,000 Equity Shares of Plant &Rs. 10 each Rs. 750 per Machinery 103,600Share called up Rs. 1,12,500 Live Stock 900 1,81,200Less Calls in Arrear Rs. 5,000 Current Assets:
1,07,500 Stock in trade at cost 50,000Stores & Spares 18,000
Reserves and Surplus:Capital Reserve 30,800 Loose Tools 24,000General Reserve 16,800 Sundry Debtors 26,000
Less ReserveProfit & Loss Account 57,500 for D’ful Debts 1,300 24,700Empioyees Benefit Fund 3,000 Cash & Bank Balances 37,480Secured Loans: Loans and Advances:From Bank (Secured by Unexpired Insurance 640mortgage on buildings machinery) 84,600Unsecured Loans: Miscellanceous ExpenditureFrom Subsidiary 22,000 & Losses:Current Liabilities and Preliminary Expenses 7,600Provisions: Brokerage on Shares 800Sundry Creditors 18,000Unpaid Dividends 700Outstanding Wages 1,820Outstanding Salary 1,000Godown Rent due 700
3,44,420 3,44,420
Adjustment: (1) Stock on 31st March 2003 was valued at Rs. 3,42,000
(2) Depreciate:Plant and Machinery 15%Computers 10%patents & Trade Marks 5%
(3) Provision for Bad & doubtful debts is required at Rs. 2,040
(4) Provide for–Rent o/s Rs. 3,200Salaries o/s Rs. 3,600Proposed Dividend 15%Provision for Income Tax 50% & Corporate Dividend tax 12.5%
Ans: Net Profit after Tax Rs. 1,03,900Corporate dividend Rs. 12,000Balance Sheet Total Rs. 8,32,800Corporate Tax = Rs. 6000 + Rs. 3600 = Rs. 9600
Rs. 96000 × 12.5% = Rs. 12000
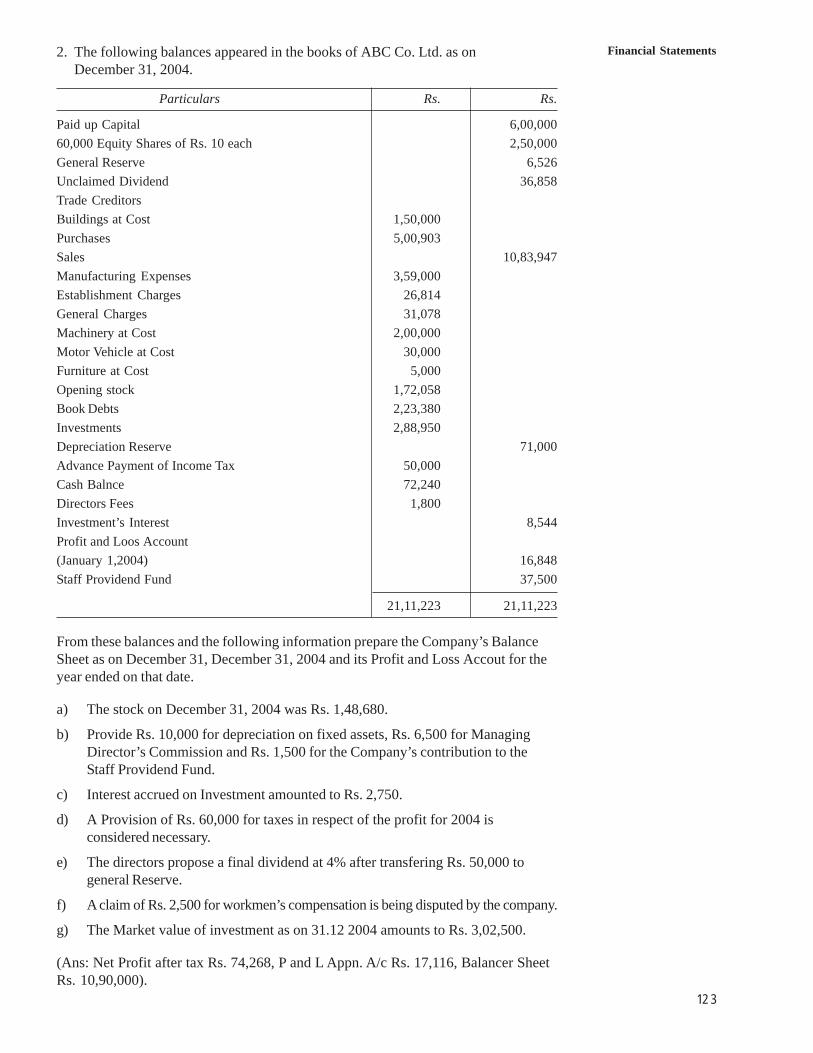
1 2 3
Financial Statements2. The following balances appeared in the books of ABC Co. Ltd. as on December 31, 2004.
Particulars Rs. Rs.
Paid up Capital 6,00,00060,000 Equity Shares of Rs. 10 each 2,50,000General Reserve 6,526Unclaimed Dividend 36,858Trade CreditorsBuildings at Cost 1,50,000Purchases 5,00,903Sales 10,83,947Manufacturing Expenses 3,59,000Establishment Charges 26,814General Charges 31,078Machinery at Cost 2,00,000Motor Vehicle at Cost 30,000Furniture at Cost 5,000Opening stock 1,72,058Book Debts 2,23,380Investments 2,88,950Depreciation Reserve 71,000Advance Payment of Income Tax 50,000Cash Balnce 72,240Directors Fees 1,800Investment’s Interest 8,544Profit and Loos Account(January 1,2004) 16,848Staff Providend Fund 37,500
21,11,223 21,11,223
From these balances and the following information prepare the Company’s BalanceSheet as on December 31, December 31, 2004 and its Profit and Loss Accout for theyear ended on that date.
a) The stock on December 31, 2004 was Rs. 1,48,680.
b) Provide Rs. 10,000 for depreciation on fixed assets, Rs. 6,500 for ManagingDirector’s Commission and Rs. 1,500 for the Company’s contribution to theStaff Providend Fund.
c) Interest accrued on Investment amounted to Rs. 2,750.
d) A Provision of Rs. 60,000 for taxes in respect of the profit for 2004 isconsidered necessary.
e) The directors propose a final dividend at 4% after transfering Rs. 50,000 togeneral Reserve.
f) A claim of Rs. 2,500 for workmen’s compensation is being disputed by the company.
g) The Market value of investment as on 31.12 2004 amounts to Rs. 3,02,500.
(Ans: Net Profit after tax Rs. 74,268, P and L Appn. A/c Rs. 17,116, Balancer SheetRs. 10,90,000).
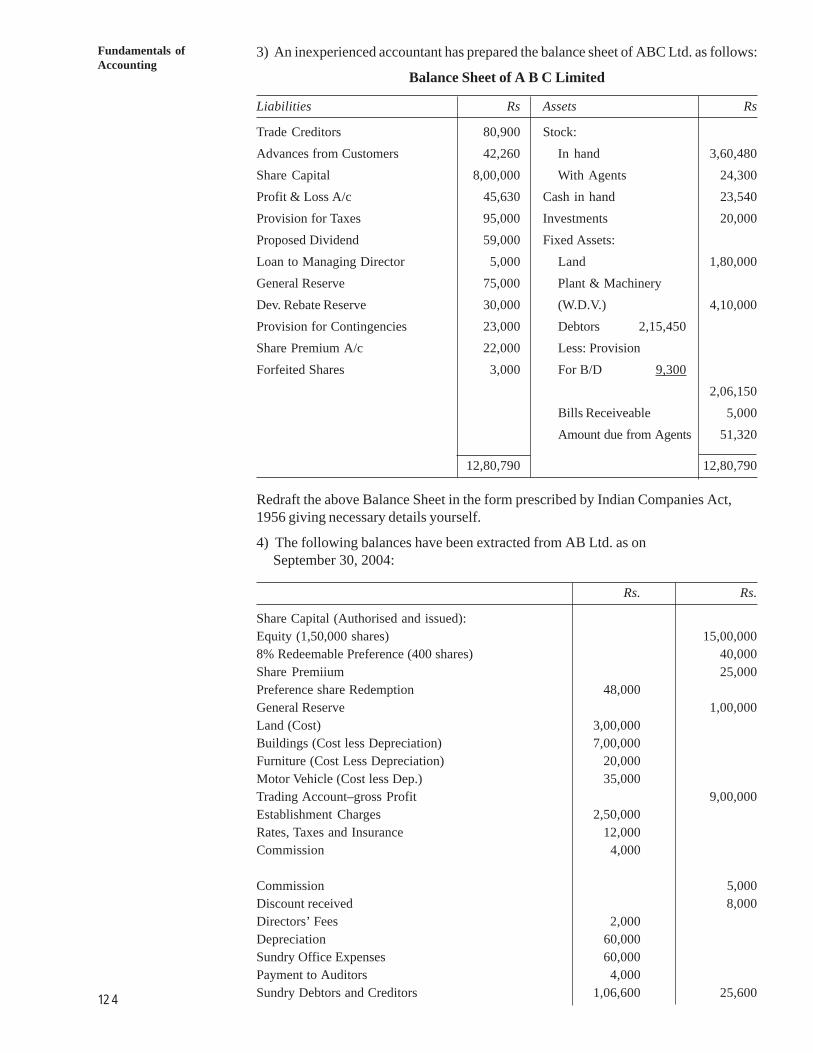
1 2 4
Fundamentals ofAccounting
3) An inexperienced accountant has prepared the balance sheet of ABC Ltd. as follows:
Balance Sheet of A B C Limited
Liabilities Rs Assets Rs
Trade Creditors 80,900 Stock:Advances from Customers 42,260 In hand 3,60,480Share Capital 8,00,000 With Agents 24,300Profit & Loss A/c 45,630 Cash in hand 23,540Provision for Taxes 95,000 Investments 20,000Proposed Dividend 59,000 Fixed Assets:Loan to Managing Director 5,000 Land 1,80,000General Reserve 75,000 Plant & MachineryDev. Rebate Reserve 30,000 (W.D.V.) 4,10,000Provision for Contingencies 23,000 Debtors 2,15,450Share Premium A/c 22,000 Less: ProvisionForfeited Shares 3,000 For B/D 9,300
2,06,150Bills Receiveable 5,000Amount due from Agents 51,320
12,80,790 12,80,790
Redraft the above Balance Sheet in the form prescribed by Indian Companies Act,1956 giving necessary details yourself.
4) The following balances have been extracted from AB Ltd. as on September 30, 2004:
Rs. Rs.
Share Capital (Authorised and issued):Equity (1,50,000 shares) 15,00,0008% Redeemable Preference (400 shares) 40,000Share Premiium 25,000Preference share Redemption 48,000General Reserve 1,00,000Land (Cost) 3,00,000Buildings (Cost less Depreciation) 7,00,000Furniture (Cost Less Depreciation) 20,000Motor Vehicle (Cost less Dep.) 35,000Trading Account–gross Profit 9,00,000Establishment Charges 2,50,000Rates, Taxes and Insurance 12,000Commission 4,000
Commission 5,000Discount received 8,000Directors’ Fees 2,000Depreciation 60,000Sundry Office Expenses 60,000Payment to Auditors 4,000Sundry Debtors and Creditors 1,06,600 25,600
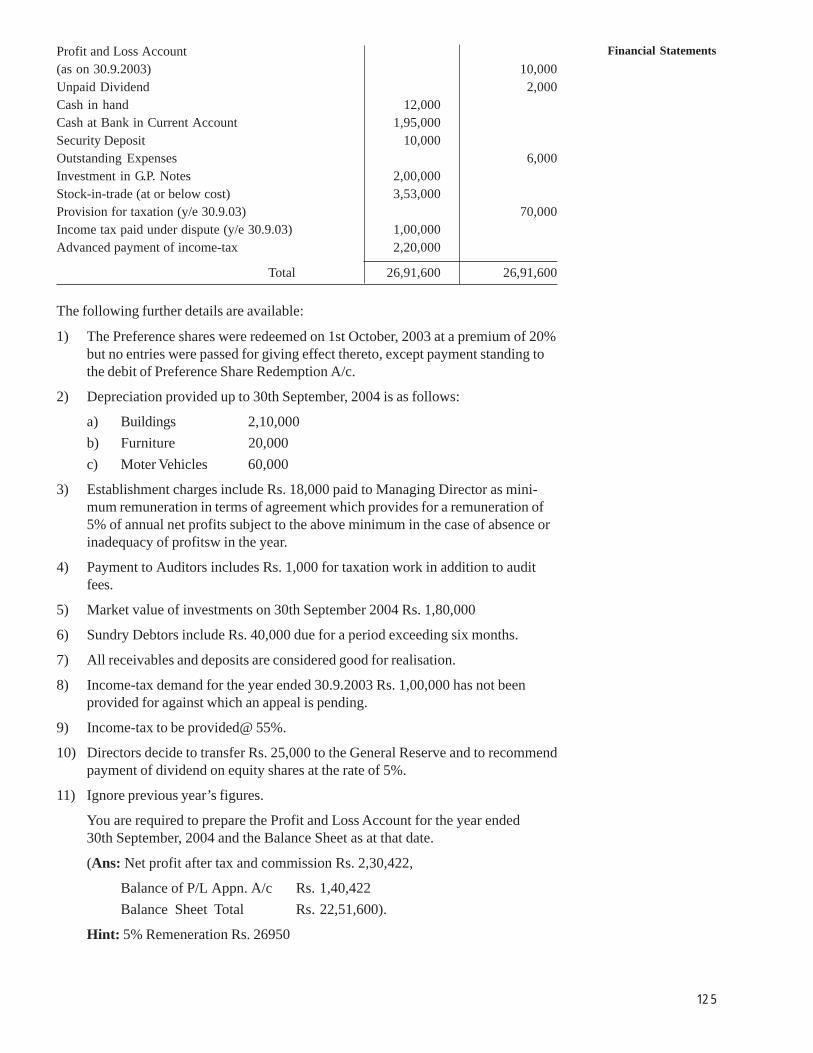
1 2 5
Financial StatementsProfit and Loss Account(as on 30.9.2003) 10,000Unpaid Dividend 2,000Cash in hand 12,000Cash at Bank in Current Account 1,95,000Security Deposit 10,000Outstanding Expenses 6,000Investment in G.P. Notes 2,00,000Stock-in-trade (at or below cost) 3,53,000Provision for taxation (y/e 30.9.03) 70,000Income tax paid under dispute (y/e 30.9.03) 1,00,000Advanced payment of income-tax 2,20,000
Total 26,91,600 26,91,600
The following further details are available:
1) The Preference shares were redeemed on 1st October, 2003 at a premium of 20%but no entries were passed for giving effect thereto, except payment standing tothe debit of Preference Share Redemption A/c.
2) Depreciation provided up to 30th September, 2004 is as follows:
a) Buildings 2,10,000b) Furniture 20,000c) Moter Vehicles 60,000
3) Establishment charges include Rs. 18,000 paid to Managing Director as mini-mum remuneration in terms of agreement which provides for a remuneration of5% of annual net profits subject to the above minimum in the case of absence orinadequacy of profitsw in the year.
4) Payment to Auditors includes Rs. 1,000 for taxation work in addition to auditfees.
5) Market value of investments on 30th September 2004 Rs. 1,80,000
6) Sundry Debtors include Rs. 40,000 due for a period exceeding six months.
7) All receivables and deposits are considered good for realisation.
8) Income-tax demand for the year ended 30.9.2003 Rs. 1,00,000 has not beenprovided for against which an appeal is pending.
9) Income-tax to be provided@ 55%.
10) Directors decide to transfer Rs. 25,000 to the General Reserve and to recommendpayment of dividend on equity shares at the rate of 5%.
11) Ignore previous year’s figures.
You are required to prepare the Profit and Loss Account for the year ended30th September, 2004 and the Balance Sheet as at that date.
(Ans: Net profit after tax and commission Rs. 2,30,422,
Balance of P/L Appn. A/c Rs. 1,40,422Balance Sheet Total Rs. 22,51,600).
Hint: 5% Remeneration Rs. 26950
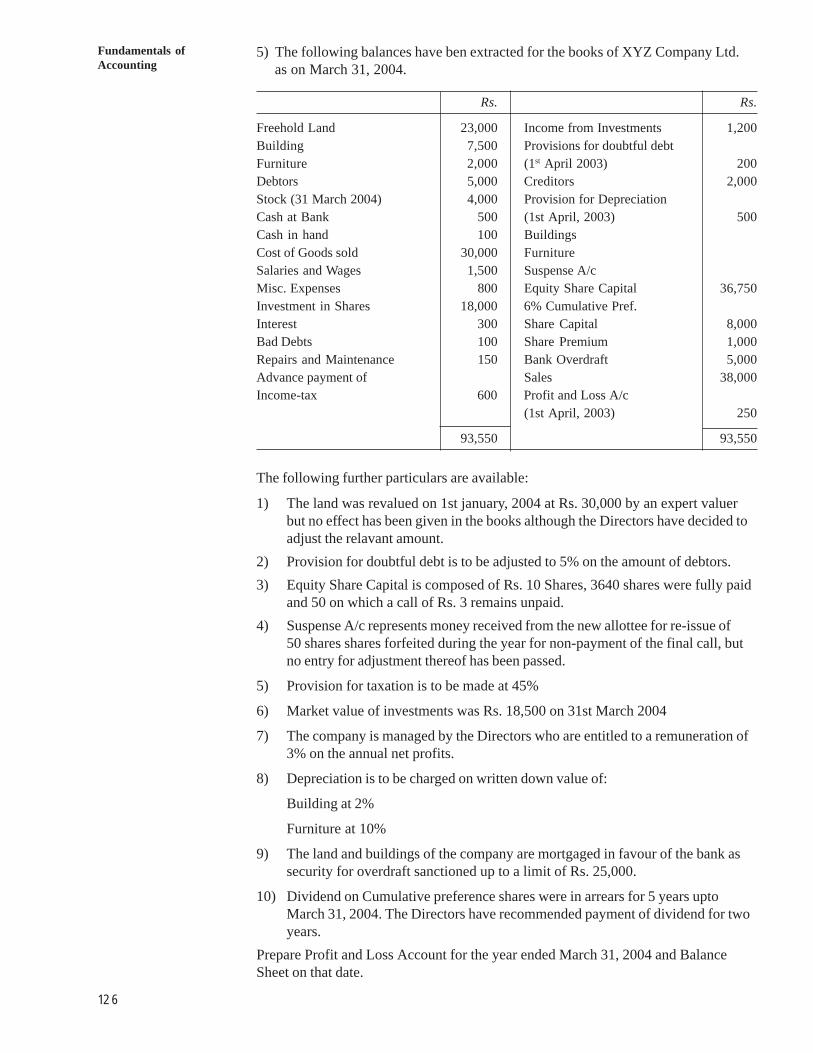
1 2 6
Fundamentals ofAccounting
5) The following balances have ben extracted for the books of XYZ Company Ltd. as on March 31, 2004.
Rs. Rs.
Freehold Land 23,000 Income from Investments 1,200Building 7,500 Provisions for doubtful debtFurniture 2,000 (1st April 2003) 200Debtors 5,000 Creditors 2,000Stock (31 March 2004) 4,000 Provision for DepreciationCash at Bank 500 (1st April, 2003) 500Cash in hand 100 BuildingsCost of Goods sold 30,000 FurnitureSalaries and Wages 1,500 Suspense A/cMisc. Expenses 800 Equity Share Capital 36,750Investment in Shares 18,000 6% Cumulative Pref.Interest 300 Share Capital 8,000Bad Debts 100 Share Premium 1,000Repairs and Maintenance 150 Bank Overdraft 5,000Advance payment of Sales 38,000Income-tax 600 Profit and Loss A/c
(1st April, 2003) 250
93,550 93,550
The following further particulars are available:
1) The land was revalued on 1st january, 2004 at Rs. 30,000 by an expert valuerbut no effect has been given in the books although the Directors have decided toadjust the relavant amount.
2) Provision for doubtful debt is to be adjusted to 5% on the amount of debtors.3) Equity Share Capital is composed of Rs. 10 Shares, 3640 shares were fully paid
and 50 on which a call of Rs. 3 remains unpaid.4) Suspense A/c represents money received from the new allottee for re-issue of
50 shares shares forfeited during the year for non-payment of the final call, butno entry for adjustment thereof has been passed.
5) Provision for taxation is to be made at 45%
6) Market value of investments was Rs. 18,500 on 31st March 2004
7) The company is managed by the Directors who are entitled to a remuneration of3% on the annual net profits.
8) Depreciation is to be charged on written down value of:
Building at 2%
Furniture at 10%
9) The land and buildings of the company are mortgaged in favour of the bank assecurity for overdraft sanctioned up to a limit of Rs. 25,000.
10) Dividend on Cumulative preference shares were in arrears for 5 years uptoMarch 31, 2004. The Directors have recommended payment of dividend for twoyears.
Prepare Profit and Loss Account for the year ended March 31, 2004 and BalanceSheet on that date.
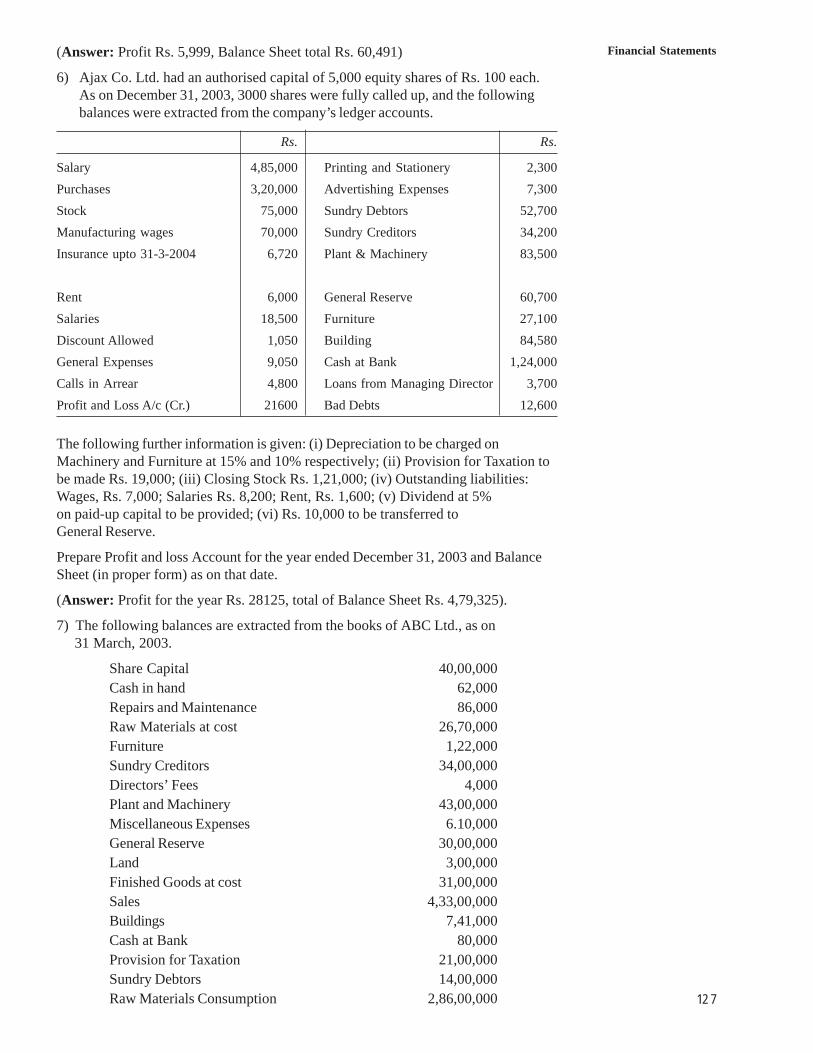
1 2 7
Financial Statements(Answer: Profit Rs. 5,999, Balance Sheet total Rs. 60,491)
6) Ajax Co. Ltd. had an authorised capital of 5,000 equity shares of Rs. 100 each.As on December 31, 2003, 3000 shares were fully called up, and the followingbalances were extracted from the company’s ledger accounts.
Rs. Rs.
Salary 4,85,000 Printing and Stationery 2,300Purchases 3,20,000 Advertishing Expenses 7,300Stock 75,000 Sundry Debtors 52,700Manufacturing wages 70,000 Sundry Creditors 34,200Insurance upto 31-3-2004 6,720 Plant & Machinery 83,500
Rent 6,000 General Reserve 60,700Salaries 18,500 Furniture 27,100Discount Allowed 1,050 Building 84,580General Expenses 9,050 Cash at Bank 1,24,000Calls in Arrear 4,800 Loans from Managing Director 3,700Profit and Loss A/c (Cr.) 21600 Bad Debts 12,600
The following further information is given: (i) Depreciation to be charged onMachinery and Furniture at 15% and 10% respectively; (ii) Provision for Taxation tobe made Rs. 19,000; (iii) Closing Stock Rs. 1,21,000; (iv) Outstanding liabilities:Wages, Rs. 7,000; Salaries Rs. 8,200; Rent, Rs. 1,600; (v) Dividend at 5%on paid-up capital to be provided; (vi) Rs. 10,000 to be transferred toGeneral Reserve.
Prepare Profit and loss Account for the year ended December 31, 2003 and BalanceSheet (in proper form) as on that date.
(Answer: Profit for the year Rs. 28125, total of Balance Sheet Rs. 4,79,325).
7) The following balances are extracted from the books of ABC Ltd., as on 31 March, 2003.
Share Capital 40,00,000Cash in hand 62,000Repairs and Maintenance 86,000Raw Materials at cost 26,70,000Furniture 1,22,000Sundry Creditors 34,00,000Directors’ Fees 4,000Plant and Machinery 43,00,000Miscellaneous Expenses 6.10,000General Reserve 30,00,000Land 3,00,000Finished Goods at cost 31,00,000Sales 4,33,00,000Buildings 7,41,000Cash at Bank 80,000Provision for Taxation 21,00,000Sundry Debtors 14,00,000Raw Materials Consumption 2,86,00,000
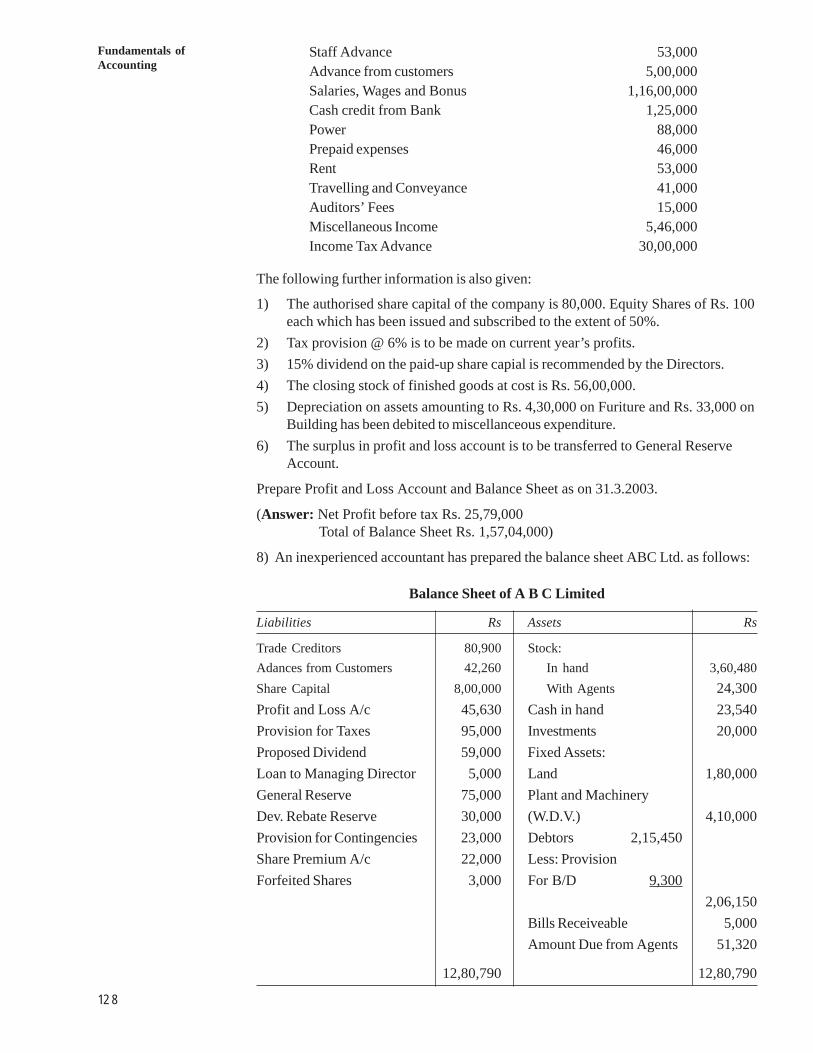
1 2 8
Fundamentals ofAccounting
Staff Advance 53,000Advance from customers 5,00,000Salaries, Wages and Bonus 1,16,00,000Cash credit from Bank 1,25,000Power 88,000Prepaid expenses 46,000Rent 53,000Travelling and Conveyance 41,000Auditors’ Fees 15,000Miscellaneous Income 5,46,000Income Tax Advance 30,00,000
The following further information is also given:
1) The authorised share capital of the company is 80,000. Equity Shares of Rs. 100each which has been issued and subscribed to the extent of 50%.
2) Tax provision @ 6% is to be made on current year’s profits.3) 15% dividend on the paid-up share capial is recommended by the Directors.4) The closing stock of finished goods at cost is Rs. 56,00,000.5) Depreciation on assets amounting to Rs. 4,30,000 on Furiture and Rs. 33,000 on
Building has been debited to miscellanceous expenditure.6) The surplus in profit and loss account is to be transferred to General Reserve
Account.
Prepare Profit and Loss Account and Balance Sheet as on 31.3.2003.
(Answer: Net Profit before tax Rs. 25,79,000 Total of Balance Sheet Rs. 1,57,04,000)
8) An inexperienced accountant has prepared the balance sheet ABC Ltd. as follows:
Balance Sheet of A B C Limited
Liabilities Rs Assets Rs
Trade Creditors 80,900 Stock:Adances from Customers 42,260 In hand 3,60,480Share Capital 8,00,000 With Agents 24,300Profit and Loss A/c 45,630 Cash in hand 23,540Provision for Taxes 95,000 Investments 20,000Proposed Dividend 59,000 Fixed Assets:Loan to Managing Director 5,000 Land 1,80,000General Reserve 75,000 Plant and MachineryDev. Rebate Reserve 30,000 (W.D.V.) 4,10,000Provision for Contingencies 23,000 Debtors 2,15,450Share Premium A/c 22,000 Less: ProvisionForfeited Shares 3,000 For B/D 9,300
2,06,150Bills Receiveable 5,000Amount Due from Agents 51,320
12,80,790 12,80,790
1 2 9
Financial Statements3.11 LET US SUM UPFinancial statements are prepared by all forms of business organisations to ascertainthe operating results of the business and to know the financial position on a particulardate. Before preparing financial statements one must gain clarity about the nature ofcertain items and their treatment in the final accounts. It is obligatory on the part ofcompanies to maintain and prepare financial statements by the end of each accountingperiod. Manufacturing account is prepared to know the cost of goods produced whileTrading account is prepared to know the results of trading operations. Profit and lossaccount is prepared to ascertain the net profit earned or net loss incurred by thebusiness concern during an accounting period. The operating and non-operatingexpenses are charged to profit and loss account. The distribution or appropriation ofprofit is shown under Profit and Loss Appropriation Account, which is also called‘Below the Line’.Balance Sheet is a statement of assets and liabilities to ascertain the financial positionof a concern at a particular date. The assets and liabilities are presented either on thebasis of liquidity or performance. Under ‘liquidity order’ assets are shown on thebasis of ‘most liquid’, ‘liquid’ and ‘least liquid’ assets. Liabilities are shown in theorder of payment. Under ‘order of performance’ the assets are arranged on the basisof their useful life whereas liabilities are shown on the besis of long term, mediumterm, short term and current liabilities.It is important to distinguish between capital and revenue to ascertain correct profit orloss amount and fair view of the affairs of the business. There are certain rules whichguide us to determine whether a particular expenditure or receipt is of a capital natureor of a revenue nature.Revenue recognition is concerned with the timing of recognition revenue in thestatement of profit and loss. ‘Realisation Concept’ recognises the revenue at the pointof sale or service rendered. Operating and non-operating revenues should be shownseparately while preparing Profit and Loss Account. There are some establishedpractices as per the Accounting Standards to recognise certain items as revenues. TheAccounting Standards have some established practices to recognise revenue in casesof sale of goods, rendering services and financial services. But there are also certainexception to this general rule.The financial statements of non-corporate entities may be presented either inconventional format or vertical format. Under vertical form various items of incomesand expenses, assets and liabilities arranged vertically to get some additionalinformation about the operating efficiency and financial position of the businessenterprise. The sole traders and partnership forms hardly adopt vertical form offinancial statements. As regards preparation of Balance Sheet of a company, thenature of details shown with respect to the liabilities and assets and the order ofarrangement of the items are prescribed in Schedule VI, Part I of the Companies Act.There are two alternate proformas given in Schedule VI for the preparation ofCompany Balance Sheets: (i) horizonal and (ii) vertical. Any of these forms may beadopted for the Balance Sheet of a Company. Both the prescribed forms may requirethat the figures of the previous year should be shown in a separate column along sidethe figures of the current year.
3.12 KEY WORDSCapital Expenditure: An expenditure which results in the acquisition of fixed assetor addition to fixed asset, or an improvement in the earning capacity of the business.Capital Receipt: Receipt in the form of additions to capital, liabilities or saleproceeds of a fixed asset.
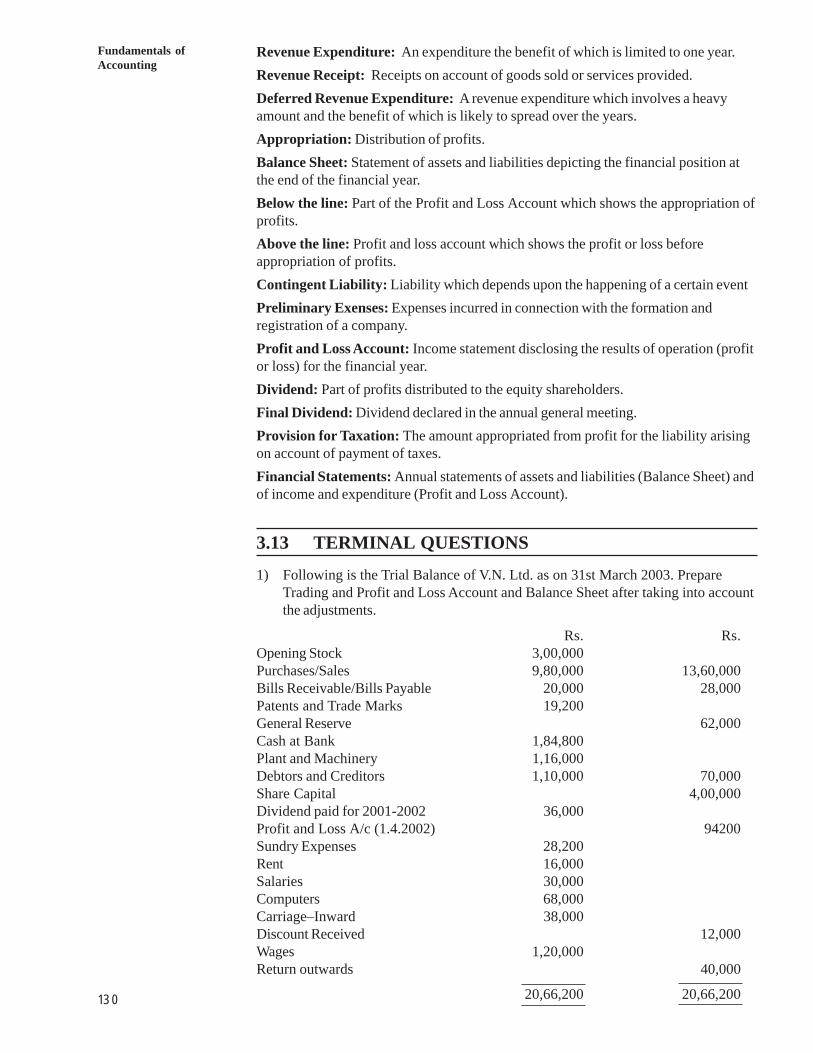
1 3 0
Fundamentals ofAccounting
Revenue Expenditure: An expenditure the benefit of which is limited to one year.Revenue Receipt: Receipts on account of goods sold or services provided.Deferred Revenue Expenditure: A revenue expenditure which involves a heavyamount and the benefit of which is likely to spread over the years.Appropriation: Distribution of profits.Balance Sheet: Statement of assets and liabilities depicting the financial position atthe end of the financial year.Below the line: Part of the Profit and Loss Account which shows the appropriation ofprofits.Above the line: Profit and loss account which shows the profit or loss beforeappropriation of profits.Contingent Liability: Liability which depends upon the happening of a certain eventPreliminary Exenses: Expenses incurred in connection with the formation andregistration of a company.Profit and Loss Account: Income statement disclosing the results of operation (profitor loss) for the financial year.Dividend: Part of profits distributed to the equity shareholders.Final Dividend: Dividend declared in the annual general meeting.Provision for Taxation: The amount appropriated from profit for the liability arisingon account of payment of taxes.Financial Statements: Annual statements of assets and liabilities (Balance Sheet) andof income and expenditure (Profit and Loss Account).
3.13 TERMINAL QUESTIONS1) Following is the Trial Balance of V.N. Ltd. as on 31st March 2003. Prepare
Trading and Profit and Loss Account and Balance Sheet after taking into accountthe adjustments.
Rs. Rs.Opening Stock 3,00,000Purchases/Sales 9,80,000 13,60,000Bills Receivable/Bills Payable 20,000 28,000Patents and Trade Marks 19,200General Reserve 62,000Cash at Bank 1,84,800Plant and Machinery 1,16,000Debtors and Creditors 1,10,000 70,000Share Capital 4,00,000Dividend paid for 2001-2002 36,000Profit and Loss A/c (1.4.2002) 94200Sundry Expenses 28,200Rent 16,000Salaries 30,000Computers 68,000Carriage–Inward 38,000Discount Received 12,000Wages 1,20,000Return outwards 40,000
20,66,200 20,66,200
UNIT 5 TECHNIQUES OFFINANCIAL ANALYSIS
Structure
5.0 Objectives
5.1 Introduction
5.2 Techniques of Financial Analysis
5.3 Common Size Statements
5.4 Comparative Statements
5.5 Trend Analysis
5.6 Ratio Analysis
5.6.1 Liquidity Analysis Ratios
5.6.2 Profitability Analysis Ratios
5.6.3 Profitability in Relation to Capital Employed (Investment)
5.6.4 Activity Analysis Ratios
5.6.5 Long-Term Solvency Ratios
5.6.6 Coverage Ratios
5.7 Dupont Model of Financial Analysis
5.8 Uses of Ratio Analysis
5.9 Limitations of Ratio Analysis
5.10 Let Us Sum Up
5.11 Key Words
5.12 Terminal Questions
5.13 Further Readings
5.0 OBJECTIVESThe objectives of this unit are to:
! explain the need for analysing financial statements;
! know different methods of analysing the financial statements;
! understand how investors and others examine the performance of thecompany through ratio analysis;
! explain a few advanced financial analysis models with the help of ratioanalysis; and
! caution the users of financial statements for some of the limitations offinancial statement analysis.
1
2
An OverviewAnalysis of FinancialStatements 5.1 INTRODUCTION
In the previous units you would have been familiarised by many terms like what is afirm, an entity, profit, loss, balance sheet, profit and loss account etc. You wouldhave seen that any business unit contains three major activities – namely; operating,financing, and investing. All the three activities transactions are contained in threemajor financial statements namely, the Balance Sheet, the Profit and Loss Account,and the Cash Flow Statement. While the Balance Sheet reveals the statement ofwealth at any given point of time, Profit and Loss Account reveals the incomeearned and expenses incurred during the financial year. Cash Flow Statementreflects the cash inflow or outflow of the above three major activities mentioned.
Most small investors like you invest in shares of varied companies with minimumknowledge on the company itself. However, in most cases it so happens that thesmall investors who do not understand much about the financial reports take the helpof the mutual funds. You would be reading more about mutual funds in some othercourse. To familiarise you with the term, mutual funds are trusts or entitiesmanaged by investment trusts and registered under the Trust Act. They pool themoney of the small investor and do the investment in shares and debentures orbonds on behalf of them. Most often than not, the mutual funds give better returns tothe individual and small investors in comparison to the returns they would haveearned had they invested by themselves. This is because the mutual funds arespecialists in investing and gain significant experience and expertise in investing asagainst the naive investors. The main reason being investors often do not find thetime to analyse and evaluate the financial credence of the company. This requires abasic understanding of the financial statements disclosed by the company. Hence, alayman who wishes to invest in companies or prefer to have any sort of dealingswith the company has to perform an analysis of the financial statements. This holdsgood for any stakeholder of the company, be it the employee, or the shareholder, orthe supplier, the Government, the Tax authorities, the bankers and lenders etc.The lending institutions need to analyse the financial statements to make sure thecompany would be able to repay the loans. Similarly, the shareholder would like toanalyse the financial statements to find out the prospects of the company andwhether it would pay sufficient returns for the money invested. The Governmentwould also be interested in analyzing the financial statements of the company tocheck whether the company is performing well like the other companies in the sameindustry or whether it is functioning as a sick company. Hence the details taken outof the financial statement analysis differs based on who analyse the financialstatements. Given the various objective of financial statement analysis lets move onto find out how exactly financial statement analysis is performed.
Check Your Progress A
1) Who and why would any one perform financial statement analysis?
...........................................................................................................................
...........................................................................................................................
...........................................................................................................................
2) Being an employee of your company, would you be interested in the analysis ofthe financial statements of your company? If yes, why and what would beanalysing?
...........................................................................................................................
...........................................................................................................................
...........................................................................................................................
Techniques of FinancialAnalysis
3
5.2 TECHNIQUES OF FINANCIAL ANALYSISInvestors buy shares based on all kinds of information about a company. Forexample, it may be that a particular firm has invented a new drug, or is a takeovercandidate, or has started exports to a boom region of the world or has discoverednew seams of gold. Any of these factors may be sufficient to give the shares a bigshort-term boost.
But, despite all this, it is important to realise that profits are the key to a company’slong-term performance. Without profits a company cannot invest in growth, cannotrepay loans and cannot pay dividends. Eventually, its very survival may be in doubt.And so most analysis is directed towards understanding the company’s profits.
Financial analysis is done to try and predict the future performance of a company.This of course has some limits. This is because your analysis will essentially be ofhistorical figures; yet you are trying to forecast the future. However, there areexperts who use technical analysis to predict the future stock prices using historicaldata, where mostly the reality is not predicted. Also, you would have noticed thatanalysis by some of the world’s top economists was unable to predict the recentAsian economic implosion. So you should be aware of the fact that there are somepretty important limitations to what you can expect from financial analysis.
Apart from this, its highly important to check whether the company is operatingefficiently. In the sense that it does not suffice by investing in the growth. It isequally important that the company operates efficiently in comparison to itscompetitors.
It is also necessary to be analyse the debt levels and how these may affect thecompany’s performance. When interest rates are low it can make good strategicsense for a company to borrow heavily in order to invest for growth. But onceinterest rates start heading up again it may be that the company’s profits comeunder threat, and it is important to gauge its ability to repay its loans.
So mostly financial analysis would be directed towards three major areas—Profitability, Productivity and Risk (determined by leverage or debt equity mix).
In order to perform the analysis, we need to do some sort of comparison. Generallythe comparison done could be of the following types : 1) Comparing theperformance of the interested company with the competitors, 2) Comparisonwith the benchmark (either the competitor or some other benchmark company,3) Comparison with the industry averages, and 4) Comparing the performance ofthe company over the years. Second and third type of comparison is called crosssection analysis and fourth type of comparison is called time series analysis.
Hence this sort of analysis requires some organized techniques such as:
1) Common size statement analysis
2) Ratio analysis
3) Comparative Statement Analysis (Cross Section analysis)
4) Trend Analysis (Time Series analysis)
5) Du Pont Analysis (Structured Ratio Analysis).
All the above are widely used techniques by experts across the world. You willbe learning the above techniques in detail in the coming sections.
4
An OverviewAnalysis of FinancialStatements
Check Your Progress B
1) List out the different techniques of performing financial analysis?
...........................................................................................................................
...........................................................................................................................
...........................................................................................................................
...........................................................................................................................
2) List out the major components that you would concentrate while analysing thefinancial statements.
...........................................................................................................................
...........................................................................................................................
...........................................................................................................................
...........................................................................................................................
3) Suppose if you are interested in investing in any of the software company.How would you decide which company to invest in the software industry.List some of the factors that you would analyse and the procedure of analysis.
...........................................................................................................................
...........................................................................................................................
...........................................................................................................................
...........................................................................................................................
5.3 COMMON SIZE STATEMENTSWhen comparing your company with industry figures, make sure that the financialdata for each company reflect comparable price levels, and that it was developedusing comparable accounting methods, classification procedures, and valuationbases.
Such comparisons should be limited to companies engaged in similar businessactivities. When the financial policies of two companies differ, these differencesshould be recognized in the evaluation of comparative reports. For example, onecompany leases its properties while the other purchases such items; one companyfinances its operations using long-term borrowing while the other relies primarily onfunds supplied by shareholders and by ploughing back the earnings. Financialstatements for two companies under these circumstances are not whollycomparable.
Hence, you require some comparable basis to overcome this problem. Hence we usecommon size statement. Common Size Statement represents a financial statementthat displays all items as a percentage of a common base figure. Such a statementmay be useful for noting changes in the relative size of the various elements.
In other words, it is a statement in which all items are expressed as a percentage ofa Base figure, which is used for analyzing trends and changing relationship amongFinancial statement items. For example, all items in each year’s income statementcould be presented as a percentage of Net sales. This technique is quite usefulwhen you are comparing your business to other businesses or to averages from anentire industry, because differences in size are neutralized by reducing all figures tocommon-size ratios. Industry statistics are frequently published in common-sizeform.
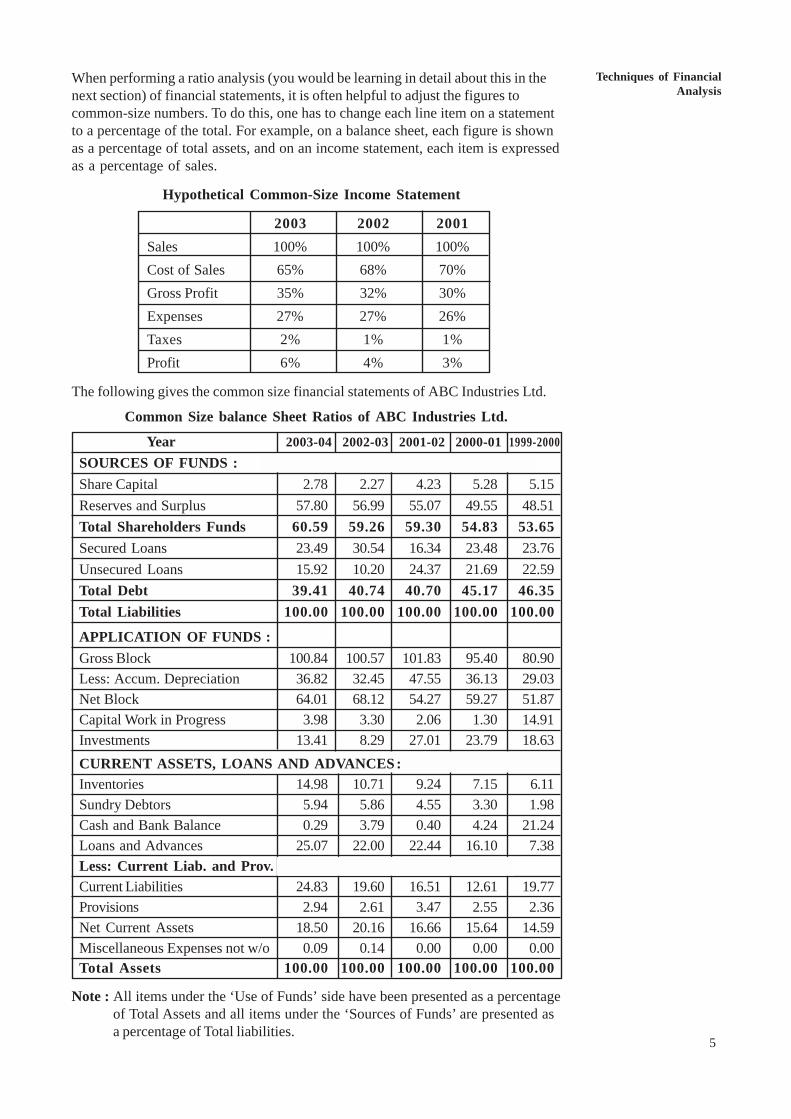
Techniques of FinancialAnalysis
5
When performing a ratio analysis (you would be learning in detail about this in thenext section) of financial statements, it is often helpful to adjust the figures tocommon-size numbers. To do this, one has to change each line item on a statementto a percentage of the total. For example, on a balance sheet, each figure is shownas a percentage of total assets, and on an income statement, each item is expressedas a percentage of sales.
Hypothetical Common-Size Income Statement
2003 2002 2001Sales 100% 100% 100%Cost of Sales 65% 68% 70%Gross Profit 35% 32% 30%Expenses 27% 27% 26%Taxes 2% 1% 1%Profit 6% 4% 3%
The following gives the common size financial statements of ABC Industries Ltd.
Common Size balance Sheet Ratios of ABC Industries Ltd.
Year 2003-04 2002-03 2001-02 2000-01 1999-2000SOURCES OF FUNDS :Share Capital 2.78 2.27 4.23 5.28 5.15Reserves and Surplus 57.80 56.99 55.07 49.55 48.51Total Shareholders Funds 60.59 59.26 59.30 54.83 53.65Secured Loans 23.49 30.54 16.34 23.48 23.76Unsecured Loans 15.92 10.20 24.37 21.69 22.59Total Debt 39.41 40.74 40.70 45.17 46.35Total Liabilities 100.00 100.00 100.00 100.00 100.00
APPLICATION OF FUNDS :Gross Block 100.84 100.57 101.83 95.40 80.90Less: Accum. Depreciation 36.82 32.45 47.55 36.13 29.03Net Block 64.01 68.12 54.27 59.27 51.87Capital Work in Progress 3.98 3.30 2.06 1.30 14.91Investments 13.41 8.29 27.01 23.79 18.63CURRENT ASSETS, LOANS AND ADVANCES :Inventories 14.98 10.71 9.24 7.15 6.11Sundry Debtors 5.94 5.86 4.55 3.30 1.98Cash and Bank Balance 0.29 3.79 0.40 4.24 21.24Loans and Advances 25.07 22.00 22.44 16.10 7.38Less: Current Liab. and Prov.Current Liabilities 24.83 19.60 16.51 12.61 19.77Provisions 2.94 2.61 3.47 2.55 2.36Net Current Assets 18.50 20.16 16.66 15.64 14.59Miscellaneous Expenses not w/o 0.09 0.14 0.00 0.00 0.00Total Assets 100.00 100.00 100.00 100.00 100.00
Note : All items under the ‘Use of Funds’ side have been presented as a percentageof Total Assets and all items under the ‘Sources of Funds’ are presented asa percentage of Total liabilities.

6
An OverviewAnalysis of FinancialStatements
Common Size Ratios of Income Statement of ABC Industries Ltd.
Year 2003-04 2002-03 2001-02 2000-01 1999-2000
Income :
Sales Turnover 100.00 100.00 100.00 100.00 100.00
Other Income 2.37 2.64 4.27 6.16 5.92
Stock Adjustments 4.86 ----2.00 1.38 2.17 ----1.43
Total Income 107.23 100.64 105.65 108.33 104.49
Expenditure :
Raw Materials 68.42 62.08 53.71 44.98 32.01
Excise Duty 8.77 7.23 11.21 15.47 18.16
Power and Fuel Cost 1.44 1.63 4.29 2.77 2.54
Other Manufacturing Expenses 2.97 3.22 4.54 6.85 9.73
Employee Cost 1.23 1.18 1.80 2.26 3.32
Selling and AdministrationExpenses 4.99 4.19 5.10 4.72 5.90
Miscellaneous Expenses 0.72 1.15 0.86 1.34 1.70
Less: Preoperative ExpenditureCapitalised 0.01 0.00 0.01 0.02 0.11
Profit before Interest,Depreciation and Tax 18.70 19.98 24.16 29.95 31.23
Interest and Financial Charges 3.10 4.02 5.28 6.36 6.86
Profit before Depreciation and Tax 15.59 15.96 18.87 23.59 24.37
Depreciation 5.66 6.20 6.80 8.07 8.05
Profit Before Tax 9.93 9.75 12.08 15.52 16.32
Tax 1.74 2.61 0.59 0.36 0.28
Profit After Tax 8.19 7.14 11.49 15.17 16.04
Adjustment below Net Profit 0.00 0.01 0.00 0.00 0.00
P & L Balance brought forward 5.44 4.76 7.56 7.15 9.86
Appropriations 6.96 5.91 9.66 11.34 15.24
P & L Bal. carried down 6.67 6.00 9.38 10.98 10.66
Equity Dividend 1.39 1.46 1.95 2.43 3.30
Preference Dividend 0.04 0.00 0.02 0.22 0.22
Corporate Dividend Tax 0.18 0.00 0.20 0.29 0.38
Equity Dividend (%) 0.10 0.10 0.18 0.25 0.35
Earning Per Share (Rs.) 0.06 0.07 0.11 0.14 0.17
Book Value 0.40 0.52 0.49 0.65 0.94
Extraordinary Items 0.01 0.70 0.05 0.32 0.06
Note : All figures are expressed as a percentage of sales.
Techniques of FinancialAnalysis
7
Vertical and Horizontal Analysis
Vertical analysis is the computation of percentages, ratios, turnovers, and othermeasures of financial position and operating results for one fiscal period. Whenthese figures are compared with those from other periods, it becomes horizontalanalysis. For instance if you would have done the above conversion intopercentages for ABC industries for only year 2003 then it would have been Verticalanalysis. But what has been presented to you is the Horizontal Analysis of thecommon size financial statements.
Activity 3
1) Visit any company’s website and download the annual report. Preparecommon size statement for two year period and write down yourunderstanding.
..........................................................................................................................
..........................................................................................................................
..........................................................................................................................
2) What do you think is the purpose for the Common Size Financial Statement?
..........................................................................................................................
..........................................................................................................................
..........................................................................................................................
3) Take any software firm and a manufacturing firm and perform common sizefinancial statement. Examine the difference and explain why they aredifferent.
..........................................................................................................................
..........................................................................................................................
..........................................................................................................................
5.4 COMPARATIVE STATEMENTSWhen you first look at a company’s current financial figures it can be quiteoverwhelming and, more often than not, a little confusing. But, if you were tocompare that data to that of the business’s historical performance, it becomessignificantly more meaningful. Hence it would make more sense to compare thecompany’s current financial numbers with monthly, quarterly, or annual data fromprevious fiscal years. In this process you should notice some trends that will helpyou map out the future of your business.
This is done the same way common size financial statement is done but a littledifferently. A hypothetical example would help you understand the importance ofthe same. The following example gives the comparative financial statements of ahypothetical XYZ company. Despite calculating the percentage for each of theyear that is the vertical analysis, the horizontal analysis has also been performed inthe sense that the conversion is done over the years. This facilitates in comparingthe performance over the year but also with the industry average. The industryaverage has also been given for the XYZ Company.
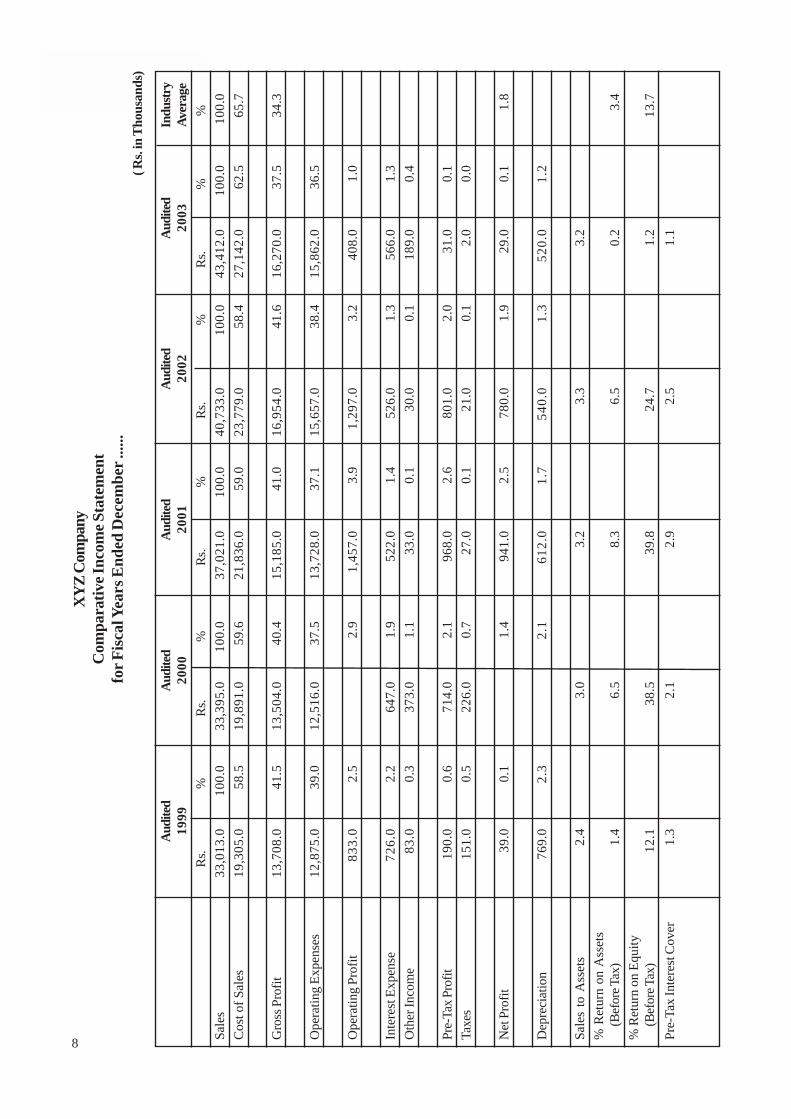
8
An OverviewAnalysis of FinancialStatements
XY
Z C
ompa
nyC
ompa
rativ
e Inc
ome S
tate
men
tfo
r Fisc
al Y
ears
End
ed D
ecem
ber .
.....
( Rs.
in T
hous
ands
)
Aud
ited
Aud
ited
Aud
ited
Aud
ited
Aud
ited
Indu
stry
1999
2000
2001
2002
2003
Aver
age
Rs.
%Rs
.%
Rs.
%Rs
.%
Rs.
%%
Sale
s33
,013
.010
0.0
33,3
95.0
100.
037
,021
.010
0.0
40,7
33.0
100.
043
,412
.010
0.0
100.
0C
ost o
f Sal
es19
,305
.058
.519
,891
.059
.621
,836
.059
.023
,779
.058
.427
,142
.062
.565
.7
Gro
ss P
rofit
13,7
08.0
41.5
13,5
04.0
40.4
15,1
85.0
41.0
16,9
54.0
41.6
16,2
70.0
37.5
34.3
Ope
ratin
g Ex
pens
es12
,875
.039
.012
,516
.037
.513
,728
.037
.115
,657
.038
.415
,862
.036
.5
Ope
ratin
g Pr
ofit
833.
02.
52.
91,
457.
03.
91,
297.
03.
240
8.0
1.0
Inte
rest
Exp
ense
726.
02.
264
7.0
1.9
522.
01.
452
6.0
1.3
566.
01.
3O
ther
Inco
me
83.
00.
337
3.0
1.1
33.0
0.1
30.0
0.1
189.
00.
4
Pre-
Tax P
rofit
190.
00.
671
4.0
2.1
968.
02.
680
1.0
2.0
31.0
0.1
Taxe
s15
1.0
0.5
226.
00.
727
.00.
121
.00.
12.
00.
0
Net
Pro
fit39
.00.
11.
494
1.0
2.5
780.
01.
929
.00.
11.
8
Dep
reci
atio
n76
9.0
2.3
2.1
612.
01.
754
0.0
1.3
520.
01.
2
Sale
s to
Ass
ets
2.4
3.0
3.2
3.3
3.2
% R
etur
n on
Ass
ets
(Bef
ore T
ax)
1.4
6.5
8.3
6.5
0.2
3.4
% R
etur
n on
Equ
ity(B
efor
e Tax
)12
.138
.539
.824
.71.
213
.7Pr
e-Ta
x In
tere
st C
over
1.3
2.1
2.9
2.5
1.1
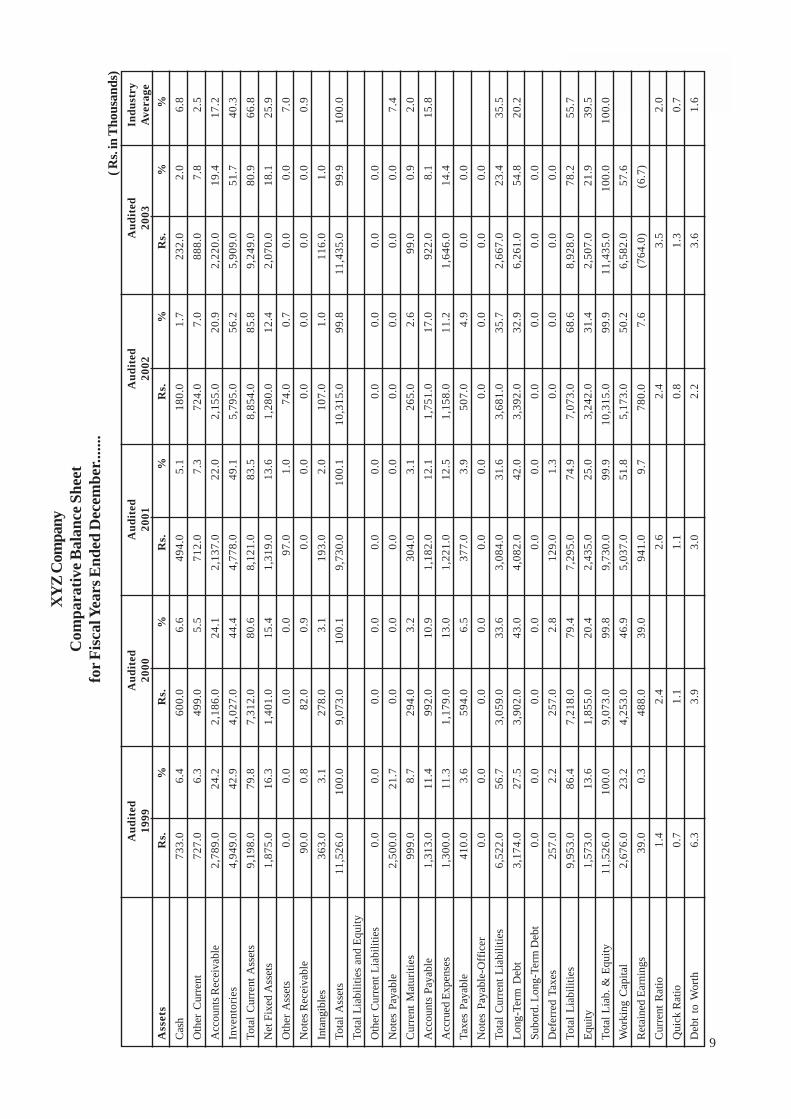
Techniques of FinancialAnalysis
9
XY
Z C
ompa
nyC
ompa
rativ
e Bal
ance
She
etfo
r Fisc
al Y
ears
End
ed D
ecem
ber..
.....
( Rs.
in T
hous
ands
)A
udit
edA
udit
edA
udit
edA
udit
edA
udit
edIn
dust
ry19
9920
0020
0120
0220
03A
vera
geA
sset
sR
s.%
Rs.
%R
s.%
Rs.
%R
s.%
%Ca
sh73
3.0
6.4
600.
06.
649
4.0
5.1
180.
01.
723
2.0
2.0
6.8
Oth
er C
urre
nt72
7.0
6.3
499.
05.
571
2.0
7.3
724.
07.
088
8.0
7.8
2.5
Acc
ount
s Rec
eiva
ble
2,78
9.0
24.2
2,18
6.0
24.1
2,13
7.0
22.0
2,15
5.0
20.9
2,22
0.0
19.4
17.2
Inve
ntor
ies
4,94
9.0
42.9
4,02
7.0
44.4
4,77
8.0
49.1
5,79
5.0
56.2
5,90
9.0
51.7
40.3
Tota
l Cur
rent
Ass
ets
9,19
8.0
79.8
7,31
2.0
80.6
8,12
1.0
83.5
8,85
4.0
85.8
9,24
9.0
80.9
66.8
Net
Fix
ed A
sset
s1,
875.
016
.31,
401.
015
.41,
319.
013
.61,
280.
012
.42,
070.
018
.125
.9O
ther
Ass
ets
0.0
0.0
0.0
0.0
97.0
1.0
74.0
0.7
0.0
0.0
7.0
Not
es R
ecei
vabl
e90
.00.
882
.00.
90.
00.
00.
00.
00.
00.
00.
9In
tang
ible
s36
3.0
3.1
278.
03.
119
3.0
2.0
107.
01.
011
6.0
1.0
Tota
l Ass
ets
11,5
26.0
100.
09,
073.
010
0.1
9,73
0.0
100.
110
,315
.099
.811
,435
.099
.910
0.0
Tota
l Lia
bilit
ies
and
Equi
tyO
ther
Cur
rent
Lia
bilit
ies
0.0
0.0
0.0
0.0
0.0
0.0
0.0
0.0
0.0
0.0
Not
es P
ayab
le2,
500.
021
.70.
00.
00.
00.
00.
00.
00.
00.
07.
4C
urre
nt M
atur
ities
999.
08.
729
4.0
3.2
304.
03.
126
5.0
2.6
99.0
0.9
2.0
Acc
ount
s Pa
yabl
e1,
313.
011
.499
2.0
10.9
1,18
2.0
12.1
1,75
1.0
17.0
922.
08.
115
.8A
ccru
ed E
xpen
ses
1,30
0.0
11.3
1,17
9.0
13.0
1,22
1.0
12.5
1,15
8.0
11.2
1,64
6.0
14.4
Taxe
s Pa
yabl
e41
0.0
3.6
594.
06.
537
7.0
3.9
507.
04.
90.
00.
0N
otes
Pay
able
-Off
icer
0.0
0.0
0.0
0.0
0.0
0.0
0.0
0.0
0.0
0.0
Tota
l Cur
rent
Lia
bilit
ies
6,52
2.0
56.7
3,05
9.0
33.6
3,08
4.0
31.6
3,68
1.0
35.7
2,66
7.0
23.4
35.5
Long
-Ter
m D
ebt
3,17
4.0
27.5
3,90
2.0
43.0
4,08
2.0
42.0
3,39
2.0
32.9
6,26
1.0
54.8
20.2
Subo
rd. L
ong-
Term
Deb
t0.
00.
00.
00.
00.
00.
00.
00.
00.
00.
0D
efer
red
Taxe
s25
7.0
2.2
257.
02.
812
9.0
1.3
0.0
0.0
0.0
0.0
Tota
l Lia
bilit
ies
9,95
3.0
86.4
7,21
8.0
79.4
7,29
5.0
74.9
7,07
3.0
68.6
8,92
8.0
78.2
55.7
Equi
ty1,
573.
013
.61,
855.
020
.42,
435.
025
.03,
242.
031
.42,
507.
021
.939
.5To
tal L
iab.
& E
quity
11,5
26.0
100.
09,
073.
099
.89,
730.
099
.910
,315
.099
.911
,435
.010
0.0
100.
0W
orki
ng C
apita
l2,
676.
023
.24,
253.
046
.95,
037.
051
.85,
173.
050
.26,
582.
057
.6R
etai
ned
Earn
ings
39.0
0.3
488.
039
.094
1.0
9.7
780.
07.
6(7
64.0
)(6
.7)
Cur
rent
Rat
io1.
42.
42.
62.
43.
52.
0Q
uick
Rat
io0.
71.
11.
10.
81.
30.
7D
ebt
to W
orth
6.3
3.9
3.0
2.2
3.6
1.6
10
An OverviewAnalysis of FinancialStatements
Activity 1
1) Carefully read the comparative income statement of XYZ and write downhow the company has performed over the 5 year period and also itsperformance in comparison to the industry.
...........................................................................................................................
...........................................................................................................................
...........................................................................................................................
2) Visit any company’s website and download their income statement for 5 yearperiod. Perform horizontal analysis. Collect the industry average for thecompany and list down the performance of the company with respect to theindustry average.
...........................................................................................................................
...........................................................................................................................
...........................................................................................................................
3) List down the usefulness of the comparative financial statements.
...........................................................................................................................
...........................................................................................................................
...........................................................................................................................
5.5 TREND ANALYSISThe earlier sections had exposed you to analyzing statements using horizontal andvertical form as well as using the common size financial statements in thecomparative form. The horizontal analysis performed there, comparing theperformance of the XYZ company over the five year period indicates the timeseries analysis or rather trend analysis. This is called as trend analysis because weare trying to see if there is a pattern in the performance of the company over theyear which could help us forecast the performance of the company for the future.Why this is useful? Its utmost useful because we are not only interested in the pastperformance whereas our utmost interest lies in finding whether the company willcontinue to perform the same way or in a better way in the coming years. Similaranalysis is done for investing in stocks. There are experts in Technical Analysiswho perform similar analysis of analyzing the trend of the prince movement of thestock and predicting the future stock price. Similar analysis is done here as well.But how and where can we use the trend analysis of the financial statements?
Trend analysis is a key to recognizing potential problems of a borrower. This isimportant during the initial review of a loan application, as well as part of on-goingmonitoring of a loan that has already been disbursed. Sound companies and weakones may have displayed some of the same trends, however, it is a pattern of manynegative trends that indicates a potential problem that needs to evaluated further.
Trend analysis involves spreading the financial statements and comparing similaroperating periods (i.e. year to year). This comparative analysis allows the reviewerto identify both positive and negative trends. Once a pattern of negative trends areidentified further action should be taken. For a potential loan, additional informationor a detailed explanation should be obtained. The trends should be weighedcarefully in making or rejecting the loan. For loans that have already been made, a
Techniques of FinancialAnalysis
11
pattern of negative trends requires fast action. Current financial information mayindicate a problem that will enable the reviewer time to react. The following is ageneral discussion of some trends to look for in the review of financial statements:
1) Decreasing cash position: This could be a lower level of cash or cash as apercentage of total assets. Look for changes in deposit activity, draws onuncollected funds, declining average monthly balances, etc.
2) Slowdown in receivables collection: Could be an indication of distractionsin the business, neglect, changes in collection policies, etc.
3) Significant increases in accounts receivable: This could be in the dollaramount, percentage of assets or in accounts receivable to a single customer(need aging of accounts receivable to determine).
4) Rising inventories: Either in the dollar amount or as a percentage of totalassets. This may be an indication of a need to liquidate excessive or obsoleteinventory, lack of attention to purchasing, slowing of sales, etc.
5) Slowdown in inventory turnover: This could indicate a slowdown in sales,overbuying, production problems, and/or problems in the purchasing policiesof the business.
6) Changes in sales terms/sales policies: Look for changes from cash salesto instalment sales, leasing instead of selling, and other similar changes.
7) A decline in liquid assets: This could be a dollar decline or a decline incurrent assets (cash, accounts receivable, etc.) to total assets. As currentassets decline or become less liquid, a business may experience difficultiesmeeting current liabilities.
8) Changes in the concentration of fixed assets: Both declining and risingconcentrations of fixed assets should be reviewed. A decline could indicatethat funds needed to purchase fixed assets are being used for other purposes.This can be a significant problem if a business is not replacing, renovating orrehabilitating fixed assets as needed. A rise in fixed assets could be aproblem when done at the expense of other assets/operational need. Levelsof fixed assets should be compared to both historical financial statements andindustry averages.
9) Revaluation of assets: A revaluation of assets on the financial statementsneeds to be justified. If not justified, it impacts the financial picture of thecompany.
10) Changes in liens of assets: Evidence of new subordinated debt should bea concern. It could indicate a deteriorating financial situation.
11) A high or increasing concentration of assets in intangibles: The valueof intangible assets is difficult to establish. Typically, intangible assets areeliminated from the financial review.
12) Increases in current debt: A rise that is tied to a concentration in tradedebt or no corresponding increase in assets should be viewed as a risk factor.Increases in long-term debt: Increases in long term debt must be reviewedcarefully. If repayment is dependent on higher than historical or reasonableprojected sales, a concern should be raised.
13) An increase or major gap between gross and net sales: result or lowerquality, production problems, out-of-date product lines and other relatedproduction and/or market factors.

12
An OverviewAnalysis of FinancialStatements
14) An increase in debt to capital: This is of particular concern when thecurrent ratio is low. Undercapitalized firms will typically exhibit poor workingcapital conditions.
15) Increase in cost of goods sold: An increase may indicated problems in theoperation or other expense areas.
16) Decline in profits compared to sales: The decline may be a result of poorcost controls, management problems, failure to pass on increases in costs, etc.
17) Increases in bad debt: An increase as a percentage of sales usuallyindicates poor collection procedures, management problems and/ordeterioration of the quality of the customer.
18) Assets rising faster than sales: This is an indication that increased assetsare not creating increases in sales.
19) Assets rising faster than profits: Assets are investments designed to createprofits. Concerns should be raised when increased assets are not resulting inhigher profits.
20) Significant variations in other areas of the financial statements: Markedchanges should always be examined!
21) An increase or major gap between gross and net sales: Result or lowerquality, production problems, out-of-date product lines and other relatedproduction and/or market factors.
22) An increase in debt to capital: This is of particular concern when thecurrent ratio is low. Undercapitalized firms will typically exhibit poor workingcapital conditions.
23) Increase in cost of goods sold: An increase may indicate problems in theoperation or other expense areas.
24) Decline in profits compared to sales: The decline may be a result of poorcost controls, management problems, failure to pass on increase in costs, etc.
25) Increases in bad debt: An increase as a percentage of sales usuallyindicates poor collection procedures, management problems and/ordeterioration of the quality of the customer.
26) Assets rising faster than sales: This is an indication that increased assetsare not creating increases in sales.
27) Assets rising faster than profits: Assets are investments designed to createprofits. Concerns should be raised when increased assets are not resulting inhigher profits.
28) Significant variations in other areas of the financial statements: Markedchanges should always be examined!
Apart from the above analysis one could adopt a simpler form of performing trendanalysis. This is done by performing what is called as the Index Number Trendanalysis.
Index-Number Trend SeriesIf you are trying to analyze financial data that span a long period of time,mechanically trying to compare financial statements can turn into quite acumbersome task. If you find yourself in this boat, try to create an index-numbertrend series to alleviate some of your confusion.
Techniques of FinancialAnalysis
13
First, choose a base year to which all other financial data will be compared.Usually, the base year is the earliest year in the group being analyzed, or it can beanother year you consider particularly appropriate.
Next, express all base year amounts as 100 percent. Then state correspondingfigures from following years as a percentage of the base year amounts. Keep inmind that index-numbers can be computed only when amounts are positive.
Hypothetical Example
2001 2002 2003
Sales 100,000 150,000 175,000
Index-Number Trend 100% 150% 175%
The index-number trend series technique is a type of horizontal analysis that canprovide you with a long range view of your firm’s financial position, earnings, andcash flow. It is important to remember, however, that long-range trend series areparticularly sensitive to changing price levels. For instance, the price level couldincrease to greater extent for some years. A horizontal analysis that ignored such asignificant change might suggest that your sales or net income increaseddramatically during the period when, in fact, little or no real growth occurred.
Data expressed in terms of a base year can be very useful when comparingyour company’s figures to those from government agencies and sources withinyour industry or the business world in general, because they will often use anindex-number trend series as well. When making comparisons, be sure thesamples you use are in the same base period. If they aren’t, simply change oneso they match.
5.6 RATIO ANALYSISWe have seen that most of us are interested in the bottom line of the company. Orin other words analysing the profitability of a company. While the profit figure isimportant, it however, does not give the complete picture of the performance of thecompany. So one should not use the bottom line figure alone as a barometer forsome sort of an indicator. That would have severe repercussions. Take for instancetwo companies A and B of the same industry. A has earned a profit of Rs. 100Crs. And B has earned Rs. 1000 Crs. for the financial year 2003. Now one wouldon the face of it say that Company B is better than company A. However, if itshould be wise enough to compare the profit earned with the level of investmentmade to earn the profit. For instance, company A had spent about 500 Crs toearn Rs 100 Cr. Profit and Company B had spent about Rs. 1000 Cr. to earnRs. 1000 Cr. profit. So its clear that profitability of company A is higher thancompany B. In that the profit earned to the investment ratio is higher for companyA (100/500 = 20%) compared to company B (1000/10000 = 10%). Hence oneshould look at profitability and not just profit figures. So the key point is that onehas to look into appropriate ratios not just absolute figures for comparison. Henceratio analysis would help understand the financial results better.
This often means working out a range of ratios. By doing so, a large amount ofcomplex information can be condensed into easily digestible and standardized form,and numerous comparisons between different years for a single company, betweencompanies of varying sizes or between industries can be made. (Note that a ratioin isolation generally has little meaning).
And it is important to note that ratios are just signals, or clues, rather than theanswers to complex questions about a company. Some might direct you to a
14
An OverviewAnalysis of FinancialStatements
specific problem within the company, but many tell you no more than that somethingneeds further investigation.
A ratio can be expressed in various ways, including as a percentage, a fraction, a“times” figure, a number of days, a rate or as a simple number.
The various ratios that are generally used have been summarized below.
5.6.1 Liquidity Analysis Ratios
A firm needs liquid assets to meet day to day payments. Therefore, liquidity ratioshighlight the ability of the firms to convert its assets into cash. If the ratios are lowthen it means that money is tied up in stocks and debtors. Thus, money is notavailable to make payments. This may cause considerable problems for firms in theshort run. It is often viewed that a value less than 1.5 implies that the company mayrun out of money as its cash is tied up in unproductive assets.
Liquidity ratio helps in assessing the firm’s ability to meet its current obligations.The following ratios come under this category:
i) Current ratio;
ii) Quick ratio; and
iii) Net Working Capital Ratio.
i) Current Ratio
The current ratio shows the relationship between the current assets and the currentliabilities. Current assets include cash in hand, cash at bank and all other assetswhich can be converted into cash in the ordinary course of business, for instance,bills receivable, sundry debtors (good debts only), short-term investments, stock etc.Current liabilities consists of all the obligations of payments that have to be metwithin a year. They comprise sundry creditors, bills payable, income received inadvance, outstanding expenses, bank overdraft, short-term borrowings, provision fortaxation, dividends payable, long term liabilities to be discharged within a year. Thefollowing formula is used to compute this ratio:
Current Assets Current Ratio = Current Liabilities
ii) Quick Ratio
The acid test ratio is similar to the current ratio as it highlights the liquidity of thecompany. A ratio of 1:1 (i.e., a value of approximately 1) is satisfactory. However, ifthe value is significantly less than 1 it implies that the company has a large amountof its cash tied up in unproductive assets, so the company may struggle to raisemoney in the short term.
Quick Assets Quick Ratio = Current Liabilities
Quick Assets = Current Assets---Inventories
iii) Net Working Capital Ratio
The working capital ratio can give an indication of the ability of your business to payits bills.
Techniques of FinancialAnalysis
15
Generally a working capital ratio of 2:1 is regarded as desirable. However, thecircumstances of every business vary and you should consider how your businessoperates and set an appropriate benchmark ratio. A stronger ratio indicates a betterability to meet ongoing and unexpected bills therefore taking the pressure off yourcash flow. Being in a liquid position can also have advantages such as being able tonegotiate cash discounts with your suppliers. A weaker ratio may indicate that yourbusiness is having greater difficulties meeting its short-term commitments and thatadditional working capital support is required. Having to pay bills before paymentsare received may be the issue in which case an overdraft could assist. Alternativelybuilding up a reserve of cash investments may create a sound working capitalbuffer. Ratios should be considered over a period of time (say three years), in orderto identify trends in the performance of the business.
The calculation used to obtain the ratio is:
Net Working CapitalNet Working Capital Ratio =
Total Assets
Net Working Capital = Current Assets ---- Current Liabilities
Illustration 1
The Balance Sheet of X Company Ltd. as on March 31, 2005 is given below. Youare required to calculate the following ratios:
i) Current ratio,
ii) Quick ratio,
iii) Net Working capital ratio.
Balance Sheet of X Company Ltd., as on 31.3.2005
Liabilities Amount Assets AmountRs. Rs.
Share Capital 20,000 Buildings 20,000Reserves and Surplus 16,000 Plant and Mechinery 10,000Debentures 10,000 Stock 8,000Sundry Creditors 11,000 Sundry Debtors 7,000Bank Overdraft 1,000 Prepaid expenses 2,000Bills Payable 2,000 Securities 12,000Provision for Taxation 1,000 Bank 2,000Outstanding Expenses 1,000 Cash 1,000
62,000 62,000
Solution
Current Assetsi) Current ratio =
Current Liabilities
Current Assets = Cash Rs. 1000 + Bank Rs. 2000 + Securities Rs. 12000+ Prepaid expenses Rs. 2000 + Sundry Debtors Rs. 7000+ Stock Rs. 8000
= Rs. 32,000.
16
An OverviewAnalysis of FinancialStatements
Current Liabilities = Outstanding expenses Rs. 1000 + Provision for taxationRs. 1000 + Bills payable Rs. 2000 + Bank overdraftRs. 1000 + Sundry creditors Rs. 11,000
= Rs. 16,000. Current Assets 32,000
∴ Current ratio = = = 2 :1Current Liabilities 16,000
Quick Assetsii) Quick ratio =
Current LiabilitiesQuick Assets = Cash Rs. 1000 + Bank Rs. 2000 + Securities Rs. 12,000
+ Sundry Debtors Rs. 7,000
= Rs. 22,000.
Current Liabilities = Sundry creditors Rs. 11,000 + Bills payable Rs. 2000 +Outstanding expenses Rs. 1000 + Provision for TaxationRs. 1000 + Bank overdraft Rs. 1000
= Rs. 16,000
Quick AssetsQuick ratio =
Current Liabilities22,000
=16,000
= 1.37 : 1Net Working Capital
iii) Net Working capital ratio = Total Assets
Net Working Capital = Current Assets ---- Current Liabilities
= Rs. 32,000 ---- Rs. 16,000
= Rs. 16,000
16,000Net Working capital ratio =
32,000
= 1 : 2.
5.6.2 Profitability Analysis RatiosProfitability ratios are the most significant - and telling - of financial ratios. Similarto income ratios, profitability ratios provide a definitive evaluation of the overalleffectiveness of management based on the returns generated on sales andinvestment.
Profitability in relation to Sales
Profits earned in relation to sales give the indication that the firm is able to meet alloperating expenses and also produce a surplus. In order to judge the efficiency ofmanagement with respect to production and sales, profitability ratios are calculatedin relation to sales.
There are :i) Gross Profit Marginii) Net Profit Marginiii) Operating Profit Marginiv) Operating Ratio.
Techniques of FinancialAnalysis
17
i) Gross Profit Margin
This is also known as gross profit ratio or gross profit to sales ratio. This ratio mayindicate to what extent the selling prices of goods per unit may be reduced withoutincurring losses on operations. This ratio is useful particularly in the case ofwholesale and ratail trading firms. It establishes the relationship between grossprofit and net sales. Its purpose is to show the amount of gross profit generated foreach rupees of sales. Gross profit margin is computed as follows:
Gross profitGross profit = × 100
Net Sales
The amount of gross profit is the difference between net sales income and the costof goods sold which includes direct expenses. A high margin enables all operatingexpenses to be covered and provides a reasonable return to the shareholders. Ifgross profit rate is continuously lower than the average margin, something is wrong.To keep the ratio high, management has to minimise cost of goods sold and improvesales performance. Higher the ratio, the greater would be the margin to coveroperating expenses and vice versa.
Note : This percentage rate can --- and will --- vary greatly from business tobusiness, even those within the same industry. Sales location, size of operations andintensity of competition etc., are the factors that can affect the gross profit rate.
Illustration 2
From the following particulars, calculate gross profit margin.
Trading Acount of ABC Company for the year ended March 31, 2005
Rs. Rs.To Opening stock 6,000 By Net sales 96,000To Net purchases 63,000 By Closing stock 6,000To Direct expenses 9,000To Gross profit 24,000
1,02,000 1,02,000
Solution
Gross ProfitGross Profit Margin = × 100
Net Sales24,000
= × 10096,000
= 25%
ii) Net Profit Margin
This ratio is called net profit to sales ratio and explains the relationship between netprofit after taxes and net sales. The purpose of this ratio is to reveal the amount ofsales income left for shareholders after meeting all costs and expenses of thebusiness. It measures the overall profitability of the firm. The higher the ratio, thegreater would be the return to the shareholders and vice versa. A net profit marginof 10% is considered normal. This ratio is very useful to control costs and toincrease the sales. It is calculated as follows:
Net Profit after taxesNet Profit Margin = × 100
Net Sales
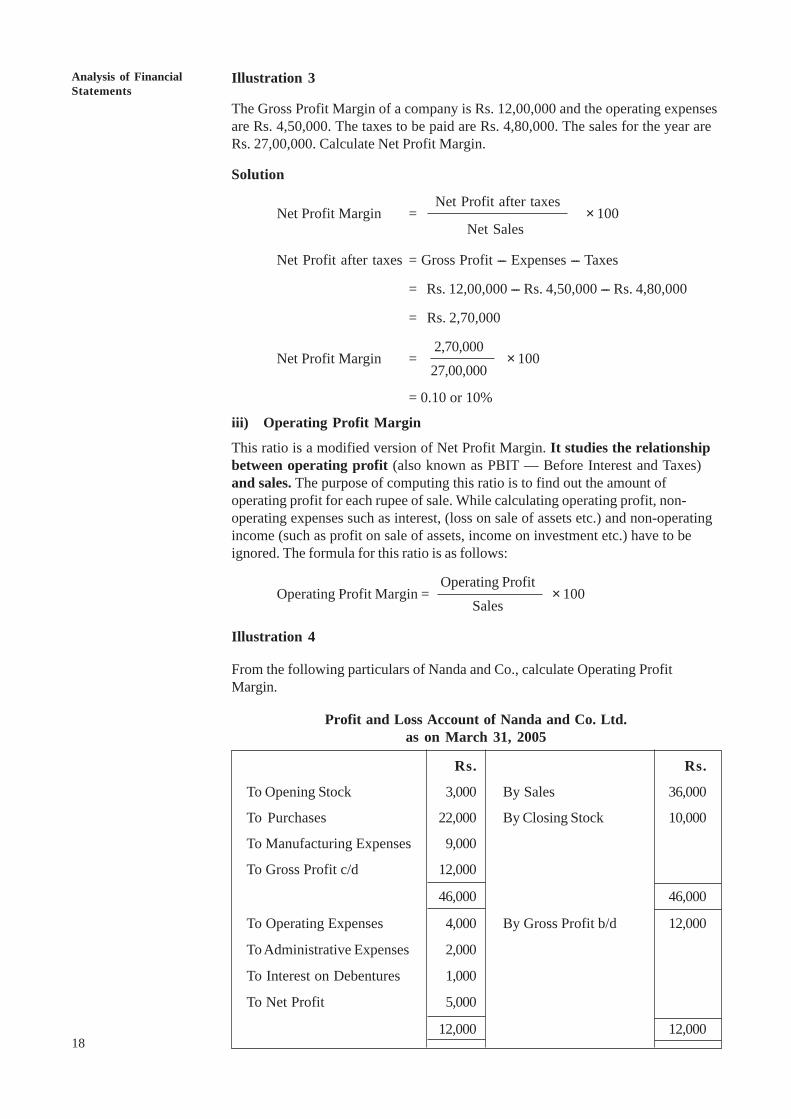
18
An OverviewAnalysis of FinancialStatements
Illustration 3
The Gross Profit Margin of a company is Rs. 12,00,000 and the operating expensesare Rs. 4,50,000. The taxes to be paid are Rs. 4,80,000. The sales for the year areRs. 27,00,000. Calculate Net Profit Margin.
Solution
Net Profit after taxesNet Profit Margin = × 100
Net Sales
Net Profit after taxes = Gross Profit --- Expenses --- Taxes
= Rs. 12,00,000 --- Rs. 4,50,000 --- Rs. 4,80,000
= Rs. 2,70,000
2,70,000Net Profit Margin = × 100
27,00,000
= 0.10 or 10%
iii) Operating Profit Margin
This ratio is a modified version of Net Profit Margin. It studies the relationshipbetween operating profit (also known as PBIT — Before Interest and Taxes)and sales. The purpose of computing this ratio is to find out the amount ofoperating profit for each rupee of sale. While calculating operating profit, non-operating expenses such as interest, (loss on sale of assets etc.) and non-operatingincome (such as profit on sale of assets, income on investment etc.) have to beignored. The formula for this ratio is as follows:
Operating ProfitOperating Profit Margin = × 100
Sales
Illustration 4
From the following particulars of Nanda and Co., calculate Operating ProfitMargin.
Profit and Loss Account of Nanda and Co. Ltd.as on March 31, 2005
Rs. Rs.
To Opening Stock 3,000 By Sales 36,000
To Purchases 22,000 By Closing Stock 10,000
To Manufacturing Expenses 9,000
To Gross Profit c/d 12,000
46,000 46,000
To Operating Expenses 4,000 By Gross Profit b/d 12,000
To Administrative Expenses 2,000
To Interest on Debentures 1,000
To Net Profit 5,000
12,000 12,000
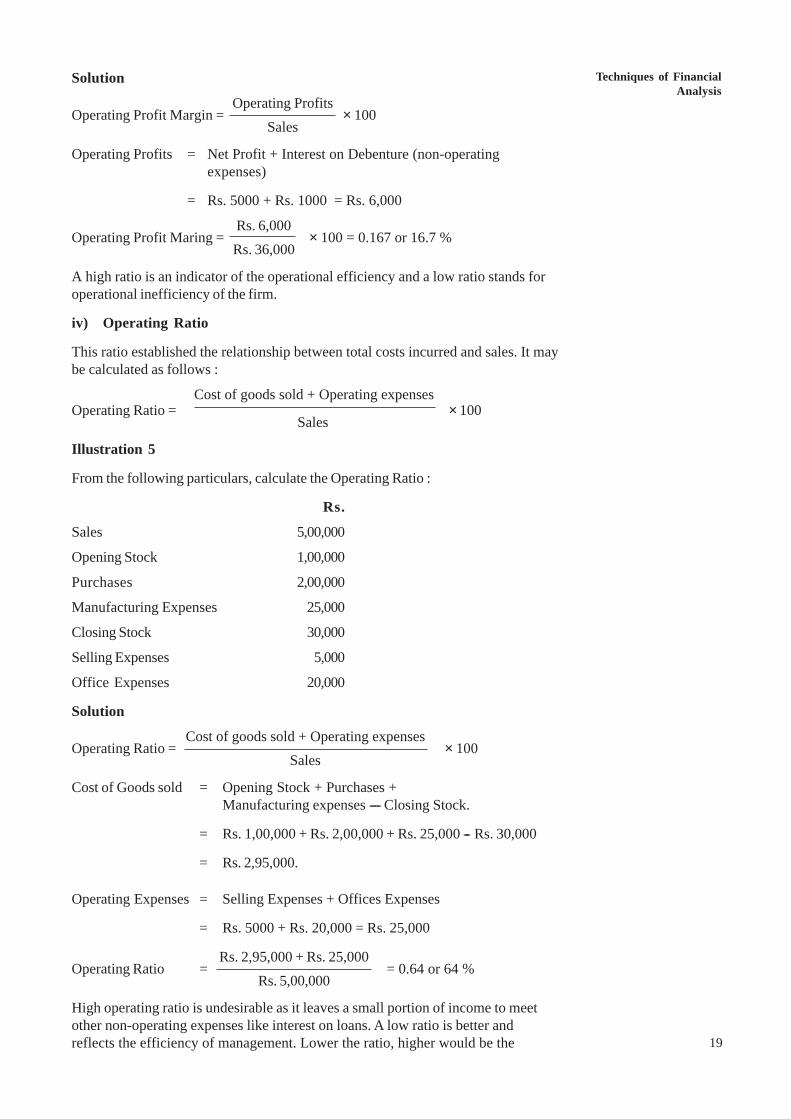
Techniques of FinancialAnalysis
19
Solution
Operating ProfitsOperating Profit Margin = × 100
Sales
Operating Profits = Net Profit + Interest on Debenture (non-operatingexpenses)
= Rs. 5000 + Rs. 1000 = Rs. 6,000
Rs. 6,000Operating Profit Maring = × 100 = 0.167 or 16.7 %
Rs. 36,000
A high ratio is an indicator of the operational efficiency and a low ratio stands foroperational inefficiency of the firm.
iv) Operating Ratio
This ratio established the relationship between total costs incurred and sales. It maybe calculated as follows :
Cost of goods sold + Operating expensesOperating Ratio = × 100
Sales
Illustration 5
From the following particulars, calculate the Operating Ratio :
Rs.
Sales 5,00,000
Opening Stock 1,00,000
Purchases 2,00,000
Manufacturing Expenses 25,000
Closing Stock 30,000
Selling Expenses 5,000
Office Expenses 20,000
Solution
Cost of goods sold + Operating expensesOperating Ratio = × 100
Sales
Cost of Goods sold = Opening Stock + Purchases +Manufacturing expenses ---- Closing Stock.
= Rs. 1,00,000 + Rs. 2,00,000 + Rs. 25,000 --- Rs. 30,000
= Rs. 2,95,000.
Operating Expenses = Selling Expenses + Offices Expenses
= Rs. 5000 + Rs. 20,000 = Rs. 25,000
Rs. 2,95,000 + Rs. 25,000Operating Ratio = = 0.64 or 64 %
Rs. 5,00,000
High operating ratio is undesirable as it leaves a small portion of income to meetother non-operating expenses like interest on loans. A low ratio is better andreflects the efficiency of management. Lower the ratio, higher would be the
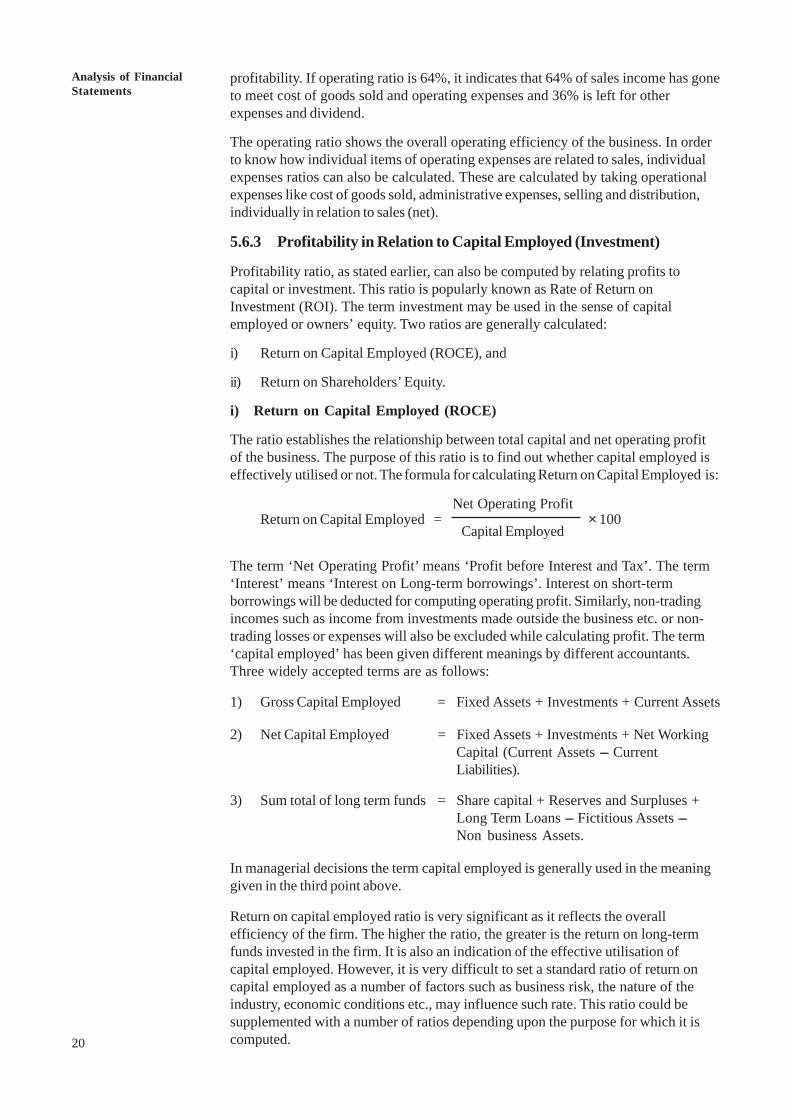
20
An OverviewAnalysis of FinancialStatements
profitability. If operating ratio is 64%, it indicates that 64% of sales income has goneto meet cost of goods sold and operating expenses and 36% is left for otherexpenses and dividend.
The operating ratio shows the overall operating efficiency of the business. In orderto know how individual items of operating expenses are related to sales, individualexpenses ratios can also be calculated. These are calculated by taking operationalexpenses like cost of goods sold, administrative expenses, selling and distribution,individually in relation to sales (net).
5.6.3 Profitability in Relation to Capital Employed (Investment)
Profitability ratio, as stated earlier, can also be computed by relating profits tocapital or investment. This ratio is popularly known as Rate of Return onInvestment (ROI). The term investment may be used in the sense of capitalemployed or owners’ equity. Two ratios are generally calculated:
i) Return on Capital Employed (ROCE), and
ii) Return on Shareholders’ Equity.
i) Return on Capital Employed (ROCE)
The ratio establishes the relationship between total capital and net operating profitof the business. The purpose of this ratio is to find out whether capital employed iseffectively utilised or not. The formula for calculating Return on Capital Employed is:
Net Operating ProfitReturn on Capital Employed = × 100
Capital Employed
The term ‘Net Operating Profit’ means ‘Profit before Interest and Tax’. The term‘Interest’ means ‘Interest on Long-term borrowings’. Interest on short-termborrowings will be deducted for computing operating profit. Similarly, non-tradingincomes such as income from investments made outside the business etc. or non-trading losses or expenses will also be excluded while calculating profit. The term‘capital employed’ has been given different meanings by different accountants.Three widely accepted terms are as follows:
1) Gross Capital Employed = Fixed Assets + Investments + Current Assets
2) Net Capital Employed = Fixed Assets + Investments + Net WorkingCapital (Current Assets --- CurrentLiabilities).
3) Sum total of long term funds = Share capital + Reserves and Surpluses +Long Term Loans --- Fictitious Assets ---Non business Assets.
In managerial decisions the term capital employed is generally used in the meaninggiven in the third point above.
Return on capital employed ratio is very significant as it reflects the overallefficiency of the firm. The higher the ratio, the greater is the return on long-termfunds invested in the firm. It is also an indication of the effective utilisation ofcapital employed. However, it is very difficult to set a standard ratio of return oncapital employed as a number of factors such as business risk, the nature of theindustry, economic conditions etc., may influence such rate. This ratio could besupplemented with a number of ratios depending upon the purpose for which it iscomputed.
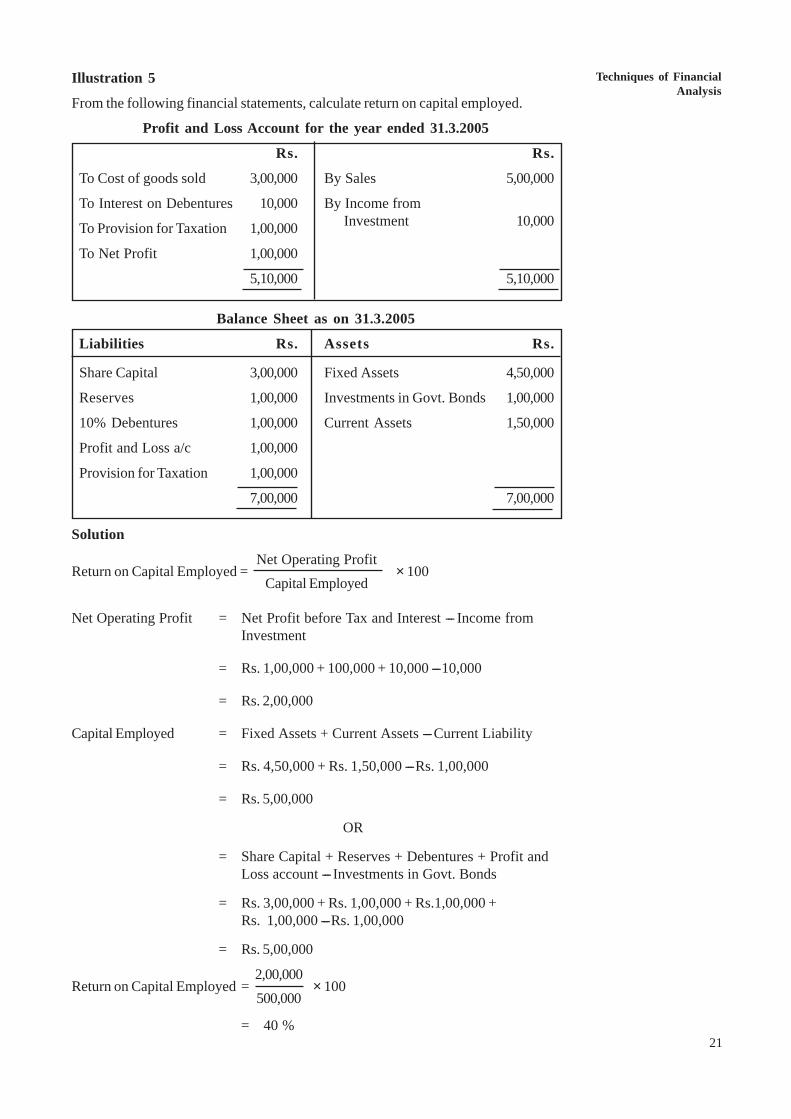
Techniques of FinancialAnalysis
21
Illustration 5
From the following financial statements, calculate return on capital employed.
Profit and Loss Account for the year ended 31.3.2005
Rs. Rs.
To Cost of goods sold 3,00,000 By Sales 5,00,000
To Interest on Debentures 10,000 By Income from
To Provision for Taxation 1,00,000 Investment 10,000
To Net Profit 1,00,000
5,10,000 5,10,000
Balance Sheet as on 31.3.2005
Liabilities Rs. Assets Rs.
Share Capital 3,00,000 Fixed Assets 4,50,000
Reserves 1,00,000 Investments in Govt. Bonds 1,00,000
10% Debentures 1,00,000 Current Assets 1,50,000
Profit and Loss a/c 1,00,000
Provision for Taxation 1,00,000
7,00,000 7,00,000
Solution
Net Operating ProfitReturn on Capital Employed = × 100
Capital Employed
Net Operating Profit = Net Profit before Tax and Interest --- Income fromInvestment
= Rs. 1,00,000 + 100,000 + 10,000 --- 10,000
= Rs. 2,00,000
Capital Employed = Fixed Assets + Current Assets --- Current Liability
= Rs. 4,50,000 + Rs. 1,50,000 --- Rs. 1,00,000
= Rs. 5,00,000
OR
= Share Capital + Reserves + Debentures + Profit andLoss account --- Investments in Govt. Bonds
= Rs. 3,00,000 + Rs. 1,00,000 + Rs.1,00,000 +Rs. 1,00,000 --- Rs. 1,00,000
= Rs. 5,00,000
2,00,000Return on Capital Employed = × 100
500,000
= 40 %
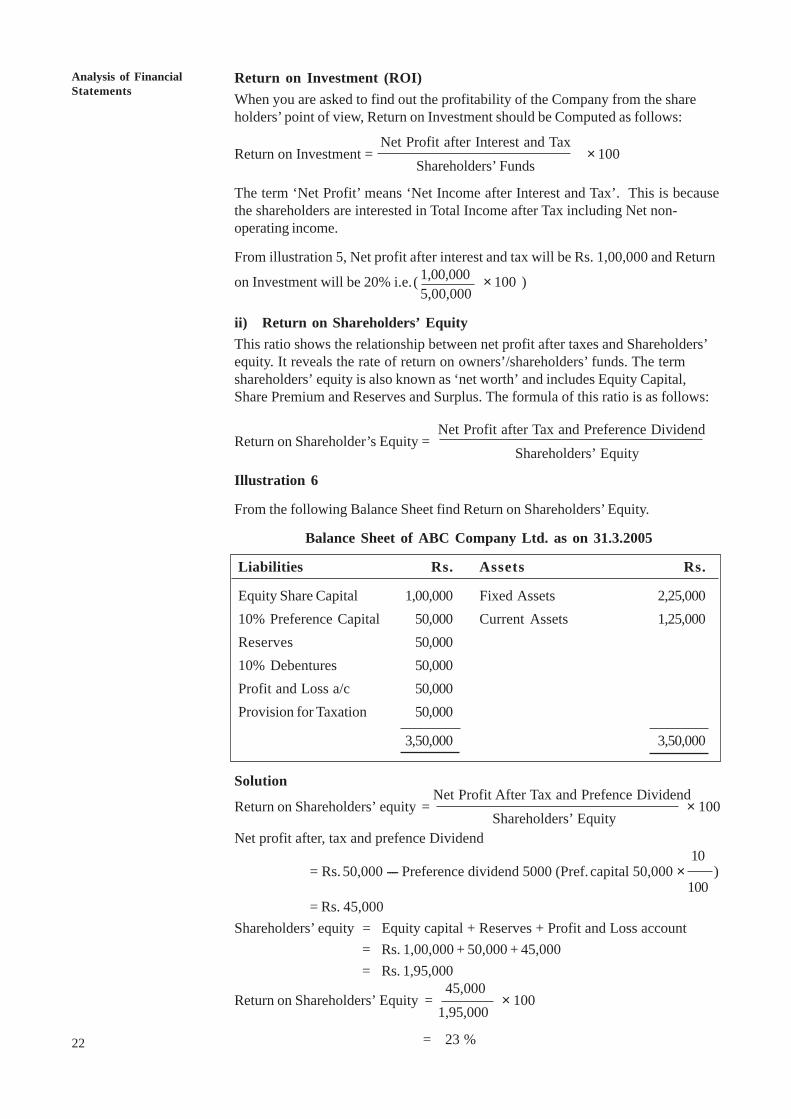
22
An OverviewAnalysis of FinancialStatements
Return on Investment (ROI)When you are asked to find out the profitability of the Company from the shareholders’ point of view, Return on Investment should be Computed as follows:
Net Profit after Interest and TaxReturn on Investment = × 100
Shareholders’ Funds
The term ‘Net Profit’ means ‘Net Income after Interest and Tax’. This is becausethe shareholders are interested in Total Income after Tax including Net non-operating income.
From illustration 5, Net profit after interest and tax will be Rs. 1,00,000 and Return
on Investment will be 20% i.e.( 1,00,000 × 100 ) 5,00,000
ii) Return on Shareholders’ EquityThis ratio shows the relationship between net profit after taxes and Shareholders’equity. It reveals the rate of return on owners’/shareholders’ funds. The termshareholders’ equity is also known as ‘net worth’ and includes Equity Capital,Share Premium and Reserves and Surplus. The formula of this ratio is as follows:
Net Profit after Tax and Preference DividendReturn on Shareholder’s Equity =
Shareholders’ Equity
Illustration 6
From the following Balance Sheet find Return on Shareholders’ Equity.
Balance Sheet of ABC Company Ltd. as on 31.3.2005
Liabilities Rs. Assets Rs.
Equity Share Capital 1,00,000 Fixed Assets 2,25,00010% Preference Capital 50,000 Current Assets 1,25,000Reserves 50,00010% Debentures 50,000Profit and Loss a/c 50,000Provision for Taxation 50,000
3,50,000 3,50,000
Solution Net Profit After Tax and Prefence Dividend
Return on Shareholders’ equity = × 100 Shareholders’ Equity
Net profit after, tax and prefence Dividend10
= Rs. 50,000 ---- Preference dividend 5000 (Pref. capital 50,000 × )100
= Rs. 45,000Shareholders’ equity = Equity capital + Reserves + Profit and Loss account
= Rs. 1,00,000 + 50,000 + 45,000= Rs. 1,95,000
45,000Return on Shareholders’ Equity = × 100
1,95,000
= 23 %
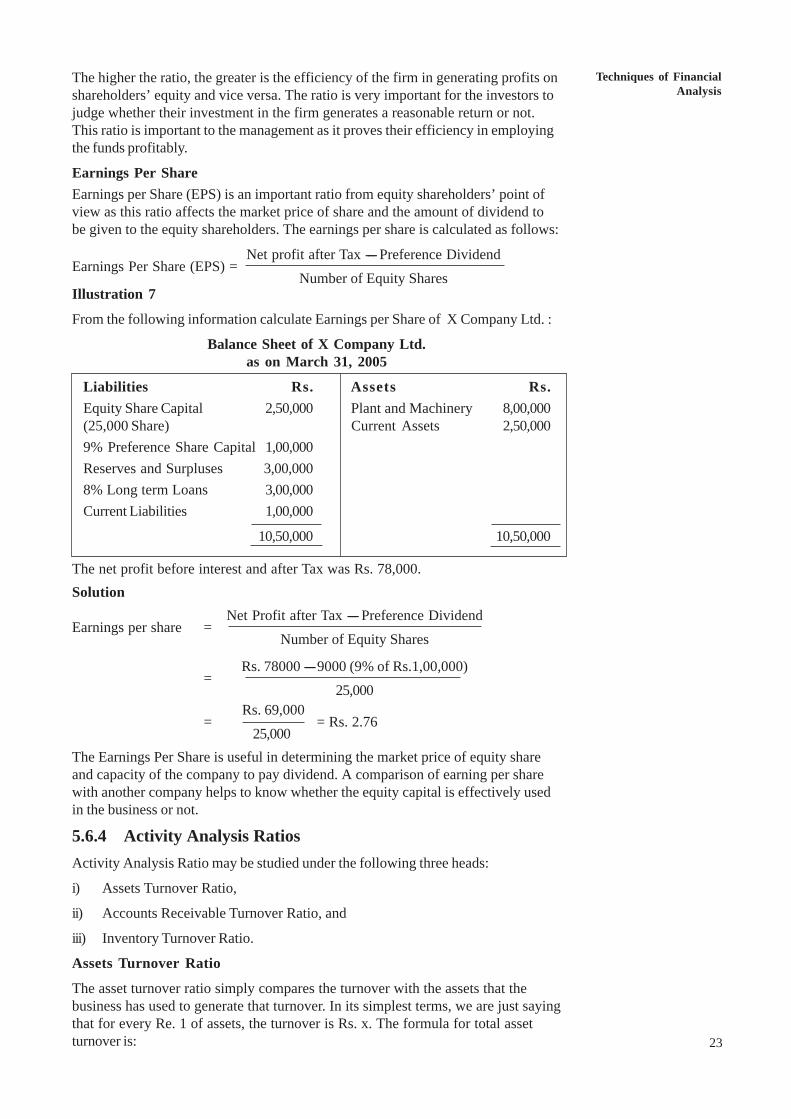
Techniques of FinancialAnalysis
23
The higher the ratio, the greater is the efficiency of the firm in generating profits onshareholders’ equity and vice versa. The ratio is very important for the investors tojudge whether their investment in the firm generates a reasonable return or not.This ratio is important to the management as it proves their efficiency in employingthe funds profitably.
Earnings Per ShareEarnings per Share (EPS) is an important ratio from equity shareholders’ point ofview as this ratio affects the market price of share and the amount of dividend tobe given to the equity shareholders. The earnings per share is calculated as follows:
Net profit after Tax ---- Preference DividendEarnings Per Share (EPS) =
Number of Equity SharesIllustration 7
From the following information calculate Earnings per Share of X Company Ltd. :
Balance Sheet of X Company Ltd.as on March 31, 2005
Liabilities Rs. Assets Rs.Equity Share Capital 2,50,000 Plant and Machinery 8,00,000(25,000 Share) Current Assets 2,50,0009% Preference Share Capital 1,00,000Reserves and Surpluses 3,00,0008% Long term Loans 3,00,000Current Liabilities 1,00,000
10,50,000 10,50,000
The net profit before interest and after Tax was Rs. 78,000.Solution
Net Profit after Tax ---- Preference DividendEarnings per share =
Number of Equity Shares
Rs. 78000 ---- 9000 (9% of Rs.1,00,000)=
25,000 Rs. 69,000
= = Rs. 2.7625,000
The Earnings Per Share is useful in determining the market price of equity shareand capacity of the company to pay dividend. A comparison of earning per sharewith another company helps to know whether the equity capital is effectively usedin the business or not.
5.6.4 Activity Analysis RatiosActivity Analysis Ratio may be studied under the following three heads:
i) Assets Turnover Ratio,
ii) Accounts Receivable Turnover Ratio, and
iii) Inventory Turnover Ratio.
Assets Turnover Ratio
The asset turnover ratio simply compares the turnover with the assets that thebusiness has used to generate that turnover. In its simplest terms, we are just sayingthat for every Re. 1 of assets, the turnover is Rs. x. The formula for total assetturnover is:
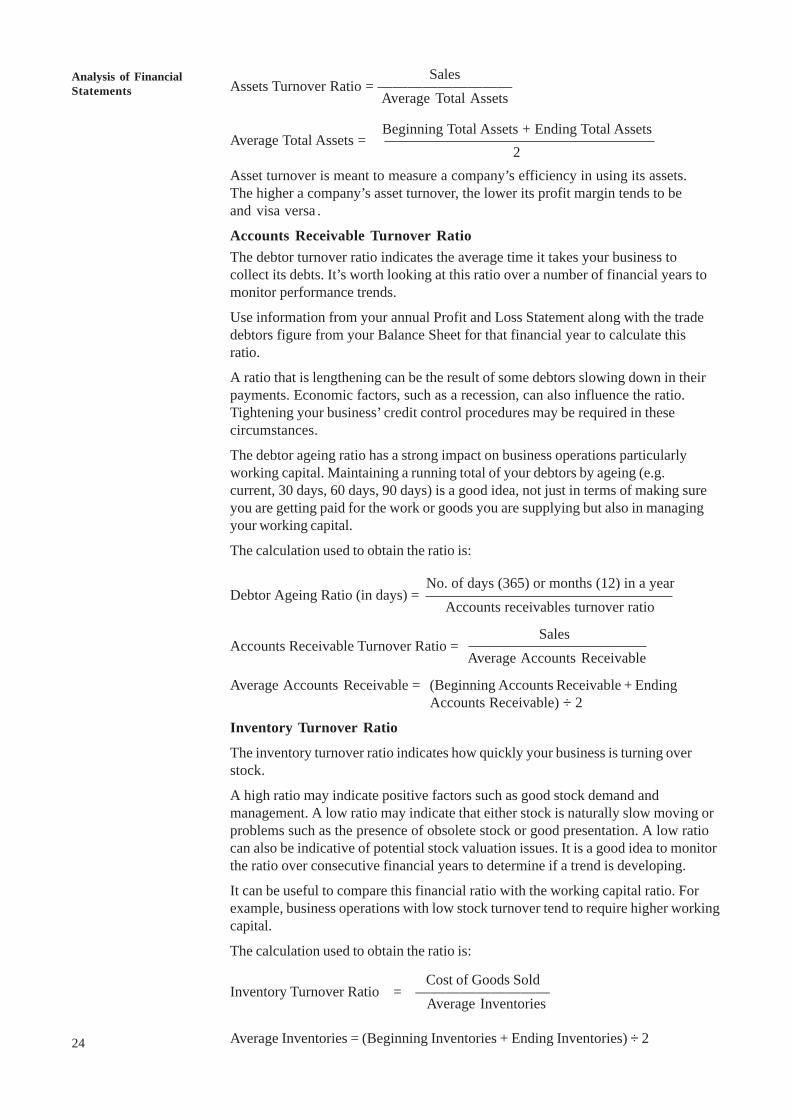
24
An OverviewAnalysis of FinancialStatements
SalesAssets Turnover Ratio = —————————
Average Total Assets
Average Total Assets = Beginning Total Assets + Ending Total Assets
2Asset turnover is meant to measure a company’s efficiency in using its assets.The higher a company’s asset turnover, the lower its profit margin tends to beand visa versa .
Accounts Receivable Turnover RatioThe debtor turnover ratio indicates the average time it takes your business tocollect its debts. It’s worth looking at this ratio over a number of financial years tomonitor performance trends.
Use information from your annual Profit and Loss Statement along with the tradedebtors figure from your Balance Sheet for that financial year to calculate thisratio.
A ratio that is lengthening can be the result of some debtors slowing down in theirpayments. Economic factors, such as a recession, can also influence the ratio.Tightening your business’ credit control procedures may be required in thesecircumstances.
The debtor ageing ratio has a strong impact on business operations particularlyworking capital. Maintaining a running total of your debtors by ageing (e.g.current, 30 days, 60 days, 90 days) is a good idea, not just in terms of making sureyou are getting paid for the work or goods you are supplying but also in managingyour working capital.
The calculation used to obtain the ratio is:
No. of days (365) or months (12) in a yearDebtor Ageing Ratio (in days) =
Accounts receivables turnover ratio
SalesAccounts Receivable Turnover Ratio =
Average Accounts Receivable
Average Accounts Receivable = (Beginning Accounts Receivable + EndingAccounts Receivable) ÷ 2
Inventory Turnover Ratio
The inventory turnover ratio indicates how quickly your business is turning overstock.
A high ratio may indicate positive factors such as good stock demand andmanagement. A low ratio may indicate that either stock is naturally slow moving orproblems such as the presence of obsolete stock or good presentation. A low ratiocan also be indicative of potential stock valuation issues. It is a good idea to monitorthe ratio over consecutive financial years to determine if a trend is developing.
It can be useful to compare this financial ratio with the working capital ratio. Forexample, business operations with low stock turnover tend to require higher workingcapital.
The calculation used to obtain the ratio is:
Cost of Goods SoldInventory Turnover Ratio = ————————— Average Inventories
Average Inventories = (Beginning Inventories + Ending Inventories) ÷ 2
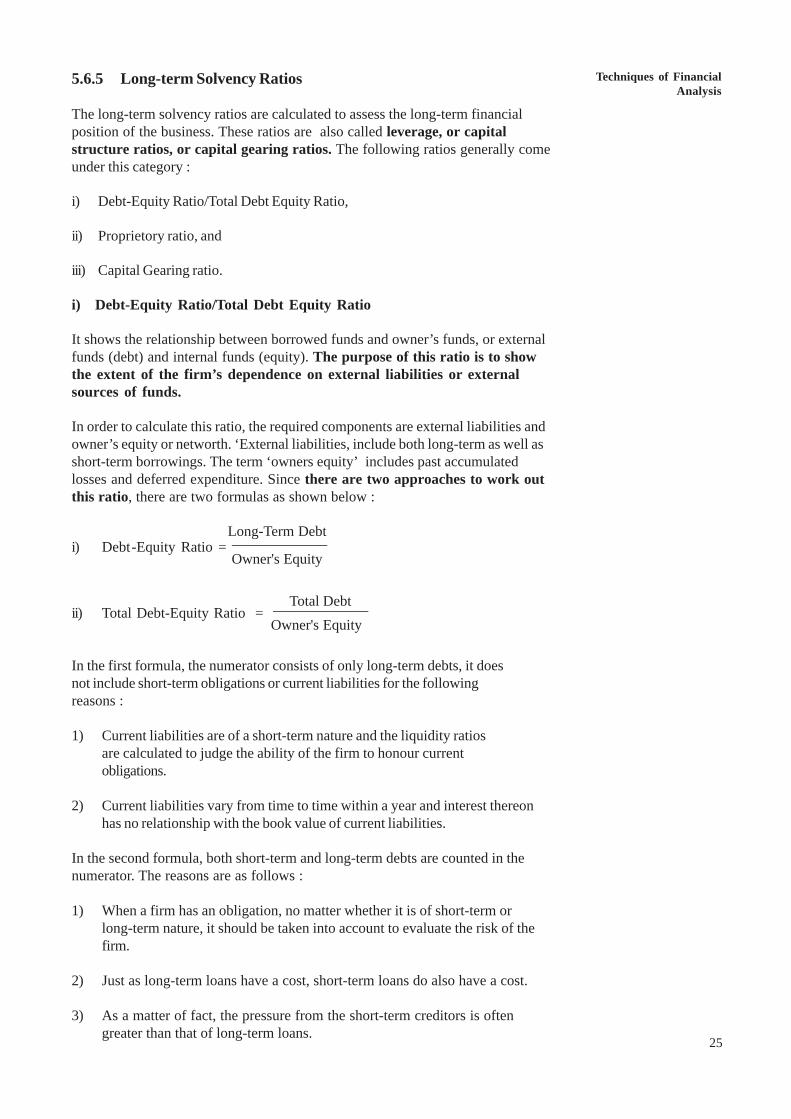
Techniques of FinancialAnalysis
25
5.6.5 Long-term Solvency Ratios
The long-term solvency ratios are calculated to assess the long-term financialposition of the business. These ratios are also called leverage, or capitalstructure ratios, or capital gearing ratios. The following ratios generally comeunder this category :
i) Debt-Equity Ratio/Total Debt Equity Ratio,
ii) Proprietory ratio, and
iii) Capital Gearing ratio.
i) Debt-Equity Ratio/Total Debt Equity Ratio
It shows the relationship between borrowed funds and owner’s funds, or externalfunds (debt) and internal funds (equity). The purpose of this ratio is to showthe extent of the firm’s dependence on external liabilities or externalsources of funds.
In order to calculate this ratio, the required components are external liabilities andowner’s equity or networth. ‘External liabilities, include both long-term as well asshort-term borrowings. The term ‘owners equity’ includes past accumulatedlosses and deferred expenditure. Since there are two approaches to work outthis ratio, there are two formulas as shown below :
Long-Term Debti) Debt -Equity Ratio = _____________
Owner's Equity
Total Debtii) Total Debt-Equity Ratio = _____________
Owner's Equity
In the first formula, the numerator consists of only long-term debts, it doesnot include short-term obligations or current liabilities for the followingreasons :
1) Current liabilities are of a short-term nature and the liquidity ratiosare calculated to judge the ability of the firm to honour currentobligations.
2) Current liabilities vary from time to time within a year and interest thereonhas no relationship with the book value of current liabilities.
In the second formula, both short-term and long-term debts are counted in thenumerator. The reasons are as follows :
1) When a firm has an obligation, no matter whether it is of short-term orlong-term nature, it should be taken into account to evaluate the risk of thefirm.
2) Just as long-term loans have a cost, short-term loans do also have a cost.
3) As a matter of fact, the pressure from the short-term creditors is oftengreater than that of long-term loans.
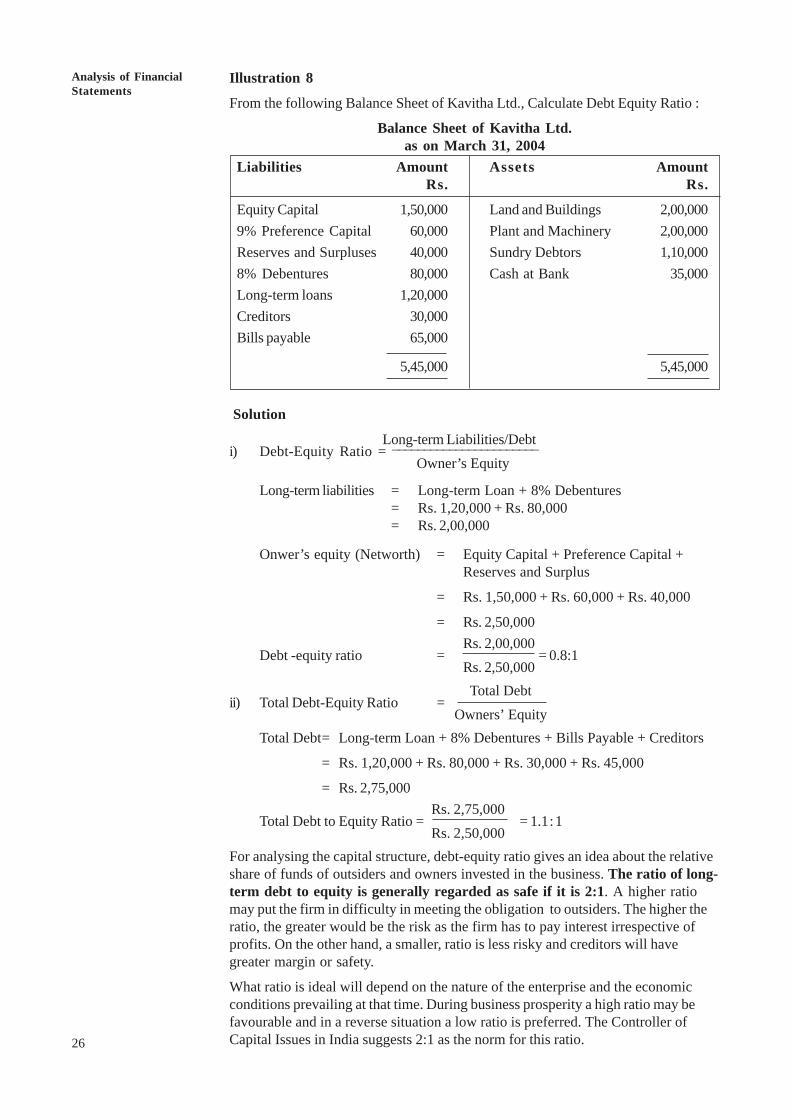
26
An OverviewAnalysis of FinancialStatements
Illustration 8
From the following Balance Sheet of Kavitha Ltd., Calculate Debt Equity Ratio :
Balance Sheet of Kavitha Ltd.as on March 31, 2004
Liabilities Amount Assets AmountRs. Rs.
Equity Capital 1,50,000 Land and Buildings 2,00,0009% Preference Capital 60,000 Plant and Machinery 2,00,000Reserves and Surpluses 40,000 Sundry Debtors 1,10,0008% Debentures 80,000 Cash at Bank 35,000Long-term loans 1,20,000Creditors 30,000Bills payable 65,000
5,45,000 5,45,000
Solution
Long-term Liabilities/Debti) Debt-Equity Ratio = _______________________
Owner’s Equity
Long-term liabilities = Long-term Loan + 8% Debentures= Rs. 1,20,000 + Rs. 80,000= Rs. 2,00,000
Onwer’s equity (Networth) = Equity Capital + Preference Capital +Reserves and Surplus
= Rs. 1,50,000 + Rs. 60,000 + Rs. 40,000
= Rs. 2,50,000Rs. 2,00,000
Debt -equity ratio = = 0.8:1Rs. 2,50,000Total Debt
ii) Total Debt-Equity Ratio =Owners’ Equity
Total Debt= Long-term Loan + 8% Debentures + Bills Payable + Creditors
= Rs. 1,20,000 + Rs. 80,000 + Rs. 30,000 + Rs. 45,000
= Rs. 2,75,000 Rs. 2,75,000
Total Debt to Equity Ratio = = 1.1:1 Rs. 2,50,000
For analysing the capital structure, debt-equity ratio gives an idea about the relativeshare of funds of outsiders and owners invested in the business. The ratio of long-term debt to equity is generally regarded as safe if it is 2:1. A higher ratiomay put the firm in difficulty in meeting the obligation to outsiders. The higher theratio, the greater would be the risk as the firm has to pay interest irrespective ofprofits. On the other hand, a smaller, ratio is less risky and creditors will havegreater margin or safety.
What ratio is ideal will depend on the nature of the enterprise and the economicconditions prevailing at that time. During business prosperity a high ratio may befavourable and in a reverse situation a low ratio is preferred. The Controller ofCapital Issues in India suggests 2:1 as the norm for this ratio.
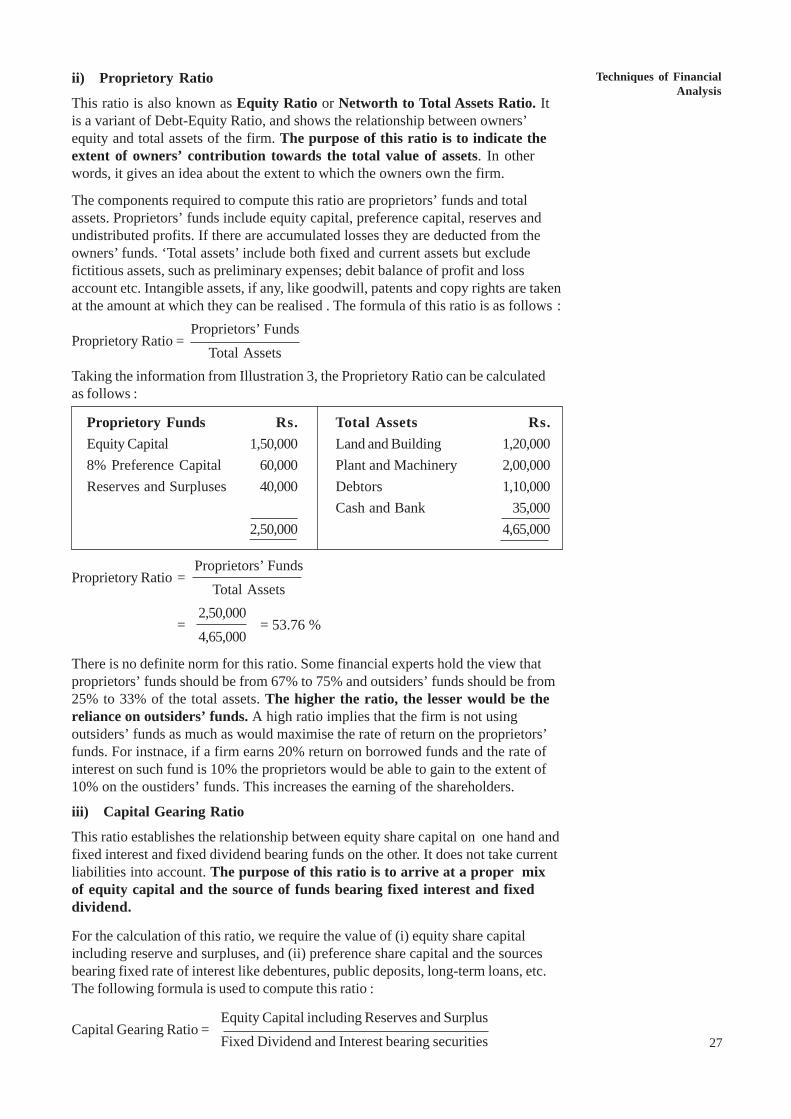
Techniques of FinancialAnalysis
27
ii) Proprietory Ratio
This ratio is also known as Equity Ratio or Networth to Total Assets Ratio. Itis a variant of Debt-Equity Ratio, and shows the relationship between owners’equity and total assets of the firm. The purpose of this ratio is to indicate theextent of owners’ contribution towards the total value of assets. In otherwords, it gives an idea about the extent to which the owners own the firm.
The components required to compute this ratio are proprietors’ funds and totalassets. Proprietors’ funds include equity capital, preference capital, reserves andundistributed profits. If there are accumulated losses they are deducted from theowners’ funds. ‘Total assets’ include both fixed and current assets but excludefictitious assets, such as preliminary expenses; debit balance of profit and lossaccount etc. Intangible assets, if any, like goodwill, patents and copy rights are takenat the amount at which they can be realised . The formula of this ratio is as follows :
Proprietors’ FundsProprietory Ratio =
Total AssetsTaking the information from Illustration 3, the Proprietory Ratio can be calculatedas follows :
Proprietory Funds Rs. Total Assets Rs.Equity Capital 1,50,000 Land and Building 1,20,0008% Preference Capital 60,000 Plant and Machinery 2,00,000Reserves and Surpluses 40,000 Debtors 1,10,000
Cash and Bank 35,0002,50,000 4,65,000
Proprietors’ FundsProprietory Ratio =
Total Assets2,50,000
= = 53.76 %4,65,000
There is no definite norm for this ratio. Some financial experts hold the view thatproprietors’ funds should be from 67% to 75% and outsiders’ funds should be from25% to 33% of the total assets. The higher the ratio, the lesser would be thereliance on outsiders’ funds. A high ratio implies that the firm is not usingoutsiders’ funds as much as would maximise the rate of return on the proprietors’funds. For instnace, if a firm earns 20% return on borrowed funds and the rate ofinterest on such fund is 10% the proprietors would be able to gain to the extent of10% on the oustiders’ funds. This increases the earning of the shareholders.
iii) Capital Gearing Ratio
This ratio establishes the relationship between equity share capital on one hand andfixed interest and fixed dividend bearing funds on the other. It does not take currentliabilities into account. The purpose of this ratio is to arrive at a proper mixof equity capital and the source of funds bearing fixed interest and fixeddividend.
For the calculation of this ratio, we require the value of (i) equity share capitalincluding reserve and surpluses, and (ii) preference share capital and the sourcesbearing fixed rate of interest like debentures, public deposits, long-term loans, etc.The following formula is used to compute this ratio :
Equity Capital including Reserves and SurplusCapital Gearing Ratio =
Fixed Dividend and Interest bearing securities
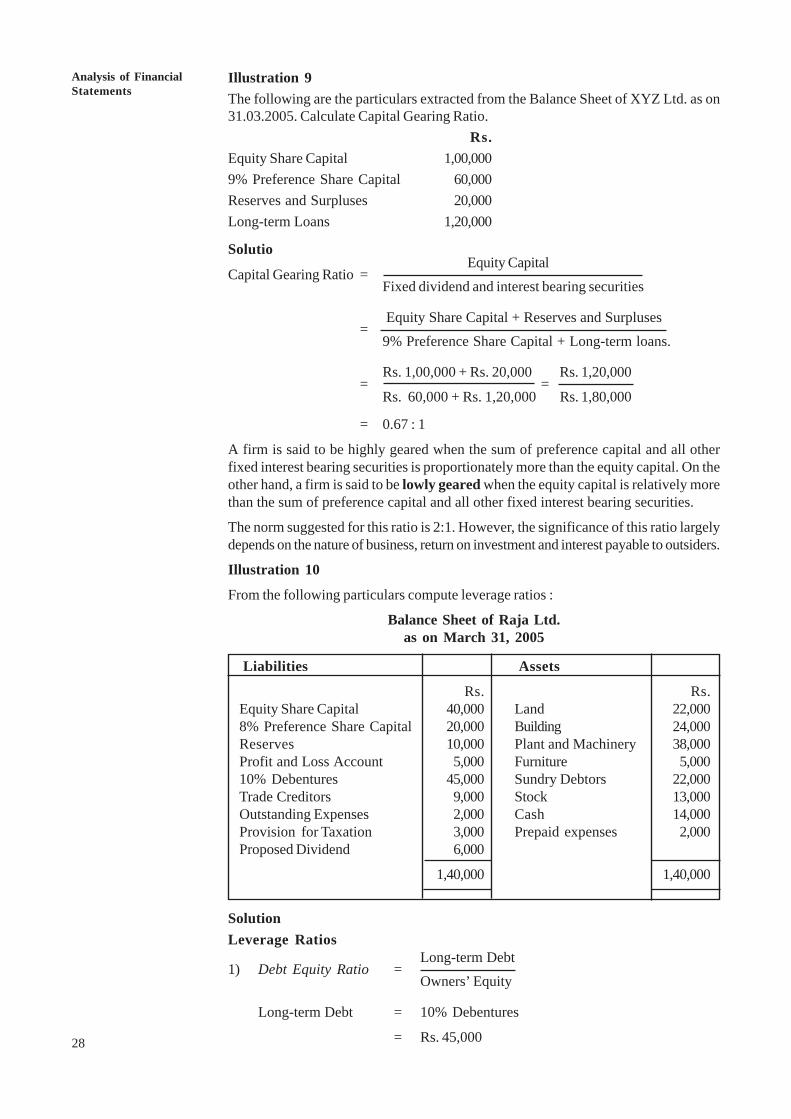
28
An OverviewAnalysis of FinancialStatements
Illustration 9The following are the particulars extracted from the Balance Sheet of XYZ Ltd. as on31.03.2005. Calculate Capital Gearing Ratio.
Rs.Equity Share Capital 1,00,0009% Preference Share Capital 60,000Reserves and Surpluses 20,000Long-term Loans 1,20,000
SolutioEquity Capital
Capital Gearing Ratio =Fixed dividend and interest bearing securities
Equity Share Capital + Reserves and Surpluses=
9% Preference Share Capital + Long-term loans.
Rs. 1,00,000 + Rs. 20,000 Rs. 1,20,000= =
Rs. 60,000 + Rs. 1,20,000 Rs. 1,80,000
= 0.67 : 1
A firm is said to be highly geared when the sum of preference capital and all otherfixed interest bearing securities is proportionately more than the equity capital. On theother hand, a firm is said to be lowly geared when the equity capital is relatively morethan the sum of preference capital and all other fixed interest bearing securities.
The norm suggested for this ratio is 2:1. However, the significance of this ratio largelydepends on the nature of business, return on investment and interest payable to outsiders.
Illustration 10
From the following particulars compute leverage ratios :
Balance Sheet of Raja Ltd.as on March 31, 2005
Liabilities Assets
Rs. Rs.Equity Share Capital 40,000 Land 22,0008% Preference Share Capital 20,000 Building 24,000Reserves 10,000 Plant and Machinery 38,000Profit and Loss Account 5,000 Furniture 5,00010% Debentures 45,000 Sundry Debtors 22,000Trade Creditors 9,000 Stock 13,000Outstanding Expenses 2,000 Cash 14,000Provision for Taxation 3,000 Prepaid expenses 2,000Proposed Dividend 6,000
1,40,000 1,40,000
SolutionLeverage Ratios
Long-term Debt1) Debt Equity Ratio =
Owners’ Equity
Long-term Debt = 10% Debentures
= Rs. 45,000
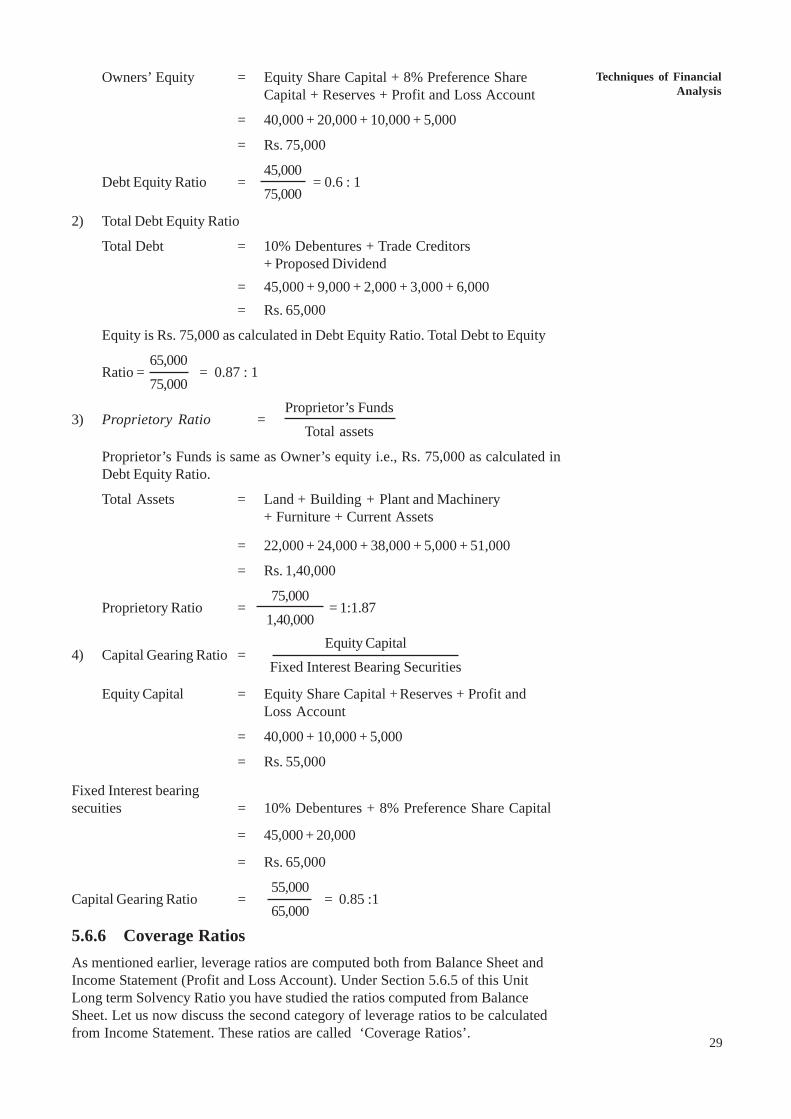
Techniques of FinancialAnalysis
29
Owners’ Equity = Equity Share Capital + 8% Preference ShareCapital + Reserves + Profit and Loss Account
= 40,000 + 20,000 + 10,000 + 5,000
= Rs. 75,000
45,000Debt Equity Ratio = = 0.6 : 1
75,000
2) Total Debt Equity Ratio
Total Debt = 10% Debentures + Trade Creditors+ Proposed Dividend
= 45,000 + 9,000 + 2,000 + 3,000 + 6,000= Rs. 65,000
Equity is Rs. 75,000 as calculated in Debt Equity Ratio. Total Debt to Equity
65,000Ratio = = 0.87 : 1
75,000Proprietor’s Funds
3) Proprietory Ratio =Total assets
Proprietor’s Funds is same as Owner’s equity i.e., Rs. 75,000 as calculated inDebt Equity Ratio.
Total Assets = Land + Building + Plant and Machinery+ Furniture + Current Assets
= 22,000 + 24,000 + 38,000 + 5,000 + 51,000
= Rs. 1,40,000
75,000Proprietory Ratio = = 1:1.87
1,40,000Equity Capital
4) Capital Gearing Ratio =Fixed Interest Bearing Securities
Equity Capital = Equity Share Capital + Reserves + Profit andLoss Account
= 40,000 + 10,000 + 5,000
= Rs. 55,000
Fixed Interest bearingsecuities = 10% Debentures + 8% Preference Share Capital
= 45,000 + 20,000
= Rs. 65,000
55,000Capital Gearing Ratio = = 0.85 :1
65,000
5.6.6 Coverage RatiosAs mentioned earlier, leverage ratios are computed both from Balance Sheet andIncome Statement (Profit and Loss Account). Under Section 5.6.5 of this UnitLong term Solvency Ratio you have studied the ratios computed from BalanceSheet. Let us now discuss the second category of leverage ratios to be calculatedfrom Income Statement. These ratios are called ‘Coverage Ratios’.
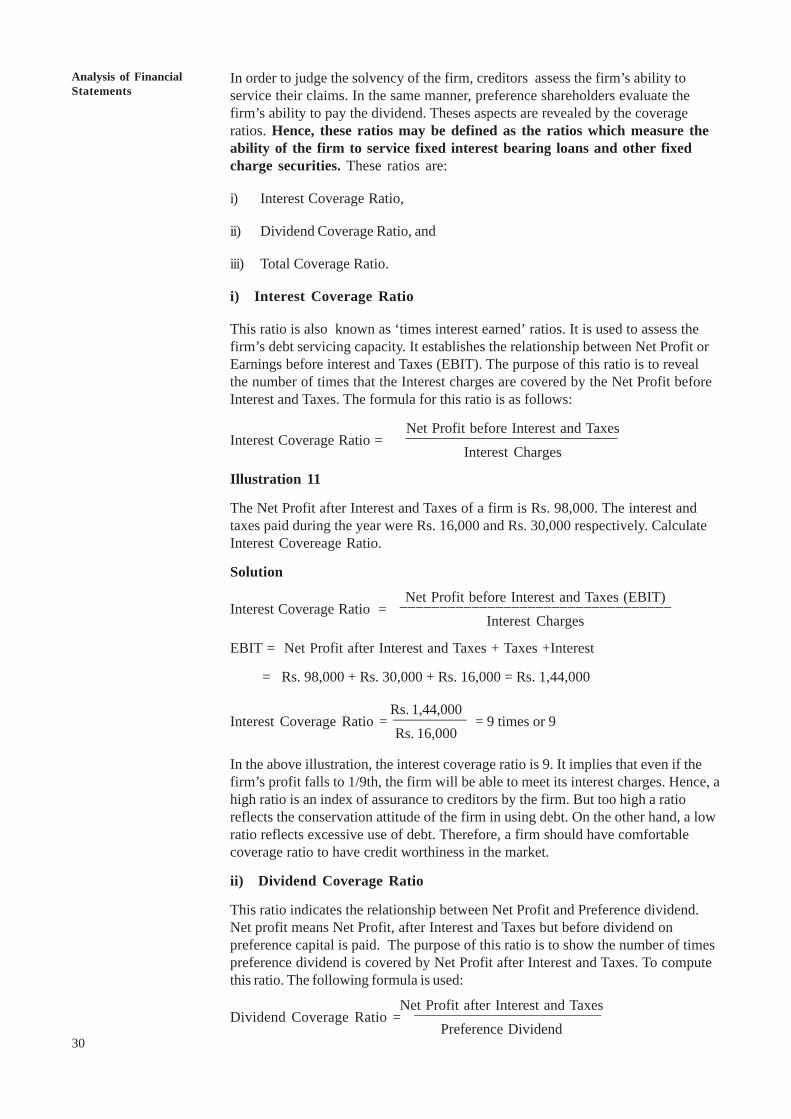
30
An OverviewAnalysis of FinancialStatements
In order to judge the solvency of the firm, creditors assess the firm’s ability toservice their claims. In the same manner, preference shareholders evaluate thefirm’s ability to pay the dividend. Theses aspects are revealed by the coverageratios. Hence, these ratios may be defined as the ratios which measure theability of the firm to service fixed interest bearing loans and other fixedcharge securities. These ratios are:
i) Interest Coverage Ratio,
ii) Dividend Coverage Ratio, and
iii) Total Coverage Ratio.
i) Interest Coverage Ratio
This ratio is also known as ‘times interest earned’ ratios. It is used to assess thefirm’s debt servicing capacity. It establishes the relationship between Net Profit orEarnings before interest and Taxes (EBIT). The purpose of this ratio is to revealthe number of times that the Interest charges are covered by the Net Profit beforeInterest and Taxes. The formula for this ratio is as follows:
Net Profit before Interest and TaxesInterest Coverage Ratio =
Interest Charges
Illustration 11
The Net Profit after Interest and Taxes of a firm is Rs. 98,000. The interest andtaxes paid during the year were Rs. 16,000 and Rs. 30,000 respectively. CalculateInterest Covereage Ratio.
Solution
Net Profit before Interest and Taxes (EBIT)Interest Coverage Ratio = __________________________________
Interest Charges
EBIT = Net Profit after Interest and Taxes + Taxes +Interest
= Rs. 98,000 + Rs. 30,000 + Rs. 16,000 = Rs. 1,44,000
Rs. 1,44,000Interest Coverage Ratio = __________ = 9 times or 9
Rs. 16,000
In the above illustration, the interest coverage ratio is 9. It implies that even if thefirm’s profit falls to 1/9th, the firm will be able to meet its interest charges. Hence, ahigh ratio is an index of assurance to creditors by the firm. But too high a ratioreflects the conservation attitude of the firm in using debt. On the other hand, a lowratio reflects excessive use of debt. Therefore, a firm should have comfortablecoverage ratio to have credit worthiness in the market.
ii) Dividend Coverage Ratio
This ratio indicates the relationship between Net Profit and Preference dividend.Net profit means Net Profit, after Interest and Taxes but before dividend onpreference capital is paid. The purpose of this ratio is to show the number of timespreference dividend is covered by Net Profit after Interest and Taxes. To computethis ratio. The following formula is used:
Net Profit after Interest and TaxesDividend Coverage Ratio = __________________________
Preference Dividend
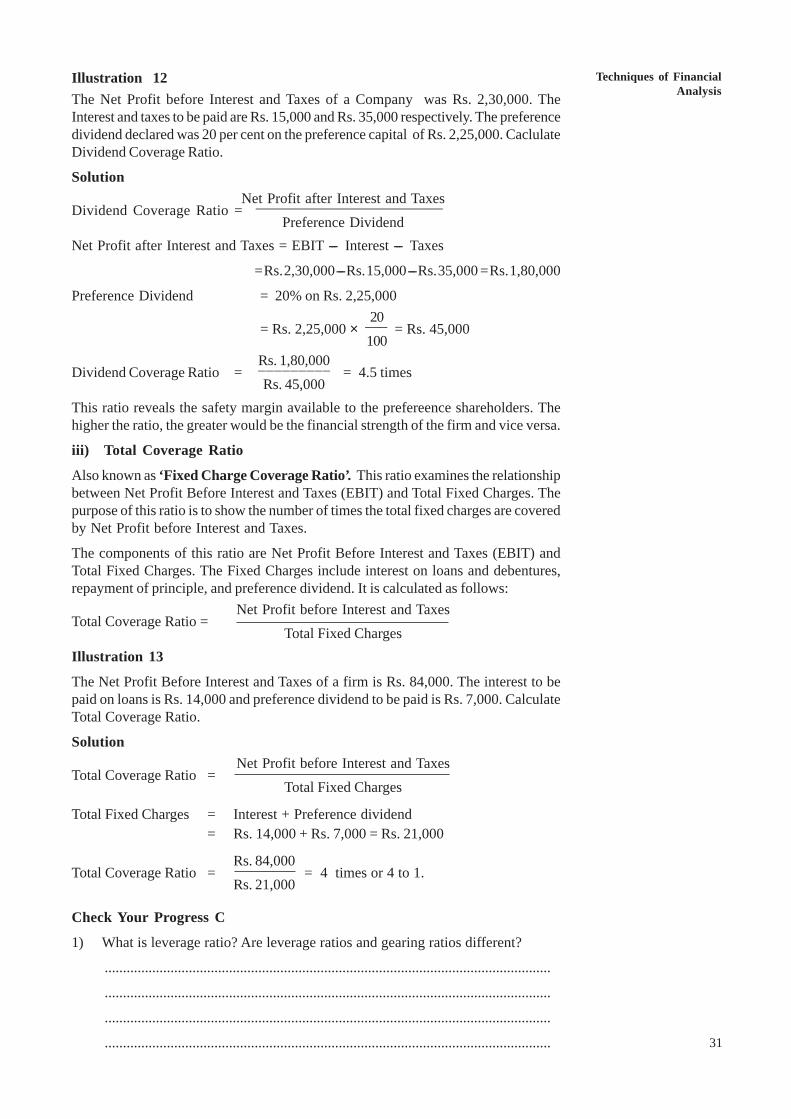
Techniques of FinancialAnalysis
31
Illustration 12The Net Profit before Interest and Taxes of a Company was Rs. 2,30,000. TheInterest and taxes to be paid are Rs. 15,000 and Rs. 35,000 respectively. The preferencedividend declared was 20 per cent on the preference capital of Rs. 2,25,000. CaclulateDividend Coverage Ratio.
SolutionNet Profit after Interest and Taxes
Dividend Coverage Ratio = __________________________Preference Dividend
Net Profit after Interest and Taxes = EBIT --- Interest --- Taxes
= Rs. 2,30,000 --- Rs. 15,000 --- Rs. 35,000 = Rs. 1,80,000
Preference Dividend = 20% on Rs. 2,25,00020
= Rs. 2,25,000 × ___ = Rs. 45,000100
Rs. 1,80,000Dividend Coverage Ratio = _________ = 4.5 times
Rs. 45,000This ratio reveals the safety margin available to the prefereence shareholders. Thehigher the ratio, the greater would be the financial strength of the firm and vice versa.
iii) Total Coverage Ratio
Also known as ‘Fixed Charge Coverage Ratio’. This ratio examines the relationshipbetween Net Profit Before Interest and Taxes (EBIT) and Total Fixed Charges. Thepurpose of this ratio is to show the number of times the total fixed charges are coveredby Net Profit before Interest and Taxes.
The components of this ratio are Net Profit Before Interest and Taxes (EBIT) andTotal Fixed Charges. The Fixed Charges include interest on loans and debentures,repayment of principle, and preference dividend. It is calculated as follows:
Net Profit before Interest and TaxesTotal Coverage Ratio =
Total Fixed ChargesIllustration 13
The Net Profit Before Interest and Taxes of a firm is Rs. 84,000. The interest to bepaid on loans is Rs. 14,000 and preference dividend to be paid is Rs. 7,000. CalculateTotal Coverage Ratio.
SolutionNet Profit before Interest and Taxes
Total Coverage Ratio =Total Fixed Charges
Total Fixed Charges = Interest + Preference dividend= Rs. 14,000 + Rs. 7,000 = Rs. 21,000
Rs. 84,000Total Coverage Ratio = = 4 times or 4 to 1.
Rs. 21,000
Check Your Progress C
1) What is leverage ratio? Are leverage ratios and gearing ratios different?
..........................................................................................................................
..........................................................................................................................
..........................................................................................................................
..........................................................................................................................
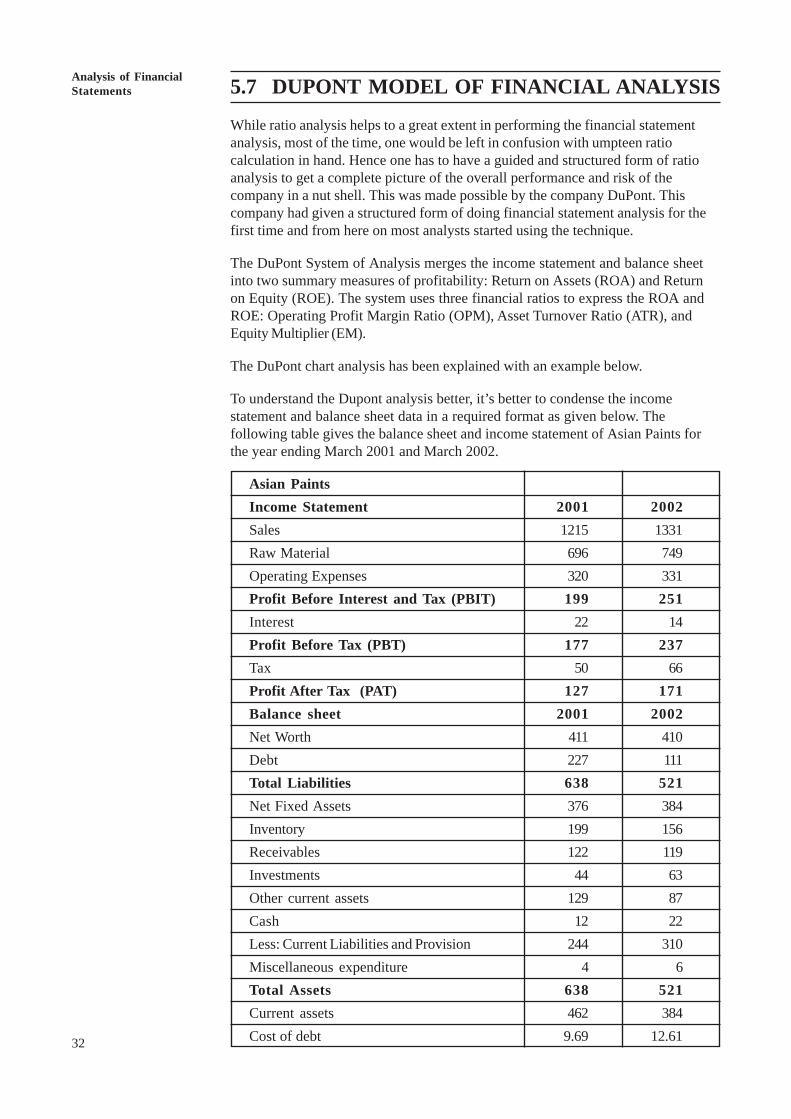
32
An OverviewAnalysis of FinancialStatements 5.7 DUPONT MODEL OF FINANCIAL ANALYSIS
While ratio analysis helps to a great extent in performing the financial statementanalysis, most of the time, one would be left in confusion with umpteen ratiocalculation in hand. Hence one has to have a guided and structured form of ratioanalysis to get a complete picture of the overall performance and risk of thecompany in a nut shell. This was made possible by the company DuPont. Thiscompany had given a structured form of doing financial statement analysis for thefirst time and from here on most analysts started using the technique.
The DuPont System of Analysis merges the income statement and balance sheetinto two summary measures of profitability: Return on Assets (ROA) and Returnon Equity (ROE). The system uses three financial ratios to express the ROA andROE: Operating Profit Margin Ratio (OPM), Asset Turnover Ratio (ATR), andEquity Multiplier (EM).
The DuPont chart analysis has been explained with an example below.
To understand the Dupont analysis better, it’s better to condense the incomestatement and balance sheet data in a required format as given below. Thefollowing table gives the balance sheet and income statement of Asian Paints forthe year ending March 2001 and March 2002.
Asian PaintsIncome Statement 2001 2002Sales 1215 1331Raw Material 696 749Operating Expenses 320 331Profit Before Interest and Tax (PBIT) 199 251Interest 22 14Profit Before Tax (PBT) 177 237Tax 50 66Profit After Tax (PAT) 127 171Balance sheet 2001 2002Net Worth 411 410Debt 227 111Total Liabilities 638 521Net Fixed Assets 376 384Inventory 199 156Receivables 122 119Investments 44 63Other current assets 129 87Cash 12 22Less: Current Liabilities and Provision 244 310Miscellaneous expenditure 4 6Total Assets 638 521Current assets 462 384Cost of debt 9.69 12.61
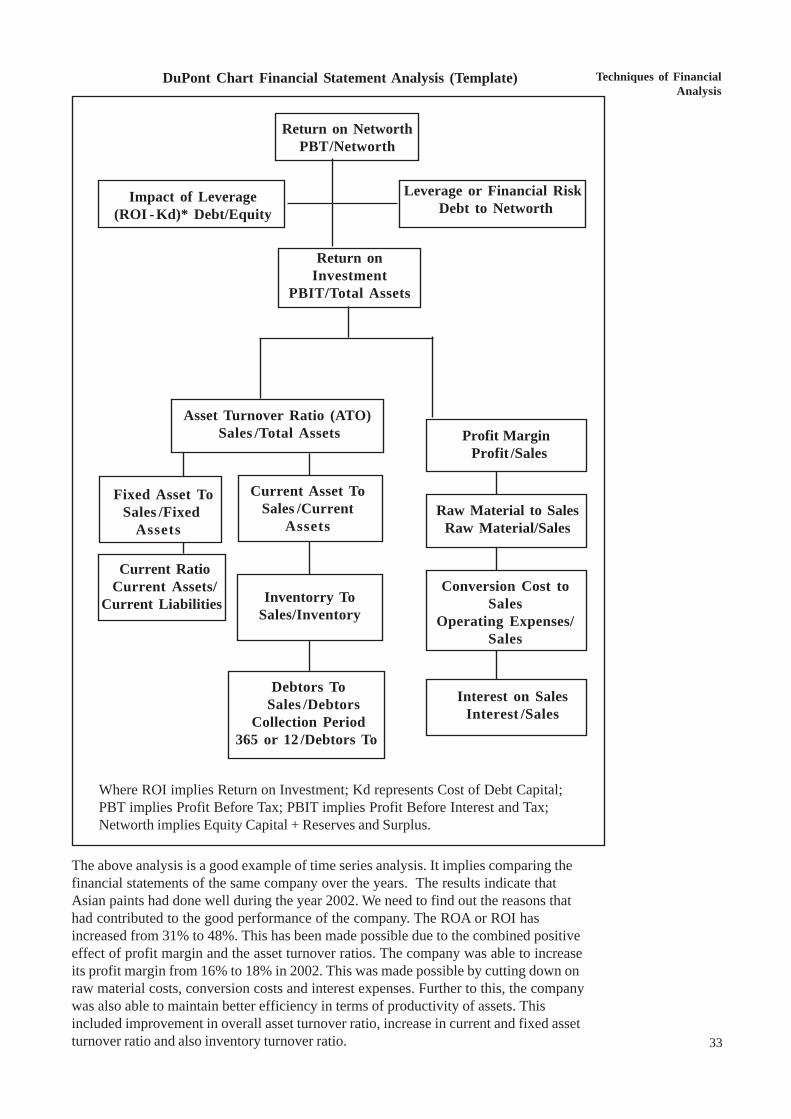
Techniques of FinancialAnalysis
33
DuPont Chart Financial Statement Analysis (Template)
Return on NetworthPBT/Networth
Impact of Leverage(ROI - Kd)* Debt/Equity
Leverage or Financial Risk Debt to Networth
Return onInvestment
PBIT/Total Assets
Asset Turnover Ratio (ATO) Sales /Total Assets
Fixed Asset ToSales /Fixed
Assets
Current Asset ToSales /Current
AssetsRaw Material to Sales
Raw Material/Sales
Current RatioCurrent Assets/
Current Liabilities Inventorry ToSales/Inventory
Conversion Cost toSales
Operating Expenses/Sales
Debtors To Sales /Debtors
Collection Period365 or 12 /Debtors To
Where ROI implies Return on Investment; Kd represents Cost of Debt Capital;PBT implies Profit Before Tax; PBIT implies Profit Before Interest and Tax;Networth implies Equity Capital + Reserves and Surplus.
Profit MarginProfit /Sales
Interest on SalesInterest /Sales
The above analysis is a good example of time series analysis. It implies comparing thefinancial statements of the same company over the years. The results indicate thatAsian paints had done well during the year 2002. We need to find out the reasons thathad contributed to the good performance of the company. The ROA or ROI hasincreased from 31% to 48%. This has been made possible due to the combined positiveeffect of profit margin and the asset turnover ratios. The company was able to increaseits profit margin from 16% to 18% in 2002. This was made possible by cutting down onraw material costs, conversion costs and interest expenses. Further to this, the companywas also able to maintain better efficiency in terms of productivity of assets. Thisincluded improvement in overall asset turnover ratio, increase in current and fixed assetturnover ratio and also inventory turnover ratio.
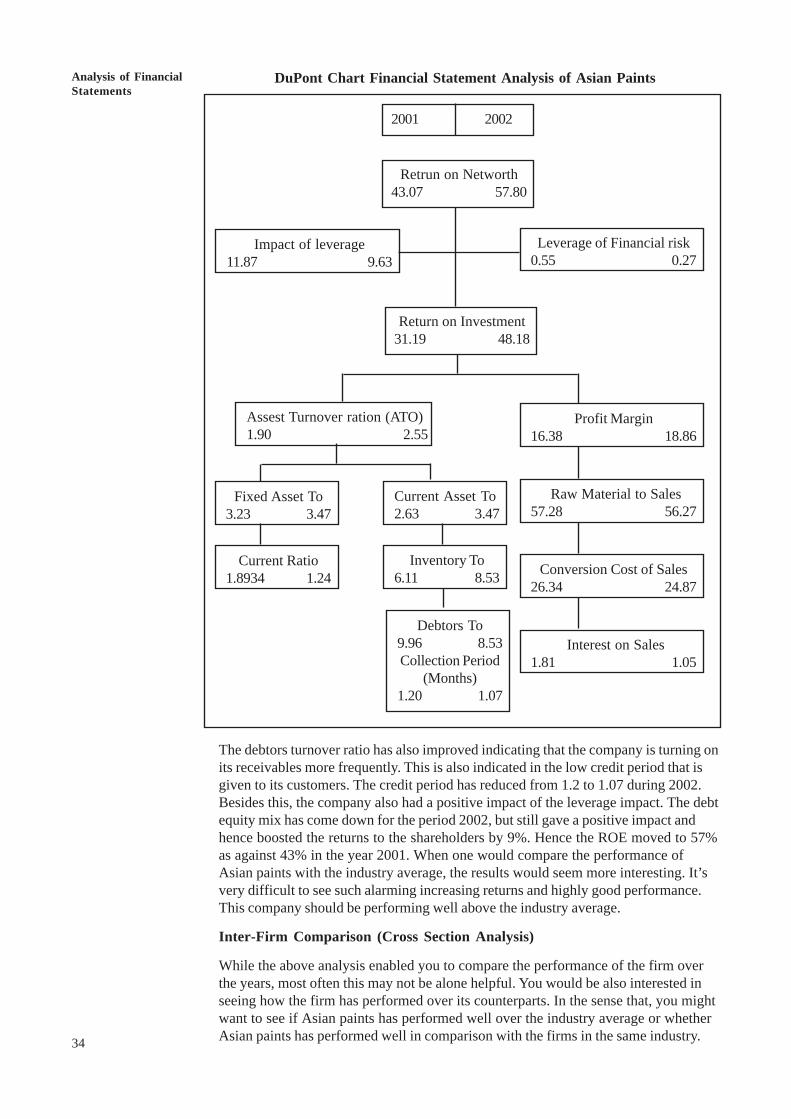
34
An OverviewAnalysis of FinancialStatements
DuPont Chart Financial Statement Analysis of Asian Paints
2001 2002
Retrun on Networth43.07 57.80
Return on Investment31.19 48.18
Leverage of Financial risk0.55 0.27
Impact of leverage11.87 9.63
Profit Margin16.38 18.86
Raw Material to Sales57.28 56.27
Conversion Cost of Sales26.34 24.87
Interest on Sales1.81 1.05
Assest Turnover ration (ATO)1.90 2.55
Fixed Asset To3.23 3.47
Current Ratio1.8934 1.24
Current Asset To2.63 3.47
Inventory To6.11 8.53
Debtors To9.96 8.53Collection Period
(Months)1.20 1.07
The debtors turnover ratio has also improved indicating that the company is turning onits receivables more frequently. This is also indicated in the low credit period that isgiven to its customers. The credit period has reduced from 1.2 to 1.07 during 2002.Besides this, the company also had a positive impact of the leverage impact. The debtequity mix has come down for the period 2002, but still gave a positive impact andhence boosted the returns to the shareholders by 9%. Hence the ROE moved to 57%as against 43% in the year 2001. When one would compare the performance ofAsian paints with the industry average, the results would seem more interesting. It’svery difficult to see such alarming increasing returns and highly good performance.This company should be performing well above the industry average.
Inter-Firm Comparison (Cross Section Analysis)
While the above analysis enabled you to compare the performance of the firm overthe years, most often this may not be alone helpful. You would be also interested inseeing how the firm has performed over its counterparts. In the sense that, you mightwant to see if Asian paints has performed well over the industry average or whetherAsian paints has performed well in comparison with the firms in the same industry.
Techniques of FinancialAnalysis
35
This sort of analysis becomes most useful when you are doing the industry analysisand when the company you are analysing is not the monopoly in the industry. Thiswould make sense to see why the company has either underperformed or overperformed in comparison to the other firms. This sort of analysis helps the analystsforecasts the future market share, profitability and the sustainable growth rate ofthe company in the presence of competition.
Check Your Progress D
1) What is the basic benefit of using the DuPont form of financial statementanalysis?
..........................................................................................................................
..........................................................................................................................
..........................................................................................................................
2) Take any other manufacturing company’s annual report and perform similaranalysis to get a practice of DuPont analysis.
..........................................................................................................................
..........................................................................................................................
..........................................................................................................................
3) What are the different ways in which this chart analysis can be used?
..........................................................................................................................
..........................................................................................................................
..........................................................................................................................
5.8 USES OF RATIO ANALYSISRatio analysis is used as a device to analyse and interpret the financial strength ofthe enterprise. With the help of these ratios Financial statements can be analysedand interpreted more clearly and conclusions can be drawn about the performanceof the business. The importance of a ratio analysis is widely recognised on accountof its usefulness as outlined below:
1) It conveys inter-relationship between different items of the financialstatements: Since the ratios convey the inter-relationship between differentitems of the Balance Sheet and Profit and Loss account, they reflect thefinancial state of affairs and efficiency of operations more clearly than theabsolute accounting figures. For example, the net profit earned by a firm mayappear to be quite satisfactory if the amount of profit is large, say Rs. 5 Lakh.But, the profit earned can not be regarded good unless it is ralated to the totalinvestment. If the capital invested is say Rs. 2 crore, the amount of profitexpressed as a percentage of investment comes to be only 2.5%. This cannotbe said to be satifactory performance. However, if the capital invested wasRs. 50 Lakh, profit earned would be 10% of the capital investment which maybe considered reasonably good.
2) Helps to judge the performance of the business: Efficiency ofperformance of management and the overall financial position are revealed bymeans of financial ratios which may not be otherwise apparent from a set ofaccounting figures. The index of efficiency reflected in the ratios can be usedas the basis of management control. The trend of ratios over a period of timecan also be used for planning and forecasting purposes.
36
An OverviewAnalysis of FinancialStatements
3) Facilitates inter-firm and intra-firm comparison: Ratio analysis providesdata for inter and intra firm comparison. With the help of these datacomparison of the performance of different firms within the industry as well asthe performance of different divisions within the firm can be made andmeaningful conclusion can be drawn out of it as to whether the performanceof the firm is improving or deteriorating so as to make appropriate investmentdecisions.
4) To determine credit worthiness of the business: The credit worthiness ofthe firm, its earning power, ability to pay interest and debt, prospects of growth,and similar information are revealed by ratio analysis.These are required bycreditors, financiers, investors as well as shareholders. They make use of ratioanalysis to measure the financial condition and performance of the firm.
5) Helpful to Government: The financial statement published by the industrialunits are used by the government to calculate ratios for determining short-termlong-term and overall financial position of the firms.These financial ratios ofindustrial units may be used by the Government as indicators of overallfinancial strength of industrial sector.
5.9 LIMITATIONS OF RATIO ANALYSISBy now you should have mastered the techniques of ratio analysis and itsapplication at the various situations. However, before you start applying the ratios youshould be careful enough to be aware of some of its limitations while being used.
1) You should be aware that many companies operate in more than one industrytake for instance companies like LandT, HLL, PandG etc. which does notoperate in only one business segment but in diversified businesses. So careshould be taken to ensure that segment level ratios are compared.
2) Inflation has distorted balance sheets, in the sense that, the financialstatements do not account for inflation which implies that they do not representthe real picture of the scenario. However, given not so high inflation it wouldnot affect the analysis much.
3) Seasonal factors can greatly influence ratios. Hence, you should make surethat you control for the seasonal differences. Better would be to perform theratio analysis on a quarterly basis to get the complete picture for the wholeyear.
4) With the kind of accounting scams breaking every other day, its not unusual tofind that Window-dressing could have been done. Though small investors haveno control on this and very little chance to get to know about the creativeaccounting that is taking place one should not however loose sight into any sortof discrepancies in the accounting.
5) Its quite possible that different companies within an industry may use differentaccounting practices which would make it difficult to compare the twocompanies. In that situation it should be made sure that the changes areaccounted for and made sure that it would not affect the analysis.
6) It could also be possible that different companies may use different fiscalyears. Say for instance one company may use the calendar year as its accountclosing year while some others may use the fiscal year. In that process careshould be taken to compare the respective months or years adjusting for thedifferences in the accounting year.
7) The age of the company may distort ratios. So it should be take into accountthat the companies you are comparing have some basic similarities. The longer
Techniques of FinancialAnalysis
37
the company had stayed in business the ratios would be quite different fromthe new entrants in the same industry. Such factors have to be accounted for.
8) However, there is also possibility that innovation and aggressiveness may leadto “bad” ratios. So one should not blindly depend on the numeric ratio figuresbut try and understand why the company has bad ratios in any particular yearbefore jumping into wrong conclusions.
9) There could also be possibility that the benchmark used for analyzing the ratiosmay not be appropriate. The industry average may not be an appropriate ordesirable target ratio. One has to carefully pick the industry averages or thebenchmark ratios. As industry averages can be very rough approximations.
10) The other downside of the ratio analysis is that ratios should not be interpreted“one-way,” e.g. a higher ratio may only be better up to a point. So one shouldnot assume that this will hold good in future. A company having a Profitmargin of 10% in 2003 does not necessarily indicate that it would have atleast10% profit margin in the year 2004.
5.10 LET US SUM UPFinancial statements represent a summary of the financial information prepared inthe required manner for the purpose of use by managers and external stakeholders.Financial reports are prepared basically to communicate to the externalshareholders about the financial position of the company that they own.
Different groups of users of financial statements are interested in different aspectsof a company’s financial activities. Short-term creditors are interested primarily inthe company’s ability to make cash payments in the short term; they focus theirattention on operating cash flows and current assets and liabilities. Long-termcreditors, on the other hand, are more interested in the company’s long-term abilityto pay interest and principal and would not limit their analysis to the company’sability to make cash payments in the immediate future. The focus of commonstockholders can vary from one investor to another, but generally stockholders areinterested in the company’s ability to pay dividends and increase the market valueof the stock of the company. Each group may focus on different information in thefinancial statements to meet its unique objectives
An important aspect of financial statement analysis is determining relevantrelationships among specific items of information. Companies typically presentfinancial information for more than one time period, which permits users of theinformation to make comparisons that help them understand changes over time.Financial statements based on absolute value and percentage changes and trendpercentages are tools for comparing information from successive time periods.Component percentages and ratios, on the other hand, are tools for establishingrelationships and making comparisons within an accounting period. Both types ofcomparisons are important in understanding an enterprise’s financial position, resultsof operations, and cash flows.
Assessing the quality of information is an important aspect of financial statementanalysis. Enterprises have significant latitude in the selection of financial reportingmethods within generally accepted accounting principles. Assessing the quality of acompany’s earnings, assets, and working capital is done by evaluating theaccounting methods selected for use in preparing financial statements.Management’s choice of accounting principles and methods that are in the bestlong-term interests of the company, even though they may currently result in lowernet income or lower total assets or working capital, leads to a conclusion of highquality in reported accounting information.
38
An OverviewAnalysis of FinancialStatements
Financial accounting information is most useful if viewed in comparison with otherrelevant information. Net income is an important measure of the financial success ofan enterprise. To make the amount of net income even more useful than if it wereviewed simply in isolation, it is often compared with the sales from which net incomeresults, the assets used to generate the income, and the amount of stockholders’equity invested by owners to earn the net income. Hence Ratio analysis is used as amajor tool.
Ratios are mathematical calculations that compare one financial statement item withanother financial statement item. The two items may come from the same financialstatement, such as the current ratio, which compares the amount of current assets withthe amount of current liabilities, both of which appear in the statement of financialposition (balance sheet). On the other hand, the items may come from two differentfinancial statements, such as the return on stockholders’ equity, which compares netincome from the income statement with the amount of stockholders’ equity from thestatement of financial position (balance sheet). Accountants and financial analysts havedeveloped many ratios that place information from a company’s financial statements ina context to permit better understanding to support decision making.
Often ratio analysis is performed in a more structured form called the Dupont model ofanalysis. This helps the investors a better picture of the analysis and also moremeaningful and holistic picture of the financial position of the companies.
5.11 KEY WORDSAccounting Ratio : Ratio of accounting figures presented in financial statements.
Common Size Balance Sheet : Statement of assets and liabilities showing each itemas a ratio (percentage) of the aggregate value of assets/1iabilities.
Common Size Income Statement : Statement of income and expenditure showingeach item as a ratio (percentage) of net sales.
Comparative Balance Sheet : Statement presenting changes in the value of assets,liabilities and capital investment between two Balance Sheet dates.
Comparative Income Statement : Statement presenting changes in income andexpenditure over successive years.
Capital Employed : Long-term funds including owners’ capital and borrowed capital.
Capital Structure : Financial mix plan of debt and equity.
Financial Analysis : Process of examining the financial position and operatingperformance with the help of information provided by the financial statement.
Financial Reporting : Communicating information based on financial data in the formof reports.
Financial Ratios : Ratios indicating financial soundness of the firm. It is also calledleverage ratio.
Financial Statements : Annual statements of assets and liabilities (Balance sheet) ofincome and expenditure (Profit and Loss account).
Intra-firm Comparison : Comparing financial data of one firm with the correspondingdata of comparable firm(s).
Intra-firm Comparison : Comparison of the financial data relating to one period withthose of previous periods in respect of the same firm.
Owners’ Equity : Shareholders funds including share capital (both preference andequity) P & L A/c balance, reserves minus fictitious assets. It is also called networth.
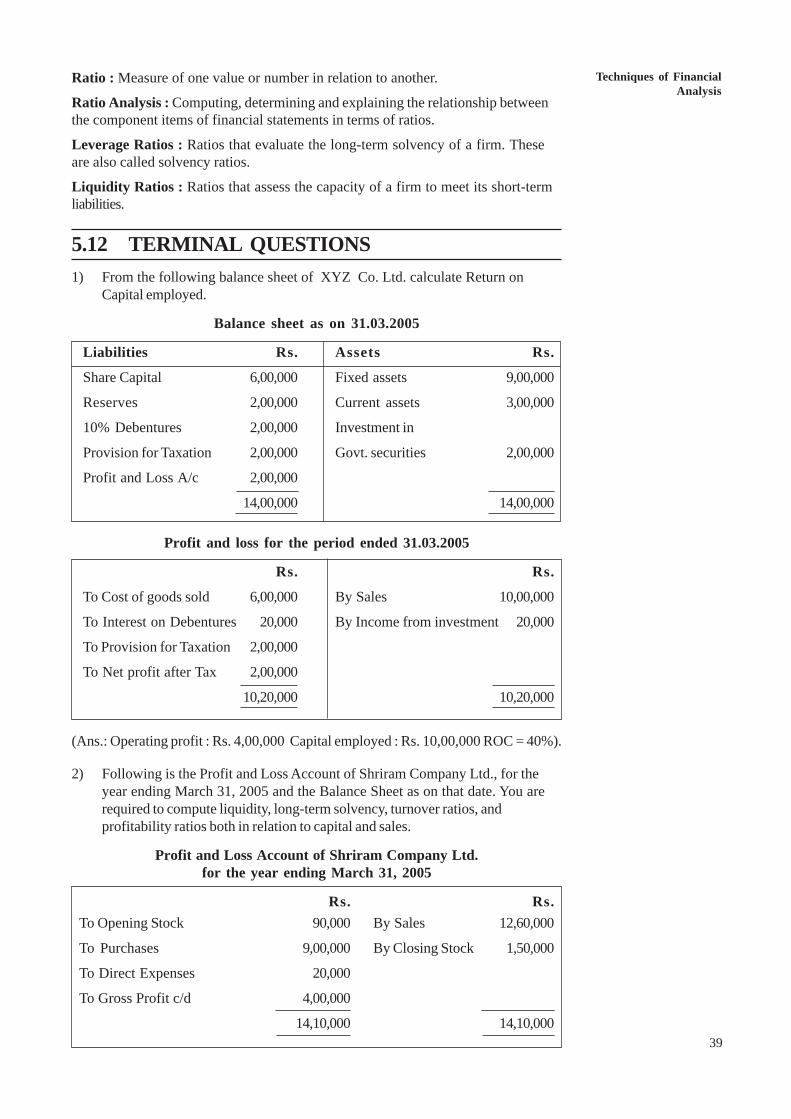
Techniques of FinancialAnalysis
39
5.12 TERMINAL QUESTIONS1) From the following balance sheet of XYZ Co. Ltd. calculate Return on
Capital employed.
Balance sheet as on 31.03.2005
Liabilities Rs. Assets Rs.
Share Capital 6,00,000 Fixed assets 9,00,000
Reserves 2,00,000 Current assets 3,00,000
10% Debentures 2,00,000 Investment in
Provision for Taxation 2,00,000 Govt. securities 2,00,000
Profit and Loss A/c 2,00,000
14,00,000 14,00,000
Profit and loss for the period ended 31.03.2005
Rs. Rs.
To Cost of goods sold 6,00,000 By Sales 10,00,000
To Interest on Debentures 20,000 By Income from investment 20,000
To Provision for Taxation 2,00,000
To Net profit after Tax 2,00,000
10,20,000 10,20,000
(Ans.: Operating profit : Rs. 4,00,000 Capital employed : Rs. 10,00,000 ROC = 40%).
2) Following is the Profit and Loss Account of Shriram Company Ltd., for theyear ending March 31, 2005 and the Balance Sheet as on that date. You arerequired to compute liquidity, long-term solvency, turnover ratios, andprofitability ratios both in relation to capital and sales.
Profit and Loss Account of Shriram Company Ltd.for the year ending March 31, 2005
Rs. Rs.To Opening Stock 90,000 By Sales 12,60,000
To Purchases 9,00,000 By Closing Stock 1,50,000
To Direct Expenses 20,000
To Gross Profit c/d 4,00,000
14,10,000 14,10,000
Ratio : Measure of one value or number in relation to another.
Ratio Analysis : Computing, determining and explaining the relationship betweenthe component items of financial statements in terms of ratios.
Leverage Ratios : Ratios that evaluate the long-term solvency of a firm. Theseare also called solvency ratios.
Liquidity Ratios : Ratios that assess the capacity of a firm to meet its short-termliabilities.
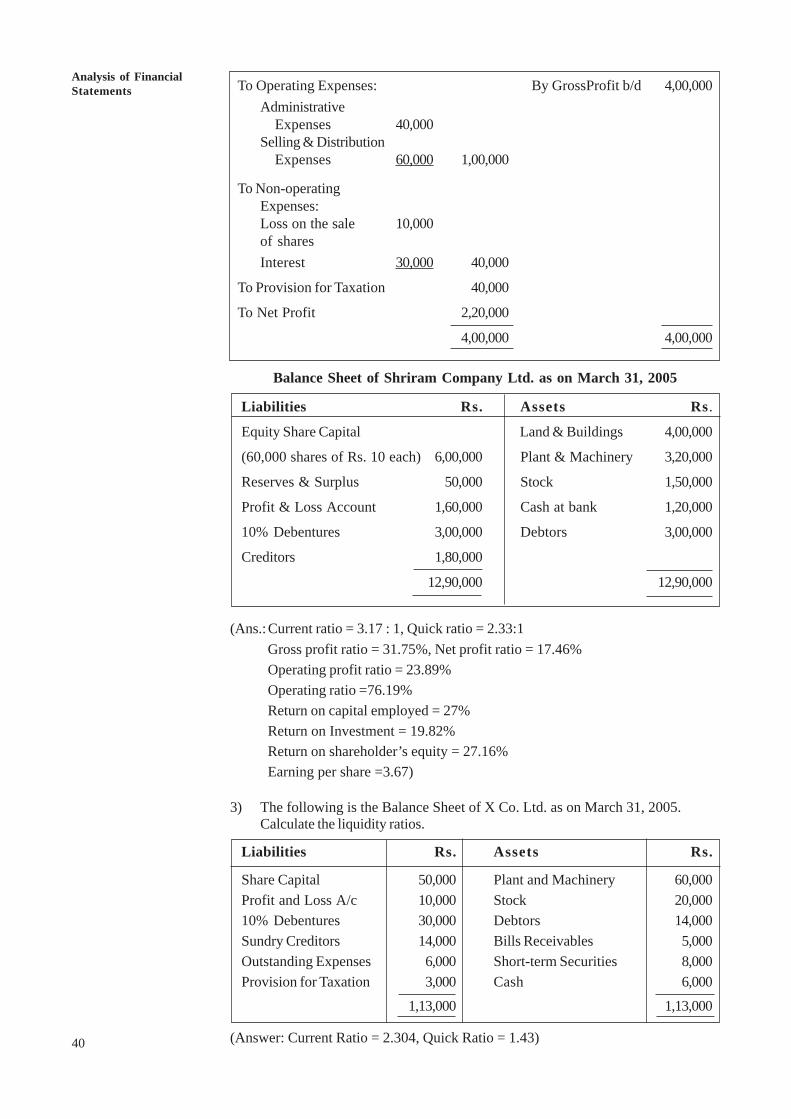
40
An OverviewAnalysis of FinancialStatements To Operating Expenses: By GrossProfit b/d 4,00,000
AdministrativeExpenses 40,000
Selling & DistributionExpenses 60,000 1,00,000
To Non-operatingExpenses:Loss on the sale 10,000of sharesInterest 30,000 40,000
To Provision for Taxation 40,000
To Net Profit 2,20,000
4,00,000 4,00,000
Balance Sheet of Shriram Company Ltd. as on March 31, 2005
Liabilities Rs. Assets Rs.
Equity Share Capital Land & Buildings 4,00,000
(60,000 shares of Rs. 10 each) 6,00,000 Plant & Machinery 3,20,000
Reserves & Surplus 50,000 Stock 1,50,000
Profit & Loss Account 1,60,000 Cash at bank 1,20,000
10% Debentures 3,00,000 Debtors 3,00,000
Creditors 1,80,000
12,90,000 12,90,000
(Ans.:Current ratio = 3.17 : 1, Quick ratio = 2.33:1Gross profit ratio = 31.75%, Net profit ratio = 17.46%Operating profit ratio = 23.89%Operating ratio =76.19%Return on capital employed = 27%Return on Investment = 19.82%Return on shareholder’s equity = 27.16%Earning per share =3.67)
3) The following is the Balance Sheet of X Co. Ltd. as on March 31, 2005.Calculate the liquidity ratios.
Liabilities Rs. Assets Rs.
Share Capital 50,000 Plant and Machinery 60,000Profit and Loss A/c 10,000 Stock 20,00010% Debentures 30,000 Debtors 14,000Sundry Creditors 14,000 Bills Receivables 5,000Outstanding Expenses 6,000 Short-term Securities 8,000Provision for Taxation 3,000 Cash 6,000
1,13,000 1,13,000
(Answer: Current Ratio = 2.304, Quick Ratio = 1.43)
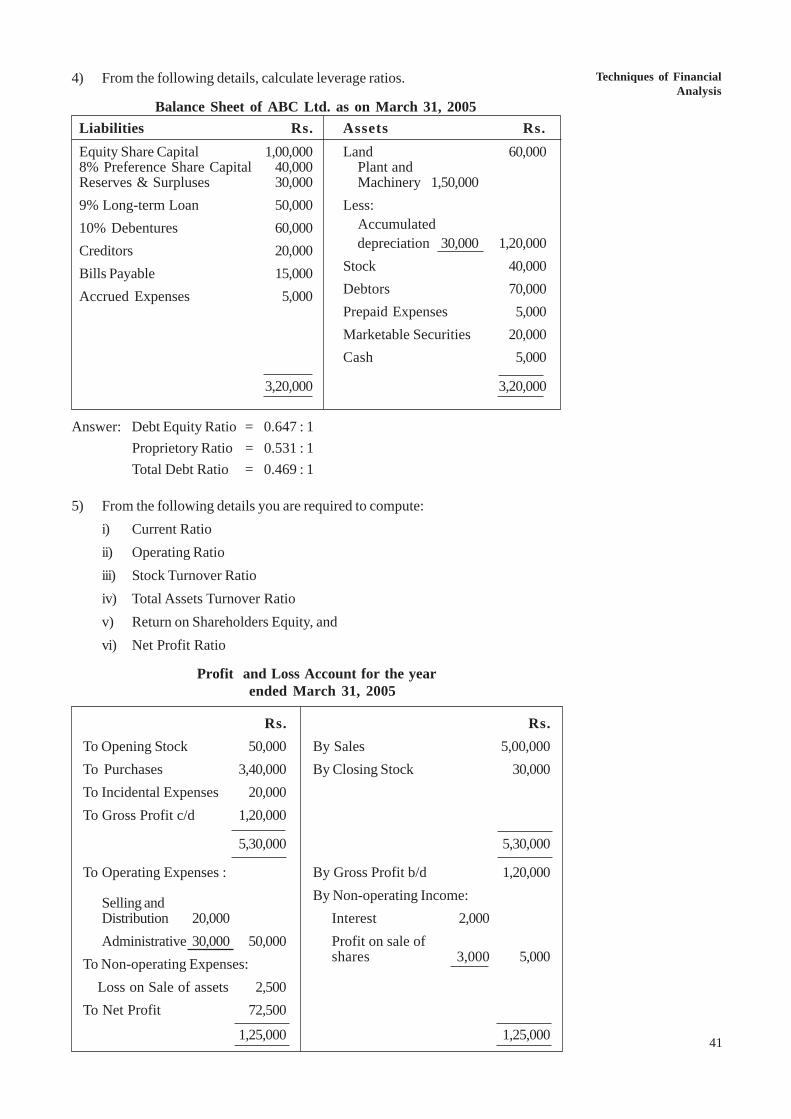
Techniques of FinancialAnalysis
41
4) From the following details, calculate leverage ratios.
Balance Sheet of ABC Ltd. as on March 31, 2005Liabilities Rs. Assets Rs.Equity Share Capital 1,00,000 Land 60,0008% Preference Share Capital 40,000 Plant andReserves & Surpluses 30,000 Machinery 1,50,0009% Long-term Loan 50,000 Less:10% Debentures 60,000 Accumulated
Creditors 20,000 depreciation 30,000 1,20,000
Bills Payable 15,000 Stock 40,000
Accrued Expenses 5,000 Debtors 70,000Prepaid Expenses 5,000Marketable Securities 20,000Cash 5,000
3,20,000 3,20,000
Answer: Debt Equity Ratio = 0.647 : 1Proprietory Ratio = 0.531 : 1Total Debt Ratio = 0.469 : 1
5) From the following details you are required to compute:i) Current Ratioii) Operating Ratioiii) Stock Turnover Ratioiv) Total Assets Turnover Ratiov) Return on Shareholders Equity, andvi) Net Profit Ratio
Profit and Loss Account for the yearended March 31, 2005
Rs. Rs.To Opening Stock 50,000 By Sales 5,00,000To Purchases 3,40,000 By Closing Stock 30,000To Incidental Expenses 20,000To Gross Profit c/d 1,20,000
5,30,000 5,30,000
To Operating Expenses : By Gross Profit b/d 1,20,000
Selling and By Non-operating Income:Distribution 20,000 Interest 2,000Administrative 30,000 50,000 Profit on sale of
To Non-operating Expenses: shares 3,000 5,000
Loss on Sale of assets 2,500To Net Profit 72,500
1,25,000 1,25,000
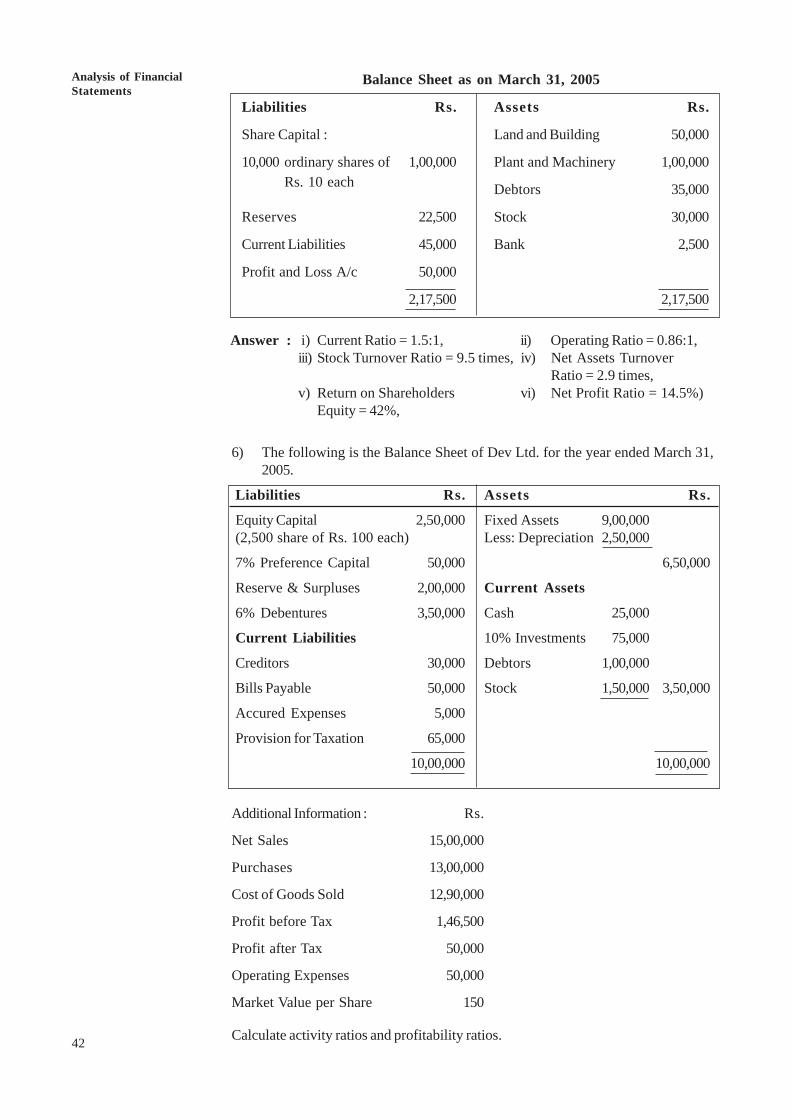
42
An OverviewAnalysis of FinancialStatements
6) The following is the Balance Sheet of Dev Ltd. for the year ended March 31,2005.
Liabilities Rs. Assets Rs.
Equity Capital 2,50,000 Fixed Assets 9,00,000(2,500 share of Rs. 100 each) Less: Depreciation 2,50,000
7% Preference Capital 50,000 6,50,000
Reserve & Surpluses 2,00,000 Current Assets
6% Debentures 3,50,000 Cash 25,000
Current Liabilities 10% Investments 75,000
Creditors 30,000 Debtors 1,00,000
Bills Payable 50,000 Stock 1,50,000 3,50,000
Accured Expenses 5,000
Provision for Taxation 65,000
10,00,000 10,00,000
Additional Information : Rs.
Net Sales 15,00,000
Purchases 13,00,000
Cost of Goods Sold 12,90,000
Profit before Tax 1,46,500
Profit after Tax 50,000
Operating Expenses 50,000
Market Value per Share 150
Calculate activity ratios and profitability ratios.
Balance Sheet as on March 31, 2005
Liabilities Rs. Assets Rs.
Share Capital : Land and Building 50,000
10,000 ordinary shares of 1,00,000 Plant and Machinery 1,00,000Rs. 10 each Debtors 35,000
Reserves 22,500 Stock 30,000
Current Liabilities 45,000 Bank 2,500
Profit and Loss A/c 50,000
2,17,500 2,17,500
Answer : i) Current Ratio = 1.5:1, ii) Operating Ratio = 0.86:1,iii) Stock Turnover Ratio = 9.5 times, iv) Net Assets Turnover
Ratio = 2.9 times,v) Return on Shareholders vi) Net Profit Ratio = 14.5%)
Equity = 42%,
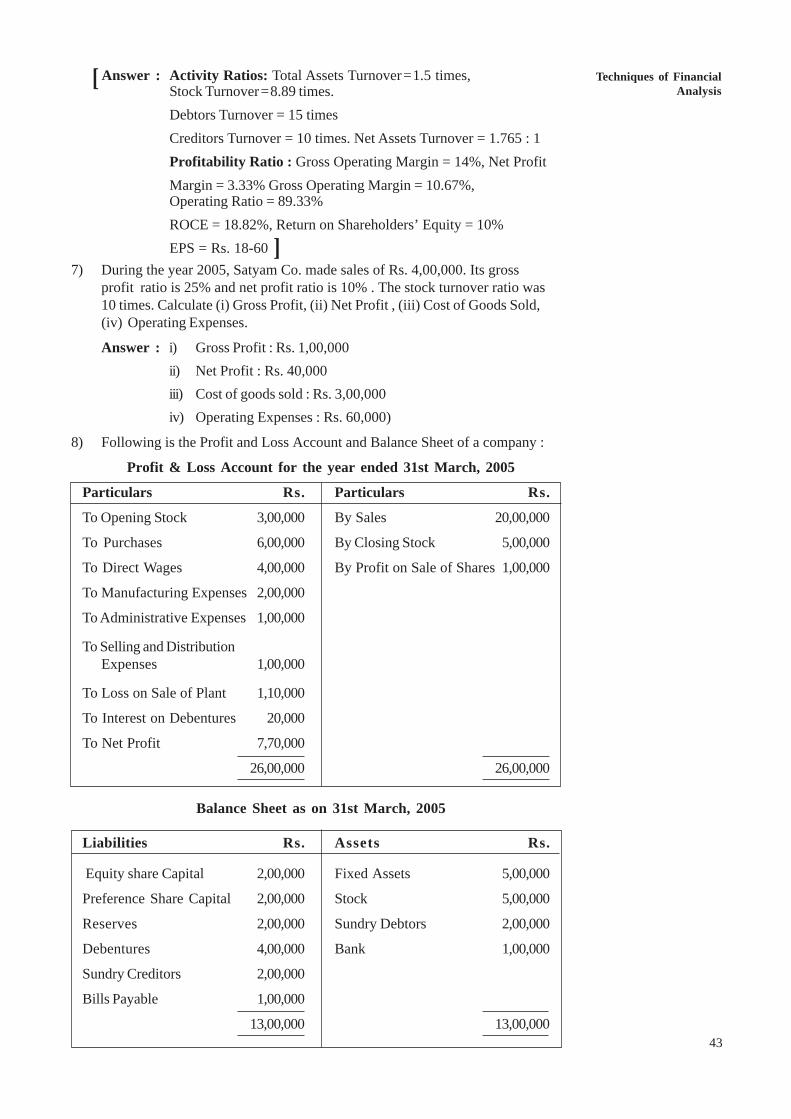
Techniques of FinancialAnalysis
43
7) During the year 2005, Satyam Co. made sales of Rs. 4,00,000. Its grossprofit ratio is 25% and net profit ratio is 10% . The stock turnover ratio was10 times. Calculate (i) Gross Profit, (ii) Net Profit , (iii) Cost of Goods Sold,(iv) Operating Expenses.
Answer : i) Gross Profit : Rs. 1,00,000ii) Net Profit : Rs. 40,000iii) Cost of goods sold : Rs. 3,00,000iv) Operating Expenses : Rs. 60,000)
8) Following is the Profit and Loss Account and Balance Sheet of a company :
Profit & Loss Account for the year ended 31st March, 2005
Particulars Rs. Particulars Rs.
To Opening Stock 3,00,000 By Sales 20,00,000
To Purchases 6,00,000 By Closing Stock 5,00,000
To Direct Wages 4,00,000 By Profit on Sale of Shares 1,00,000
To Manufacturing Expenses 2,00,000
To Administrative Expenses 1,00,000
To Selling and DistributionExpenses 1,00,000
To Loss on Sale of Plant 1,10,000
To Interest on Debentures 20,000
To Net Profit 7,70,000
26,00,000 26,00,000
Balance Sheet as on 31st March, 2005
Liabilities Rs. Assets Rs.
Equity share Capital 2,00,000 Fixed Assets 5,00,000
Preference Share Capital 2,00,000 Stock 5,00,000
Reserves 2,00,000 Sundry Debtors 2,00,000
Debentures 4,00,000 Bank 1,00,000
Sundry Creditors 2,00,000
Bills Payable 1,00,000
13,00,000 13,00,000
Answer : Activity Ratios: Total Assets Turnover=1.5 times,Stock Turnover=8.89 times.Debtors Turnover = 15 timesCreditors Turnover = 10 times. Net Assets Turnover = 1.765 : 1Profitability Ratio : Gross Operating Margin = 14%, Net ProfitMargin = 3.33% Gross Operating Margin = 10.67%,Operating Ratio = 89.33%ROCE = 18.82%, Return on Shareholders’ Equity = 10%EPS = Rs. 18-60
[
]
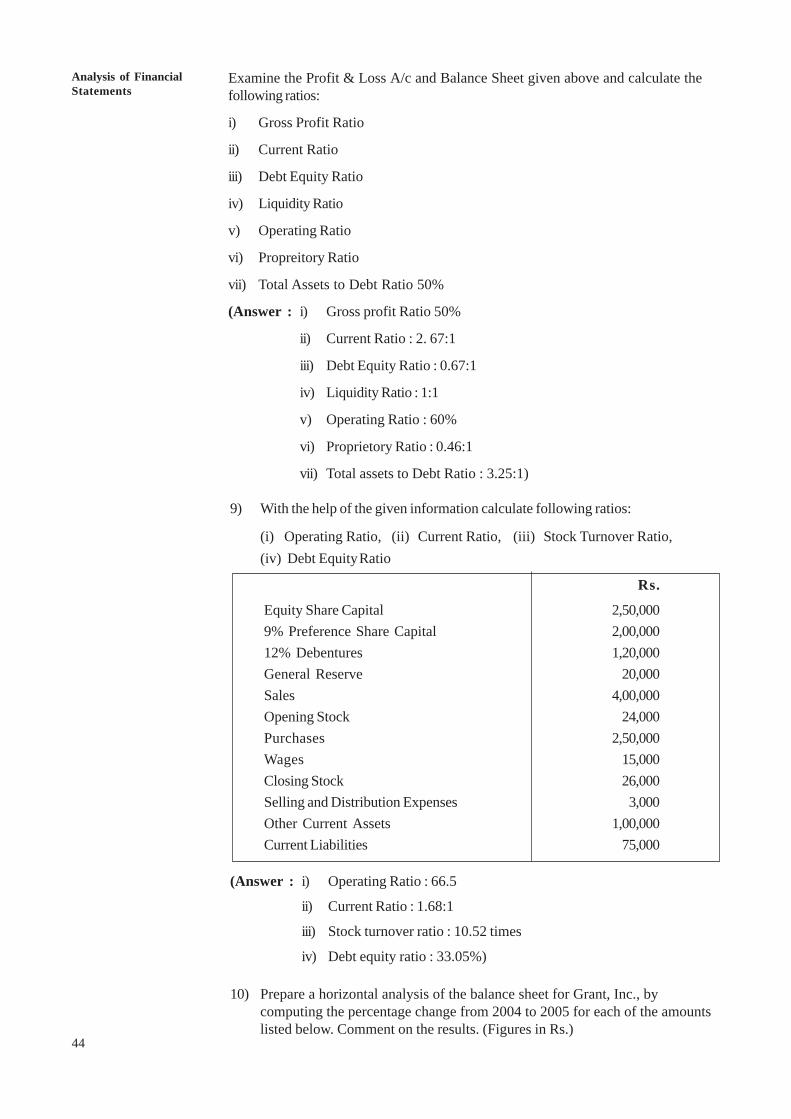
44
An OverviewAnalysis of FinancialStatements
9) With the help of the given information calculate following ratios:
(i) Operating Ratio, (ii) Current Ratio, (iii) Stock Turnover Ratio,(iv) Debt Equity Ratio
Rs.
Equity Share Capital 2,50,0009% Preference Share Capital 2,00,00012% Debentures 1,20,000General Reserve 20,000Sales 4,00,000Opening Stock 24,000Purchases 2,50,000Wages 15,000Closing Stock 26,000Selling and Distribution Expenses 3,000Other Current Assets 1,00,000Current Liabilities 75,000
(Answer : i) Operating Ratio : 66.5
ii) Current Ratio : 1.68:1
iii) Stock turnover ratio : 10.52 times
iv) Debt equity ratio : 33.05%)
Examine the Profit & Loss A/c and Balance Sheet given above and calculate thefollowing ratios:
i) Gross Profit Ratio
ii) Current Ratio
iii) Debt Equity Ratio
iv) Liquidity Ratio
v) Operating Ratio
vi) Propreitory Ratio
vii) Total Assets to Debt Ratio 50%
(Answer : i) Gross profit Ratio 50%
ii) Current Ratio : 2. 67:1
iii) Debt Equity Ratio : 0.67:1
iv) Liquidity Ratio : 1:1
v) Operating Ratio : 60%
vi) Proprietory Ratio : 0.46:1
vii) Total assets to Debt Ratio : 3.25:1)
10) Prepare a horizontal analysis of the balance sheet for Grant, Inc., bycomputing the percentage change from 2004 to 2005 for each of the amountslisted below. Comment on the results. (Figures in Rs.)
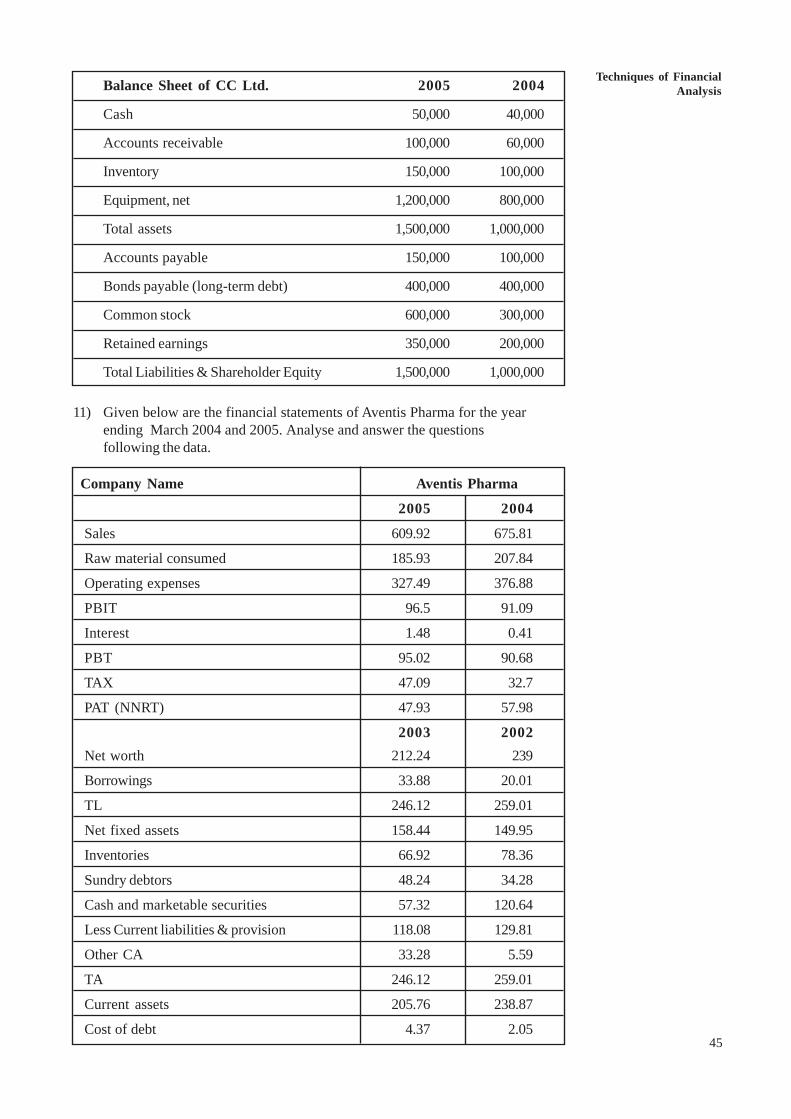
Techniques of FinancialAnalysis
45
Balance Sheet of CC Ltd. 2005 2004
Cash 50,000 40,000
Accounts receivable 100,000 60,000
Inventory 150,000 100,000
Equipment, net 1,200,000 800,000
Total assets 1,500,000 1,000,000
Accounts payable 150,000 100,000
Bonds payable (long-term debt) 400,000 400,000
Common stock 600,000 300,000
Retained earnings 350,000 200,000
Total Liabilities & Shareholder Equity 1,500,000 1,000,000
11) Given below are the financial statements of Aventis Pharma for the yearending March 2004 and 2005. Analyse and answer the questionsfollowing the data.
Company Name Aventis Pharma
2005 2004
Sales 609.92 675.81
Raw material consumed 185.93 207.84
Operating expenses 327.49 376.88
PBIT 96.5 91.09
Interest 1.48 0.41
PBT 95.02 90.68
TAX 47.09 32.7
PAT (NNRT) 47.93 57.98
2003 2002Net worth 212.24 239
Borrowings 33.88 20.01
TL 246.12 259.01
Net fixed assets 158.44 149.95
Inventories 66.92 78.36
Sundry debtors 48.24 34.28
Cash and marketable securities 57.32 120.64
Less Current liabilities & provision 118.08 129.81
Other CA 33.28 5.59
TA 246.12 259.01
Current assets 205.76 238.87
Cost of debt 4.37 2.05
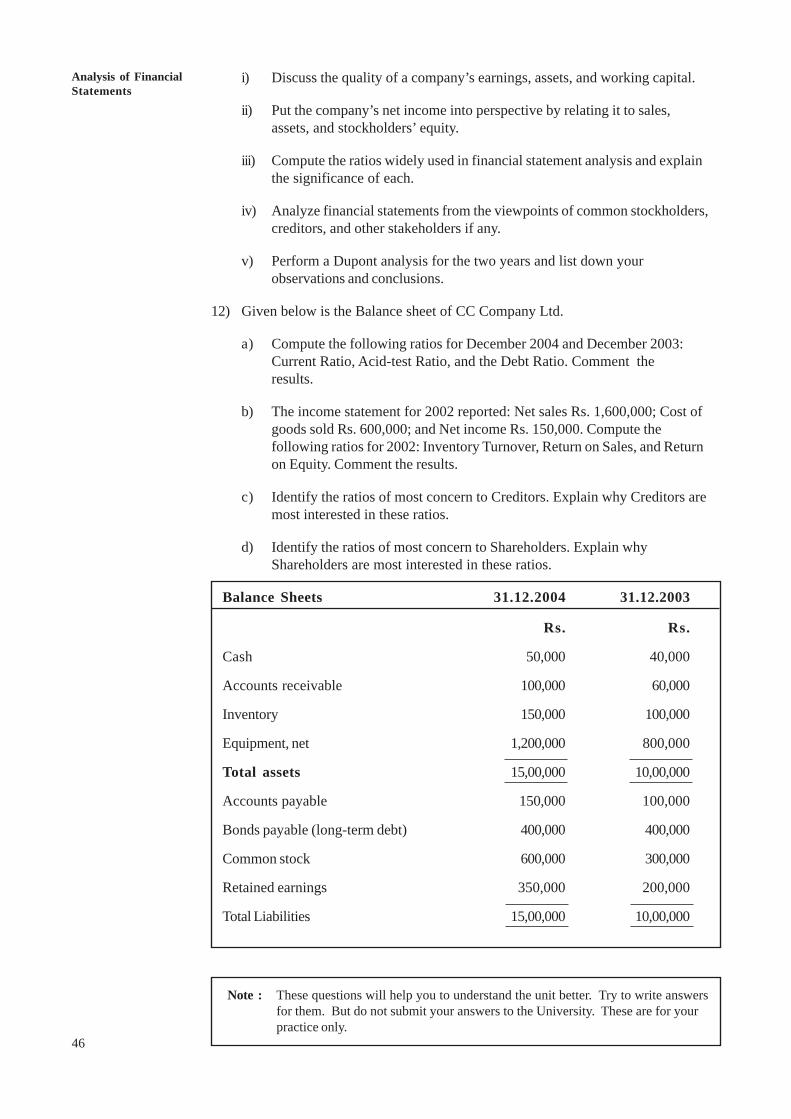
46
An OverviewAnalysis of FinancialStatements
i) Discuss the quality of a company’s earnings, assets, and working capital.
ii) Put the company’s net income into perspective by relating it to sales,assets, and stockholders’ equity.
iii) Compute the ratios widely used in financial statement analysis and explainthe significance of each.
iv) Analyze financial statements from the viewpoints of common stockholders,creditors, and other stakeholders if any.
v) Perform a Dupont analysis for the two years and list down yourobservations and conclusions.
12) Given below is the Balance sheet of CC Company Ltd.
a) Compute the following ratios for December 2004 and December 2003:Current Ratio, Acid-test Ratio, and the Debt Ratio. Comment theresults.
b) The income statement for 2002 reported: Net sales Rs. 1,600,000; Cost ofgoods sold Rs. 600,000; and Net income Rs. 150,000. Compute thefollowing ratios for 2002: Inventory Turnover, Return on Sales, and Returnon Equity. Comment the results.
c) Identify the ratios of most concern to Creditors. Explain why Creditors aremost interested in these ratios.
d) Identify the ratios of most concern to Shareholders. Explain whyShareholders are most interested in these ratios.
Balance Sheets 31.12.2004 31.12.2003
Rs. Rs.
Cash 50,000 40,000
Accounts receivable 100,000 60,000
Inventory 150,000 100,000
Equipment, net 1,200,000 800,000
Total assets 15,00,000 10,00,000
Accounts payable 150,000 100,000
Bonds payable (long-term debt) 400,000 400,000
Common stock 600,000 300,000
Retained earnings 350,000 200,000
Total Liabilities 15,00,000 10,00,000
Note : These questions will help you to understand the unit better. Try to write answersfor them. But do not submit your answers to the University. These are for yourpractice only.
Techniques of FinancialAnalysis
47
5.13 FURTHER READINGSDaniel L. Jensen, “Advanced Accounting” (McGraw-Hill College Publishing, 1997).
Eric Press, “Analyzing Financial Statements” (Lebahar-Friedman, 1999).
Foster (2002), “Financial Statement Analysis”.
Gerald I. White, “The Analysis and Use of Financial Statements” (John Wiley &Sons, 1997).
Horngren et al. (2002), Financial Accounting Pearson’s Ed.
Howard M. Schilit (1993) Financial Shenanigans: How to Detect AccountingGimmicks & Fraud in Financial Reports by McGrahill.
Leopold Bernstein and John Wild, “Analysis of Financial Statements” (McGraw-Hill,2000) .
Martin Mellman et. al, “Accounting for Effective Decision Making”(Irwin Professional Press, 1994).
Mulford and Comiskey (2002), The Financial Numbers Game: Detecting CreativeAccounting Practices, John Wiley & Sons.
Peter Atrill and Eddie McLaney, “Accounting and Finance for Non-Specialists”(Prentice Hall, 1997).
Pinson, Linda (2001), Keeping the Books: Basic Record keeping and Accountingfor the Successful Small Business (5th Ed), Dearbon Publishing.
Wild, Bernstein and Subramanyam (7th Ed.), Financial Statement Analysis, IrwinMcGrawhill.
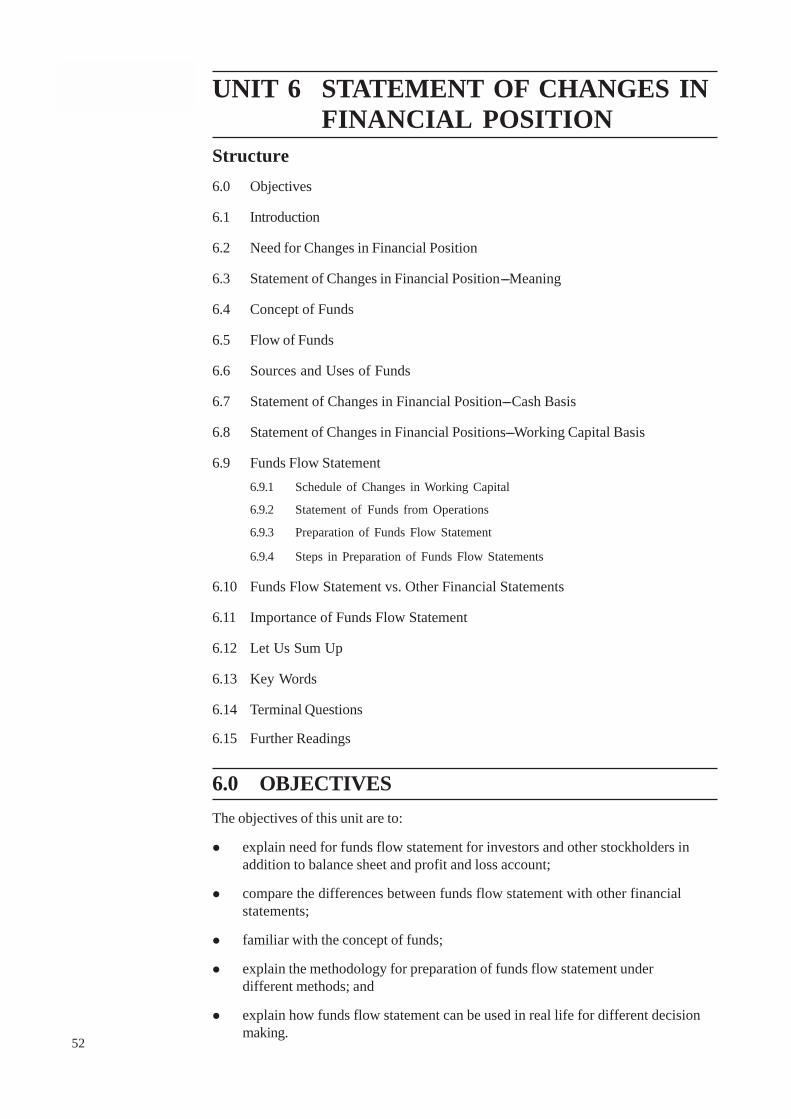
52
An OverviewAnalysis of FinancialStatements UNIT 6 STATEMENT OF CHANGES IN
FINANCIAL POSITIONStructure6.0 Objectives
6.1 Introduction
6.2 Need for Changes in Financial Position
6.3 Statement of Changes in Financial Position--- Meaning
6.4 Concept of Funds
6.5 Flow of Funds
6.6 Sources and Uses of Funds
6.7 Statement of Changes in Financial Position --- Cash Basis
6.8 Statement of Changes in Financial Positions --- Working Capital Basis
6.9 Funds Flow Statement6.9.1 Schedule of Changes in Working Capital
6.9.2 Statement of Funds from Operations
6.9.3 Preparation of Funds Flow Statement
6.9.4 Steps in Preparation of Funds Flow Statements
6.10 Funds Flow Statement vs. Other Financial Statements
6.11 Importance of Funds Flow Statement
6.12 Let Us Sum Up
6.13 Key Words
6.14 Terminal Questions
6.15 Further Readings
6.0 OBJECTIVESThe objectives of this unit are to:
! explain need for funds flow statement for investors and other stockholders inaddition to balance sheet and profit and loss account;
! compare the differences between funds flow statement with other financialstatements;
! familiar with the concept of funds;
! explain the methodology for preparation of funds flow statement underdifferent methods; and
! explain how funds flow statement can be used in real life for different decisionmaking.
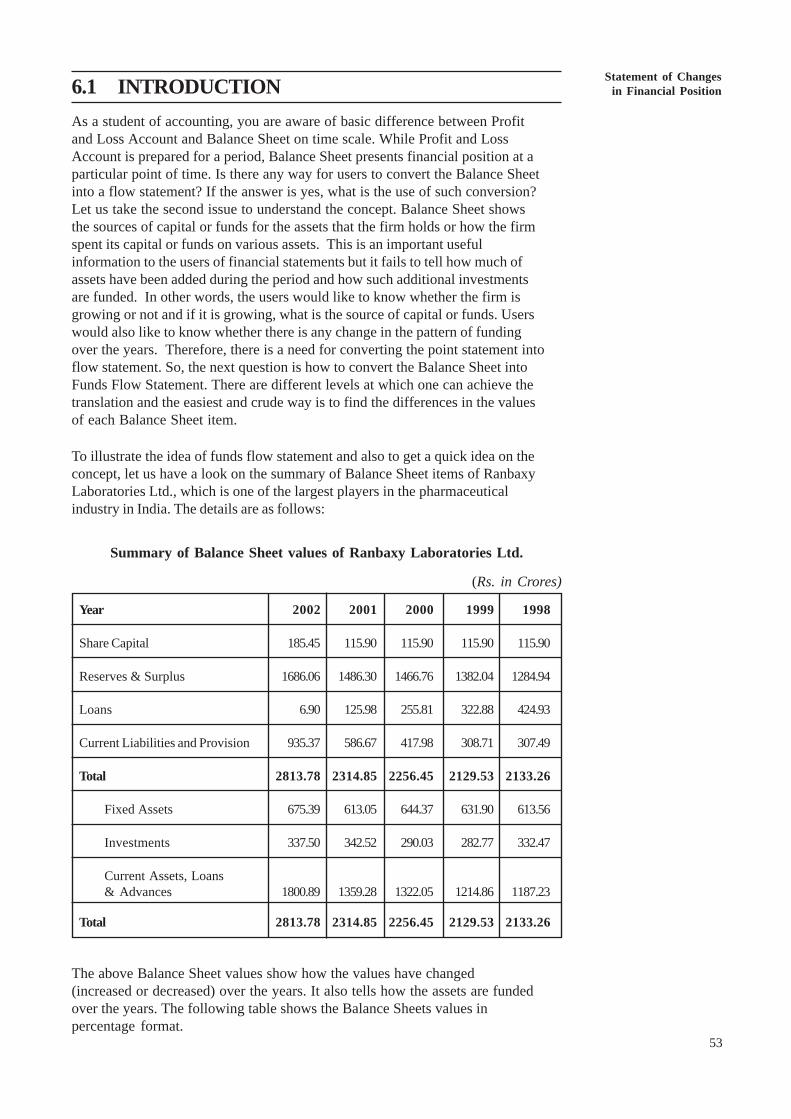
Statement of Changesin Financial Position
53
6.1 INTRODUCTIONAs a student of accounting, you are aware of basic difference between Profitand Loss Account and Balance Sheet on time scale. While Profit and LossAccount is prepared for a period, Balance Sheet presents financial position at aparticular point of time. Is there any way for users to convert the Balance Sheetinto a flow statement? If the answer is yes, what is the use of such conversion?Let us take the second issue to understand the concept. Balance Sheet showsthe sources of capital or funds for the assets that the firm holds or how the firmspent its capital or funds on various assets. This is an important usefulinformation to the users of financial statements but it fails to tell how much ofassets have been added during the period and how such additional investmentsare funded. In other words, the users would like to know whether the firm isgrowing or not and if it is growing, what is the source of capital or funds. Userswould also like to know whether there is any change in the pattern of fundingover the years. Therefore, there is a need for converting the point statement intoflow statement. So, the next question is how to convert the Balance Sheet intoFunds Flow Statement. There are different levels at which one can achieve thetranslation and the easiest and crude way is to find the differences in the valuesof each Balance Sheet item.
To illustrate the idea of funds flow statement and also to get a quick idea on theconcept, let us have a look on the summary of Balance Sheet items of RanbaxyLaboratories Ltd., which is one of the largest players in the pharmaceuticalindustry in India. The details are as follows:
Summary of Balance Sheet values of Ranbaxy Laboratories Ltd.
(Rs. in Crores)
Year 2002 2001 2000 1999 1998
Share Capital 185.45 115.90 115.90 115.90 115.90
Reserves & Surplus 1686.06 1486.30 1466.76 1382.04 1284.94
Loans 6.90 125.98 255.81 322.88 424.93
Current Liabilities and Provision 935.37 586.67 417.98 308.71 307.49
Total 2813.78 2314.85 2256.45 2129.53 2133.26
Fixed Assets 675.39 613.05 644.37 631.90 613.56
Investments 337.50 342.52 290.03 282.77 332.47
Current Assets, Loans& Advances 1800.89 1359.28 1322.05 1214.86 1187.23
Total 2813.78 2314.85 2256.45 2129.53 2133.26
The above Balance Sheet values show how the values have changed(increased or decreased) over the years. It also tells how the assets are fundedover the years. The following table shows the Balance Sheets values inpercentage format.
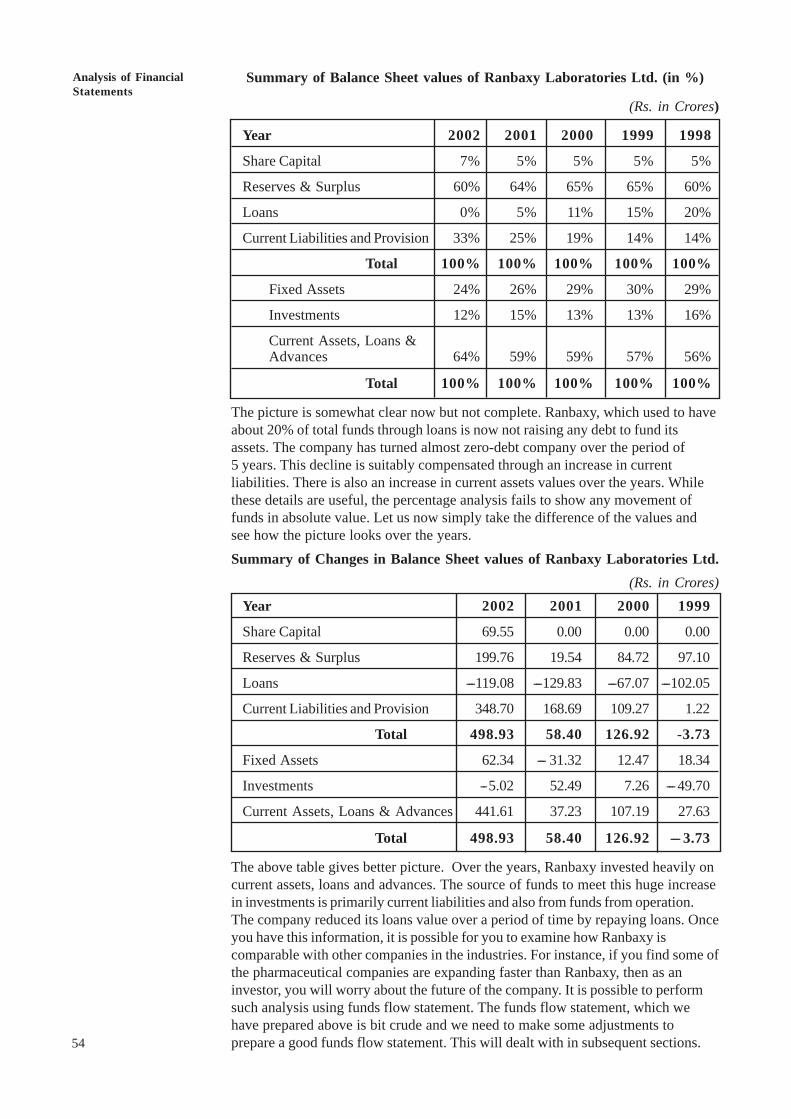
54
An OverviewAnalysis of FinancialStatements
Summary of Balance Sheet values of Ranbaxy Laboratories Ltd. (in %)
(Rs. in Crores)
Year 2002 2001 2000 1999 1998
Share Capital 7% 5% 5% 5% 5%
Reserves & Surplus 60% 64% 65% 65% 60%
Loans 0% 5% 11% 15% 20%
Current Liabilities and Provision 33% 25% 19% 14% 14%
Total 100% 100% 100% 100% 100%
Fixed Assets 24% 26% 29% 30% 29%
Investments 12% 15% 13% 13% 16%
Current Assets, Loans &Advances 64% 59% 59% 57% 56%
Total 100% 100% 100% 100% 100%
The picture is somewhat clear now but not complete. Ranbaxy, which used to haveabout 20% of total funds through loans is now not raising any debt to fund itsassets. The company has turned almost zero-debt company over the period of5 years. This decline is suitably compensated through an increase in currentliabilities. There is also an increase in current assets values over the years. Whilethese details are useful, the percentage analysis fails to show any movement offunds in absolute value. Let us now simply take the difference of the values andsee how the picture looks over the years.Summary of Changes in Balance Sheet values of Ranbaxy Laboratories Ltd.
(Rs. in Crores)Year 2002 2001 2000 1999
Share Capital 69.55 0.00 0.00 0.00
Reserves & Surplus 199.76 19.54 84.72 97.10
Loans ---119.08 ---129.83 ---67.07 ---102.05
Current Liabilities and Provision 348.70 168.69 109.27 1.22
Total 498.93 58.40 126.92 -3.73
Fixed Assets 62.34 --- 31.32 12.47 18.34
Investments --5.02 52.49 7.26 ---49.70
Current Assets, Loans & Advances 441.61 37.23 107.19 27.63
Total 498.93 58.40 126.92 --- 3.73
The above table gives better picture. Over the years, Ranbaxy invested heavily oncurrent assets, loans and advances. The source of funds to meet this huge increasein investments is primarily current liabilities and also from funds from operation.The company reduced its loans value over a period of time by repaying loans. Onceyou have this information, it is possible for you to examine how Ranbaxy iscomparable with other companies in the industries. For instance, if you find some ofthe pharmaceutical companies are expanding faster than Ranbaxy, then as aninvestor, you will worry about the future of the company. It is possible to performsuch analysis using funds flow statement. The funds flow statement, which wehave prepared above is bit crude and we need to make some adjustments toprepare a good funds flow statement. This will dealt with in subsequent sections.
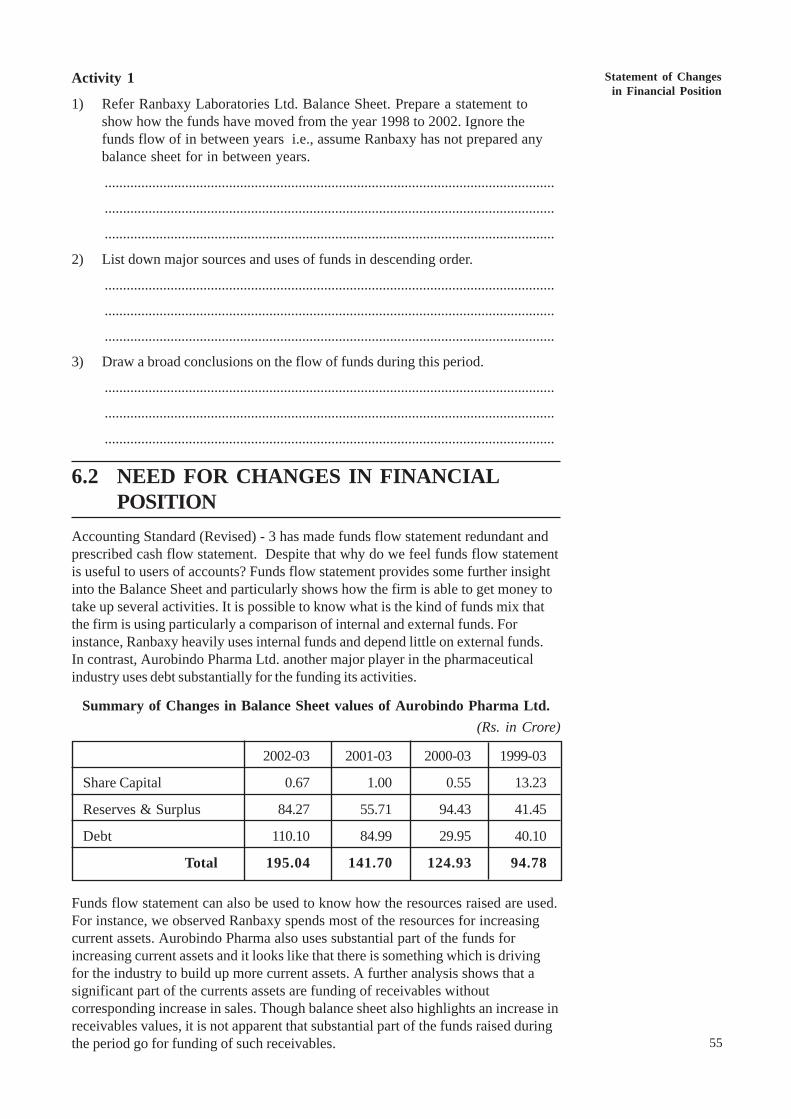
Statement of Changesin Financial Position
55
Activity 1
1) Refer Ranbaxy Laboratories Ltd. Balance Sheet. Prepare a statement toshow how the funds have moved from the year 1998 to 2002. Ignore thefunds flow of in between years i.e., assume Ranbaxy has not prepared anybalance sheet for in between years.
...........................................................................................................................
...........................................................................................................................
...........................................................................................................................
2) List down major sources and uses of funds in descending order.
...........................................................................................................................
...........................................................................................................................
...........................................................................................................................
3) Draw a broad conclusions on the flow of funds during this period.
...........................................................................................................................
...........................................................................................................................
...........................................................................................................................
6.2 NEED FOR CHANGES IN FINANCIALPOSITION
Accounting Standard (Revised) - 3 has made funds flow statement redundant andprescribed cash flow statement. Despite that why do we feel funds flow statementis useful to users of accounts? Funds flow statement provides some further insightinto the Balance Sheet and particularly shows how the firm is able to get money totake up several activities. It is possible to know what is the kind of funds mix thatthe firm is using particularly a comparison of internal and external funds. Forinstance, Ranbaxy heavily uses internal funds and depend little on external funds.In contrast, Aurobindo Pharma Ltd. another major player in the pharmaceuticalindustry uses debt substantially for the funding its activities.
Summary of Changes in Balance Sheet values of Aurobindo Pharma Ltd.(Rs. in Crore)
2002-03 2001-03 2000-03 1999-03
Share Capital 0.67 1.00 0.55 13.23
Reserves & Surplus 84.27 55.71 94.43 41.45
Debt 110.10 84.99 29.95 40.10
Total 195.04 141.70 124.93 94.78
Funds flow statement can also be used to know how the resources raised are used.For instance, we observed Ranbaxy spends most of the resources for increasingcurrent assets. Aurobindo Pharma also uses substantial part of the funds forincreasing current assets and it looks like that there is something which is drivingfor the industry to build up more current assets. A further analysis shows that asignificant part of the currents assets are funding of receivables withoutcorresponding increase in sales. Though balance sheet also highlights an increase inreceivables values, it is not apparent that substantial part of the funds raised duringthe period go for funding of such receivables.
56
An OverviewAnalysis of FinancialStatements
It is possible to examine how healthy the financial policies of firms. For instance,many firms would like to avoid using short-term capital for long-term purposes. It ispossible to identify whether firms in which you are interested use funds in a sub-optimal way.Activity 21) Pick up annual report of two or three companies belonging to software or any
other industry. Compare the changes in balance sheet values for two yearsand write down the values here...........................................................................................................................
..........................................................................................................................
..........................................................................................................................
2) Write a brief on the sources of funds and where they are used. Also, comparethese figures between the companies and write down your views...........................................................................................................................
..........................................................................................................................
..........................................................................................................................
3) Do you find all the companies are behaving in a same way? Mostly it will notbe and if so, why do you feel companies follow different strategies in raisingfunds and using the same in different assets?
..........................................................................................................................
..........................................................................................................................
..........................................................................................................................
6.3 STATEMENT OF CHANGES IN FINANCIALPOSITION ---- MEANING
Statement of changes in financial position is a statement which outlines the causesof a change in the financial position of a company during an accounting period.These causes are reflected in the movement of funds viz., inflows and outflows offunds during the period. Therefore, it is called Funds Flow Statement in which theinflows are shown as sources of funds and the out flows are shown as applicationor uses of funds. The difference between the two (inflows and outflows) indicatesthe net changes (increase or decrease) in the position of funds during theaccounting period.
6.4 CONCEPT OF FUNDSThe Balance Sheet gives a ‘snapshot’ view at a point in time for the sources fromwhich a firm has acquired its funds and the uses, which the firm has made of thesefunds. The flow statement explains the changes that took place in the BalanceSheet account. Firms get funds from various sources. Broadly, we classify thesources of funds into two categories namely, long-term funds and short-term funds,Sources of long-term funds include equity share capital, funds provided byoperation, term loan, etc. Source of short-term funds consists of supplier credit andany short-term borrowing. The term fund is broader compared to the term cash.For instance, when a firm sells goods on credit, there is no cash flow and cash flowstatement ignores such transactions. On the other hand, funds flow statement treatsthis source of funds from operating activities and treat the increased accountsreceivables as application of funds for working capital purpose. On the other hand,if the firm collects receivables of last year, it appears in cash flow statement,whereas it has no impact in funds flow statement because there is no change in
Statement of Changesin Financial Position
57
working capital. That is, while receivables decline its value, cash increases to thatextent and flow of funds is restricted within the working capital group. The conceptof funds simply denotes whether there is any change in Balance Sheet item ataggregate level and such changes lead to an increase in fund or decrease in fund.The following are certain activities, which will not affect fund flow statement andany effect that arises out of these activities will be restricted to working capitalstatement.
a) Collection of bills receivable.
b) Payment of bills payable.
c) Purchase of Materials for cash or on credit basis.
d) Sale of goods on cash or credit basis (except for the profit or loss component).
The above items normally affect cash flow statement [cash part of item (c) and (d)].There are several items, which affects funds flow and not cash flow statement.A few of them are:
a) Sale or purchase of goods on credit basis --- it affects funds from operation andto a minor extent working capital statement.
b) Purchase of fixed assets on credit basis.
c) Expenses incurred but not paid.
d) Income accured but not received.
e) Changes in value of closing stock.
There are several items, which affect both funds flow and cash flow statement.A few of them are:
a) Fresh Equity
b) Fresh loan or repayment of loan
c) Purchase of fixed assets by paying cash
d) Cash sales and purchases
e) Cash Expenses
From the above discussion, it is clear that ‘funds’ in funds flow statement meanschanges in equity, liability or working capital. It includes both cash and non-cashitems. In this unit, for the purpose of funds flow statement, we use the net workingcapital concept which refers to excess of current assets over current liabilities.
Activity 41) A machine costing Rs. 70,000 (book value Rs. 40,000) was sold for
Rs. 25,000. What is the impact of this transaction on funds flow statement?
...........................................................................................................................
...........................................................................................................................
...........................................................................................................................
2) The book value of Inventory was Rs. 8 lakhs and market value is Rs. 6.50lakhs. What is the effect of change in market value on funds flow statement?
...........................................................................................................................
...........................................................................................................................
...........................................................................................................................
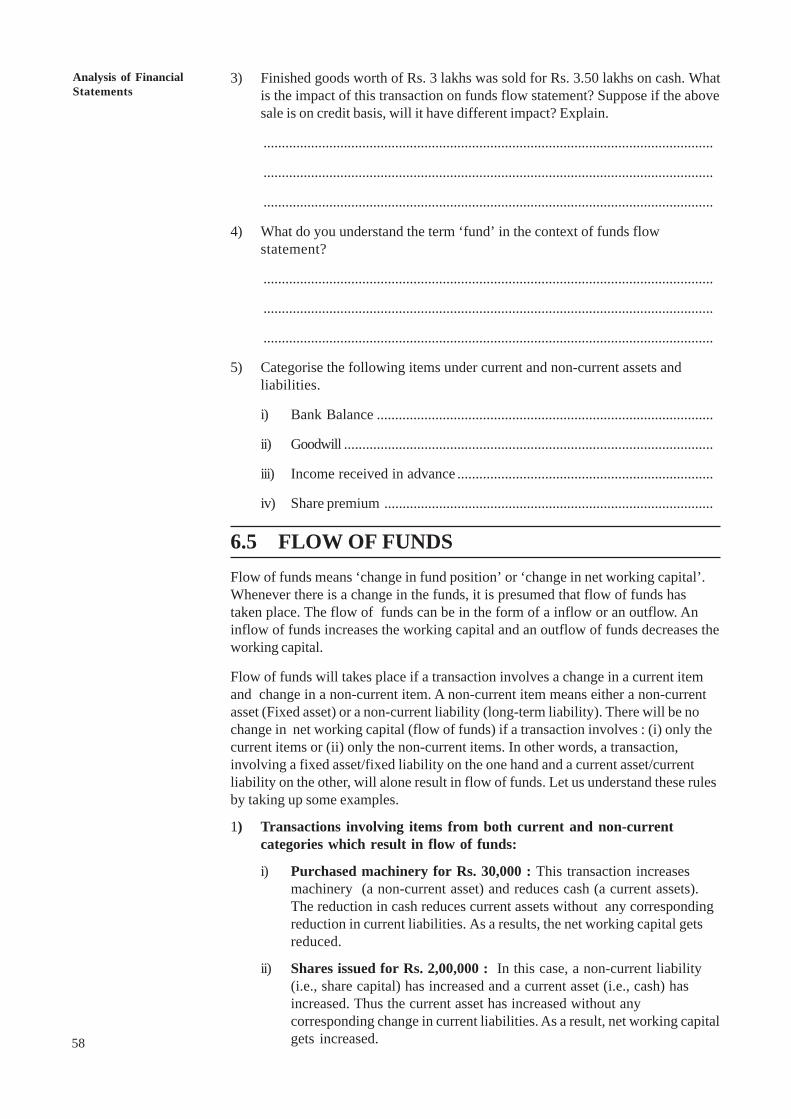
58
An OverviewAnalysis of FinancialStatements
3) Finished goods worth of Rs. 3 lakhs was sold for Rs. 3.50 lakhs on cash. Whatis the impact of this transaction on funds flow statement? Suppose if the abovesale is on credit basis, will it have different impact? Explain.
...........................................................................................................................
...........................................................................................................................
...........................................................................................................................
4) What do you understand the term ‘fund’ in the context of funds flowstatement?
...........................................................................................................................
...........................................................................................................................
...........................................................................................................................
5) Categorise the following items under current and non-current assets andliabilities.
i) Bank Balance ............................................................................................
ii) Goodwill .....................................................................................................
iii) Income received in advance ......................................................................
iv) Share premium ..........................................................................................
6.5 FLOW OF FUNDSFlow of funds means ‘change in fund position’ or ‘change in net working capital’.Whenever there is a change in the funds, it is presumed that flow of funds hastaken place. The flow of funds can be in the form of a inflow or an outflow. Aninflow of funds increases the working capital and an outflow of funds decreases theworking capital.
Flow of funds will takes place if a transaction involves a change in a current itemand change in a non-current item. A non-current item means either a non-currentasset (Fixed asset) or a non-current liability (long-term liability). There will be nochange in net working capital (flow of funds) if a transaction involves : (i) only thecurrent items or (ii) only the non-current items. In other words, a transaction,involving a fixed asset/fixed liability on the one hand and a current asset/currentliability on the other, will alone result in flow of funds. Let us understand these rulesby taking up some examples.
1) Transactions involving items from both current and non-currentcategories which result in flow of funds:
i) Purchased machinery for Rs. 30,000 : This transaction increasesmachinery (a non-current asset) and reduces cash (a current assets).The reduction in cash reduces current assets without any correspondingreduction in current liabilities. As a results, the net working capital getsreduced.
ii) Shares issued for Rs. 2,00,000 : In this case, a non-current liability(i.e., share capital) has increased and a current asset (i.e., cash) hasincreased. Thus the current asset has increased without anycorresponding change in current liabilities. As a result, net working capitalgets increased.
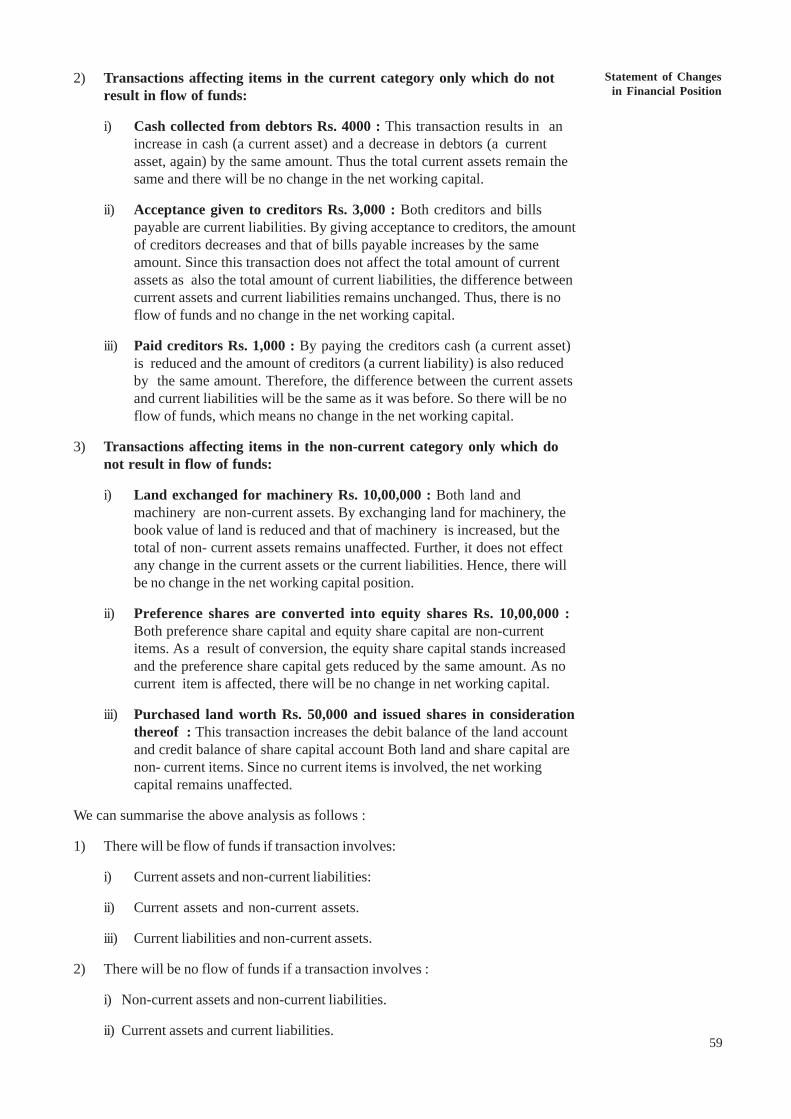
Statement of Changesin Financial Position
59
2) Transactions affecting items in the current category only which do notresult in flow of funds:
i) Cash collected from debtors Rs. 4000 : This transaction results in anincrease in cash (a current asset) and a decrease in debtors (a currentasset, again) by the same amount. Thus the total current assets remain thesame and there will be no change in the net working capital.
ii) Acceptance given to creditors Rs. 3,000 : Both creditors and billspayable are current liabilities. By giving acceptance to creditors, the amountof creditors decreases and that of bills payable increases by the sameamount. Since this transaction does not affect the total amount of currentassets as also the total amount of current liabilities, the difference betweencurrent assets and current liabilities remains unchanged. Thus, there is noflow of funds and no change in the net working capital.
iii) Paid creditors Rs. 1,000 : By paying the creditors cash (a current asset)is reduced and the amount of creditors (a current liability) is also reducedby the same amount. Therefore, the difference between the current assetsand current liabilities will be the same as it was before. So there will be noflow of funds, which means no change in the net working capital.
3) Transactions affecting items in the non-current category only which donot result in flow of funds:
i) Land exchanged for machinery Rs. 10,00,000 : Both land andmachinery are non-current assets. By exchanging land for machinery, thebook value of land is reduced and that of machinery is increased, but thetotal of non- current assets remains unaffected. Further, it does not effectany change in the current assets or the current liabilities. Hence, there willbe no change in the net working capital position.
ii) Preference shares are converted into equity shares Rs. 10,00,000 :Both preference share capital and equity share capital are non-currentitems. As a result of conversion, the equity share capital stands increasedand the preference share capital gets reduced by the same amount. As nocurrent item is affected, there will be no change in net working capital.
iii) Purchased land worth Rs. 50,000 and issued shares in considerationthereof : This transaction increases the debit balance of the land accountand credit balance of share capital account Both land and share capital arenon- current items. Since no current items is involved, the net workingcapital remains unaffected.
We can summarise the above analysis as follows :
1) There will be flow of funds if transaction involves:
i) Current assets and non-current liabilities:
ii) Current assets and non-current assets.
iii) Current liabilities and non-current assets.
2) There will be no flow of funds if a transaction involves :
i) Non-current assets and non-current liabilities.
ii) Current assets and current liabilities.
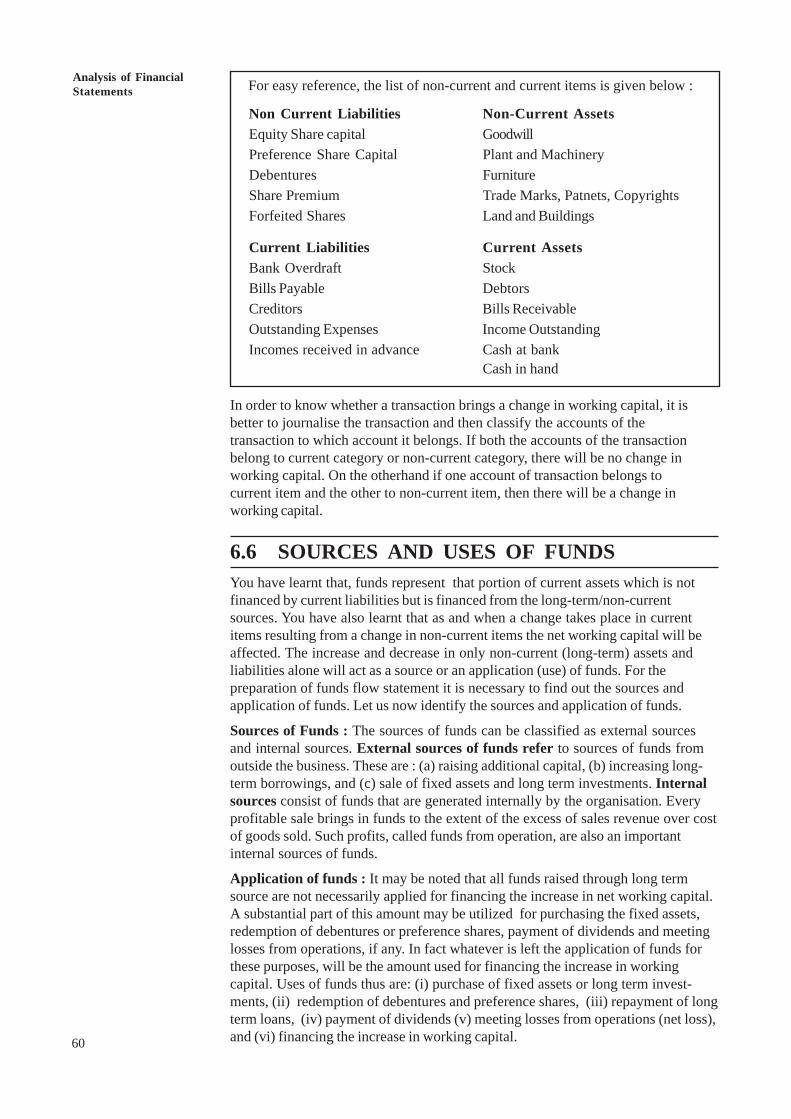
60
An OverviewAnalysis of FinancialStatements For easy reference, the list of non-current and current items is given below :
Non Current Liabilities Non-Current AssetsEquity Share capital GoodwillPreference Share Capital Plant and MachineryDebentures FurnitureShare Premium Trade Marks, Patnets, CopyrightsForfeited Shares Land and Buildings
Current Liabilities Current AssetsBank Overdraft StockBills Payable DebtorsCreditors Bills ReceivableOutstanding Expenses Income OutstandingIncomes received in advance Cash at bank
Cash in hand
In order to know whether a transaction brings a change in working capital, it isbetter to journalise the transaction and then classify the accounts of thetransaction to which account it belongs. If both the accounts of the transactionbelong to current category or non-current category, there will be no change inworking capital. On the otherhand if one account of transaction belongs tocurrent item and the other to non-current item, then there will be a change inworking capital.
6.6 SOURCES AND USES OF FUNDSYou have learnt that, funds represent that portion of current assets which is notfinanced by current liabilities but is financed from the long-term/non-currentsources. You have also learnt that as and when a change takes place in currentitems resulting from a change in non-current items the net working capital will beaffected. The increase and decrease in only non-current (long-term) assets andliabilities alone will act as a source or an application (use) of funds. For thepreparation of funds flow statement it is necessary to find out the sources andapplication of funds. Let us now identify the sources and application of funds.
Sources of Funds : The sources of funds can be classified as external sourcesand internal sources. External sources of funds refer to sources of funds fromoutside the business. These are : (a) raising additional capital, (b) increasing long-term borrowings, and (c) sale of fixed assets and long term investments. Internalsources consist of funds that are generated internally by the organisation. Everyprofitable sale brings in funds to the extent of the excess of sales revenue over costof goods sold. Such profits, called funds from operation, are also an importantinternal sources of funds.
Application of funds : It may be noted that all funds raised through long termsource are not necessarily applied for financing the increase in net working capital.A substantial part of this amount may be utilized for purchasing the fixed assets,redemption of debentures or preference shares, payment of dividends and meetinglosses from operations, if any. In fact whatever is left the application of funds forthese purposes, will be the amount used for financing the increase in workingcapital. Uses of funds thus are: (i) purchase of fixed assets or long term invest-ments, (ii) redemption of debentures and preference shares, (iii) repayment of longterm loans, (iv) payment of dividends (v) meeting losses from operations (net loss),and (vi) financing the increase in working capital.
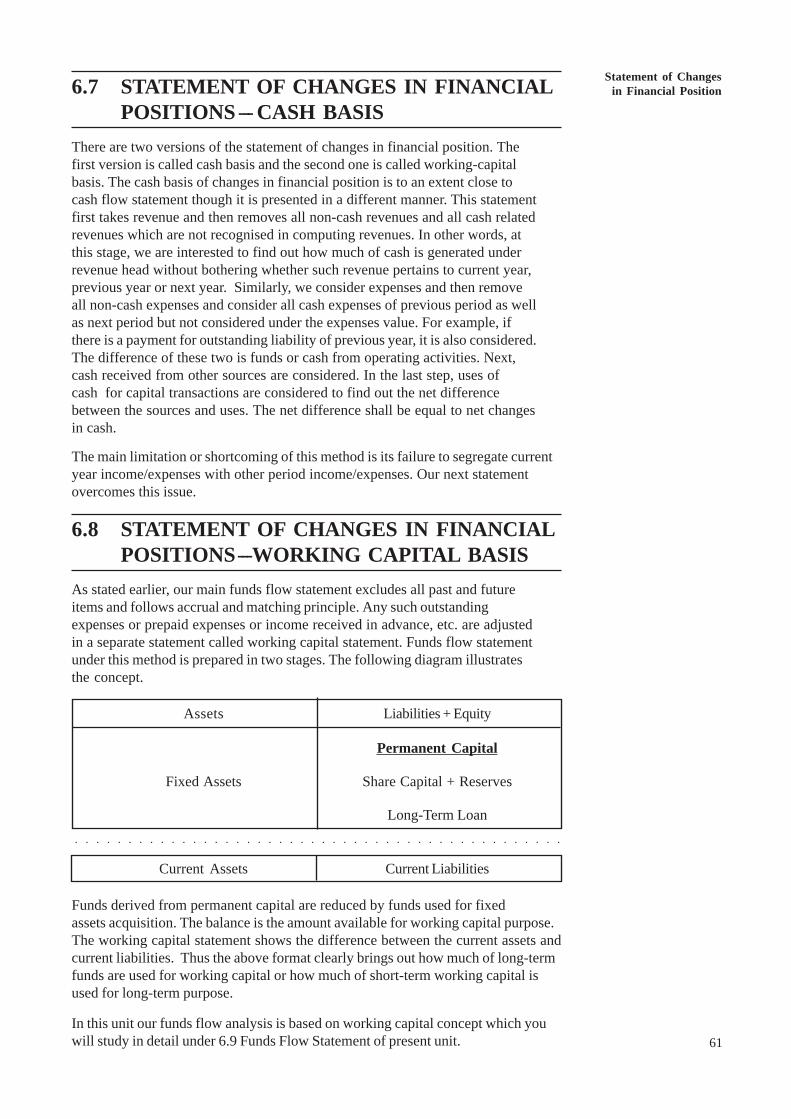
Statement of Changesin Financial Position
61
6.7 STATEMENT OF CHANGES IN FINANCIALPOSITIONS --- CASH BASIS
There are two versions of the statement of changes in financial position. Thefirst version is called cash basis and the second one is called working-capitalbasis. The cash basis of changes in financial position is to an extent close tocash flow statement though it is presented in a different manner. This statementfirst takes revenue and then removes all non-cash revenues and all cash relatedrevenues which are not recognised in computing revenues. In other words, atthis stage, we are interested to find out how much of cash is generated underrevenue head without bothering whether such revenue pertains to current year,previous year or next year. Similarly, we consider expenses and then removeall non-cash expenses and consider all cash expenses of previous period as wellas next period but not considered under the expenses value. For example, ifthere is a payment for outstanding liability of previous year, it is also considered.The difference of these two is funds or cash from operating activities. Next,cash received from other sources are considered. In the last step, uses ofcash for capital transactions are considered to find out the net differencebetween the sources and uses. The net difference shall be equal to net changesin cash.
The main limitation or shortcoming of this method is its failure to segregate currentyear income/expenses with other period income/expenses. Our next statementovercomes this issue.
6.8 STATEMENT OF CHANGES IN FINANCIALPOSITIONS--- WORKING CAPITAL BASIS
As stated earlier, our main funds flow statement excludes all past and futureitems and follows accrual and matching principle. Any such outstandingexpenses or prepaid expenses or income received in advance, etc. are adjustedin a separate statement called working capital statement. Funds flow statementunder this method is prepared in two stages. The following diagram illustratesthe concept.
Assets Liabilities + Equity
Permanent Capital
Fixed Assets Share Capital + Reserves
Long-Term Loan
Current Assets Current Liabilities
Funds derived from permanent capital are reduced by funds used for fixedassets acquisition. The balance is the amount available for working capital purpose.The working capital statement shows the difference between the current assets andcurrent liabilities. Thus the above format clearly brings out how much of long-termfunds are used for working capital or how much of short-term working capital isused for long-term purpose.
In this unit our funds flow analysis is based on working capital concept which youwill study in detail under 6.9 Funds Flow Statement of present unit.
○ ○ ○ ○ ○ ○ ○ ○ ○ ○ ○ ○ ○ ○ ○ ○ ○ ○ ○ ○ ○ ○ ○ ○ ○ ○ ○ ○ ○ ○ ○ ○ ○ ○ ○ ○ ○ ○ ○ ○ ○ ○ ○ ○ ○ ○
62
An OverviewAnalysis of FinancialStatements
Activity 5
1) Refer the two sets of Changes in Financial Positions statements. Briefly writeimportant differences between the two statements.
...........................................................................................................................
...........................................................................................................................
...........................................................................................................................
...........................................................................................................................
2. Briefly write your understanding under each of the two formats which one youfeel is useful in your analysis.
...........................................................................................................................
...........................................................................................................................
...........................................................................................................................
...........................................................................................................................
3. List down atleast three financial transactions that leads to differences in fundsflow from operations.
.................................................................................................................
.................................................................................................................
.................................................................................................................
.................................................................................................................
6.9 FUNDS FLOW STATEMENTFund flow statement is intended to explain the magnitude, direction and the causesof changes in the position of funds (net working capital) that took place during thetwo balance sheets dates. Thus, it highlights the basic changes in the financialstructure, asset structure and the liquidity position of a business between twobalance sheet dates. But primarily, it reveals changes in the financial position of thecompany by identifying the sources and application of funds resulting from financingand investing decisions that took place during a particular period.
The preparation of fund flow statement involves essentially the following three steps:
1) Schedule of Changes in Working Capital.
2) Statement of Funds from Operations.
3) Preparation of the Funds Flow Statement (on working capital basis).
6.9.1 Schedule of Changes in Working Capital
As explained earlier, the first step in the preparation of fund flow statement is toprepare the schedule of changes in working capital. For this purpose, all non-currentitems are to be ignored as the net working capital is simply the difference betweencurrent assets and current liabilities.
In order to ascertain the amount of increase or decrease in the net working capital,it could be noted that :
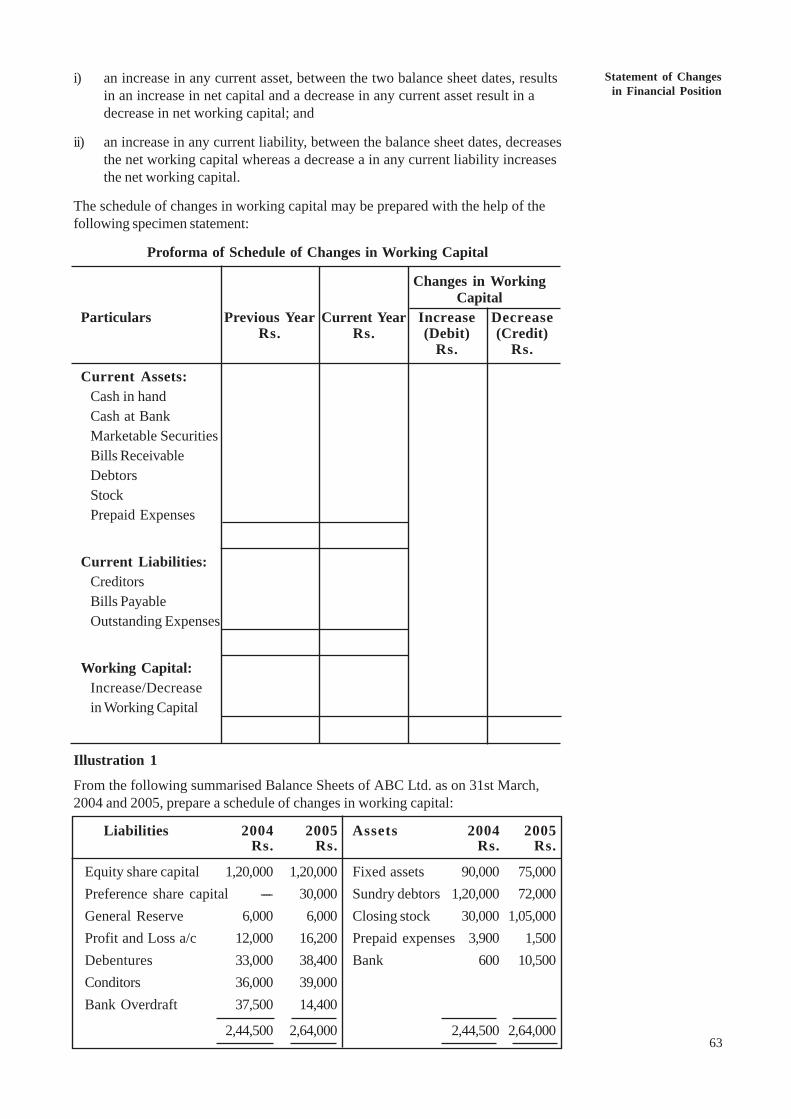
Statement of Changesin Financial Position
63
i) an increase in any current asset, between the two balance sheet dates, resultsin an increase in net capital and a decrease in any current asset result in adecrease in net working capital; and
ii) an increase in any current liability, between the balance sheet dates, decreasesthe net working capital whereas a decrease a in any current liability increasesthe net working capital.
The schedule of changes in working capital may be prepared with the help of thefollowing specimen statement:
Proforma of Schedule of Changes in Working Capital
Changes in WorkingCapital
Particulars Previous Year Current Year Increase DecreaseRs. Rs. (Debit) (Credit)
Rs. Rs.
Current Assets:Cash in handCash at BankMarketable SecuritiesBills ReceivableDebtorsStockPrepaid Expenses
Current Liabilities:CreditorsBills PayableOutstanding Expenses
Working Capital:Increase/Decreasein Working Capital
Illustration 1
From the following summarised Balance Sheets of ABC Ltd. as on 31st March,2004 and 2005, prepare a schedule of changes in working capital:
Liabilities 2004 2005 Assets 2004 2005Rs. Rs. Rs. Rs.
Equity share capital 1,20,000 1,20,000 Fixed assets 90,000 75,000Preference share capital ---- 30,000 Sundry debtors 1,20,000 72,000General Reserve 6,000 6,000 Closing stock 30,000 1,05,000Profit and Loss a/c 12,000 16,200 Prepaid expenses 3,900 1,500Debentures 33,000 38,400 Bank 600 10,500Conditors 36,000 39,000Bank Overdraft 37,500 14,400
2,44,500 2,64,000 2,44,500 2,64,000
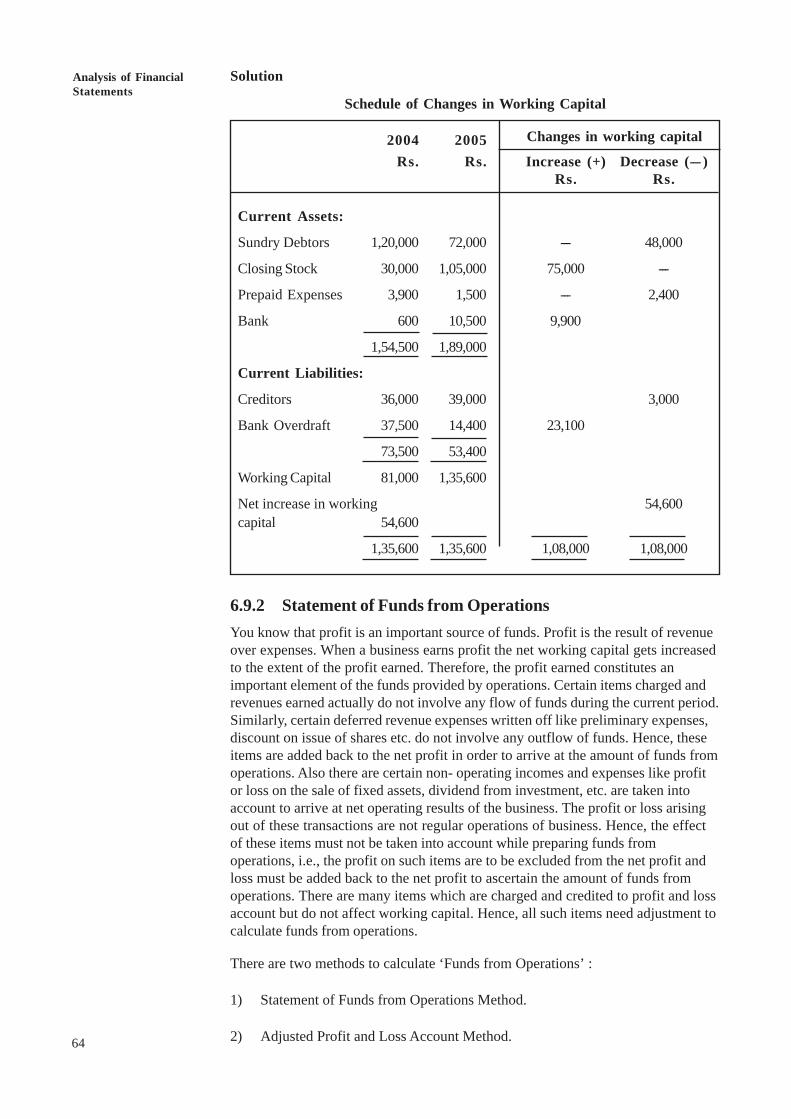
64
An OverviewAnalysis of FinancialStatements
Solution
Schedule of Changes in Working Capital
2004 2005 Changes in working capital
Rs. Rs. Increase (+) Decrease (--- )Rs. Rs.
Current Assets:
Sundry Debtors 1,20,000 72,000 --- 48,000
Closing Stock 30,000 1,05,000 75,000 ---
Prepaid Expenses 3,900 1,500 --- 2,400
Bank 600 10,500 9,900
1,54,500 1,89,000
Current Liabilities:
Creditors 36,000 39,000 3,000
Bank Overdraft 37,500 14,400 23,100
73,500 53,400
Working Capital 81,000 1,35,600
Net increase in working 54,600capital 54,600
1,35,600 1,35,600 1,08,000 1,08,000
6.9.2 Statement of Funds from OperationsYou know that profit is an important source of funds. Profit is the result of revenueover expenses. When a business earns profit the net working capital gets increasedto the extent of the profit earned. Therefore, the profit earned constitutes animportant element of the funds provided by operations. Certain items charged andrevenues earned actually do not involve any flow of funds during the current period.Similarly, certain deferred revenue expenses written off like preliminary expenses,discount on issue of shares etc. do not involve any outflow of funds. Hence, theseitems are added back to the net profit in order to arrive at the amount of funds fromoperations. Also there are certain non- operating incomes and expenses like profitor loss on the sale of fixed assets, dividend from investment, etc. are taken intoaccount to arrive at net operating results of the business. The profit or loss arisingout of these transactions are not regular operations of business. Hence, the effectof these items must not be taken into account while preparing funds fromoperations, i.e., the profit on such items are to be excluded from the net profit andloss must be added back to the net profit to ascertain the amount of funds fromoperations. There are many items which are charged and credited to profit and lossaccount but do not affect working capital. Hence, all such items need adjustment tocalculate funds from operations.
There are two methods to calculate ‘Funds from Operations’ :
1) Statement of Funds from Operations Method.
2) Adjusted Profit and Loss Account Method.
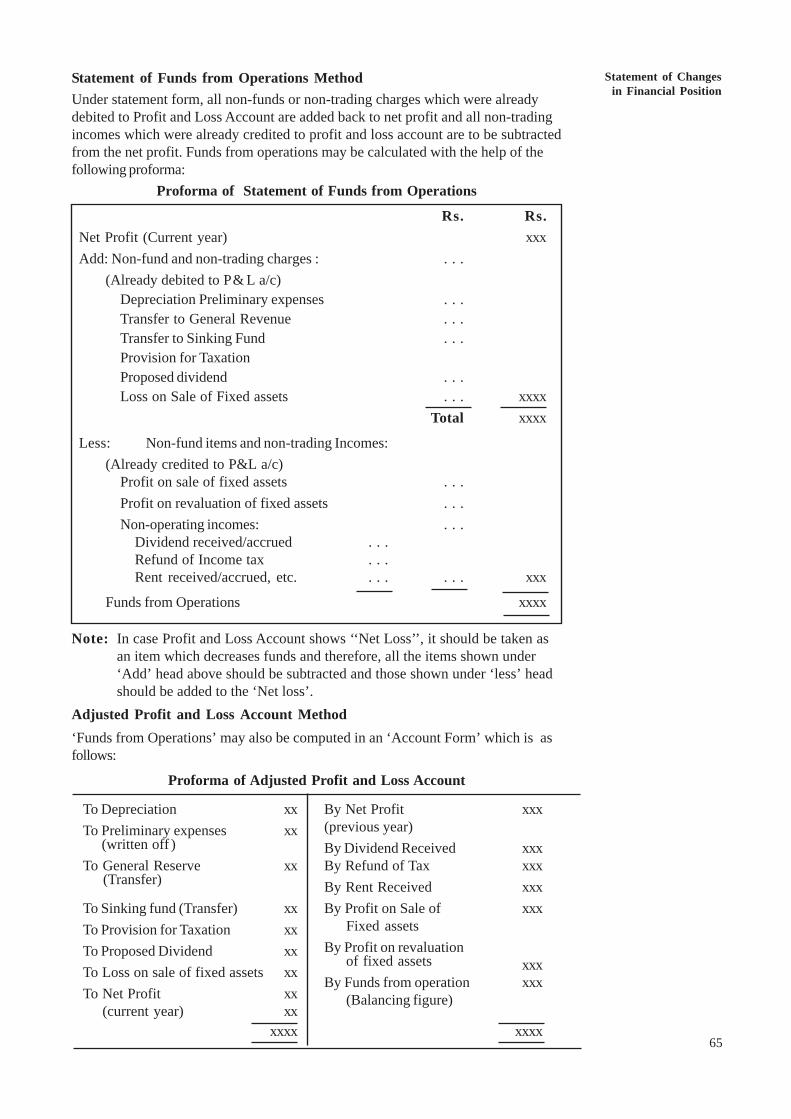
Statement of Changesin Financial Position
65
Statement of Funds from Operations MethodUnder statement form, all non-funds or non-trading charges which were alreadydebited to Profit and Loss Account are added back to net profit and all non-tradingincomes which were already credited to profit and loss account are to be subtractedfrom the net profit. Funds from operations may be calculated with the help of thefollowing proforma:
Proforma of Statement of Funds from Operations
Rs. Rs.Net Profit (Current year) xxxAdd: Non-fund and non-trading charges : . . .
(Already debited to P& L a/c)Depreciation Preliminary expenses . . .Transfer to General Revenue . . .Transfer to Sinking Fund . . .Provision for TaxationProposed dividend . . .Loss on Sale of Fixed assets . . . xxxx
Total xxxx
Less: Non-fund items and non-trading Incomes:(Already credited to P&L a/c)
Profit on sale of fixed assets . . .Profit on revaluation of fixed assets . . .Non-operating incomes: . . .
Dividend received/accrued . . .Refund of Income tax . . .Rent received/accrued, etc. . . . . . . xxx
Funds from Operations xxxx
Note: In case Profit and Loss Account shows ‘‘Net Loss’’, it should be taken asan item which decreases funds and therefore, all the items shown under‘Add’ head above should be subtracted and those shown under ‘less’ headshould be added to the ‘Net loss’.
Adjusted Profit and Loss Account Method‘Funds from Operations’ may also be computed in an ‘Account Form’ which is asfollows:
Proforma of Adjusted Profit and Loss Account
To Depreciation xx By Net Profit xxxTo Preliminary expenses xx (previous year)
(written off ) By Dividend Received xxxTo General Reserve xx By Refund of Tax xxx
(Transfer) By Rent Received xxxTo Sinking fund (Transfer) xx By Profit on Sale of xxxTo Provision for Taxation xx Fixed assets
To Proposed Dividend xx By Profit on revaluation
To Loss on sale of fixed assets xxof fixed assets xxx
To Net Profit xxBy Funds from operation xxx
(current year) xx(Balancing figure)
xxxx xxxx
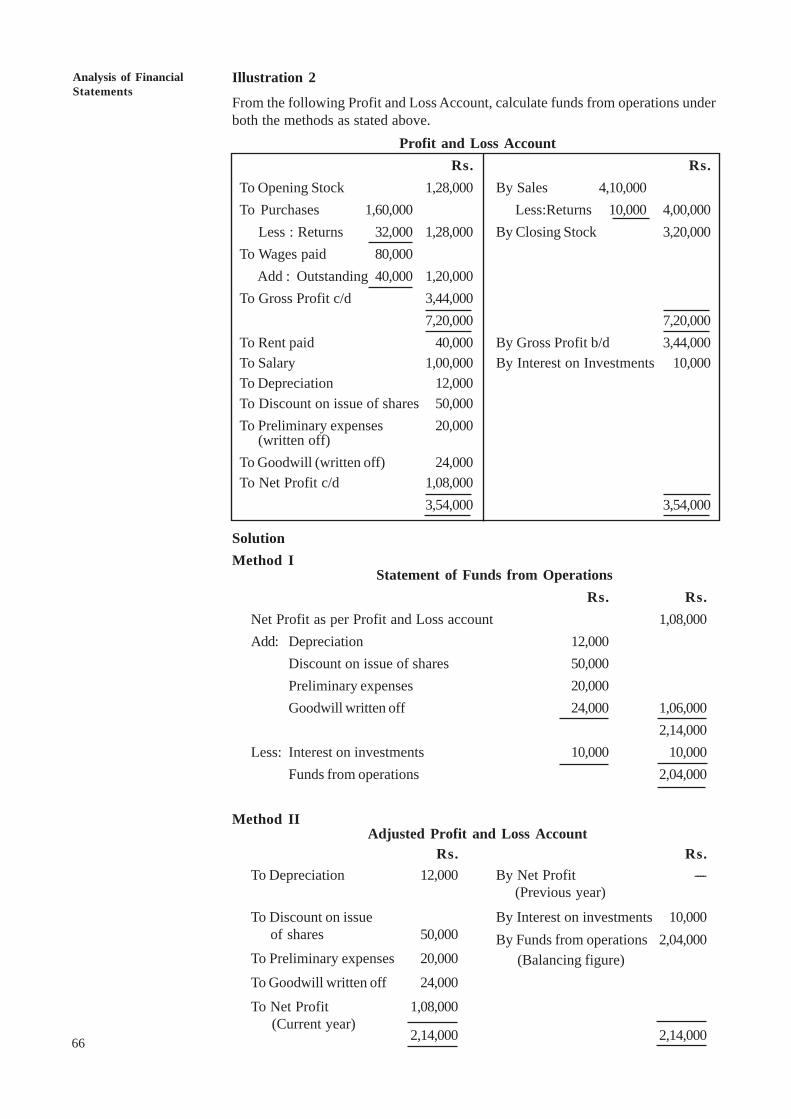
66
An OverviewAnalysis of FinancialStatements
Illustration 2
From the following Profit and Loss Account, calculate funds from operations underboth the methods as stated above.
Profit and Loss AccountRs. Rs.
To Opening Stock 1,28,000 By Sales 4,10,000To Purchases 1,60,000 Less:Returns 10,000 4,00,000
Less : Returns 32,000 1,28,000 By Closing Stock 3,20,000To Wages paid 80,000
Add : Outstanding 40,000 1,20,000To Gross Profit c/d 3,44,000
7,20,000 7,20,000To Rent paid 40,000 By Gross Profit b/d 3,44,000To Salary 1,00,000 By Interest on Investments 10,000To Depreciation 12,000To Discount on issue of shares 50,000To Preliminary expenses 20,000
(written off)To Goodwill (written off) 24,000To Net Profit c/d 1,08,000
3,54,000 3,54,000
SolutionMethod I
Statement of Funds from OperationsRs. Rs.
Net Profit as per Profit and Loss account 1,08,000Add: Depreciation 12,000
Discount on issue of shares 50,000Preliminary expenses 20,000Goodwill written off 24,000 1,06,000
2,14,000Less: Interest on investments 10,000 10,000
Funds from operations 2,04,000
Method IIAdjusted Profit and Loss Account
Rs. Rs.To Depreciation 12,000 By Net Profit ----
(Previous year)
To Discount on issue By Interest on investments 10,000 of shares 50,000To Preliminary expenses 20,000
By Funds from operations 2,04,000
To Goodwill written off 24,000
(Balancing figure)
To Net Profit 1,08,000
(Current year)
2,14,000 2,14,000
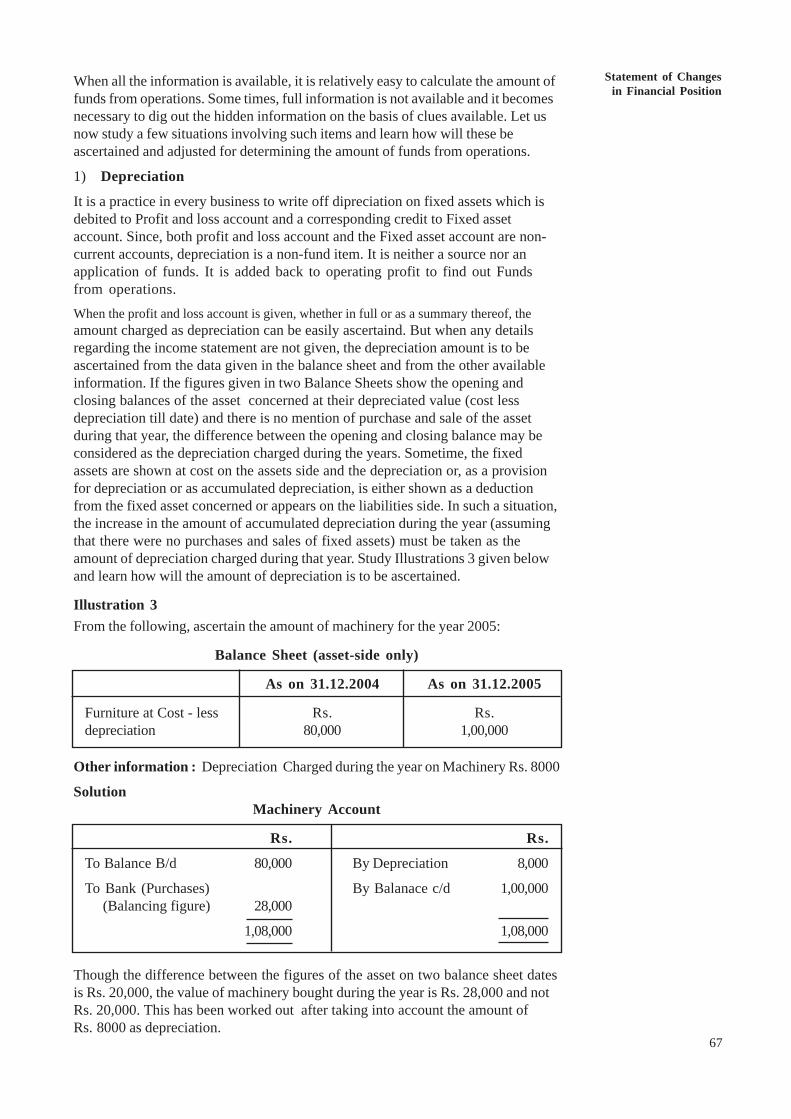
Statement of Changesin Financial Position
67
When all the information is available, it is relatively easy to calculate the amount offunds from operations. Some times, full information is not available and it becomesnecessary to dig out the hidden information on the basis of clues available. Let usnow study a few situations involving such items and learn how will these beascertained and adjusted for determining the amount of funds from operations.
1) Depreciation
It is a practice in every business to write off dipreciation on fixed assets which isdebited to Profit and loss account and a corresponding credit to Fixed assetaccount. Since, both profit and loss account and the Fixed asset account are non-current accounts, depreciation is a non-fund item. It is neither a source nor anapplication of funds. It is added back to operating profit to find out Fundsfrom operations.When the profit and loss account is given, whether in full or as a summary thereof, theamount charged as depreciation can be easily ascertaind. But when any detailsregarding the income statement are not given, the depreciation amount is to beascertained from the data given in the balance sheet and from the other availableinformation. If the figures given in two Balance Sheets show the opening andclosing balances of the asset concerned at their depreciated value (cost lessdepreciation till date) and there is no mention of purchase and sale of the assetduring that year, the difference between the opening and closing balance may beconsidered as the depreciation charged during the years. Sometime, the fixedassets are shown at cost on the assets side and the depreciation or, as a provisionfor depreciation or as accumulated depreciation, is either shown as a deductionfrom the fixed asset concerned or appears on the liabilities side. In such a situation,the increase in the amount of accumulated depreciation during the year (assumingthat there were no purchases and sales of fixed assets) must be taken as theamount of depreciation charged during that year. Study Illustrations 3 given belowand learn how will the amount of depreciation is to be ascertained.
Illustration 3From the following, ascertain the amount of machinery for the year 2005:
Balance Sheet (asset-side only)
As on 31.12.2004 As on 31.12.2005
Furniture at Cost - less Rs. Rs.depreciation 80,000 1,00,000
Other information : Depreciation Charged during the year on Machinery Rs. 8000
SolutionMachinery Account
Rs. Rs.
To Balance B/d 80,000 By Depreciation 8,000
To Bank (Purchases) By Balanace c/d 1,00,000 (Balancing figure) 28,000
1,08,000 1,08,000
Though the difference between the figures of the asset on two balance sheet datesis Rs. 20,000, the value of machinery bought during the year is Rs. 28,000 and notRs. 20,000. This has been worked out after taking into account the amount ofRs. 8000 as depreciation.
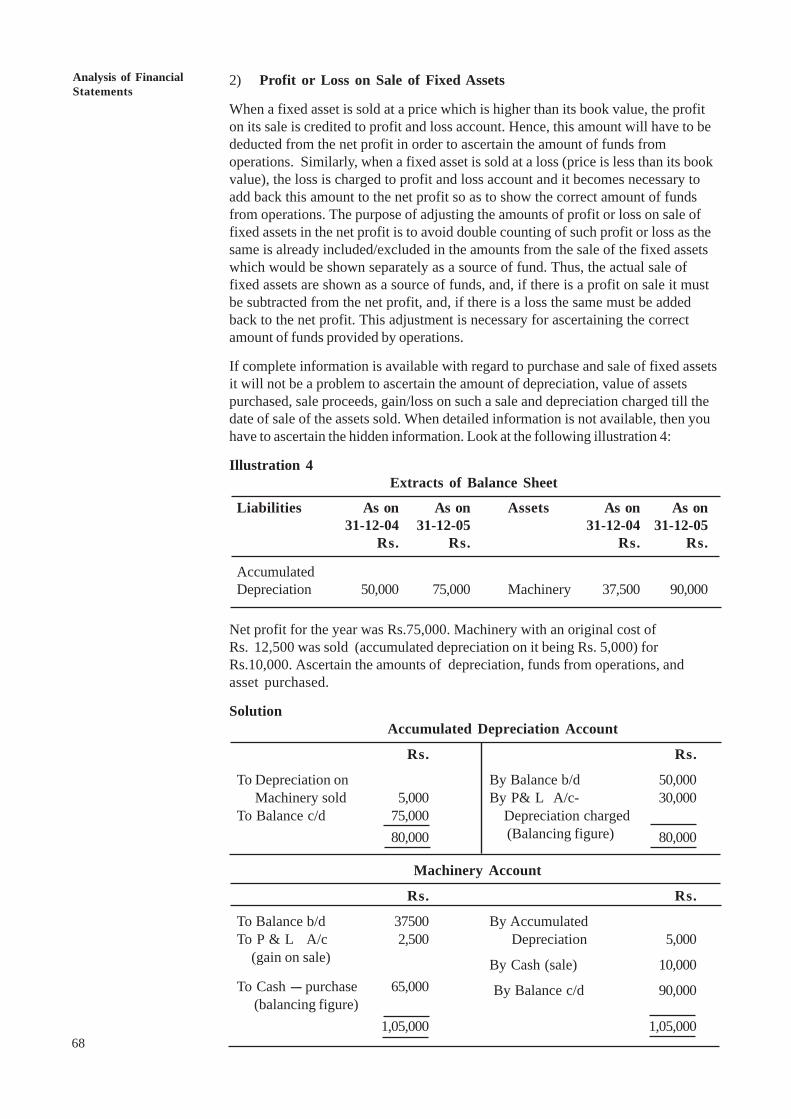
68
An OverviewAnalysis of FinancialStatements
2) Profit or Loss on Sale of Fixed Assets
When a fixed asset is sold at a price which is higher than its book value, the profiton its sale is credited to profit and loss account. Hence, this amount will have to bededucted from the net profit in order to ascertain the amount of funds fromoperations. Similarly, when a fixed asset is sold at a loss (price is less than its bookvalue), the loss is charged to profit and loss account and it becomes necessary toadd back this amount to the net profit so as to show the correct amount of fundsfrom operations. The purpose of adjusting the amounts of profit or loss on sale offixed assets in the net profit is to avoid double counting of such profit or loss as thesame is already included/excluded in the amounts from the sale of the fixed assetswhich would be shown separately as a source of fund. Thus, the actual sale offixed assets are shown as a source of funds, and, if there is a profit on sale it mustbe subtracted from the net profit, and, if there is a loss the same must be addedback to the net profit. This adjustment is necessary for ascertaining the correctamount of funds provided by operations.
If complete information is available with regard to purchase and sale of fixed assetsit will not be a problem to ascertain the amount of depreciation, value of assetspurchased, sale proceeds, gain/loss on such a sale and depreciation charged till thedate of sale of the assets sold. When detailed information is not available, then youhave to ascertain the hidden information. Look at the following illustration 4:
Illustration 4Extracts of Balance Sheet
Liabilities As on As on Assets As on As on31-12-04 31-12-05 31-12-04 31-12-05
Rs. Rs. Rs. Rs.
AccumulatedDepreciation 50,000 75,000 Machinery 37,500 90,000
Net profit for the year was Rs.75,000. Machinery with an original cost ofRs. 12,500 was sold (accumulated depreciation on it being Rs. 5,000) forRs.10,000. Ascertain the amounts of depreciation, funds from operations, andasset purchased.
SolutionAccumulated Depreciation Account
Rs. Rs.
To Depreciation on By Balance b/d 50,000 Machinery sold 5,000 By P& L A/c- 30,000To Balance c/d 75,000 Depreciation charged
80,000 (Balancing figure) 80,000
Machinery Account
Rs. Rs.
To Balance b/d 37500 By AccumulatedTo P & L A/c 2,500 Depreciation 5,000
(gain on sale) By Cash (sale) 10,000To Cash --- purchase 65,000 By Balance c/d 90,000
(balancing figure)1,05,000 1,05,000
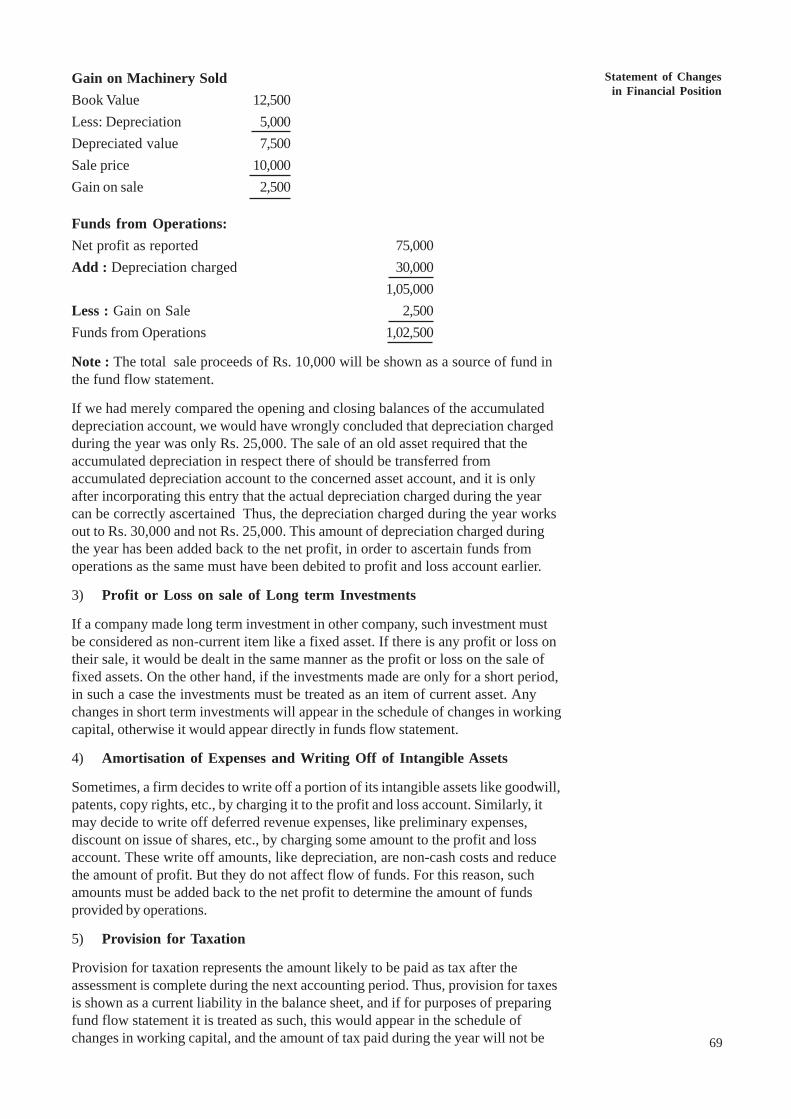
Statement of Changesin Financial Position
69
Gain on Machinery SoldBook Value 12,500Less: Depreciation 5,000Depreciated value 7,500Sale price 10,000Gain on sale 2,500
Funds from Operations:Net profit as reported 75,000Add : Depreciation charged 30,000
1,05,000Less : Gain on Sale 2,500Funds from Operations 1,02,500
Note : The total sale proceeds of Rs. 10,000 will be shown as a source of fund inthe fund flow statement.
If we had merely compared the opening and closing balances of the accumulateddepreciation account, we would have wrongly concluded that depreciation chargedduring the year was only Rs. 25,000. The sale of an old asset required that theaccumulated depreciation in respect there of should be transferred fromaccumulated depreciation account to the concerned asset account, and it is onlyafter incorporating this entry that the actual depreciation charged during the yearcan be correctly ascertained Thus, the depreciation charged during the year worksout to Rs. 30,000 and not Rs. 25,000. This amount of depreciation charged duringthe year has been added back to the net profit, in order to ascertain funds fromoperations as the same must have been debited to profit and loss account earlier.
3) Profit or Loss on sale of Long term Investments
If a company made long term investment in other company, such investment mustbe considered as non-current item like a fixed asset. If there is any profit or loss ontheir sale, it would be dealt in the same manner as the profit or loss on the sale offixed assets. On the other hand, if the investments made are only for a short period,in such a case the investments must be treated as an item of current asset. Anychanges in short term investments will appear in the schedule of changes in workingcapital, otherwise it would appear directly in funds flow statement.
4) Amortisation of Expenses and Writing Off of Intangible Assets
Sometimes, a firm decides to write off a portion of its intangible assets like goodwill,patents, copy rights, etc., by charging it to the profit and loss account. Similarly, itmay decide to write off deferred revenue expenses, like preliminary expenses,discount on issue of shares, etc., by charging some amount to the profit and lossaccount. These write off amounts, like depreciation, are non-cash costs and reducethe amount of profit. But they do not affect flow of funds. For this reason, suchamounts must be added back to the net profit to determine the amount of fundsprovided by operations.
5) Provision for Taxation
Provision for taxation represents the amount likely to be paid as tax after theassessment is complete during the next accounting period. Thus, provision for taxesis shown as a current liability in the balance sheet, and if for purposes of preparingfund flow statement it is treated as such, this would appear in the schedule ofchanges in working capital, and the amount of tax paid during the year will not be
70
An OverviewAnalysis of FinancialStatements
shown as an application in the fund flow statement. However, as per practice, tax onprofits is normally treated as a non-current item for preparing the fund flow statement.Hence, this will not be taken to the statement of changes in working capital. In fact,the provision made during the current year will have to be added back to net profit tofind out the amount of funds from operations, as the same must have been debited toprofit and loss account earlier. As for the amount of tax paid, it must be shown as anapplication of fund in the fund flow statement. It may be noted that if no additionalinformation is available, the provision for tax shown in the previous year’s balancesheet shall be taken as the tax paid during the year, and the provision for tax shown incurrent years’ balance sheet be treated as the amount of tax provided during thecurrent by debiting it to the current year’s profit and loss account. Of course, thisamount will have to be added back to net profit for ascertaining funds fromoperations. This treatment of taxation is in strict conformity with the requirements ofthe Accounting Standard on State of Changes in Position of Funds (AS-3).
6) Proposed Dividends
Proposed dividend, as in the case of provision of taxation, can be treated either acurrent liability or as a non-current liability and its treatment will differ accordingly. Incase it is treated as a current liability, it will appear as one of the items in the scheduleof changes in working capital and the amount of dividend paid will not be shown as anapplication of funds in fund flow statement. But, as per the requirement of AS-3, theproposed dividends are also to be treated as a non-current item for purposes of fundflow statement. As such proposed dividends will not find a place in the schedule ofchanges in working capital. The amount of proposed dividends relating to current yearif already deducted from profits, shall be added back for ascertaining the amount offunds from operations, and the dividends actually paid during the year will be shownas an application of funds. It may be noted that, just like provision for tax, if no detailsare available, the proposed dividends shown in the previous year’s balance sheet shallbe taken as dividends paid during the year and the proposed dividends shown incurrent year’s balance sheet shall be treated as the amount of dividends providedduring the current year by debiting it to the current year’s profit and loss appropriationaccount.
7) Provision for Doubtful Debts
Provision for doubtful debts is treated as a current item as it relates to an item ofcurrent asset (debtors) and therefore it should appear in the schedule of changes inworking capital.
6.9.3 Preparation of Funds Flow Statement (on working capitalbasis)
Funds flow statement is a statement which explains about the movement of fundswhere from working capital originates and where into the same goes during theaccounting period. While preparing funds flow statement, current assets and currentliabilities are to be ignored and only changes in non-current assets and non-currentliabilities are taken into account. In otherwords, funds flow statement is prepared onthe basis of the changes in fixed assets, long term liabilities and share capital shown inthe Balance Sheet after taking into account the additional information given, if any.This statement has two parts, Sources of funds and Application of funds. Thedifference between sources and application of funds shows the net changes in theworking capital during a specified period. The transactions which increase workingcapital are sources of funds and the transactions which decrease working capital areapplication of funds. Therefore, funds flow statement is also called as a Statement ofSources and Application of Funds, Inflow-outflow of Funds Statement etc.
Statement of Changesin Financial Position
71
This can be prepared either in a (1) Statement Form, or (2) Account Format asgiven below:
1) Statement Form :
Proforma of Fund Flow Statement
Fund Flow Statement for the year ending ................................
A) Sources of Funds : Rs. Rs.
1) Funds from operations ---------------
2) Issue of share capital ---------------
3) Issue of debentures ---------------
4) Long-term loans raised ---------------
5) Sale of fixed assets ---------------
--------------- xxxx
B) Uses of funds
1) Operating loss, if any ---------------
2) Redemption of preference share capital ---------------
3) Redemption of debentures ---------------
4) Repayment of long- term liabilities ---------------
5) Purchase of fixed assets ---------------
6) Payment of dividends (final and interim) ---------------
7) Payment of taxes ---------------
--------------- xxxx
Increase/Decrease in Working Capital (A-B) xxxx
2) Account Format
Proforma of Fund Flow StatementFund Flow Statement for the year ending..............
Sources Rs. Uses Rs.
Funds from operations ................. Operating loss, if any ................
Issue of Share capital ................. Redemption of preference share capital .............
Issue of debentures ................. Redemption of debentures ................
Long term loans raised ................. Repayment of long term loans ................
Sale of fixed assets ................. Purchases of fixed assets ................
Decrease of Net ................. Payment of dividends (final and interim) ............Working Capital ................. Payment of tax
(Balanicing figure) ................. Increase of Net Working Capital ................(Balanicing figure)
Total Total
72
An OverviewAnalysis of FinancialStatements
6.9.4 Steps in Preparation of Funds Flow Statement
To prepare funds flow statement, sources and application of funds have to beascertained. The usual sources of funds and uses of funds are as follows:
1) Funds From Operation: Identify profit after tax but before any appropriation.With that value, add the following values:
l Depreciation on fixed assets
l Any expenses written off during the year
l Loss on sale of fixed assets and investments
Deduct the following:
l Profit on sale of fixed assets and investments
l Profit on revaluation of fixed assets
l Non-operating incomes
2) Fresh issue of Equity shares, issue of debentures, fresh loan from financialinstitutions, etc. are next major sources of funds.
3) Sale proceeds of fixed assets and investments are next source of funds.
4) Non-operating income, which was deducted earlier to compute funds fromoperation has to be added at this stage since it is also source of funds.
5) The above four sources of funds give your gross value of funds generatedduring the year. From this value deduct the following uses of funds of long-term nature.
6) Purchase of fixed assets and investments has to be deducted.
7) Repayment of loan, debentures, share repurchase are to be deducted.
8) Payment of dividend, income-tax, etc., are to be reduced.
9) The difference between the sources and uses of funds calculated above issources of funds from long-term operations.
10) Find out changes in current assets and current liabilities values of two periodsand compute how much net change on working capital. The net changes inworking capital will be equal to net changes in long-term sources and uses.
6.10 FUNDS FLOW VS. OTHER FINANCIALSTATEMENTS
Funds flow statement is unique compared to other statement since it converts astock statement (balance sheet) into a flow statement. As such, there is not muchof comparison or relationship between funds flow and other financial statements.When compared to cash flow statements, which will be discussed in the nextsection, funds flow gives a broader view of financial flow. While cash flow showshow cash balance changed from one period to another period, funds flow statementtypically shows the changes in the balances of working capital, which includes cashbalance. Normally, funds flow statement is used to understand long-term stability ofbusiness whereas cash flow statement is used to find out short-term stability. Cashflow statement can be used to assess the quality of reported profit, whereas itwould be difficult to do such exercise with funds flow statement.
There are significant differences between funds flow statement and profit and lossaccount. Though both of them are flow or period statement, profit and loss accountexcludes all capital-related transactions like capital expenditure or capital receipts.
Statement of Changesin Financial Position
73
Funds flow statement considers both revenue and capital items. The onlyrelationship between the two statements is both are concerned with funds raisedthrough operating activities. To get funds from operating activities, we use profitand loss statement and perform some adjustments.
As discussed earlier, funds flow statement is a kind of extension of Balance Sheet.There are number of similarities between the two statements. Many accountingheads of both statements are common and the only difference is the valuation.While Balance Sheet shows the figure as on a particular date, Funds FlowStatement shows the period value. While Balance Sheets values are normallypositive, funds flow statement may show negative values on some of the items. Forinstance, consider secured loan item of Balance Sheet. It might show a value ofRs. 200 lakhs last year and Rs. 150 lakhs at the end of current year. Both arepositive values. In Funds Flow Statement, the secured loan account will havenegative value of Rs. 20 lakhs, since this much of amount is repaid and hence it isapplication of funds. While Balance Sheet is a single statement, funds flow isnormally prepared in two stages and includes working capital statement.
Activity 3
1) Visit some of the web sites of large Indian companies, which have also issuedAmerican Depository Receipts (ADR). From the web sites, download theP&L account as per Indian Accounting Standards and also P&L accountdrawn under US accounting standards (called US GAAP). Compare the twostatements and then briefly write your overall observations.
..........................................................................................................................
..........................................................................................................................
..........................................................................................................................
2) Why do feel that the two figures are different? List down some of thedominant reasons.
..........................................................................................................................
..........................................................................................................................
..........................................................................................................................
3) Now, you check the cash flow statement reported under two systems and listdown your observations.
..........................................................................................................................
..........................................................................................................................
..........................................................................................................................
6.11 IMPORTANCE OF FUNDS FLOWSTATEMENT
An important contribution of funds flow statement is to know how funds havemoved between long-term and short-term needs of the organisation. It is generallybelieved that organisation needs to match assets and liabilities on time scale thoughassets are always equal to liabilities. For instance, if a firm raises funds through 364days commercial paper and uses the money to buy a plant. There is a asset-liabilitymismatch between the sources and uses of funds. Suppose, the interest rate is10% and expected return from the project is 12%. Today, the project looks
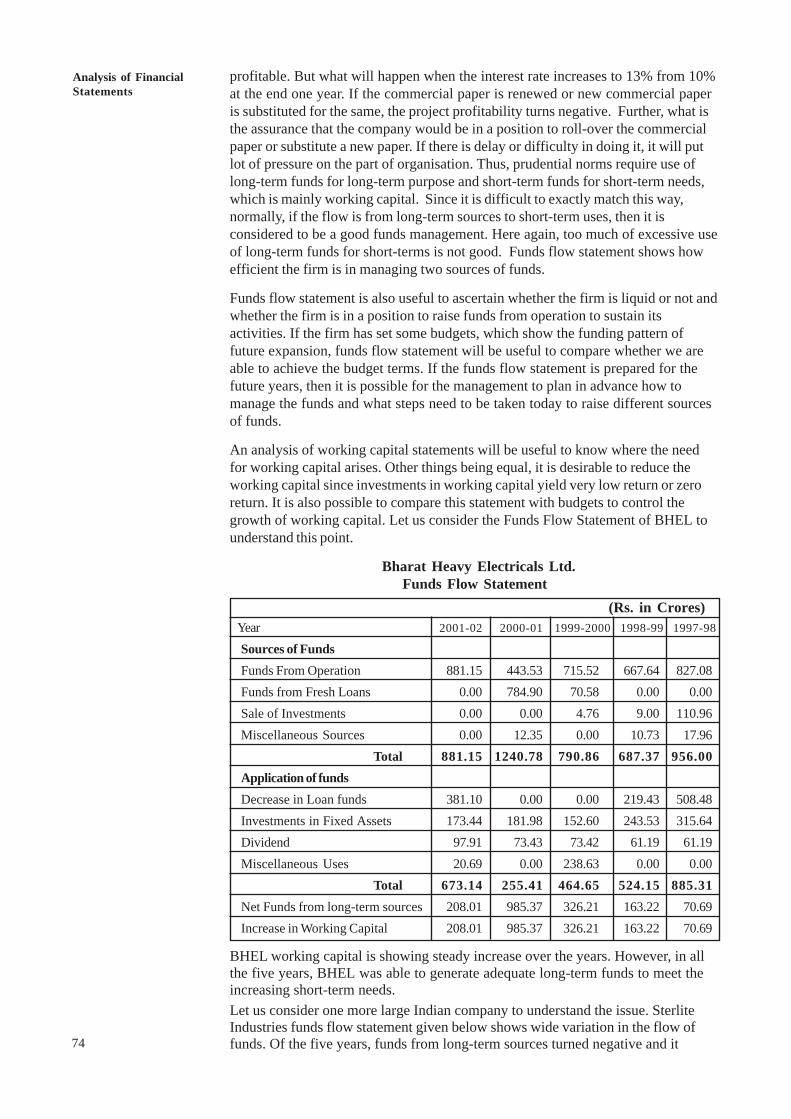
74
An OverviewAnalysis of FinancialStatements
profitable. But what will happen when the interest rate increases to 13% from 10%at the end one year. If the commercial paper is renewed or new commercial paperis substituted for the same, the project profitability turns negative. Further, what isthe assurance that the company would be in a position to roll-over the commercialpaper or substitute a new paper. If there is delay or difficulty in doing it, it will putlot of pressure on the part of organisation. Thus, prudential norms require use oflong-term funds for long-term purpose and short-term funds for short-term needs,which is mainly working capital. Since it is difficult to exactly match this way,normally, if the flow is from long-term sources to short-term uses, then it isconsidered to be a good funds management. Here again, too much of excessive useof long-term funds for short-terms is not good. Funds flow statement shows howefficient the firm is in managing two sources of funds.
Funds flow statement is also useful to ascertain whether the firm is liquid or not andwhether the firm is in a position to raise funds from operation to sustain itsactivities. If the firm has set some budgets, which show the funding pattern offuture expansion, funds flow statement will be useful to compare whether we areable to achieve the budget terms. If the funds flow statement is prepared for thefuture years, then it is possible for the management to plan in advance how tomanage the funds and what steps need to be taken today to raise different sourcesof funds.
An analysis of working capital statements will be useful to know where the needfor working capital arises. Other things being equal, it is desirable to reduce theworking capital since investments in working capital yield very low return or zeroreturn. It is also possible to compare this statement with budgets to control thegrowth of working capital. Let us consider the Funds Flow Statement of BHEL tounderstand this point.
Bharat Heavy Electricals Ltd.Funds Flow Statement
(Rs. in Crores)Year 2001-02 2000-01 1999-2000 1998-99 1997-98
Sources of FundsFunds From Operation 881.15 443.53 715.52 667.64 827.08Funds from Fresh Loans 0.00 784.90 70.58 0.00 0.00Sale of Investments 0.00 0.00 4.76 9.00 110.96Miscellaneous Sources 0.00 12.35 0.00 10.73 17.96 Total 881.15 1240.78 790.86 687.37 956.00Application of fundsDecrease in Loan funds 381.10 0.00 0.00 219.43 508.48Investments in Fixed Assets 173.44 181.98 152.60 243.53 315.64Dividend 97.91 73.43 73.42 61.19 61.19Miscellaneous Uses 20.69 0.00 238.63 0.00 0.00 Total 673.14 255.41 464.65 524.15 885.31Net Funds from long-term sources 208.01 985.37 326.21 163.22 70.69Increase in Working Capital 208.01 985.37 326.21 163.22 70.69
BHEL working capital is showing steady increase over the years. However, in allthe five years, BHEL was able to generate adequate long-term funds to meet theincreasing short-term needs.Let us consider one more large Indian company to understand the issue. SterliteIndustries funds flow statement given below shows wide variation in the flow offunds. Of the five years, funds from long-term sources turned negative and it
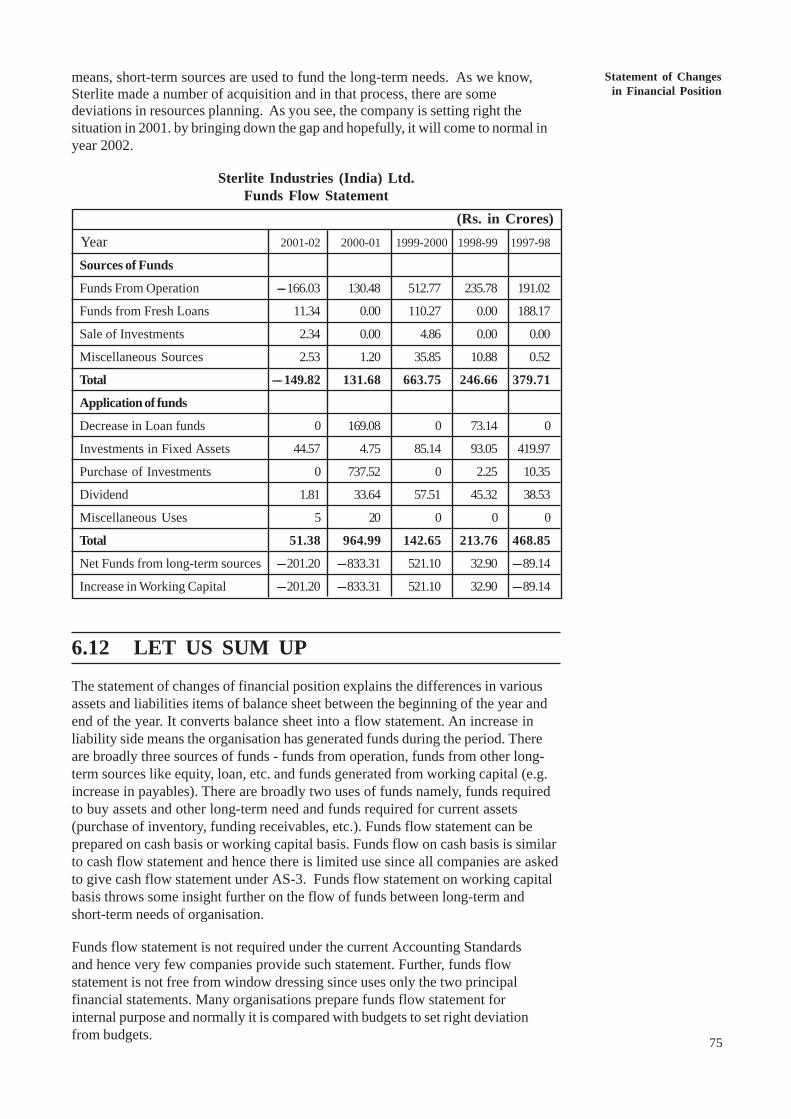
Statement of Changesin Financial Position
75
means, short-term sources are used to fund the long-term needs. As we know,Sterlite made a number of acquisition and in that process, there are somedeviations in resources planning. As you see, the company is setting right thesituation in 2001. by bringing down the gap and hopefully, it will come to normal inyear 2002.
Sterlite Industries (India) Ltd.Funds Flow Statement
(Rs. in Crores) Year 2001-02 2000-01 1999-2000 1998-99 1997-98
Sources of Funds
Funds From Operation ----166.03 130.48 512.77 235.78 191.02
Funds from Fresh Loans 11.34 0.00 110.27 0.00 188.17
Sale of Investments 2.34 0.00 4.86 0.00 0.00
Miscellaneous Sources 2.53 1.20 35.85 10.88 0.52
Total ----149.82 131.68 663.75 246.66 379.71
Application of funds
Decrease in Loan funds 0 169.08 0 73.14 0
Investments in Fixed Assets 44.57 4.75 85.14 93.05 419.97
Purchase of Investments 0 737.52 0 2.25 10.35
Dividend 1.81 33.64 57.51 45.32 38.53
Miscellaneous Uses 5 20 0 0 0
Total 51.38 964.99 142.65 213.76 468.85
Net Funds from long-term sources ----201.20 ----833.31 521.10 32.90 ----89.14
Increase in Working Capital ----201.20 ----833.31 521.10 32.90 ----89.14
6.12 LET US SUM UP
The statement of changes of financial position explains the differences in variousassets and liabilities items of balance sheet between the beginning of the year andend of the year. It converts balance sheet into a flow statement. An increase inliability side means the organisation has generated funds during the period. Thereare broadly three sources of funds - funds from operation, funds from other long-term sources like equity, loan, etc. and funds generated from working capital (e.g.increase in payables). There are broadly two uses of funds namely, funds requiredto buy assets and other long-term need and funds required for current assets(purchase of inventory, funding receivables, etc.). Funds flow statement can beprepared on cash basis or working capital basis. Funds flow on cash basis is similarto cash flow statement and hence there is limited use since all companies are askedto give cash flow statement under AS-3. Funds flow statement on working capitalbasis throws some insight further on the flow of funds between long-term andshort-term needs of organisation.
Funds flow statement is not required under the current Accounting Standardsand hence very few companies provide such statement. Further, funds flowstatement is not free from window dressing since uses only the two principalfinancial statements. Many organisations prepare funds flow statement forinternal purpose and normally it is compared with budgets to set right deviationfrom budgets.
76
An OverviewAnalysis of FinancialStatements 6.13 KEY WORDS
Funds: Cash or net working capital.
Flow of funds: Movement or change in the net working capital.
Current Assets : Cash and other assets that are converted into cash or consumedin the production of goods in the normal course of business.
Fund Flow Statement: Statement which shows the sources (inflows) and uses(outflows) of funds between two balance sheet dates.
Funds from Operations: The amount of net profit that acts as a source of fundi.e., profit before charging certain non-cash costs and before crediting items likeprofit on sale of fixed assets.
Current - liabilities : Liabilities payable within one year.
Gross Working Capital : Total of current assets.
Net Working Capital: Excess of current assets over current liabilities.
Non-Current Items: Long term asset and long-term liabilities.
Schedule of Changes in Working Capital: Statement which reveals the effectof item wise change in current asset and current liabilities on the net workingcapital between two balance sheet dates.
Working Capital: That part of the capital which is required for recoming operationsof a business as distinguished from capital invested in fixed assets.
6.14 TERMINAL QUESTIONS
1) Compared to two principal financial statements namely, Profit and LossAccount and Balance Sheet, what is additional insight you get from funds flowstatement?
2) “Funds flow statement is only supplementary to P&L Account and BalanceSheet; it can’t be substitute to P&L Account and Balance Sheet” - Do youagree to this statement? Explain your views.
3) Discuss a few basic differences between “cash” concept of funds flowstatement and “working capital” concept of funds flow statement.
4) A firm is found to have negative changes in working capital. What does itmean? Is it good for the firm in the long-run if the negative change in workingcapital continues for a long period?
5) “Funds Flow Statement also suffers from window dressing of accounts andhence fails to give true view of funds movement; for instance, funds fromoperation can be increased by recording a few dummy sales” - Do you agreeto this criticism? Give your views.
6) From the following figures, prepare Funds Flow Statement under both methodsand then give your comments and observations.
Statement of Changesin Financial Position
77
Year 1 Year 2AssetsFixed Assets (Net Block) 510000 620000Investments 30000 80000Current Assets 240000 375000Discount on Issue of Debentures 10000 5000 Total 790000 1080000Liabilities
Equity Share Capital 300000 350000
14% Preference Share Capital 200000 100000
14% Debentures 100000 200000
Reserves 110000 270000
Provision for Doubtful Debts 10000 15000
Current Liabilities 70000 145000
Total 790000 1080000
Additional Details
a) Provision for Depreciation stood at 150000 at the end of Year 1and Rs. 190000 at the end of Year 2.
b) During the year, a machine costing Rs. 70000 (book value Rs. 40000)was disposed of for Rs. 25000.
c) Preference shares redemption was carried out at a premium of 5%.
d) Dividend @ 15% was paid on equity shares for the year 1 during theyear 2.
7) Following is the summarised Balance Sheet of Bombay Industries Ltd. as onDecember 31, 2004 and 2005 :
Balance Sheet
Liabilities 2004 2005 Assets 2004 2005Rs. Rs. Rs. Rs.
Sundry Creditors 40,400 43,200 Cash and Bank 44,600 47,800
Bills Payable 10,800 12,200 Debtors 10,800 17,000
Outstanding Rent 2,600 1,000 Stock-in-trade 44,000 67,200
Mortgage Loan 22,000 21,000 Temporary Investments 30,200 8,000
Share Capital 2,80,000 3,20,000 Plant & Machinery 2,54,600 3,35,800
Reserves 1,12,600 1,31,600 Land 50,000 50,000
Proposed Dividend 28,000 32,000 Long-term investment 62,200 35,200
4,96,400 5,61,000 4,96,400 5,61,000
You are required to prepare schedule of changes in working capital.
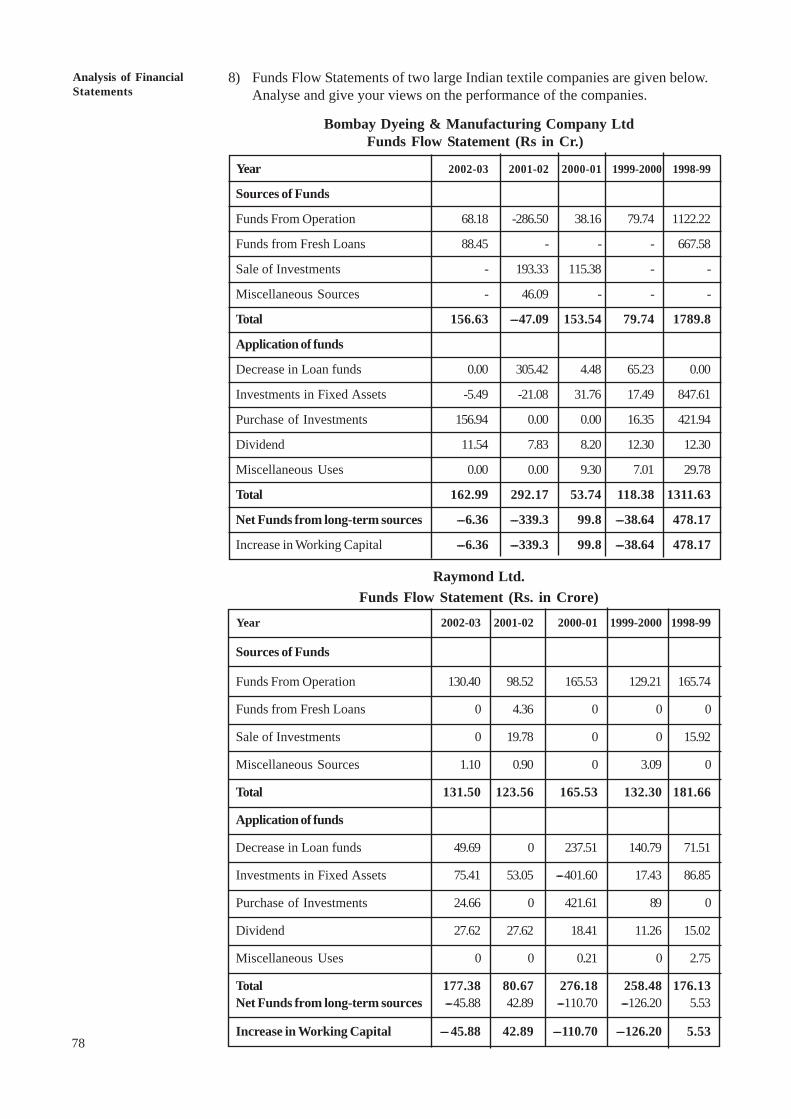
78
An OverviewAnalysis of FinancialStatements
8) Funds Flow Statements of two large Indian textile companies are given below.Analyse and give your views on the performance of the companies.
Bombay Dyeing & Manufacturing Company LtdFunds Flow Statement (Rs in Cr.)
Year 2002-03 2001-02 2000-01 1999-2000 1998-99
Sources of Funds
Funds From Operation 68.18 -286.50 38.16 79.74 1122.22
Funds from Fresh Loans 88.45 - - - 667.58
Sale of Investments - 193.33 115.38 - -
Miscellaneous Sources - 46.09 - - -
Total 156.63 ---47.09 153.54 79.74 1789.8
Application of funds
Decrease in Loan funds 0.00 305.42 4.48 65.23 0.00
Investments in Fixed Assets -5.49 -21.08 31.76 17.49 847.61
Purchase of Investments 156.94 0.00 0.00 16.35 421.94
Dividend 11.54 7.83 8.20 12.30 12.30
Miscellaneous Uses 0.00 0.00 9.30 7.01 29.78
Total 162.99 292.17 53.74 118.38 1311.63
Net Funds from long-term sources ---6.36 ---339.3 99.8 ---38.64 478.17
Increase in Working Capital ---6.36 ---339.3 99.8 ---38.64 478.17
Raymond Ltd.Funds Flow Statement (Rs. in Crore)
Year 2002-03 2001-02 2000-01 1999-2000 1998-99
Sources of Funds
Funds From Operation 130.40 98.52 165.53 129.21 165.74
Funds from Fresh Loans 0 4.36 0 0 0
Sale of Investments 0 19.78 0 0 15.92
Miscellaneous Sources 1.10 0.90 0 3.09 0
Total 131.50 123.56 165.53 132.30 181.66
Application of funds
Decrease in Loan funds 49.69 0 237.51 140.79 71.51
Investments in Fixed Assets 75.41 53.05 ---401.60 17.43 86.85
Purchase of Investments 24.66 0 421.61 89 0
Dividend 27.62 27.62 18.41 11.26 15.02
Miscellaneous Uses 0 0 0.21 0 2.75
Total 177.38 80.67 276.18 258.48 176.13Net Funds from long-term sources ---45.88 42.89 ---110.70 ---126.20 5.53
Increase in Working Capital ---45.88 42.89 ---110.70 ---126.20 5.53
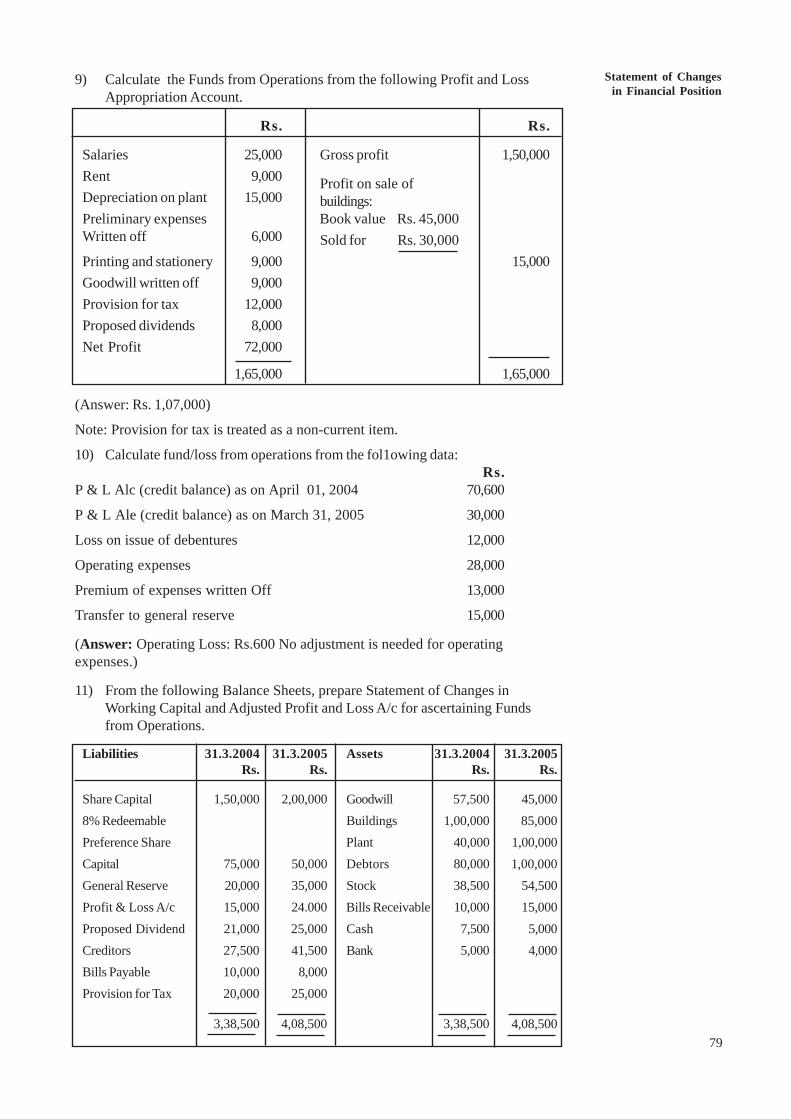
Statement of Changesin Financial Position
79
9) Calculate the Funds from Operations from the following Profit and LossAppropriation Account.
Rs. Rs.
Salaries 25,000 Gross profit 1,50,000Rent 9,000 Profit on sale ofDepreciation on plant 15,000 buildings:Preliminary expenses Book value Rs. 45,000Written off 6,000 Sold for Rs. 30,000Printing and stationery 9,000 15,000Goodwill written off 9,000Provision for tax 12,000Proposed dividends 8,000Net Profit 72,000
1,65,000 1,65,000
(Answer: Rs. 1,07,000)
Note: Provision for tax is treated as a non-current item.
10) Calculate fund/loss from operations from the fol1owing data:Rs.
P & L Alc (credit balance) as on April 01, 2004 70,600
P & L Ale (credit balance) as on March 31, 2005 30,000
Loss on issue of debentures 12,000
Operating expenses 28,000
Premium of expenses written Off 13,000
Transfer to general reserve 15,000
(Answer: Operating Loss: Rs.600 No adjustment is needed for operatingexpenses.)
11) From the following Balance Sheets, prepare Statement of Changes inWorking Capital and Adjusted Profit and Loss A/c for ascertaining Fundsfrom Operations.
Liabilities 31.3.2004 31.3.2005 Assets 31.3.2004 31.3.2005Rs. Rs. Rs. Rs.
Share Capital 1,50,000 2,00,000 Goodwill 57,500 45,0008% Redeemable Buildings 1,00,000 85,000Preference Share Plant 40,000 1,00,000Capital 75,000 50,000 Debtors 80,000 1,00,000General Reserve 20,000 35,000 Stock 38,500 54,500Profit & Loss A/c 15,000 24.000 Bills Receivable 10,000 15,000Proposed Dividend 21,000 25,000 Cash 7,500 5,000Creditors 27,500 41,500 Bank 5,000 4,000Bills Payable 10,000 8,000Provision for Tax 20,000 25,000
3,38,500 4,08,500 3,38,500 4,08,500
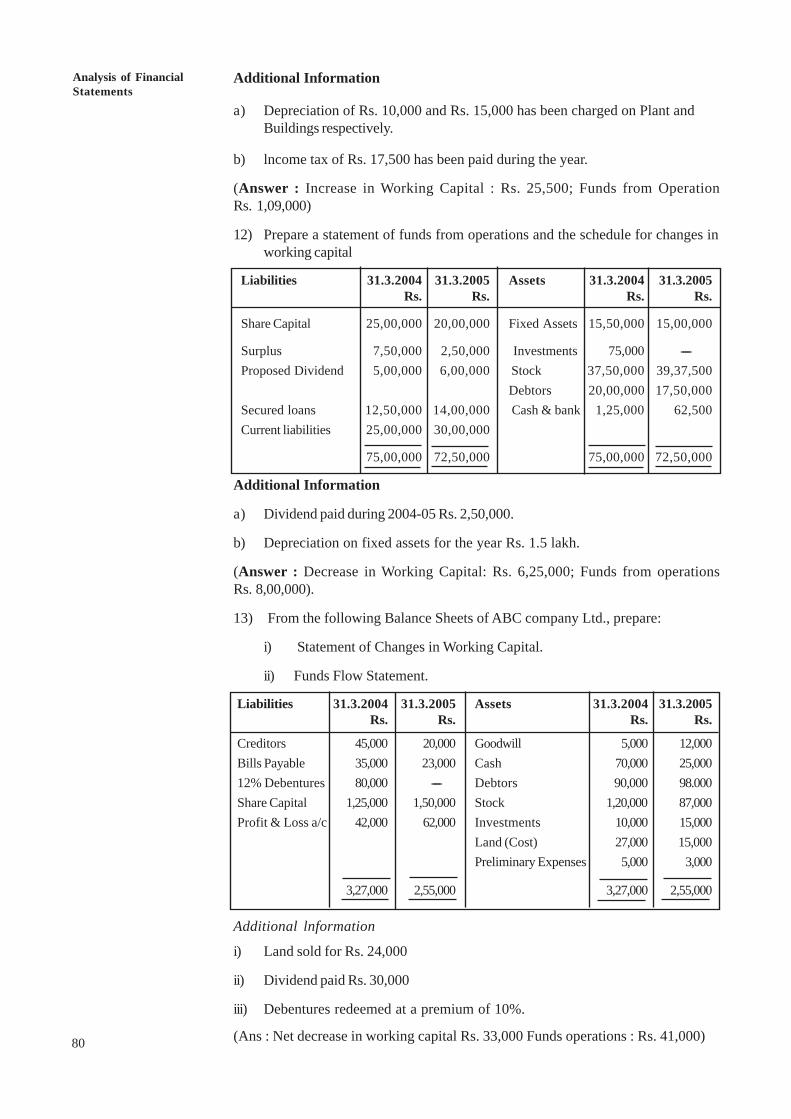
80
An OverviewAnalysis of FinancialStatements
Additional Information
a) Depreciation of Rs. 10,000 and Rs. 15,000 has been charged on Plant andBuildings respectively.
b) lncome tax of Rs. 17,500 has been paid during the year.
(Answer : Increase in Working Capital : Rs. 25,500; Funds from OperationRs. 1,09,000)
12) Prepare a statement of funds from operations and the schedule for changes inworking capital
Liabilities 31.3.2004 31.3.2005 Assets 31.3.2004 31.3.2005Rs. Rs. Rs. Rs.
Share Capital 25,00,000 20,00,000 Fixed Assets 15,50,000 15,00,000
Surplus 7,50,000 2,50,000 Investments 75,000 -----Proposed Dividend 5,00,000 6,00,000 Stock 37,50,000 39,37,500
Debtors 20,00,000 17,50,000Secured loans 12,50,000 14,00,000 Cash & bank 1,25,000 62,500Current liabilities 25,00,000 30,00,000
75,00,000 72,50,000 75,00,000 72,50,000
Additional Information
a) Dividend paid during 2004-05 Rs. 2,50,000.
b) Depreciation on fixed assets for the year Rs. 1.5 lakh.
(Answer : Decrease in Working Capital: Rs. 6,25,000; Funds from operationsRs. 8,00,000).
13) From the following Balance Sheets of ABC company Ltd., prepare:
i) Statement of Changes in Working Capital.
ii) Funds Flow Statement.
Liabilities 31.3.2004 31.3.2005 Assets 31.3.2004 31.3.2005Rs. Rs. Rs. Rs.
Creditors 45,000 20,000 Goodwill 5,000 12,000Bills Payable 35,000 23,000 Cash 70,000 25,00012% Debentures 80,000 ----- Debtors 90,000 98.000Share Capital 1,25,000 1,50,000 Stock 1,20,000 87,000Profit & Loss a/c 42,000 62,000 Investments 10,000 15,000
Land (Cost) 27,000 15,000Preliminary Expenses 5,000 3,000
3,27,000 2,55,000 3,27,000 2,55,000
Additional lnformation
i) Land sold for Rs. 24,000
ii) Dividend paid Rs. 30,000
iii) Debentures redeemed at a premium of 10%.
(Ans : Net decrease in working capital Rs. 33,000 Funds operations : Rs. 41,000)
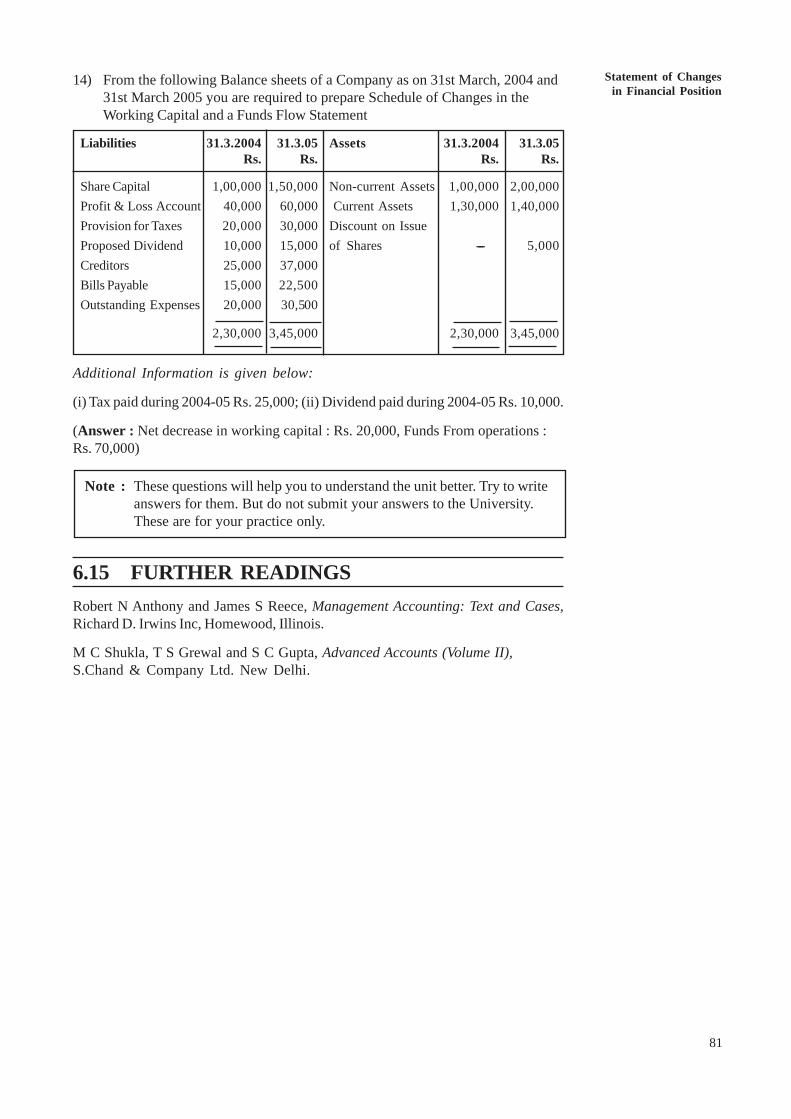
Statement of Changesin Financial Position
81
14) From the following Balance sheets of a Company as on 31st March, 2004 and31st March 2005 you are required to prepare Schedule of Changes in theWorking Capital and a Funds Flow Statement
Liabilities 31.3.2004 31.3.05 Assets 31.3.2004 31.3.05Rs. Rs. Rs. Rs.
Share Capital 1,00,000 1,50,000 Non-current Assets 1,00,000 2,00,000Profit & Loss Account 40,000 60,000 Current Assets 1,30,000 1,40,000Provision for Taxes 20,000 30,000 Discount on IssueProposed Dividend 10,000 15,000 of Shares ----- 5,000Creditors 25,000 37,000Bills Payable 15,000 22,500Outstanding Expenses 20,000 30,500
2,30,000 3,45,000 2,30,000 3,45,000
Additional Information is given below:
(i) Tax paid during 2004-05 Rs. 25,000; (ii) Dividend paid during 2004-05 Rs. 10,000.
(Answer : Net decrease in working capital : Rs. 20,000, Funds From operations :Rs. 70,000)
6.15 FURTHER READINGSRobert N Anthony and James S Reece, Management Accounting: Text and Cases,Richard D. Irwins Inc, Homewood, Illinois.
M C Shukla, T S Grewal and S C Gupta, Advanced Accounts (Volume II),S.Chand & Company Ltd. New Delhi.
Note : These questions will help you to understand the unit better. Try to writeanswers for them. But do not submit your answers to the University.These are for your practice only.
82
Analysis of FinancialStatements UNIT 7 CASH FLOW ANALYSIS
Structure7.0 Objectives
7.1 Introduction
7.2 Need for Cash Flow Statement
7.3 Cash Flow Statements vs. Other Financial Statements
7.4 Preparation of Cash Flow Statement7.4.1 Sources and Uses of Cash
7.4.2 Ascertaining Cash from Operations
7.5 Preparation of Cash Flow Statement
7.6 Regulations Relating to Cash Flow Statement
7.7 Cash Flow Statement Formats
7.8 Cash Flow from Operating Activities
7.9 Cash Flow From Investing and Financing Activities
7.10 Uses of Cash Flow Analysis
7.11 Distinctions between Funds Flow and Cash Flow Analysis
7.12 Let Us Sum Up
7.13 Key Words
7.14 Terminal Questions
7.15 Further Readings
7.0 OBJECTIVESThe objectives of this unit are to:
! explain importance of cash flow statement for investors and otherstockholders;
! compare the differences between cash flow statement with other financialstatements;
! explain regulations relating to preparation of cash flows;
! familiar with the methodology for preparation of cash flow statement anddifferent components of cash flow statement; and
! comprehend how cash flow statement can be used in real life for differentdecision making.
7.1 INTRODUCTIONThe statement of cash flows, required by the Accounting Standard-3, is a majordevelopment in accounting measurement and disclosure because of its relevanceto financial statement users. Cash Flow Statement is reasonably simple and easyto understand. It is also difficult to fudge or manipulate the cash flow numbersand hence often used as a way to test the real profitability of the firm. Forinstance, if your company approaches a bank for a loan, your company willnormally highlight the profitability of your business as your strength. But the bank
Cash FlowAnalysis
83
manager may not be sure how you arrived at the profit, particularly when we readlot of accounting related scams. Hence, the bank manager would like to examinewhether you have actually earned the profit or not. Cash Flow Statement will beuseful to examine whether the profits are realised and if so, to what percentage ofprofit a firm has realised. In other words, a company that shows high level ofprofit need not be liquid in cash. Suppliers of goods will also be interested toexamine the cash flow position of the company before supplying goods on credit.Investor, who have no control on management, will also be interested in examiningthe cash flow to supplement her/his analysis on profitability of the business.
Activity 1
1) Before you read further, can you think about why profit reported in P&Laccount might be misleading? Can you think about some examples of howprofit can be overstated?
..........................................................................................................................
..........................................................................................................................
..........................................................................................................................
..........................................................................................................................
..........................................................................................................................
2) If you have identified some examples, can you think about why companiesresort to do such things and also how you can find out if you are an outsider?
..........................................................................................................................
..........................................................................................................................
..........................................................................................................................
..........................................................................................................................
..........................................................................................................................
7.2 NEED FOR CASH FLOW STATEMENTThe primary objective of the statement of cash flows is to provide informationabout an entity’s cash receipts and cash payments during a period. The net effectof cash flow is provided under different heads namely cash flow from operating,investing and financing activities. It helps users to find answers to the followingimportant questions:
a) Where did the cash come from during the period?
b) What was the cash used for during the period?
c) What was the change in the cash balance during the period?
The AS-3 identifies two important uses of cash flow statement as follows:
a) A cash flow statement, when used in conjunction with the other financialstatements, provides information that enables users to evaluate the changes innet assets of an enterprise, its financial structure (including its liquidity andsolvency) and its ability to affect the amounts and timing of cash flows inorder to adapt to changing circumstances and opportunities. Cash flowinformation is useful in assessing the ability of the enterprise to generate cash
84
Analysis of FinancialStatements
and cash equivalents and enables users to develop models to assess andcompare the present value of the future cash flows of different enterprises. Italso enhances the comparability of the reporting of operating performance bydifferent enterprises because it eliminates the effects of using differentaccounting treatments for the same transactions and events.
b) Historical cash flow information is often used as an indicator of the amount,timing and certainty of future cash flows. It is also useful in checking theaccuracy of past assessments of future cash flows and in examining therelationship between profitability and net cash flow and the impact of changingprices.
A Statement issued by Securities and Exchange Board of India in 1995 when itmade the cash flow statement mandatory also lists the above are primary objectiveof requiring the listed companies to provide cash flow statement to the investors.
The importance of cash flow as a measure of corporate performance and as acritical variable to appraise loan decisions has been supported by several influentialpersons or organisations. The importance of cash flow statements is clear from thefollowing excerpts:
1) Harold Williams (the then chairman of the SEC) made the following commentsin a speech to the Financial Executives Research Foundation:
Corporate earnings reports communicate, at best, only part of the story.And, their most critical omission - in recognition that insufficient cashresources are a major cause of corporate problems particularly ininflationary times - is their failure to speak to a corporation’s cashposition. Indeed, in my view, cash flow from operations is a bettermeasure of performance than earnings-per-share. What should beconsidered is more revealing analytical concepts of cash flow or cash-flow-per-share, which reflect the total cash earnings available tomanagement - that is earnings before expenses such as depreciation andamortization are deducted. An even more sophisticated - and, in myopinion, more informative - analytical tool is free cash flow, whichconsiders cash flow after deducting such spiralling corporate costs ascapital expenditures. This technique allows (evaluation of ) the costs ofmaintaining the corporation’s present capital and market position - costwhich are, in essence, expenses and cash flow obligations that should beconsidered in determining the corporation’s financial position. ArthurYoung Views (January 1981).
2) Robert Morris Associates, a national association of bank loan and creditofficers, advocates the use of cash flow analysis as a tool necessary toevaluate, understand, and accurately determine a borrower’s ability to repayloans:
Banks lend cash to their clients, collect interest in cash, and require debtrepayment in cash. Nothing less, just cash. Financial statements,however, usually are prepared on an accrual basis, not on a cash basis.And projections? Same thing. Projected net income, not projected cashincome. Yet, cash repays loans. Therefore, we are compelled to shift ourfocus if we truly wish to assess our client’s ability to pay interest andrepay debt. We must turn our attention to cash, working through theroadblocks thrown up by accrual accounting, to properly evaluate thecreditworthiness of our client. (RMA Uniform Credit Analysis,Philadelphia, Robert Morris Associates, 1982).
Cash FlowAnalysis
85
Activity 2
1) Pick up annual report of a company and show the Balance Sheet and Profitand Loss account to your non-accounting friends. Ask them how comfortablein reading the two statements and record their observation here.
...........................................................................................................................
...........................................................................................................................
...........................................................................................................................
...........................................................................................................................
2) Now, show the Cash Flow statements to them and ask them whether they areable to understand anything better about the company. Record their statementshere.
...........................................................................................................................
...........................................................................................................................
...........................................................................................................................
...........................................................................................................................
3) Examine the above two and record your overall assessment whether there isany improvement in their understanding.
...........................................................................................................................
...........................................................................................................................
...........................................................................................................................
...........................................................................................................................
7.3 CASH FLOW STATEMENT VS. OTHERFINANCIAL STATEMENTS
The cash flow statement is different from other principal financial statements inmany different ways. Financial statements like P&L account and Balance Sheetare prepared using accrual accounting principle. For instance, when a firm sellsits products, it is assumed that profit is realised. It is assumed as a going concern,the firm will eventually realise its profits. Similarly, the expenses incurred againstthe sale are assumed to have incurred or paid irrespective of the fact whethercash is paid or not. Interest expenses are charged against profit though it is anoutcome of financing decision. Several non-cash expenses like depreciation arealso charged against profit. On the other hand, cash flow statement is preparedon the principle for cash accounting concept. It is simply a summary of cashbook classified under three headings namely cash flow from operating, investingand financing activities. In a broad context, the cash flow from operating activitiesculls out all Profit and Loss Account entries of cash book (like sales, material,wages, etc.,) and summarise the same. The cash flow from investing activitiessummarises all the assets side entries like purchase of fixed assets, sale of fixedassets, etc., of cash book. Finally, the cash flow from financing activitiessummarises all the liability side entries like borrowing, repayment, fresh equity,etc. of cash book. The following table shows the Cash Flow Statement of acompany, which simply summarises the cash book entries under differentheadings, which are easily readable.
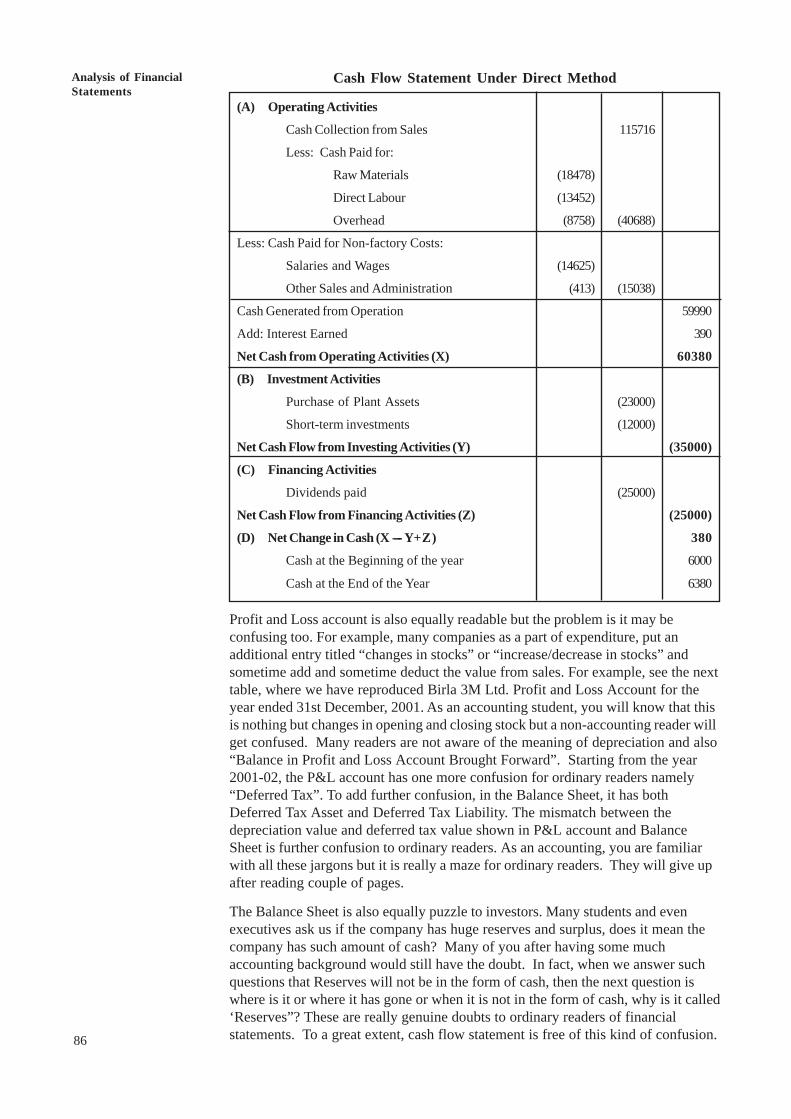
86
Analysis of FinancialStatements
Cash Flow Statement Under Direct Method
(A) Operating Activities
Cash Collection from Sales 115716
Less: Cash Paid for:
Raw Materials (18478)
Direct Labour (13452)
Overhead (8758) (40688)
Less: Cash Paid for Non-factory Costs:
Salaries and Wages (14625)
Other Sales and Administration (413) (15038)
Cash Generated from Operation 59990
Add: Interest Earned 390
Net Cash from Operating Activities (X) 60380
(B) Investment Activities
Purchase of Plant Assets (23000)
Short-term investments (12000)
Net Cash Flow from Investing Activities (Y) (35000)
(C) Financing Activities
Dividends paid (25000)
Net Cash Flow from Financing Activities (Z) (25000)
(D) Net Change in Cash (X ----- Y+Z) 380
Cash at the Beginning of the year 6000
Cash at the End of the Year 6380
Profit and Loss account is also equally readable but the problem is it may beconfusing too. For example, many companies as a part of expenditure, put anadditional entry titled “changes in stocks” or “increase/decrease in stocks” andsometime add and sometime deduct the value from sales. For example, see the nexttable, where we have reproduced Birla 3M Ltd. Profit and Loss Account for theyear ended 31st December, 2001. As an accounting student, you will know that thisis nothing but changes in opening and closing stock but a non-accounting reader willget confused. Many readers are not aware of the meaning of depreciation and also“Balance in Profit and Loss Account Brought Forward”. Starting from the year2001-02, the P&L account has one more confusion for ordinary readers namely“Deferred Tax”. To add further confusion, in the Balance Sheet, it has bothDeferred Tax Asset and Deferred Tax Liability. The mismatch between thedepreciation value and deferred tax value shown in P&L account and BalanceSheet is further confusion to ordinary readers. As an accounting, you are familiarwith all these jargons but it is really a maze for ordinary readers. They will give upafter reading couple of pages.
The Balance Sheet is also equally puzzle to investors. Many students and evenexecutives ask us if the company has huge reserves and surplus, does it mean thecompany has such amount of cash? Many of you after having some muchaccounting background would still have the doubt. In fact, when we answer suchquestions that Reserves will not be in the form of cash, then the next question iswhere is it or where it has gone or when it is not in the form of cash, why is it called‘Reserves”? These are really genuine doubts to ordinary readers of financialstatements. To a great extent, cash flow statement is free of this kind of confusion.
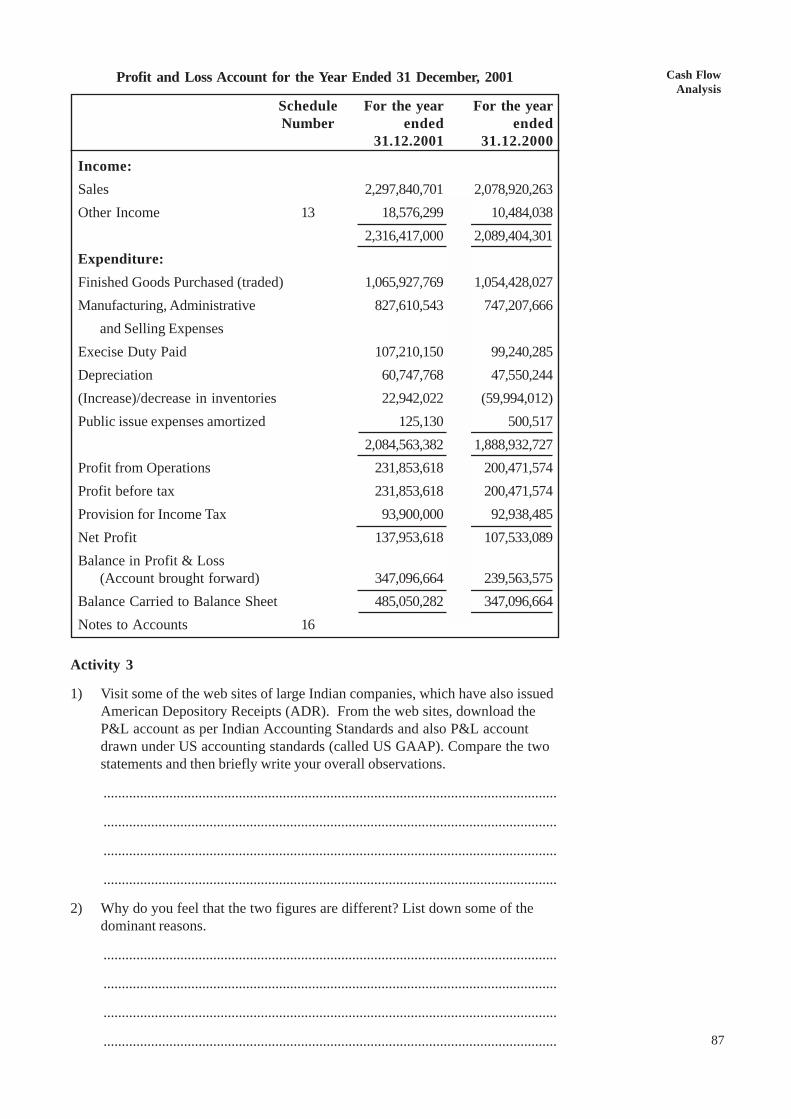
Cash FlowAnalysis
87
Profit and Loss Account for the Year Ended 31 December, 2001
Schedule For the year For the yearNumber ended ended
31.12.2001 31.12.2000
Income:Sales 2,297,840,701 2,078,920,263Other Income 13 18,576,299 10,484,038
2,316,417,000 2,089,404,301Expenditure:Finished Goods Purchased (traded) 1,065,927,769 1,054,428,027Manufacturing, Administrative 827,610,543 747,207,666
and Selling ExpensesExecise Duty Paid 107,210,150 99,240,285Depreciation 60,747,768 47,550,244(Increase)/decrease in inventories 22,942,022 (59,994,012)Public issue expenses amortized 125,130 500,517
2,084,563,382 1,888,932,727Profit from Operations 231,853,618 200,471,574Profit before tax 231,853,618 200,471,574Provision for Income Tax 93,900,000 92,938,485Net Profit 137,953,618 107,533,089Balance in Profit & Loss
(Account brought forward) 347,096,664 239,563,575Balance Carried to Balance Sheet 485,050,282 347,096,664Notes to Accounts 16
Activity 3
1) Visit some of the web sites of large Indian companies, which have also issuedAmerican Depository Receipts (ADR). From the web sites, download theP&L account as per Indian Accounting Standards and also P&L accountdrawn under US accounting standards (called US GAAP). Compare the twostatements and then briefly write your overall observations.
............................................................................................................................
............................................................................................................................
............................................................................................................................
............................................................................................................................
2) Why do you feel that the two figures are different? List down some of thedominant reasons.
............................................................................................................................
............................................................................................................................
............................................................................................................................
............................................................................................................................
88
Analysis of FinancialStatements
3) Now, you check the cash flow statement reported under two systems and list.
............................................................................................................................
............................................................................................................................
............................................................................................................................
7.4 CASH FLOW STATEMENTSIn the previous unit you have learnt that flow of funds means change in workingcapital. An inflow of funds increases the working capital. Under cash flowanalysis, all movements of cash, rather than the inflow and outflow of workingcapital would be considered. In other words, cash flow analysis, focuses attentionon cash instead of working capital. When the movements of cash (i.e., cash inflowand cash outflow) is depicted in a statement, it is called Cash Flow Statement. Thus,a cash flow statement summarises the causes of changes in cash position of abusiness between two balance sheet dates. The flow of cash may be inflow oroutflow. When cash inflows are more than the cash outflows, there would be anincrease in cash balance. On the other hand, if cash outflows are more than thecash inflows, there would be decrease in cash balance. The term cash includes bothcash and bank balances.
Availability cash, generally, determines the ability to meet the maturing obligations.If cash is not available and current obligations cannot be met, it may result intechnical insolvency. Therefore, it is very essential for a business to maintainadequate cash balance. A proper planning of the cash resources will enable themanagement to have cash available whenever needed and employes surplus cash, ifany, to the most profitable or productive use. For this purpose, we prepare cashflow statement which shows the sources and application during a year and theresultant effect on cash balance.
7.4.1 Sources and Uses of CashThe change in the cash position is computed by considering ‘Sources’ and‘Applications’ of cash which are as follows:
Sources of cash
The sources of cash includes:
1) Cash from Operations
2) Issue of Shares
3) Issue of Debentures
4) Long term Loans Raised
5) Sale of Fixed Assets
Application (uses) of cash
Application of cash includes the following:
1) Redumption of Preference Shares
2) Redumption of Debentures
3) Repayment of Loans
4) Purchase of Fixed Assets
5) Payment of Dividends
6) Payment of Taxes
Cash FlowAnalysis
89
7.4.2 Ascertaining Cash from OperationsYou have learnt that the main purpose of preparing a cash flow statement is toexplain the increase/decrease in the cash balance between the two balance sheetdates and that it is prepared on the same pattern as the fund flow statement. Justas the net profit is adjusted to ascertain the amount of funds from operations, thefunds from operations are now adjusted to ascertain the cash from operations. Forthis purpose, you have to look at the changes in current assets and current liabilitiesthat have taken place during the year.
Conversion of ‘Funds from Operations’ to ‘Cash from Operations’ is necessarybecause, under the working capital concept, funds from operations are based onaccrual concept of accounting, and total sales (whether credit or cash) and totalpurchases (whether credit or cash) are recognised as sources and uses of workingcapital respectively. But under a cash concept of funds only cash sales andreceipts from debtors are treated as sources of cash, while cash purchases andpayment to creditors are regarded as uses of cash. The same holds good for theother incomes and expenses. Therefore, funds from operations (based on theaccrual concept) require conversion into cash from operations (based on cashaccounting). For example, assume that a business was started on 1-1-2003 and thesales during the year were Rs. 3,00,000. Also assume that there were no closingdebtors. As there are no opening and closing debtors, it must be assumed that theentire amount of Rs. 3,00,000 was realised by way of cash. Now assume that theclosing debtors on 31-12-2003 were Rs. 40,000. This would mean that the entireamount of sales were not collected during the year. Since Rs. 40,000 (closingdebtors) was still to be realised, the cash from sales would be Rs. 2,60,000(Rs. 3,00,000 --- Rs. 40,000).
The closing debtors on 31-12-2003 would become opening debtors on 1-1-2004.Assume further that sales during 2004 were Rs. 4,00,000 and the closing debtors on31-12-2004 were Rs. 50,000. In that case, the cash received from sales during theyear 2004 be ascertained as follows:
Rs.Opening Debtors as on 1-1-2004 40,000Add : Sales during the year 4,00,000
4,40,000Less: Closing Debtors as on 31-12-2004 50,000
Cash from Sales during the year 3,90,000
The same result can also be obtained by subtracting the increase in debtors fromthe sales during the year as shown hereunder.
Sales during the year (2004) 4,00,000
Less: Increase in Debtors during the year(Closing debtors Rs. 50,000 ---- Opening debtors Rs. 40,000) 10,000
Cash from sales during the year 3,90,000
Cash from Operations can be calculated on the basis of the following equation:
Cash from Operations = Net profit + Opening Debtors at the beginning of theyear ---- Closing Debtors at the year end or
= Net Profit + Decrease in Debtors or
---- Increase in Debtors
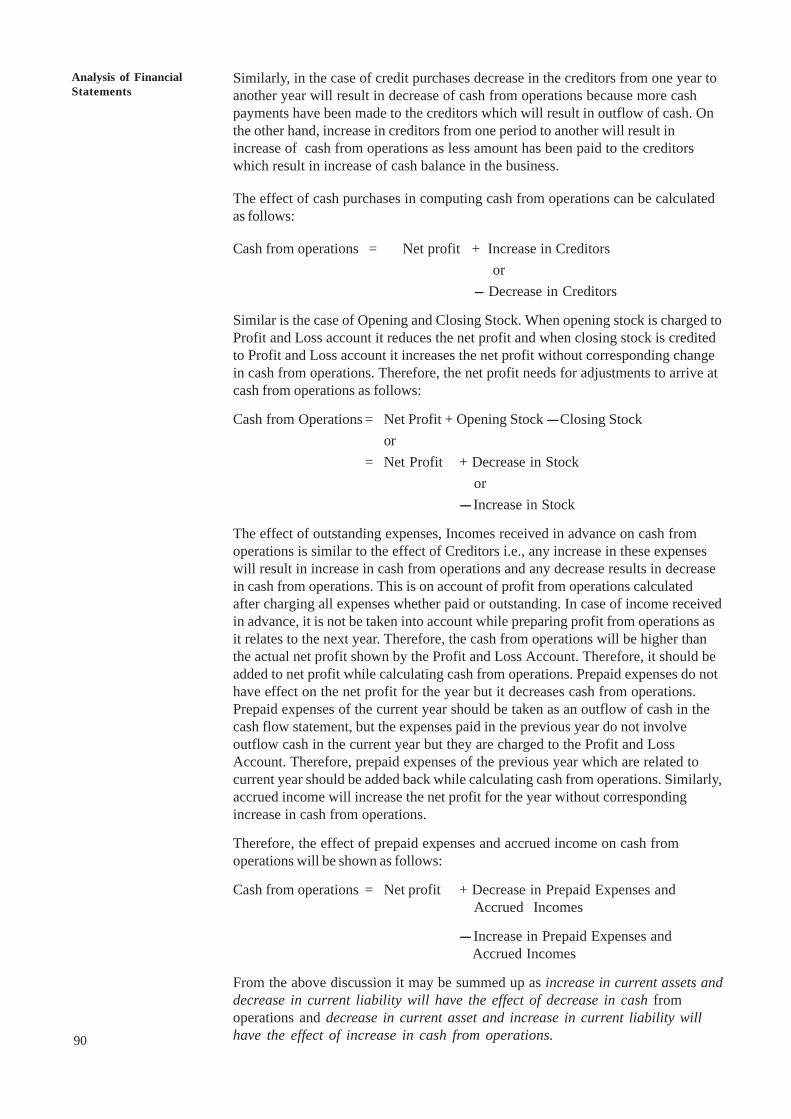
90
Analysis of FinancialStatements
Similarly, in the case of credit purchases decrease in the creditors from one year toanother year will result in decrease of cash from operations because more cashpayments have been made to the creditors which will result in outflow of cash. Onthe other hand, increase in creditors from one period to another will result inincrease of cash from operations as less amount has been paid to the creditorswhich result in increase of cash balance in the business.
The effect of cash purchases in computing cash from operations can be calculatedas follows:
Cash from operations = Net profit + Increase in Creditorsor
--- Decrease in Creditors
Similar is the case of Opening and Closing Stock. When opening stock is charged toProfit and Loss account it reduces the net profit and when closing stock is creditedto Profit and Loss account it increases the net profit without corresponding changein cash from operations. Therefore, the net profit needs for adjustments to arrive atcash from operations as follows:
Cash from Operations = Net Profit + Opening Stock ---- Closing Stockor
= Net Profit + Decrease in Stockor
---- Increase in Stock
The effect of outstanding expenses, Incomes received in advance on cash fromoperations is similar to the effect of Creditors i.e., any increase in these expenseswill result in increase in cash from operations and any decrease results in decreasein cash from operations. This is on account of profit from operations calculatedafter charging all expenses whether paid or outstanding. In case of income receivedin advance, it is not be taken into account while preparing profit from operations asit relates to the next year. Therefore, the cash from operations will be higher thanthe actual net profit shown by the Profit and Loss Account. Therefore, it should beadded to net profit while calculating cash from operations. Prepaid expenses do nothave effect on the net profit for the year but it decreases cash from operations.Prepaid expenses of the current year should be taken as an outflow of cash in thecash flow statement, but the expenses paid in the previous year do not involveoutflow cash in the current year but they are charged to the Profit and LossAccount. Therefore, prepaid expenses of the previous year which are related tocurrent year should be added back while calculating cash from operations. Similarly,accrued income will increase the net profit for the year without correspondingincrease in cash from operations.
Therefore, the effect of prepaid expenses and accrued income on cash fromoperations will be shown as follows:
Cash from operations = Net profit + Decrease in Prepaid Expenses andAccrued Incomes
---- Increase in Prepaid Expenses and Accrued Incomes
From the above discussion it may be summed up as increase in current assets anddecrease in current liability will have the effect of decrease in cash fromoperations and decrease in current asset and increase in current liability willhave the effect of increase in cash from operations.
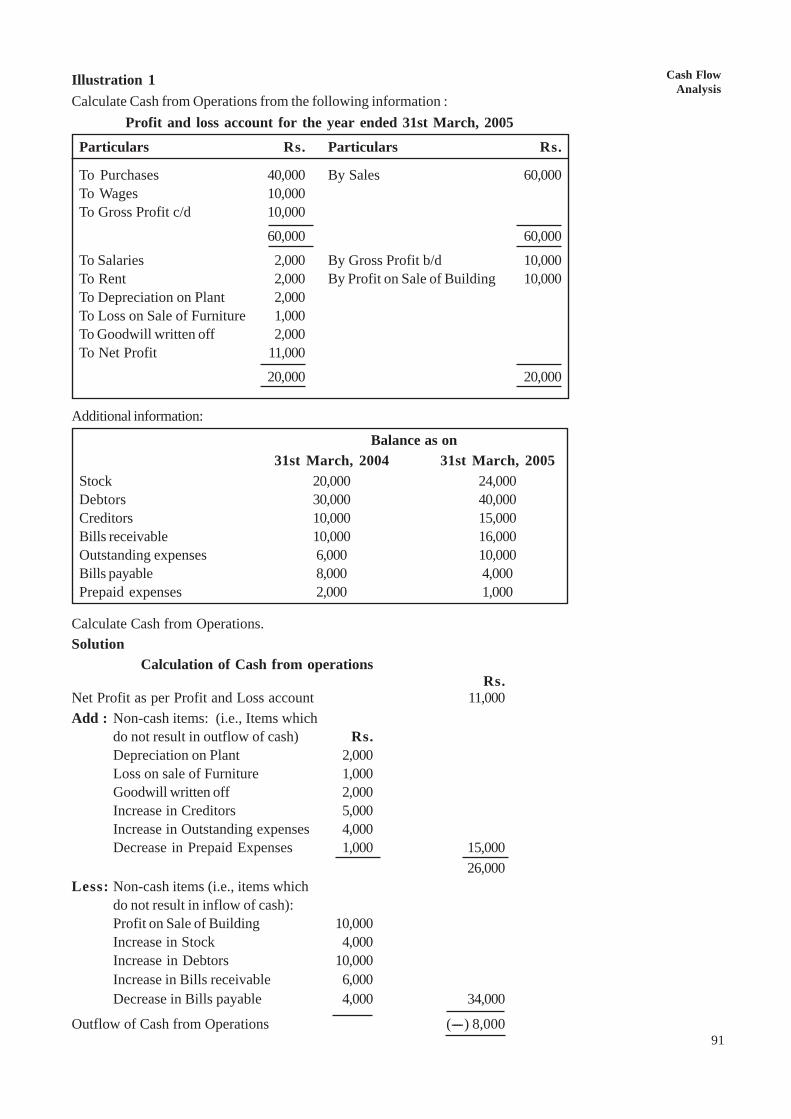
Cash FlowAnalysis
91
Illustration 1Calculate Cash from Operations from the following information :
Profit and loss account for the year ended 31st March, 2005
Particulars Rs. Particulars Rs.
To Purchases 40,000 By Sales 60,000To Wages 10,000To Gross Profit c/d 10,000
60,000 60,000
To Salaries 2,000 By Gross Profit b/d 10,000To Rent 2,000 By Profit on Sale of Building 10,000To Depreciation on Plant 2,000To Loss on Sale of Furniture 1,000To Goodwill written off 2,000To Net Profit 11,000
20,000 20,000
Additional information:
Balance as on31st March, 2004 31st March, 2005
Stock 20,000 24,000Debtors 30,000 40,000Creditors 10,000 15,000Bills receivable 10,000 16,000Outstanding expenses 6,000 10,000Bills payable 8,000 4,000Prepaid expenses 2,000 1,000
Calculate Cash from Operations.Solution
Calculation of Cash from operationsRs.
Net Profit as per Profit and Loss account 11,000Add : Non-cash items: (i.e., Items which
do not result in outflow of cash) Rs.Depreciation on Plant 2,000Loss on sale of Furniture 1,000Goodwill written off 2,000Increase in Creditors 5,000Increase in Outstanding expenses 4,000Decrease in Prepaid Expenses 1,000 15,000
26,000Less: Non-cash items (i.e., items which
do not result in inflow of cash):Profit on Sale of Building 10,000Increase in Stock 4,000Increase in Debtors 10,000Increase in Bills receivable 6,000Decrease in Bills payable 4,000 34,000
Outflow of Cash from Operations (----) 8,000
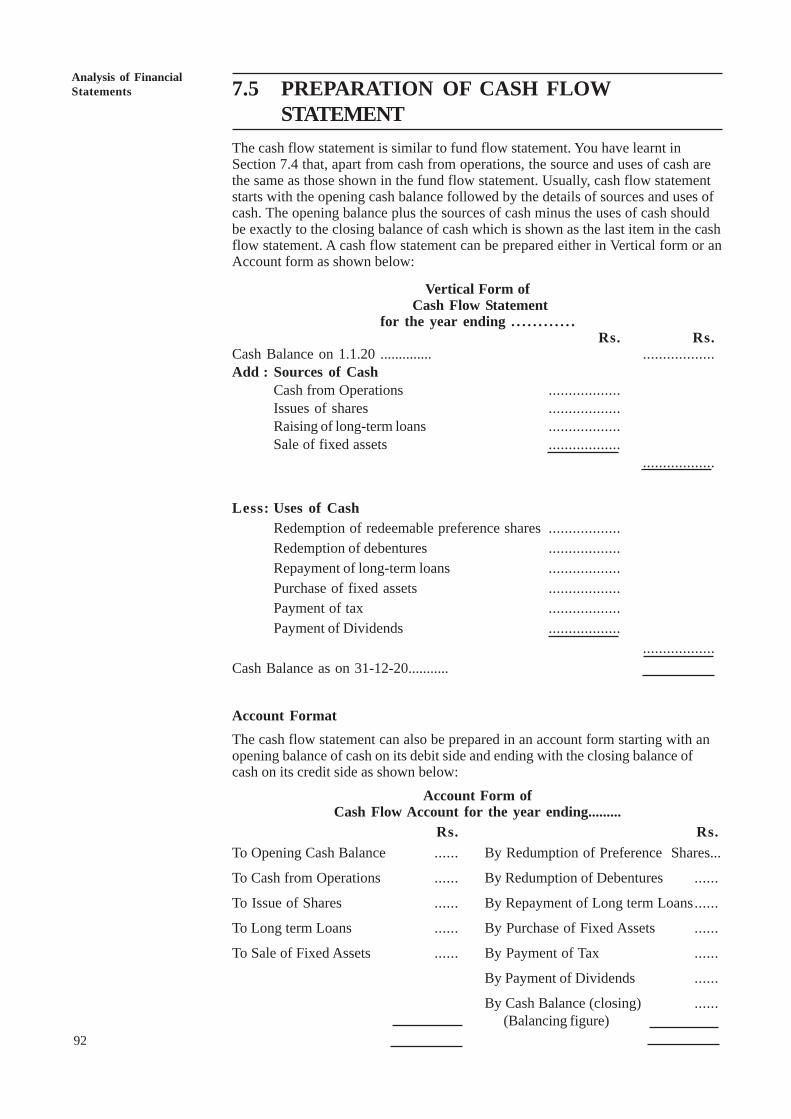
92
Analysis of FinancialStatements 7.5 PREPARATION OF CASH FLOW
STATEMENTThe cash flow statement is similar to fund flow statement. You have learnt inSection 7.4 that, apart from cash from operations, the source and uses of cash arethe same as those shown in the fund flow statement. Usually, cash flow statementstarts with the opening cash balance followed by the details of sources and uses ofcash. The opening balance plus the sources of cash minus the uses of cash shouldbe exactly to the closing balance of cash which is shown as the last item in the cashflow statement. A cash flow statement can be prepared either in Vertical form or anAccount form as shown below:
Vertical Form of Cash Flow Statement
for the year ending . . . . . . . . . . . .Rs. Rs.
Cash Balance on 1.1.20 .............. ..................Add : Sources of Cash
Cash from Operations ..................Issues of shares ..................Raising of long-term loans ..................Sale of fixed assets ..................
..................
Less: Uses of CashRedemption of redeemable preference shares ..................Redemption of debentures ..................Repayment of long-term loans ..................Purchase of fixed assets ..................Payment of tax ..................Payment of Dividends ..................
..................Cash Balance as on 31-12-20...........
Account FormatThe cash flow statement can also be prepared in an account form starting with anopening balance of cash on its debit side and ending with the closing balance ofcash on its credit side as shown below:
Account Form ofCash Flow Account for the year ending.........
Rs. Rs.To Opening Cash Balance ...... By Redumption of Preference Shares...
To Cash from Operations ...... By Redumption of Debentures ......
To Issue of Shares ...... By Repayment of Long term Loans......
To Long term Loans ...... By Purchase of Fixed Assets ......
To Sale of Fixed Assets ...... By Payment of Tax ......
By Payment of Dividends ......
By Cash Balance (closing) ......(Balancing figure)
Cash FlowAnalysis
93
7.6 REGULATIONS RELATING TO CASH FLOWSTATEMENT
Accounting standards in India are formulated by the Accounting Standards Board(ASB) of the Institute of Chartered Accountants of India (ICAI). ThoughInternational Accounting Standard Committee has revised the InternationalAccounting Standard-7 (IAS-7) in 1992 and switched over to cash flow statement,Accounting Standard-3 (AS-3) of ASB, which is equivalent to earlier IAS-7, was notrevised till 1997. In 1997, ASB of ICAI revised the AS-3 in line with revised IAS-7and issued an accounting standard on reporting cash flow information (see AS-3 fulltext given in http://www.icai.org.). However, this standard was not been mademandatory immediately in 1997. However, AS-3 was made mandatory for theaccounting period starting on or after 1st April 2001 for the following enterprises:
i) Enterprises whose equity or debt securities are listed on a recognised stockexchange in India, and enterprises that are in the process of issuing equity ordebt securities that will be listed on a recognised stock exchange in India asevidenced by the board of directors’ resolution in this regard.
ii) All other commercial, industrial and business reporting enterprises, whoseturnover for the accounting period exceeds Rs. 50 crore.
Since ASB of ICAI took a long time for the introduction of cash flow statement,the SEBI had formed a group consisting of representatives of SEBI, the StockExchanges, ICAI to frame the norms for incorporating Cash Flow Statement in theAnnual Reports of listed companies. The group has recommended cash flowstatement to be supplied by listed companies. SEBI, following the recommendationof the group, has instructed the Governing Board of all the Stock Exchanges toamend the Clause 32 of the Listing Agreement as follows:
“The company will supply a copy of the complete and full Balance Sheet, Profitand Loss Account and the Directors Report to each shareholder and uponapplication to any member of the exchange. The company will also give a CashFlow Statement along with Balance Sheet and Profit and Loss Account. TheCash Flow Statement will be prepared in accordance with the Annexureattached hereto”.
Cash Flow Statement, as a requirement in the Listing Agreement, has been madeeffective for the accounts prepared by the companies and listed entities from thefinancial year 1994-95. Cash Flow Statement, as a requirement of the ListingAgreement, has been made effective for the accounts prepared by the companieslisted in stock exchanges from the financial year 1994-95.
Activity 4
1) Read carefully the AS-3 given in http.//www.icai.org. Write in your own words,the objectives, scope and benefit of the Cash Flow Information.
..........................................................................................................................
..........................................................................................................................
..........................................................................................................................
..........................................................................................................................
94
Analysis of FinancialStatements
2) Download the cash flow statement of a company (visit the web site) for twoyears and read the statement carefully. Write your observation whether thebenefits stated in the AS-3 is actually true.
..........................................................................................................................
..........................................................................................................................
..........................................................................................................................
..........................................................................................................................
..........................................................................................................................
..........................................................................................................................
3) List down your difficulties in understanding cash flow statement given in theannual reports.
..........................................................................................................................
..........................................................................................................................
..........................................................................................................................
..........................................................................................................................
..........................................................................................................................
7.7 CASH FLOW STATEMENT FORMATS
The statement of cash flow requires restating of the information presented ona Balance Sheet but in flow format. The Balance Sheet is prepared bymeasuring the assets and liabilities at a point of time, usually as on March 31stof the year. In flow statements, whether it is funds flow or cash flow, wemeasure the changes in assets and liabilities during the period. For example,the liability side of the Balance Sheets contains so many items, which areessentially brought funds for the company. How much of cash is receivedunder each item or how much cash was given back on each item constituteone part of the cash flow statement. Similarly, cash flows on the assets sidesare also computed. The changes in retain earning part of the Balance Sheetactually reflect Profit and Loss Account. Cash Flow statement separatelycomputes cash generated and paid for various operating activities. Cash FlowStatement can be prepared in two ways. They are called direct and indirectmethod. Actually, these two methods differ on the part in which we computecash from operating activities. It may be noted that AS-3, IAS-7 and alsoFASB Statement No. 95 all recommend presentation of the direct method inthe primary statement though firms are allowed to use either method.However, companies normally provide the statement in indirect format and youwill shortly realise some of the reasons behind such practice. While directmethod logically summarises cash flow movement under broad operatingheads, indirect method works backward from Net profit and remove all non-cash income and expenses to get cash from operating activities. The formatused under these two methods are given below:
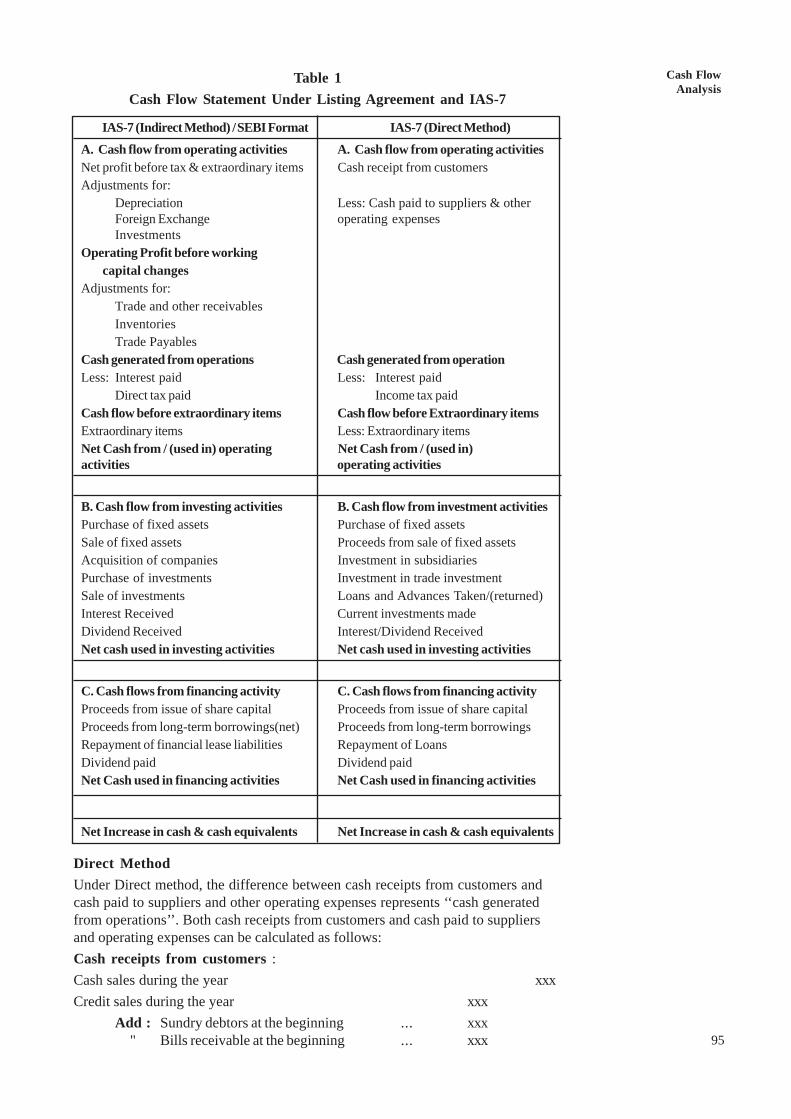
Cash FlowAnalysis
95
Table 1Cash Flow Statement Under Listing Agreement and IAS-7
IAS-7 (Indirect Method) /SEBI Format IAS-7 (Direct Method)A. Cash flow from operating activities A. Cash flow from operating activitiesNet profit before tax & extraordinary items Cash receipt from customersAdjustments for:
Depreciation Less: Cash paid to suppliers & otherForeign Exchange operating expensesInvestments
Operating Profit before working capital changesAdjustments for:
Trade and other receivablesInventoriesTrade Payables
Cash generated from operations Cash generated from operationLess: Interest paid Less: Interest paid
Direct tax paid Income tax paidCash flow before extraordinary items Cash flow before Extraordinary itemsExtraordinary items Less: Extraordinary itemsNet Cash from / (used in) operating Net Cash from / (used in)activities operating activities
B. Cash flow from investing activities B. Cash flow from investment activitiesPurchase of fixed assets Purchase of fixed assetsSale of fixed assets Proceeds from sale of fixed assetsAcquisition of companies Investment in subsidiariesPurchase of investments Investment in trade investmentSale of investments Loans and Advances Taken/(returned)Interest Received Current investments madeDividend Received Interest/Dividend ReceivedNet cash used in investing activities Net cash used in investing activities
C. Cash flows from financing activity C. Cash flows from financing activityProceeds from issue of share capital Proceeds from issue of share capitalProceeds from long-term borrowings(net) Proceeds from long-term borrowingsRepayment of financial lease liabilities Repayment of LoansDividend paid Dividend paidNet Cash used in financing activities Net Cash used in financing activities
Net Increase in cash & cash equivalents Net Increase in cash & cash equivalents
Direct MethodUnder Direct method, the difference between cash receipts from customers andcash paid to suppliers and other operating expenses represents ‘‘cash generatedfrom operations’’. Both cash receipts from customers and cash paid to suppliersand operating expenses can be calculated as follows:Cash receipts from customers :Cash sales during the year xxxCredit sales during the year xxx
Add : Sundry debtors at the beginning ... xxx " Bills receivable at the beginning ... xxx
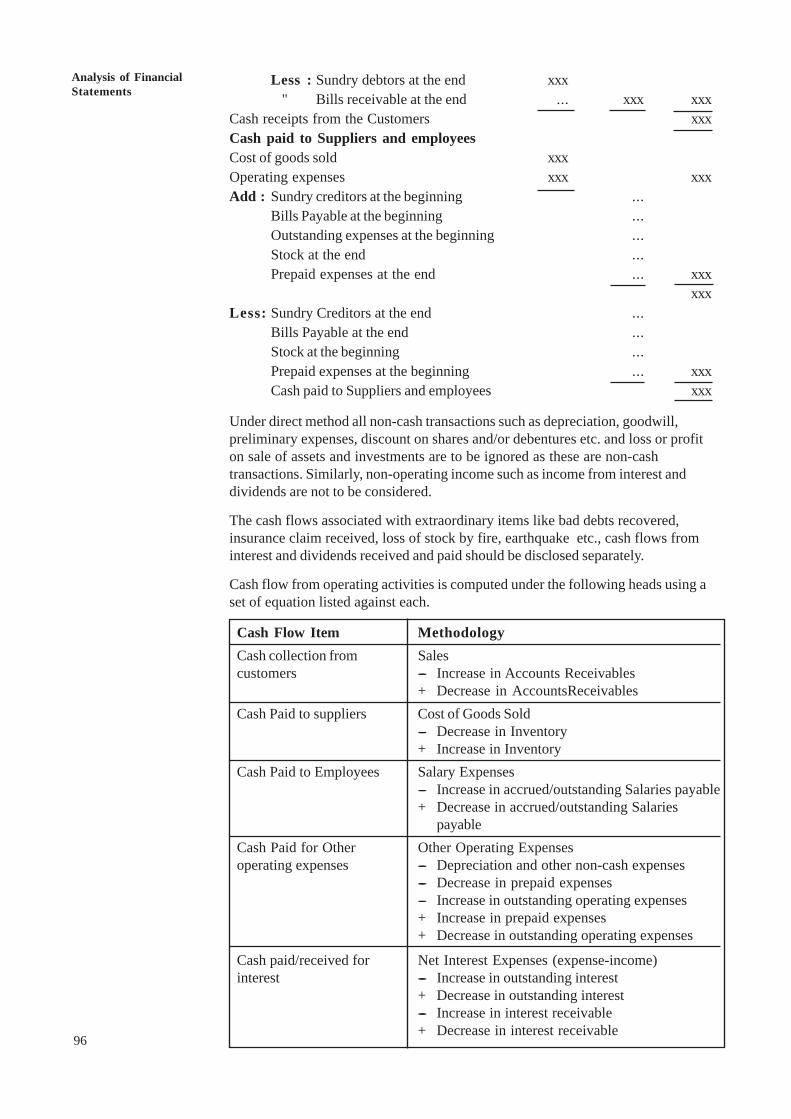
96
Analysis of FinancialStatements
Less : Sundry debtors at the end xxx " Bills receivable at the end ... xxx xxx
Cash receipts from the Customers xxxCash paid to Suppliers and employeesCost of goods sold xxxOperating expenses xxx xxxAdd : Sundry creditors at the beginning ...
Bills Payable at the beginning ...Outstanding expenses at the beginning ...Stock at the end ...Prepaid expenses at the end ... xxx
xxxLess: Sundry Creditors at the end ...
Bills Payable at the end ...Stock at the beginning ...Prepaid expenses at the beginning ... xxxCash paid to Suppliers and employees xxx
Under direct method all non-cash transactions such as depreciation, goodwill,preliminary expenses, discount on shares and/or debentures etc. and loss or profiton sale of assets and investments are to be ignored as these are non-cashtransactions. Similarly, non-operating income such as income from interest anddividends are not to be considered.
The cash flows associated with extraordinary items like bad debts recovered,insurance claim received, loss of stock by fire, earthquake etc., cash flows frominterest and dividends received and paid should be disclosed separately.
Cash flow from operating activities is computed under the following heads using aset of equation listed against each.
Cash Flow Item MethodologyCash collection from Salescustomers ---- Increase in Accounts Receivables
+ Decrease in AccountsReceivablesCash Paid to suppliers Cost of Goods Sold
---- Decrease in Inventory+ Increase in Inventory
Cash Paid to Employees Salary Expenses---- Increase in accrued/outstanding Salaries payable+ Decrease in accrued/outstanding Salaries
payableCash Paid for Other Other Operating Expensesoperating expenses ---- Depreciation and other non-cash expenses
---- Decrease in prepaid expenses---- Increase in outstanding operating expenses+ Increase in prepaid expenses+ Decrease in outstanding operating expenses
Cash paid/received for Net Interest Expenses (expense-income)interest ---- Increase in outstanding interest
+ Decrease in outstanding interest---- Increase in interest receivable+ Decrease in interest receivable
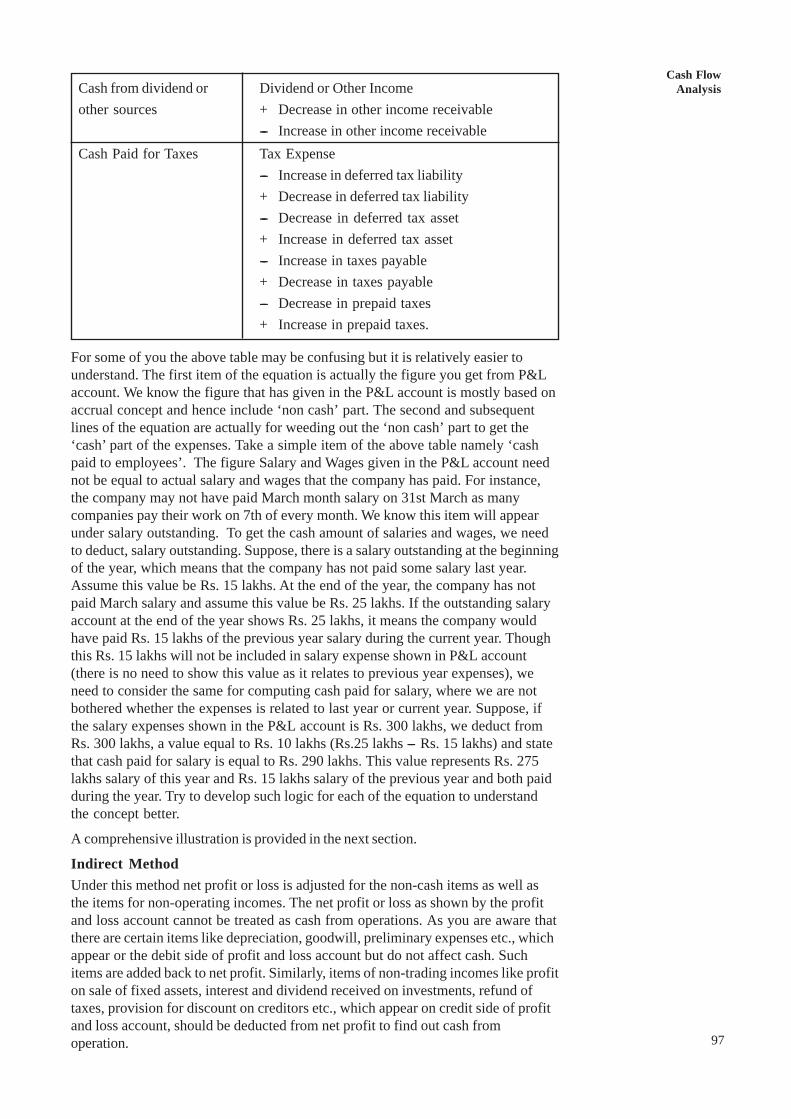
Cash FlowAnalysis
97
Cash from dividend or Dividend or Other Incomeother sources + Decrease in other income receivable
---- Increase in other income receivableCash Paid for Taxes Tax Expense
---- Increase in deferred tax liability+ Decrease in deferred tax liability---- Decrease in deferred tax asset+ Increase in deferred tax asset---- Increase in taxes payable+ Decrease in taxes payable---- Decrease in prepaid taxes+ Increase in prepaid taxes.
For some of you the above table may be confusing but it is relatively easier tounderstand. The first item of the equation is actually the figure you get from P&Laccount. We know the figure that has given in the P&L account is mostly based onaccrual concept and hence include ‘non cash’ part. The second and subsequentlines of the equation are actually for weeding out the ‘non cash’ part to get the‘cash’ part of the expenses. Take a simple item of the above table namely ‘cashpaid to employees’. The figure Salary and Wages given in the P&L account neednot be equal to actual salary and wages that the company has paid. For instance,the company may not have paid March month salary on 31st March as manycompanies pay their work on 7th of every month. We know this item will appearunder salary outstanding. To get the cash amount of salaries and wages, we needto deduct, salary outstanding. Suppose, there is a salary outstanding at the beginningof the year, which means that the company has not paid some salary last year.Assume this value be Rs. 15 lakhs. At the end of the year, the company has notpaid March salary and assume this value be Rs. 25 lakhs. If the outstanding salaryaccount at the end of the year shows Rs. 25 lakhs, it means the company wouldhave paid Rs. 15 lakhs of the previous year salary during the current year. Thoughthis Rs. 15 lakhs will not be included in salary expense shown in P&L account(there is no need to show this value as it relates to previous year expenses), weneed to consider the same for computing cash paid for salary, where we are notbothered whether the expenses is related to last year or current year. Suppose, ifthe salary expenses shown in the P&L account is Rs. 300 lakhs, we deduct fromRs. 300 lakhs, a value equal to Rs. 10 lakhs (Rs.25 lakhs --- Rs. 15 lakhs) and statethat cash paid for salary is equal to Rs. 290 lakhs. This value represents Rs. 275lakhs salary of this year and Rs. 15 lakhs salary of the previous year and both paidduring the year. Try to develop such logic for each of the equation to understandthe concept better.
A comprehensive illustration is provided in the next section.
Indirect MethodUnder this method net profit or loss is adjusted for the non-cash items as well asthe items for non-operating incomes. The net profit or loss as shown by the profitand loss account cannot be treated as cash from operations. As you are aware thatthere are certain items like depreciation, goodwill, preliminary expenses etc., whichappear or the debit side of profit and loss account but do not affect cash. Suchitems are added back to net profit. Similarly, items of non-trading incomes like profiton sale of fixed assets, interest and dividend received on investments, refund oftaxes, provision for discount on creditors etc., which appear on credit side of profitand loss account, should be deducted from net profit to find out cash fromoperation.
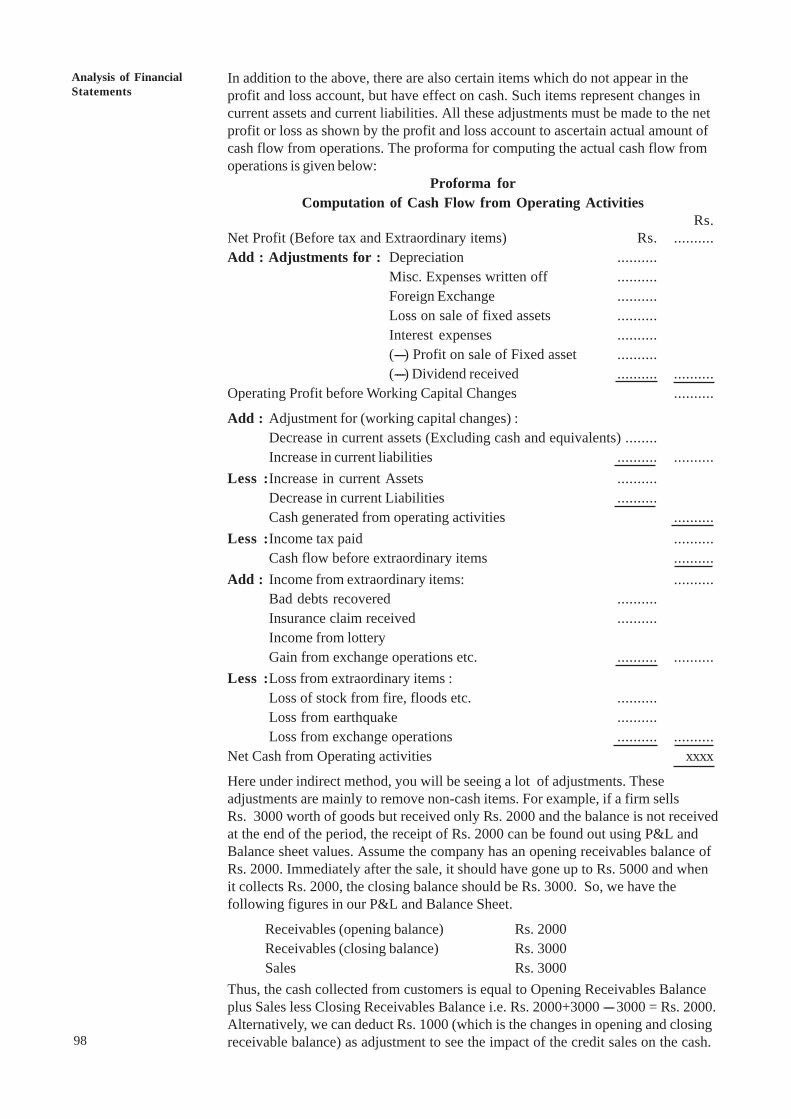
98
Analysis of FinancialStatements
In addition to the above, there are also certain items which do not appear in theprofit and loss account, but have effect on cash. Such items represent changes incurrent assets and current liabilities. All these adjustments must be made to the netprofit or loss as shown by the profit and loss account to ascertain actual amount ofcash flow from operations. The proforma for computing the actual cash flow fromoperations is given below:
Proforma forComputation of Cash Flow from Operating Activities
Rs.Net Profit (Before tax and Extraordinary items) Rs. ..........Add : Adjustments for : Depreciation ..........
Misc. Expenses written off ..........Foreign Exchange ..........Loss on sale of fixed assets ..........Interest expenses ..........(----) Profit on sale of Fixed asset ..........(----) Dividend received .......... ..........
Operating Profit before Working Capital Changes ..........
Add : Adjustment for (working capital changes) :Decrease in current assets (Excluding cash and equivalents) ........Increase in current liabilities .......... ..........
Less :Increase in current Assets ..........Decrease in current Liabilities ..........Cash generated from operating activities ..........
Less :Income tax paid ..........Cash flow before extraordinary items ..........
Add : Income from extraordinary items: ..........Bad debts recovered ..........Insurance claim received ..........Income from lotteryGain from exchange operations etc. .......... ..........
Less :Loss from extraordinary items :Loss of stock from fire, floods etc. ..........Loss from earthquake ..........Loss from exchange operations .......... ..........
Net Cash from Operating activities xxxx
Here under indirect method, you will be seeing a lot of adjustments. Theseadjustments are mainly to remove non-cash items. For example, if a firm sellsRs. 3000 worth of goods but received only Rs. 2000 and the balance is not receivedat the end of the period, the receipt of Rs. 2000 can be found out using P&L andBalance sheet values. Assume the company has an opening receivables balance ofRs. 2000. Immediately after the sale, it should have gone up to Rs. 5000 and whenit collects Rs. 2000, the closing balance should be Rs. 3000. So, we have thefollowing figures in our P&L and Balance Sheet.
Receivables (opening balance) Rs. 2000Receivables (closing balance) Rs. 3000Sales Rs. 3000
Thus, the cash collected from customers is equal to Opening Receivables Balanceplus Sales less Closing Receivables Balance i.e. Rs. 2000+3000 ---- 3000 = Rs. 2000.Alternatively, we can deduct Rs. 1000 (which is the changes in opening and closingreceivable balance) as adjustment to see the impact of the credit sales on the cash.
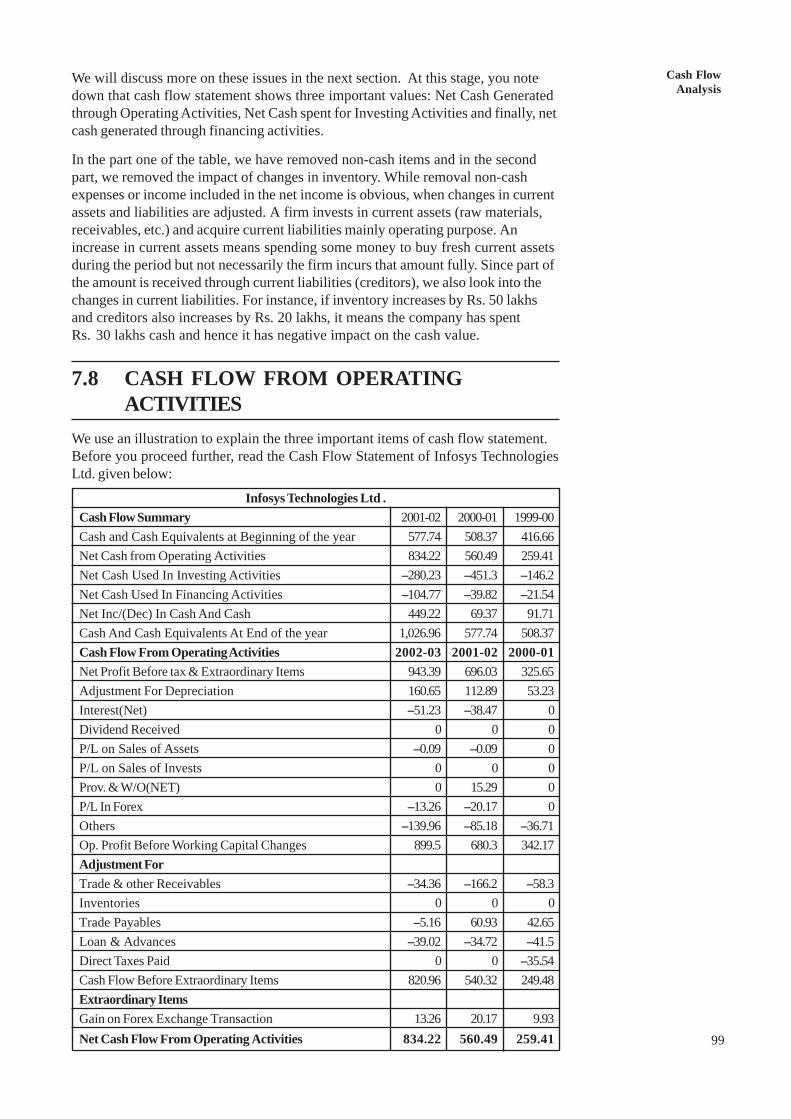
Cash FlowAnalysis
99
We will discuss more on these issues in the next section. At this stage, you notedown that cash flow statement shows three important values: Net Cash Generatedthrough Operating Activities, Net Cash spent for Investing Activities and finally, netcash generated through financing activities.
In the part one of the table, we have removed non-cash items and in the secondpart, we removed the impact of changes in inventory. While removal non-cashexpenses or income included in the net income is obvious, when changes in currentassets and liabilities are adjusted. A firm invests in current assets (raw materials,receivables, etc.) and acquire current liabilities mainly operating purpose. Anincrease in current assets means spending some money to buy fresh current assetsduring the period but not necessarily the firm incurs that amount fully. Since part ofthe amount is received through current liabilities (creditors), we also look into thechanges in current liabilities. For instance, if inventory increases by Rs. 50 lakhsand creditors also increases by Rs. 20 lakhs, it means the company has spentRs. 30 lakhs cash and hence it has negative impact on the cash value.
7.8 CASH FLOW FROM OPERATINGACTIVITIES
We use an illustration to explain the three important items of cash flow statement.Before you proceed further, read the Cash Flow Statement of Infosys TechnologiesLtd. given below:
Infosys Technologies Ltd .Cash Flow Summary 2001-02 2000-01 1999-00Cash and Cash Equivalents at Beginning of the year 577.74 508.37 416.66Net Cash from Operating Activities 834.22 560.49 259.41Net Cash Used In Investing Activities --280.23 --451.3 --146.2Net Cash Used In Financing Activities --104.77 --39.82 --21.54Net Inc/(Dec) In Cash And Cash 449.22 69.37 91.71Cash And Cash Equivalents At End of the year 1,026.96 577.74 508.37Cash Flow From Operating Activities 2002-03 2001-02 2000-01Net Profit Before tax & Extraordinary Items 943.39 696.03 325.65Adjustment For Depreciation 160.65 112.89 53.23Interest(Net) --51.23 --38.47 0Dividend Received 0 0 0P/L on Sales of Assets --0.09 --0.09 0P/L on Sales of Invests 0 0 0Prov. & W/O(NET) 0 15.29 0P/L In Forex --13.26 --20.17 0Others --139.96 --85.18 --36.71Op. Profit Before Working Capital Changes 899.5 680.3 342.17Adjustment ForTrade & other Receivables --34.36 --166.2 --58.3Inventories 0 0 0Trade Payables --5.16 60.93 42.65Loan & Advances --39.02 --34.72 --41.5Direct Taxes Paid 0 0 --35.54Cash Flow Before Extraordinary Items 820.96 540.32 249.48Extraordinary ItemsGain on Forex Exchange Transaction 13.26 20.17 9.93Net Cash Flow From Operating Activities 834.22 560.49 259.41
100
Analysis of FinancialStatements
The first part of the table shows the summary of Cash Flows of InfosysTechnologies Ltd. and the second part lists detail working of Net CashFlow Operating Activities. Infosys has generated Rs. 834.22 cr. during the year2001-02 through its operation against Rs. 560.49 cr. during the previous year.How this is comparable with the net profit figure? It is comparable for thiscompany since during the year 2001-02, the company reported a net profit valueof Rs. 807.96 cr. But it need not be true for other companies where the net profitand cash from operating activities may show substantial difference. For instance,Pentamedia Graphics Ltd. has reported a net profit of Rs. 98.75 cr. for the yearending March 2002 whereas for the same period, its cash flow from operatingactivities is a negative value of Rs. 360.88 cr. There could be several reasons forsuch wide difference between the reported book profit and cash flow fromoperating activities.
In the Infosys Cash Flow Statement, the first part of the adjustment is related toremoving non-cash expenses and income and the second part of adjustment isrelated to impact of changes in current assets and liabilities. In the third part, casharising out of extraordinary items is shown separately since the profit figure of thefirst line excludes such extraordinary items. In terms of relative importance, the partone adjustments are high value. While this may be true for companies like softwarewhere working capital is not high, the second component may be large formanufacturing companies. For instance, the cash flow statements of Cipla Ltd. forthe year ending 2002 shows an adjustment factor of Rs. 1.25 cr. (negative) for non-cash items against Rs. 183.13 cr. (negative) for working capital items. Theadjustments relating to extra-ordinary items is not a regular feature and in theCipla’s case, it has not shown any value in the last three years. An analysis ofcomponent of the three operating items shows further insight on where the cash isdrained. A year-to-year comparison also shows how much of additional amount isbeing pumped in each of these items. While such an analysis is possible withbalance sheets figures alone, an analysis on cash basis is much simpler and straightforward without any accounting principles and policies related issues. Increasingly,users of financial statement rely on cash flow statement for this reason.
Activity 5
1) Collect Cash Flow from Operations of few companies and examine how isrelated to Profit reported in P&L account?
..........................................................................................................................
..........................................................................................................................
..........................................................................................................................
..........................................................................................................................
..........................................................................................................................
2) Compare the each components of cash flow from operating activity over theperiod and record your observations here.
..........................................................................................................................
..........................................................................................................................
..........................................................................................................................
..........................................................................................................................
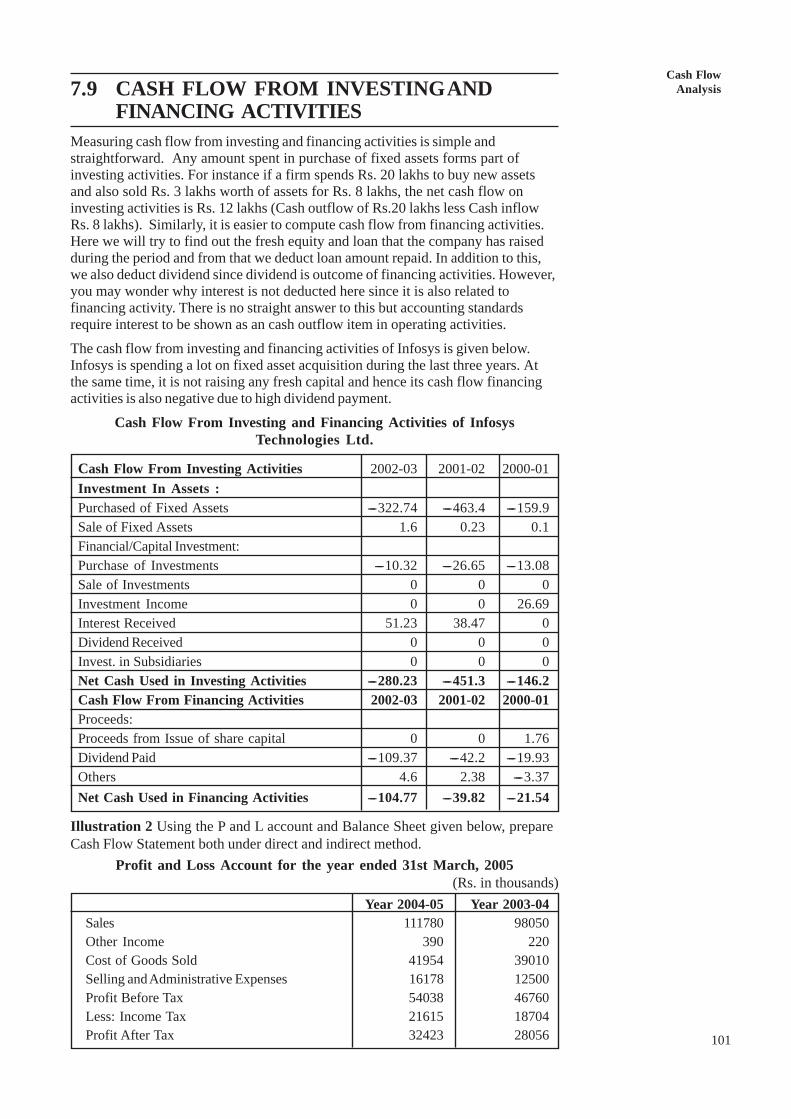
Cash FlowAnalysis
101
7.9 CASH FLOW FROM INVESTING ANDFINANCING ACTIVITIES
Measuring cash flow from investing and financing activities is simple andstraightforward. Any amount spent in purchase of fixed assets forms part ofinvesting activities. For instance if a firm spends Rs. 20 lakhs to buy new assetsand also sold Rs. 3 lakhs worth of assets for Rs. 8 lakhs, the net cash flow oninvesting activities is Rs. 12 lakhs (Cash outflow of Rs.20 lakhs less Cash inflowRs. 8 lakhs). Similarly, it is easier to compute cash flow from financing activities.Here we will try to find out the fresh equity and loan that the company has raisedduring the period and from that we deduct loan amount repaid. In addition to this,we also deduct dividend since dividend is outcome of financing activities. However,you may wonder why interest is not deducted here since it is also related tofinancing activity. There is no straight answer to this but accounting standardsrequire interest to be shown as an cash outflow item in operating activities.
The cash flow from investing and financing activities of Infosys is given below.Infosys is spending a lot on fixed asset acquisition during the last three years. Atthe same time, it is not raising any fresh capital and hence its cash flow financingactivities is also negative due to high dividend payment.
Cash Flow From Investing and Financing Activities of InfosysTechnologies Ltd.
Cash Flow From Investing Activities 2002-03 2001-02 2000-01Investment In Assets :Purchased of Fixed Assets ----322.74 ----463.4 ----159.9Sale of Fixed Assets 1.6 0.23 0.1Financial/Capital Investment:Purchase of Investments ----10.32 ----26.65 ----13.08Sale of Investments 0 0 0Investment Income 0 0 26.69Interest Received 51.23 38.47 0Dividend Received 0 0 0Invest. in Subsidiaries 0 0 0Net Cash Used in Investing Activities ----280.23 ----451.3 ----146.2Cash Flow From Financing Activities 2002-03 2001-02 2000-01Proceeds:Proceeds from Issue of share capital 0 0 1.76Dividend Paid ----109.37 ----42.2 ----19.93Others 4.6 2.38 ----3.37Net Cash Used in Financing Activities ----104.77 ----39.82 ----21.54
Illustration 2 Using the P and L account and Balance Sheet given below, prepareCash Flow Statement both under direct and indirect method.
Profit and Loss Account for the year ended 31st March, 2005 (Rs. in thousands)
Year 2004-05 Year 2003-04Sales 111780 98050Other Income 390 220Cost of Goods Sold 41954 39010Selling and Administrative Expenses 16178 12500Profit Before Tax 54038 46760Less: Income Tax 21615 18704Profit After Tax 32423 28056
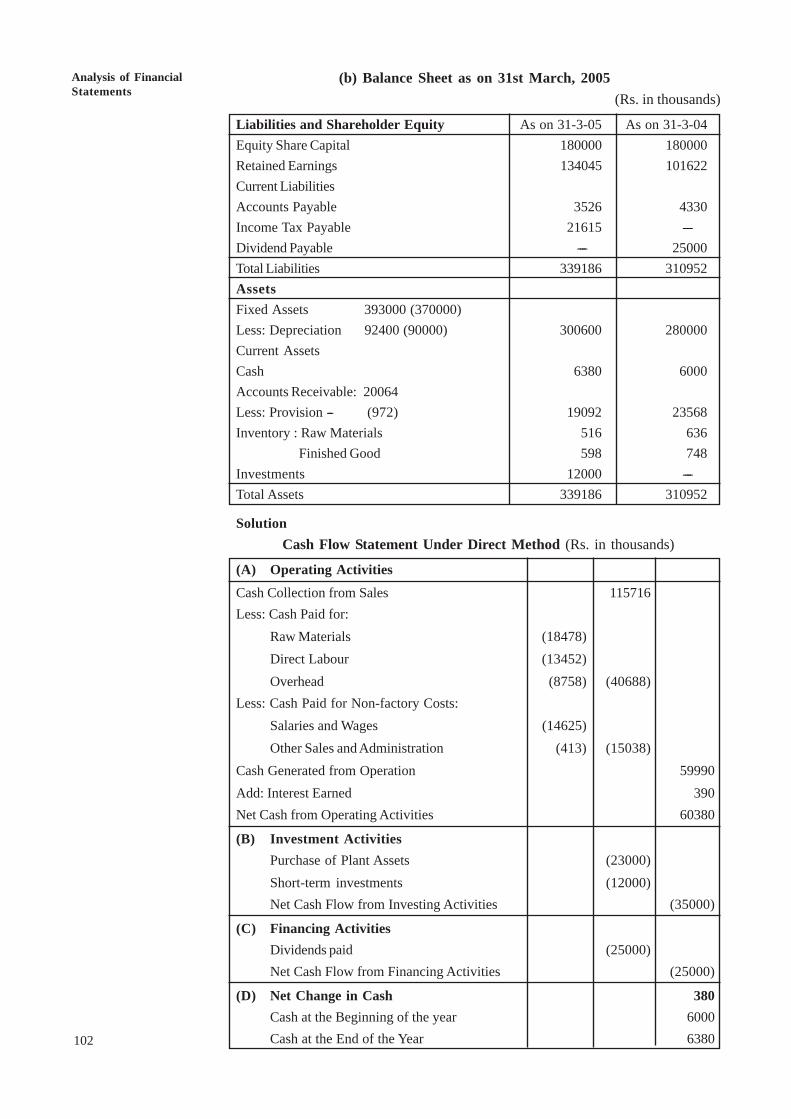
102
Analysis of FinancialStatements
(b) Balance Sheet as on 31st March, 2005(Rs. in thousands)
Liabilities and Shareholder Equity As on 31-3-05 As on 31-3-04Equity Share Capital 180000 180000Retained Earnings 134045 101622Current LiabilitiesAccounts Payable 3526 4330Income Tax Payable 21615 ----Dividend Payable ---- 25000Total Liabilities 339186 310952AssetsFixed Assets 393000 (370000)Less: Depreciation 92400 (90000) 300600 280000Current AssetsCash 6380 6000Accounts Receivable: 20064Less: Provision --- (972) 19092 23568Inventory : Raw Materials 516 636
Finished Good 598 748Investments 12000 ----Total Assets 339186 310952
SolutionCash Flow Statement Under Direct Method (Rs. in thousands)
(A) Operating ActivitiesCash Collection from Sales 115716Less: Cash Paid for:
Raw Materials (18478)Direct Labour (13452)Overhead (8758) (40688)
Less: Cash Paid for Non-factory Costs:Salaries and Wages (14625)Other Sales and Administration (413) (15038)
Cash Generated from Operation 59990Add: Interest Earned 390Net Cash from Operating Activities 60380
(B) Investment ActivitiesPurchase of Plant Assets (23000)Short-term investments (12000)Net Cash Flow from Investing Activities (35000)
(C) Financing ActivitiesDividends paid (25000)Net Cash Flow from Financing Activities (25000)
(D) Net Change in Cash 380Cash at the Beginning of the year 6000Cash at the End of the Year 6380
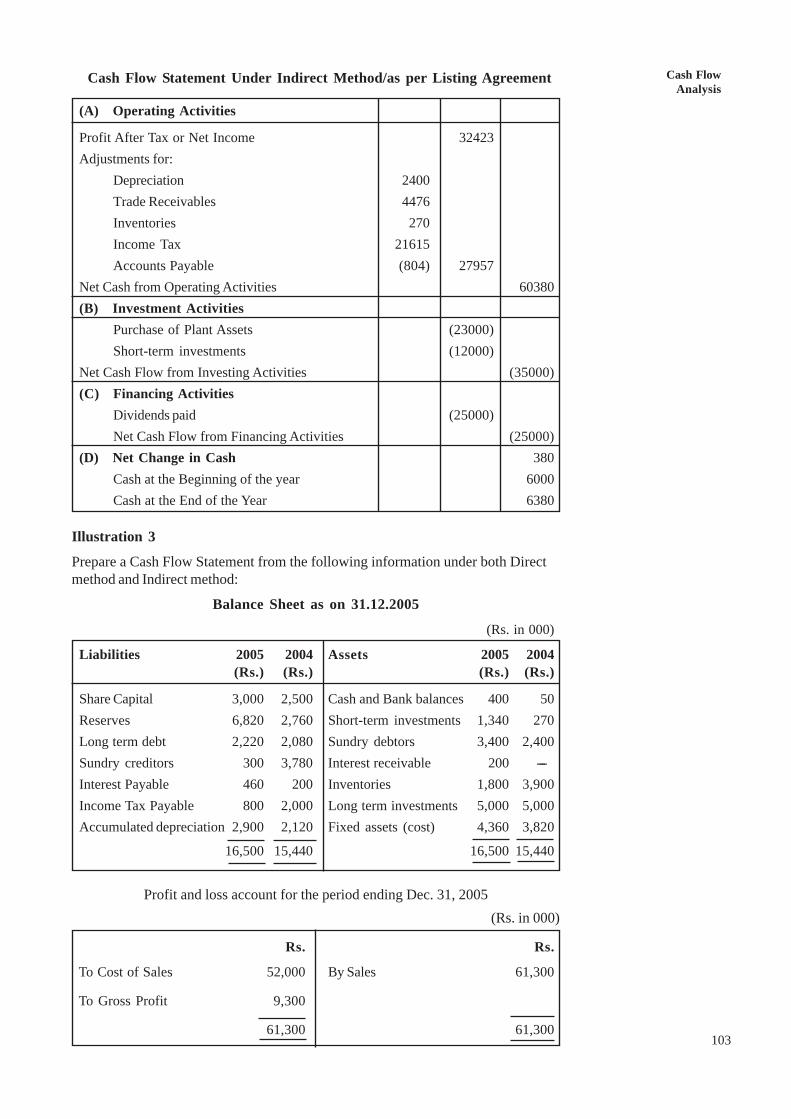
Cash FlowAnalysis
103
Cash Flow Statement Under Indirect Method/as per Listing Agreement
(A) Operating Activities
Profit After Tax or Net Income 32423Adjustments for:
Depreciation 2400Trade Receivables 4476Inventories 270Income Tax 21615Accounts Payable (804) 27957
Net Cash from Operating Activities 60380(B) Investment Activities
Purchase of Plant Assets (23000)Short-term investments (12000)
Net Cash Flow from Investing Activities (35000)(C) Financing Activities
Dividends paid (25000)Net Cash Flow from Financing Activities (25000)
(D) Net Change in Cash 380Cash at the Beginning of the year 6000Cash at the End of the Year 6380
Illustration 3
Prepare a Cash Flow Statement from the following information under both Directmethod and Indirect method:
Balance Sheet as on 31.12.2005
(Rs. in 000)
Liabilities 2005 2004 Assets 2005 2004(Rs.) (Rs.) (Rs.) (Rs.)
Share Capital 3,000 2,500 Cash and Bank balances 400 50Reserves 6,820 2,760 Short-term investments 1,340 270Long term debt 2,220 2,080 Sundry debtors 3,400 2,400Sundry creditors 300 3,780 Interest receivable 200 ----Interest Payable 460 200 Inventories 1,800 3,900Income Tax Payable 800 2,000 Long term investments 5,000 5,000Accumulated depreciation 2,900 2,120 Fixed assets (cost) 4,360 3,820
16,500 15,440 16,500 15,440
Profit and loss account for the period ending Dec. 31, 2005(Rs. in 000)
Rs. Rs.
To Cost of Sales 52,000 By Sales 61,300
To Gross Profit 9,300
61,300 61,300
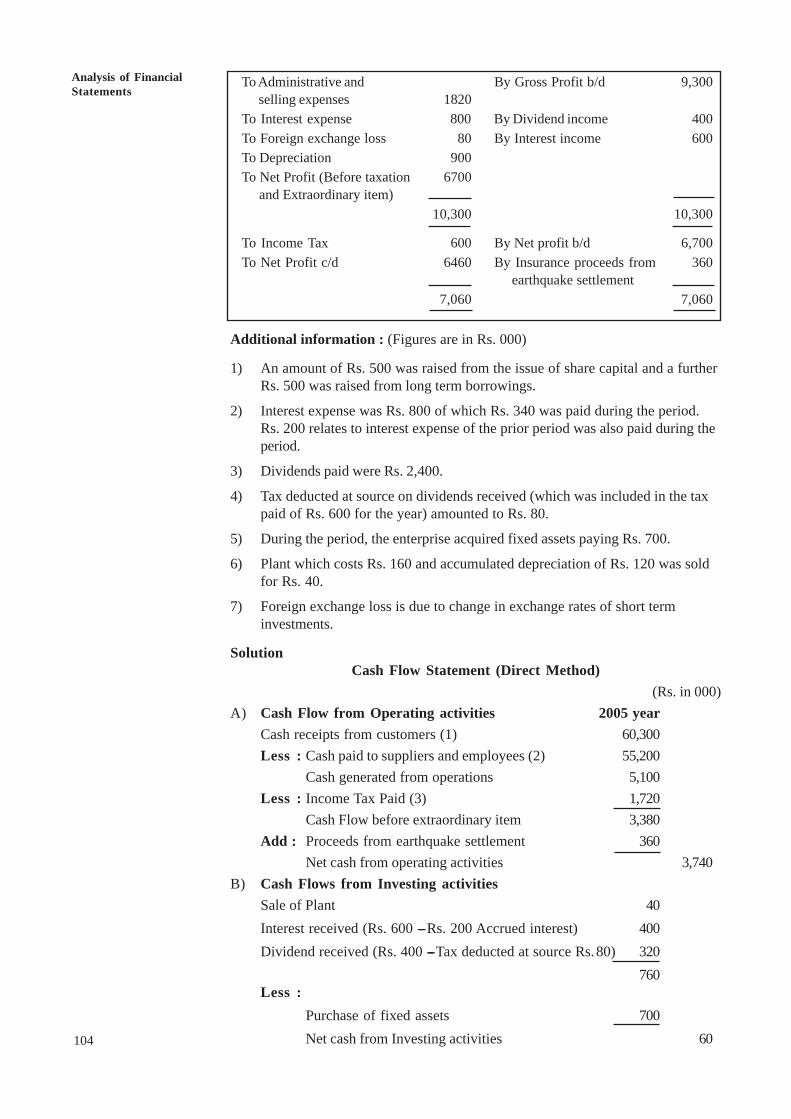
104
Analysis of FinancialStatements
To Administrative and By Gross Profit b/d 9,300 selling expenses 1820
To Interest expense 800 By Dividend income 400To Foreign exchange loss 80 By Interest income 600To Depreciation 900To Net Profit (Before taxation 6700
and Extraordinary item)10,300 10,300
To Income Tax 600 By Net profit b/d 6,700To Net Profit c/d 6460 By Insurance proceeds from 360
earthquake settlement7,060 7,060
Additional information : (Figures are in Rs. 000)
1) An amount of Rs. 500 was raised from the issue of share capital and a furtherRs. 500 was raised from long term borrowings.
2) Interest expense was Rs. 800 of which Rs. 340 was paid during the period.Rs. 200 relates to interest expense of the prior period was also paid during theperiod.
3) Dividends paid were Rs. 2,400.
4) Tax deducted at source on dividends received (which was included in the taxpaid of Rs. 600 for the year) amounted to Rs. 80.
5) During the period, the enterprise acquired fixed assets paying Rs. 700.
6) Plant which costs Rs. 160 and accumulated depreciation of Rs. 120 was soldfor Rs. 40.
7) Foreign exchange loss is due to change in exchange rates of short terminvestments.
SolutionCash Flow Statement (Direct Method)
(Rs. in 000)A) Cash Flow from Operating activities 2005 year
Cash receipts from customers (1) 60,300Less : Cash paid to suppliers and employees (2) 55,200
Cash generated from operations 5,100Less : Income Tax Paid (3) 1,720
Cash Flow before extraordinary item 3,380Add : Proceeds from earthquake settlement 360
Net cash from operating activities 3,740B) Cash Flows from Investing activities
Sale of Plant 40Interest received (Rs. 600 ---- Rs. 200 Accrued interest) 400Dividend received (Rs. 400 ---- Tax deducted at source Rs.80) 320
760Less :
Purchase of fixed assets 700Net cash from Investing activities 60
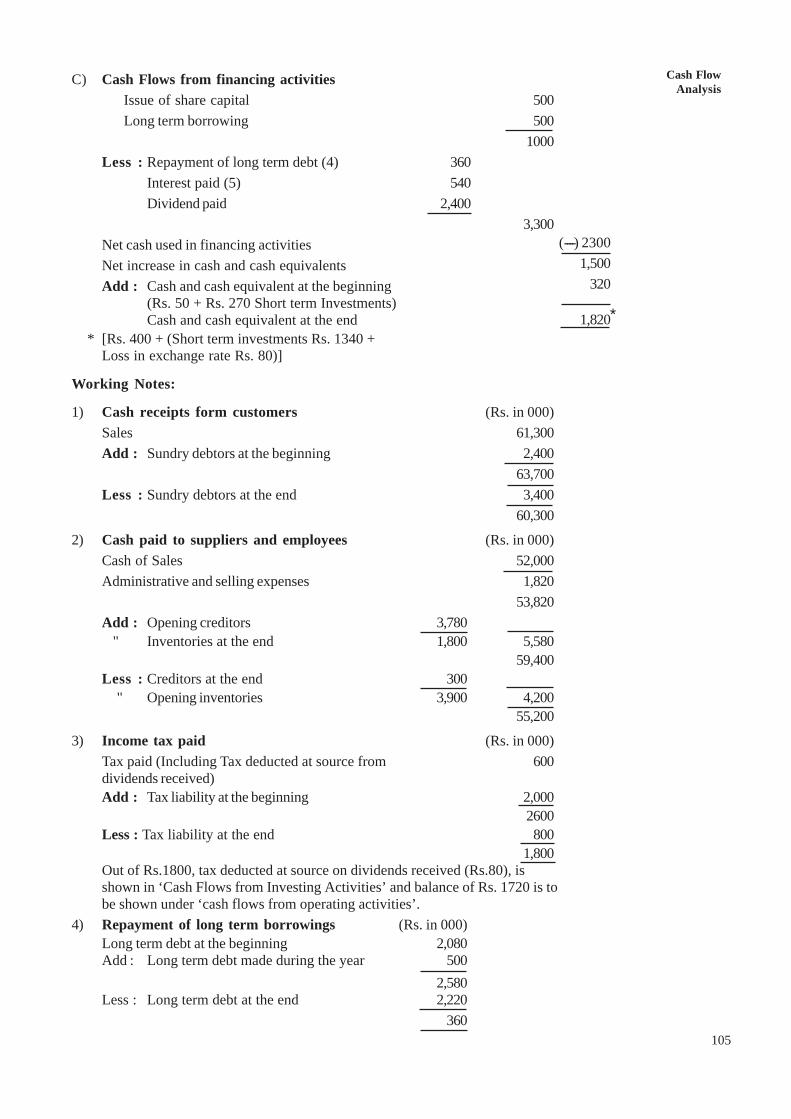
Cash FlowAnalysis
105
C) Cash Flows from financing activitiesIssue of share capital 500Long term borrowing 500
1000Less : Repayment of long term debt (4) 360
Interest paid (5) 540Dividend paid 2,400
3,300Net cash used in financing activitiesNet increase in cash and cash equivalentsAdd : Cash and cash equivalent at the beginning
(Rs. 50 + Rs. 270 Short term Investments)Cash and cash equivalent at the end
* [Rs. 400 + (Short term investments Rs. 1340 +Loss in exchange rate Rs. 80)]
Working Notes:
1) Cash receipts form customers (Rs. in 000)Sales 61,300Add : Sundry debtors at the beginning 2,400
63,700Less : Sundry debtors at the end 3,400
60,300
2) Cash paid to suppliers and employees (Rs. in 000)Cash of Sales 52,000Administrative and selling expenses 1,820
53,820Add : Opening creditors 3,780 " Inventories at the end 1,800 5,580
59,400Less : Creditors at the end 300 " Opening inventories 3,900 4,200
55,200
3) Income tax paid (Rs. in 000)Tax paid (Including Tax deducted at source from 600dividends received)Add : Tax liability at the beginning 2,000
2600Less : Tax liability at the end 800
1,800Out of Rs.1800, tax deducted at source on dividends received (Rs.80), isshown in ‘Cash Flows from Investing Activities’ and balance of Rs. 1720 is tobe shown under ‘cash flows from operating activities’.
4) Repayment of long term borrowings (Rs. in 000)Long term debt at the beginning 2,080Add : Long term debt made during the year 500
2,580Less : Long term debt at the end 2,220
360
*
(----) 23001,500
320
1,820
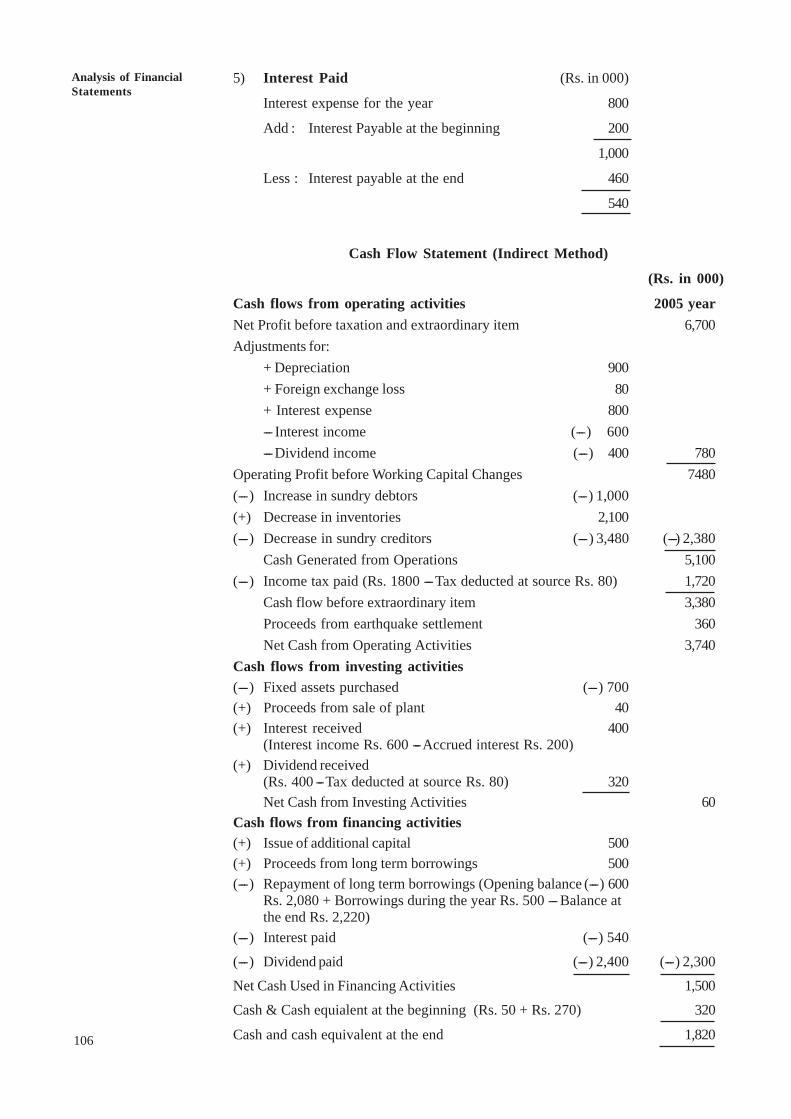
106
Analysis of FinancialStatements
5) Interest Paid (Rs. in 000)
Interest expense for the year 800
Add : Interest Payable at the beginning 200
1,000
Less : Interest payable at the end 460
540
Cash Flow Statement (Indirect Method)
(Rs. in 000)
Cash flows from operating activities 2005 yearNet Profit before taxation and extraordinary item 6,700Adjustments for:
+ Depreciation 900+ Foreign exchange loss 80+ Interest expense 800--- Interest income (---) 600--- Dividend income (---) 400 780
Operating Profit before Working Capital Changes 7480(---) Increase in sundry debtors (---) 1,000(+) Decrease in inventories 2,100(---) Decrease in sundry creditors (---) 3,480 (---) 2,380
Cash Generated from Operations 5,100(---) Income tax paid (Rs. 1800 --- Tax deducted at source Rs. 80) 1,720
Cash flow before extraordinary item 3,380Proceeds from earthquake settlement 360Net Cash from Operating Activities 3,740
Cash flows from investing activities(---) Fixed assets purchased (---) 700(+) Proceeds from sale of plant 40(+) Interest received 400
(Interest income Rs. 600 --- Accrued interest Rs. 200)(+) Dividend received
(Rs. 400 --- Tax deducted at source Rs. 80) 320Net Cash from Investing Activities 60
Cash flows from financing activities(+) Issue of additional capital 500(+) Proceeds from long term borrowings 500(---) Repayment of long term borrowings (Opening balance (---) 600
Rs. 2,080 + Borrowings during the year Rs. 500 --- Balance atthe end Rs. 2,220)
(---) Interest paid (---) 540
(---) Dividend paid (---) 2,400 (---) 2,300
Net Cash Used in Financing Activities 1,500
Cash & Cash equialent at the beginning (Rs. 50 + Rs. 270) 320
Cash and cash equivalent at the end 1,820
Cash FlowAnalysis
107
7.10 USES OF CASH FLOW STATEMENT
Cash flow statement is very useful to the financial management. It is used as a tool forfinancial analysis for short term planning.
The preparation of cash flow statement has several uses. The more important usesare as follows:
1) Changes in cash balance between two points of time and the contributing factorsfor such change are clearly revealed.
2) The cash flow statement explains the reasons for:
i) the presence of very low cash balance inspite of huge operating profits: or
ii) the presence of a higher cash balance inspite of a very low level of profits
3) Projected cash fow statements help the management in short-term planning andseveral other ways like:
i) Determination of additional cash requirements during a given period andmaking timely arrangements
ii) Identification of the size of surplus and the time for which such surplusfunds are likely to be available
iii) Judging the ability of the firm to repay/redeem debentures/preferencesshares.
iv) Examining the possibility of maintaining/increasing dividends
v) Assessing the capability of finance, replacement of fixed assets
vi) Assessing the capacity of the firm to finace expansion.
vii) More efficient and effective management of cash flows.
7.11 DISTINCTION BETWEEN CASH FLOWANALYSIS AND FUND FLOW ANALYSIS
Following are the major points of difference between cash flow analysis and fund flowanalysis:
1) Fund flow analysis deals with the change in working capital position between twobalance sheet dates, whereas the cash flow analysis is concerned with thechange in cash position.
2) Cash flow analysis is more useful as a tool in short-term financial planning,whereas fund flow analysis is more useful in long-term financial planning.
3) An increase in current liability or decrease in current asset (other than cash)results in an increase in cash whereas such changes result in decrease in the networking capital. Similarly, a decrease in any current liability or an increase incurrent asset (other than cash) results in a decrease in cash, whereas suchchanges increase the net working capital.
4) Cash flow statement recognises 'cash basis of accounting' where as funds flowstatement is based on accrual basis of accounting.
5) Cash flow analysis explains only the causes of cash variations, wheresas fundsflow analysis discloses the causes of overall working capital variations.
108
Analysis of FinancialStatements
Activity 6
1) Compute the changes in cash flow from operating activities of Infosysbetween Year 2001 & 2000 and 2002 & 2001.
...........................................................................................................................
...........................................................................................................................
...........................................................................................................................
...........................................................................................................................
2) Compute the changes in profit before taxes and depreciation of Infosysbetween Year 2001 & 2000 and 2002 & 2001.
...........................................................................................................................
...........................................................................................................................
...........................................................................................................................
...........................................................................................................................
3) Compare whether the profit changes are in line with the changes in cash flowfrom operating activities.
...........................................................................................................................
...........................................................................................................................
...........................................................................................................................
...........................................................................................................................
4) Repeat the above two steps for few companies and write your findings.
...........................................................................................................................
...........................................................................................................................
...........................................................................................................................
...........................................................................................................................
7.12 LET US SUM UPCash Flow Statement and cash flow analysis have assumed importanceparticularly when many companies have started adopting creative accountingand earnings management. Realising the needs of new users as well as others,regulating agencies have made reporting of cash flow statements mandatory.Cash flow statement is easy to understand and difficult to manipulate. Itprovides three important pieces of information on cash flow movements of thefirm --- how much cash is generated through operation, financing and how muchcash is spent for investment? It gives a clear and real picture about the internalactivities of the firm. There are two methods of preparation of cash flowstatements, namely direct and indirect method. While direct method gives moredetails on cash flow from operating activities and also reader-friendly, indirectmethod is more accounting oriented and fails to provide any additionalinformation. Unfortunately, many companies use indirect method though theaccounting standards allow both methods. This indirectly shows the eagernessof management to withhold information unless it is required by the regulation.Fortunately, the final figure is adequate to get good insight though additionalinformation will always be useful. Cash flow analysis are typically done bycomparing the changes in cash flow from operating activities from period to
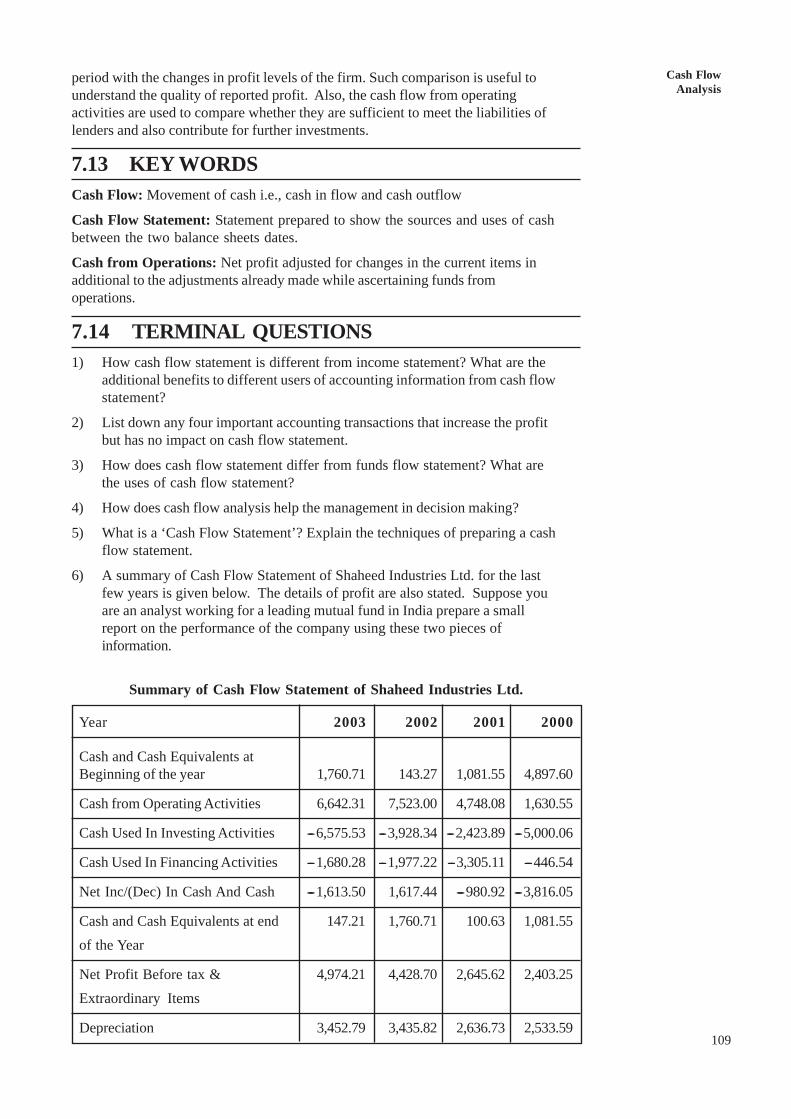
Cash FlowAnalysis
109
period with the changes in profit levels of the firm. Such comparison is useful tounderstand the quality of reported profit. Also, the cash flow from operatingactivities are used to compare whether they are sufficient to meet the liabilities oflenders and also contribute for further investments.
7.13 KEY WORDSCash Flow: Movement of cash i.e., cash in flow and cash outflow
Cash Flow Statement: Statement prepared to show the sources and uses of cashbetween the two balance sheets dates.
Cash from Operations: Net profit adjusted for changes in the current items inadditional to the adjustments already made while ascertaining funds fromoperations.
7.14 TERMINAL QUESTIONS1) How cash flow statement is different from income statement? What are the
additional benefits to different users of accounting information from cash flowstatement?
2) List down any four important accounting transactions that increase the profitbut has no impact on cash flow statement.
3) How does cash flow statement differ from funds flow statement? What arethe uses of cash flow statement?
4) How does cash flow analysis help the management in decision making?
5) What is a ‘Cash Flow Statement’? Explain the techniques of preparing a cashflow statement.
6) A summary of Cash Flow Statement of Shaheed Industries Ltd. for the lastfew years is given below. The details of profit are also stated. Suppose youare an analyst working for a leading mutual fund in India prepare a smallreport on the performance of the company using these two pieces ofinformation.
Summary of Cash Flow Statement of Shaheed Industries Ltd.
Year 2003 2002 2001 2000
Cash and Cash Equivalents atBeginning of the year 1,760.71 143.27 1,081.55 4,897.60
Cash from Operating Activities 6,642.31 7,523.00 4,748.08 1,630.55
Cash Used In Investing Activities ----6,575.53 ----3,928.34 ----2,423.89 ----5,000.06
Cash Used In Financing Activities ----1,680.28 ----1,977.22 ----3,305.11 ----446.54
Net Inc/(Dec) In Cash And Cash ----1,613.50 1,617.44 ----980.92 ----3,816.05
Cash and Cash Equivalents at end 147.21 1,760.71 100.63 1,081.55of the Year
Net Profit Before tax & 4,974.21 4,428.70 2,645.62 2,403.25Extraordinary Items
Depreciation 3,452.79 3,435.82 2,636.73 2,533.59
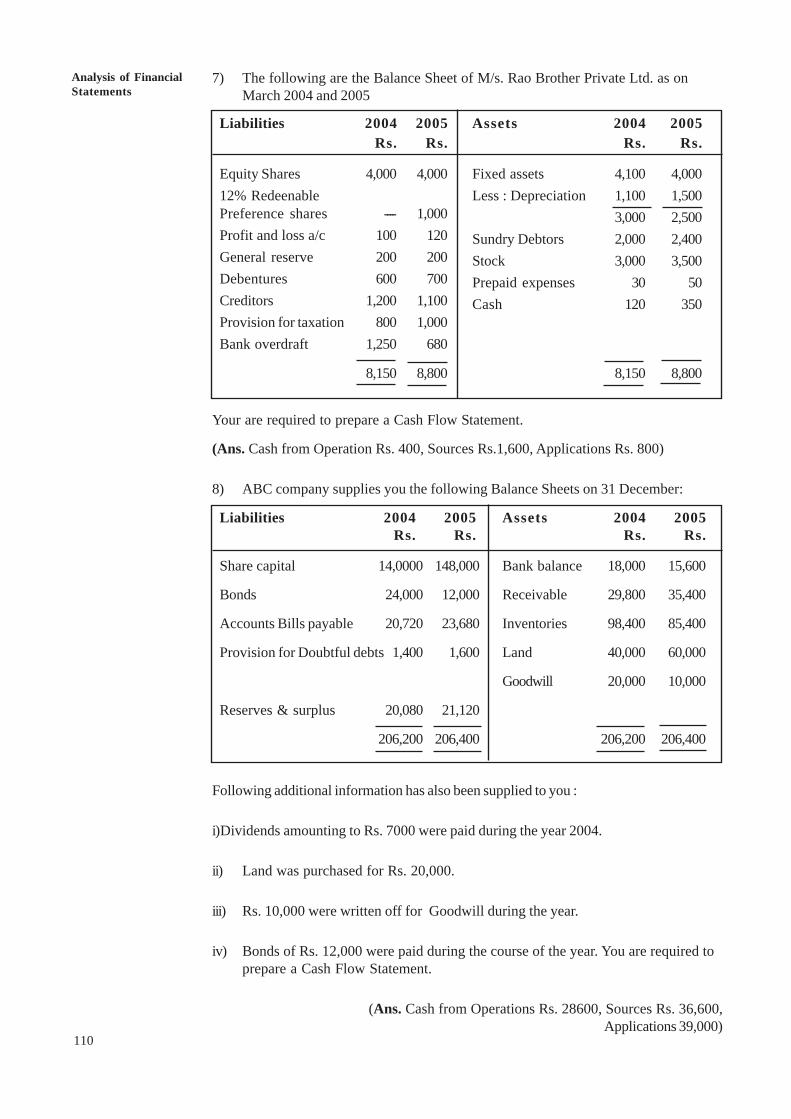
110
Analysis of FinancialStatements
7) The following are the Balance Sheet of M/s. Rao Brother Private Ltd. as onMarch 2004 and 2005
Liabilities 2004 2005 Assets 2004 2005Rs. Rs. Rs. Rs.
Equity Shares 4,000 4,000 Fixed assets 4,100 4,00012% Redeenable Less : Depreciation 1,100 1,500Preference shares ---- 1,000 3,000 2,500Profit and loss a/c 100 120 Sundry Debtors 2,000 2,400General reserve 200 200 Stock 3,000 3,500Debentures 600 700 Prepaid expenses 30 50Creditors 1,200 1,100 Cash 120 350Provision for taxation 800 1,000Bank overdraft 1,250 680
8,150 8,800 8,150 8,800
Your are required to prepare a Cash Flow Statement.
(Ans. Cash from Operation Rs. 400, Sources Rs.1,600, Applications Rs. 800)
8) ABC company supplies you the following Balance Sheets on 31 December:
Liabilities 2004 2005 Assets 2004 2005Rs. Rs. Rs. Rs.
Share capital 14,0000 148,000 Bank balance 18,000 15,600
Bonds 24,000 12,000 Receivable 29,800 35,400
Accounts Bills payable 20,720 23,680 Inventories 98,400 85,400
Provision for Doubtful debts 1,400 1,600 Land 40,000 60,000
Goodwill 20,000 10,000
Reserves & surplus 20,080 21,120
206,200 206,400 206,200 206,400
Following additional information has also been supplied to you :
i)Dividends amounting to Rs. 7000 were paid during the year 2004.
ii) Land was purchased for Rs. 20,000.
iii) Rs. 10,000 were written off for Goodwill during the year.
iv) Bonds of Rs. 12,000 were paid during the course of the year. You are required toprepare a Cash Flow Statement.
(Ans. Cash from Operations Rs. 28600, Sources Rs. 36,600,Applications 39,000)
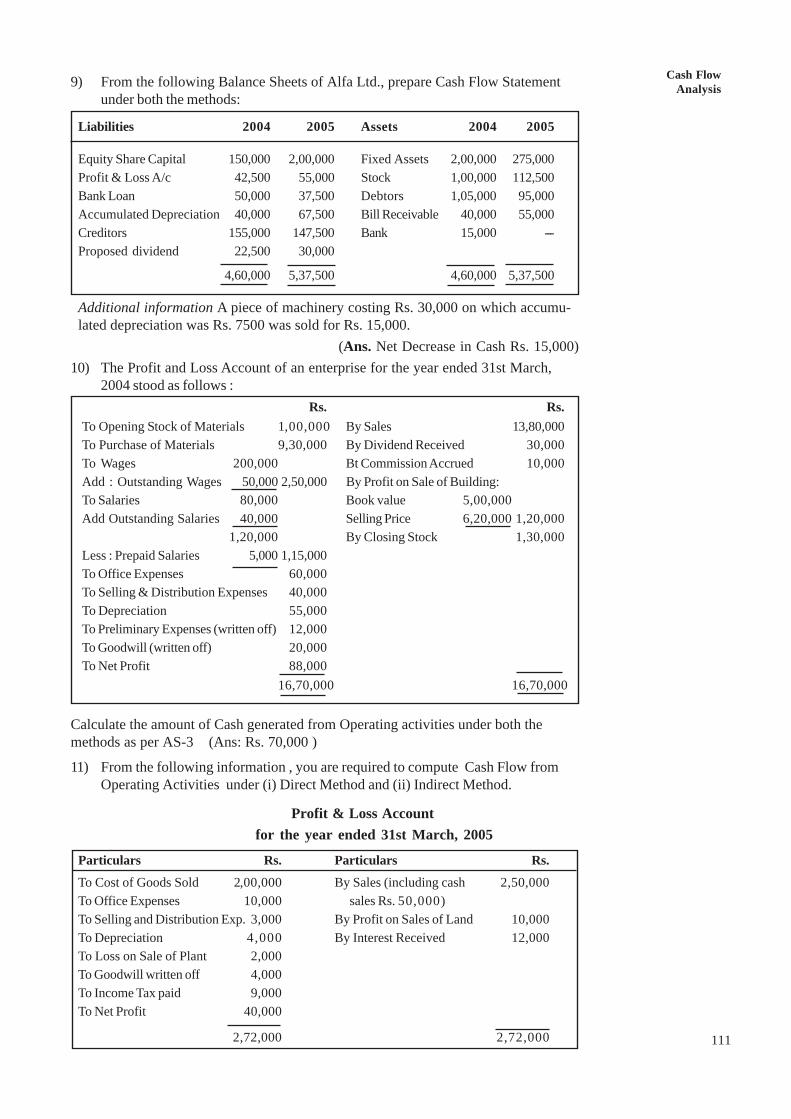
Cash FlowAnalysis
111
9) From the following Balance Sheets of Alfa Ltd., prepare Cash Flow Statementunder both the methods:
Liabilities 2004 2005 Assets 2004 2005
Equity Share Capital 150,000 2,00,000 Fixed Assets 2,00,000 275,000Profit & Loss A/c 42,500 55,000 Stock 1,00,000 112,500Bank Loan 50,000 37,500 Debtors 1,05,000 95,000Accumulated Depreciation 40,000 67,500 Bill Receivable 40,000 55,000Creditors 155,000 147,500 Bank 15,000 ---Proposed dividend 22,500 30,000
4,60,000 5,37,500 4,60,000 5,37,500
Additional information A piece of machinery costing Rs. 30,000 on which accumu-lated depreciation was Rs. 7500 was sold for Rs. 15,000.
(Ans. Net Decrease in Cash Rs. 15,000)10) The Profit and Loss Account of an enterprise for the year ended 31st March,
2004 stood as follows :Rs. Rs.
To Opening Stock of Materials 1,00,000 By Sales 13,80,000To Purchase of Materials 9,30,000 By Dividend Received 30,000To Wages 200,000 Bt Commission Accrued 10,000Add : Outstanding Wages 50,000 2,50,000 By Profit on Sale of Building:To Salaries 80,000 Book value 5,00,000Add Outstanding Salaries 40,000 Selling Price 6,20,000 1,20,000
1,20,000 By Closing Stock 1,30,000Less : Prepaid Salaries 5,000 1,15,000To Office Expenses 60,000To Selling & Distribution Expenses 40,000To Depreciation 55,000To Preliminary Expenses (written off) 12,000To Goodwill (written off) 20,000To Net Profit 88,000
16,70,000 16,70,000
Calculate the amount of Cash generated from Operating activities under both themethods as per AS-3 (Ans: Rs. 70,000 )
11) From the following information , you are required to compute Cash Flow fromOperating Activities under (i) Direct Method and (ii) Indirect Method.
Profit & Loss Accountfor the year ended 31st March, 2005
Particulars Rs. Particulars Rs.To Cost of Goods Sold 2,00,000 By Sales (including cash 2,50,000To Office Expenses 10,000 sales Rs. 50,000)To Selling and Distribution Exp. 3,000 By Profit on Sales of Land 10,000To Depreciation 4,000 By Interest Received 12,000To Loss on Sale of Plant 2,000To Goodwill written off 4,000To Income Tax paid 9,000To Net Profit 40,000
2,72,000 2,72,000
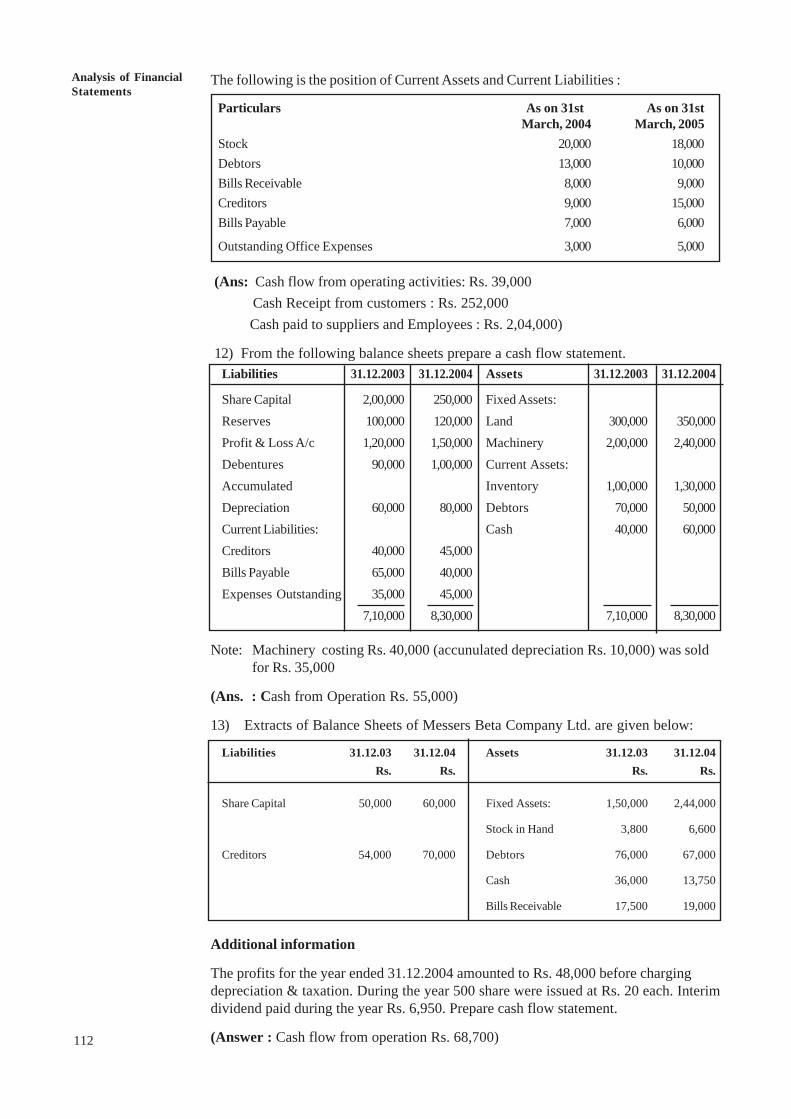
112
Analysis of FinancialStatements
The following is the position of Current Assets and Current Liabilities :
Particulars As on 31st As on 31stMarch, 2004 March, 2005
Stock 20,000 18,000Debtors 13,000 10,000Bills Receivable 8,000 9,000Creditors 9,000 15,000Bills Payable 7,000 6,000
Outstanding Office Expenses 3,000 5,000
(Ans: Cash flow from operating activities: Rs. 39,000 Cash Receipt from customers : Rs. 252,000 Cash paid to suppliers and Employees : Rs. 2,04,000)
12) From the following balance sheets prepare a cash flow statement.Liabilities 31.12.2003 31.12.2004 Assets 31.12.2003 31.12.2004
Share Capital 2,00,000 250,000 Fixed Assets:Reserves 100,000 120,000 Land 300,000 350,000Profit & Loss A/c 1,20,000 1,50,000 Machinery 2,00,000 2,40,000Debentures 90,000 1,00,000 Current Assets:Accumulated Inventory 1,00,000 1,30,000Depreciation 60,000 80,000 Debtors 70,000 50,000Current Liabilities: Cash 40,000 60,000Creditors 40,000 45,000Bills Payable 65,000 40,000Expenses Outstanding 35,000 45,000
7,10,000 8,30,000 7,10,000 8,30,000
Note: Machinery costing Rs. 40,000 (accunulated depreciation Rs. 10,000) was soldfor Rs. 35,000
(Ans. : Cash from Operation Rs. 55,000)
13) Extracts of Balance Sheets of Messers Beta Company Ltd. are given below:
Liabilities 31.12.03 31.12.04 Assets 31.12.03 31.12.04Rs. Rs. Rs. Rs.
Share Capital 50,000 60,000 Fixed Assets: 1,50,000 2,44,000
Stock in Hand 3,800 6,600
Creditors 54,000 70,000 Debtors 76,000 67,000
Cash 36,000 13,750
Bills Receivable 17,500 19,000
Additional information
The profits for the year ended 31.12.2004 amounted to Rs. 48,000 before chargingdepreciation & taxation. During the year 500 share were issued at Rs. 20 each. Interimdividend paid during the year Rs. 6,950. Prepare cash flow statement.
(Answer : Cash flow from operation Rs. 68,700)
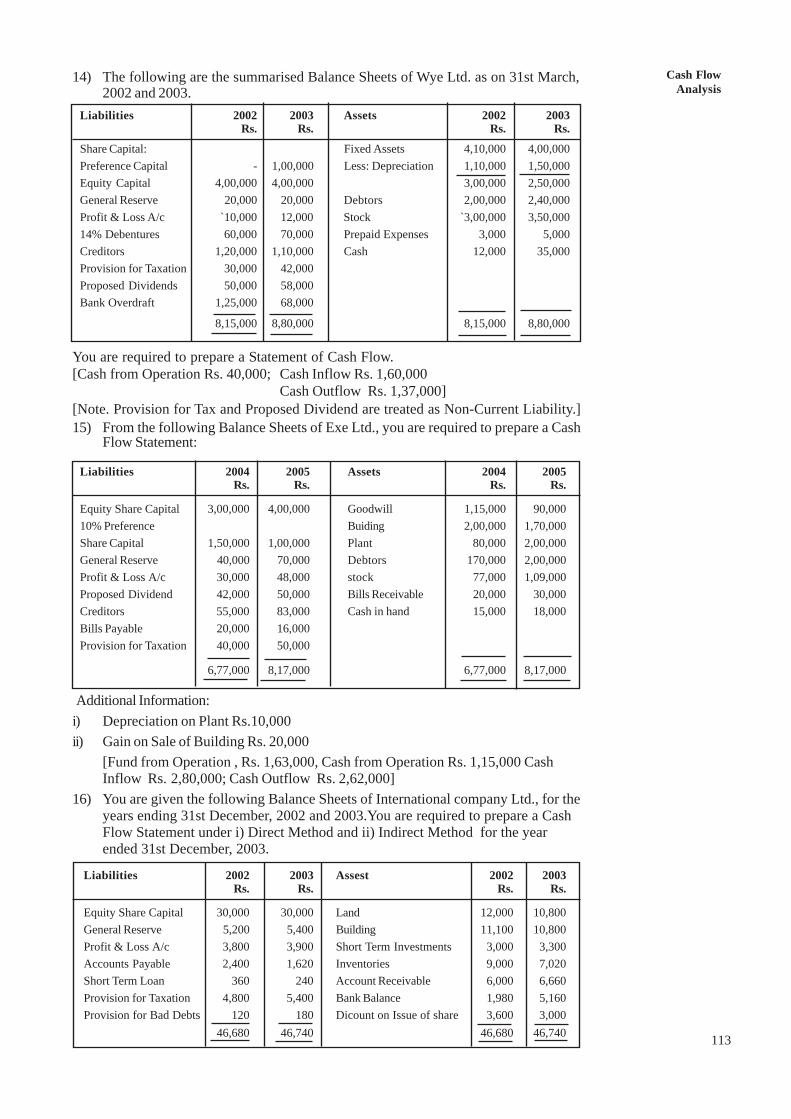
Cash FlowAnalysis
113
14) The following are the summarised Balance Sheets of Wye Ltd. as on 31st March,2002 and 2003.
Liabilities 2002 2003 Assets 2002 2003Rs. Rs. Rs. Rs.
Share Capital: Fixed Assets 4,10,000 4,00,000Preference Capital - 1,00,000 Less: Depreciation 1,10,000 1,50,000Equity Capital 4,00,000 4,00,000 3,00,000 2,50,000General Reserve 20,000 20,000 Debtors 2,00,000 2,40,000Profit & Loss A/c `10,000 12,000 Stock `3,00,000 3,50,00014% Debentures 60,000 70,000 Prepaid Expenses 3,000 5,000Creditors 1,20,000 1,10,000 Cash 12,000 35,000Provision for Taxation 30,000 42,000Proposed Dividends 50,000 58,000Bank Overdraft 1,25,000 68,000
8,15,000 8,80,000 8,15,000 8,80,000
You are required to prepare a Statement of Cash Flow.[Cash from Operation Rs. 40,000; Cash Inflow Rs. 1,60,000
Cash Outflow Rs. 1,37,000][Note. Provision for Tax and Proposed Dividend are treated as Non-Current Liability.]15) From the following Balance Sheets of Exe Ltd., you are required to prepare a Cash
Flow Statement:
Liabilities 2004 2005 Assets 2004 2005Rs. Rs. Rs. Rs.
Equity Share Capital 3,00,000 4,00,000 Goodwill 1,15,000 90,00010% Preference Buiding 2,00,000 1,70,000Share Capital 1,50,000 1,00,000 Plant 80,000 2,00,000General Reserve 40,000 70,000 Debtors 170,000 2,00,000Profit & Loss A/c 30,000 48,000 stock 77,000 1,09,000Proposed Dividend 42,000 50,000 Bills Receivable 20,000 30,000Creditors 55,000 83,000 Cash in hand 15,000 18,000Bills Payable 20,000 16,000Provision for Taxation 40,000 50,000
6,77,000 8,17,000 6,77,000 8,17,000
Additional Information:i) Depreciation on Plant Rs.10,000ii) Gain on Sale of Building Rs. 20,000
[Fund from Operation , Rs. 1,63,000, Cash from Operation Rs. 1,15,000 CashInflow Rs. 2,80,000; Cash Outflow Rs. 2,62,000]
16) You are given the following Balance Sheets of International company Ltd., for theyears ending 31st December, 2002 and 2003.You are required to prepare a CashFlow Statement under i) Direct Method and ii) Indirect Method for the yearended 31st December, 2003.
Liabilities 2002 2003 Assest 2002 2003Rs. Rs. Rs. Rs.
Equity Share Capital 30,000 30,000 Land 12,000 10,800General Reserve 5,200 5,400 Building 11,100 10,800Profit & Loss A/c 3,800 3,900 Short Term Investments 3,000 3,300Accounts Payable 2,400 1,620 Inventories 9,000 7,020Short Term Loan 360 240 Account Receivable 6,000 6,660Provision for Taxation 4,800 5,400 Bank Balance 1,980 5,160Provision for Bad Debts 120 180 Dicount on Issue of share 3,600 3,000
46,680 46,740 46,680 46,740
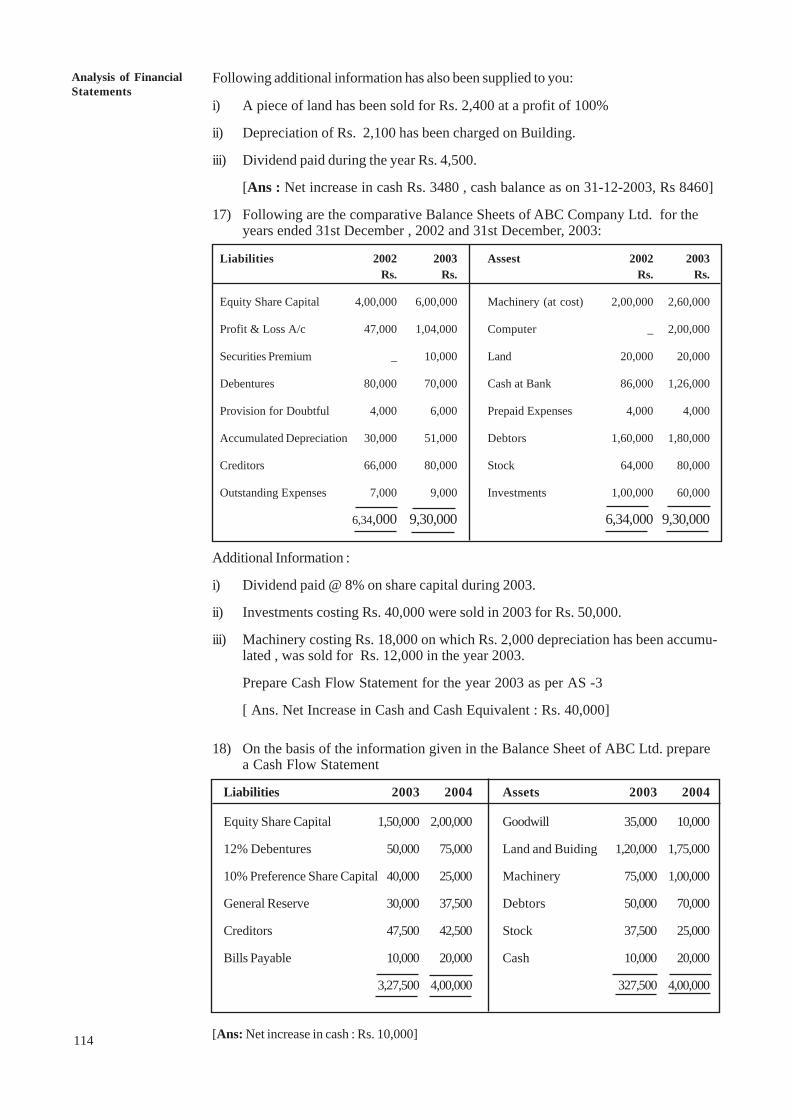
114
Analysis of FinancialStatements
Following additional information has also been supplied to you:
i) A piece of land has been sold for Rs. 2,400 at a profit of 100%
ii) Depreciation of Rs. 2,100 has been charged on Building.
iii) Dividend paid during the year Rs. 4,500.
[Ans : Net increase in cash Rs. 3480 , cash balance as on 31-12-2003, Rs 8460]
17) Following are the comparative Balance Sheets of ABC Company Ltd. for theyears ended 31st December , 2002 and 31st December, 2003:
Liabilities 2002 2003 Assest 2002 2003Rs. Rs. Rs. Rs.
Equity Share Capital 4,00,000 6,00,000 Machinery (at cost) 2,00,000 2,60,000
Profit & Loss A/c 47,000 1,04,000 Computer _ 2,00,000
Securities Premium _ 10,000 Land 20,000 20,000
Debentures 80,000 70,000 Cash at Bank 86,000 1,26,000
Provision for Doubtful 4,000 6,000 Prepaid Expenses 4,000 4,000
Accumulated Depreciation 30,000 51,000 Debtors 1,60,000 1,80,000
Creditors 66,000 80,000 Stock 64,000 80,000
Outstanding Expenses 7,000 9,000 Investments 1,00,000 60,000
6,34,000 9,30,000 6,34,000 9,30,000
Additional Information :
i) Dividend paid @ 8% on share capital during 2003.
ii) Investments costing Rs. 40,000 were sold in 2003 for Rs. 50,000.
iii) Machinery costing Rs. 18,000 on which Rs. 2,000 depreciation has been accumu-lated , was sold for Rs. 12,000 in the year 2003.
Prepare Cash Flow Statement for the year 2003 as per AS -3
[ Ans. Net Increase in Cash and Cash Equivalent : Rs. 40,000]
18) On the basis of the information given in the Balance Sheet of ABC Ltd. preparea Cash Flow Statement
Liabilities 2003 2004 Assets 2003 2004
Equity Share Capital 1,50,000 2,00,000 Goodwill 35,000 10,000
12% Debentures 50,000 75,000 Land and Buiding 1,20,000 1,75,000
10% Preference Share Capital 40,000 25,000 Machinery 75,000 1,00,000
General Reserve 30,000 37,500 Debtors 50,000 70,000
Creditors 47,500 42,500 Stock 37,500 25,000
Bills Payable 10,000 20,000 Cash 10,000 20,000
3,27,500 4,00,000 327,500 4,00,000
[Ans: Net increase in cash : Rs. 10,000]
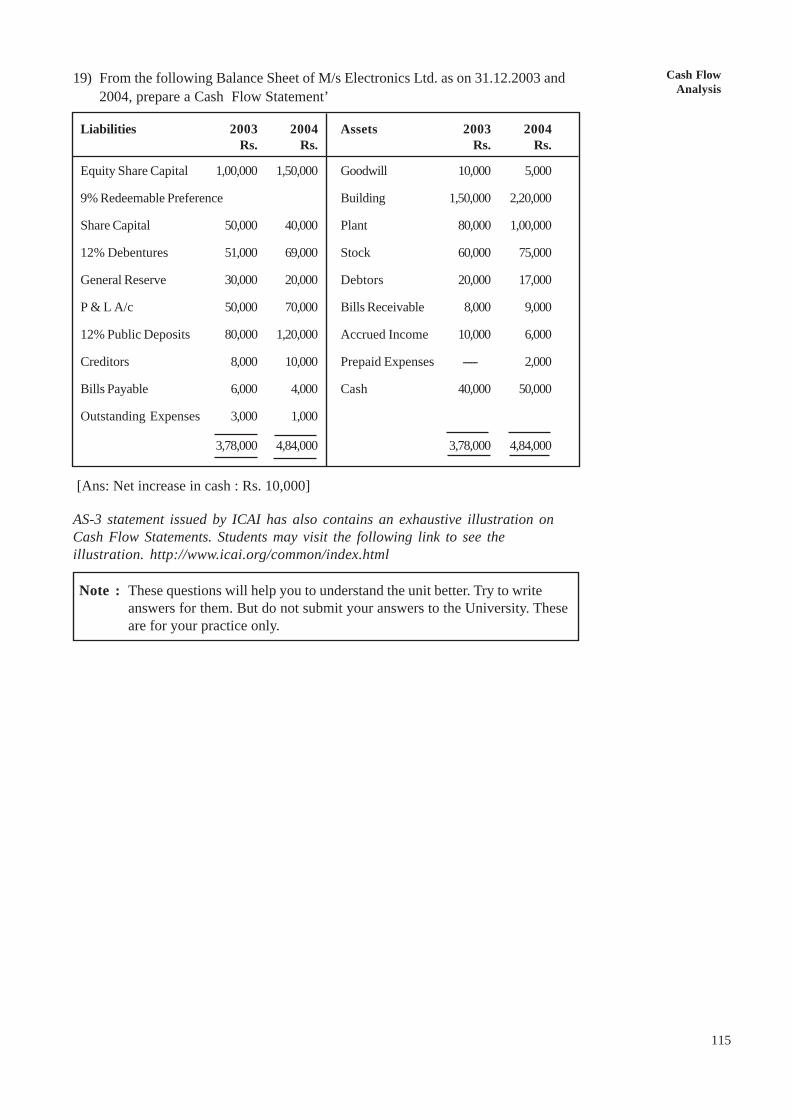
Cash FlowAnalysis
115
19) From the following Balance Sheet of M/s Electronics Ltd. as on 31.12.2003 and2004, prepare a Cash Flow Statement’
Liabilities 2003 2004 Assets 2003 2004Rs. Rs. Rs. Rs.
Equity Share Capital 1,00,000 1,50,000 Goodwill 10,000 5,000
9% Redeemable Preference Building 1,50,000 2,20,000
Share Capital 50,000 40,000 Plant 80,000 1,00,000
12% Debentures 51,000 69,000 Stock 60,000 75,000
General Reserve 30,000 20,000 Debtors 20,000 17,000
P & L A/c 50,000 70,000 Bills Receivable 8,000 9,000
12% Public Deposits 80,000 1,20,000 Accrued Income 10,000 6,000
Creditors 8,000 10,000 Prepaid Expenses ----- 2,000
Bills Payable 6,000 4,000 Cash 40,000 50,000
Outstanding Expenses 3,000 1,000
3,78,000 4,84,000 3,78,000 4,84,000
[Ans: Net increase in cash : Rs. 10,000]
AS-3 statement issued by ICAI has also contains an exhaustive illustration onCash Flow Statements. Students may visit the following link to see theillustration. http://www.icai.org/common/index.html
Note : These questions will help you to understand the unit better. Try to writeanswers for them. But do not submit your answers to the University. Theseare for your practice only.
UNIT 8 BASIC CONCEPTS OFBUDGETING
Structure8.0 Objectives
8.1 Introduction
8.2 Meaning of Budgeting
8.3 Definition of Budget and Budgetary Control
8.4 Objectives of Budgeting
8.5 Advantages of Budgeting
8.6 Limitations of Budgeting
8.7 Essentials of Effective Budgeting
8.8 Establishing a Budgeting System
8.9 Classification of Budgets
8.10 Let Us Sum Up
8.11 Key Words
8.12 Answers to Check Your Progress
8.13 Terminal Questions
8.14 Further Readings
8.0 OBJECTIVESThe main objectives of this unit are to acquaint you with:
l the concepts of budgeting and budgetary control;
l the establishment of effective budgeting system; and
l classification of various types of budget.
8.1 INTRODUCTIONThe efficiency of a management depends upon the attainment of the objectives of theenterprise. It is effective when it achieves the objectives with minimum effort andcost. This requires proper planning and therefore, management must chart out itscourse of action in advance. One systematic approach for attaining effectivemanagement performance is profit planning and control or budgeting. Profit planningor budgeting is an integral part of management. Budgeting is an important controltechnique of cost control. This is the process of pre-estimation of cost, revenue, profitand other figures for the next year or period and on that basis, actual expensesincurred, revenue generated/earned. Afterwards budget is used as a standard formeasuring actual performance. The deviations are found out and responsibility fixedfor deviations. Thus, this is indirectly management control process, which involvesplanning, control, coordination, communication, etc. In this unit you will study about thebasic concept of budgeting, establishment of a system of budgeting and classificationof budgets. 1
2
Budgeting andBudgetary Control 8.2 MEANING OF BUDGETING
In our daily life, we use to prepare budgets for matching the expenses withincome; and available funds can be invested in a profitable manner. Similarly inbusiness, budgets are prepared on the basis of future estimated production andsales in order to find out the profit in a specified period. A budget is in the natureof an estimate and is a quantified plan for future activities to coordinate andcontrol the use of resources for a specified period. Thus budget is a quantitativestatement of management plans and policies for a given period and is used as aguide for the purpose of attaining the given objectives. It is also used as standardwith which actual performance is measured. Budgets must be prepared with fullknowledge and acceptance by the executives whose performance is to bemeasured against the budget. Different types of budgets are prepared fordifferent purposes.
Budgeting may be defined as the process of preparing plans for future activities ofa business enterprise after considering and involving the objectives of the saidorganization. This also provides process/steps of collection and comparison ofdata, by which deviations from the plan, either favourable or adverse, can bemeasured. This analysis is helpful in performance analysis, cost estimation,minimizing wastage and better utilisation of resources of the organisation.
8.3 DEFINITION OF BUDGET AND BUDGETARYCONTROL
Budgeting is a process, which includes two important functions: Budget andBudgetary control. Budget is a planning function and budgetary control is acontrolling system or technique. A manager looks to the future, searches foralternative courses of action and predetermines a course of action to be taken inrelation to known events and the possibilities of future problems. Thus, the budgetwill do this work for the activities of a business enterprise. I.C.M.A., Londondefines the budget as “Budget is financial and/or quantitative statement, preparedprior to a defined period of time, of the policy to be pursued during that period forthe purpose of attaining a given object”.
At the same time, controlling is the process of measuring current performancesand guiding them towards some predetermined goals. The essence of control lies inchecking existing actions against some desired results determined in the planningprocess. Thus, the budgetary control is a tool of control to achieve the budgetedgoals. I.C.M.A., London defines budgetary control as, “Budgetary control is theestablishment of budgets relating to the responsibilities of executives to therequirement of a policy and the continuous comparison of actual with budgetedresults either to secure by individual action the objectives of that policy or toprovide a basis for its revision.”
In nutshell, Budgetary control is a system and a technique which uses budgetsas a means of controlling all aspects of the business and is designed to assistmanagement in the allocation of responsibility and authority, in the measurementof actual performance, in the analysis of variations between budgeted andactual results and to develop basis of measurement, in the light of experiencegained and results achieved, with which to evaluate performance and efficiencyof the operations. Thus, a budget is a means and budgetary control is the endresult.
Basic Concepts ofBudgeting
3
8.4 OBJECTIVES OF BUDGETINGIt is a well known fact that a planned activity has better chances of success than anunplanned one. The budgeting is a forward planning and effective control tool. Thus,the objectives of the budgeting are:
a) To control the cost and increase revenue and thereby maximise profit, so as toknow profit at different level of production and best production level.
b) To run production activities in efficient manner by lay behind the chances ofinterruption in production process due to lack of material, labour etc.
c) To bring about coordination between different functions of an enterprise, which isessential for the success of any enterprise.
d) To incorporate measures of calculation of deviations from budgeted results andanalysis of the same, whereby responsibility can be fixed and controllingmeasures/action can be taken.
e) To ensure that actions taken are in accordance with the targets and if required, totake suitable corrective action.
f) To predict short-term and long-term financial positions for better financial positionand management of working capital in better manner.
8.5 ADVANTAGES OF BUDGETINGThe following are the advantages of budgeting:
a) Budgeting leads to maximum utilisation of resources with a view to ensuringmaximum return.
b) Budgeting increases the awareness about business enterprise at all levels ofmanagement in the process of fulfillment of targets.
c) Budgeting is helpful in better co-ordination between different functions/activitiesof business/organisation and hence, better understanding between differentfunctions.
d) Budgeting is a process of self-examination and self-criticism which is essentialfor the success of any organisation.
e) Budgeting makes a path for active participation and support of top management
f) Budgeting enables the organisation to prefix its goals and push up the forcestowards their achievements.
g) Budgeting stimulates the effective use of resources and creates an attitude ofcost consciousness throughout the organisation.
h) It creates the bases for measuring performances of different departments as wellas different functions of the production activities.
8.6 LIMITATIONS OF BUDGETINGInspite of the above advantages, budgeting has the following limitations:
a) Forecasting, planning or budgeting is not an exact science and a certain amountof judgement is present in any budgeting plan.
4
Budgeting andBudgetary Control
b) The basic requirement for the success of budgeting is the absolute support andenthusian provided by the top management. If it is lacking at any time, the wholesystem will collapse.
c) Budgeting should be followed up by effective control action, this is often lackingin many organisations, which defeats the very purpose of budgeting.
d) The installation of budgeting system is an elaborate process and it takes time.
e) It is only a source and not a target and hence, can not take the place ofmanagement, while it is only a tool of management. Thus, the budget should beregarded not as a master, but as a servant.
f) It requires the experienced man-power, technical staff, analysis, control etc,hence, it is costly affair.
8.7 ESSENTIALS OF EFFECTIVE BUDGETINGA good budgeting system requires good organisational system with lines of authorityand responsibility clearly mentioned. There must be perfect co-ordination amongdifferent functions as well as participation of responsible managers / supervisors in thedecision making process. Thus, the main essentials of effective budgeting may be asfollows:
a) There should be well-planned organisational set-up, authority and responsibilityclearly defined, budget committee should be formed consisting of all topexecutives.
b) There should be a good accounting system which provides accurate and timelyinformation.
c) Variations should be reported promptly and clearly to the appropriate levels ofmanagement.
d) Budgets have no meaning unless they lead to control action as a consequence offeedback provided.
e) The whole system should enjoy the support and co-operation of top management.
f) Staff should be strongly and properly motivated towards the systems.
g) Budgets should be prepared on the basis of clearly defined business policies afterdiscussion held with the head of individual department so that they may providetheir suggestions in this regard.
8.8 ESTABLISHING A BUDGETING SYSTEMFor preparing an efficient budget, there is an urgent need of well-versed system forpreparing the budget. This process is required an efficient system of implementationwithin the organisation. The main essentials of establishment of system of budgetingare:
1) Budget Centres
2) Budget Committee
3) Budget Officer
4) Budget Manual
Basic Concepts ofBudgeting
5
5) Budget Period
6) Budget Key Factor or Determining Principal Budget Factor
7) Forecasting
8) Determining Level of Activity
9) Preparation of Budget
Let us study each one of the above in detail.
1) Budget Centres: Budget centre are defined as different sections of anundertaking or an organisation, where budgetary control measures are to be appliedand for the purpose, separate budgets are to be prepared with the help of head ofthese centres so that these may be implemented more efficiently.
2) Budget Committee: The budget committee is a group of representatives ofvarious functions in an organisation, e.g. Sales Manager, Production Manager, R&DManager, Materials Manager, etc. As all functions are interrelated and any change inone’s target will have its impact on that of the others. Therefore, it is necessary todiscuss the targets so that a mutually agreed programme can be determined. This isreally the co-ordination in budget making. It is powerful force in knitting together thevarious activities of the business and enforcing real control over operations. Theprinciple functions of a Budget Committee are:
a) To provide departmental managers past data regarding performance, costs etc.thus, helping them to prepare their respective budgets.
b) To co-ordinate, receive, review the functional budgets in the light of generalpolicies and objective of the organisation.
c) To approve the functional budgets after making necessary changes.
d) To prepare and present the Master Budget on the basis of functional budgets, sodeveloped and approved for final considerations and approval of the Board ofDirectors.
e) To recommend action to be taken on the basis of variance analysis.
3) Budget Officer: To link up or co-ordinate the various functions, to bring themtogether and to co-ordinate their efforts in the matter of preparation of target figures,there should be a person called Budget Officer or Budget Controller. He is enable toprovide ready data relating to all the functions. He is more or less the Secretary to theBudget Committee. His duties will comprise mainly:
a) Helping in preparation of the various budgets and their co-ordinations andcompilation into the master budget.
b) Compiling information about actual performance on a continuous basis,comparing it against the budget figures, ascertaining causes of deviation andpreparing reports based thereon and sending them to the appropriate executives.
c) Bringing to the notice of the management the need for revision of budgets andassisting them in the task, and
d) Compiling information of all types for the purpose of efficient preparation ofbudgets and proper reporting.
6
Budgeting andBudgetary Control
4) Budget Manual: Budget manual is defined as a document which setsoutstanding instructions, the responsibility of the persons engaged in, and theprocedures, forms and records relating to the preparation and use of budgets. Thusbudget manual is a booklet of budget policies which lays down the details of theorganisational set up with duties and responsibilities of executives including thebudget committee and budget officer and procedures to be followed for developingbudget in respect of various activities.
The following are some of the important matters dealt with in the budget manual:
a) The dates by which preliminary forecasts and plans are to be submitted.
b) The forms in which these are to be submitted and the person to whom theseare to be forwarded.
c) The important factors that must be considered for each forecast or plan
d) The categorisation of expenses, e.g., variable and fixed, and the manner inwhich each category is to be estimated and dealt with.
e) The manner of scrutiny and the personnel to carry it out.
f) The matter which must be settled only with the consent of the managingdirector, departmental manager, etc.
g) The finalisation of the functional budgets and their compilation into the MasterBudget.
h) The form in which the various reports are to be made out, their periodicity anddates, the persons to whom these and their copies are to be sent.
i) The reporting of the remedial actions.
j) The manner in which budgets, after acceptance and issuance, are to berevised or amended, and
k) The matters to be included in budgets, on which action may be taken only withthe approval of top management.
5) Budget Period: This is the period for which forecasts can reasonably bemade and budgets can be formulated. Budget periods vary between short-term andlong-term and no specific period can be laid down for all budgets. Normally, adetailed budget for each responsibility centre is prepared for one year. In fact, thelength of the budget period depends on the type of the business, the length of themanufacturing cycle from raw material to finished products, the ease or difficultyof forecasting future market conditions and other factors. It should be kept in mindthat the budget period should be long enough to allow for the financing ofproduction well in advance of actual needs and also coincide with the financialaccounting period to compare actual results with budgeted estimates.
6) Budget Key Factor or Determining Principal Budget Factor: The keyfactor is also known as limiting factor, governing factor, etc. and may be defined asthe factor which at a particular time or over a period will limit the activities of anundertaking. The limiting factor is, usually, the level of demand for the products orservices of the undertaking, but it could be a shortage of one of the productiveresources, e.g. skilled labour, raw material, or machine capacity etc.. In order toensure that the functional budgets are reasonably capable of fulfillment, the extentof the influence of this factor must be assessed.
The key factor is normally temporary in nature and is a constraint at a particularpoint of time. In the long run, they can be overcome by proper planning andmanagement action.
Basic Concepts ofBudgeting
7
The principal budget factor which will influence the targets may be : (i) customerdemand, (ii) plant capacity, (iii) availability of raw materials, (iv) availability of skilledlabour, (v) availability of adequate capital, (vi) storage capacity of raw material andfinished goods, (vii) space for plant installation, and (viii) governmental restrictions etc.
7) Forecasting: Forecasting is the statement of events likely to occur. It connotesa degree of looseness, so that it is usually the practice to judge the accuracy offorecasts on the basis of actual performance, taking the latter to be correct. Theforecast of a function need not necessarily be well coordinated. The desired co-ordination could be obtained before the budget is finalised. A forecast forms the basisfor the budget. A budget indicates a target and it is a statement of planned events,generally evolved from the forecast.
8) Determining Level of Activity: The level of activities are determined on thebasis of information and estimates provided regarding / about future conditions andactivities of market and position of product in the market by departmental heads orconcerned managers. For this purpose, detailed discussions, analysis, preparation ofreports are to be done and then written report to be formed and submitted to budgetcommittee for their decision making.
9) Preparation of Budget: After discussing all the factors, which may affect theprocess of budgeting, the budget should be prepared. The manager who is responsiblefor meeting the budgeted performance should prepare the budget for those areas forwhich they are responsible. The preparation of the budget should be a bottom-upprocess. This means, the budget should originate at the lowest levels of managementand be refined and co-ordinated at higher levels. This will enable managers toparticipate in the preparation of their budgets and increases the probability that they willaccept the budget and strive to achieve the budgeted targets.
When all the budgets prepared by respective managers, then, they should be co-ordinated with each other and corrected in respect of organisational goal and then,summarized into a Master Budget consisting of a Budgeted Profit and Loss Account,a Balance Sheet and a Cash Flow Statement. After the Master Budget has beenapproved, the budgets are to be passed down through the organisation to the appropriateresponsibility centre. The approval of the master budget gives the authority for themanager of each responsibility centre to carry out the plans contained in each budget.
8.9 CLASSIFICATION OF BUDGETSBudgets can be classified into different categories on the basis of time, functions orflexibility. The different budgets covered under each category are shown in thefollowing chart :
Classification of Budgets
Time Function Flexibilityl Long-term l Sales l Fixedl Short-term l Production l Flexiblel Current l Cost of Production
l Purchasel Personnell Researchl Capital Expenditurel Cashl Master
Let us study all the above budgets briefly. You will study these budgets in detail in Unit 9.
↓ ↓ ↓
8
Budgeting andBudgetary Control
1) Classification According to Time
The budget, on the basis of time, may be classified as :
a) Long-term budget,
b) Short-term budget, and
c) Current budget.
Long-Term Budget : A budget designed for a long period is termed as a Long-termbudget. The period generally is of 5 to 10 years. These budgets are concerned withplanning of the operations of a firm over a considerably long period of time. They aregenerally prepared in terms of physical quantities.
Short-Term Budget : The budget prepared for a period of less than 5 years is ashort-term budget. Generally short-term budgets are prepared for a period of one totwo years. They are generally prepared in terms of physical as well as in monetaryunits.
Current Budget : The budget prepared for a period of a week, a month, or a quarteris termed as a current budget. They are essentially short-term budgets adjusted tocurrent conditions or prevailing circumstances.
2) Classification According to Function
Budgets can be classified on the basis of functions, they are meant to perform.Different types of budgets under this head are as follows:
Sales Budget : This is the most important budget on which all other budgets arebased. The sales manager is responsible for preparation and execution of the budget.The budget forecasts total sales in terms of quantity, value, items, periods, areas etc.
Production Budget :The budget is basically based on sales budget. It forecastsquantity of production in terms of items, periods, areas, etc. The works manger isresponsible for the preparation of overall production budget and departmental worksmanager is responsible for departmental production budgets.
Cost of Production Budget : It forecasts the cost of production. Separate budgetsare prepared for different elements of costs such as direct materials budget, directlabour budget, factory overheads budget, office overheads budget, selling anddistribution overhead budget, etc.
Purchase Budget : The budget forecasts the quantity and value of purchasesrequired for production. It gives quantity-wise and period-wise information about thematerials to be purchased. It correlates with sales forecast and production planning.
Personnel Budget : The budget anticipates the quantity of personnel required duringa period for production activity. This may be further split up between direct andindirect personnel budgets.
Research Budget : The budget relates to the research work to be done forimprovement in quality of the products or research for new products.
Capital Expenditure Budget : The budget provides a guidance regarding theamount of capital that may be required for procurement of capital assets during thebudget period.
Cash Budgets : The budget is a forecast of the cash position, for a specific durationof time for different time periods. It states the estimated amount of cash receipts andcash payments and the likely balance of cash in hand at the end of different periods.
Basic Concepts ofBudgeting
9
Master Budget : It is a summary budget incorporating all functional budgets in acapsule form. It interprets different functional budgets and covers within its range thepreparation of projected income statement and projected balance sheet.
3) Classification According to Flexibility
Budget can also be classified in the following categories:
Fixed Budget : A budget prepared on the basis of a standard or a fixed level ofactivity is called a fixed budget. It does not change with the change in the level ofactivity. If the output and sales do not fluctuate from year to year or if an accurateprediction of the same can be made, a fixed budget can be prepared.
Flexible Budget : A budget designed in a manner so as to give the budgeted cost ofany level of activity is termed as a flexible budget. Such a budget is prepared afterconsidering the fixed and variable elements of cost and the changes that may beexpected for each item at various levels of operation.
Check Your Progress
1) What do you mean by Budgeting ?
.............................................................................................................................
.............................................................................................................................
.............................................................................................................................
.............................................................................................................................
2) What is Budgetary Control ?
.............................................................................................................................
.............................................................................................................................
.............................................................................................................................
.............................................................................................................................
3) List out the essentials of a sound system of Budgeting.
1 ………………….. 4 ………………………………
2 …………………. 5 ……………………………..
3 ………………… 6 ……………………………..
4) Differentiate between a Forecast and a Budget.
............................................................................................................................
............................................................................................................................
............................................................................................................................
............................................................................................................................
............................................................................................................................
10
Budgeting andBudgetary Control
5) Fill in the blanks :
a) The process of preparing and using budgets to achieve the objectives ofmanagement is called ....................................... .
b) ............................ is a tool of control to achieve the budgeted goals.
c) .................................... is a group of representatives of various functionsof an organisation for preparing budgets and exercising overall control.
d) A book let of budget policies which lays down duties and responsibilities ofexecutives and procedures to be followed for preparation andimplementation of budget programme is called ..................................... .
e) .......................... is the basis for preparation of the budget.
f) The most important budget on which all other budgets are based is................... .
g) A summary of budget which contains all functional budgets in a capsuleform is called ............... .
h) In the preparation of budgets ..................... limits the volume of budget activity.
i) A budget may be defined as a ............... expression of a business plan fora specified future period.
6) State whether each of the following statements is True or False.
a) A budget is a means and budgetary control is the end result. ( )
b) Budget should be regarded as a master but not as a servant. ( )
c) Key factor can be overcome in the long-run by proper planning. ( )
d) Research budget relates to the improvement in quality anddevelopment of the new products. ( )
e) Flexible budget gives details of budgeted cost at any level of activity. ( )
f) A budget is both a plan as well as a control tool. ( )
g) A budget is a base while the forecast is the structure built on the base( )
h) A fixed budget is concerned with budgeting of fixed assets. ( )
i) A budget manual contains a summary of all functional budgets. ( )
j) A budget is a plan of the management for a future period expressed inquantitative terms. ( )
8.10 LET US SUM UPA budget is in the nature of an estimate and is quantified plan for future activitiesto coordinate and control the use of resources for a specified period. Budget isused as a standard with which actual performance is measured. Budgeting is aprocess which includes both budget and budgetory control. Budget is a planningfunction and budgetory control is a system and technique which uses budgets as a
Basic Concepts ofBudgeting
11
means of controlling all aspects of the business and is designed to assistmanagement in the measurement of actual performance, in the analysis ofdeviations from the budgeted targets and to evaluate performance and efficiencyof the operations. A good budgeting system requires good organisational systemwith the lines of authority and responsibility clearly mentioned. The importantessentials required for the establishment of a sound system of budgeting includesbudget centres, budget committee, budget officer, budget manual, budget period,budget key factor, forecasting, determining level of activity and preparation ofbudget.
Budget may be classified on the basis of time, function and flexibility. On thebasis of time, budget may be classified as long term budget, short-term budget andcurrent budget. The classification of budget according to functions generallyinclude : Sales budget, production budget, cost of production budget, purchasebudget, personnel budget, research budget, capital expenditure budget, cash budgetand master budget. Budget can also be classified according to flexibility as fixedand flexible budget.
8.11 KEY WORDSBudget : A comprehensive and coordinated plan, expressed in financial terms, forthe operations and resources of an enterprise for some specific period in the future.
Budgeting : The process of preparing plans for future activities of a businessenterprise for attaining the objectives of an organisation.
Budgetory Control : The establishment of budgets relating to the responsibilities ofexecutives to the requirement of a policy and the continuous comparison of actual withbudgeted results either to secure by individual action the objectives of that policy or toprovide a basis for its revision.
Budget Centres : Different sections of an undertaking or an organisation, wherebudgetory control measures to be applied and for the purpose, separate budgets are tobe prepared.
Budget Committee : A group of representatives of various functions in anorganisation
Budget Officer : A person who links up or coordinates the various functions, tobring them together and coordinate their efforts in the matter of preparation of targetfigures.
Budget Manual : A document which sets out standing instructions, the responsibilityof the persons engaged in, and the procedures, forms and records relating to thepreparation and use of budgets.
Budget Period : The period for which forecasts can reasonably be made andbudgets can be formulated.
Budget Key Factor : The factor which at a particular time or over a period will limitthe activities of an undertaking.
Forecasting : A statement of events likely to occur
Fixed Budget : A budget prepared on the basis of a standard or a fixed level ofactivity
Flexible Budget : A budget designed in a manner so as to give the budgeted cost atany level of activity.
Master Budget : A summary budget incorporating all functional budgets which isfinally approved, adopted and employed.
12
Budgeting andBudgetary Control 8.12 ANSWERS TO CHECK YOUR PROGRESS
5) a) Budgeting b) Budgetary control c) Budget Committee
d) Budget Manual e) A forecast f) Sales budget
g) Master budget h) The key factor i) Quantitative
6) a) True, b) False, c) True, d) True, e) False, f) True, g) True, h) False,i) False, j) True
8.13 TERMINAL QUESTIONS1) Define budgeting and budgetory control. State the objective of Budgeting.
2) What is budgeting ? What are the advantages and limitations of Budgeting ?
3) What are the essentials of an effective system of Budgeting ? Explain
4) What is a Budget Manual ? State briefly the contents of a budget manual.
5) What do you mean by Budgeting ? Mention different types of budgets that a bigindustrial concern would normally prepare.
6) What are the essentials of establishment of sound system of Budgeting ?
7) Explain the following :
i) Budget Committee
ii) Budget Officer
iii) Budget Key Factor
iv) Budget Period
8) Explain in brief different types of budgets.
9) “A budget is a means and budgetory control is the end result”. Explain.
8.14 FURTHER READINGSEdward B. Deakin and Michael W. Maher, Cost Accounting, Richard D. Erwin, inc.,Homewood, Illinois.
Lal Nigam B.M. and Sharma G.L., Advanced Cost Accounting, HimalayaPublishing House, Bombay-4.
Indira Gandhi National Open University, Study Material MS-4 and MS-43.
Maheswari, S.N. 1987, Management Accounting and Financial Control, SultanChand : New Delhi.
Note : These questions will help you to understand the unit better. Try to writeanswers for them. But do not submit your answers to the University. Theseare for your practice only.
Preparation andReview of Budgets
17
UNIT 9 PREPARATION ANDREVIEW OF BUDGETS
Structure9.0 Objectives
9.1 Introduction
9.2 Sales Budget
9.3 Production Budget
9.4 Production Cost Budget
9.5 Materials Budget
9.6 Purchase Budget
9.7 Direct Labour Budget
9.8 Overheads Budget
9.9 Capital Expenditure Budget
9.10 Cash Budget
9.11 Master Budget
9.12 Revision of Budgets
9.13 Budget Report
9.14 Let Us Sum Up
9.15 Key Words
9.16 Answers to Check Your Progress
9.17 Terminal Questions
9.18 Further Readings
9.0 OBJECTIVESThe main objectives of this unit are to make you familiar with :l the preparation of different types of budgets;l the preparation of Master budget; andl review of different budgets.
9.1 INTRODUCTIONIn the previous unit you have learnt about the basic concept of budgeting,establishment of a sound system of budgeting and classification of budgets. Youhave also learnt that budgeting is the principal instrument for projecting the futurecosts and revenues which is an essential aspect of management accounting andfinancial control. Budgeting helps in monitoring the present as well as past.Preparation of budgets involves a number of forecast or projections. It starts withsales forecasting and ends with the compilation of the master budget. In this unit youwill study about the construction of functional budgets.
9.2 SALES BUDGETThe sales budget is usually the keystone in planning and control of operation of abusiness. Sales forecast serves as a base for the sales budget. The sales budget isprepared in quantitative terms of units expected to be sold and the value expected to
18
Budgeting andBudgetary Control
be realised. The Sales Manager should be made directly responsible for thepreparation and execution of sales budget. This is prepared according to therequirements of the business while preparing sales budget. The useful classificationmay be-products, territories, customers, salesmen, etc. More than one classificationmay be employed. However, at the time of preparing sales budget the followingfactors should be kept in mind:
(a) salesmen’s estimates (b) orders in hand (c) Past behaviour (d) Managementpolicies for future (e) seasonal fluctuations (f) availability of materials (g) plantcapacity (h) availability of finance (i) potential market (j) level of competition(k) position of competitors, etc. Look at the following illustration how a sales budget isto be prepared.
Illustration 1
Shri Ramu manufactures two types of toys, Raja and Rani and sell them in Agra andMumbai markets. The following information is made available for the current year2003-2004:
Places/Markets Type of Toys Budgeted Sales Actual Sales 2002-2003 2002-2003
Agra Raja 400 at Rs. 9 each 500 at Rs. 9 each
Rani 300 at Rs. 21 each 200 at Rs. 21 each
Mumbai Raja 600 at Rs. 9 each 700 at Rs. 9 each
Rani 500 at Rs. 21 each 400 at Rs. 21 each
Market studies reveal that toy Raja is popular as it is under priced. It is observed thatif its price is increased by Rs.1 it will find a ready market. On the other hand, Rani isover-priced and market could absorb more sales if its selling price is reduced to Rs.20. The management has agreed to give effect to the above price changes.
On the above basis, the following estimates have been prepared by Sales Manager:
Product % increase in Sales Over Current Budget
Agra Mumbai
Raja +10% +5%
Rani +20% +10%
With the help of an intensive advertisement campaign, the following additional salesabove the estimated sale are possible:
Product Agra Mumbai
Raja 60 units 60 units
Rani 40 units 50 units
You are required to prepare a budget for sales incorporating the above estimates.
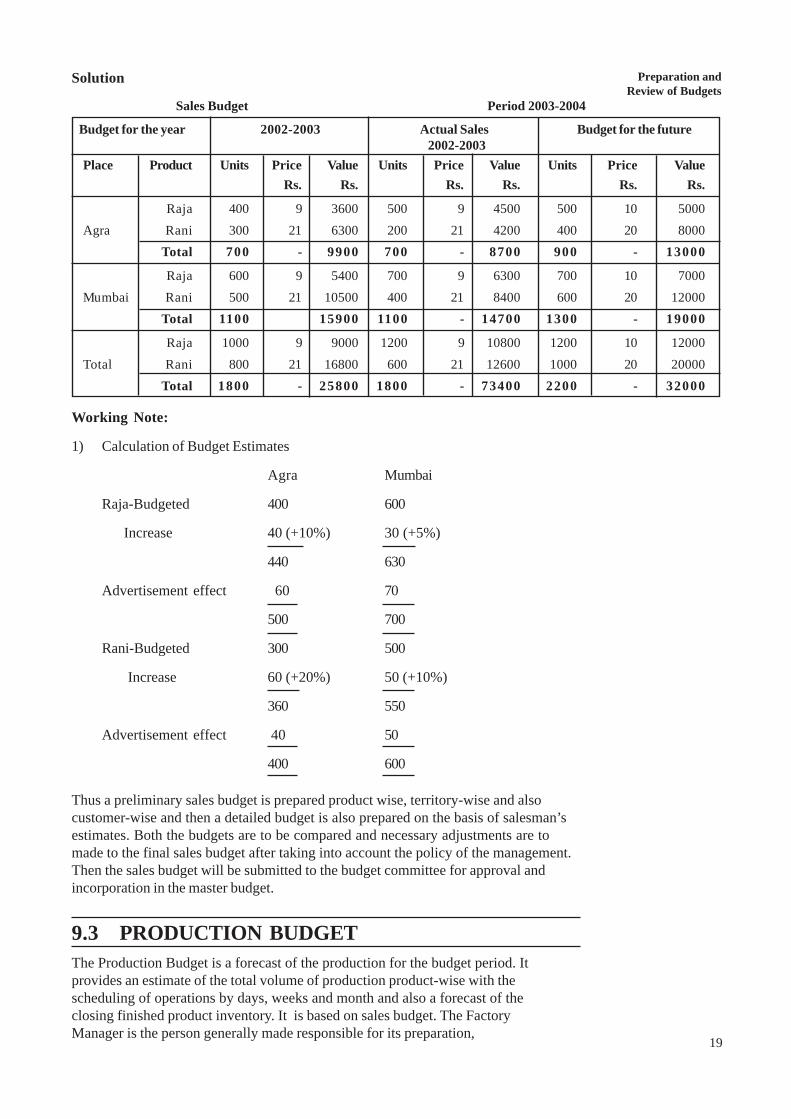
Preparation andReview of Budgets
19
Working Note:
1) Calculation of Budget Estimates
Agra Mumbai
Raja-Budgeted 400 600
Increase 40 (+10%) 30 (+5%)
440 630
Advertisement effect 60 70
500 700
Rani-Budgeted 300 500
Increase 60 (+20%) 50 (+10%)
360 550
Advertisement effect 40 50
400 600
Thus a preliminary sales budget is prepared product wise, territory-wise and alsocustomer-wise and then a detailed budget is also prepared on the basis of salesman’sestimates. Both the budgets are to be compared and necessary adjustments are tomade to the final sales budget after taking into account the policy of the management.Then the sales budget will be submitted to the budget committee for approval andincorporation in the master budget.
9.3 PRODUCTION BUDGETThe Production Budget is a forecast of the production for the budget period. Itprovides an estimate of the total volume of production product-wise with thescheduling of operations by days, weeks and month and also a forecast of theclosing finished product inventory. It is based on sales budget. The FactoryManager is the person generally made responsible for its preparation,
Sales Budget Period 2003-2004
Budget for the year 2002-2003 Actual Sales Budget for the future 2002-2003
Place Product Units Price Value Units Price Value Units Price ValueRs. Rs. Rs. Rs. Rs. Rs.
Raja 400 9 3600 500 9 4500 500 10 5000Agra Rani 300 21 6300 200 21 4200 400 20 8000
Total 700 - 9900 700 - 8700 900 - 13000
Raja 600 9 5400 700 9 6300 700 10 7000Mumbai Rani 500 21 10500 400 21 8400 600 20 12000
Total 1100 15900 1100 - 14700 1300 - 19000
Raja 1000 9 9000 1200 9 10800 1200 10 12000Total Rani 800 21 16800 600 21 12600 1000 20 20000
Total 1800 - 25800 1800 - 73400 2200 - 32000
Solution
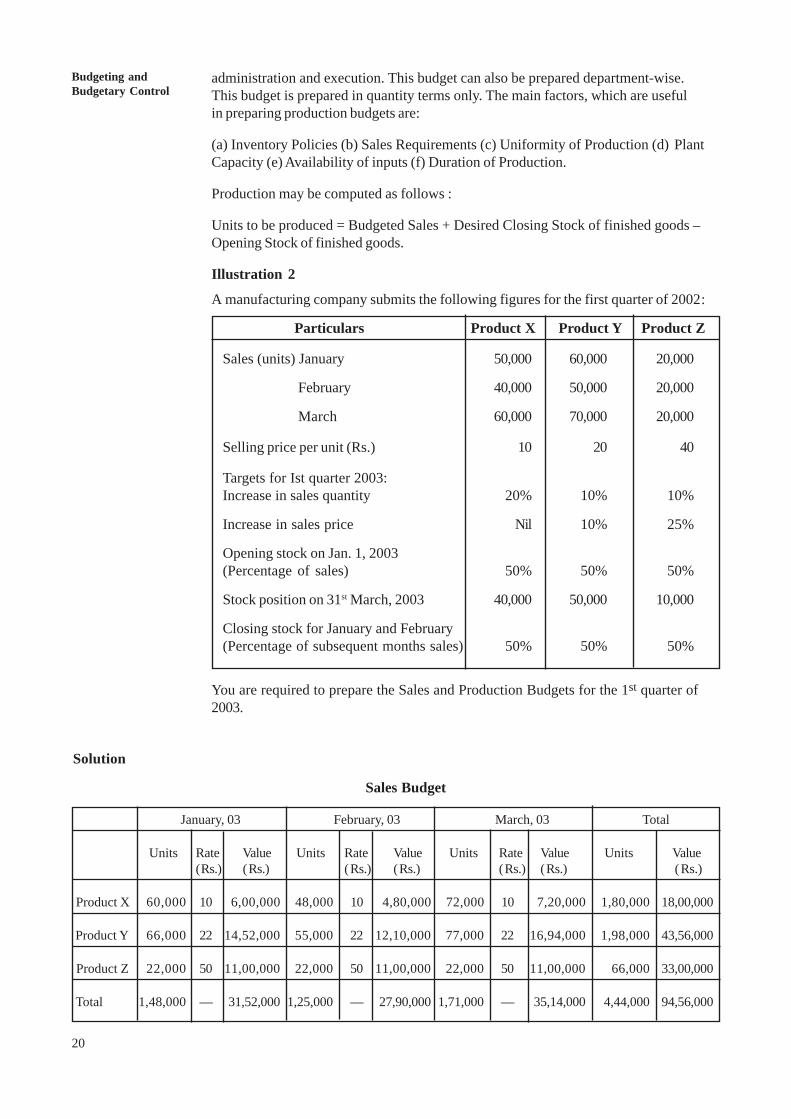
20
Budgeting andBudgetary Control
administration and execution. This budget can also be prepared department-wise.This budget is prepared in quantity terms only. The main factors, which are usefulin preparing production budgets are:
(a) Inventory Policies (b) Sales Requirements (c) Uniformity of Production (d) PlantCapacity (e) Availability of inputs (f) Duration of Production.
Production may be computed as follows :
Units to be produced = Budgeted Sales + Desired Closing Stock of finished goods –Opening Stock of finished goods.
Illustration 2
A manufacturing company submits the following figures for the first quarter of 2002 :
Particulars Product X Product Y Product Z
Sales (units) January 50,000 60,000 20,000
February 40,000 50,000 20,000
March 60,000 70,000 20,000
Selling price per unit (Rs.) 10 20 40
Targets for Ist quarter 2003:Increase in sales quantity 20% 10% 10%
Increase in sales price Nil 10% 25%
Opening stock on Jan. 1, 2003(Percentage of sales) 50% 50% 50%
Stock position on 31st March, 2003 40,000 50,000 10,000
Closing stock for January and February(Percentage of subsequent months sales) 50% 50% 50%
You are required to prepare the Sales and Production Budgets for the 1st quarter of2003.
Solution
Sales Budget
January, 03 February, 03 March, 03 Total
Units Rate Value Units Rate Value Units Rate Value Units Value(Rs.) (Rs.) (Rs.) (Rs.) (Rs.) (Rs.) (Rs.)
Product X 60,000 10 6,00,000 48,000 10 4,80,000 72,000 10 7,20,000 1,80,000 18,00,000
Product Y 66,000 22 14,52,000 55,000 22 12,10,000 77,000 22 16,94,000 1,98,000 43,56,000
Product Z 22,000 50 11,00,000 22,000 50 11,00,000 22,000 50 11,00,000 66,000 33,00,000
Total 1,48,000 — 31,52,000 1,25,000 — 27,90,000 1,71,000 — 35,14,000 4,44,000 94,56,000
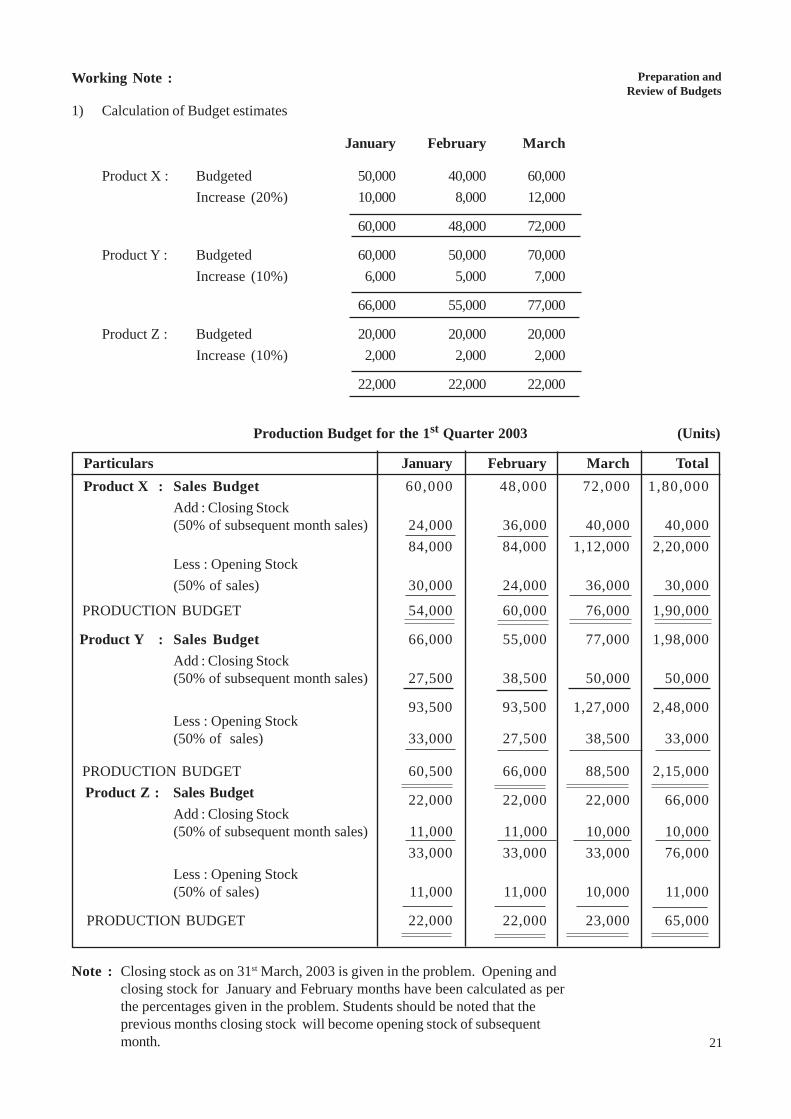
Preparation andReview of Budgets
21
Working Note :
1) Calculation of Budget estimates
January February March
Product X : Budgeted 50,000 40,000 60,000Increase (20%) 10,000 8,000 12,000
60,000 48,000 72,000
Product Y : Budgeted 60,000 50,000 70,000Increase (10%) 6,000 5,000 7,000
66,000 55,000 77,000
Product Z : Budgeted 20,000 20,000 20,000Increase (10%) 2,000 2,000 2,000
22,000 22,000 22,000
Particulars January February March Total Product X : Sales Budget 60,000 48,000 72,000 1,80,000
Add : Closing Stock(50% of subsequent month sales) 24,000 36,000 40,000 40,000
84,000 84,000 1,12,000 2,20,000Less : Opening Stock(50% of sales) 30,000 24,000 36,000 30,000
PRODUCTION BUDGET 54,000 60,000 76,000 1,90,000
Product Y : Sales Budget 66,000 55,000 77,000 1,98,000Add : Closing Stock(50% of subsequent month sales) 27,500 38,500 50,000 50,000
93,500 93,500 1,27,000 2,48,000Less : Opening Stock(50% of sales) 33,000 27,500 38,500 33,000
PRODUCTION BUDGET 60,500 66,000 88,500 2,15,000 Product Z : Sales Budget 22,000 22,000 22,000 66,000
Add : Closing Stock(50% of subsequent month sales) 11,000 11,000 10,000 10,000
33,000 33,000 33,000 76,000Less : Opening Stock(50% of sales) 11,000 11,000 10,000 11,000
PRODUCTION BUDGET 22,000 22,000 23,000 65,000
Note : Closing stock as on 31st March, 2003 is given in the problem. Opening andclosing stock for January and February months have been calculated as perthe percentages given in the problem. Students should be noted that theprevious months closing stock will become opening stock of subsequentmonth.
Production Budget for the 1st Quarter 2003 (Units)
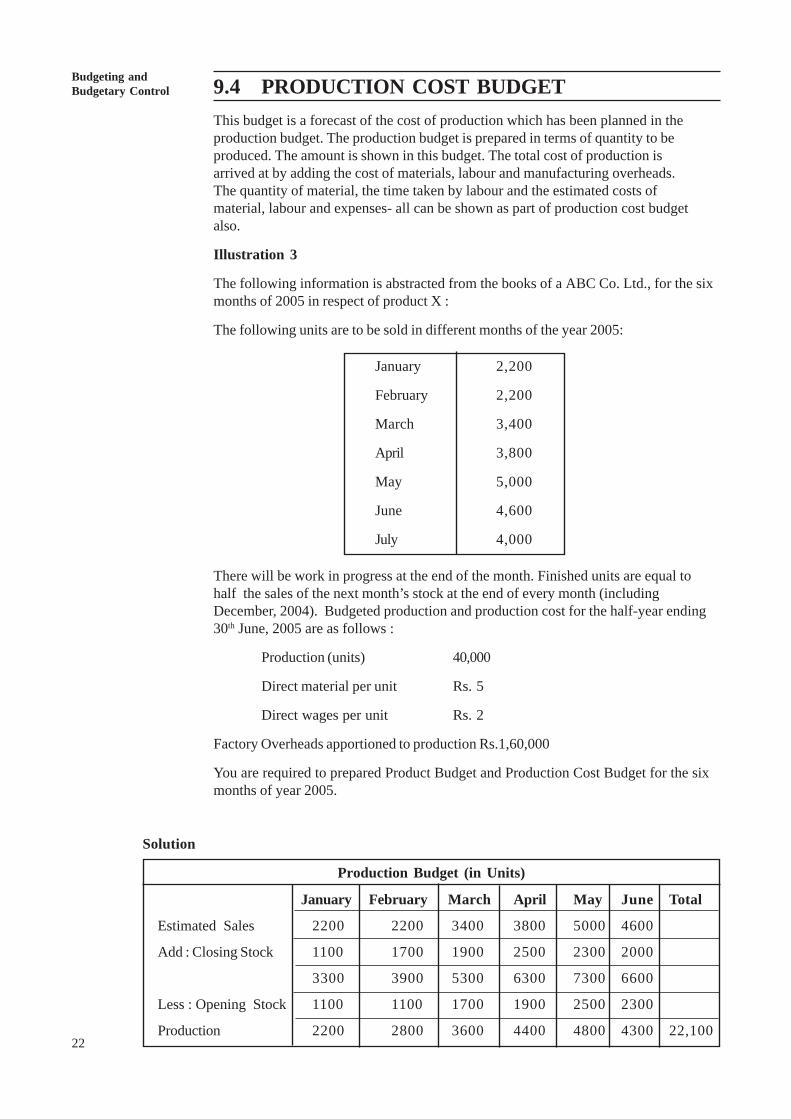
22
Budgeting andBudgetary Control 9.4 PRODUCTION COST BUDGET
This budget is a forecast of the cost of production which has been planned in theproduction budget. The production budget is prepared in terms of quantity to beproduced. The amount is shown in this budget. The total cost of production isarrived at by adding the cost of materials, labour and manufacturing overheads.The quantity of material, the time taken by labour and the estimated costs ofmaterial, labour and expenses- all can be shown as part of production cost budgetalso.
Illustration 3
The following information is abstracted from the books of a ABC Co. Ltd., for the sixmonths of 2005 in respect of product X :
The following units are to be sold in different months of the year 2005:
January 2,200
February 2,200
March 3,400
April 3,800
May 5,000
June 4,600
July 4,000
There will be work in progress at the end of the month. Finished units are equal tohalf the sales of the next month’s stock at the end of every month (includingDecember, 2004). Budgeted production and production cost for the half-year ending30th June, 2005 are as follows :
Production (units) 40,000
Direct material per unit Rs. 5
Direct wages per unit Rs. 2
Factory Overheads apportioned to production Rs.1,60,000
You are required to prepared Product Budget and Production Cost Budget for the sixmonths of year 2005.
Solution
Production Budget (in Units)
January February March April May June Total
Estimated Sales 2200 2200 3400 3800 5000 4600
Add : Closing Stock 1100 1700 1900 2500 2300 2000
3300 3900 5300 6300 7300 6600
Less : Opening Stock 1100 1100 1700 1900 2500 2300
Production 2200 2800 3600 4400 4800 4300 22,100
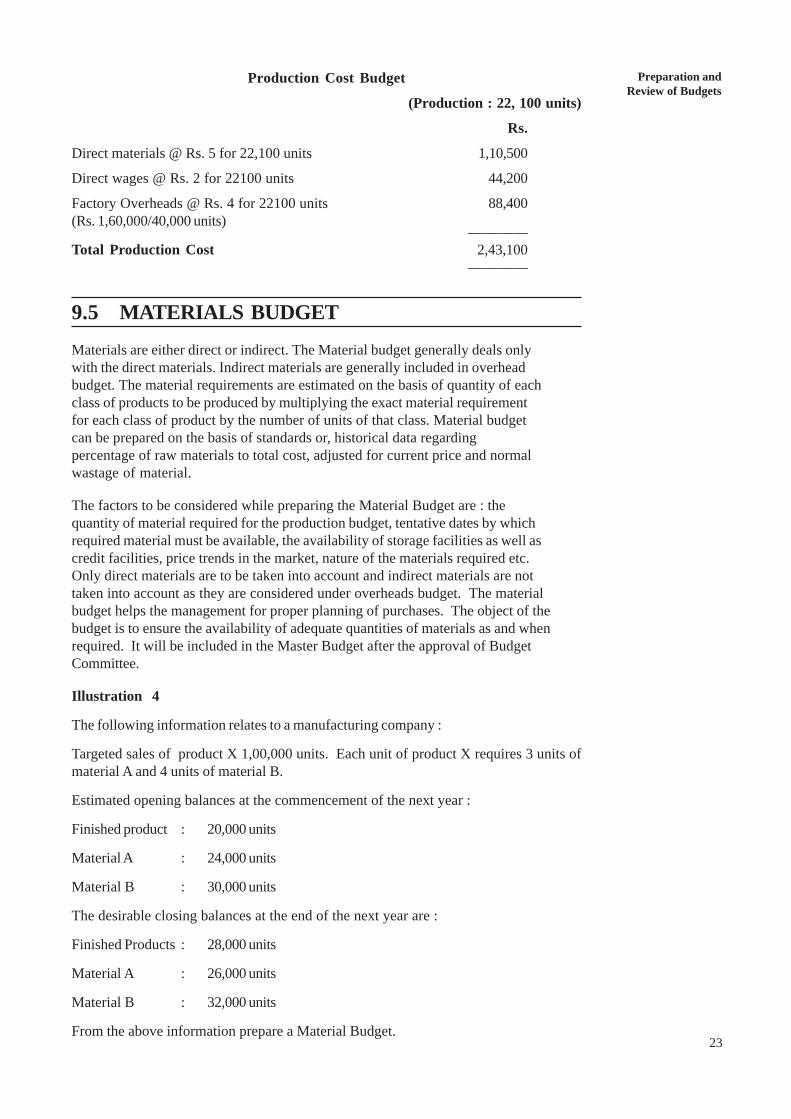
Preparation andReview of Budgets
23
Production Cost Budget
(Production : 22, 100 units)
Rs.
Direct materials @ Rs. 5 for 22,100 units 1,10,500
Direct wages @ Rs. 2 for 22100 units 44,200
Factory Overheads @ Rs. 4 for 22100 units 88,400(Rs. 1,60,000/40,000 units)
————Total Production Cost 2,43,100
————
9.5 MATERIALS BUDGETMaterials are either direct or indirect. The Material budget generally deals onlywith the direct materials. Indirect materials are generally included in overheadbudget. The material requirements are estimated on the basis of quantity of eachclass of products to be produced by multiplying the exact material requirementfor each class of product by the number of units of that class. Material budgetcan be prepared on the basis of standards or, historical data regardingpercentage of raw materials to total cost, adjusted for current price and normalwastage of material.
The factors to be considered while preparing the Material Budget are : thequantity of material required for the production budget, tentative dates by whichrequired material must be available, the availability of storage facilities as well ascredit facilities, price trends in the market, nature of the materials required etc.Only direct materials are to be taken into account and indirect materials are nottaken into account as they are considered under overheads budget. The materialbudget helps the management for proper planning of purchases. The object of thebudget is to ensure the availability of adequate quantities of materials as and whenrequired. It will be included in the Master Budget after the approval of BudgetCommittee.
Illustration 4
The following information relates to a manufacturing company :
Targeted sales of product X 1,00,000 units. Each unit of product X requires 3 units ofmaterial A and 4 units of material B.
Estimated opening balances at the commencement of the next year :
Finished product : 20,000 units
Material A : 24,000 units
Material B : 30,000 units
The desirable closing balances at the end of the next year are :
Finished Products : 28,000 units
Material A : 26,000 units
Material B : 32,000 units
From the above information prepare a Material Budget.
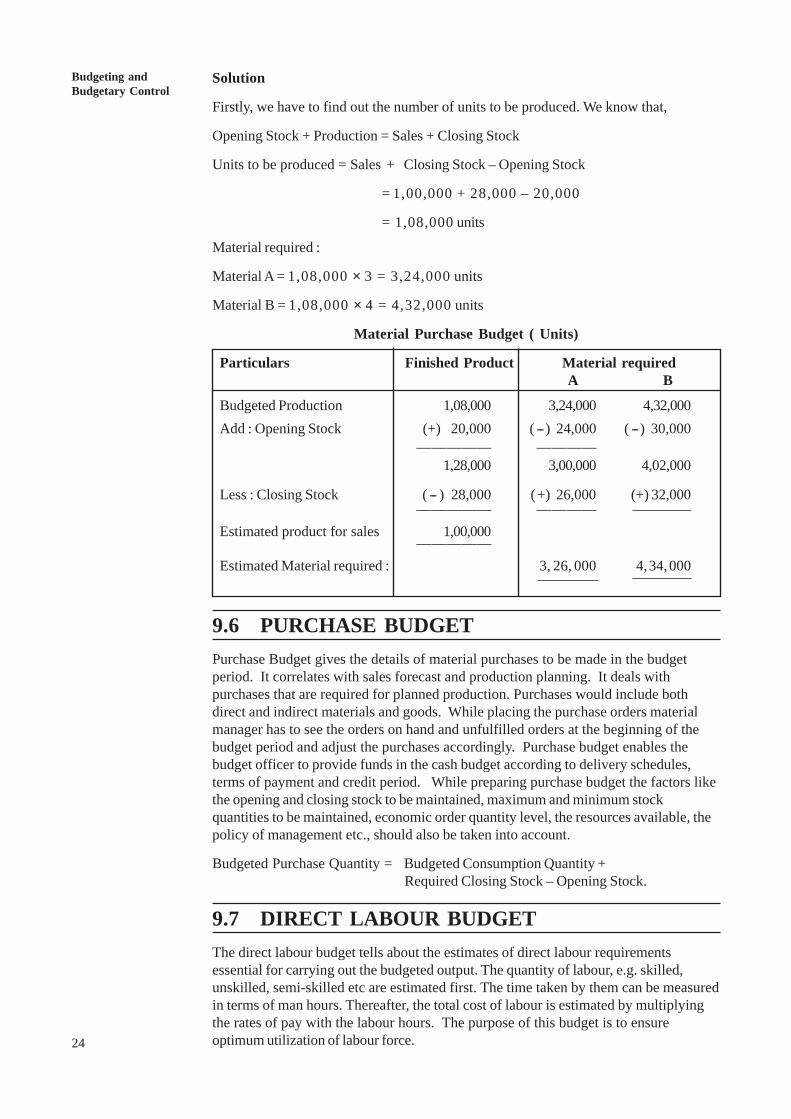
24
Budgeting andBudgetary Control
Solution
Firstly, we have to find out the number of units to be produced. We know that,
Opening Stock + Production = Sales + Closing Stock
Units to be produced = Sales + Closing Stock – Opening Stock
= 1,00,000 + 28,000 – 20,000
= 1,08,000 units
Material required :
Material A = 1,08,000 × 3 = 3,24,000 units
Material B = 1,08,000 × 4 = 4,32,000 units
Material Purchase Budget ( Units)
Particulars Finished Product Material required A B
Budgeted Production 1,08,000 3,24,000 4,32,000Add : Opening Stock (+) 20,000 ( --) 24,000 ( --) 30,000
————— ————1,28,000 3,00,000 4,02,000
Less : Closing Stock ( -- ) 28,000 (+) 26,000 (+) 32,000————— ———— ————
Estimated product for sales 1,00,000
Estimated Material required :—————
3, 26, 000 4,34, 000
9.6 PURCHASE BUDGETPurchase Budget gives the details of material purchases to be made in the budgetperiod. It correlates with sales forecast and production planning. It deals withpurchases that are required for planned production. Purchases would include bothdirect and indirect materials and goods. While placing the purchase orders materialmanager has to see the orders on hand and unfulfilled orders at the beginning of thebudget period and adjust the purchases accordingly. Purchase budget enables thebudget officer to provide funds in the cash budget according to delivery schedules,terms of payment and credit period. While preparing purchase budget the factors likethe opening and closing stock to be maintained, maximum and minimum stockquantities to be maintained, economic order quantity level, the resources available, thepolicy of management etc., should also be taken into account.
Budgeted Purchase Quantity = Budgeted Consumption Quantity +Required Closing Stock – Opening Stock.
9.7 DIRECT LABOUR BUDGETThe direct labour budget tells about the estimates of direct labour requirementsessential for carrying out the budgeted output. The quantity of labour, e.g. skilled,unskilled, semi-skilled etc are estimated first. The time taken by them can be measuredin terms of man hours. Thereafter, the total cost of labour is estimated by multiplyingthe rates of pay with the labour hours. The purpose of this budget is to ensureoptimum utilization of labour force.
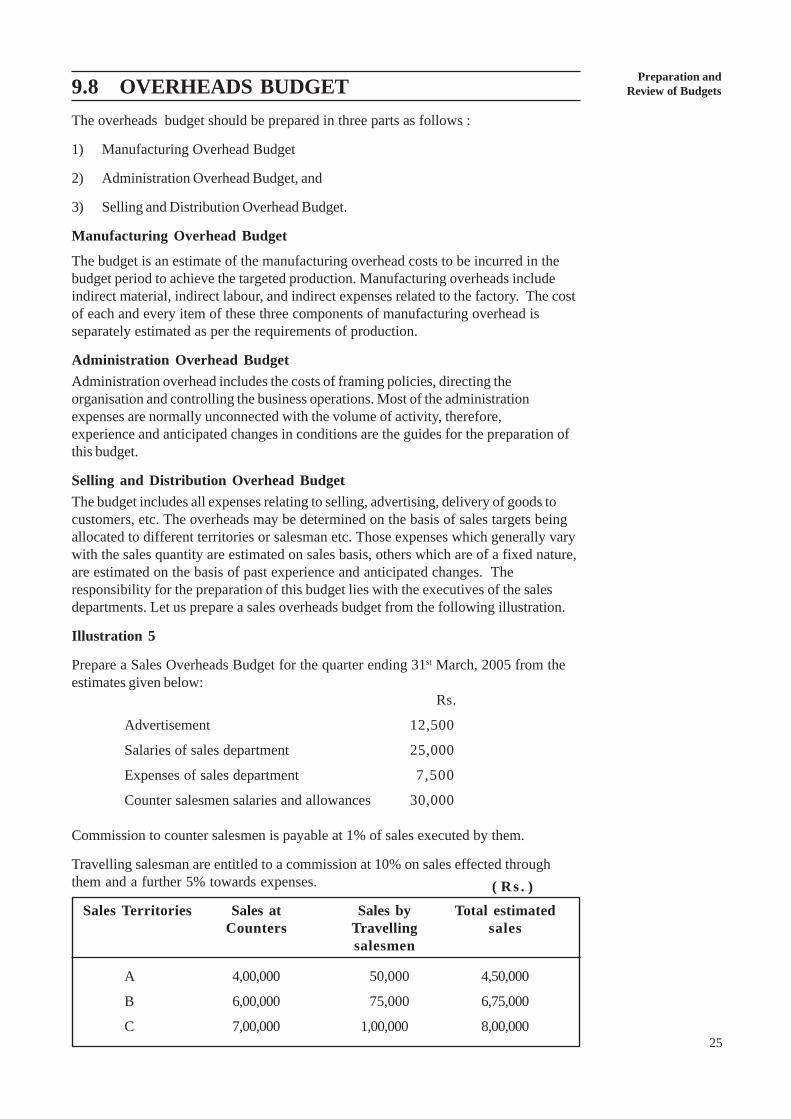
Preparation andReview of Budgets
25
9.8 OVERHEADS BUDGETThe overheads budget should be prepared in three parts as follows :
1) Manufacturing Overhead Budget
2) Administration Overhead Budget, and
3) Selling and Distribution Overhead Budget.
Manufacturing Overhead Budget
The budget is an estimate of the manufacturing overhead costs to be incurred in thebudget period to achieve the targeted production. Manufacturing overheads includeindirect material, indirect labour, and indirect expenses related to the factory. The costof each and every item of these three components of manufacturing overhead isseparately estimated as per the requirements of production.
Administration Overhead BudgetAdministration overhead includes the costs of framing policies, directing theorganisation and controlling the business operations. Most of the administrationexpenses are normally unconnected with the volume of activity, therefore,experience and anticipated changes in conditions are the guides for the preparation ofthis budget.
Selling and Distribution Overhead BudgetThe budget includes all expenses relating to selling, advertising, delivery of goods tocustomers, etc. The overheads may be determined on the basis of sales targets beingallocated to different territories or salesman etc. Those expenses which generally varywith the sales quantity are estimated on sales basis, others which are of a fixed nature,are estimated on the basis of past experience and anticipated changes. Theresponsibility for the preparation of this budget lies with the executives of the salesdepartments. Let us prepare a sales overheads budget from the following illustration.
Illustration 5
Prepare a Sales Overheads Budget for the quarter ending 31st March, 2005 from theestimates given below:
Rs.
Advertisement 12,500
Salaries of sales department 25,000
Expenses of sales department 7,500
Counter salesmen salaries and allowances 30,000
Commission to counter salesmen is payable at 1% of sales executed by them.
Travelling salesman are entitled to a commission at 10% on sales effected throughthem and a further 5% towards expenses.
Sales Territories Sales at Sales by Total estimatedCounters Travelling sales
salesmen
A 4,00,000 50,000 4,50,000
B 6,00,000 75,000 6,75,000
C 7,00,000 1,00,000 8,00,000
( Rs . )
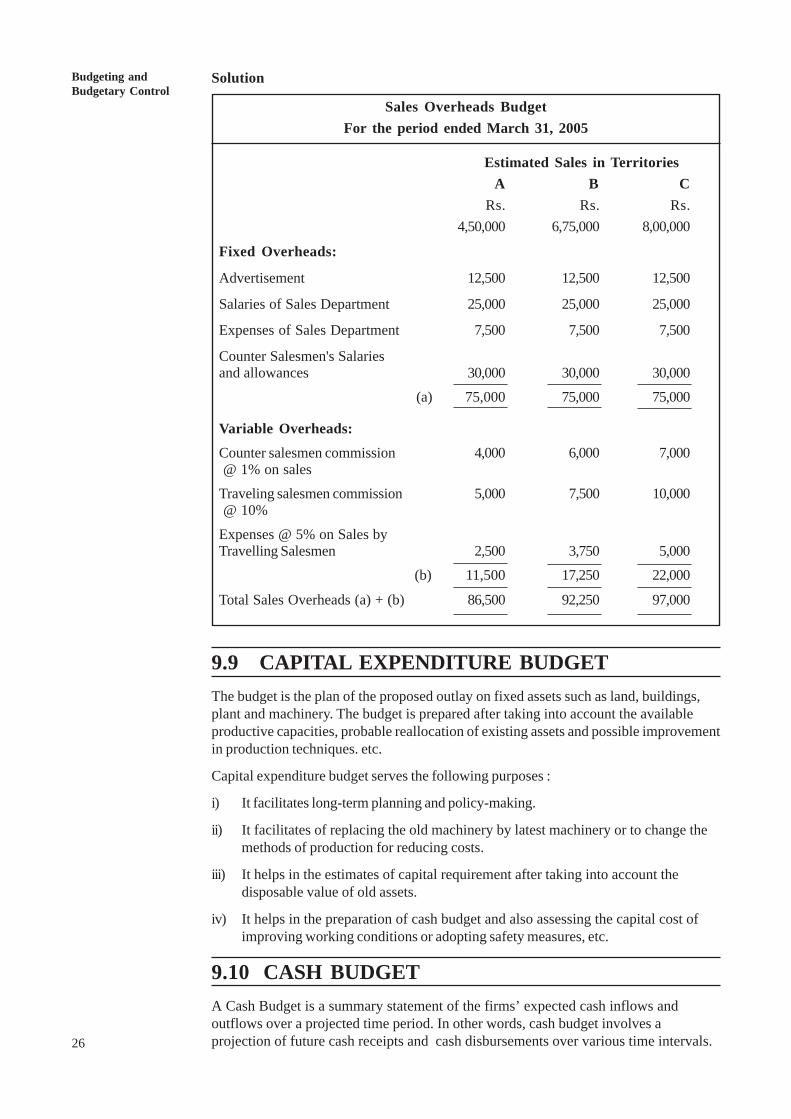
26
Budgeting andBudgetary Control
Solution
Sales Overheads BudgetFor the period ended March 31, 2005
Estimated Sales in TerritoriesA B C
Rs. Rs. Rs.4,50,000 6,75,000 8,00,000
Fixed Overheads:
Advertisement 12,500 12,500 12,500
Salaries of Sales Department 25,000 25,000 25,000
Expenses of Sales Department 7,500 7,500 7,500
Counter Salesmen's Salariesand allowances 30,000 30,000 30,000
(a) 75,000 75,000 75,000
Variable Overheads:Counter salesmen commission 4,000 6,000 7,000 @ 1% on sales
Traveling salesmen commission 5,000 7,500 10,000 @ 10%
Expenses @ 5% on Sales byTravelling Salesmen 2,500 3,750 5,000
(b) 11,500 17,250 22,000
Total Sales Overheads (a) + (b) 86,500 92,250 97,000
9.9 CAPITAL EXPENDITURE BUDGETThe budget is the plan of the proposed outlay on fixed assets such as land, buildings,plant and machinery. The budget is prepared after taking into account the availableproductive capacities, probable reallocation of existing assets and possible improvementin production techniques. etc.
Capital expenditure budget serves the following purposes :
i) It facilitates long-term planning and policy-making.
ii) It facilitates of replacing the old machinery by latest machinery or to change themethods of production for reducing costs.
iii) It helps in the estimates of capital requirement after taking into account thedisposable value of old assets.
iv) It helps in the preparation of cash budget and also assessing the capital cost ofimproving working conditions or adopting safety measures, etc.
9.10 CASH BUDGETA Cash Budget is a summary statement of the firms’ expected cash inflows andoutflows over a projected time period. In other words, cash budget involves aprojection of future cash receipts and cash disbursements over various time intervals.
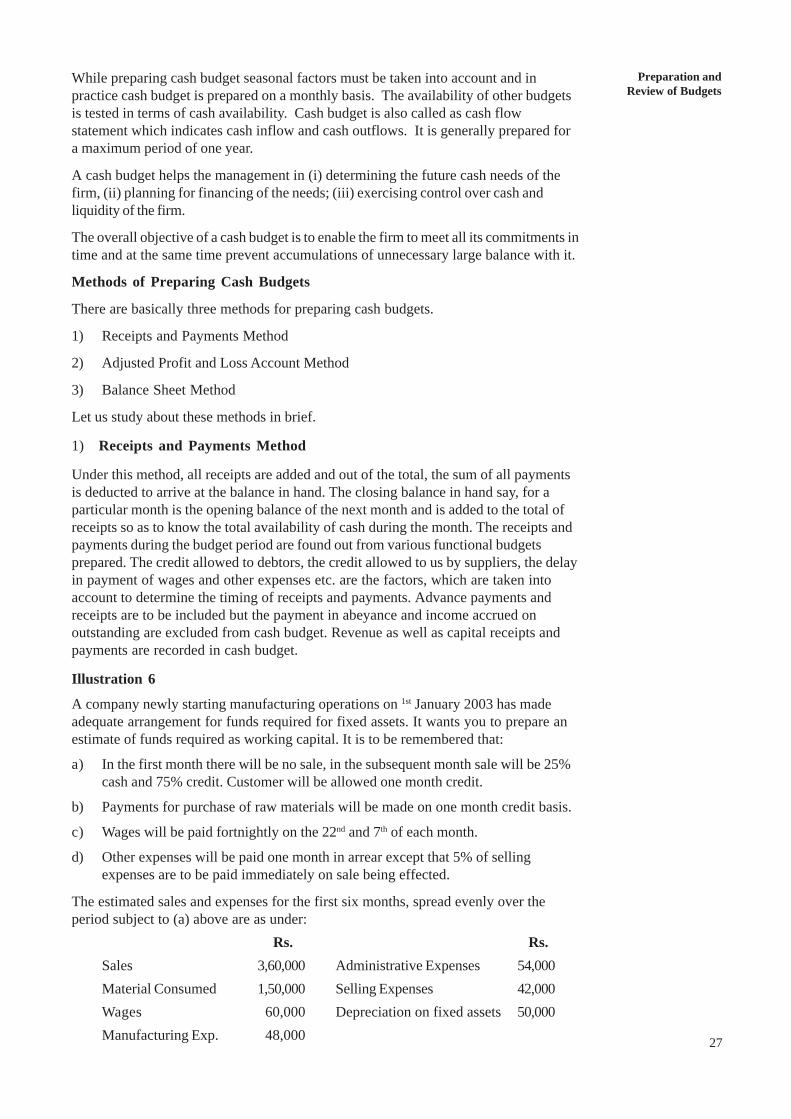
Preparation andReview of Budgets
27
While preparing cash budget seasonal factors must be taken into account and inpractice cash budget is prepared on a monthly basis. The availability of other budgetsis tested in terms of cash availability. Cash budget is also called as cash flowstatement which indicates cash inflow and cash outflows. It is generally prepared fora maximum period of one year.
A cash budget helps the management in (i) determining the future cash needs of thefirm, (ii) planning for financing of the needs; (iii) exercising control over cash andliquidity of the firm.
The overall objective of a cash budget is to enable the firm to meet all its commitments intime and at the same time prevent accumulations of unnecessary large balance with it.
Methods of Preparing Cash Budgets
There are basically three methods for preparing cash budgets.
1) Receipts and Payments Method
2) Adjusted Profit and Loss Account Method
3) Balance Sheet Method
Let us study about these methods in brief.
1) Receipts and Payments Method
Under this method, all receipts are added and out of the total, the sum of all paymentsis deducted to arrive at the balance in hand. The closing balance in hand say, for aparticular month is the opening balance of the next month and is added to the total ofreceipts so as to know the total availability of cash during the month. The receipts andpayments during the budget period are found out from various functional budgetsprepared. The credit allowed to debtors, the credit allowed to us by suppliers, the delayin payment of wages and other expenses etc. are the factors, which are taken intoaccount to determine the timing of receipts and payments. Advance payments andreceipts are to be included but the payment in abeyance and income accrued onoutstanding are excluded from cash budget. Revenue as well as capital receipts andpayments are recorded in cash budget.
Illustration 6
A company newly starting manufacturing operations on 1st January 2003 has madeadequate arrangement for funds required for fixed assets. It wants you to prepare anestimate of funds required as working capital. It is to be remembered that:
a) In the first month there will be no sale, in the subsequent month sale will be 25%cash and 75% credit. Customer will be allowed one month credit.
b) Payments for purchase of raw materials will be made on one month credit basis.
c) Wages will be paid fortnightly on the 22nd and 7th of each month.
d) Other expenses will be paid one month in arrear except that 5% of sellingexpenses are to be paid immediately on sale being effected.
The estimated sales and expenses for the first six months, spread evenly over theperiod subject to (a) above are as under:
Rs. Rs.Sales 3,60,000 Administrative Expenses 54,000Material Consumed 1,50,000 Selling Expenses 42,000Wages 60,000 Depreciation on fixed assets 50,000Manufacturing Exp. 48,000
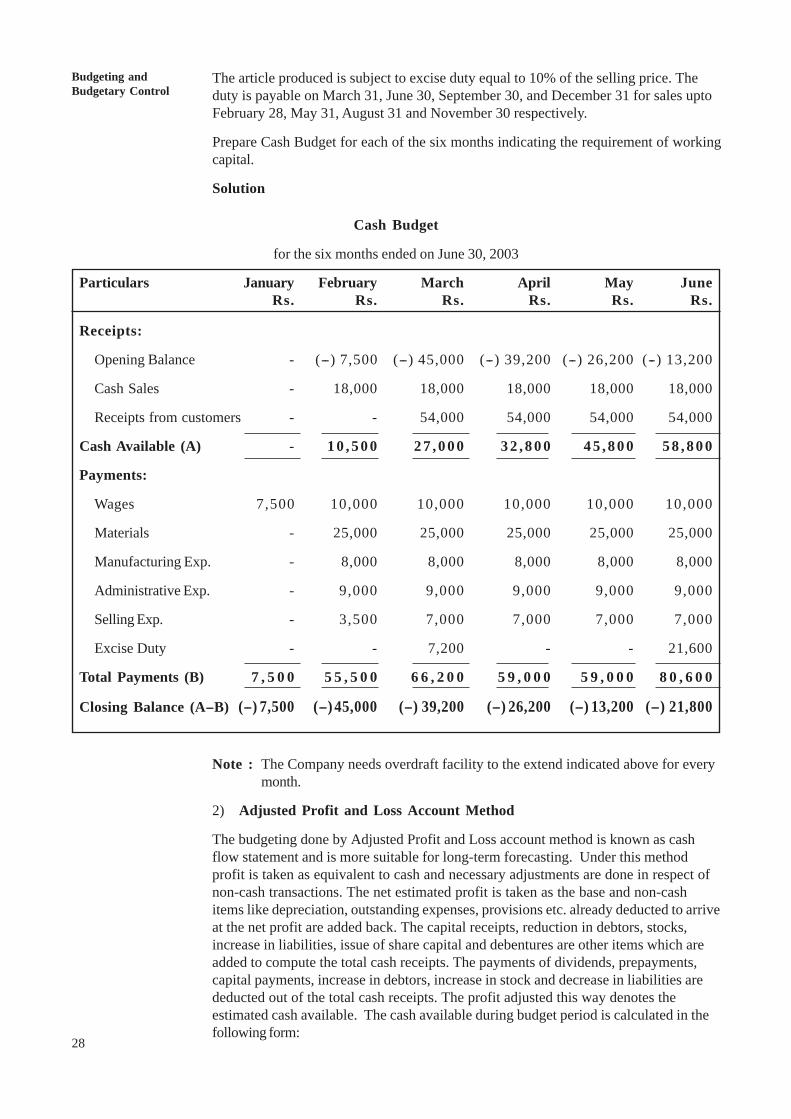
28
Budgeting andBudgetary Control
The article produced is subject to excise duty equal to 10% of the selling price. Theduty is payable on March 31, June 30, September 30, and December 31 for sales uptoFebruary 28, May 31, August 31 and November 30 respectively.
Prepare Cash Budget for each of the six months indicating the requirement of workingcapital.
Solution
Cash Budget
for the six months ended on June 30, 2003
Particulars January February March April May JuneRs. Rs. Rs. Rs. Rs. Rs.
Receipts:
Opening Balance - (--) 7,500 (--) 45,000 (--) 39,200 (--) 26,200 (--) 13,200
Cash Sales - 18,000 18,000 18,000 18,000 18,000
Receipts from customers - - 54,000 54,000 54,000 54,000
Cash Available (A) - 1 0 , 5 0 0 2 7 , 0 0 0 3 2 , 8 0 0 4 5 , 8 0 0 5 8 , 8 0 0
Payments:
Wages 7,500 10,000 10,000 10,000 10,000 10,000
Materials - 25,000 25,000 25,000 25,000 25,000
Manufacturing Exp. - 8,000 8,000 8,000 8,000 8,000
Administrative Exp. - 9,000 9,000 9,000 9,000 9,000
Selling Exp. - 3,500 7,000 7,000 7,000 7,000
Excise Duty - - 7,200 - - 21,600
Total Payments (B) 7 , 5 0 0 5 5 , 5 0 0 6 6 , 2 0 0 5 9 , 0 0 0 5 9 , 0 0 0 8 0 , 6 0 0
Closing Balance (A--B) (--) 7,500 (--) 45,000 (--) 39,200 (--) 26,200 (--) 13,200 (--) 21,800
Note : The Company needs overdraft facility to the extend indicated above for everymonth.
2) Adjusted Profit and Loss Account Method
The budgeting done by Adjusted Profit and Loss account method is known as cashflow statement and is more suitable for long-term forecasting. Under this methodprofit is taken as equivalent to cash and necessary adjustments are done in respect ofnon-cash transactions. The net estimated profit is taken as the base and non-cashitems like depreciation, outstanding expenses, provisions etc. already deducted to arriveat the net profit are added back. The capital receipts, reduction in debtors, stocks,increase in liabilities, issue of share capital and debentures are other items which areadded to compute the total cash receipts. The payments of dividends, prepayments,capital payments, increase in debtors, increase in stock and decrease in liabilities arededucted out of the total cash receipts. The profit adjusted this way denotes theestimated cash available. The cash available during budget period is calculated in thefollowing form:
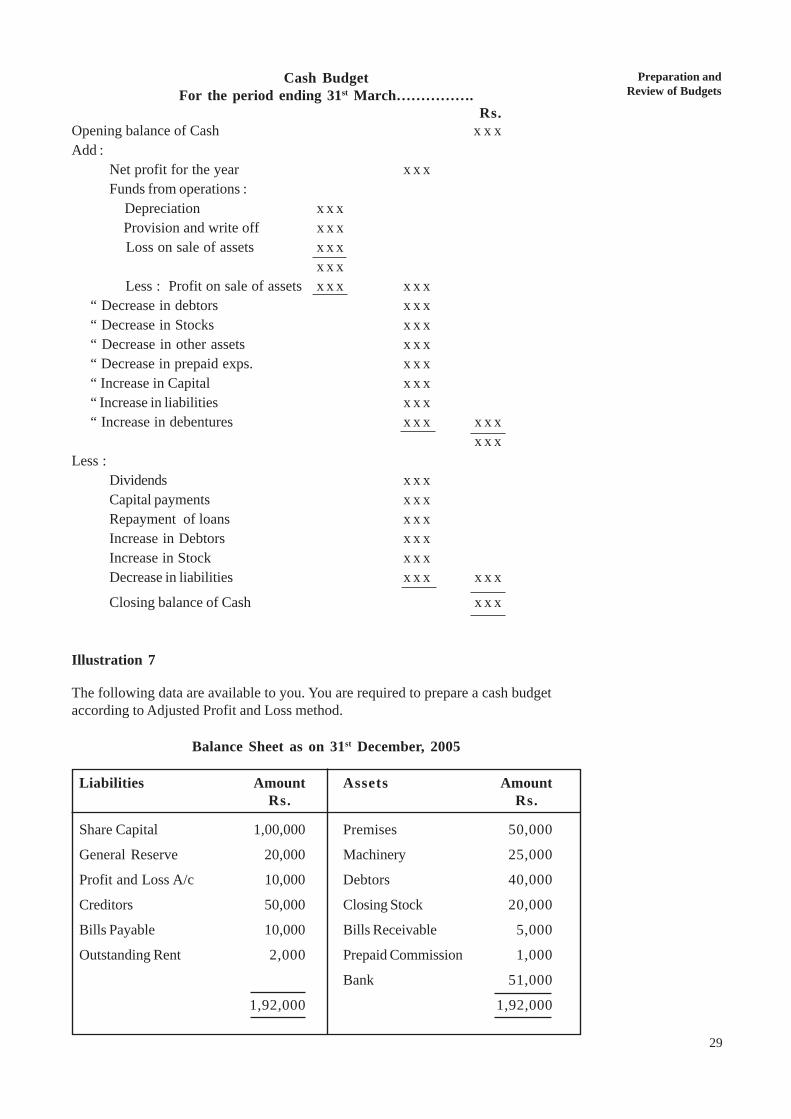
Preparation andReview of Budgets
29
Cash BudgetFor the period ending 31st March…………….
Rs.Opening balance of Cash x x xAdd :
Net profit for the year x x xFunds from operations :
Depreciation x x x Provision and write off x x x Loss on sale of assets x x x
x x x Less : Profit on sale of assets x x x x x x“ Decrease in debtors x x x“ Decrease in Stocks x x x“ Decrease in other assets x x x“ Decrease in prepaid exps. x x x“ Increase in Capital x x x“ Increase in liabilities x x x“ Increase in debentures x x x x x x
x x xLess :
Dividends x x xCapital payments x x xRepayment of loans x x xIncrease in Debtors x x xIncrease in Stock x x xDecrease in liabilities x x x x x x
Closing balance of Cash x x x
Illustration 7
The following data are available to you. You are required to prepare a cash budgetaccording to Adjusted Profit and Loss method.
Balance Sheet as on 31st December, 2005
Liabilities Amount Assets AmountRs. Rs.
Share Capital 1,00,000 Premises 50,000
General Reserve 20,000 Machinery 25,000
Profit and Loss A/c 10,000 Debtors 40,000
Creditors 50,000 Closing Stock 20,000
Bills Payable 10,000 Bills Receivable 5,000
Outstanding Rent 2,000 Prepaid Commission 1,000
Bank 51,000
1,92,000 1,92,000
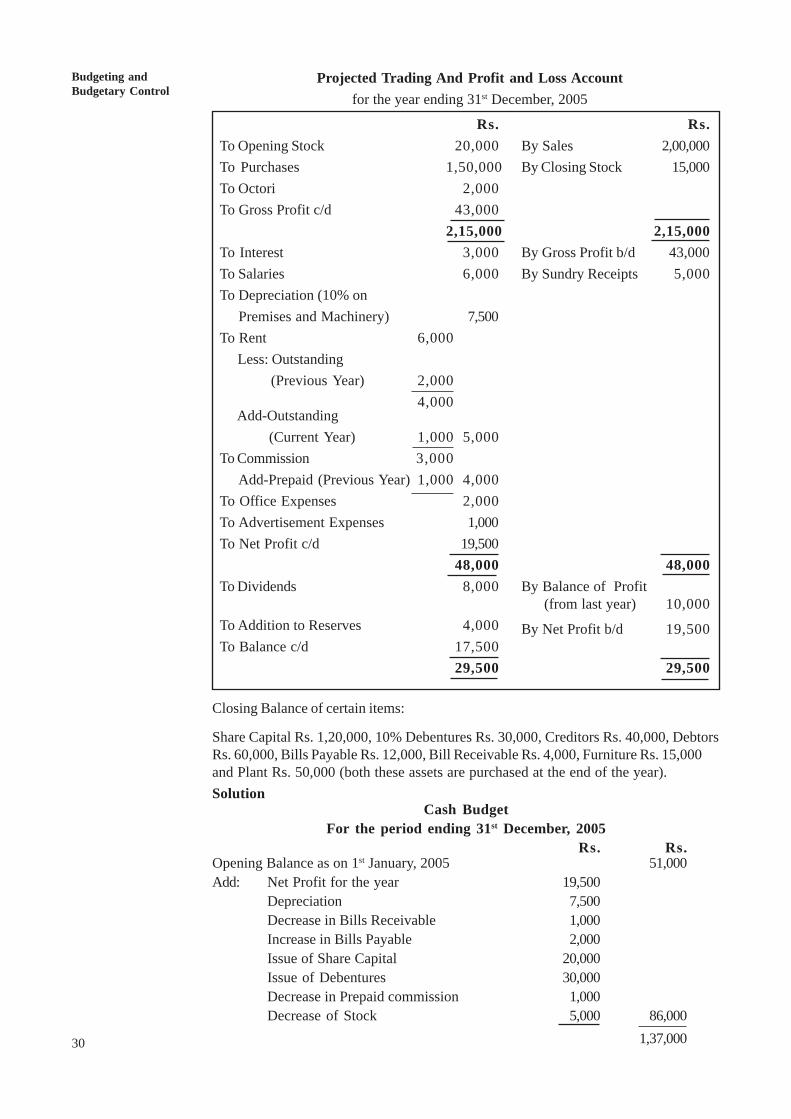
30
Budgeting andBudgetary Control
Projected Trading And Profit and Loss Accountfor the year ending 31st December, 2005
Rs. Rs.To Opening Stock 20,000 By Sales 2,00,000To Purchases 1,50,000 By Closing Stock 15,000To Octori 2,000To Gross Profit c/d 43,000
2,15,000 2,15,000To Interest 3,000 By Gross Profit b/d 43,000To Salaries 6,000 By Sundry Receipts 5,000To Depreciation (10% on
Premises and Machinery) 7,500To Rent 6,000
Less: Outstanding(Previous Year) 2,000
4,000 Add-Outstanding
(Current Year) 1,000 5,000To Commission 3,000
Add-Prepaid (Previous Year) 1,000 4,000To Office Expenses 2,000To Advertisement Expenses 1,000To Net Profit c/d 19,500
48,000 48,000To Dividends 8,000 By Balance of Profit
(from last year) 10,000To Addition to Reserves 4,000 By Net Profit b/d 19,500To Balance c/d 17,500
29,500 29,500
Closing Balance of certain items:
Share Capital Rs. 1,20,000, 10% Debentures Rs. 30,000, Creditors Rs. 40,000, DebtorsRs. 60,000, Bills Payable Rs. 12,000, Bill Receivable Rs. 4,000, Furniture Rs. 15,000and Plant Rs. 50,000 (both these assets are purchased at the end of the year).Solution
Cash BudgetFor the period ending 31st December, 2005
Rs. Rs.Opening Balance as on 1st January, 2005 51,000Add: Net Profit for the year 19,500
Depreciation 7,500Decrease in Bills Receivable 1,000Increase in Bills Payable 2,000Issue of Share Capital 20,000Issue of Debentures 30,000Decrease in Prepaid commission 1,000Decrease of Stock 5,000 86,000
1,37,000
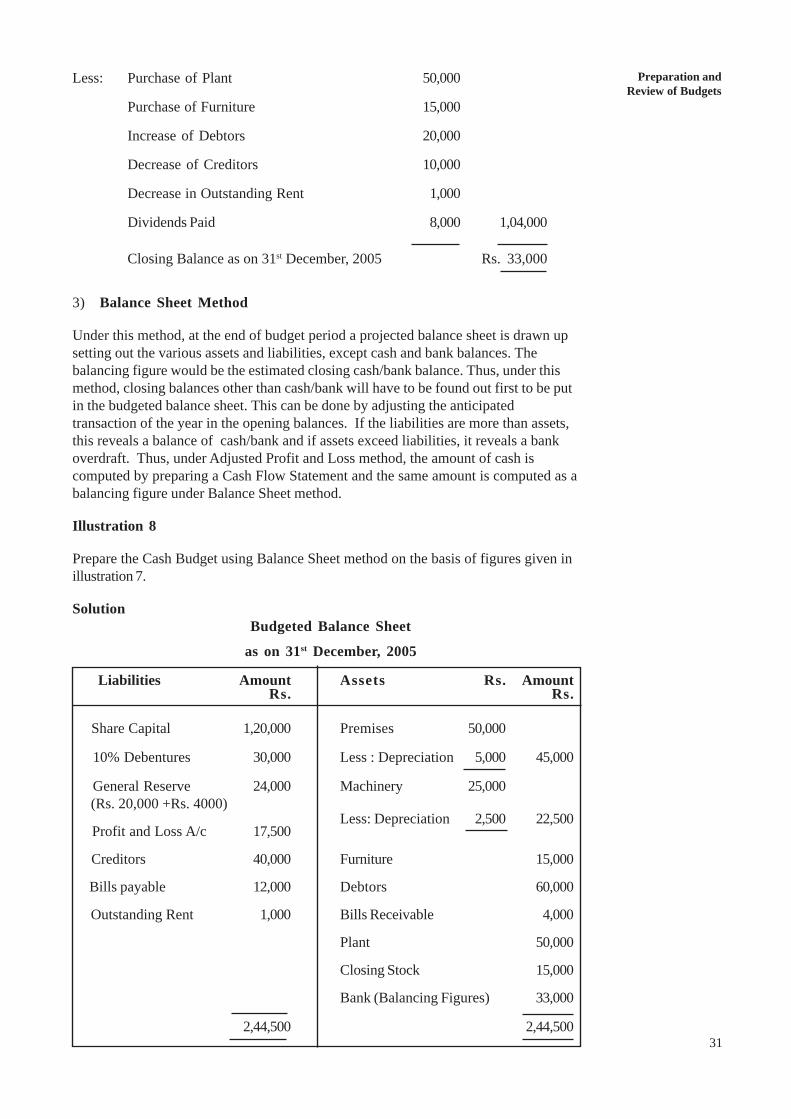
Preparation andReview of Budgets
31
Less: Purchase of Plant 50,000
Purchase of Furniture 15,000
Increase of Debtors 20,000
Decrease of Creditors 10,000
Decrease in Outstanding Rent 1,000
Dividends Paid 8,000 1,04,000
Closing Balance as on 31st December, 2005 Rs. 33,000
3) Balance Sheet Method
Under this method, at the end of budget period a projected balance sheet is drawn upsetting out the various assets and liabilities, except cash and bank balances. Thebalancing figure would be the estimated closing cash/bank balance. Thus, under thismethod, closing balances other than cash/bank will have to be found out first to be putin the budgeted balance sheet. This can be done by adjusting the anticipatedtransaction of the year in the opening balances. If the liabilities are more than assets,this reveals a balance of cash/bank and if assets exceed liabilities, it reveals a bankoverdraft. Thus, under Adjusted Profit and Loss method, the amount of cash iscomputed by preparing a Cash Flow Statement and the same amount is computed as abalancing figure under Balance Sheet method.
Illustration 8
Prepare the Cash Budget using Balance Sheet method on the basis of figures given inillustration 7.
SolutionBudgeted Balance Sheet
as on 31st December, 2005
Liabilities Amount Assets Rs. AmountRs. Rs.
Share Capital 1,20,000 Premises 50,000
10% Debentures 30,000 Less : Depreciation 5,000 45,000
General Reserve 24,000 Machinery 25,000 (Rs. 20,000 +Rs. 4000)
Less: Depreciation 2,500 22,500 Profit and Loss A/c 17,500
Creditors 40,000 Furniture 15,000
Bills payable 12,000 Debtors 60,000
Outstanding Rent 1,000 Bills Receivable 4,000
Plant 50,000
Closing Stock 15,000
Bank (Balancing Figures) 33,000
2,44,500 2,44,500
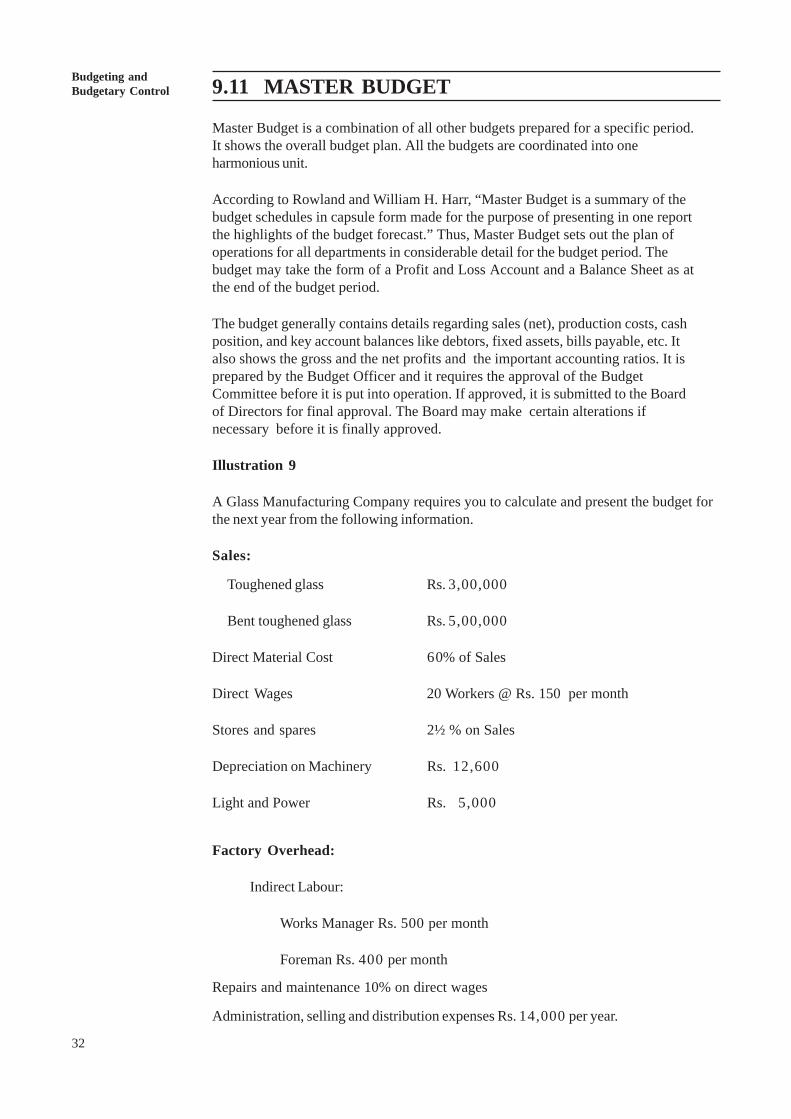
32
Budgeting andBudgetary Control 9.11 MASTER BUDGET
Master Budget is a combination of all other budgets prepared for a specific period.It shows the overall budget plan. All the budgets are coordinated into oneharmonious unit.
According to Rowland and William H. Harr, “Master Budget is a summary of thebudget schedules in capsule form made for the purpose of presenting in one reportthe highlights of the budget forecast.” Thus, Master Budget sets out the plan ofoperations for all departments in considerable detail for the budget period. Thebudget may take the form of a Profit and Loss Account and a Balance Sheet as atthe end of the budget period.
The budget generally contains details regarding sales (net), production costs, cashposition, and key account balances like debtors, fixed assets, bills payable, etc. Italso shows the gross and the net profits and the important accounting ratios. It isprepared by the Budget Officer and it requires the approval of the BudgetCommittee before it is put into operation. If approved, it is submitted to the Boardof Directors for final approval. The Board may make certain alterations ifnecessary before it is finally approved.
Illustration 9
A Glass Manufacturing Company requires you to calculate and present the budget forthe next year from the following information.
Sales:
Toughened glass Rs. 3,00,000
Bent toughened glass Rs. 5,00,000
Direct Material Cost 60% of Sales
Direct Wages 20 Workers @ Rs. 150 per month
Stores and spares 2½ % on Sales
Depreciation on Machinery Rs. 12,600
Light and Power Rs. 5,000
Factory Overhead:
Indirect Labour:
Works Manager Rs. 500 per month
Foreman Rs. 400 per month
Repairs and maintenance 10% on direct wages
Administration, selling and distribution expenses Rs. 14,000 per year.
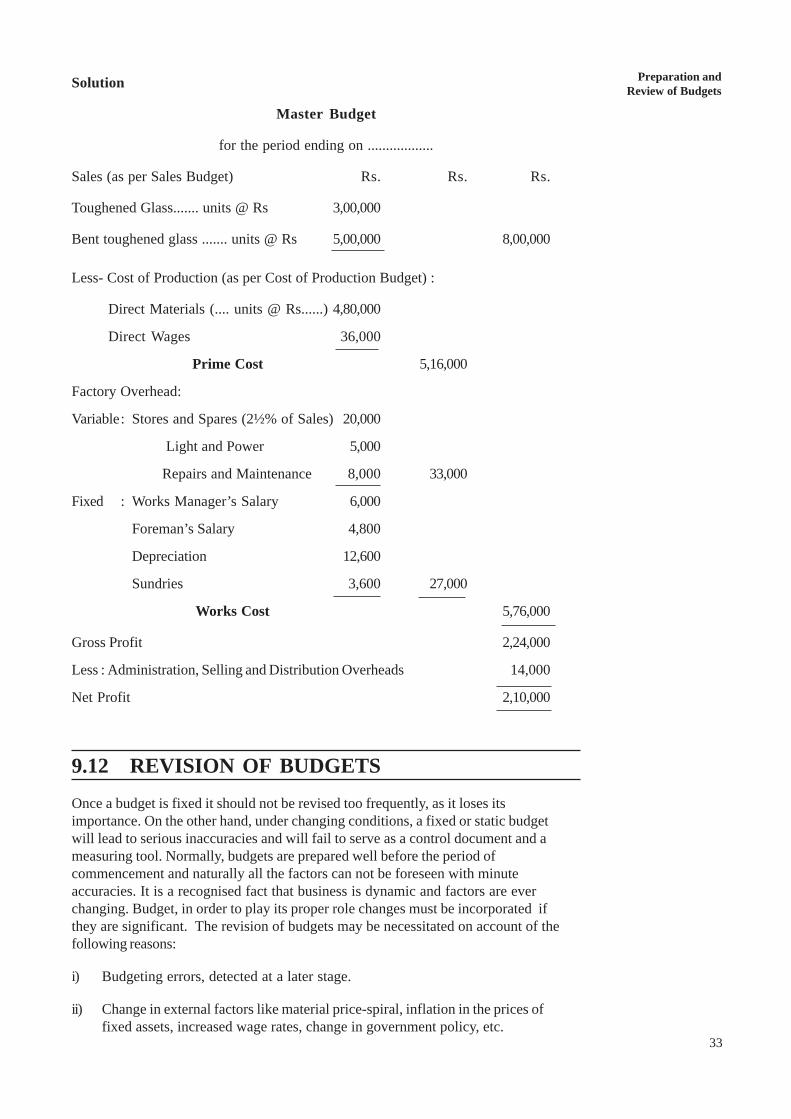
Preparation andReview of Budgets
33
Solution
Master Budget
for the period ending on ..................
Sales (as per Sales Budget) Rs. Rs. Rs.
Toughened Glass....... units @ Rs 3,00,000
Bent toughened glass ....... units @ Rs 5,00,000 8,00,000
Less- Cost of Production (as per Cost of Production Budget) :
Direct Materials (.... units @ Rs......) 4,80,000
Direct Wages 36,000
Prime Cost 5,16,000
Factory Overhead:
Variable: Stores and Spares (2½% of Sales) 20,000
Light and Power 5,000
Repairs and Maintenance 8,000 33,000
Fixed : Works Manager’s Salary 6,000
Foreman’s Salary 4,800
Depreciation 12,600
Sundries 3,600 27,000
Works Cost 5,76,000
Gross Profit 2,24,000
Less : Administration, Selling and Distribution Overheads 14,000
Net Profit 2,10,000
9.12 REVISION OF BUDGETSOnce a budget is fixed it should not be revised too frequently, as it loses itsimportance. On the other hand, under changing conditions, a fixed or static budgetwill lead to serious inaccuracies and will fail to serve as a control document and ameasuring tool. Normally, budgets are prepared well before the period ofcommencement and naturally all the factors can not be foreseen with minuteaccuracies. It is a recognised fact that business is dynamic and factors are everchanging. Budget, in order to play its proper role changes must be incorporated ifthey are significant. The revision of budgets may be necessitated on account of thefollowing reasons:
i) Budgeting errors, detected at a later stage.
ii) Change in external factors like material price-spiral, inflation in the prices offixed assets, increased wage rates, change in government policy, etc.
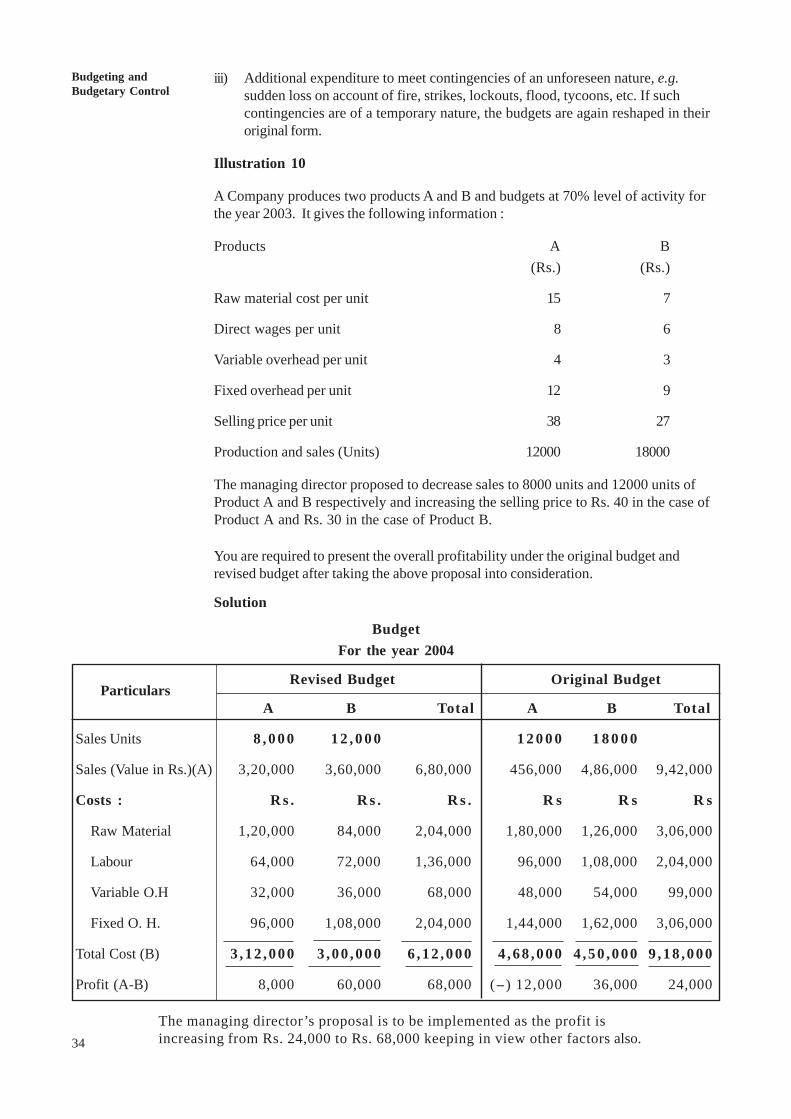
34
Budgeting andBudgetary Control
iii) Additional expenditure to meet contingencies of an unforeseen nature, e.g.sudden loss on account of fire, strikes, lockouts, flood, tycoons, etc. If suchcontingencies are of a temporary nature, the budgets are again reshaped in theiroriginal form.
Illustration 10
A Company produces two products A and B and budgets at 70% level of activity forthe year 2003. It gives the following information :
Products A B(Rs.) (Rs.)
Raw material cost per unit 15 7
Direct wages per unit 8 6
Variable overhead per unit 4 3
Fixed overhead per unit 12 9
Selling price per unit 38 27
Production and sales (Units) 12000 18000
The managing director proposed to decrease sales to 8000 units and 12000 units ofProduct A and B respectively and increasing the selling price to Rs. 40 in the case ofProduct A and Rs. 30 in the case of Product B.
You are required to present the overall profitability under the original budget andrevised budget after taking the above proposal into consideration.
Solution
BudgetFor the year 2004
Revised Budget Original Budget
A B Total A B Total
Sales Units 8 , 0 0 0 1 2 , 0 0 0 1 2 0 0 0 1 8 0 0 0
Sales (Value in Rs.)(A) 3,20,000 3,60,000 6,80,000 456,000 4,86,000 9,42,000
Costs : R s . R s . R s . R s R s R s
Raw Material 1,20,000 84,000 2,04,000 1,80,000 1,26,000 3,06,000
Labour 64,000 72,000 1,36,000 96,000 1,08,000 2,04,000
Variable O.H 32,000 36,000 68,000 48,000 54,000 99,000
Fixed O. H. 96,000 1,08,000 2,04,000 1,44,000 1,62,000 3,06,000
Total Cost (B) 3 ,12 ,000 3 ,00 ,000 6 ,12 ,000 4 ,68 ,000 4 ,50 ,000 9 ,18 ,000
Profit (A-B) 8,000 60,000 68,000 (--) 12,000 36,000 24,000
The managing director’s proposal is to be implemented as the profit isincreasing from Rs. 24,000 to Rs. 68,000 keeping in view other factors also.
Particulars
Preparation andReview of Budgets
35
9.13 BUDGET REPORTProper reporting is an essential element in budgetary control. The management mustbe regularly informed about the results of various functions so that follow up actionscan be taken up without loss of time. The periodicity of reports depends on the natureof operations involved. The budgetary control reports are prepared on the basis of thebudget reports. The comparison of budgeted and actual figures is made and deviationstaken out- all the relevant figures are presented in the control reports. On the basis ofthe principle of management by exception, remedial and corrective action is taken.The report may indicate the necessity of revision of the budget also.
The budget report should be prompt and factual and should have the requisite degree ofaccuracy. The report should be prepared in such a manner that it reveals theresponsibility of a department or an executive and give full reasons for the variancesso that proper corrective action can be taken.
Check Your Progress
1) State the factors that should be kept in mind while preparing Sales Budget.
a) ……………………….. d) …………………………….
b) ………………………… e) …………………………….
c) ………………………… f) …………………………….
2) What are the components of functional budgets ?
..............................................................................................................................
..............................................................................................................................
..............................................................................................................................
..............................................................................................................................
3) Specify the objectives of preparing capital expenditure budget.
..............................................................................................................................
..............................................................................................................................
..............................................................................................................................
..............................................................................................................................
4) Why does revision of budget necessary ?
..............................................................................................................................
..............................................................................................................................
..............................................................................................................................
..............................................................................................................................
5) Fill in the blanks :
a) .................. is responsible for the preparation and execution of sales budget.
b) Production budget is based on ...................................... budget.
c) Purchase budget must correlate .......................... budget and ....................budget.
36
Budgeting andBudgetary Control
d) .............................. budget is the combination of all other budgets.
e) The preparation of cash budget by the method of adjusted profit and lossaccount is also known as............................... .
f) Master budget is the summary of all components of .............................. .
6) State whether each of the following statement is true or false.
a) The cost of materials, labor and manufacturing overheads constitutes totalcost of sales
b) The purpose of Direct labour budget is to ensure optimum utilisation oflabour force.
c) Direct materials are generally included in overhead budget.
d) Once a budget is fixed there is no need to incorporate the changes in thebudget however significant they are.
e) Cash budget indicates the amount of loan required as well as the time whenit is needed.
f) A Master Budget is the master plan drawn up by the organisation for thebudget period.
9.14 LET US SUM UPBudgeting is the main instrument for projecting the future costs and revenues and forfinancial control of the organisation. Preparation of budgets involves a number offorecasts or projections. It starts with sales forecasting and ends with the compilationof the master budget. The sales budget is the keystone in planning and control ofoperations of a business. Sales forecast serves as a base for the sales budget. TheSales Manager is responsible for the preparation and execution of sales budget. Inaddition to sales budget, other functional budgets are also prepared. The otherfunctional budgets are : i) Production Budget, ii) Cost of Production Budget,iii) Material Budget, iv) Purchase Budget, v) Direct Labour Budget,vi) Manufacturing Overhead Budget, vii) Administration Overhead Budget,viii) Selling and Distribution Overhead Budget, and ix) Capital Expenditure Budget.
A cash budget is a summary statement of the firms expected cash inflows andoutflows over a projected time period. It is generally prepared for a maximumperiod of one year. There are three methods of preparing cash budgets. They are :i) Receipts and Payment Method, ii) Adjusted Profit and Loss Account Method, andiii) Balance Sheet Method.
A master budget is a combination of all other budgets prepared for a specificperiod. It shows the overall budget plan. The budget generally contains detailsregarding sales, production costs, cash position and the key account balances. Italso shows profit and important accounting ratios. Revision of budgets isnecessary to incorporate the changing conditions for effective control. Revision ofbudget may be necessitated due to budgeting errors, change in external factors andadditional expenditure to meet unforeseen contingencies. Proper reporting is anessential element in budgetory control. The management must be regularlyinformed about the results of various functions so that remedial and correctiveaction may be taken well in time. The report may also indicate the necessity ofrevision of budget also.
[ ]
[ ]
[ ]
[ ]
[ ]
[ ]
Preparation andReview of Budgets
37
9.15 KEY WORDSCash Budget : A summary statement of future cash receipts and payments over aprojected time period.
Production Budget : A forecast of production expressed quantitatively for the budgetperiod.
Sales Budget : A budget expressed in quantitative terms of units expected to be soldand the value expected to be realised for the budget period.
9.16 ANSWERS TO CHECK YOUR PROGRESS5) a) Sales Manager b) Sales c) Sales, production d) Master Budget
d) Cash flow statement f) Functional budget
6) a) False b) True c) False d) False e) True f) True
9.17 TERMINAL QUESTIONS1) What is a Sales Budget ? How is it prepared ?
2) Write short notes on the following :
i) Sales Budget
ii) Material Budget
iii) Production Cost Budget
iv) Overhead Budget
3) What is a Cash Budget ? How is it prepared ?
4) What is a Master Budget ? What are its Components ?
5) From the following particulars, prepare a production budget of a manufacturingcompany for the year ended 31st March, 2003.
Product Sales Budget Estimated Stock (Units)(Units) 1-4-2002 31-3-2003
A 75,000 7,000 7,500
B 50,000 2,500 7,250
C 35,000 4,000 4,000
(Ans. A : 75,500 Units, B : 54, 750 Units, C : 35,000 Units)
6) Prepare a material procurement budget (in units) from the following information :
Estimated sales of a product 40,000 units. Each unit of the product requires 3units of Material A and 4 units of Material B. Estimated opening balance at thebeginning of the next year:
UnitsFinished Products 5,000
Material A 19,000
Material B 31,000
The desired level of closing balances at the end of the next year :
Finished Products 7,000
38
Budgeting andBudgetary Control
Material A 23,000
Material B 35,000
(Ans. Production 42,000 units, Material required : Material A : 1,30,000units, Material B : 1,72,000 units)
7) The budgeted expenses for production of 10,000 units in a manufacturingcompany are given below. From the information prepare a budget for theproduction of (a) 8000 units and (b) 6000 units. Assume that the administrationexpenses are fixed for all levels of production:
Rs. Per unit
Materials 70
Labour 25
Variable Overheads 20
Fixed Overheads (Rs. 1,00,000) 10
Variable Overheads(Direct) 5
Selling expenses (10% fixed) 13
Administration expenses (Rs. 50,000) 5
Distribution expenses (20% Fixed) 7
Rs.155
( Ans. (a) Rs. 12,75,400 (b) Rs. 10,00,800 )
8) A Company produces and sells three products : Product A, Product B andProduct C. The Company has divided its market into two areas as North zoneand South zone. The actual sales for the year 2003 were as follows :
North Zone South Zone
Products Price per No. of Units Price per No. of UnitsUnit (Rs.) Unit (Rs.)
A 12 8,00,000 12 5,00,000
B 15 5,00,000 15 7,00,000
C 16 6,00,000 16 6,00,000
For the current year i.e, 2002, it is estimated that the sales of product A will go upby 10% in South zone and of Product C by 50,000 units in North zone. The companyplans to launch an intensive advertisement campaign through which budgeted figuresfor product B are to be increased by 20% in both the zones.
There will be no change in the pries of the product A and C but the price of Product Bwill be reduced by Rs. 1.
You are required to prepare a sales budget for the year 2003.
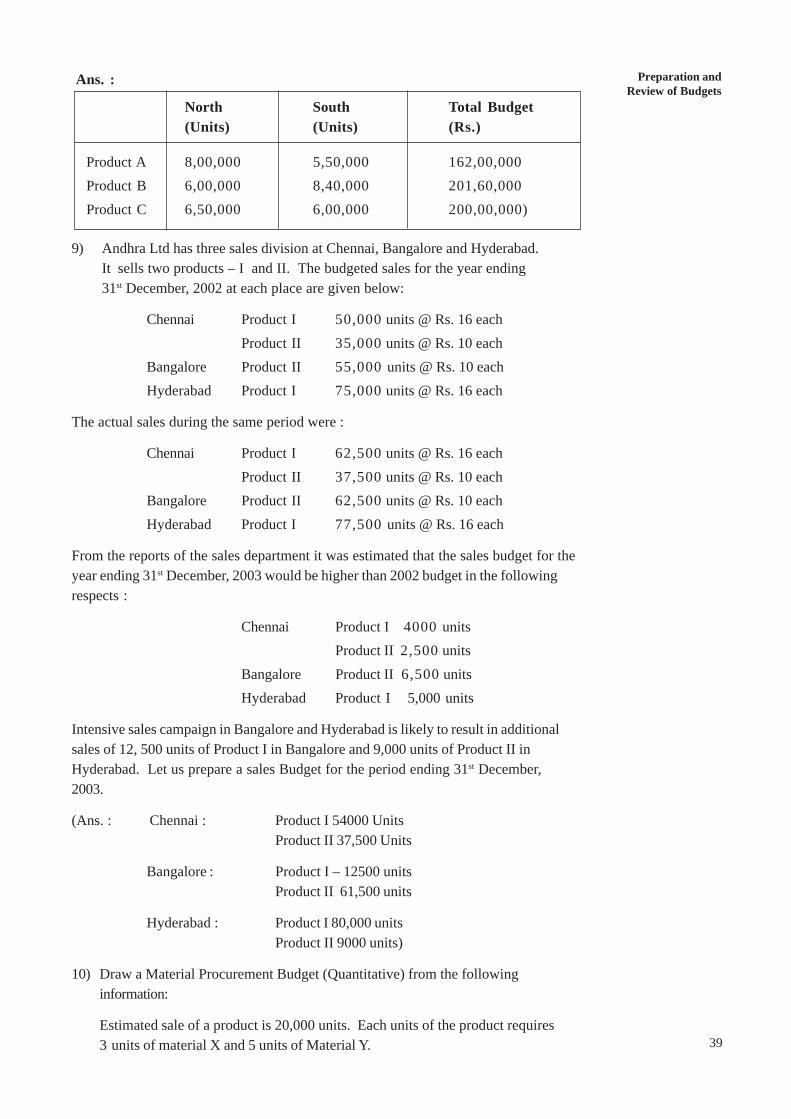
Preparation andReview of Budgets
39
North South Total Budget(Units) (Units) (Rs.)
Product A 8,00,000 5,50,000 162,00,000Product B 6,00,000 8,40,000 201,60,000Product C 6,50,000 6,00,000 200,00,000)
9) Andhra Ltd has three sales division at Chennai, Bangalore and Hyderabad.It sells two products – I and II. The budgeted sales for the year ending31st December, 2002 at each place are given below:
Chennai Product I 50,000 units @ Rs. 16 eachProduct II 35,000 units @ Rs. 10 each
Bangalore Product II 55,000 units @ Rs. 10 eachHyderabad Product I 75,000 units @ Rs. 16 each
The actual sales during the same period were :
Chennai Product I 62,500 units @ Rs. 16 eachProduct II 37,500 units @ Rs. 10 each
Bangalore Product II 62,500 units @ Rs. 10 eachHyderabad Product I 77,500 units @ Rs. 16 each
From the reports of the sales department it was estimated that the sales budget for theyear ending 31st December, 2003 would be higher than 2002 budget in the followingrespects :
Chennai Product I 4000 unitsProduct II 2,500 units
Bangalore Product II 6,500 unitsHyderabad Product I 5,000 units
Intensive sales campaign in Bangalore and Hyderabad is likely to result in additionalsales of 12, 500 units of Product I in Bangalore and 9,000 units of Product II inHyderabad. Let us prepare a sales Budget for the period ending 31st December,2003.
(Ans. : Chennai : Product I 54000 UnitsProduct II 37,500 Units
Bangalore : Product I – 12500 unitsProduct II 61,500 units
Hyderabad : Product I 80,000 unitsProduct II 9000 units)
10) Draw a Material Procurement Budget (Quantitative) from the followinginformation:
Estimated sale of a product is 20,000 units. Each units of the product requires3 units of material X and 5 units of Material Y.
Ans. :
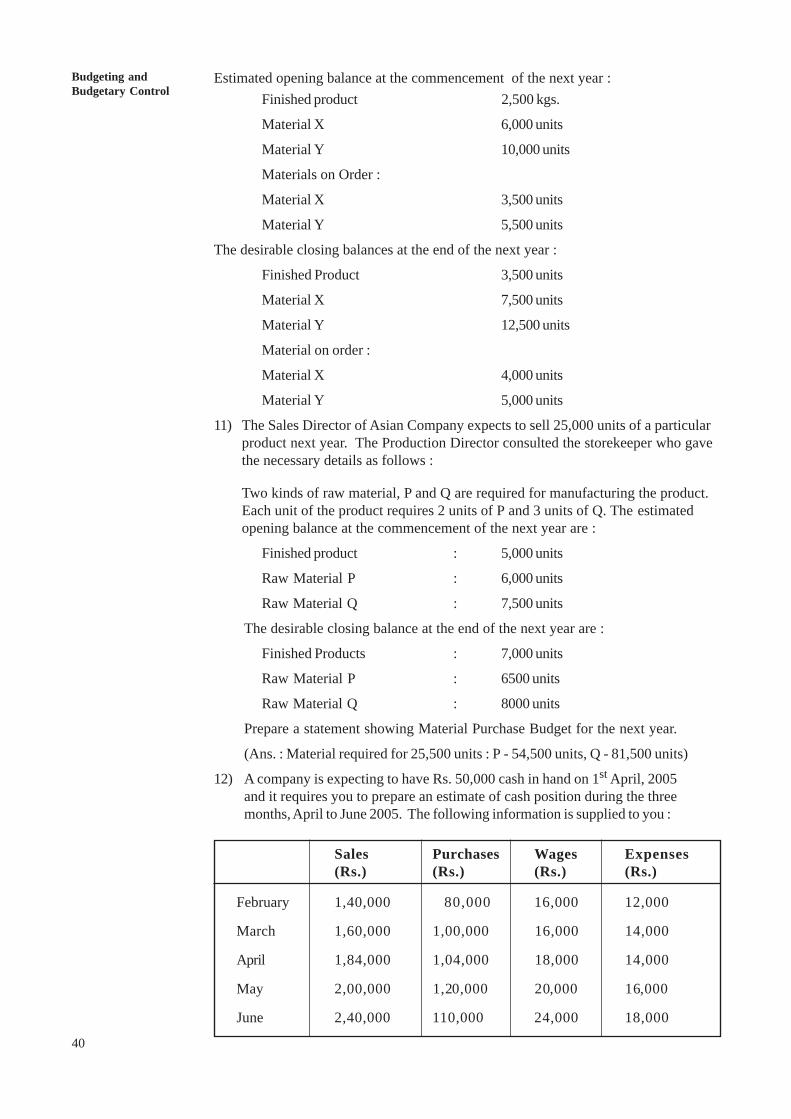
40
Budgeting andBudgetary Control
Estimated opening balance at the commencement of the next year :Finished product 2,500 kgs.
Material X 6,000 units
Material Y 10,000 units
Materials on Order :
Material X 3,500 units
Material Y 5,500 units
The desirable closing balances at the end of the next year :
Finished Product 3,500 units
Material X 7,500 units
Material Y 12,500 units
Material on order :
Material X 4,000 units
Material Y 5,000 units
11) The Sales Director of Asian Company expects to sell 25,000 units of a particularproduct next year. The Production Director consulted the storekeeper who gavethe necessary details as follows :
Two kinds of raw material, P and Q are required for manufacturing the product.Each unit of the product requires 2 units of P and 3 units of Q. The estimatedopening balance at the commencement of the next year are :
Finished product : 5,000 units
Raw Material P : 6,000 units
Raw Material Q : 7,500 units
The desirable closing balance at the end of the next year are :
Finished Products : 7,000 units
Raw Material P : 6500 units
Raw Material Q : 8000 units
Prepare a statement showing Material Purchase Budget for the next year.
(Ans. : Material required for 25,500 units : P - 54,500 units, Q - 81,500 units)
12) A company is expecting to have Rs. 50,000 cash in hand on 1st April, 2005and it requires you to prepare an estimate of cash position during the threemonths, April to June 2005. The following information is supplied to you :
Sales Purchases Wages Expenses(Rs.) (Rs.) (Rs.) (Rs.)
February 1,40,000 80,000 16,000 12,000
March 1,60,000 1,00,000 16,000 14,000
April 1,84,000 1,04,000 18,000 14,000
May 2,00,000 1,20,000 20,000 16,000
June 2,40,000 110,000 24,000 18,000
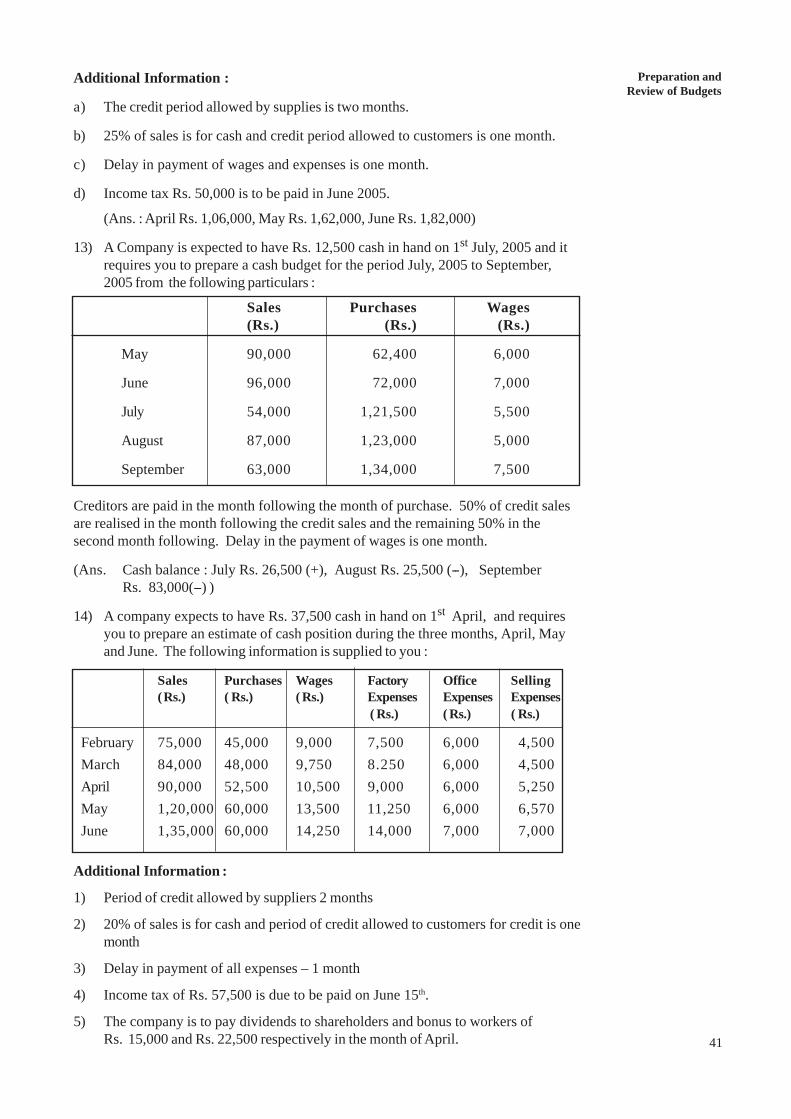
Preparation andReview of Budgets
41
Additional Information :
a) The credit period allowed by supplies is two months.
b) 25% of sales is for cash and credit period allowed to customers is one month.
c) Delay in payment of wages and expenses is one month.
d) Income tax Rs. 50,000 is to be paid in June 2005.
(Ans. : April Rs. 1,06,000, May Rs. 1,62,000, June Rs. 1,82,000)
13) A Company is expected to have Rs. 12,500 cash in hand on 1st July, 2005 and itrequires you to prepare a cash budget for the period July, 2005 to September,2005 from the following particulars :
Sales Purchases Wages(Rs.) (Rs.) (Rs.)
May 90,000 62,400 6,000
June 96,000 72,000 7,000
July 54,000 1,21,500 5,500
August 87,000 1,23,000 5,000
September 63,000 1,34,000 7,500
Creditors are paid in the month following the month of purchase. 50% of credit salesare realised in the month following the credit sales and the remaining 50% in thesecond month following. Delay in the payment of wages is one month.
(Ans. Cash balance : July Rs. 26,500 (+), August Rs. 25,500 (--), SeptemberRs. 83,000(--) )
14) A company expects to have Rs. 37,500 cash in hand on 1st April, and requiresyou to prepare an estimate of cash position during the three months, April, Mayand June. The following information is supplied to you :
Sales Purchases Wages Factory Office Selling(Rs.) ( Rs.) ( Rs.) Expenses Expenses Expenses
( Rs.) ( Rs.) ( Rs.)
February 75,000 45,000 9,000 7,500 6,000 4,500March 84,000 48,000 9,750 8.250 6,000 4,500April 90,000 52,500 10,500 9,000 6,000 5,250May 1,20,000 60,000 13,500 11,250 6,000 6,570June 1,35,000 60,000 14,250 14,000 7,000 7,000
Additional Information :
1) Period of credit allowed by suppliers 2 months
2) 20% of sales is for cash and period of credit allowed to customers for credit is onemonth
3) Delay in payment of all expenses – 1 month
4) Income tax of Rs. 57,500 is due to be paid on June 15th.
5) The company is to pay dividends to shareholders and bonus to workers ofRs. 15,000 and Rs. 22,500 respectively in the month of April.
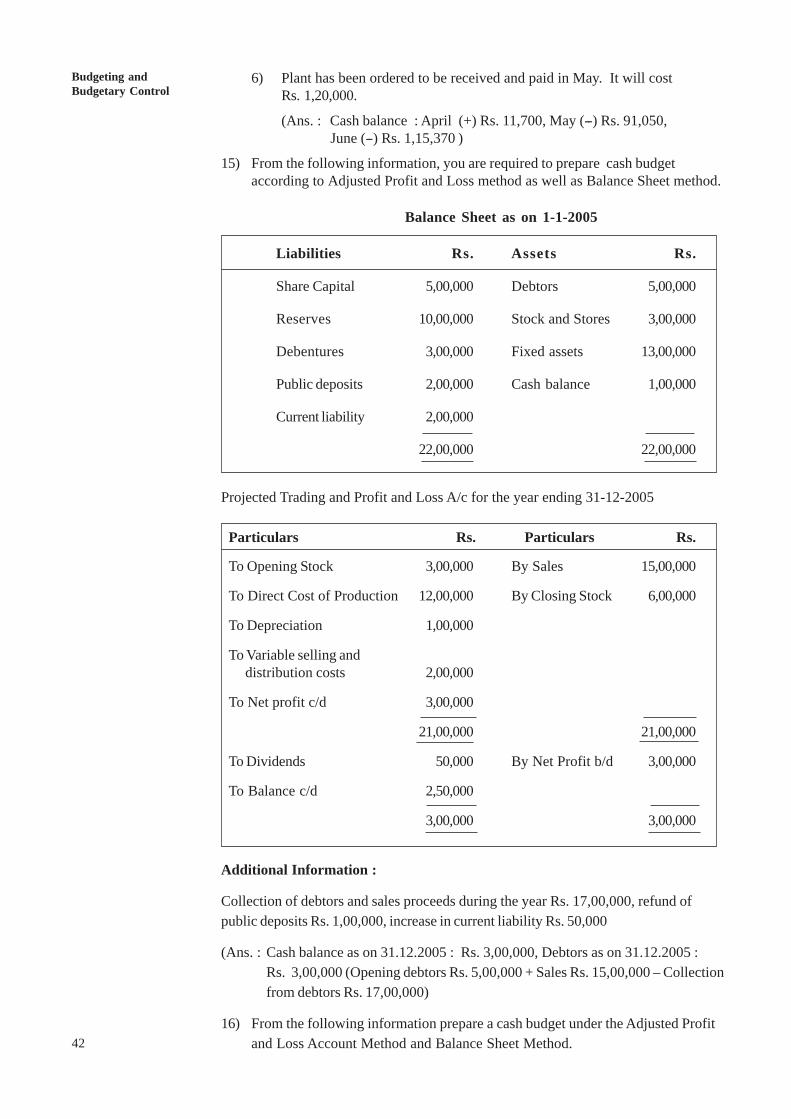
42
Budgeting andBudgetary Control
6) Plant has been ordered to be received and paid in May. It will costRs. 1,20,000.
(Ans. : Cash balance : April (+) Rs. 11,700, May (--) Rs. 91,050,June (--) Rs. 1,15,370 )
15) From the following information, you are required to prepare cash budgetaccording to Adjusted Profit and Loss method as well as Balance Sheet method.
Balance Sheet as on 1-1-2005
Liabilities Rs. Assets Rs.
Share Capital 5,00,000 Debtors 5,00,000
Reserves 10,00,000 Stock and Stores 3,00,000
Debentures 3,00,000 Fixed assets 13,00,000
Public deposits 2,00,000 Cash balance 1,00,000
Current liability 2,00,000
22,00,000 22,00,000
Projected Trading and Profit and Loss A/c for the year ending 31-12-2005
Particulars Rs. Particulars Rs.
To Opening Stock 3,00,000 By Sales 15,00,000
To Direct Cost of Production 12,00,000 By Closing Stock 6,00,000
To Depreciation 1,00,000
To Variable selling and distribution costs 2,00,000
To Net profit c/d 3,00,000
21,00,000 21,00,000
To Dividends 50,000 By Net Profit b/d 3,00,000
To Balance c/d 2,50,000
3,00,000 3,00,000
Additional Information :
Collection of debtors and sales proceeds during the year Rs. 17,00,000, refund ofpublic deposits Rs. 1,00,000, increase in current liability Rs. 50,000
(Ans. : Cash balance as on 31.12.2005 : Rs. 3,00,000, Debtors as on 31.12.2005 :Rs. 3,00,000 (Opening debtors Rs. 5,00,000 + Sales Rs. 15,00,000 – Collectionfrom debtors Rs. 17,00,000)
16) From the following information prepare a cash budget under the Adjusted Profitand Loss Account Method and Balance Sheet Method.
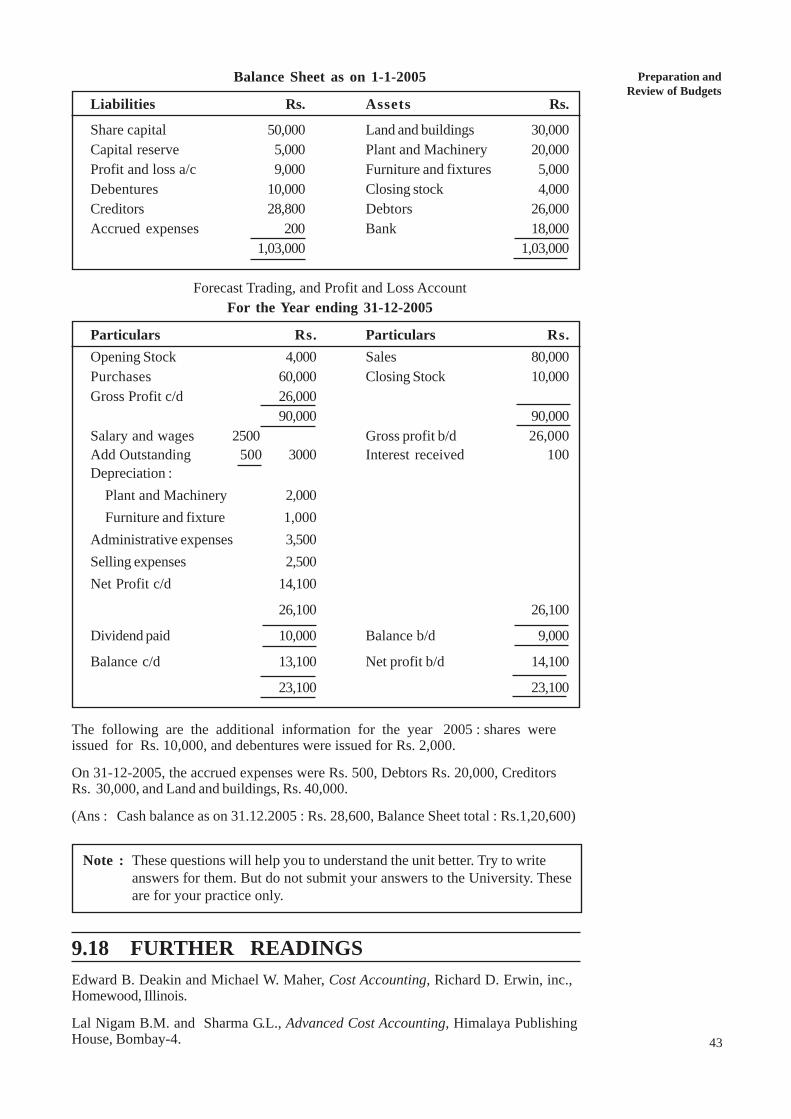
Preparation andReview of Budgets
43
Balance Sheet as on 1-1-2005
Liabilities Rs. Assets Rs.
Share capital 50,000 Land and buildings 30,000Capital reserve 5,000 Plant and Machinery 20,000Profit and loss a/c 9,000 Furniture and fixtures 5,000Debentures 10,000 Closing stock 4,000Creditors 28,800 Debtors 26,000Accrued expenses 200 Bank 18,000
1,03,000 1,03,000
Forecast Trading, and Profit and Loss AccountFor the Year ending 31-12-2005
Particulars Rs. Particulars Rs.Opening Stock 4,000 Sales 80,000Purchases 60,000 Closing Stock 10,000Gross Profit c/d 26,000
90,000 90,000Salary and wages 2500 Gross profit b/d 26,000Add Outstanding 500 3000 Interest received 100Depreciation :
Plant and Machinery 2,000Furniture and fixture 1,000
Administrative expenses 3,500Selling expenses 2,500Net Profit c/d 14,100
26,100 26,100
Dividend paid 10,000 Balance b/d 9,000
Balance c/d 13,100 Net profit b/d 14,100
23,100 23,100
The following are the additional information for the year 2005 : shares wereissued for Rs. 10,000, and debentures were issued for Rs. 2,000.
On 31-12-2005, the accrued expenses were Rs. 500, Debtors Rs. 20,000, CreditorsRs. 30,000, and Land and buildings, Rs. 40,000.
(Ans : Cash balance as on 31.12.2005 : Rs. 28,600, Balance Sheet total : Rs.1,20,600)
9.18 FURTHER READINGSEdward B. Deakin and Michael W. Maher, Cost Accounting, Richard D. Erwin, inc.,Homewood, Illinois.
Lal Nigam B.M. and Sharma G.L., Advanced Cost Accounting, Himalaya PublishingHouse, Bombay-4.
Note : These questions will help you to understand the unit better. Try to writeanswers for them. But do not submit your answers to the University. Theseare for your practice only.
UNIT 10 APPROACHES TOBUDGETING
Structure10.0 Objectives
10.1 Introduction
10.2 Fixed Budgeting
10.3 Flexible Budgeting
10.4 Difference between Fixed and Flexible Budgeting
10.5 Appropriation Budgeting
10.6 Zero Based Budgeting (ZBB)
10.7 Performance Budgeting
10.8 Budgetary Control Ratios
10.9 Behavioural Consideration
10.10 Let Us Sum Up
10.11 Key Words
10.12 Answers to Check Your Progress
10.13 Terminal Questions
10.14 Further Readings
10.0 OBJECTIVESAfter studying this unit you will be able to know:
l different approaches for the preparation of budgets;
l the process of adjusting the budget to reflect actual conditions; and
l the differences between planned activity and actual activity.
10.1 INTRODUCTIONIn the previous Unit you have learnt the preparation and review of various typesof budgets. You have also learnt about the development of the master budgetfor planning and control of costs. In this unit, you will study about differentapproaches to budgeting and further to examine the use of the budget as a toolfor performance evaluation and control. The actual performance is comparedwith the budgeted programme and the variances are analysed and investigatedso that corrective action may be taken well in time to ensure the success of thebusiness.
10.2 FIXED BUDGETINGAccording to C.I.M.A., London, “a fixed budget is a budget which is designed toremain unchanged irrespective of the level of activity actually attained.” Thus, a budgetprepared on the basis of a standard or fixed level of activity is known as a fixedbudget. It does not change with the change in the level of activity. Therefore, it44
Approaches toBudgeting
45
becomes an unrealistic yardstick in case the level of activity actually attained does notconfirm to the one assumed for budgeting purposes. The management will not be in aposition to assess the performance of different heads on the basis of budgets preparedby them because they can serve as yardsticks only when the actual level of activitycorresponds to the budgeted level of activity. Fixed budget is useful when there is nosignificant variation between the budgeted output and the actual output. It does notconsider variances due to changes in the volume. In the industries where the patternof demand is stable a fixed budget may be adequate, especially where the budgetperiod is comparatively short. In such concerns it is possible to forecast sales with aconsiderable degree of accuracy.
10.3 FLEXIBLE BUDGETING
Flexible budget, also known as variable or sliding sale budget, is a budget which isdesigned to furnish budgeted costs for any level of activity actually attained. Flexiblebudgeting technique may be employed to adjust other budgets according to currentconditions arising out of seasonal variations or changes in the length of the workingperiod etc.
According to C.I.M.A., London, “a flexible budget is a budget designed to change inaccordance with the level of activity actually attained.” Thus, a budget prepared in amanner so as to give the budgeted cost for any level of activity is known as a flexiblebudget. Such a budget is prepared after considering the fixed and variable elements ofcost and the changes that may be expected for each item at various levels ofoperations.
Under this method, a series of budgets would be prepared at different levels of activity.Variable items are shown in the budget as per the level of output. Fixed costs areshown at the same amount irrespective of level of output. Sales value is computed andentered into the flexible budget. The position of profit or loss will be revealed at thevarious levels of activity. Management will take a decision to operate at a particularlevel of activity where the profit is maximum taking into account all other factors.
A flexible budget is more realistic, useful and practical. The likely changes in the actualcircumstances are taken into account while preparing a flexible budget. The techniqueis highly useful for control purposes. Actual performance of an executive may becompared with what he should have achieved in the actual circumstances and not withwhat he should have achieved under quite different circumstances.
Illustration 1
A Company producing electronic watches, estimates the following factory overheadcosts for producing 5,000 units:
Rs.Indirect Materials 16,000Indirect Labour 30,000Inspection Costs 16,000Heat, Light and Power 8,000Expendable tools 8,000Supervision costs 8,000Equipment depreciation 4,000Factory rent 4,000
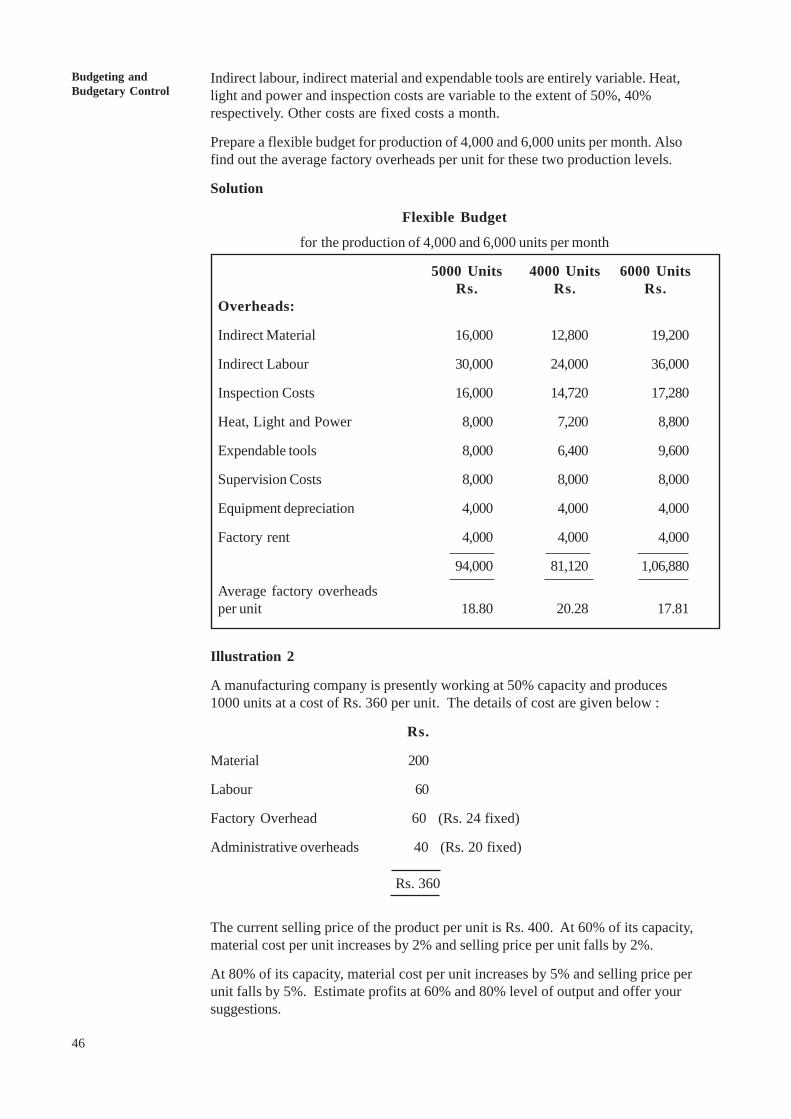
46
Budgeting andBudgetary Control
Indirect labour, indirect material and expendable tools are entirely variable. Heat,light and power and inspection costs are variable to the extent of 50%, 40%respectively. Other costs are fixed costs a month.
Prepare a flexible budget for production of 4,000 and 6,000 units per month. Alsofind out the average factory overheads per unit for these two production levels.
Solution
Flexible Budget
for the production of 4,000 and 6,000 units per month
5000 Units 4000 Units 6000 UnitsRs. Rs. Rs.
Overheads:
Indirect Material 16,000 12,800 19,200
Indirect Labour 30,000 24,000 36,000
Inspection Costs 16,000 14,720 17,280
Heat, Light and Power 8,000 7,200 8,800
Expendable tools 8,000 6,400 9,600
Supervision Costs 8,000 8,000 8,000
Equipment depreciation 4,000 4,000 4,000
Factory rent 4,000 4,000 4,000
94,000 81,120 1,06,880
Average factory overheadsper unit 18.80 20.28 17.81
Illustration 2
A manufacturing company is presently working at 50% capacity and produces1000 units at a cost of Rs. 360 per unit. The details of cost are given below :
Rs.
Material 200
Labour 60
Factory Overhead 60 (Rs. 24 fixed)
Administrative overheads 40 (Rs. 20 fixed)
Rs. 360
The current selling price of the product per unit is Rs. 400. At 60% of its capacity,material cost per unit increases by 2% and selling price per unit falls by 2%.
At 80% of its capacity, material cost per unit increases by 5% and selling price perunit falls by 5%. Estimate profits at 60% and 80% level of output and offer yoursuggestions.
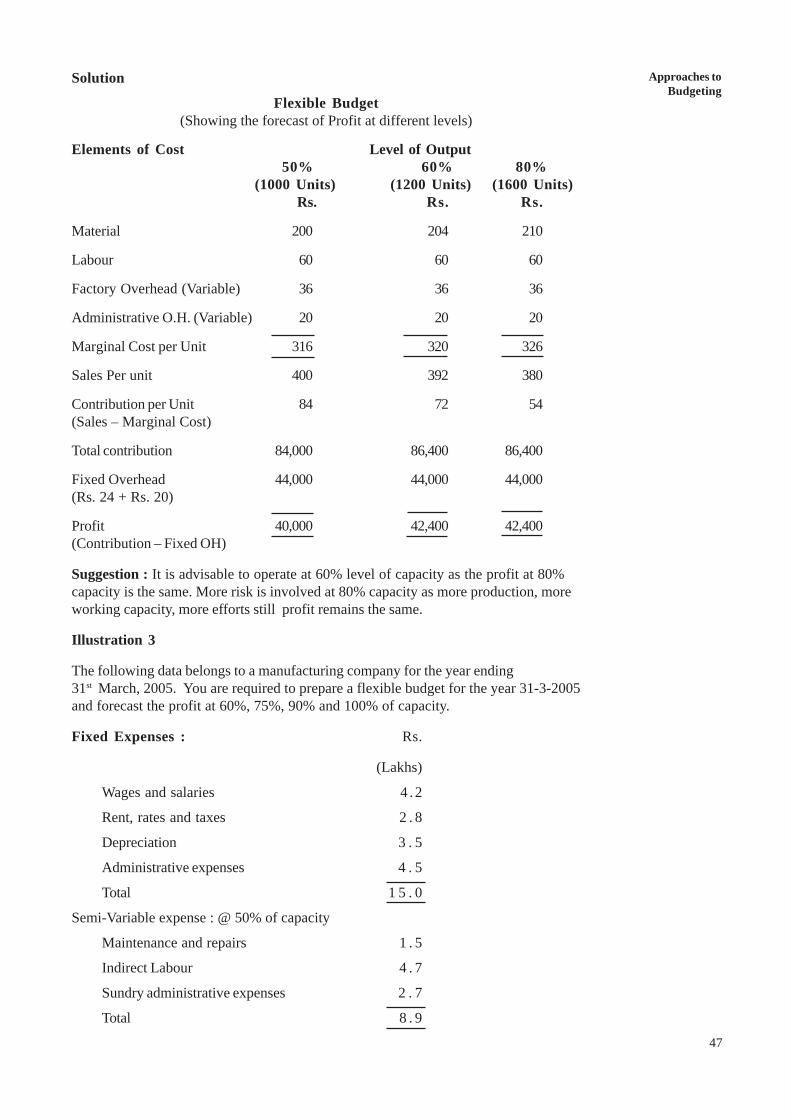
Approaches toBudgeting
47
Solution
Flexible Budget(Showing the forecast of Profit at different levels)
Elements of Cost Level of Output50% 60% 80%
(1000 Units) (1200 Units) (1600 Units) Rs. Rs. Rs.
Material 200 204 210
Labour 60 60 60
Factory Overhead (Variable) 36 36 36
Administrative O.H. (Variable) 20 20 20
Marginal Cost per Unit 316 320 326
Sales Per unit 400 392 380
Contribution per Unit 84 72 54(Sales – Marginal Cost)
Total contribution 84,000 86,400 86,400
Fixed Overhead 44,000 44,000 44,000(Rs. 24 + Rs. 20)
Profit 40,000 42,400 42,400(Contribution – Fixed OH)
Suggestion : It is advisable to operate at 60% level of capacity as the profit at 80%capacity is the same. More risk is involved at 80% capacity as more production, moreworking capacity, more efforts still profit remains the same.
Illustration 3
The following data belongs to a manufacturing company for the year ending31st March, 2005. You are required to prepare a flexible budget for the year 31-3-2005and forecast the profit at 60%, 75%, 90% and 100% of capacity.
Fixed Expenses : Rs.
(Lakhs)
Wages and salaries 4 .2
Rent, rates and taxes 2 . 8
Depreciation 3 . 5
Administrative expenses 4 . 5
Total 1 5 . 0
Semi-Variable expense : @ 50% of capacity
Maintenance and repairs 1 . 5
Indirect Labour 4 . 7
Sundry administrative expenses 2 . 7
Total 8 . 9
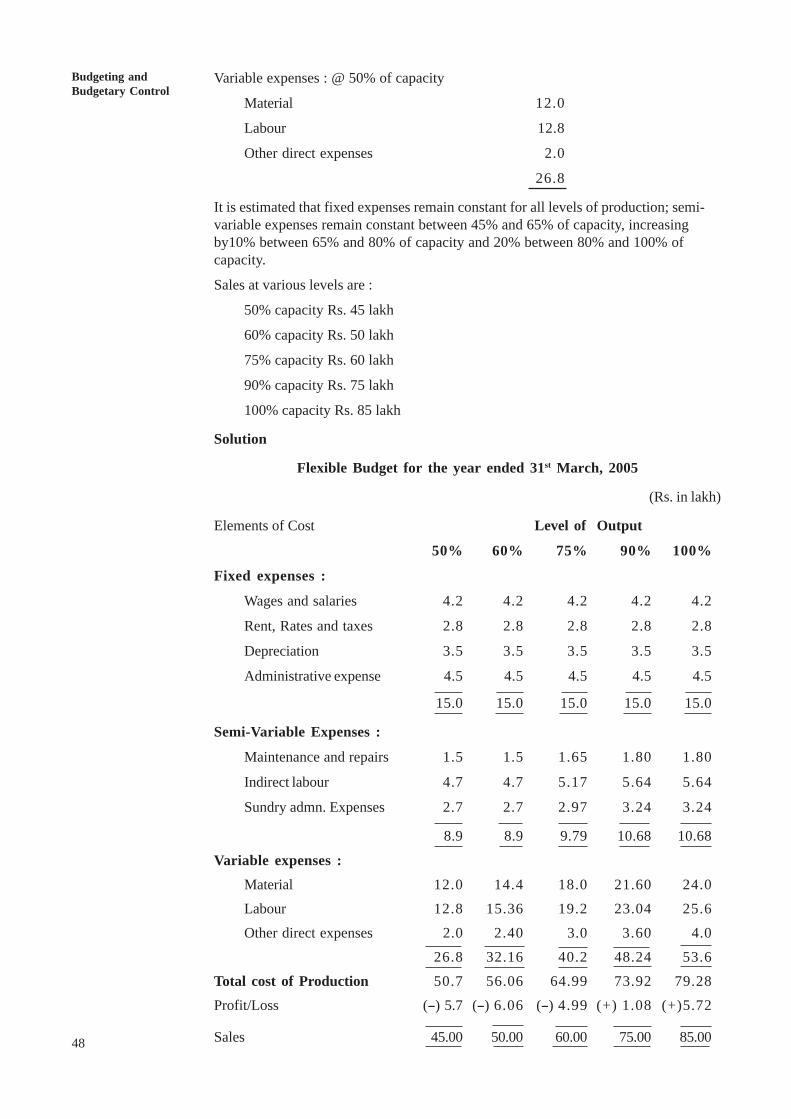
48
Budgeting andBudgetary Control
Variable expenses : @ 50% of capacity
Material 12.0
Labour 12.8
Other direct expenses 2.0
26.8
It is estimated that fixed expenses remain constant for all levels of production; semi-variable expenses remain constant between 45% and 65% of capacity, increasingby10% between 65% and 80% of capacity and 20% between 80% and 100% ofcapacity.
Sales at various levels are :
50% capacity Rs. 45 lakh
60% capacity Rs. 50 lakh
75% capacity Rs. 60 lakh
90% capacity Rs. 75 lakh
100% capacity Rs. 85 lakh
Solution
Flexible Budget for the year ended 31st March, 2005
(Rs. in lakh)
Elements of Cost Level of Output
50% 60% 75% 90% 100%
Fixed expenses :
Wages and salaries 4.2 4.2 4.2 4.2 4.2
Rent, Rates and taxes 2.8 2.8 2.8 2.8 2.8
Depreciation 3.5 3.5 3.5 3.5 3.5
Administrative expense 4.5 4.5 4.5 4.5 4.5
15.0 15.0 15.0 15.0 15.0
Semi-Variable Expenses :
Maintenance and repairs 1.5 1.5 1.65 1.80 1.80
Indirect labour 4.7 4.7 5.17 5.64 5.64
Sundry admn. Expenses 2.7 2.7 2.97 3.24 3.24
8.9 8.9 9.79 10.68 10.68
Variable expenses :Material 12.0 14.4 18.0 21.60 24.0
Labour 12.8 15.36 19.2 23.04 25.6
Other direct expenses 2.0 2.40 3.0 3.60 4.0
26.8 32.16 40.2 48.24 53.6
Total cost of Production 50.7 56.06 64.99 73.92 79.28
Profit/Loss (--) 5.7 (--) 6.06 (--) 4.99 (+) 1.08 (+)5.72
Sales 45.00 50.00 60.00 75.00 85.00
Approaches toBudgeting
49
10.4 DIFFERENCE BETWEEN FIXED ANDFLEXIBLE BUDGETING
The differences can be outlined as follows:
1) Fixed budgeting is inflexible and remains the same irrespective of the volume ofbusiness activity, whereas flexible budgeting can be suitably recast quickly to suitchanged conditions.
2) Fixed budgeting assumes that conditions would remain static, whereas, flexiblebudgeting is designed to change according to a change in the level of activity.
3) Under fixed budgeting, costs are not classified according to fixed, variable andsemi-variable, while, under flexible budgeting, costs are classified according tonature of their variability.
4) Under fixed budgeting, actual and budgeted performances can’t be correctlycompared if the volume of output differs, while under flexible budgeting,comparisons are realistic since the changed plan figures are placed against actualones.
5) Under fixed budgeting, cost cannot be ascertained if there is a change in thecircumstances, while, under flexible budgeting, costs can easily be ascertained atdifferent levels of activity. The task of fixing prices becomes smooth.
10.5 APPROPRIATION BUDGETINGGenerally budgets are prepared for the regular business activities and they cover theoperational activities of an organisation. However, it is not true that budgets are onlyuseful for operational activities, these may also prepare for any particular purpose, likefor constructing any particular building, development activities, where revenue is notconcerned, only expenditures are there. When budgets are prepared only for aparticular activity/work, that is called Appropriation Budget. These budgets are relatedto only one activity /work and on completion of that particular activity the purpose ofthis budget ends. Hence, this type of budget are always relate /cover different activitiesin an organisation.
10.6 ZERO BASED BUDGETING (ZBB)The technique of zero based budgeting suggests that an organisation should not onlymake decisions about the proposed new programmes but it should also, from time totime, review the appropriateness of the existing programmes. Such review shouldparticularly done of such responsibility centres where there is relatively high proportionof discretionary costs.
Zero based budgeting, as the term suggests, examines a programme or function orresponsibility from “ scratch.” The reviewer proceeds on the assumption that nothingis to be allowed. The manger proposing the activity has, therefore, to prove that theactivity is essential and the various amounts asked for are reasonable taking intoaccount the volume of activity. Nothing is allowed simply because it was being done orallowed in the past. Thus, it means writing on a clean slate.
Peter A. Pyhrr defined the zero based budgeting as “an operating planning andbudgeting process which requires each manager to justify his entire budget requests indetail from scratch (hence zero basis). Each manager states why he should spend anymoney at all. This approach requires that all activities be identified as decisionpackages which would be evaluated by systematic analysis ranked in order ofimportance.”
50
Budgeting andBudgetary Control
Thus, a cost-benefit analysis is done in respect of every function or process. It has tobe justified while framing budgets. The assumption underlying zero base budgeting isthat the budget for the previous period was zero, therefore whatever costs are likely tobe incurred or spending programmes are chalked out, justification or the full amount isto be given. Under conventional system of budgeting, however, the justification is to besubmitted by the manager only in respect of the increase in the demand for allotmentof funds in excess over the budget for the previous period. Thus, instead offunctionally-oriented spending approach, programme-oriented and decision-orientedapproach is followed under zero based budgeting.
Advantages of ZBB
1) This system is decision oriented.
2) The technique is relatively elastic, because budgets are prepared every year aszero base.
3) It reduces wastage, eliminates inefficiency and reduces the overall cost ofproduction because every budget proposal is on the basis of cost-benefit ratioafter careful evaluation of different alternatives and the one which is ‘best’ isapproved.
4) It provides for a greater possibility of goal congruence.
5) It takes into consideration inflationary trends, competitor games and consumerbehaviour.
6) It vastly improves financial planning and management information system in viewof its revolutionary approach.
Disadvantages of ZBB
1) It is possible to quantify and evaluate budget proposals involving financial mattersbut computation of cost-benefit analysis is not possible in respect of non-financialmatters.
2) The cost of administration of zero based budgeting is high.
3) It may be difficult to search out various alternatives for the same activity.
4) Some decision packages are inter-related which may be difficult to rank.
5) Ranking the decision is a scientific technique. Every manager can not beexpected to have the necessary technical expertise in this matter.
6) Zero based budgeting dismisses that the past is irrelevant and thereby challengesthe fundamental theory of continuity. Budgeting is a continuous process ofestimating and forecasting about the future and is based on past happenings.
10.7 PERFORMANCE BUDGETINGPerformance budgets are framed in such a manner that items of expenditure andreceipts for a budget period related to a specific responsibility centre are linked withthe physical performance of that centre. The main issue involved in the preparation ofperformance budgets is the development of work programmes and performanceexpectation by assignment of responsibility. It is essential for the attainment of theobjectives.
In this approach, there is not only a financial plan but also a work plan in terms ofwork done or end-products produced. Thus, it gives a broader view to the budget as aplan and programme of action rather than only as an instrument for obtaining funds. Infact, it makes the integration of inputs with the outputs of a development programme.
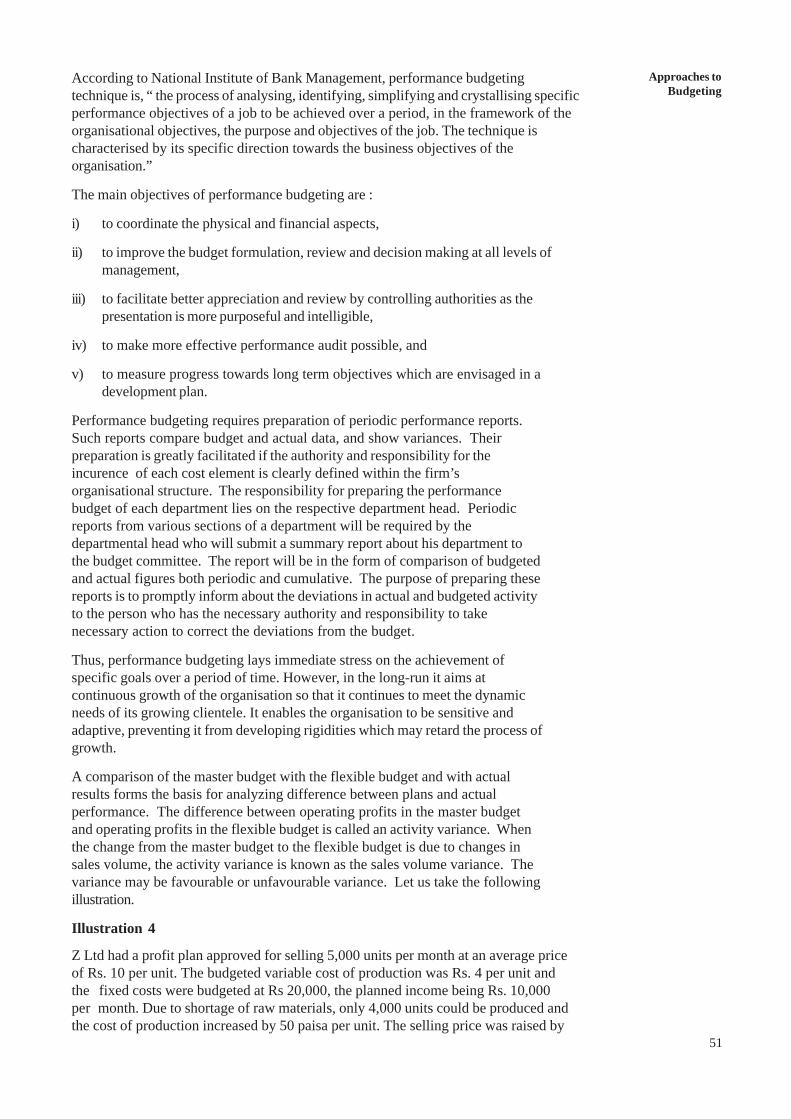
Approaches toBudgeting
51
According to National Institute of Bank Management, performance budgetingtechnique is, “ the process of analysing, identifying, simplifying and crystallising specificperformance objectives of a job to be achieved over a period, in the framework of theorganisational objectives, the purpose and objectives of the job. The technique ischaracterised by its specific direction towards the business objectives of theorganisation.”
The main objectives of performance budgeting are :
i) to coordinate the physical and financial aspects,
ii) to improve the budget formulation, review and decision making at all levels ofmanagement,
iii) to facilitate better appreciation and review by controlling authorities as thepresentation is more purposeful and intelligible,
iv) to make more effective performance audit possible, and
v) to measure progress towards long term objectives which are envisaged in adevelopment plan.
Performance budgeting requires preparation of periodic performance reports.Such reports compare budget and actual data, and show variances. Theirpreparation is greatly facilitated if the authority and responsibility for theincurence of each cost element is clearly defined within the firm’sorganisational structure. The responsibility for preparing the performancebudget of each department lies on the respective department head. Periodicreports from various sections of a department will be required by thedepartmental head who will submit a summary report about his department tothe budget committee. The report will be in the form of comparison of budgetedand actual figures both periodic and cumulative. The purpose of preparing thesereports is to promptly inform about the deviations in actual and budgeted activityto the person who has the necessary authority and responsibility to takenecessary action to correct the deviations from the budget.
Thus, performance budgeting lays immediate stress on the achievement ofspecific goals over a period of time. However, in the long-run it aims atcontinuous growth of the organisation so that it continues to meet the dynamicneeds of its growing clientele. It enables the organisation to be sensitive andadaptive, preventing it from developing rigidities which may retard the process ofgrowth.
A comparison of the master budget with the flexible budget and with actualresults forms the basis for analyzing difference between plans and actualperformance. The difference between operating profits in the master budgetand operating profits in the flexible budget is called an activity variance. Whenthe change from the master budget to the flexible budget is due to changes insales volume, the activity variance is known as the sales volume variance. Thevariance may be favourable or unfavourable variance. Let us take the followingillustration.
Illustration 4
Z Ltd had a profit plan approved for selling 5,000 units per month at an average priceof Rs. 10 per unit. The budgeted variable cost of production was Rs. 4 per unit andthe fixed costs were budgeted at Rs 20,000, the planned income being Rs. 10,000per month. Due to shortage of raw materials, only 4,000 units could be produced andthe cost of production increased by 50 paisa per unit. The selling price was raised by
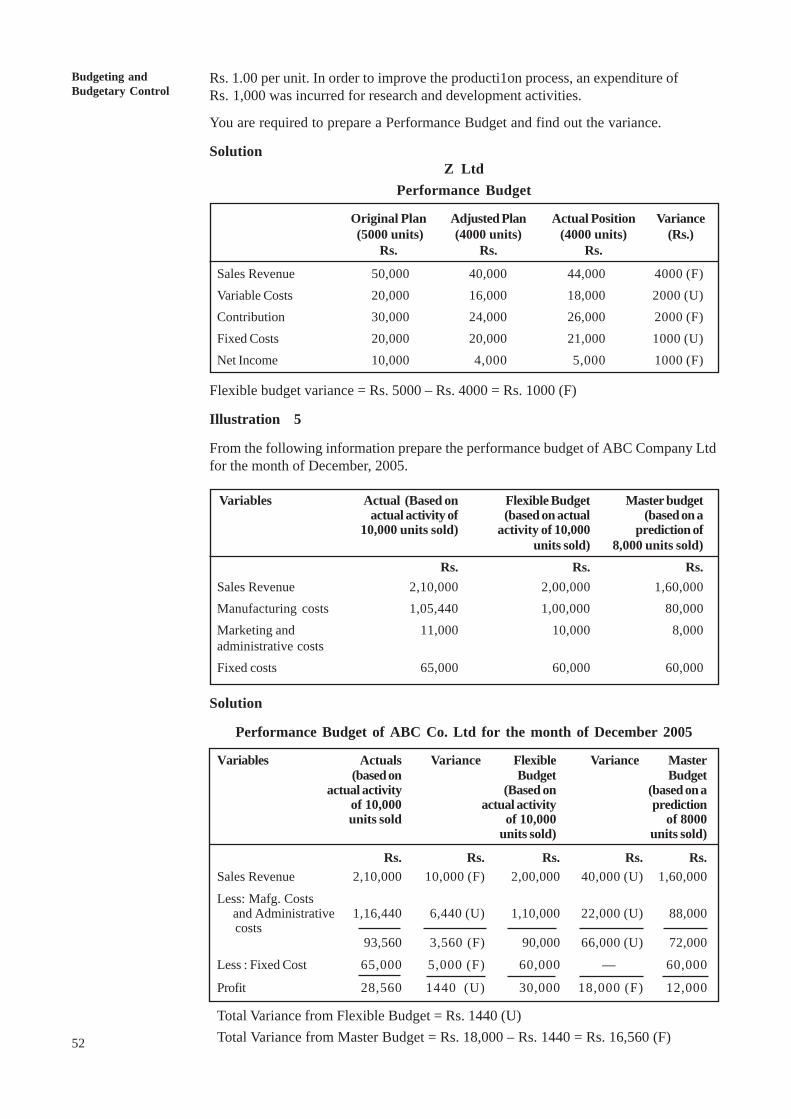
52
Budgeting andBudgetary Control
Rs. 1.00 per unit. In order to improve the producti1on process, an expenditure ofRs. 1,000 was incurred for research and development activities.
You are required to prepare a Performance Budget and find out the variance.
SolutionZ Ltd
Performance Budget
Original Plan Adjusted Plan Actual Position Variance (5000 units) (4000 units) (4000 units) (Rs.)
Rs. Rs. Rs.
Sales Revenue 50,000 40,000 44,000 4000 (F)Variable Costs 20,000 16,000 18,000 2000 (U)Contribution 30,000 24,000 26,000 2000 (F)Fixed Costs 20,000 20,000 21,000 1000 (U)Net Income 10,000 4,000 5,000 1000 (F)
Flexible budget variance = Rs. 5000 – Rs. 4000 = Rs. 1000 (F)
Illustration 5
From the following information prepare the performance budget of ABC Company Ltdfor the month of December, 2005.
Variables Actual (Based on Flexible Budget Master budgetactual activity of (based on actual (based on a
10,000 units sold) activity of 10,000 prediction ofunits sold) 8,000 units sold)
Rs. Rs. Rs.Sales Revenue 2,10,000 2,00,000 1,60,000Manufacturing costs 1,05,440 1,00,000 80,000Marketing and 11,000 10,000 8,000administrative costsFixed costs 65,000 60,000 60,000
Solution
Performance Budget of ABC Co. Ltd for the month of December 2005
Variables Actuals Variance Flexible Variance Master(based on Budget Budget
actual activity (Based on (based on aof 10,000 actual activity predictionunits sold of 10,000 of 8000
units sold) units sold)
Rs. Rs. Rs. Rs. Rs.Sales Revenue 2,10,000 10,000 (F) 2,00,000 40,000 (U) 1,60,000
Less: Mafg. Costs and Administrative 1,16,440 6,440 (U) 1,10,000 22,000 (U) 88,000 costs
93,560 3,560 (F) 90,000 66,000 (U) 72,000
Less : Fixed Cost 65,000 5,000 (F) 60,000 — 60,000
Profit 28,560 1440 (U) 30,000 18,000 (F) 12,000
Total Variance from Flexible Budget = Rs. 1440 (U)Total Variance from Master Budget = Rs. 18,000 – Rs. 1440 = Rs. 16,560 (F)
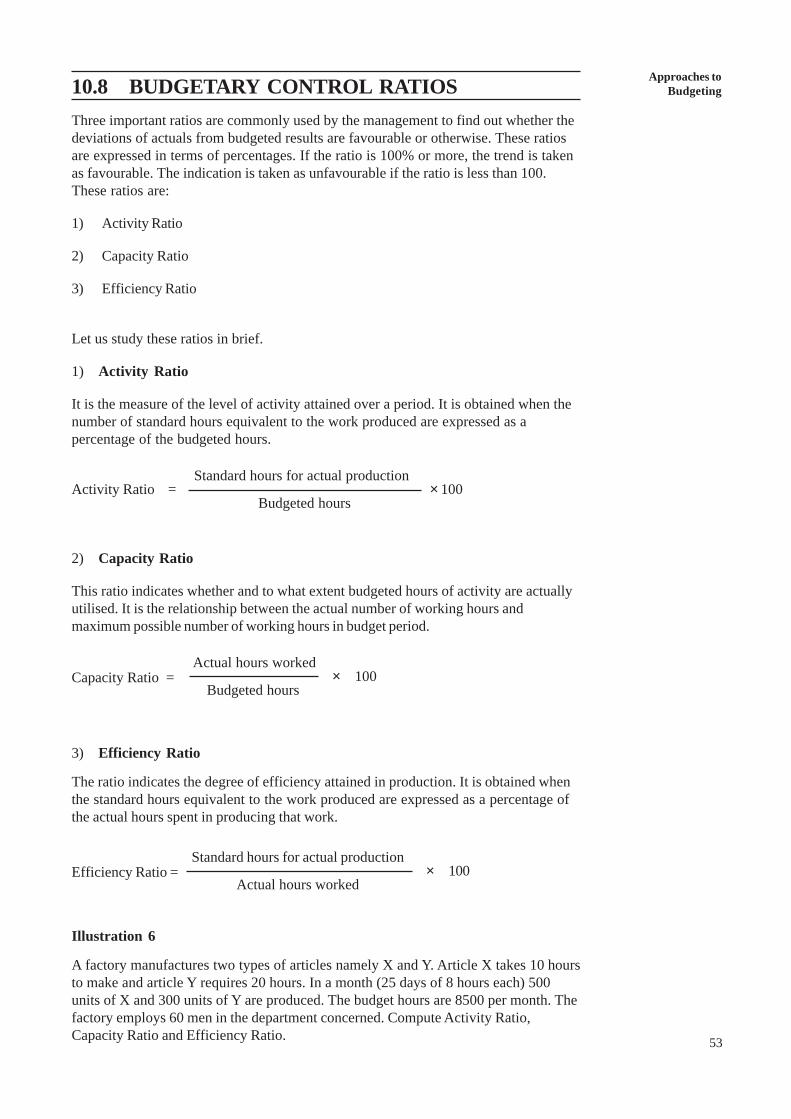
Approaches toBudgeting
53
10.8 BUDGETARY CONTROL RATIOSThree important ratios are commonly used by the management to find out whether thedeviations of actuals from budgeted results are favourable or otherwise. These ratiosare expressed in terms of percentages. If the ratio is 100% or more, the trend is takenas favourable. The indication is taken as unfavourable if the ratio is less than 100.These ratios are:
1) Activity Ratio
2) Capacity Ratio
3) Efficiency Ratio
Let us study these ratios in brief.
1) Activity Ratio
It is the measure of the level of activity attained over a period. It is obtained when thenumber of standard hours equivalent to the work produced are expressed as apercentage of the budgeted hours.
Standard hours for actual productionActivity Ratio = × 100
Budgeted hours
2) Capacity Ratio
This ratio indicates whether and to what extent budgeted hours of activity are actuallyutilised. It is the relationship between the actual number of working hours andmaximum possible number of working hours in budget period.
Capacity Ratio = Actual hours worked
× 100 Budgeted hours
3) Efficiency Ratio
The ratio indicates the degree of efficiency attained in production. It is obtained whenthe standard hours equivalent to the work produced are expressed as a percentage ofthe actual hours spent in producing that work.
Efficiency Ratio =Standard hours for actual production
× 100Actual hours worked
Illustration 6
A factory manufactures two types of articles namely X and Y. Article X takes 10 hoursto make and article Y requires 20 hours. In a month (25 days of 8 hours each) 500units of X and 300 units of Y are produced. The budget hours are 8500 per month. Thefactory employs 60 men in the department concerned. Compute Activity Ratio,Capacity Ratio and Efficiency Ratio.
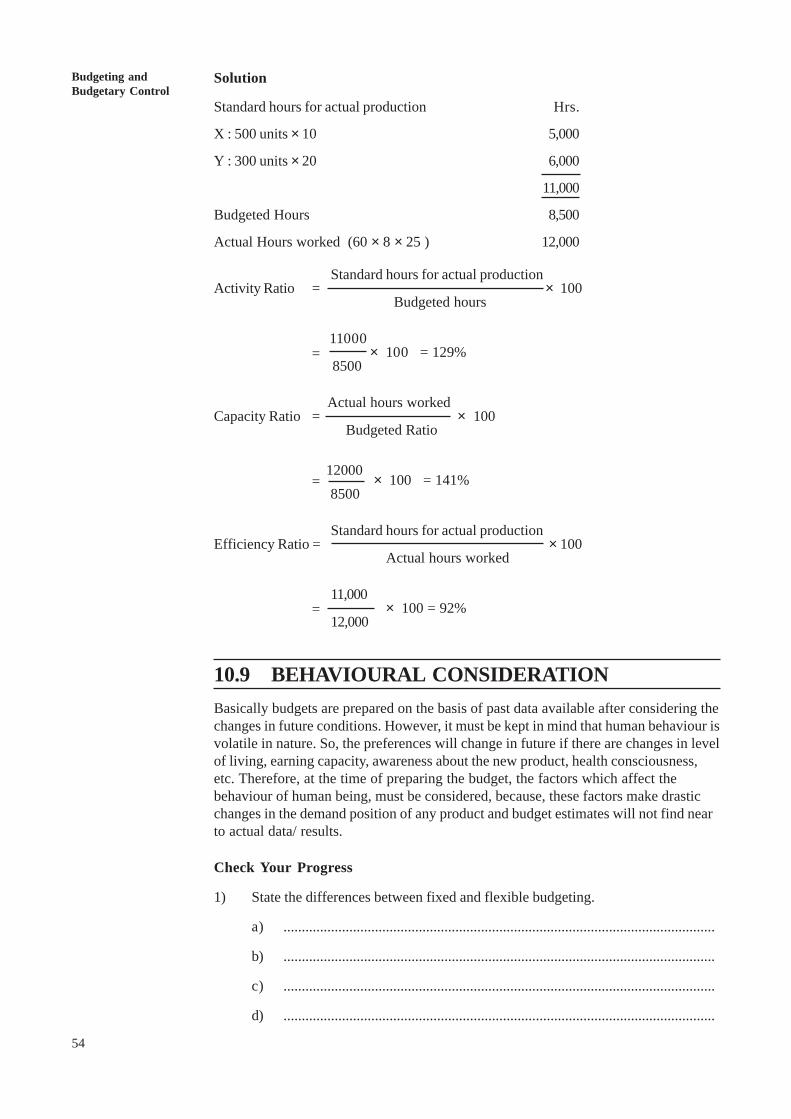
54
Budgeting andBudgetary Control
Solution
Standard hours for actual production Hrs.
X : 500 units × 10 5,000
Y : 300 units × 20 6,000
11,000
Budgeted Hours 8,500
Actual Hours worked (60 × 8 × 25 ) 12,000
Standard hours for actual productionActivity Ratio = × 100
Budgeted hours
= 11000
× 100 = 129% 8500
Actual hours workedCapacity Ratio = × 100
Budgeted Ratio
= 12000
× 100 = 141% 8500
Standard hours for actual productionEfficiency Ratio = × 100
Actual hours worked
=11,000 × 100 = 92%12,000
10.9 BEHAVIOURAL CONSIDERATIONBasically budgets are prepared on the basis of past data available after considering thechanges in future conditions. However, it must be kept in mind that human behaviour isvolatile in nature. So, the preferences will change in future if there are changes in levelof living, earning capacity, awareness about the new product, health consciousness,etc. Therefore, at the time of preparing the budget, the factors which affect thebehaviour of human being, must be considered, because, these factors make drasticchanges in the demand position of any product and budget estimates will not find nearto actual data/ results.
Check Your Progress
1) State the differences between fixed and flexible budgeting.
a) ......................................................................................................................
b) ......................................................................................................................
c) ......................................................................................................................
d) ......................................................................................................................
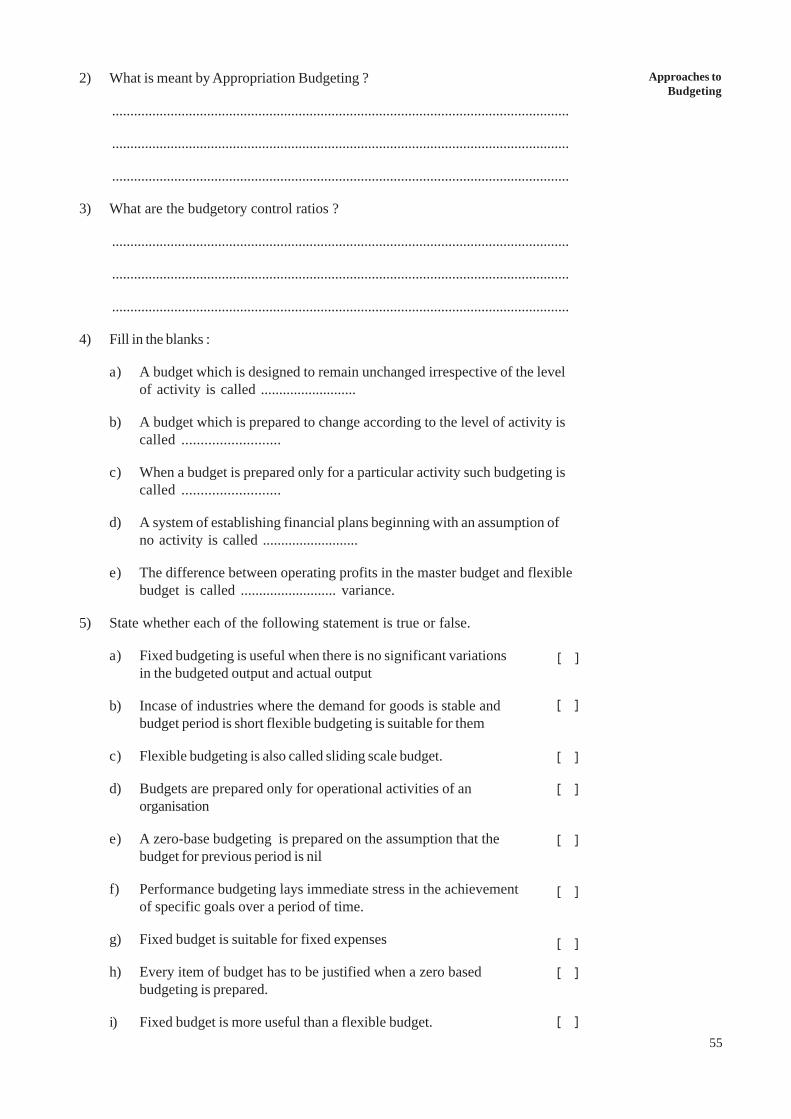
Approaches toBudgeting
55
2) What is meant by Appropriation Budgeting ?
.............................................................................................................................
.............................................................................................................................
.............................................................................................................................
3) What are the budgetory control ratios ?
.............................................................................................................................
.............................................................................................................................
.............................................................................................................................
4) Fill in the blanks :
a) A budget which is designed to remain unchanged irrespective of the levelof activity is called ..........................
b) A budget which is prepared to change according to the level of activity iscalled ..........................
c) When a budget is prepared only for a particular activity such budgeting iscalled ..........................
d) A system of establishing financial plans beginning with an assumption ofno activity is called ..........................
e) The difference between operating profits in the master budget and flexiblebudget is called .......................... variance.
5) State whether each of the following statement is true or false.
a) Fixed budgeting is useful when there is no significant variationsin the budgeted output and actual output
b) Incase of industries where the demand for goods is stable andbudget period is short flexible budgeting is suitable for them
c) Flexible budgeting is also called sliding scale budget.
d) Budgets are prepared only for operational activities of anorganisation
e) A zero-base budgeting is prepared on the assumption that thebudget for previous period is nil
f) Performance budgeting lays immediate stress in the achievementof specific goals over a period of time.
g) Fixed budget is suitable for fixed expenses
h) Every item of budget has to be justified when a zero basedbudgeting is prepared.
i) Fixed budget is more useful than a flexible budget.
[ ]
[ ]
[ ]
[ ]
[ ]
[ ]
[ ]
[ ]
[ ]
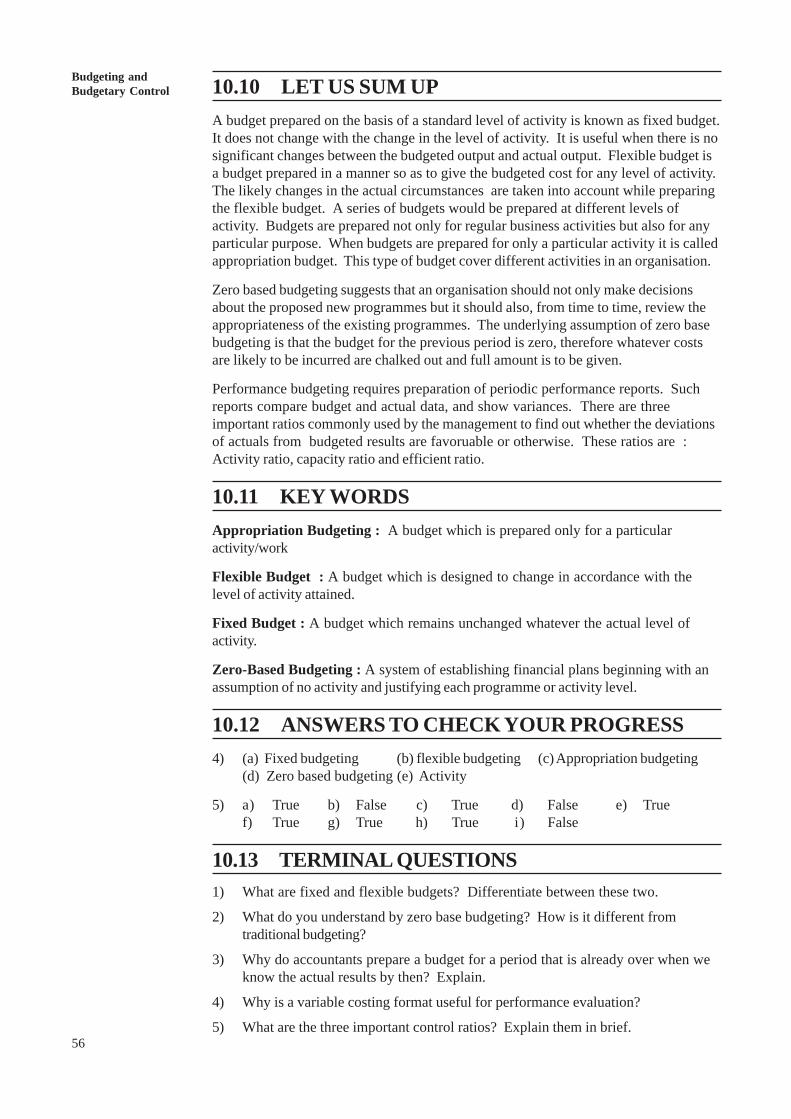
56
Budgeting andBudgetary Control 10.10 LET US SUM UP
A budget prepared on the basis of a standard level of activity is known as fixed budget.It does not change with the change in the level of activity. It is useful when there is nosignificant changes between the budgeted output and actual output. Flexible budget isa budget prepared in a manner so as to give the budgeted cost for any level of activity.The likely changes in the actual circumstances are taken into account while preparingthe flexible budget. A series of budgets would be prepared at different levels ofactivity. Budgets are prepared not only for regular business activities but also for anyparticular purpose. When budgets are prepared for only a particular activity it is calledappropriation budget. This type of budget cover different activities in an organisation.
Zero based budgeting suggests that an organisation should not only make decisionsabout the proposed new programmes but it should also, from time to time, review theappropriateness of the existing programmes. The underlying assumption of zero basebudgeting is that the budget for the previous period is zero, therefore whatever costsare likely to be incurred are chalked out and full amount is to be given.
Performance budgeting requires preparation of periodic performance reports. Suchreports compare budget and actual data, and show variances. There are threeimportant ratios commonly used by the management to find out whether the deviationsof actuals from budgeted results are favoruable or otherwise. These ratios are :Activity ratio, capacity ratio and efficient ratio.
10.11 KEY WORDSAppropriation Budgeting : A budget which is prepared only for a particularactivity/work
Flexible Budget : A budget which is designed to change in accordance with thelevel of activity attained.
Fixed Budget : A budget which remains unchanged whatever the actual level ofactivity.
Zero-Based Budgeting : A system of establishing financial plans beginning with anassumption of no activity and justifying each programme or activity level.
10.12 ANSWERS TO CHECK YOUR PROGRESS4) (a) Fixed budgeting (b) flexible budgeting (c) Appropriation budgeting
(d) Zero based budgeting (e) Activity
5) a) True b) False c) True d) False e) Truef) True g) True h) True i) False
10.13 TERMINAL QUESTIONS1) What are fixed and flexible budgets? Differentiate between these two.
2) What do you understand by zero base budgeting? How is it different fromtraditional budgeting?
3) Why do accountants prepare a budget for a period that is already over when weknow the actual results by then? Explain.
4) Why is a variable costing format useful for performance evaluation?
5) What are the three important control ratios? Explain them in brief.
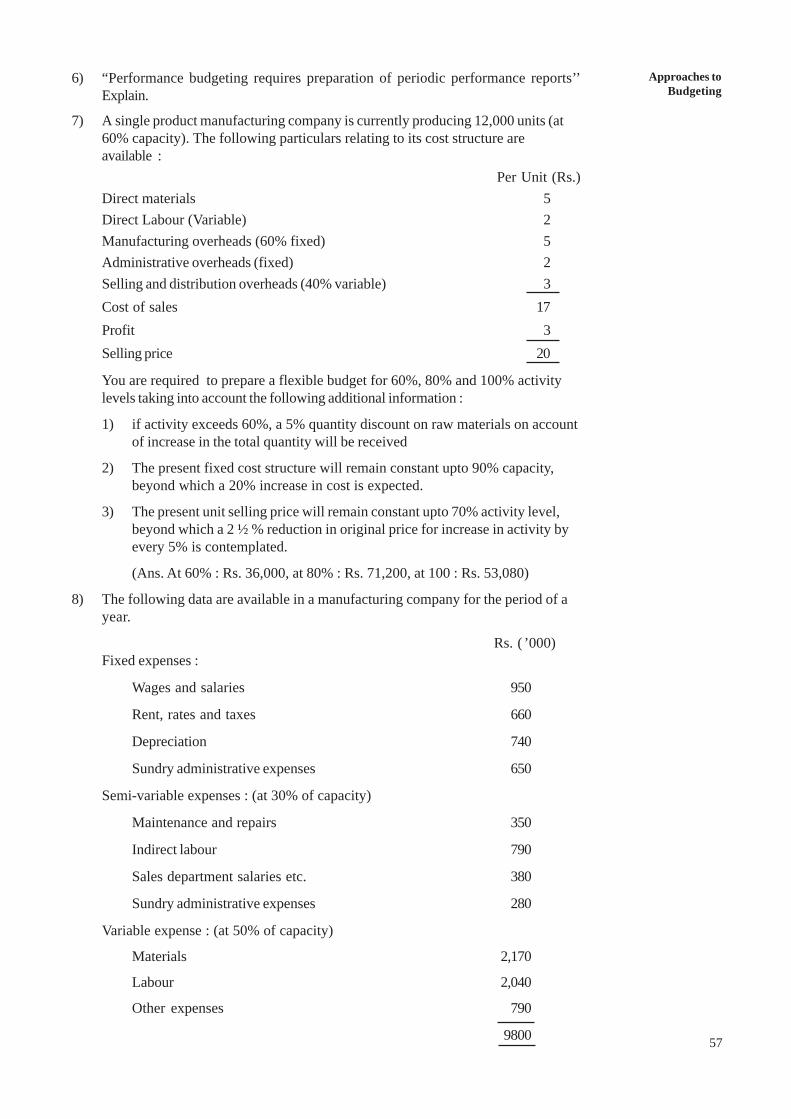
Approaches toBudgeting
57
6) “Performance budgeting requires preparation of periodic performance reports’’Explain.
7) A single product manufacturing company is currently producing 12,000 units (at60% capacity). The following particulars relating to its cost structure areavailable :
Per Unit (Rs.)Direct materials 5Direct Labour (Variable) 2Manufacturing overheads (60% fixed) 5Administrative overheads (fixed) 2Selling and distribution overheads (40% variable) 3Cost of sales 17Profit 3Selling price 20
You are required to prepare a flexible budget for 60%, 80% and 100% activitylevels taking into account the following additional information :
1) if activity exceeds 60%, a 5% quantity discount on raw materials on accountof increase in the total quantity will be received
2) The present fixed cost structure will remain constant upto 90% capacity,beyond which a 20% increase in cost is expected.
3) The present unit selling price will remain constant upto 70% activity level,beyond which a 2 ½ % reduction in original price for increase in activity byevery 5% is contemplated.
(Ans. At 60% : Rs. 36,000, at 80% : Rs. 71,200, at 100 : Rs. 53,080)
8) The following data are available in a manufacturing company for the period of ayear.
Rs. ( ’000)Fixed expenses :
Wages and salaries 950
Rent, rates and taxes 660
Depreciation 740
Sundry administrative expenses 650
Semi-variable expenses : (at 30% of capacity)
Maintenance and repairs 350
Indirect labour 790
Sales department salaries etc. 380
Sundry administrative expenses 280
Variable expense : (at 50% of capacity)
Materials 2,170
Labour 2,040
Other expenses 790
9800
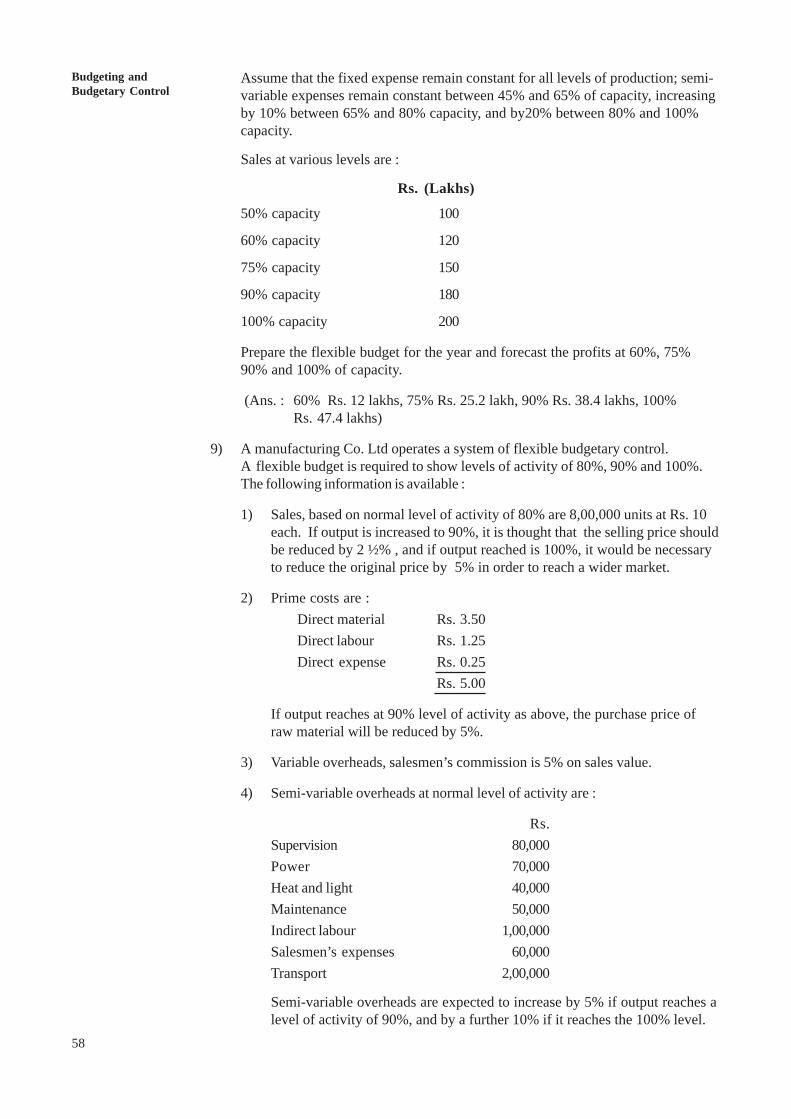
58
Budgeting andBudgetary Control
Assume that the fixed expense remain constant for all levels of production; semi-variable expenses remain constant between 45% and 65% of capacity, increasingby 10% between 65% and 80% capacity, and by20% between 80% and 100%capacity.
Sales at various levels are :
Rs. (Lakhs)
50% capacity 100
60% capacity 120
75% capacity 150
90% capacity 180
100% capacity 200
Prepare the flexible budget for the year and forecast the profits at 60%, 75%90% and 100% of capacity.
(Ans. : 60% Rs. 12 lakhs, 75% Rs. 25.2 lakh, 90% Rs. 38.4 lakhs, 100%Rs. 47.4 lakhs)
9) A manufacturing Co. Ltd operates a system of flexible budgetary control.A flexible budget is required to show levels of activity of 80%, 90% and 100%.The following information is available :
1) Sales, based on normal level of activity of 80% are 8,00,000 units at Rs. 10each. If output is increased to 90%, it is thought that the selling price shouldbe reduced by 2 ½% , and if output reached is 100%, it would be necessaryto reduce the original price by 5% in order to reach a wider market.
2) Prime costs are :Direct material Rs. 3.50Direct labour Rs. 1.25Direct expense Rs. 0.25
Rs. 5.00
If output reaches at 90% level of activity as above, the purchase price ofraw material will be reduced by 5%.
3) Variable overheads, salesmen’s commission is 5% on sales value.
4) Semi-variable overheads at normal level of activity are :
Rs.Supervision 80,000Power 70,000Heat and light 40,000Maintenance 50,000Indirect labour 1,00,000Salesmen’s expenses 60,000Transport 2,00,000
Semi-variable overheads are expected to increase by 5% if output reaches alevel of activity of 90%, and by a further 10% if it reaches the 100% level.
Approaches toBudgeting
59
5) Fixed overheads are : Rs.Rent and rates 1,00,000Depreciation 4,00,000Administration 7,50,000Sales department 2,00,000Advertising 5,00,000General 50,000
(Ans : 80% Rs. 10 lakhs, 90% Rs. 1363750, 100% Rs. 1507000)
10) A department of a Company X attains sales of Rs. 3,00,00 at 80% of its normalcapacity and its expenses are given below :
Administration Costs:
Salaries : Rs. 45,000, General expenses 2% of sales,Depreciation Rs. 3,750, Rates and taxes Rs. 4,375
Selling Costs :
Salaries 8% of sales, Travelling expenses 2% of sales,Sales expenses 1% of sales, general expenses 1% of sales.
Distribution Costs :
Wages Rs. 7,500, Rent 1% of sales, other expenses 4% of sales.
Prepare a flexible administration, selling and distribution costs budget, operating at90% and 100% of normal capacity.
90% 100%(Ans. : Administration costs Rs. 59,875 Rs. 60,625
Selling Costs Rs. 40,500 Rs. 45,000Distribution Costs Rs.14,375 Rs. 26,250
Total Rs. 1,14,750 Rs. 1,31,875
11) From the following particulars relating to XYZ company for the month ofNovember, 2003 prepare a report comprising actual results with the flexible andmaster budget.
Units produced and sold : 50,000 (Budgeted sales 45,000 units)
Selling price per unit : Rs. 10 (Budgeted Rs. 11 per unit)
Actual variable cost per unit : Rs. 5 (Budgeted Rs. 4 per unit )
Actual fixed overhead : Rs. 83, 000 (Budgeted Rs. 80,000)
Actual fixed administration cost : Rs. 96,000 (Budgeted Rs.1,00,000)
Actual Variable administration Cost : Rs. 62,500 (Budgeted Rs. 1 per unit)(50,000 units @ 1.25 per unit)
[Ans. : Total variance from flexible budget : Rs. 1,27,500 (Unfavourable)]Total variance from Master budget : Rs. 2,39,000(Unfavourable) ]
60
Budgeting andBudgetary Control
12) From the following controllable and non-controllable costs relating amanufacturing company for 31st March, 2003, prepare a performance budget bycomparing actual results with the flexible and master budget :
Standard budget based on 20,000 units :
Controllable Costs : Non Controllable Costs :
Rs. Rs.
Indirect Labour 70,000 Supervision 34,000
Indirect material 20,000 Rates and taxes 12,000
Fuel and power 56,000 Insurance 2,000
Maintenance 12,000 Depreciation 15,000
1,58,000 63,000
The actual production during the year was as follows :
Controllable costs : Actual Costs Budget based on18,000 units actuals
Rs. Rs.
Indirect labour 63,000 65,000Indirect material 21,000 18,000Fuel and power 56,000 51,400Maintenance 12,000 11,600
1,52,000 1,46,000
Non-controllable costs :Supervision 32,980 31,600Rates and taxes 12,000 12,000Insurance 2,000 2,000Depreciation 15,000 15,000
61,980 61,600
[Ans. Total Variance from flexible budget : Controllable costs Rs. 6000 (U),Non Controllable Costs : Rs. 1380 (U), Total variance from Master budget :Controllable costs : Rs. 6000 (F) Uncontrollable costs : Rs. 1020 (F) ]
10.14 FURTHER READINGSPrem Chand, 1969, Performance Budgeting, Academic Books : New Delhi.
Pyhrr, Peter, A. 1973, Zero Base Budgeting, John Wiley and, Sons ; New York.`
Note : These questions will help you to understand the unit better. Try to write answersfor them. But do not submit your answers to the University. These are for yourpractice only.
____________________________________________________________ UNIT 11: STANDARD COSTING
_____________________________________________________________ Introduction
One of the prime functions of management accounting is to facilitate managerial control
and the important aspect of managerial control is cost control. The efficiency of
management depends upon the effective control of costs. Therefore, it is very important
to plan and control cost. Standard costing is one of the most important tools, which helps
the management to plan and control cost of business operations. Under standard costing,
all costs are pre-determined and pre determined costs are then compared with the actual
costs. The difference between pre-determined costs and the actual costs is known as
variance which is analysed and investigated to the reasons. The variances are then
reported to management for taking remedial steps so that the actuals costs adhere to pre-
determined costs. In historical costing actual costs are ascertained only when they have
been incurred. They are useful only when they are compared with predetermined costs.
Such costs are not useful to management in decision-making and cost control. Therefore,
the technique of standard costing is used as a tool for planning, decision-making and
control of business operations. In this unit you will study the basic concepts of standard
costing.
Meaning of Standard Cost
Standard costs are predetermined cost which may be used as a yardstick to measure the
efficiency with which actual costs has been incurred under given circumstance. To
illustrate, the amount of raw material required to produce a unit of product can be
determined and the cost of that raw material estimated. This becomes the standard
material input. If actual raw material usage or costs differ from the standards, the
difference which is called ‘variance’ is reported to manager concerned. When size of the
1
variance is significant, a detailed investigation will be made to determine the causes of
variance
According to the chartered Institute of Management Accountants (C.I.M.A) London,
“Standard cost is the predetermined cost based on technical estimates for materials,
labour and overhead for a selected period of time for a prescribed set of working
conditions.”
The Institute of Cost and Works Accountants defines standard costs as “Standard costs
are prepared and used to clarify the final results of a business, particularly by
measurement of variations of actual costs from standard costs and the analysis of the
causes of variations for the purpose of maintaining efficiency of executive action.”
Thus standard costs is a predetermined which determines what each product or service
‘should be’ under given circumstances. From the above definitions we may note that
standard costs are:
i) Pre-determined cost: Standard cost is always determined in advance and
ahead of actual point of time of incurring of costs.
ii) Based on technical estimated: Standard cost is determined only on the basis of
a technical estimate and on a rational basis.
iii) For the purpose of Comparison: The very purpose of standard cost is to aid
the comparison with actual costs.
iv) Based for price fixing: The prices are fixed in advance and hence the only
variation basis is the standard cost.
Standard Cost and Estimated Costs
Estimates are predetermined costs which are based on historical data and is often not very
scientifically determined. They usually compiled from loosely gathered information and
therefore, they are unsafe to use them as a tool for measuring performance. Standard
costs are predetermined costs which aims at what the cost should be rather then what it
will be. Both the standard costs and estimated costs are used to determine price in
2
advance and their purpose is to control cost. But, there are certain differences between
these two costs as stated below:
Differences between Standard costs and Estimated Costs:
The following are some of the important differences between standard cost and estimated
cost:
Standard Cost Estimated Cost
Standard cost emphasizes as what the cost
‘should be’ in a given set of situations.
Estimated cost emphasizes on what the cost
‘will be’.
Standard costs are planned costs which are
determined by technical experts after
considering levels of efficiency and
production
Estimated costs are determined by taking
into consideration the historical data as the
basis and adjusting it to future trends.
It is used as a devise for measuring
efficiency
It cannot be used as a devise to determine
efficiency. It only determines expected
costs.
Standard costs serve the purpose of cost
control
Estimated costs do not serve the purpose of
cost control.
Standard costing is part of cost accounting
process
Estimated costs are statistical in nature and
may not become a part of accounting.
It is a technique developed and recognised
by management and academecians
It is just an estimate and not a technique
It can be used where standard costing is in
operation
It may be used in any concern operating on
a historical cost system.
Concept of Standard Costing
Standard costing is a technique used for the purpose of determining standard cost and
their comparison with the actual costs to find out the causes of difference between the
3
two so that remedial action may be taken immediately. The Charted Institute of
Management Accountants, London, defines standard costing as “the preparation of
standard costs and applying them to measure the variations from actual costs and
analysing the causes of variations with a view to maintain maximum efficiency in
production”.
Thus, standard costing is a technique of cost accounting which compares the ‘standard
cost’ of each product or service, with the actual cost, to determine the efficiency of the
operation. When actual costs differ from standards the difference is called variance and
when the size of the variance is significant a detailed investigation will be made to
determine the causes of variance, so that remedial action will be taken immediately.
Thus, standard costing involves the following steps:
1. Setting standard costs for different elements of costs
2. Recording of actual costs
3. Comparing between standard costs and actual costs to determine the variances
4. Analysing the variances to know the causes thereof, and
5. Reporting the analysis of variances to management for taking appropriate
actions wherever necessary.
The system of standard costing can be used effectively to those industries which are
producing standardised products and are repetitive in nature. Examples are cement
industry, steel industry, sugar industry etc. The standard costing may not be suitable to
jobbing industries because every job has different specifications and it will be difficult
and expensive to set standard costs for every job. Thus, standard costing is not suitable in
situations where a variety of different kinds of tasks are being done.
Objectives of Standard Costing:
1. Cost Control: The most important objective of standard cost is to help the
management in cost control. It can be used as a yardstick against which actual costs can
4
be compared to measure efficiency. The management can make comparison of actgual
costs with the standard costs at periodic intervals and take corrective action to maintain
control over costs.
2. Management by Exception: The second objective of standard cost is to help the
management in exercising control over the costs through the principle of exception.
Standard cost helps to prescribe standards and the attention of the management is drawn
only when the actual performance is deviated from the prescribed standards. It
concentrates its attention on variations only.
3. Develops Cost Conscious Attitude: Another objective of standard cost is to
make the entire organisation cost conscious. It makes the employees to recognise the
importance of efficient operations so that costs can be reduced by joint efforts.
4. Fixation of Prices: To help the management in formulating production policy
and helps in fixing the price quotations as well as in submitting tenders of various
products. This can be done with accuracy with standard cost than the actual costs. It also
helps in formulating production policies. Standard costs removes the reflection of
abnormal price fluctuations in production planning.
5. Fixing Prices and Formulating Policies: Another object of standard cost is to
help the management in determining prices and formulating production policies. It also
helps the management in the areas of profit planning, product-pricing and inventory
pricing etc.
6. Management Planning: Budget planning is undertaken by the management
at different levels at periodic intervals to maximise the profit through different product
mixes. For this purpose it is more convenient using standard costing than actual costs
because it is done on scientific and rational manner by taking into account all technical
aspects.
5
Check your progress A
1. Standard costing involves in determining
i) Standard Costs
ii) Actual Costs
iii) Estimated Costs
2. The difference between actual costs and standard cost is known as
i) Profit
ii) Variance
iii) Historical Cost
3. The purpose of standard costing is to
i) Reduce Costs
ii) Measure Efficiency
iii) Control Prices
4. Distinguish between standard cost and estimated cost
5. What do you understand about standard cost and standard costing.
True or False Statements
a. Standard costing is suitable to job industries where different kinds of tasks are
being done. (False)
b. Standard costing is used effectively in those industries which are producing
standardized products and are repetitive in nature. (True)
c. Budgeting is the process of preparing plans for future activities of an
enterprise. (True)
d. Standard costing is suitable for small business. (False)
e. The figure based on the average performance of the past after taking into
account the seasonal/cyclical changes is called expected standards. (False)
6
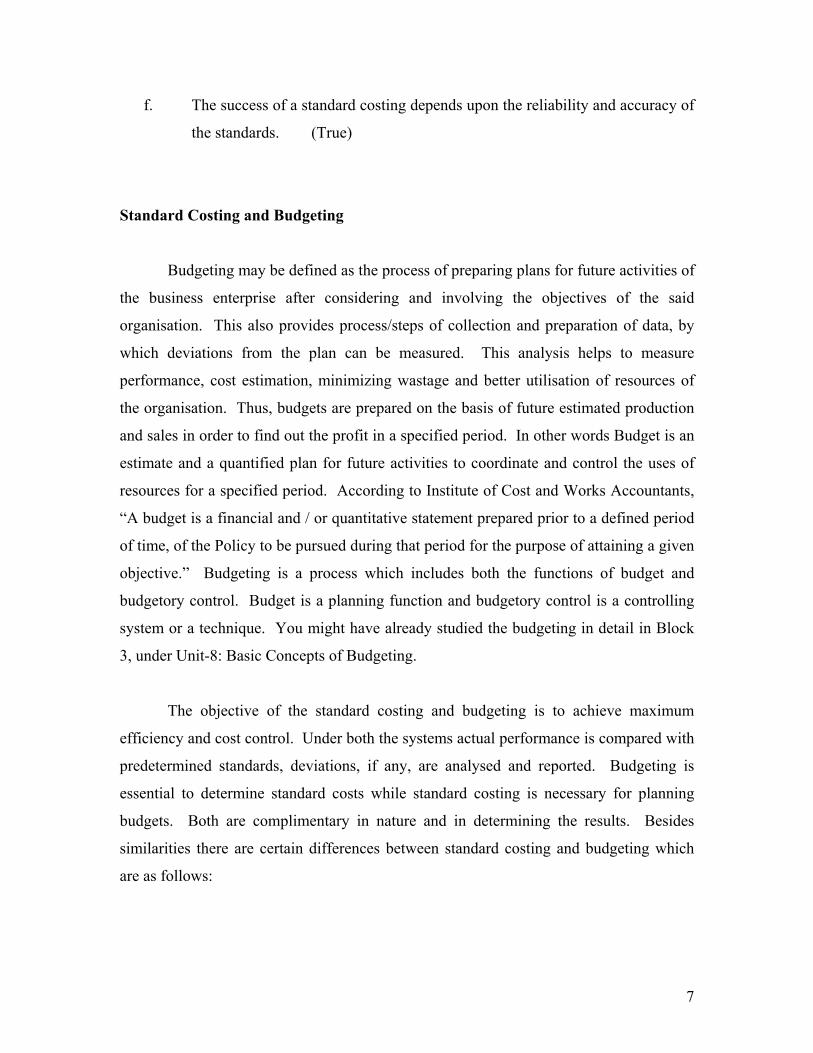
f. The success of a standard costing depends upon the reliability and accuracy of
the standards. (True)
Standard Costing and Budgeting
Budgeting may be defined as the process of preparing plans for future activities of
the business enterprise after considering and involving the objectives of the said
organisation. This also provides process/steps of collection and preparation of data, by
which deviations from the plan can be measured. This analysis helps to measure
performance, cost estimation, minimizing wastage and better utilisation of resources of
the organisation. Thus, budgets are prepared on the basis of future estimated production
and sales in order to find out the profit in a specified period. In other words Budget is an
estimate and a quantified plan for future activities to coordinate and control the uses of
resources for a specified period. According to Institute of Cost and Works Accountants,
“A budget is a financial and / or quantitative statement prepared prior to a defined period
of time, of the Policy to be pursued during that period for the purpose of attaining a given
objective.” Budgeting is a process which includes both the functions of budget and
budgetory control. Budget is a planning function and budgetory control is a controlling
system or a technique. You might have already studied the budgeting in detail in Block
3, under Unit-8: Basic Concepts of Budgeting.
The objective of the standard costing and budgeting is to achieve maximum
efficiency and cost control. Under both the systems actual performance is compared with
predetermined standards, deviations, if any, are analysed and reported. Budgeting is
essential to determine standard costs while standard costing is necessary for planning
budgets. Both are complimentary in nature and in determining the results. Besides
similarities there are certain differences between standard costing and budgeting which
are as follows:
7
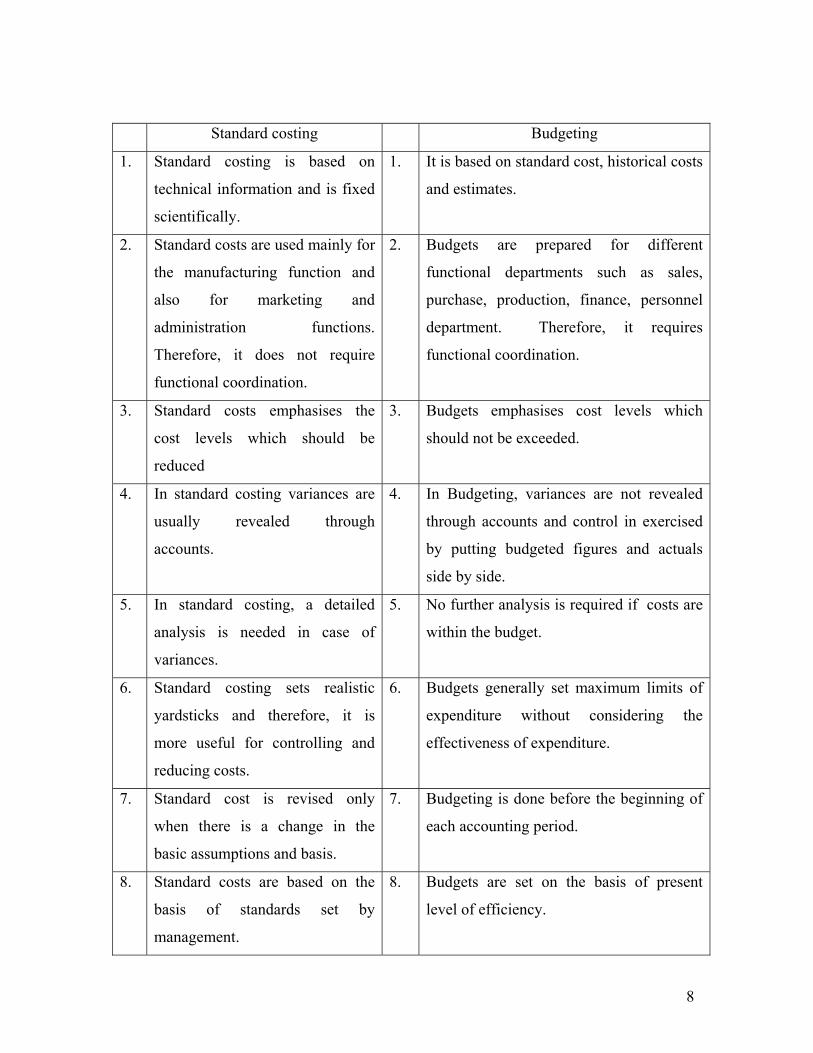
Standard costing Budgeting
1. Standard costing is based on
technical information and is fixed
scientifically.
1. It is based on standard cost, historical costs
and estimates.
2. Standard costs are used mainly for
the manufacturing function and
also for marketing and
administration functions.
Therefore, it does not require
functional coordination.
2. Budgets are prepared for different
functional departments such as sales,
purchase, production, finance, personnel
department. Therefore, it requires
functional coordination.
3. Standard costs emphasises the
cost levels which should be
reduced
3. Budgets emphasises cost levels which
should not be exceeded.
4. In standard costing variances are
usually revealed through
accounts.
4. In Budgeting, variances are not revealed
through accounts and control in exercised
by putting budgeted figures and actuals
side by side.
5. In standard costing, a detailed
analysis is needed in case of
variances.
5. No further analysis is required if costs are
within the budget.
6. Standard costing sets realistic
yardsticks and therefore, it is
more useful for controlling and
reducing costs.
6. Budgets generally set maximum limits of
expenditure without considering the
effectiveness of expenditure.
7. Standard cost is revised only
when there is a change in the
basic assumptions and basis.
7. Budgeting is done before the beginning of
each accounting period.
8. Standard costs are based on the
basis of standards set by
management.
8. Budgets are set on the basis of present
level of efficiency.
8
9. Standard costing cannot be used
partially. Standards will have to
be set for all elements of cost.
9. Budgeting can be done either wholly or
partly.
10. Standard cost is a projection of
cost accounts.
10. Budgeting is a projection of financial
accounts.
Advantages of Standard Costing
The introduction of Standard Costing system may offer many advantages. It varies from
one business to another. The following advantages may be derived from standard costing
in the light of the various objectives of the system:
1. To measure efficiency: Standard Costs provide a yardstick against which
actual costs can be measured. The comparison of actual costs with the standard cost
enables the management to evaluate the performance of various cost centres. In the
absence of standard costing, efficiency is measured by comparing actual costs of different
periods which is very difficult to measure because the conditions prevailing in both the
periods may differ.
2. To fix prices and formulate policies: Standard costing is helpful in
determining prices and formulating production policies. The standards are set by
studying all the existing conditions. It also helps to find out the prices of various
products. It helps the management in the formulation of production and price policies in
advance and also in the areas of profit planning product pricing, quoting prices of tenders.
It also helps to furnish cost estimates while planning production of new products.
3. For Effective cost control: One of the most advantages of standard
costing is that it helps in cost control. By comparing actual costs with the standard costs,
variances are determined. These variances facilitate management to locate inefficiencies
and to take remedial action against those inefficiencies at the earliest.
9
4. Management by exception: Management by exception means that each
individual is fixed targets and every one is expected to achieve these given targets.
Management need not supervise each and everything and need not bother if everything is
going as per the targets. Management interferes only when there is deviation. Variances
beyond a predetermined limit may be considered by the management for corrective
action. The standard costing enables the management in determining responsibilities and
facilitates the principle of management by exception.
5. Valuation of stocks: Under standard costing, stock is valued at standard cost and
any difference between standard cost and actual cost is transferred to variance account.
Therefore, it simplifies valuation of stock and reduces lot of clerical work to the
minimum level.
6. Cost consciousness: The emphasis under standard costing is more on cost
variations which makes the entire organisation cost conscious. It makes the employees to
recognise the importance of efficient operations so that efforts will be taken to reduce the
costs to the minimum by collective efforts.
7. Provides incentives: Under standard costing system, men, material and
machines can be used effectively and economies can be effected in addition to enhanced
productivity. Schemes may be formulated to reward those who achieve targets. It
increases efficiency, productivity and morale of the employees.
Limitations of Standard Costing
In spite of the above advantages, standard costing suffers from the following
disadvantages:
1. Difficulty in setting standards: Setting standards is a very difficult task as it
requires a lot of scientific analysis such as time study, motion study etc. When standards
10
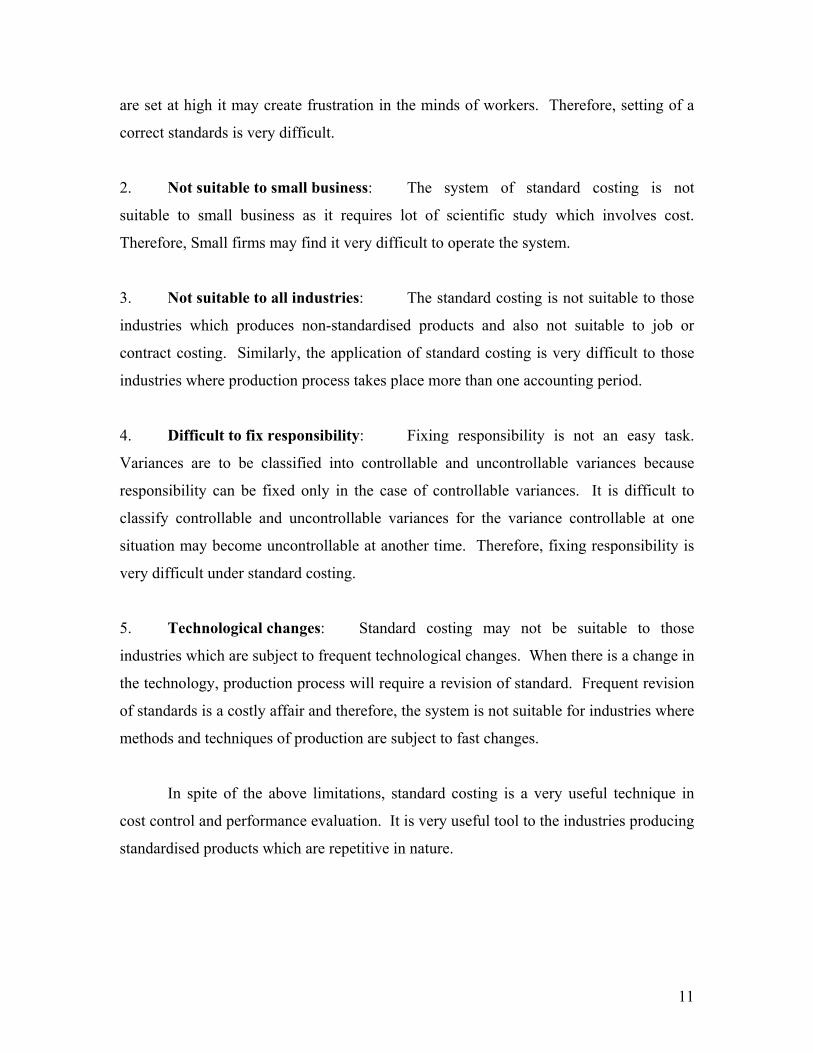
are set at high it may create frustration in the minds of workers. Therefore, setting of a
correct standards is very difficult.
2. Not suitable to small business: The system of standard costing is not
suitable to small business as it requires lot of scientific study which involves cost.
Therefore, Small firms may find it very difficult to operate the system.
3. Not suitable to all industries: The standard costing is not suitable to those
industries which produces non-standardised products and also not suitable to job or
contract costing. Similarly, the application of standard costing is very difficult to those
industries where production process takes place more than one accounting period.
4. Difficult to fix responsibility: Fixing responsibility is not an easy task.
Variances are to be classified into controllable and uncontrollable variances because
responsibility can be fixed only in the case of controllable variances. It is difficult to
classify controllable and uncontrollable variances for the variance controllable at one
situation may become uncontrollable at another time. Therefore, fixing responsibility is
very difficult under standard costing.
5. Technological changes: Standard costing may not be suitable to those
industries which are subject to frequent technological changes. When there is a change in
the technology, production process will require a revision of standard. Frequent revision
of standards is a costly affair and therefore, the system is not suitable for industries where
methods and techniques of production are subject to fast changes.
In spite of the above limitations, standard costing is a very useful technique in
cost control and performance evaluation. It is very useful tool to the industries producing
standardised products which are repetitive in nature.
11
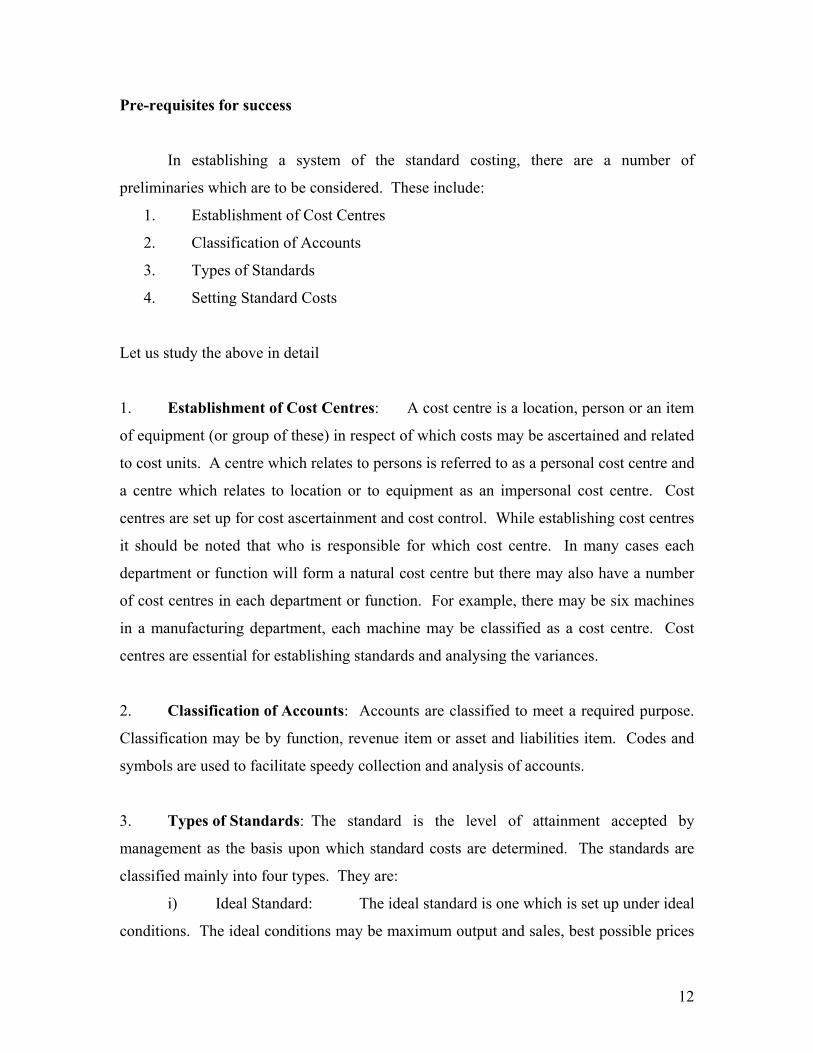
Pre-requisites for success
In establishing a system of the standard costing, there are a number of
preliminaries which are to be considered. These include:
1. Establishment of Cost Centres
2. Classification of Accounts
3. Types of Standards
4. Setting Standard Costs
Let us study the above in detail
1. Establishment of Cost Centres: A cost centre is a location, person or an item
of equipment (or group of these) in respect of which costs may be ascertained and related
to cost units. A centre which relates to persons is referred to as a personal cost centre and
a centre which relates to location or to equipment as an impersonal cost centre. Cost
centres are set up for cost ascertainment and cost control. While establishing cost centres
it should be noted that who is responsible for which cost centre. In many cases each
department or function will form a natural cost centre but there may also have a number
of cost centres in each department or function. For example, there may be six machines
in a manufacturing department, each machine may be classified as a cost centre. Cost
centres are essential for establishing standards and analysing the variances.
2. Classification of Accounts: Accounts are classified to meet a required purpose.
Classification may be by function, revenue item or asset and liabilities item. Codes and
symbols are used to facilitate speedy collection and analysis of accounts.
3. Types of Standards: The standard is the level of attainment accepted by
management as the basis upon which standard costs are determined. The standards are
classified mainly into four types. They are:
i) Ideal Standard: The ideal standard is one which is set up under ideal
conditions. The ideal conditions may be maximum output and sales, best possible prices
12
for materials, most satisfactory rates for labour and overhead costs. As these conditions
do not continue to remain ideal, this standard is of little practical value. It does provide a
target or incentive for employees, but is usually unattainable in practice.
ii) Expected Standard: This is the standard which is actually expected to be
achieved in the budget period, based on current conditions. The standards are set on
expected performance after allowing a reasonable allowance for unavoidable losses and
lapses from perfect efficiency. Standards are normally set on short term basis and
requires frequent revision. This standard is more realistic than ideal standard.
iii) Normal Standard: This represents an average figure based on the
average performance of the past after taking into account the fluctuations caused by
seasonal and cyclical changes. It should be attainable and provides a challenge to the
staff.
iv) Basic Standard: This is the level fixed in relation to a base year.
The principle used in setting the basic standard is similar to that used in statistics when
calculating an index number. The basic standard is established for a long period and is
not adjusted to the present conditions. It is just like an index number against which
subsequent price changes can be measured. Basic standard enables to measure the
changes in cost. It serves as a tool for cost control purpose because the standard is not
revised for a long period. But it cannot be used as a yard stick for measuring efficiency.
4. Setting Standard Costs: The success of a standard costing system depends
upon the reliability and accuracy of the standards. Therefore, every case should be taken
into account while establishing standards. The number of people involved with the
setting of standards will depend on the size and nature of the business. The responsibility
for setting standards should be entrusted to a specific person. In a big concern a Standard
Costing Committee is formed for this purpose. The committee consists of Production
Manager, Personnel Manager, Production Engineer, Sales Manager, Cost Accountant and
other functional heads. The cost accountant is an important person, who has to supply
the necessary cost figures and coordinate the activities of budget committee. He must
ensure that the standards set are accurate and present the statements of standard cost in
most satisfactory manner.
13
Standard costs are set for each element of cost i.e., direct materials, direct labour
and overheads. The standards should be set up in a systematic manner so that they can be
used as a tool for cost control. Briefly, standard costs will be set as shown below:
i) Standard Cost for Direct Materials:
If material is used for manufacturing a product it is known as direct
material. Direct material cost involves two things (a) Quantity of materials and (b) Price
of materials. Firstly, while setting standard for quantity of material, the quality and size
of the material should be determined. The standard quantity of material required for
producing a product is decided by the technical experts in the production department.
While fixing standard for material quantity, a proper allowance should be given to normal
loss of materials. Normal loss will be determined after careful analysis of various factors.
Secondly, standard price for the material is to be determined. Setting standard price for
material is difficult because the prices are regulated more by the external factors than the
company management. Before fixing the standard, factors like prices of materials in
stock, price quoted by suppliers, forecast of price trends, the price of materials already
contracted, provision for discounts, packing and delivery charges etc., should be
considered.
ii) Setting Standards for Direct material:
The labour involved in manufacture of a product is known as direct
labour. The wage paid to such workers is known as direct wages. The time required for
producing a product should be ascertained and labour should be properly graded. Setting
of standard cost of direct labour involves fixation of standard time and fixation of
standard rate. Standard time is fixed by time or motion study or past records or
estimates. While fixing standard time normal ideal time is to be allowed for normal
delays, idle time, other contingencies etc. The labour rate standard refers the wage rate
applicable to different categories of workers. Fixation of standard rate will depend upon
various factors take demand for labour, policy of the organisation, influence of unions,
method of wage payment etc. If any incentive scheme is in operation then anticipated
14
extra payment to the workers should also be included in determining standard rate. The
Accountant will determine the standard rate with the help of the Personnel Manager,.
The object of fixing standard time and labour rate is to get maximum efficiency in the use
of labour.
iii) Setting Standards for Direct Expenses
Direct expenses are those expenses which are specifically incurred in
connection with a particular job or cost unit. These expenses are also known as
chargeable expenses. Standards for these expenses must also be determined. Standards
for these may be based on past performance records subject to anticipatory changes
therein.
iv) Setting Standards for Overheads
Indirect costs are called overheads. These costs are those which cannot be
assigned to any particular cost unit and are incurred for the business as a whole. The
overheads are classified into fixed, variable and semi-variable overheads. Standard
overhead rate is determined for these on the basis of past records and future trend of
prices. It will be calculated per unit or per hour. Setting standard for overhead cost
involves the following two steps:
a) Determination of the standard overhead costs, and
b) Determination of the estimates of production
Standard overhead absorption rate is computed with the help of the following
formula:
Standard overhead for the period Standard overhead rate = ---------------------------------------------
(per hour) Standard hours for the period
or
Standard overhead for the period Standard overhead rate = -------------------------------------------------------
(per hour) Standard production (in units) for the period
15
The purpose of setting standard overhead rate is to minimise overhead costs. Overhead rates are more useful to the management if they are divided into fixed and variable components. When overheads are divided into fixed and variable, separate overhead absorption rates are to be calculated with the help of the following formulae:
Standard Variable Overhead for the Period Standard Variable Overhead Rate = -------------------------------------------------------- Standard Production (in Units or Hours) for the Period
Standard Fixed Overhead for the Period Standard Fixed Overhead Rate = -------------------------------------------------------- Standard Production (in Units or Hours) for the Period
Standard Hour
Production may be expressed in different units of measurement such as kilos,
tones, litres, numbers etc. When a concern produces different types of products, the
production will be expressed in different units. It is difficult to aggregate the production
which is expressed in different units. To over come this difficulty, the production is to be
expressed in a common measure known as ‘Standard Hour’. The standard hour is the
quantity of output which should be produced in one hour. A standard hour may be as “A
hypothetical hour which represents the amounts of work which should be performed in
one hour under stated conditions.” A measure of standard hour is useful for the purpose
of comparison of performance of one department to another. It is also useful to compute
efficiency and activity ratios. For example if 20 units of product A are produced in 2
hour, and 40 units of product B are produced in 5 hours, the standard hours represent 10
20 Units 40 Units units of product A (-----------)and 8 units of product B (-------------). Therefore, standard 2 hrs 5 hrs hour is the quantity of production of a given product for one clock hour.
Revision of Standards
Standard cost is based on a number of factors. These factors some may be
internal or external may vary from time to time depending upon different situations.
16
Standard cost may become unrealistic if it is not revised according to the changed
circumstances. Then a question arises what would be the period in which standards
should be set? If the standard is set for a shorter period it is expensive and frequent
revision of standards will impair the utility and purpose of the standard cost. If the
standard is set for a longer period it may not be useful particularly during periods of high
inflation and rapidly changing technological environment. Therefore, standards are
normally set for a fixed period of one year and revised annually at the beginning of
accounting period. If there are major changes, a revision may also be required within the
accounting period. If there are minor changes, the causes of difference between actual
and standards may be explained without being revised the standards. There are certain
conditions which necessitate the revision of standard costs. These conditions are:
i) Changes in price levels of materials, labour and overheads
ii) Technological changes
iii) Changes in production methods or product mixes
iv) Changes in plant capacity utilization
v) Errors discovered in setting standards
vi) Changes in designs or specification
vii) Changes in the policy of organisation
viii) Changes in government policy affecting the product or organisation, etc.
Check your progress B
1. State some of the conditions under which a revision of stand cost takes place
2. Explain the concept of standard hour.
a) Standard hour is a hypothetical hour which represents the amount of work
to be done in one hour under given circumstances (True)
17
b) To control cost either standard costing or budgetory control should be
used but not both the techniques. (False)
c) Standard cost is used as a yardstick to measure the efficiency with which
actual cost has been incurred. (True)
d) Standard cost is a projection of costs accounts whereas budgeting is a
projection of financial accounts. (True)
e) Standards are normally set for a longer period and revised annually.
(False)
Terminal Questions
1. What is Estimating Costing and how does it differ from Standard Costing?
2. What do you understand by standard costing. Give a suitable definition to explain
your answer.
3. What is Standard Costing? State the objectives of standard costing.
4. Give a comparative account of standard costing and budgeting.
5. Write a detailed note explaining the advantages and limitations of standard
costing.
6. How do you ensure the success of a standard costing method in your organisation
7. Write notes on the following:
a) Ideal standard
18
19
b) Expected standard
c) Normal standard
d) Basic standard
8. Explain the meaning of Standard Hour.
9. Write a note on Revision of Standards.
10. How are standards fixed? Explain.
11. A company has decided to introduce a system of standard costing. What are the
preliminaries to be considered before developing such a system? Explain.
Unit 13: Variance Analysis – II After having studied the first part of variance analysis consisting of material and labour
variances. Let us proceed to analysis of variances relating to overheads. Now the
overheads variance analysis is different from variance analysis relating to materials and
labour. Here the overheads and inputs are already determined. These pre determined
overheads and inputs are called the standard. The overhead is considered in terms of
predetermined rate and is applied to the input. There can be different bases for the
absorption of overheads e.g., labour hours, machine tools, output (in units), etc.
Overhead variances may be classified into fixed and variable overhead variances and
fixed overhead variance can be further analysed according to the courses. In case of
variable overheads, it is assured that variable overheads vary directly with production so
that any change in expenditure can affect costs. Some authors say that a variance may
arise through inefficiency, but as these costs are usually very small per unit of output, it is
to be ignored and any variance in variable overhead is attributed to expenditure variance.
Considering the fixed overheads cost, the difficulty arises in determining standard
overhead rates. This is so because this is dependent on the volume or level of activity.
Any change in volume or level of activity causes a change in the overhead rate.
Therefore the fixing the volume or level of activity is a crucial aspect in determining
standard overhead rate. Now if the management decides to change the normal volume or
level of activity, without a corresponding change in the fixed amount of overheads, then a
change occurs in the overhead rate. Here it may be noted that in the case of material or
labour variances, the volume decision does not in any way influence the fixation of
standard rate. So to resolve this problem, normally the Budget is used in place of the
standard.
Another important thing to be noted in case of overhead analysis is that different writers
use different modes of computation of overhead variance and also different
terminologies. E.g. spending variance is same as expenditure variance and volume
variance is same as capacity variance.
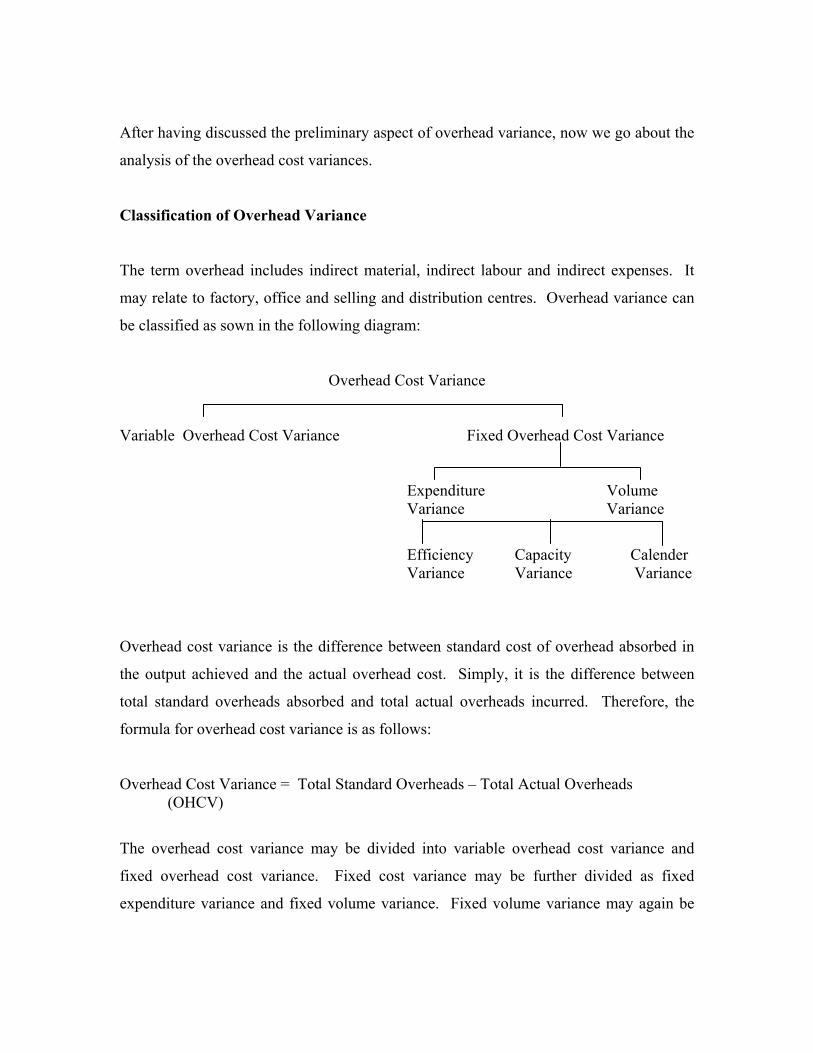
After having discussed the preliminary aspect of overhead variance, now we go about the
analysis of the overhead cost variances.
Classification of Overhead Variance
The term overhead includes indirect material, indirect labour and indirect expenses. It
may relate to factory, office and selling and distribution centres. Overhead variance can
be classified as sown in the following diagram:
Overhead Cost Variance
Variable Overhead Cost Variance Fixed Overhead Cost Variance
Expenditure Volume Variance Variance
Efficiency Capacity Calender Variance Variance Variance
Overhead cost variance is the difference between standard cost of overhead absorbed in
the output achieved and the actual overhead cost. Simply, it is the difference between
total standard overheads absorbed and total actual overheads incurred. Therefore, the
formula for overhead cost variance is as follows:
Overhead Cost Variance = Total Standard Overheads – Total Actual Overheads (OHCV)
The overhead cost variance may be divided into variable overhead cost variance and
fixed overhead cost variance. Fixed cost variance may be further divided as fixed
expenditure variance and fixed volume variance. Fixed volume variance may again be
sub-divided into efficiency variance, capacity variance and calendar variance. Let us
study, how these variances are calculated.
1. Variable Overhead Cost Variance (V.OH.C.V): This variance is the difference
between the standard variable overhead and the actual variable overhead. The formula is:
Variable Overhead Cost Variance
= Standard Variable overhead for actual output – Actual Variable Overhead
Where,
Standard Variable Overhead
= Standard hours allowed for actual output X Standard Variable Overhead Rate
Standard Variable Overheads
Standard Variable Overhead Rate = ----------------------------------------
Standard Output
It is stated earlier that there are two basic variances, price and volume. If volume does
not affect the cost per unit the only variance to be calculated is price variance known as
the variable overhead variance. But when assumed that variable overheads do not move
directly with output, the variable overhead variances are to be calculated on similar lines
as to fixed overhead variances which you will study later. In this unit, we are assuming
that variable overheads do change directly with the output and infact it is the practice that
many firms follow and by a number of writers on the subject.
Variable overhead cost variances arise due to the following reasons:
i) Advance payment of overheads
ii) Outstanding overheads during the current period
iii) Payment of past outstanding overheads during the current period
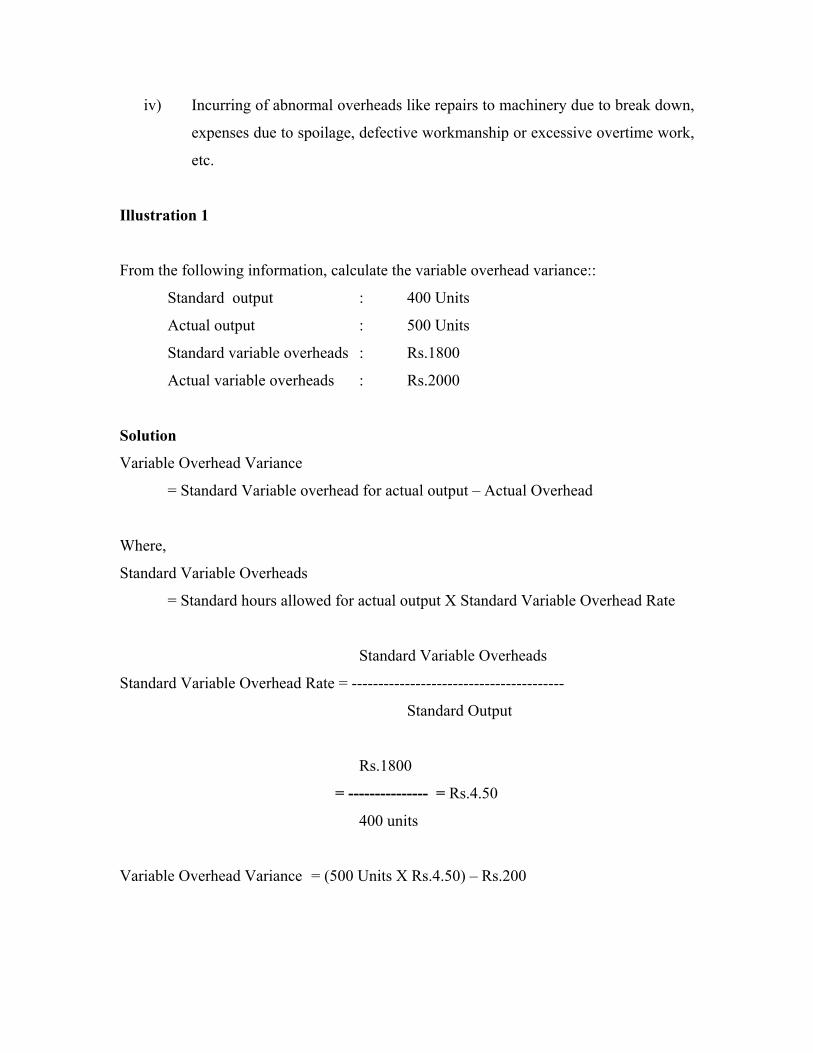
iv) Incurring of abnormal overheads like repairs to machinery due to break down,
expenses due to spoilage, defective workmanship or excessive overtime work,
etc.
Illustration 1
From the following information, calculate the variable overhead variance::
Standard output : 400 Units
Actual output : 500 Units
Standard variable overheads : Rs.1800
Actual variable overheads : Rs.2000
Solution
Variable Overhead Variance
= Standard Variable overhead for actual output – Actual Overhead
Where,
Standard Variable Overheads
= Standard hours allowed for actual output X Standard Variable Overhead Rate
Standard Variable Overheads
Standard Variable Overhead Rate = ----------------------------------------
Standard Output
Rs.1800
= --------------- = Rs.4.50
400 units
Variable Overhead Variance = (500 Units X Rs.4.50) – Rs.200
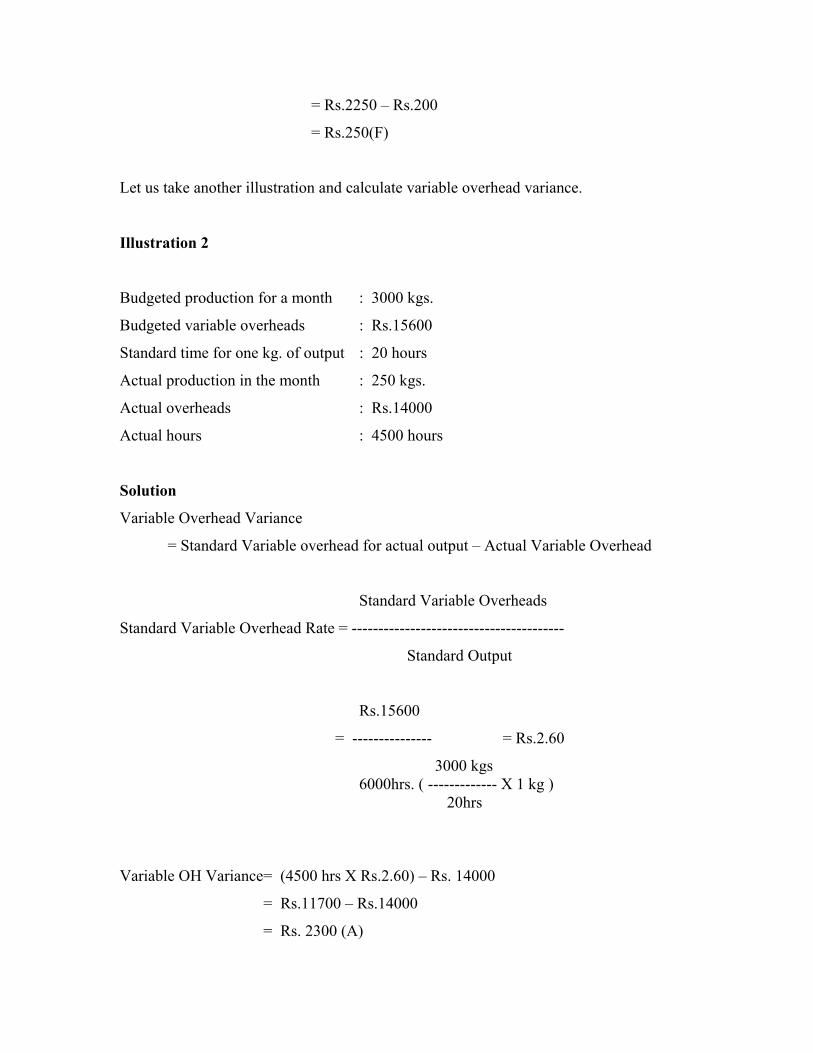
= Rs.2250 – Rs.200
= Rs.250(F)
Let us take another illustration and calculate variable overhead variance.
Illustration 2
Budgeted production for a month : 3000 kgs.
Budgeted variable overheads : Rs.15600
Standard time for one kg. of output : 20 hours
Actual production in the month : 250 kgs.
Actual overheads : Rs.14000
Actual hours : 4500 hours
Solution
Variable Overhead Variance
= Standard Variable overhead for actual output – Actual Variable Overhead
Standard Variable Overheads
Standard Variable Overhead Rate = ----------------------------------------
Standard Output
Rs.15600
= --------------- = Rs.2.60
3000 kgs 6000hrs. ( ------------- X 1 kg ) 20hrs
Variable OH Variance = (4500 hrs X Rs.2.60) – Rs. 14000
= Rs.11700 – Rs.14000
= Rs. 2300 (A)
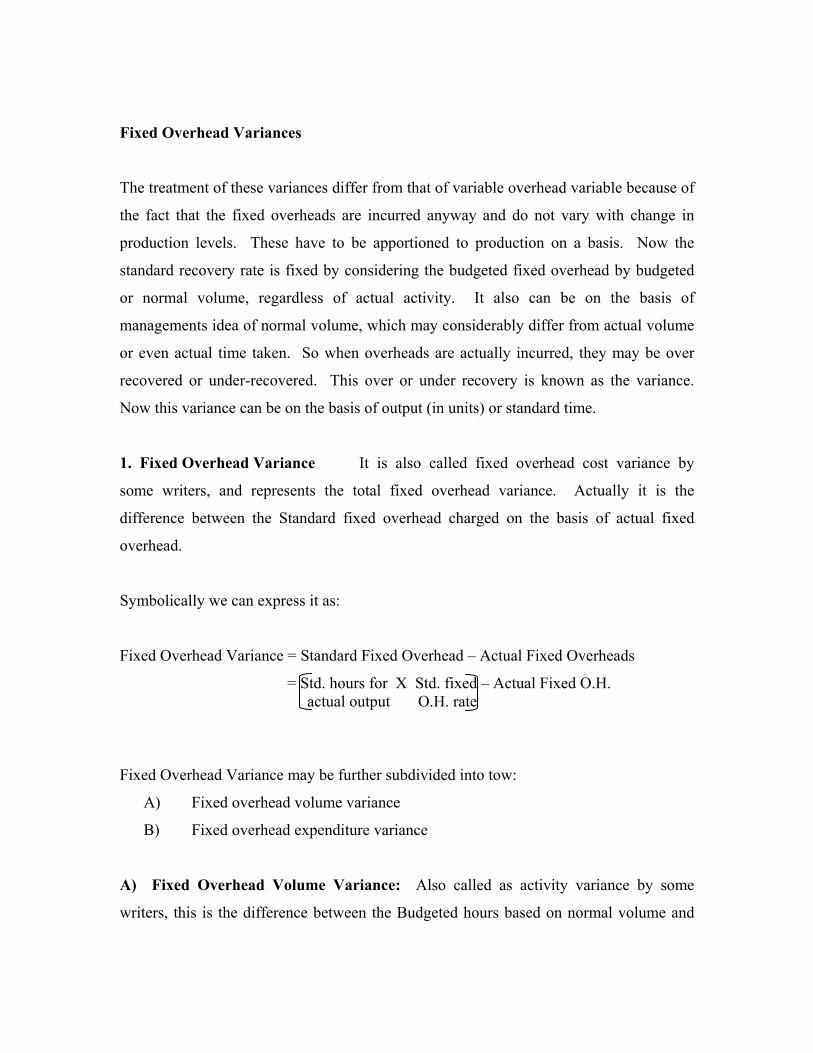
Fixed Overhead Variances
The treatment of these variances differ from that of variable overhead variable because of
the fact that the fixed overheads are incurred anyway and do not vary with change in
production levels. These have to be apportioned to production on a basis. Now the
standard recovery rate is fixed by considering the budgeted fixed overhead by budgeted
or normal volume, regardless of actual activity. It also can be on the basis of
managements idea of normal volume, which may considerably differ from actual volume
or even actual time taken. So when overheads are actually incurred, they may be over
recovered or under-recovered. This over or under recovery is known as the variance.
Now this variance can be on the basis of output (in units) or standard time.
1. Fixed Overhead Variance It is also called fixed overhead cost variance by
some writers, and represents the total fixed overhead variance. Actually it is the
difference between the Standard fixed overhead charged on the basis of actual fixed
overhead.
Symbolically we can express it as:
Fixed Overhead Variance = Standard Fixed Overhead – Actual Fixed Overheads
= Std. hours for X Std. fixed – Actual Fixed O.H. actual output O.H. rate
Fixed Overhead Variance may be further subdivided into tow:
A) Fixed overhead volume variance
B) Fixed overhead expenditure variance
A) Fixed Overhead Volume Variance: Also called as activity variance by some
writers, this is the difference between the Budgeted hours based on normal volume and
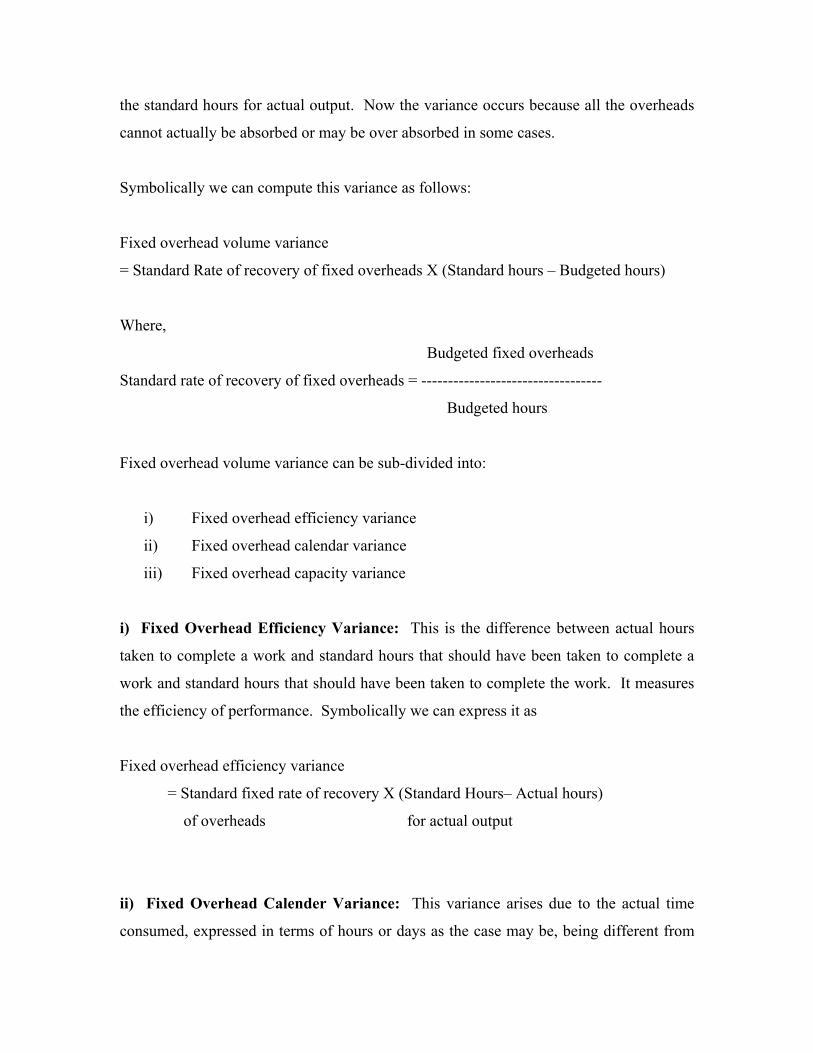
the standard hours for actual output. Now the variance occurs because all the overheads
cannot actually be absorbed or may be over absorbed in some cases.
Symbolically we can compute this variance as follows:
Fixed overhead volume variance
= Standard Rate of recovery of fixed overheads X (Standard hours – Budgeted hours)
Where,
Budgeted fixed overheads
Standard rate of recovery of fixed overheads = ----------------------------------
Budgeted hours
Fixed overhead volume variance can be sub-divided into:
i) Fixed overhead efficiency variance
ii) Fixed overhead calendar variance
iii) Fixed overhead capacity variance
i) Fixed Overhead Efficiency Variance: This is the difference between actual hours
taken to complete a work and standard hours that should have been taken to complete a
work and standard hours that should have been taken to complete the work. It measures
the efficiency of performance. Symbolically we can express it as
Fixed overhead efficiency variance
= Standard fixed rate of recovery X (Standard Hours– Actual hours)
of overheads for actual output
ii) Fixed Overhead Calender Variance: This variance arises due to the actual time
consumed, expressed in terms of hours or days as the case may be, being different from
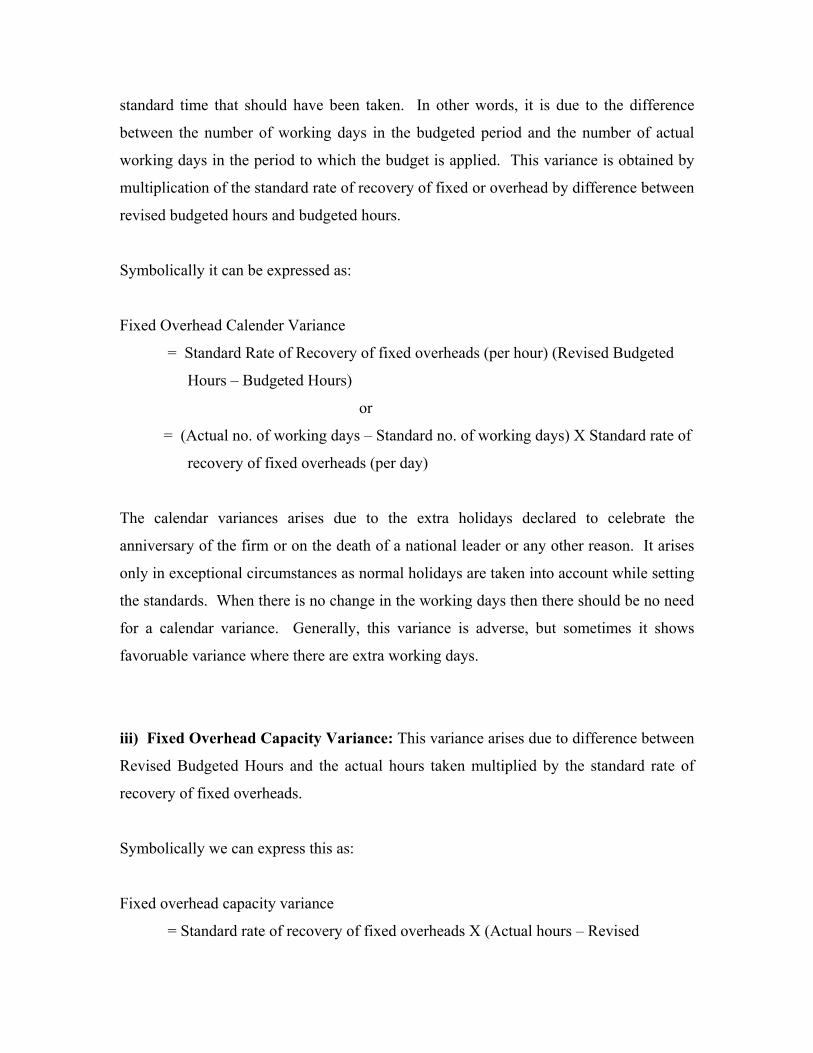
standard time that should have been taken. In other words, it is due to the difference
between the number of working days in the budgeted period and the number of actual
working days in the period to which the budget is applied. This variance is obtained by
multiplication of the standard rate of recovery of fixed or overhead by difference between
revised budgeted hours and budgeted hours.
Symbolically it can be expressed as:
Fixed Overhead Calender Variance
= Standard Rate of Recovery of fixed overheads (per hour) (Revised Budgeted
Hours – Budgeted Hours)
or
= (Actual no. of working days – Standard no. of working days) X Standard rate of
recovery of fixed overheads (per day)
The calendar variances arises due to the extra holidays declared to celebrate the
anniversary of the firm or on the death of a national leader or any other reason. It arises
only in exceptional circumstances as normal holidays are taken into account while setting
the standards. When there is no change in the working days then there should be no need
for a calendar variance. Generally, this variance is adverse, but sometimes it shows
favoruable variance where there are extra working days.
iii) Fixed Overhead Capacity Variance: This variance arises due to difference between
Revised Budgeted Hours and the actual hours taken multiplied by the standard rate of
recovery of fixed overheads.
Symbolically we can express this as:
Fixed overhead capacity variance
= Standard rate of recovery of fixed overheads X (Actual hours – Revised
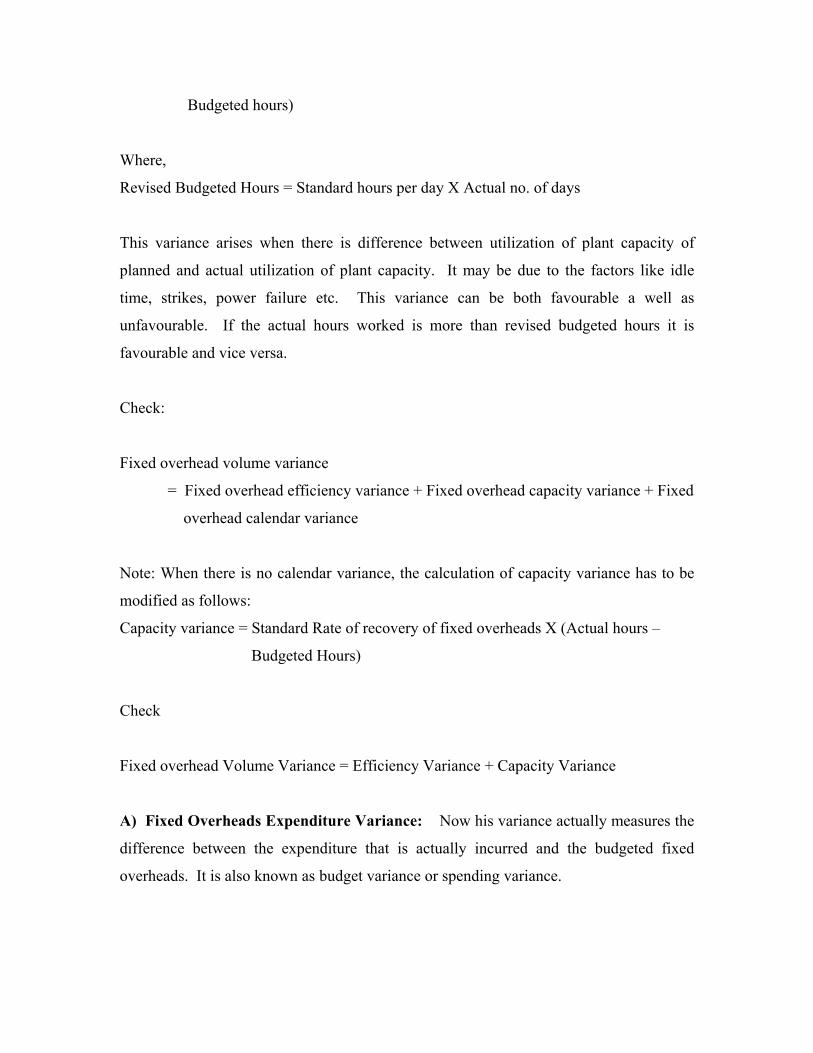
Budgeted hours)
Where,
Revised Budgeted Hours = Standard hours per day X Actual no. of days
This variance arises when there is difference between utilization of plant capacity of
planned and actual utilization of plant capacity. It may be due to the factors like idle
time, strikes, power failure etc. This variance can be both favourable a well as
unfavourable. If the actual hours worked is more than revised budgeted hours it is
favourable and vice versa.
Check:
Fixed overhead volume variance
= Fixed overhead efficiency variance + Fixed overhead capacity variance + Fixed
overhead calendar variance
Note: When there is no calendar variance, the calculation of capacity variance has to be
modified as follows:
Capacity variance = Standard Rate of recovery of fixed overheads X (Actual hours –
Budgeted Hours)
Check
Fixed overhead Volume Variance = Efficiency Variance + Capacity Variance
A) Fixed Overheads Expenditure Variance: Now his variance actually measures the
difference between the expenditure that is actually incurred and the budgeted fixed
overheads. It is also known as budget variance or spending variance.
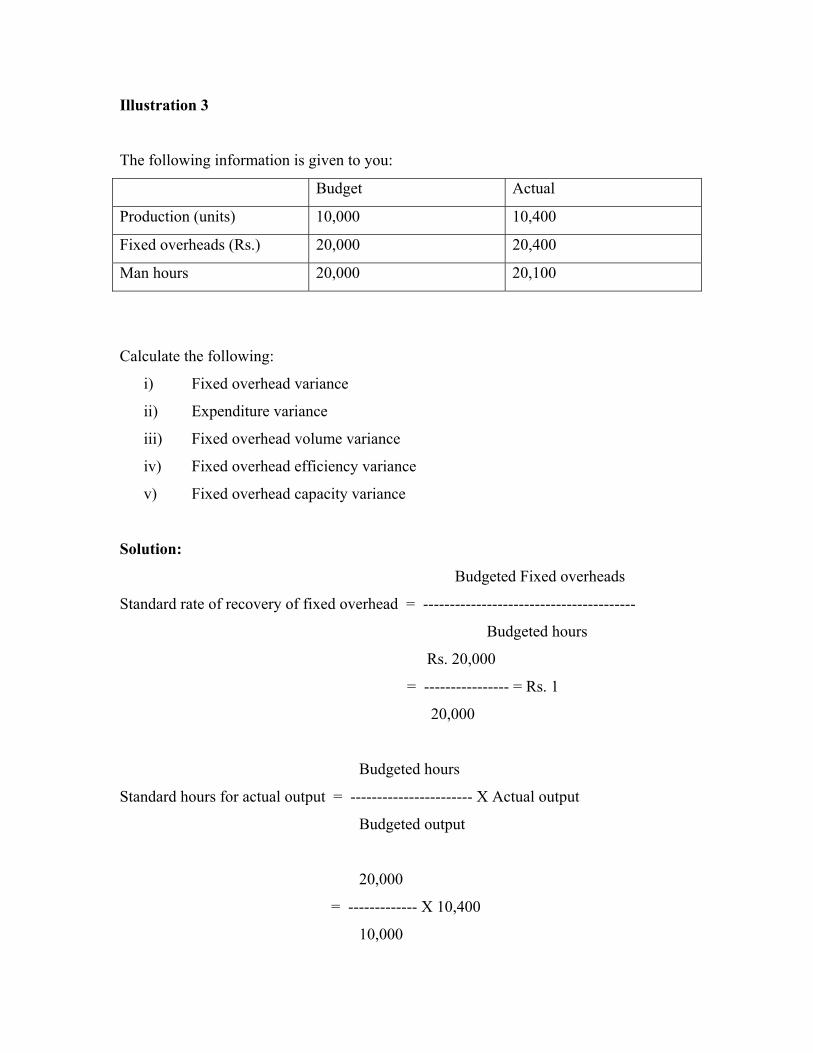
Illustration 3
The following information is given to you:
Budget Actual
Production (units) 10,000 10,400
Fixed overheads (Rs.) 20,000 20,400
Man hours 20,000 20,100
Calculate the following:
i) Fixed overhead variance
ii) Expenditure variance
iii) Fixed overhead volume variance
iv) Fixed overhead efficiency variance
v) Fixed overhead capacity variance
Solution:
Budgeted Fixed overheads
Standard rate of recovery of fixed overhead = ----------------------------------------
Budgeted hours
Rs. 20,000
= ---------------- = Rs. 1
20,000
Budgeted hours
Standard hours for actual output = ----------------------- X Actual output
Budgeted output
20,000
= ------------- X 10,400
10,000
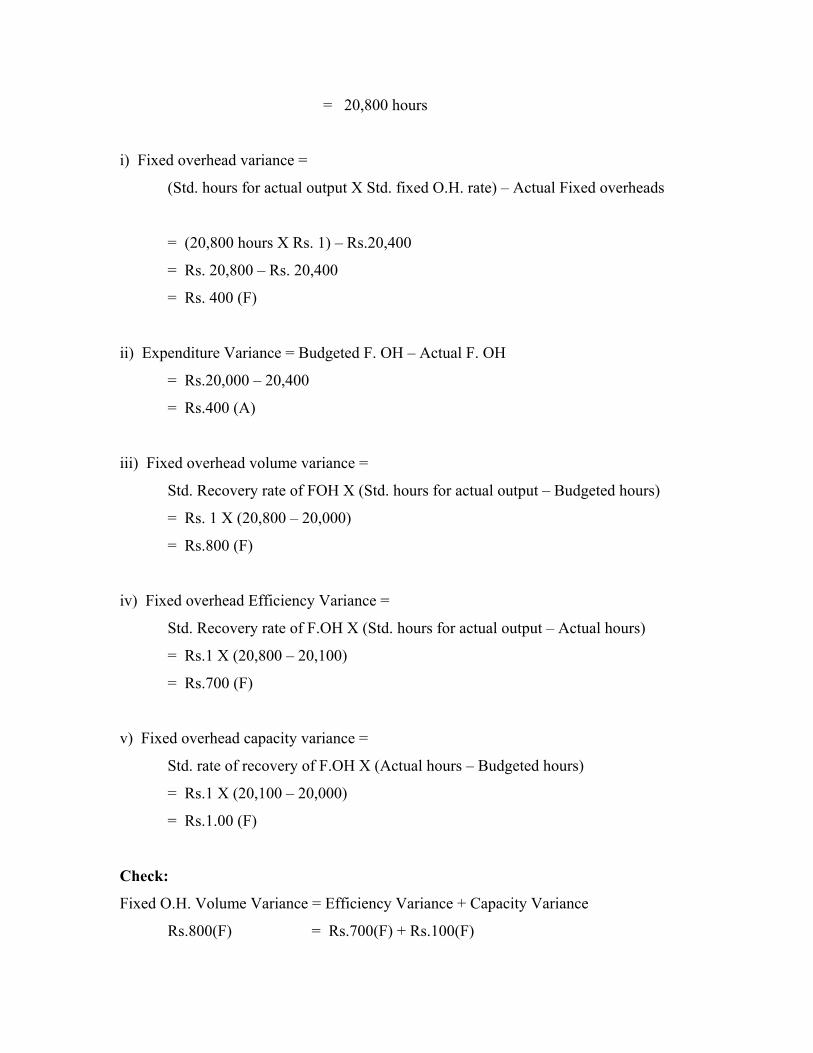
= 20,800 hours
i) Fixed overhead variance =
(Std. hours for actual output X Std. fixed O.H. rate) – Actual Fixed overheads
= (20,800 hours X Rs. 1) – Rs.20,400
= Rs. 20,800 – Rs. 20,400
= Rs. 400 (F)
ii) Expenditure Variance = Budgeted F. OH – Actual F. OH
= Rs.20,000 – 20,400
= Rs.400 (A)
iii) Fixed overhead volume variance =
Std. Recovery rate of FOH X (Std. hours for actual output – Budgeted hours)
= Rs. 1 X (20,800 – 20,000)
= Rs.800 (F)
iv) Fixed overhead Efficiency Variance =
Std. Recovery rate of F.OH X (Std. hours for actual output – Actual hours)
= Rs.1 X (20,800 – 20,100)
= Rs.700 (F)
v) Fixed overhead capacity variance =
Std. rate of recovery of F.OH X (Actual hours – Budgeted hours)
= Rs.1 X (20,100 – 20,000)
= Rs.1.00 (F)
Check:
Fixed O.H. Volume Variance = Efficiency Variance + Capacity Variance
Rs.800(F) = Rs.700(F) + Rs.100(F)
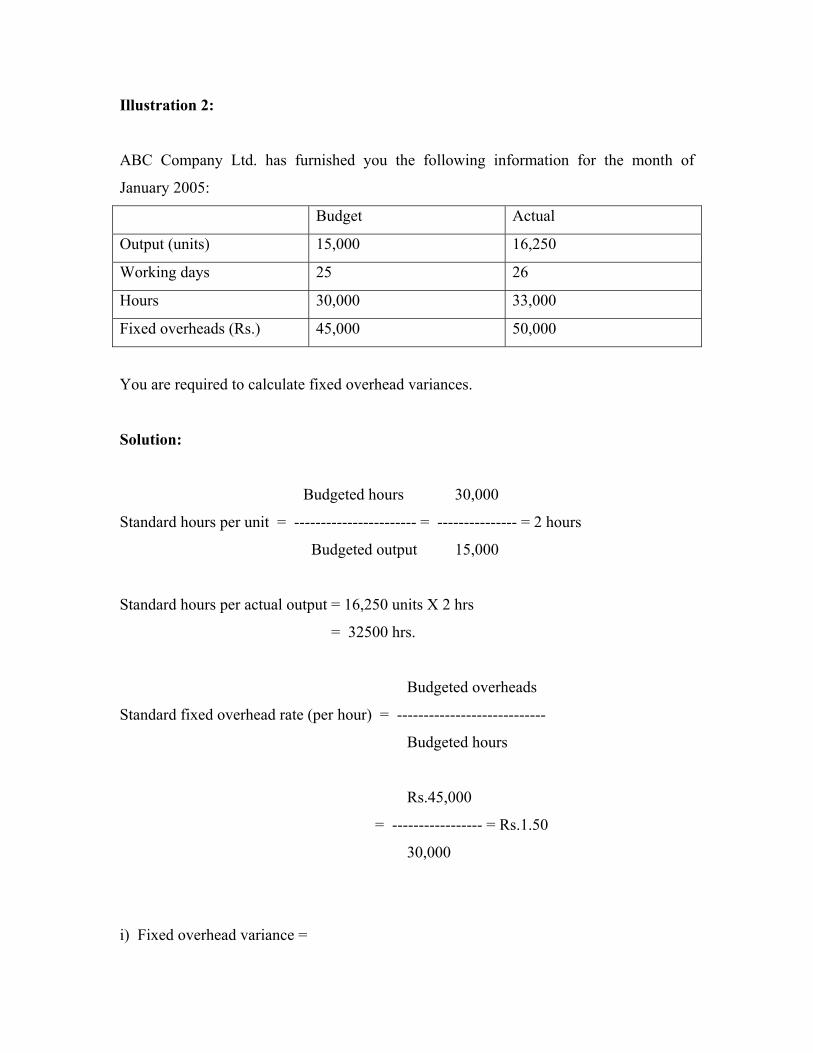
Illustration 2:
ABC Company Ltd. has furnished you the following information for the month of
January 2005:
Budget Actual
Output (units) 15,000 16,250
Working days 25 26
Hours 30,000 33,000
Fixed overheads (Rs.) 45,000 50,000
You are required to calculate fixed overhead variances.
Solution:
Budgeted hours 30,000
Standard hours per unit = ----------------------- = --------------- = 2 hours
Budgeted output 15,000
Standard hours per actual output = 16,250 units X 2 hrs
= 32500 hrs.
Budgeted overheads
Standard fixed overhead rate (per hour) = ----------------------------
Budgeted hours
Rs.45,000
= ----------------- = Rs.1.50
30,000
i) Fixed overhead variance =
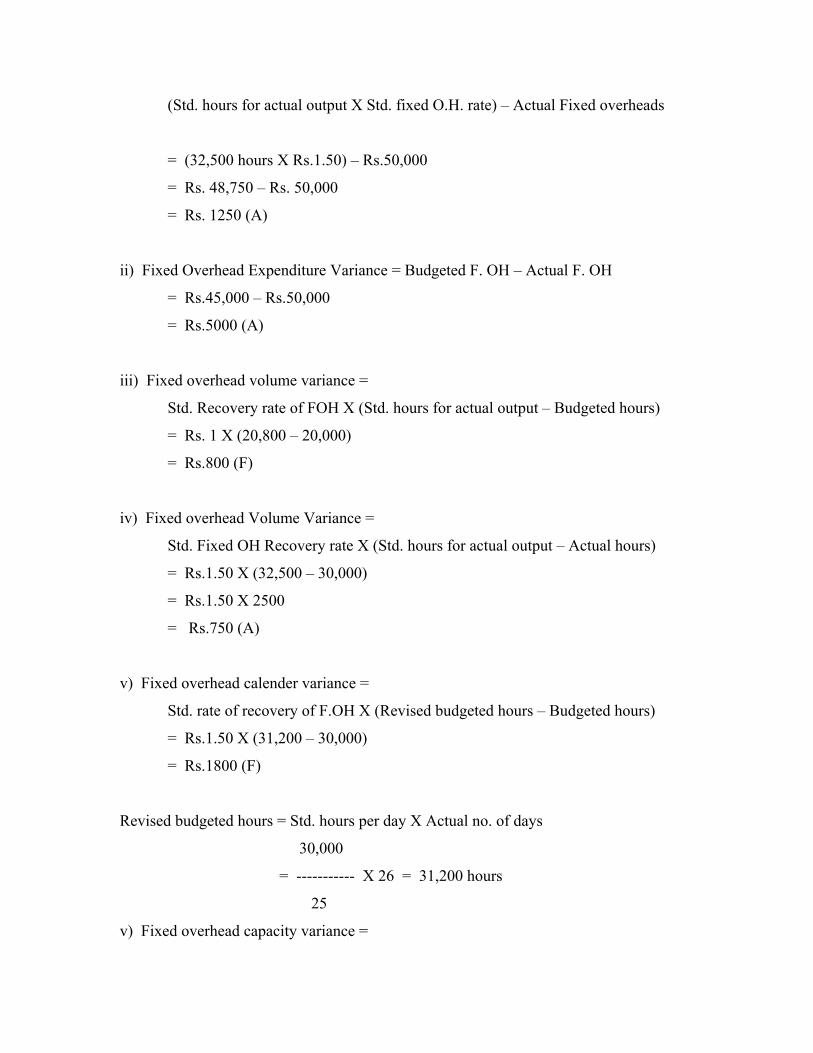
(Std. hours for actual output X Std. fixed O.H. rate) – Actual Fixed overheads
= (32,500 hours X Rs.1.50) – Rs.50,000
= Rs. 48,750 – Rs. 50,000
= Rs. 1250 (A)
ii) Fixed Overhead Expenditure Variance = Budgeted F. OH – Actual F. OH
= Rs.45,000 – Rs.50,000
= Rs.5000 (A)
iii) Fixed overhead volume variance =
Std. Recovery rate of FOH X (Std. hours for actual output – Budgeted hours)
= Rs. 1 X (20,800 – 20,000)
= Rs.800 (F)
iv) Fixed overhead Volume Variance =
Std. Fixed OH Recovery rate X (Std. hours for actual output – Actual hours)
= Rs.1.50 X (32,500 – 30,000)
= Rs.1.50 X 2500
= Rs.750 (A)
v) Fixed overhead calender variance =
Std. rate of recovery of F.OH X (Revised budgeted hours – Budgeted hours)
= Rs.1.50 X (31,200 – 30,000)
= Rs.1800 (F)
Revised budgeted hours = Std. hours per day X Actual no. of days
30,000
= ----------- X 26 = 31,200 hours
25
v) Fixed overhead capacity variance =
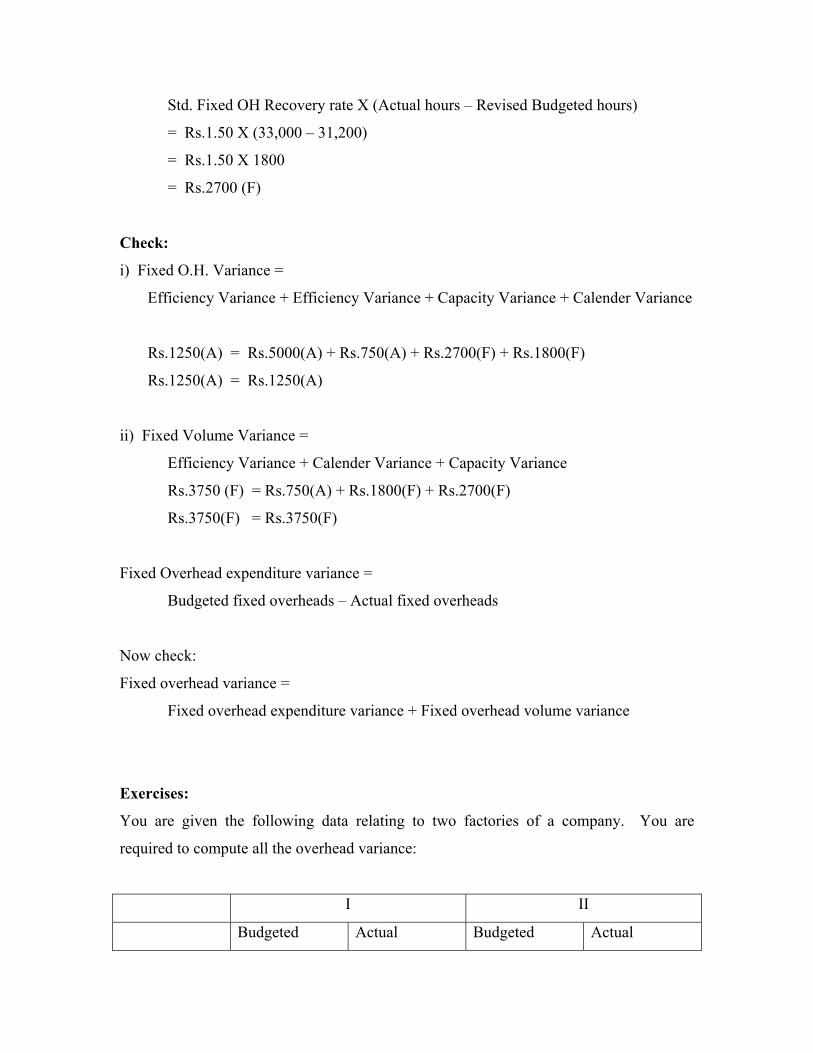
Std. Fixed OH Recovery rate X (Actual hours – Revised Budgeted hours)
= Rs.1.50 X (33,000 – 31,200)
= Rs.1.50 X 1800
= Rs.2700 (F)
Check:
i) Fixed O.H. Variance =
Efficiency Variance + Efficiency Variance + Capacity Variance + Calender Variance
Rs.1250(A) = Rs.5000(A) + Rs.750(A) + Rs.2700(F) + Rs.1800(F)
Rs.1250(A) = Rs.1250(A)
ii) Fixed Volume Variance =
Efficiency Variance + Calender Variance + Capacity Variance
Rs.3750 (F) = Rs.750(A) + Rs.1800(F) + Rs.2700(F)
Rs.3750(F) = Rs.3750(F)
Fixed Overhead expenditure variance =
Budgeted fixed overheads – Actual fixed overheads
Now check:
Fixed overhead variance =
Fixed overhead expenditure variance + Fixed overhead volume variance
Exercises:
You are given the following data relating to two factories of a company. You are
required to compute all the overhead variance:
I II
Budgeted Actual Budgeted Actual
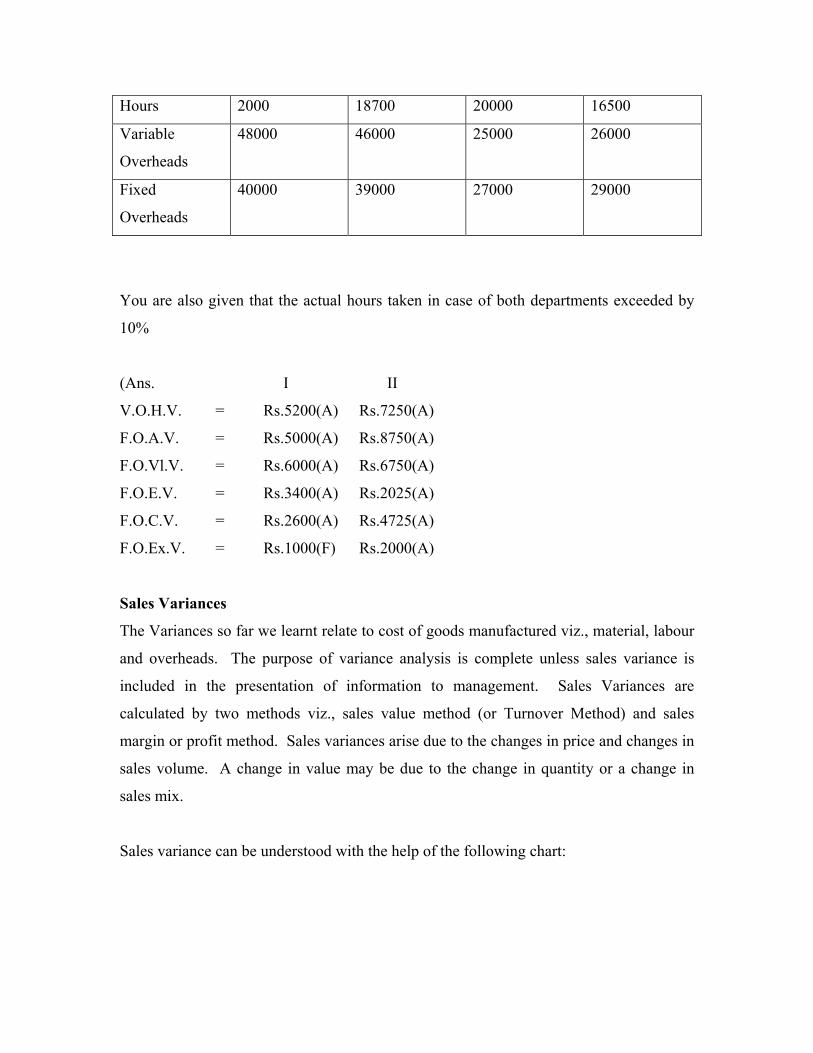
Hours 2000 18700 20000 16500
Variable
Overheads
48000 46000 25000 26000
Fixed
Overheads
40000 39000 27000 29000
You are also given that the actual hours taken in case of both departments exceeded by
10%
(Ans. I II
V.O.H.V. = Rs.5200(A) Rs.7250(A)
F.O.A.V. = Rs.5000(A) Rs.8750(A)
F.O.Vl.V. = Rs.6000(A) Rs.6750(A)
F.O.E.V. = Rs.3400(A) Rs.2025(A)
F.O.C.V. = Rs.2600(A) Rs.4725(A)
F.O.Ex.V. = Rs.1000(F) Rs.2000(A)
Sales Variances
The Variances so far we learnt relate to cost of goods manufactured viz., material, labour
and overheads. The purpose of variance analysis is complete unless sales variance is
included in the presentation of information to management. Sales Variances are
calculated by two methods viz., sales value method (or Turnover Method) and sales
margin or profit method. Sales variances arise due to the changes in price and changes in
sales volume. A change in value may be due to the change in quantity or a change in
sales mix.
Sales variance can be understood with the help of the following chart:
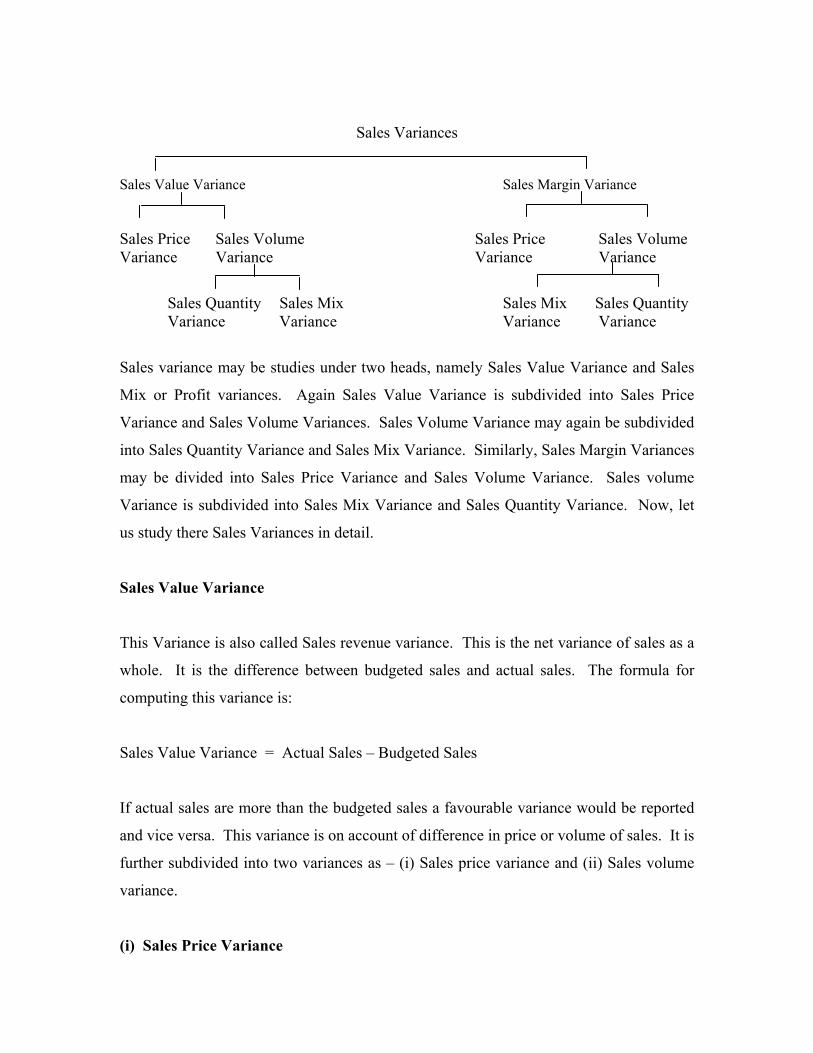
Sales Variances
Sales Value Variance Sales Margin Variance Sales Price Sales Volume Sales Price Sales Volume Variance Variance Variance Variance
Sales Quantity Sales Mix Sales Mix Sales Quantity Variance Variance Variance Variance
Sales variance may be studies under two heads, namely Sales Value Variance and Sales
Mix or Profit variances. Again Sales Value Variance is subdivided into Sales Price
Variance and Sales Volume Variances. Sales Volume Variance may again be subdivided
into Sales Quantity Variance and Sales Mix Variance. Similarly, Sales Margin Variances
may be divided into Sales Price Variance and Sales Volume Variance. Sales volume
Variance is subdivided into Sales Mix Variance and Sales Quantity Variance. Now, let
us study there Sales Variances in detail.
Sales Value Variance
This Variance is also called Sales revenue variance. This is the net variance of sales as a
whole. It is the difference between budgeted sales and actual sales. The formula for
computing this variance is:
Sales Value Variance = Actual Sales – Budgeted Sales
If actual sales are more than the budgeted sales a favourable variance would be reported
and vice versa. This variance is on account of difference in price or volume of sales. It is
further subdivided into two variances as – (i) Sales price variance and (ii) Sales volume
variance.
(i) Sales Price Variance
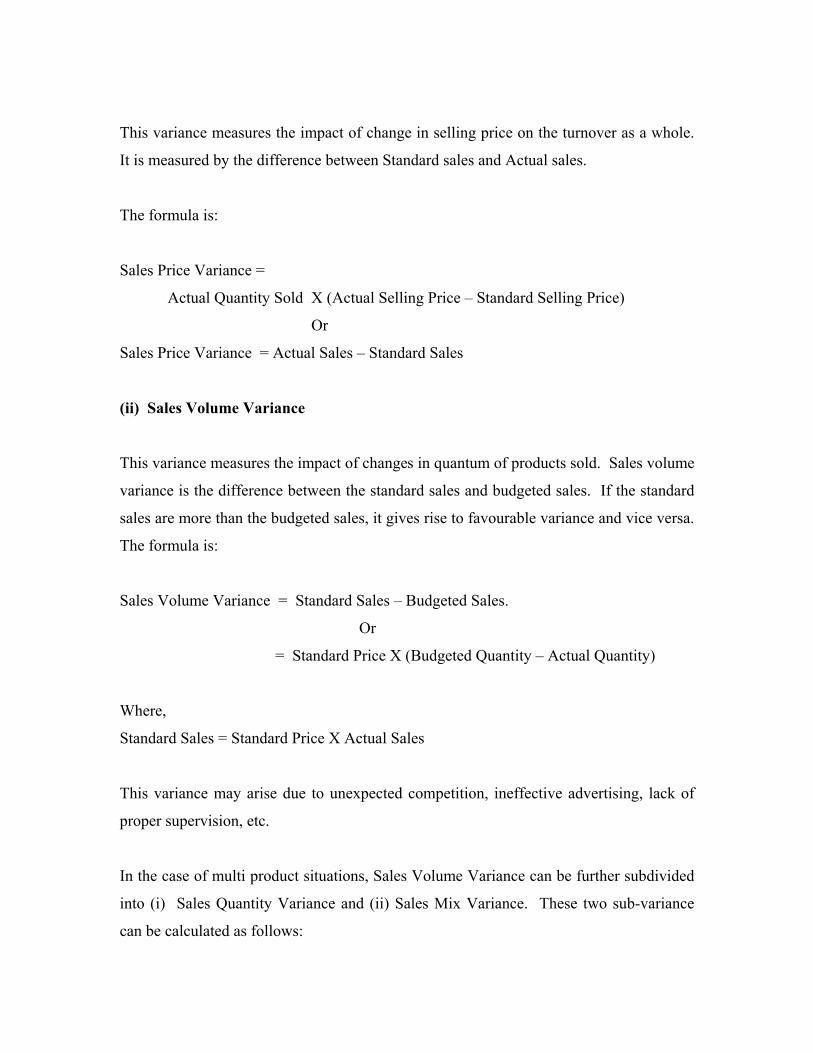
This variance measures the impact of change in selling price on the turnover as a whole.
It is measured by the difference between Standard sales and Actual sales.
The formula is:
Sales Price Variance =
Actual Quantity Sold X (Actual Selling Price – Standard Selling Price)
Or
Sales Price Variance = Actual Sales – Standard Sales
(ii) Sales Volume Variance
This variance measures the impact of changes in quantum of products sold. Sales volume
variance is the difference between the standard sales and budgeted sales. If the standard
sales are more than the budgeted sales, it gives rise to favourable variance and vice versa.
The formula is:
Sales Volume Variance = Standard Sales – Budgeted Sales.
Or
= Standard Price X (Budgeted Quantity – Actual Quantity)
Where,
Standard Sales = Standard Price X Actual Sales
This variance may arise due to unexpected competition, ineffective advertising, lack of
proper supervision, etc.
In the case of multi product situations, Sales Volume Variance can be further subdivided
into (i) Sales Quantity Variance and (ii) Sales Mix Variance. These two sub-variance
can be calculated as follows:
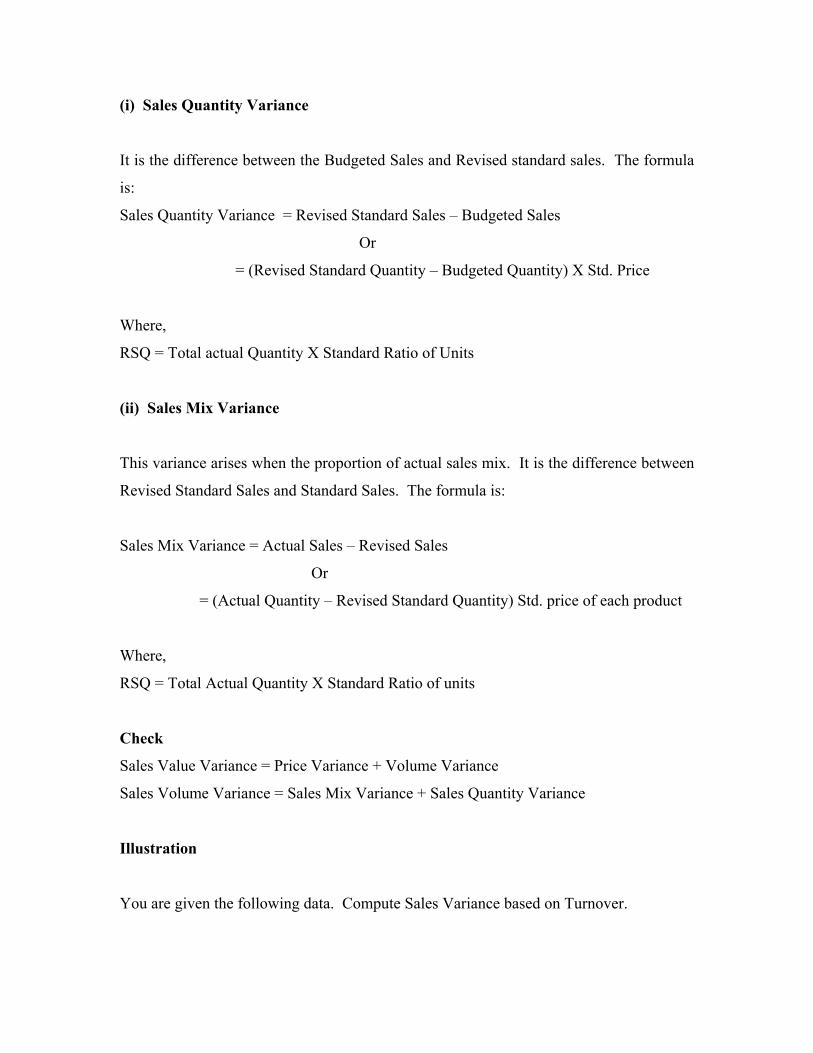
(i) Sales Quantity Variance
It is the difference between the Budgeted Sales and Revised standard sales. The formula
is:
Sales Quantity Variance = Revised Standard Sales – Budgeted Sales
Or
= (Revised Standard Quantity – Budgeted Quantity) X Std. Price
Where,
RSQ = Total actual Quantity X Standard Ratio of Units
(ii) Sales Mix Variance
This variance arises when the proportion of actual sales mix. It is the difference between
Revised Standard Sales and Standard Sales. The formula is:
Sales Mix Variance = Actual Sales – Revised Sales
Or
= (Actual Quantity – Revised Standard Quantity) Std. price of each product
Where,
RSQ = Total Actual Quantity X Standard Ratio of units
Check
Sales Value Variance = Price Variance + Volume Variance
Sales Volume Variance = Sales Mix Variance + Sales Quantity Variance
Illustration
You are given the following data. Compute Sales Variance based on Turnover.
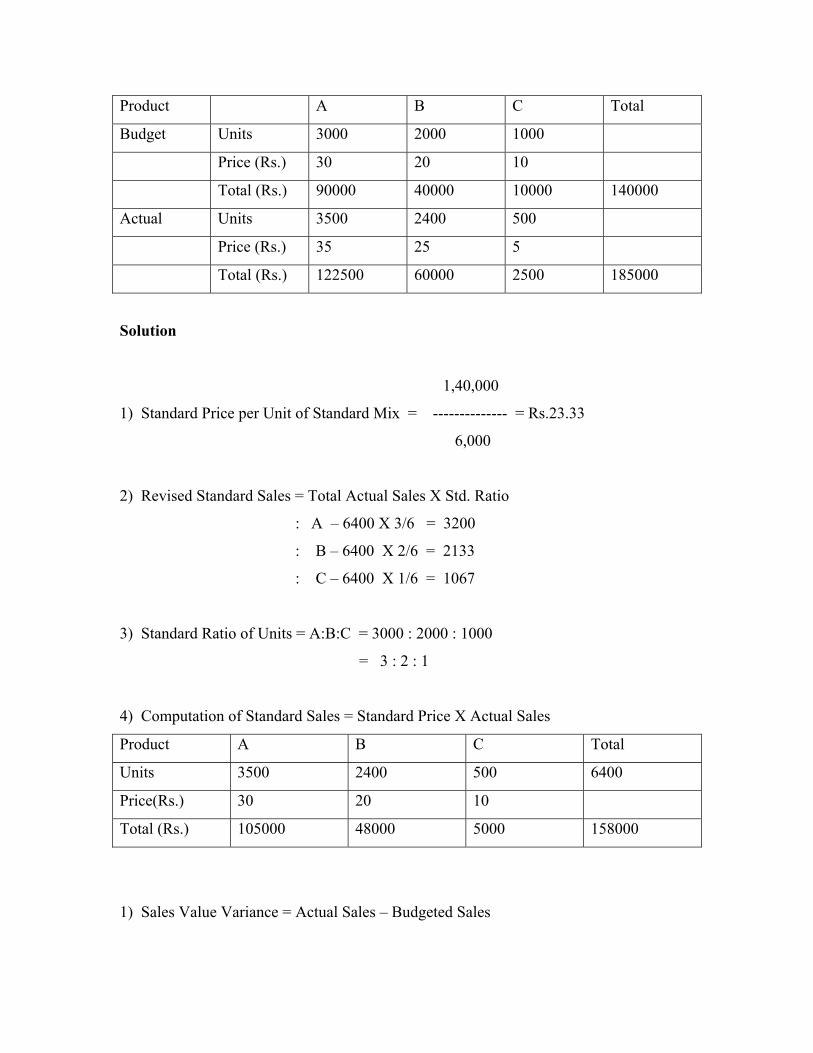
Product A B C Total
Budget Units 3000 2000 1000
Price (Rs.) 30 20 10
Total (Rs.) 90000 40000 10000 140000
Actual Units 3500 2400 500
Price (Rs.) 35 25 5
Total (Rs.) 122500 60000 2500 185000
Solution
1,40,000
1) Standard Price per Unit of Standard Mix = -------------- = Rs.23.33
6,000
2) Revised Standard Sales = Total Actual Sales X Std. Ratio
: A – 6400 X 3/6 = 3200
: B – 6400 X 2/6 = 2133
: C – 6400 X 1/6 = 1067
3) Standard Ratio of Units = A:B:C = 3000 : 2000 : 1000
= 3 : 2 : 1
4) Computation of Standard Sales = Standard Price X Actual Sales
Product A B C Total
Units 3500 2400 500 6400
Price(Rs.) 30 20 10
Total (Rs.) 105000 48000 5000 158000
1) Sales Value Variance = Actual Sales – Budgeted Sales
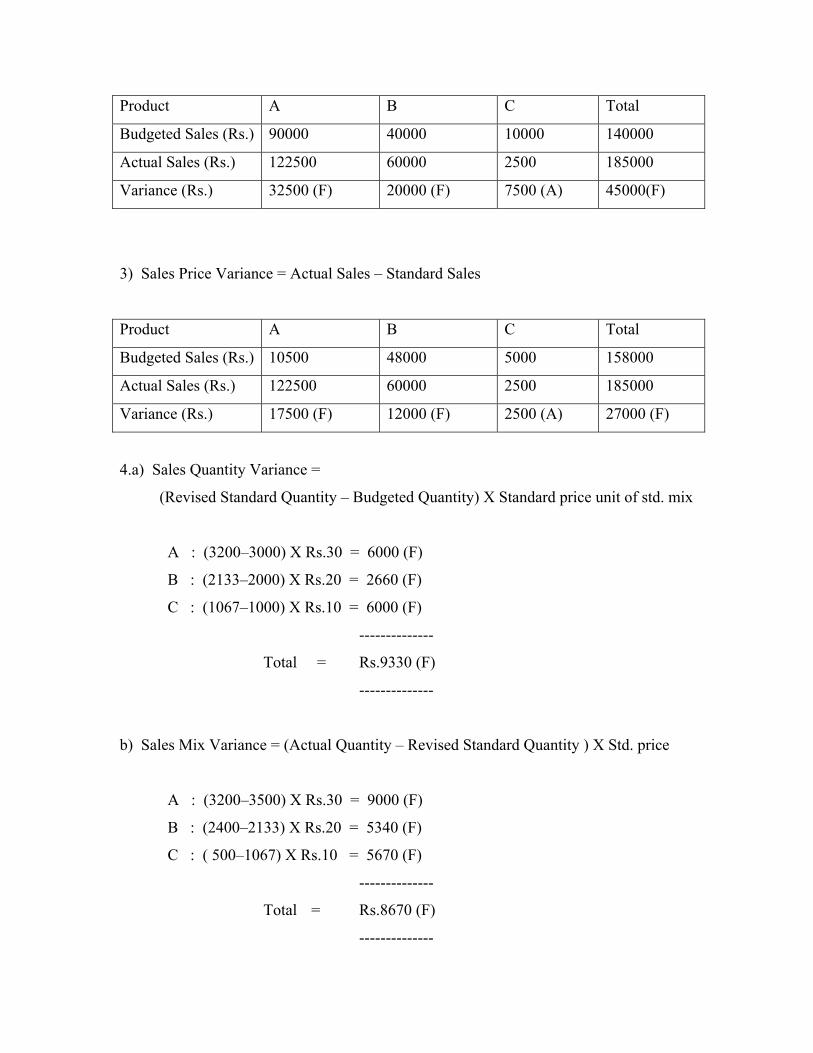
Product A B C Total
Budgeted Sales (Rs.) 90000 40000 10000 140000
Actual Sales (Rs.) 122500 60000 2500 185000
Variance (Rs.) 32500 (F) 20000 (F) 7500 (A) 45000(F)
3) Sales Price Variance = Actual Sales – Standard Sales
Product A B C Total
Budgeted Sales (Rs.) 10500 48000 5000 158000
Actual Sales (Rs.) 122500 60000 2500 185000
Variance (Rs.) 17500 (F) 12000 (F) 2500 (A) 27000 (F)
4.a) Sales Quantity Variance =
(Revised Standard Quantity – Budgeted Quantity) X Standard price unit of std. mix
A : (3200–3000) X Rs.30 = 6000 (F)
B : (2133–2000) X Rs.20 = 2660 (F)
C : (1067–1000) X Rs.10 = 6000 (F)
--------------
Total = Rs.9330 (F)
--------------
b) Sales Mix Variance = (Actual Quantity – Revised Standard Quantity ) X Std. price
A : (3200–3500) X Rs.30 = 9000 (F)
B : (2400–2133) X Rs.20 = 5340 (F)
C : ( 500–1067) X Rs.10 = 5670 (F)
--------------
Total = Rs.8670 (F)
--------------
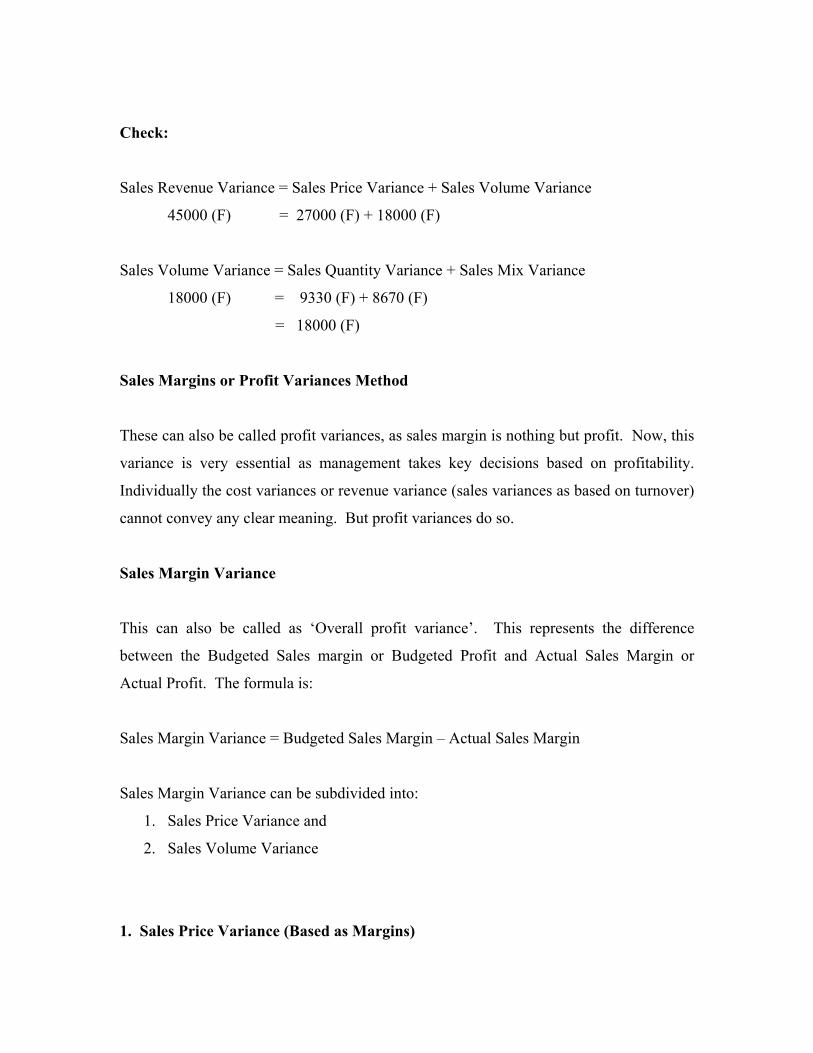
Check:
Sales Revenue Variance = Sales Price Variance + Sales Volume Variance
45000 (F) = 27000 (F) + 18000 (F)
Sales Volume Variance = Sales Quantity Variance + Sales Mix Variance
18000 (F) = 9330 (F) + 8670 (F)
= 18000 (F)
Sales Margins or Profit Variances Method
These can also be called profit variances, as sales margin is nothing but profit. Now, this
variance is very essential as management takes key decisions based on profitability.
Individually the cost variances or revenue variance (sales variances as based on turnover)
cannot convey any clear meaning. But profit variances do so.
Sales Margin Variance
This can also be called as ‘Overall profit variance’. This represents the difference
between the Budgeted Sales margin or Budgeted Profit and Actual Sales Margin or
Actual Profit. The formula is:
Sales Margin Variance = Budgeted Sales Margin – Actual Sales Margin
Sales Margin Variance can be subdivided into:
1. Sales Price Variance and
2. Sales Volume Variance
1. Sales Price Variance (Based as Margins)
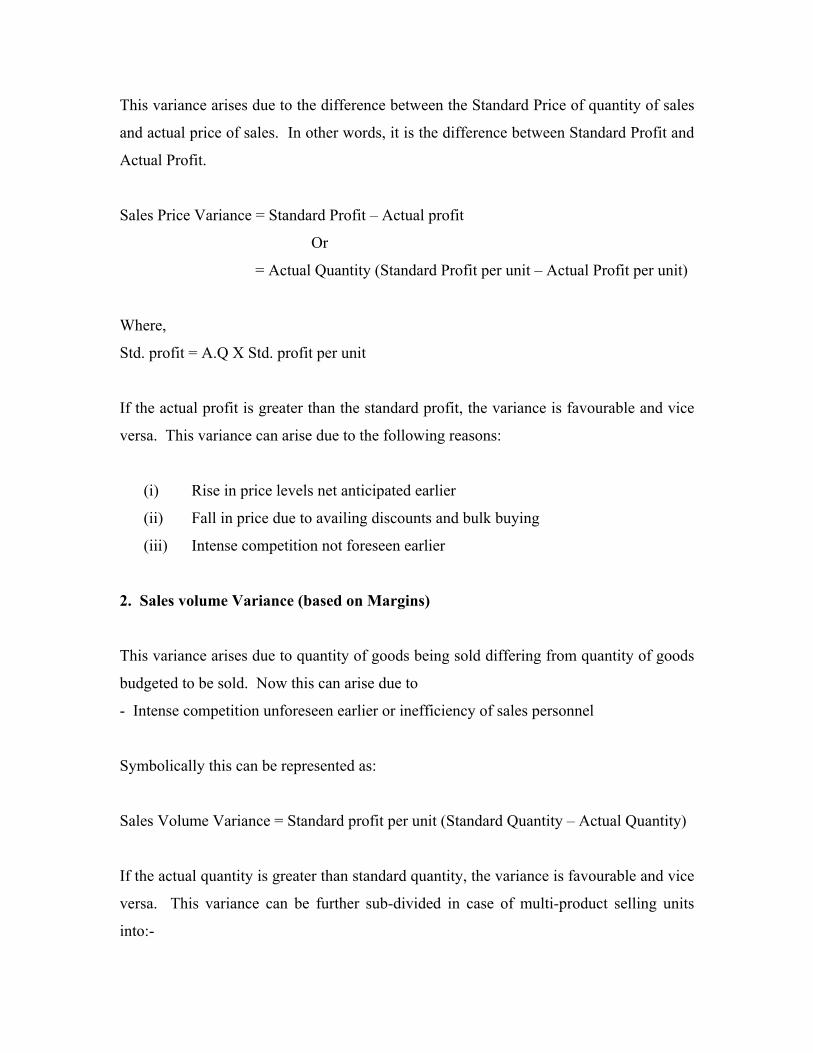
This variance arises due to the difference between the Standard Price of quantity of sales
and actual price of sales. In other words, it is the difference between Standard Profit and
Actual Profit.
Sales Price Variance = Standard Profit – Actual profit
Or
= Actual Quantity (Standard Profit per unit – Actual Profit per unit)
Where,
Std. profit = A.Q X Std. profit per unit
If the actual profit is greater than the standard profit, the variance is favourable and vice
versa. This variance can arise due to the following reasons:
(i) Rise in price levels net anticipated earlier
(ii) Fall in price due to availing discounts and bulk buying
(iii) Intense competition not foreseen earlier
2. Sales volume Variance (based on Margins)
This variance arises due to quantity of goods being sold differing from quantity of goods
budgeted to be sold. Now this can arise due to
- Intense competition unforeseen earlier or inefficiency of sales personnel
Symbolically this can be represented as:
Sales Volume Variance = Standard profit per unit (Standard Quantity – Actual Quantity)
If the actual quantity is greater than standard quantity, the variance is favourable and vice
versa. This variance can be further sub-divided in case of multi-product selling units
into:-
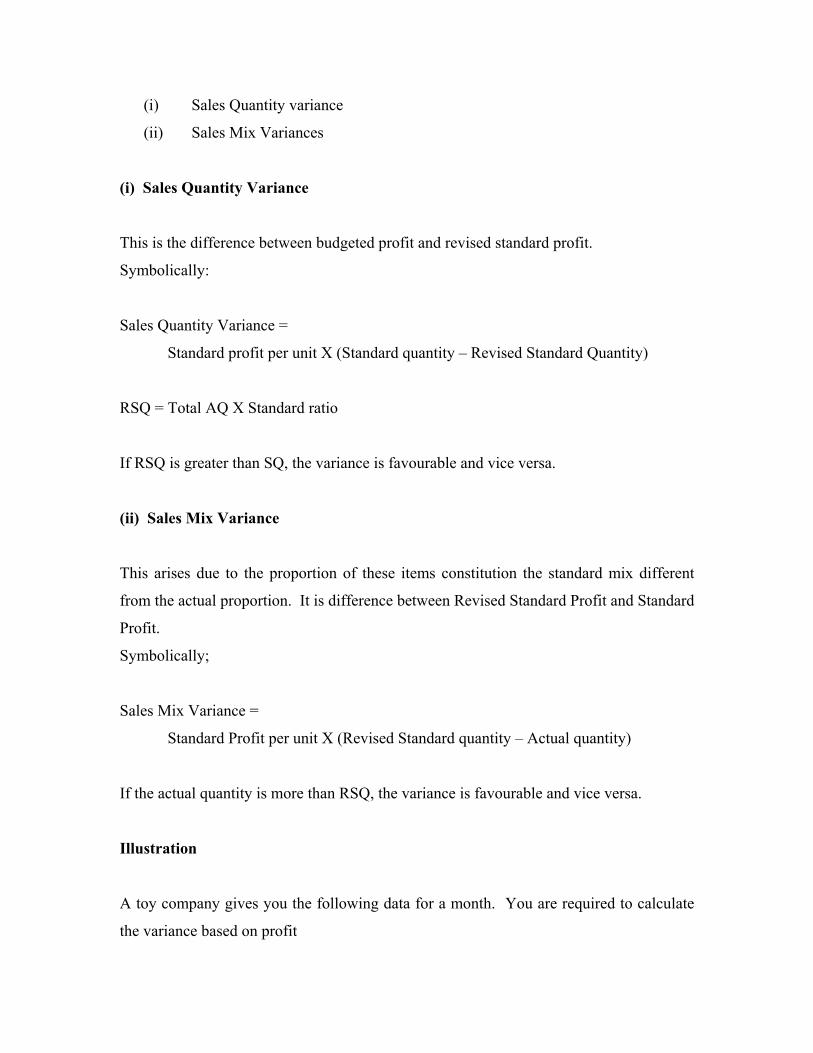
(i) Sales Quantity variance
(ii) Sales Mix Variances
(i) Sales Quantity Variance
This is the difference between budgeted profit and revised standard profit.
Symbolically:
Sales Quantity Variance =
Standard profit per unit X (Standard quantity – Revised Standard Quantity)
RSQ = Total AQ X Standard ratio
If RSQ is greater than SQ, the variance is favourable and vice versa.
(ii) Sales Mix Variance
This arises due to the proportion of these items constitution the standard mix different
from the actual proportion. It is difference between Revised Standard Profit and Standard
Profit.
Symbolically;
Sales Mix Variance =
Standard Profit per unit X (Revised Standard quantity – Actual quantity)
If the actual quantity is more than RSQ, the variance is favourable and vice versa.
Illustration
A toy company gives you the following data for a month. You are required to calculate
the variance based on profit
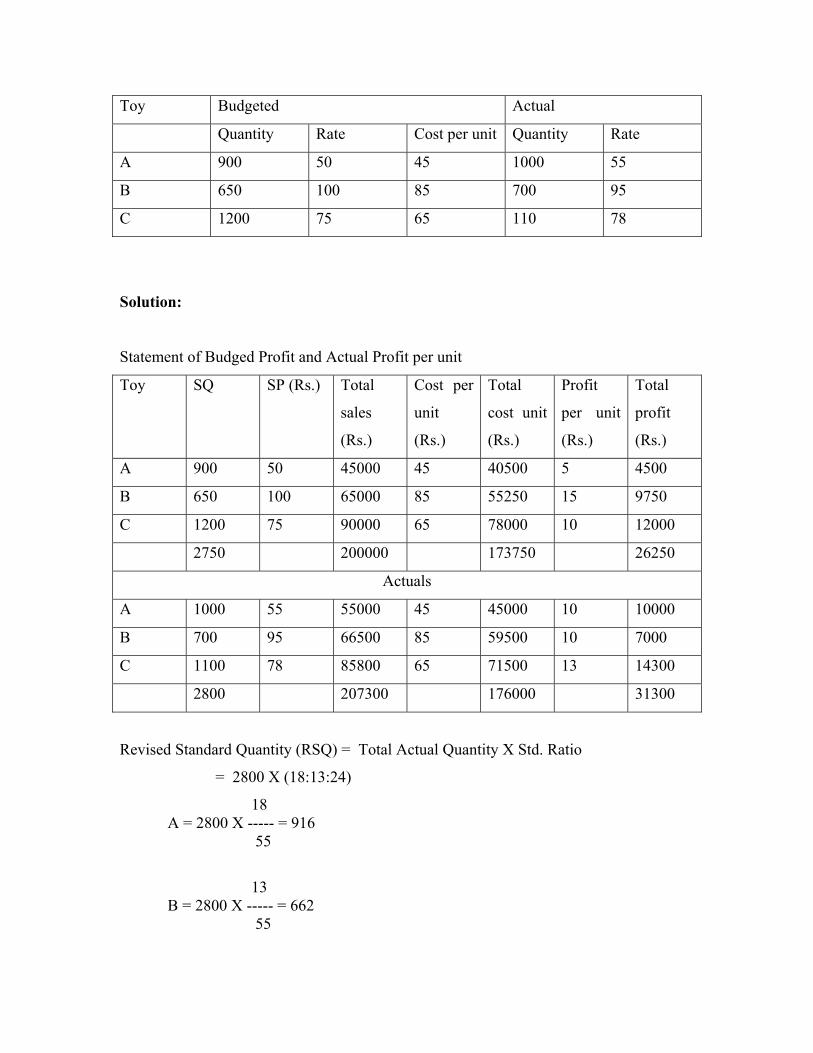
Toy Budgeted Actual
Quantity Rate Cost per unit Quantity Rate
A 900 50 45 1000 55
B 650 100 85 700 95
C 1200 75 65 110 78
Solution:
Statement of Budged Profit and Actual Profit per unit
Toy SQ SP (Rs.) Total
sales
(Rs.)
Cost per
unit
(Rs.)
Total
cost unit
(Rs.)
Profit
per unit
(Rs.)
Total
profit
(Rs.)
A 900 50 45000 45 40500 5 4500
B 650 100 65000 85 55250 15 9750
C 1200 75 90000 65 78000 10 12000
2750 200000 173750 26250
Actuals
A 1000 55 55000 45 45000 10 10000
B 700 95 66500 85 59500 10 7000
C 1100 78 85800 65 71500 13 14300
2800 207300 176000 31300
Revised Standard Quantity (RSQ) = Total Actual Quantity X Std. Ratio
= 2800 X (18:13:24)
18 A = 2800 X ----- = 916 55
13 B = 2800 X ----- = 662 55
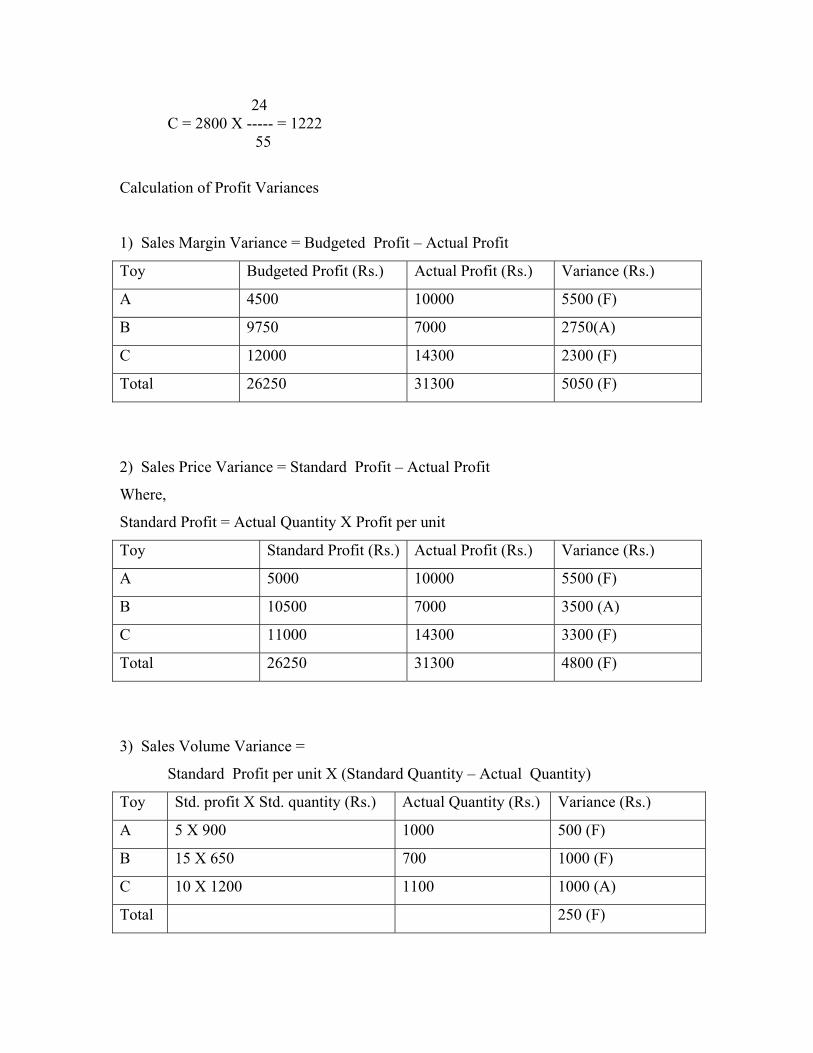
24 C = 2800 X ----- = 1222 55
Calculation of Profit Variances
1) Sales Margin Variance = Budgeted Profit – Actual Profit
Toy Budgeted Profit (Rs.) Actual Profit (Rs.) Variance (Rs.)
A 4500 10000 5500 (F)
B 9750 7000 2750(A)
C 12000 14300 2300 (F)
Total 26250 31300 5050 (F)
2) Sales Price Variance = Standard Profit – Actual Profit
Where,
Standard Profit = Actual Quantity X Profit per unit
Toy Standard Profit (Rs.) Actual Profit (Rs.) Variance (Rs.)
A 5000 10000 5500 (F)
B 10500 7000 3500 (A)
C 11000 14300 3300 (F)
Total 26250 31300 4800 (F)
3) Sales Volume Variance =
Standard Profit per unit X (Standard Quantity – Actual Quantity)
Toy Std. profit X Std. quantity (Rs.) Actual Quantity (Rs.) Variance (Rs.)
A 5 X 900 1000 500 (F)
B 15 X 650 700 1000 (F)
C 10 X 1200 1100 1000 (A)
Total 250 (F)
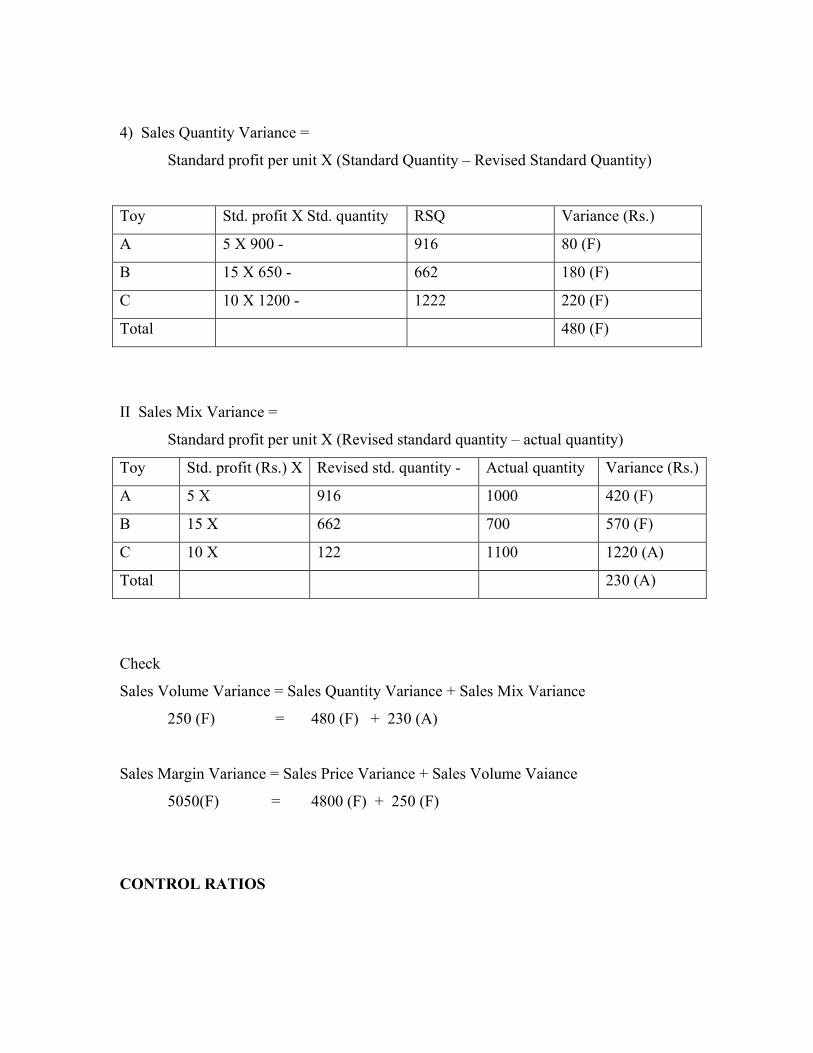
4) Sales Quantity Variance =
Standard profit per unit X (Standard Quantity – Revised Standard Quantity)
Toy Std. profit X Std. quantity RSQ Variance (Rs.)
A 5 X 900 - 916 80 (F)
B 15 X 650 - 662 180 (F)
C 10 X 1200 - 1222 220 (F)
Total 480 (F)
II Sales Mix Variance =
Standard profit per unit X (Revised standard quantity – actual quantity)
Toy Std. profit (Rs.) X Revised std. quantity - Actual quantity Variance (Rs.)
A 5 X 916 1000 420 (F)
B 15 X 662 700 570 (F)
C 10 X 122 1100 1220 (A)
Total 230 (A)
Check
Sales Volume Variance = Sales Quantity Variance + Sales Mix Variance
250 (F) = 480 (F) + 230 (A)
Sales Margin Variance = Sales Price Variance + Sales Volume Vaiance
5050(F) = 4800 (F) + 250 (F)
CONTROL RATIOS
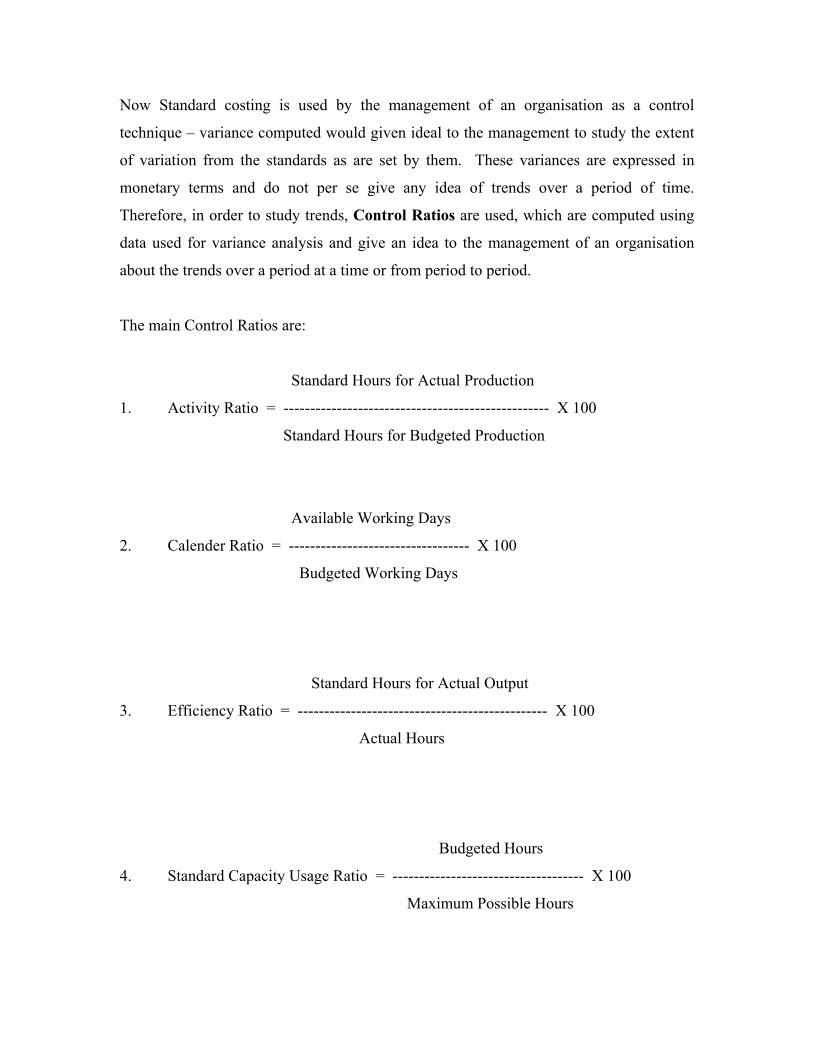
Now Standard costing is used by the management of an organisation as a control
technique – variance computed would given ideal to the management to study the extent
of variation from the standards as are set by them. These variances are expressed in
monetary terms and do not per se give any idea of trends over a period of time.
Therefore, in order to study trends, Control Ratios are used, which are computed using
data used for variance analysis and give an idea to the management of an organisation
about the trends over a period at a time or from period to period.
The main Control Ratios are:
Standard Hours for Actual Production
1. Activity Ratio = -------------------------------------------------- X 100
Standard Hours for Budgeted Production
Available Working Days
2. Calender Ratio = ---------------------------------- X 100
Budgeted Working Days
Standard Hours for Actual Output
3. Efficiency Ratio = ----------------------------------------------- X 100
Actual Hours
Budgeted Hours
4. Standard Capacity Usage Ratio = ------------------------------------ X 100
Maximum Possible Hours
Actual Hours Worked
5. Capacity Utilisation Ratio = -------------------------------------- X 100
Maximum possible hours in
Budgeted period
Disposition of Variances
The organisation, where standard costing system is not in use, accounting records contain
only actuals and there will be no variances. When standard costing system is used then
accounting records contain both standard costs and actual costs. The variances arise at
the end of the accounting period and the management should take corrective measures for
the disposal of variances. The accountants suggests several methods for treating the
variances which were as follows:
1. Allocate the Variances to Inventories
According to this method the variances are distributed over stocks of raw materials, wage
costs, overheads or finished stock valued at cost.
Now when this happens the real costs only enter the account books and consequently are
reflected in the financial statements. The adjustment of variances is made only in the
general ledger and not in subsidiary books. The distribution of variances is not done to
products. As variances are not actuals. Losses should not be taken to profit and loss
account. The standard costs and variances that are observed are displayed for control
purposes to the management.
2. Transfer to Profit and Loss Account
According to this method the stocks of inventories work in progress and finished goods
are valued at standard cost and variances are transferred to the P & L A/c. Now this
method ensures that valuation of stock is done uniformly and variances are transferred
thereby revealing the extent of variation to the management.
3. Transfer to the Reserve Account
Under this method, variances are carried formal to the next financial year as deferred
item by crediting the same to a reserve account to be set off in the subsequent year or
years. The favourable and adverse variances may cancel each other in the course of
reasonable time. This method is useful in cases where reasonable fluctuations occurs and
the variance may be disposed off during the course of time.
4. Combination of (1) and (2) methods
Though the above first two methods easy to follow, management upon their needs choose
a combination of the above two methods. The variances which are controllable and arise
out of over sight or carelessness of officials can be transferred to profit and loss a/c, the
uncontrollable can be absorbed by the cost of inventories.
EXERCISES
1) Explain how the variance analysis relating to overheads differ from that relating
to material and labour
2) In what ways can we analyse sales variances. Explain in detail.
3) Write short notes as the following:
i) Variable overhead expenditure variance
ii) Fixed overhead volume variance
iii) Fixed overhead calendar variance
iv) Variable overhead efficiency variance
v) Sales margin variance
vi) Sales price variance (based on turnover)
vii) Sales volume variance
4) A Company manufacturing two products operates standard costing system. The
Standard overhead content of each product in cost centre 101 is Product A Rs.
2.40 (8 direct hours @ Rs. 0.30 per hour) Product B Rs. 1.80 (6 direct labour
hours @ Rs.0.30 per hour. The rate of Rs. 0.30 per hour is arrived at as follows:
Budgeted overhead RS.570
Budgeted Direct Labour Hours 1,900
For the month of October the following data was recorded for cost centre 101
Output of Product A 100 Units
Output of Product B 200 Units
No opening or closing stock
Actual Direct labour hours working 2,320
Actual overhead incurred Rs.640
a. You are required to calculate total overhead variance for the month of October
b. Show its division into
i. Overhead Expenditure Variance
ii. Overhead Volume Variance
iii. Overhead Efficiency Variance
5) In a factory the standard units of production for the year were fixed at 1,20,000
units and estimated overhead expenditure were estimated to be:
Rs.
Fixed 12,000
Variable 6,000
Semi-variable 1,800
Actual production during April of the year was 8000 units. Each month has 20
working days. During the months in question there was one statutory holiday.
Actual overhead amounted to:
Fixed 1190
Variable 6000
Semi-variable 192
Semi variable charges are considered to include 60% expenses of fixed nature.
Find out expenditure, volume, calendar variances.
6) Standard Actual
No. of working days 20 22
Man hours per day 8000 8400
Output per man hour in unit 1.0 0.9
Overhead Cost (Rs.) 1,60,000 1,68,000
Calculate Overhead Variances:
a) Overhead Cost Variances
b) Overhead Efficiency Variances
c) Overhead Capacity Variance
d) Overhead Calender Variance
7) The sales manager of a company engaged in the manufacture and sale of three
products P, Q and R gives you the following information for the month of
October, 1982.
Budgeted Sales
Product Units Sold Selling Price per Unit
P 2000 Rs.012
Q 2000 Rs.8
R 2000 Rs.5
Actual Sales
P 1500 units for Rs.15000
Q 2500 units for Rs.17500
R 3500 units for Rs.21,000
You are required to calculate the following variances:
a) Sales Price Variance
b) Sales Volume Variance
C) Sales Quantity Variance
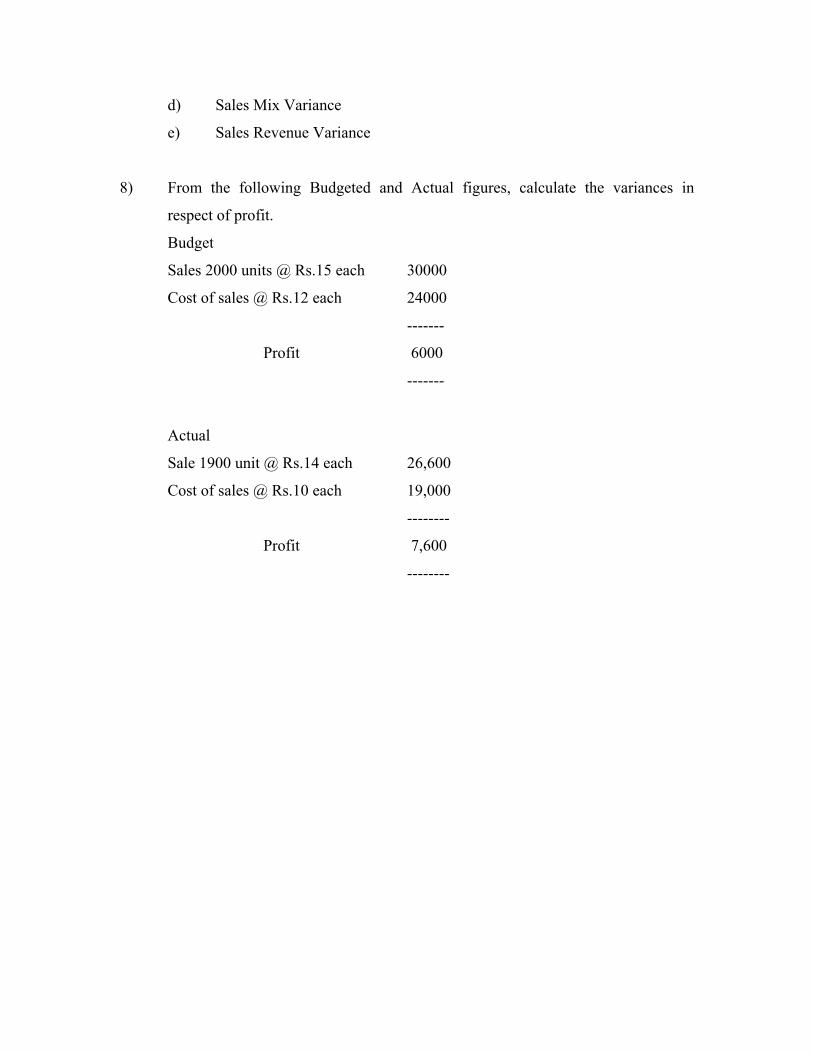
d) Sales Mix Variance
e) Sales Revenue Variance
8) From the following Budgeted and Actual figures, calculate the variances in
respect of profit.
Budget
Sales 2000 units @ Rs.15 each 30000
Cost of sales @ Rs.12 each 24000
-------
Profit 6000
-------
Actual
Sale 1900 unit @ Rs.14 each 26,600
Cost of sales @ Rs.10 each 19,000
--------
Profit 7,600
--------
69
Responsibility AccountingUNIT 14 RESPONSIBILITYACCOUNTING
Structure14.0 Objectives
14.1 Introduction
14.2 The Concept of Responsibility Accounting
14.3 Profit Planning and Control
14.4 Design of the System
14.5 Uses of Responsibility Accounting
14.6 Essentials of Success of Responsibility Accounting
14.7 Segment Performance
14.8 Measuring Segment Performance14.8.1 Return on Investment
14.8.2 Residual Income
14.9 Transfer Pricing
14.10 Methods of Transfer Pricing14.10.1 Market Price Based
14.10.2 Cost Price Based
14.11 Let Us Sum Up
14.12 Key Words
14.13 Answers to Check Your Progress
14.14 Terminal Questions
14.15 Further Readings
14.0 OBJECTIVESAfter studying this unit, you should be able to:
! know how cost and management accounting will be used for managerial planningand control.
! appreciate the structure and process in designing responsibility accounting system;
! understand the concept of responsibility centres;
! familiar with different methods of evaluating the performance of differentsegments of an organisation; and
! identify the benefits, and essentials of success of measuring and reporting of costsby managerial levels of responsibility.
14.1 INTRODUCTIONResponsibility accounting has been very much a part of cost and managementaccounting for a while now. It has emerged as a widely accepted practice withinbudgeting. But mind that responsibility accounting is not a separate system of
70
Standard Costing management accounting. It does not involve any significant change in accountingtheory or generally accepted accounting principles. Else, it represents one of the threesets of management accounting information. The two other sets are full costinformation and differential cost information. In this unit you will study about theconcept of responsibility accounting, design of the system and uses of responsibilityaccounting. In addition to this you will also learn performence evaluation of differentsegments besides transfer pricing.
14.2 THE CONCEPT OF RESPONSIBILITYACCOUNTING
The framework of responsibility accounting was developed by Professor A.J.E.Sorgdrager titled “Particularisation of Indirect Costs”. As the title suggests,responsibility accounting is a cost accounting system established on a responsibilitybasis. A basis is said to be responsible where actual results are as close to plannedresults as possible. As such, the variances are minimal. Planned results could bestated in budgets and standards. Properly speaking, responsibility accounting is amethod of budgeting and performance reporting created around the structure of theorganization. Individual managers are hold accountable for the costs within theirjurisdiction. The purpose, obviously, is to exercise control over the operations. Hence,in simple words, it could be described as a system of collecting and reportingaccounting data on the basis of managerial level. It may be defined as the approach toaccountability- identification of cost, with the persons responsible for their incurrence.Performance is evaluated by assigned responsibilities. Reporting on performance is onthe lines of organizational structure. There is a separate report for each box of theorganization chart.
The concept emphasizes “personalization of costs” by putting questions as to wherethe cost was incurred and who were responsible for it. The technique seeks to controlcosts at the starting point. Broadly speaking, responsibility accounting is designing theaccounting system according to answerability of the manager. The accumulationclassification, measurement and reporting of financial data is so arranged that itpromotes the fixing of precise responsibility on the concerned manager. Horngreenrightly says, “Responsibility accounting focuses on people and not on things. It isdesigned to present managers with information relating to their individual fields ofresponsibility’’. The message is that since all items of income, operating costs, otherexpenses and capital expenditure are the responsibility of some manager, none shouldbe left unassigned.
Responsibility accounting considers both historical and future costs. For somepurposes, the activity of responsibility centers is expressed in historical amounts. Forothers, these are expressed in estimated future amounts.
14.3 PROFIT PLANNING AND CONTROL (PPC)As mentioned earlier responsibility accounting is an important piece of the budgetarysystem. It provides for the reporting of operating data and budget comparisons to theindividuals and groups who have organizational responsibility. Responsibilityaccounting, measures plans by budgets, and actions by actual results of eachresponsibility centre. If fully developed, it has a built-in budgetary system whichperfectly fits the organizational chart. Budgeting provides the measuring stick bywhich the actual performance can be judged. Budgets, along with responsibilityaccounting provides systematic help to the managers if they interpret the feedbackcarefully.
When an integrated and comprehensive view is taken of budgeting, it becomes ProfitPlanning and Control (PPC). Desired or target profit figures are planned andcontrolled through a set of budgets. Here, responsibility accounting is the dominant
71
Responsibility Accountingconcept as control is its crux. Performance is measured by using actual results.Traditional cost accounting had been focused on determinining the cost of products andservices. In responsibility accounting, this is reversed. Costs are no longer associatedwith products and services. Else, the focus is on planning and control needs ofmanagement. Costs initially accumulated for control purposes are then recast forproduct costing purposes. The control aspect is emphasized by summarizing andreporting costs on the basis of individual responsibility before those costs are mergedfor product cost purposes.
14.4 DESIGN OF THE SYSTEMIn designing a system, one has to decide upon its structure and the process. So is theresponsibility accounting. Its structure rests on the responsibility centres. The processconsists of bifurcating costs into controllable and non-controllable groups, flexiblebudgeting, and performance reporting. These three dimensions of the process and,then, the structural reorganization could be called the principles or fundamentals ofresponsibility accounting. These are being discussed below:
1) Establishing Responsibility Centers : A responsibility centre (RC) is anorganizational unit. It exists because of some functional activity for which eachspecific manager is made responsible. Setting up of responsibility centres,therefore, becomes the first step. A large decentralized organization has to berestructured in terms of areas of influence. In ascending (i.e., rising) order ofautonomy, these are cost centres, revenue centres, profit centres, and investmentcentres. The depth of use of responsibility accounting in the enterprise depends onthe delegation of authority and assignment of responsibility. In a cost centre themanager is responsible only for the costs (expenses) incurred in his sub-unit.When actual costs of his sub-unit differ from budgeted costs then the managermust explain the significant variances. In a revenue centre, the manager isresponsible for generating revenues too upto the budgeted levels. In a profitcentre, the manager goes beyond, and is responsible also for profit performance.For instance, the manager of a furniture department of a departmental store isresponsible for earning a profit on the furniture sold. He is expected to earn thebudgeted amount of profit during the period. In an investment centre, themanager has the responsibility and control over the assets that are used to carryon its activities. For example, individual departments of a departmental store, andindividual branches of a chain stores are investment centres. The manager of theconcerned department is expected to achieve some target rate of return oninvestment. It should be noted that investment centre differs from a profit centreas investment centre is evaluated on the basis of the rate of return earned on theassets invested in the sub-unit or segment while a profit centre is evaluated on thebasis of excess of revenue over the revenue for the period. Control can beexercised only though managers who are responsible for what the organizationdoes. It is based on the principle that a manager’s performance, should beassessed only on the factors that are within his span of control. Each managers’sbudget contains costs and revenues within his span of control. Generally costsare accumulated by departments.
Subsidiary revenue and expense accounts are created for each centre. These enableaccounting transactions to be recorded not only by revenue and expense category, butalso by the responsibility centre incurring the transaction. The accounting system canthen summarize transactions by descriptive category for public reporting purposes,and by responsibility centre for purposes of performance evaluation. These accountsindicate how, at the lowest reporting level in an organization, performance reportsshow costs incurred in a division by descriptive category. At higher reporting levels,summaries reflect total costs incurred in subordinate responsibility centres.
2) Limits to Controllable Costs: Once the responsibility centres have beenestablished in a company, costs and revenues under the control of each therein
72
Standard Costing need be indicated. In responsibility accounting, the basis of classifyingcosts is controllability--- the capability of the manager of a responsibilitycentre to influence (i.e., increase or decrease) them. As such, costs areaccumulated and reported in the two groups of controllable and non-controllable costs. The former are those which can be changed by thehead of the responsibility centre. He has the ability to regulate thequantity or price or both of an item by his managerial action.Uncontrollable costs, obviously, are the costs which cannot be increasedor decreased within a given time span at the discreation of the manager.But these can be changed at higher levels of management authority.Generally, costs of raw materials, direct labour and operating supplies arecontrollable. Fixed costs are non-controllable such as rentals, depreciation,and insurance on equipment. In this setup, no allocation of common orjoint costs takes place, which by their very nature are quite indirect.Allocation is always an arbitrary process.
3) Flexibile Budgeting: Responsibility accounting starts with theassumption that budgets are flexible. They have to be prepared forseveral levels of activity, instead of one static level. When actual outputhas been obtained, a fresh budget is prepared threof. Comparison ofactual results is made against the budget targets freshly prepared for thatlevel. It would be a weak analysis to use a budget based on a level ofactivity that differs from the actual level of activity. A performancebudget is the flexible budget adjusted to the actual level attained. Flexiblebudgeting permits comparison of actual costs with budgeted costs thathave been recast to changes in production volume. It would be recalledthat flexible budgets are prepared either by the mathematical function orformula method, or the multi-activity method.
4) Performance Reporting: Each responsibility centre has to periodicallyreport about its performance, the feedback. A report has both financialand statistical parts. It shows income, expenses and capital expenditures.Statistics such as volume of production, cost per unit, and manpower dataare also provided. Typically, performance reports will disclose the actualcosts incurred, the budgeted costs, and a variance, which is the differencebetween the actual and budgeted amounts. Normally these amounts willbe summarized by the responsibility centre for the month being reportedand also for the current year-to-date. The purpose is to take timely andcorrective action. Performance reports could be monthly, weekly, or evendaily depending on the size of the organization and significance of theitem. In addition, the report must be given to the manager while theinformation is still useful. Reports received weeks after the period are oflittle value. Further, once the performance reports are prepared,management need only to consider the significant variances from thebudget. This is what is being referred to as management by exception.
Difficulties
Responsibility accounting is a conceptually appealing tool for motivation andcontrol. But many organizations in practice do not achieve these objectives. Twomajor difficulties in implementing a successful responsibility accounting system are:Accumulation of mass of dats, and Development of appropriate performancemeasures. However, cost accumulation at such a detailed level throughout anorganization is made practicable by the use of computer-based cost accountingsystems. Computer programs can quickly summarize costs for each descriptivecategory for purposes of product costing and producing a traditional incomestatement. Similar programs can summarize costs by responsibility centres andgenerate the associated performance reports. Thus, the problem of dataaccumulation, although a substantial one can now be overcome through the use of
73
Responsibility Accountingcomputer technology. As a result, the problem of developing appropriate performancemeasures has become the more difficult one to resolve.
For a budgetary system to serve as an effective means of control, cost and revenuesgoals must be adopted by each manager and accepted as individual objectives. This ismost likely to occur when budgeted goals are reasonable and realistically attainable andyet challenging. The cost accountant is in a position to identify these performancemeasure and to isolate the costs incurred in each responsibility centre. These costsmust then be categorized as controllable and uncontrollable before the reportingstructure is developed. These decisions will have a sound impact on the effectivenessof the system. Generally, responsibility accounting systems are used in conjunction withstandard costs. A major task then of the cost accountant is of the development andthen interpretation.
14.5 USES OF RESPONSIBILITY ACCOUNTINGResponsibility accounting which focuses on managerial levels is an important aid in themanagement control process. It has several uses and confers many benefits. Theseare listed below:
i) Performance Evaluation : This is perhaps the biggest benefit. Withresponsibility localized, it is possible to rate individual managers on a cost basis.When a manager is held responsible for whatever he does, he become extra-vigilant. Responsibility accounting system provides the manager with informationthat helps controlling operations and evaluating the performance of subordinates.
ii) Delegating Authority : Large business firms can hardly survive without properdelegation of authority. By its very nature, responsibility accounting makes ithappen. Decentralisation of power is its keypoint and, hence, delegation ofauthority follows.
iii) Motivation : Responsibility accounting is the use of accounting information forplanning and control. When the managers know that they are being evaluated,they are prompted to put their heart and soul in meeting the targets set for them.It acts as a great stimulus. As a matter of fact, responsibility accounting is basedon the motivating individual managers to maximum performance. The targetsprovide goals for achievement and serve to motivate managers to increaserevenues or decrease costs.
iv) Corrective Action : If performance is unsatisfactory, the person responsiblemust be identified. It is only after identification of the erring subordinate that thecorrective action can be taken. Under responsibility accounting, as areas ofauthority are clearly laid down, such corrective action becomes easier. Thecontrol action to be effective must occur immediately after identification of thecauses of the problem. The longer control action is deferred, the greater theunfavourable financial effect.
v) Management by Objectives : The heads of divisions and departments areassigned definite objectives before the commencement of the period. They areheld answerable for the attainment of these targets. Shortfalls are punished andexcesses rewarded. Such a system helps in establishing the principle ofmanagement by objectives (MBO)
vi) Management by Exception : Performance reporting here, is on exceptions ordeviations from the plan. The idea runs throughout the responsibility accounting.It helps managers by spending their time on major variances with greatestpotential improvements. The concentration of managerial attention on exceptionalor unusual items of deviation rather than on all is the key to success of thesystem.
74
Standard Costing vii) High Morale and Efficiency: Once it is clear that rewards are linked to theperformance, it acts as a great morale booster. Great disappointment will becaused if an operating foreman is evaluated on the decisions in which he was nota party.
14.6 ESSENTIALS OF SUCCESS OFRESPONSIBILITY ACCOUNTING
Responsibility accounting by itself, does not give any benefits. Its success is dependenton certain conditions. These are:
1) Support of all levels of management through “Participative budgeting”. Budgetedperformance is basic to responsibility accounting. Most managers will beresponsive to a budget which they have helped to develop. If the budget of theresponsibility centre is produced by a process of negotiation between its managerand immediate supervisor, he will work to attain it. He will more actively pursuethe goals and accept the resulting performance measures as equitable. Effectivemotivations and control based on appropriate performance measures does notoccure by accident. They must be carefully considered during the design of thesystem.
2) The system is based on individual manager’s responsibility. It is the manager whoincur costs and should be held accountable for each expenditure
3) Separation of costs into controllable and non-controllable categories.
4) Restructuring the organization along the decision-making lines of authority.
5) An organization plan which establishes objectives and goals to be achieved.
6) The delegation of authority and responsibility for cost incurrence through a systemof policies and procedures.
7) Motivation of the individual by developing standards of performance together withincentives.
8) Timely reporting and analysis of difference between goals and performance bymeans of a system of records and reports.
9) A system of appraisal or internal auditing to ensure that unfavourable variancesare clearly shown. Then, follow-up and corrective action need be applied.
In responsibility accounting revenues and expenses are accumulated and reported bylevels of responsibility with a view to comparing the actual costs with the budgetedperformance data by the responsible manager. The whole effort is towards satisfyingthe ‘data requirements for responsive control’.
Check Your Progress A
1) What do you understand about Responsibility Accounting?
................................................................................................................................
................................................................................................................................
................................................................................................................................
................................................................................................................................
75
Responsibility Accounting2) What are the stages that are involved in the process of ResponsibilityAccounting?
1). ............................................................................................................................
2) .............................................................................................................................
3) .............................................................................................................................
4) .............................................................................................................................
3) Specify any four essential conditions for the success of ResponsibilityAccounting.
1) .............................................................................................................................
2) .............................................................................................................................
3) .............................................................................................................................
4) .............................................................................................................................
4) State whether the following statements are ‘True’ or ‘False’:
i) Responsibility accounting emphasises on personalisation of costs. [ ]
ii) Responsibility accounting is based on historical costing only. [ ]
iii) The degree of responsibility of a cost centre, in a responsibility accounting,depends upon the level of delegation of authority. [ ]
iv) Responsibility accounting is not based on the assumption that budgets areflexible. [ ]
v) Setting up of responsibility centres is the first step in the process ofresponsibility accounting. [ ]
14.7 SEGMENT PERFORMANCEA segment or division may be either a profit centre having responsibility for bothrevenues and operating costs, or an investment centre, having responsibility forassets in addition to revenues and operating costs.
The manager of each segment are free to take decisions regarding the performanceof their centres. When an orgainzation grows it is inevitable to create divisions orsegments to control operations of different divisions. This requires accountinginformation which discloses not only the objectives and performances of divisionsbut also whether or not each division is performing in the interest of the organizationas a whole. This section illustrates how segment data should be presented so thatmeaningful decisions regarding segment performance can be taken.
A manager’s performance is evaluated generally on the basis of comparison ofcosts incurred with costs budgeted. It is therefore, important to allocate appropriatecosts to the respective segments. While allocating the costs, the costs relating togeneral administration or head office should not be charged to any segment as thesecosts remain constant irrespective of the volume of sales by each department. Letus see the following illustration:
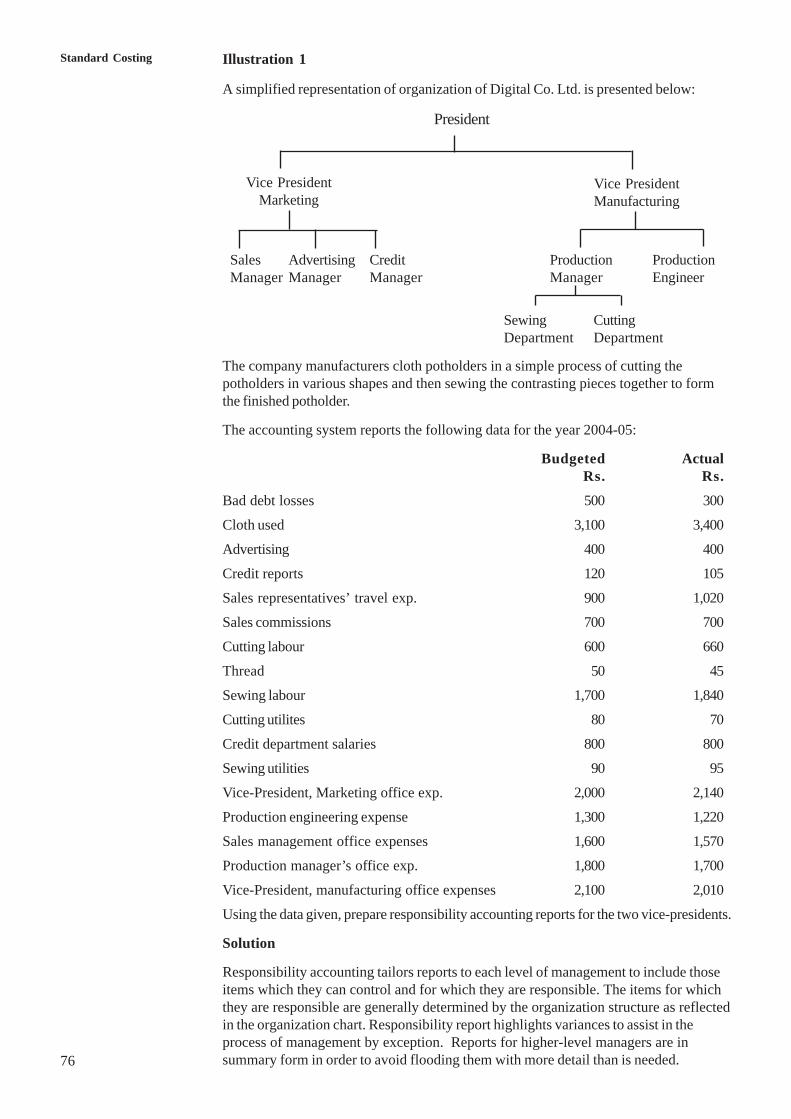
76
Standard Costing Illustration 1
A simplified representation of organization of Digital Co. Ltd. is presented below:
President
The company manufacturers cloth potholders in a simple process of cutting thepotholders in various shapes and then sewing the contrasting pieces together to formthe finished potholder.
The accounting system reports the following data for the year 2004-05:
Budgeted ActualRs. Rs.
Bad debt losses 500 300
Cloth used 3,100 3,400
Advertising 400 400
Credit reports 120 105
Sales representatives’ travel exp. 900 1,020
Sales commissions 700 700
Cutting labour 600 660
Thread 50 45
Sewing labour 1,700 1,840
Cutting utilites 80 70
Credit department salaries 800 800
Sewing utilities 90 95
Vice-President, Marketing office exp. 2,000 2,140
Production engineering expense 1,300 1,220
Sales management office expenses 1,600 1,570
Production manager’s office exp. 1,800 1,700
Vice-President, manufacturing office expenses 2,100 2,010
Using the data given, prepare responsibility accounting reports for the two vice-presidents.
Solution
Responsibility accounting tailors reports to each level of management to include thoseitems which they can control and for which they are responsible. The items for whichthey are responsible are generally determined by the organization structure as reflectedin the organization chart. Responsibility report highlights variances to assist in theprocess of management by exception. Reports for higher-level managers are insummary form in order to avoid flooding them with more detail than is needed.
Vice PresidentMarketing
Vice PresidentManufacturing
AdvertisingManager
CreditManager
ProductionEngineer
ProductionManager
SewingDepartment
CuttingDepartment
SalesManager
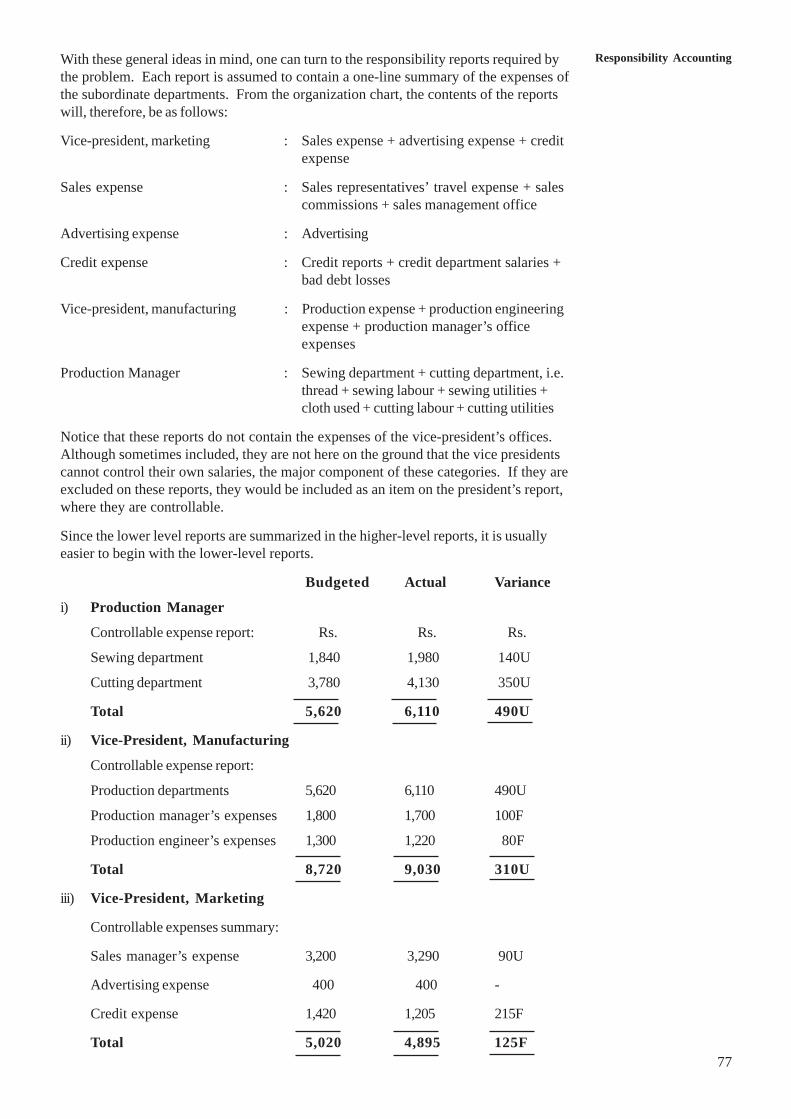
77
Responsibility AccountingWith these general ideas in mind, one can turn to the responsibility reports required bythe problem. Each report is assumed to contain a one-line summary of the expenses ofthe subordinate departments. From the organization chart, the contents of the reportswill, therefore, be as follows:
Vice-president, marketing : Sales expense + advertising expense + creditexpense
Sales expense : Sales representatives’ travel expense + salescommissions + sales management office
Advertising expense : Advertising
Credit expense : Credit reports + credit department salaries +bad debt losses
Vice-president, manufacturing : Production expense + production engineeringexpense + production manager’s officeexpenses
Production Manager : Sewing department + cutting department, i.e.thread + sewing labour + sewing utilities +cloth used + cutting labour + cutting utilities
Notice that these reports do not contain the expenses of the vice-president’s offices.Although sometimes included, they are not here on the ground that the vice presidentscannot control their own salaries, the major component of these categories. If they areexcluded on these reports, they would be included as an item on the president’s report,where they are controllable.
Since the lower level reports are summarized in the higher-level reports, it is usuallyeasier to begin with the lower-level reports.
Budgeted Actual Variance
i) Production Manager
Controllable expense report: Rs. Rs. Rs.
Sewing department 1,840 1,980 140U
Cutting department 3,780 4,130 350U
Total 5,620 6,110 490U
ii) Vice-President, Manufacturing
Controllable expense report:
Production departments 5,620 6,110 490U
Production manager’s expenses 1,800 1,700 100F
Production engineer’s expenses 1,300 1,220 80F
Total 8,720 9,030 310U
iii) Vice-President, Marketing
Controllable expenses summary:
Sales manager’s expense 3,200 3,290 90U
Advertising expense 400 400 -
Credit expense 1,420 1,205 215F
Total 5,020 4,895 125F
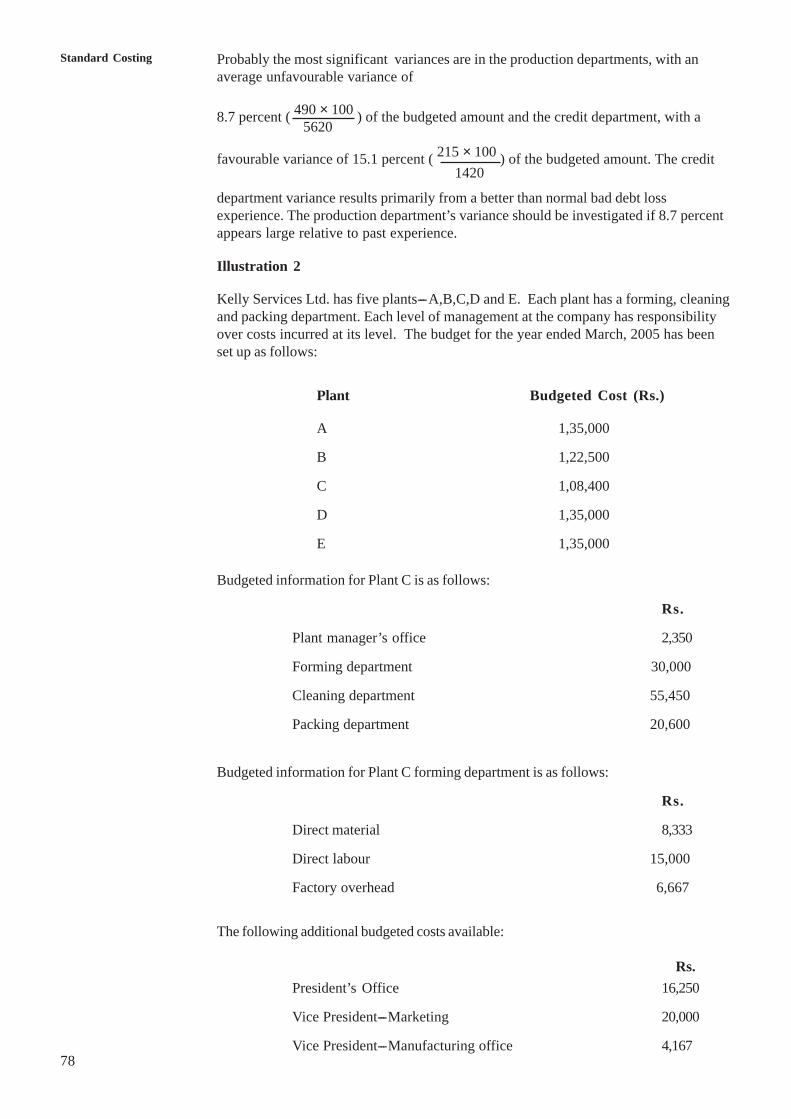
78
Standard Costing Probably the most significant variances are in the production departments, with anaverage unfavourable variance of
8.7 percent ( 490 × 100 ) of the budgeted amount and the credit department, with a
5620
Illustration 2
Kelly Services Ltd. has five plants---A,B,C,D and E. Each plant has a forming, cleaningand packing department. Each level of management at the company has responsibilityover costs incurred at its level. The budget for the year ended March, 2005 has beenset up as follows:
Plant Budgeted Cost (Rs.)
A 1,35,000
B 1,22,500
C 1,08,400
D 1,35,000
E 1,35,000
Budgeted information for Plant C is as follows:
Rs.
Plant manager’s office 2,350
Forming department 30,000
Cleaning department 55,450
Packing department 20,600
Budgeted information for Plant C forming department is as follows:
Rs.
Direct material 8,333
Direct labour 15,000
Factory overhead 6,667
The following additional budgeted costs available:
Rs.President’s Office 16,250
Vice President---Marketing 20,000
Vice President---Manufacturing office 4,167
favourable variance of 15.1 percent ( 215 × 100 ) of the budgeted amount. The credit
1420
department variance results primarily from a better than normal bad debt lossexperience. The production department’s variance should be investigated if 8.7 percentappears large relative to past experience.
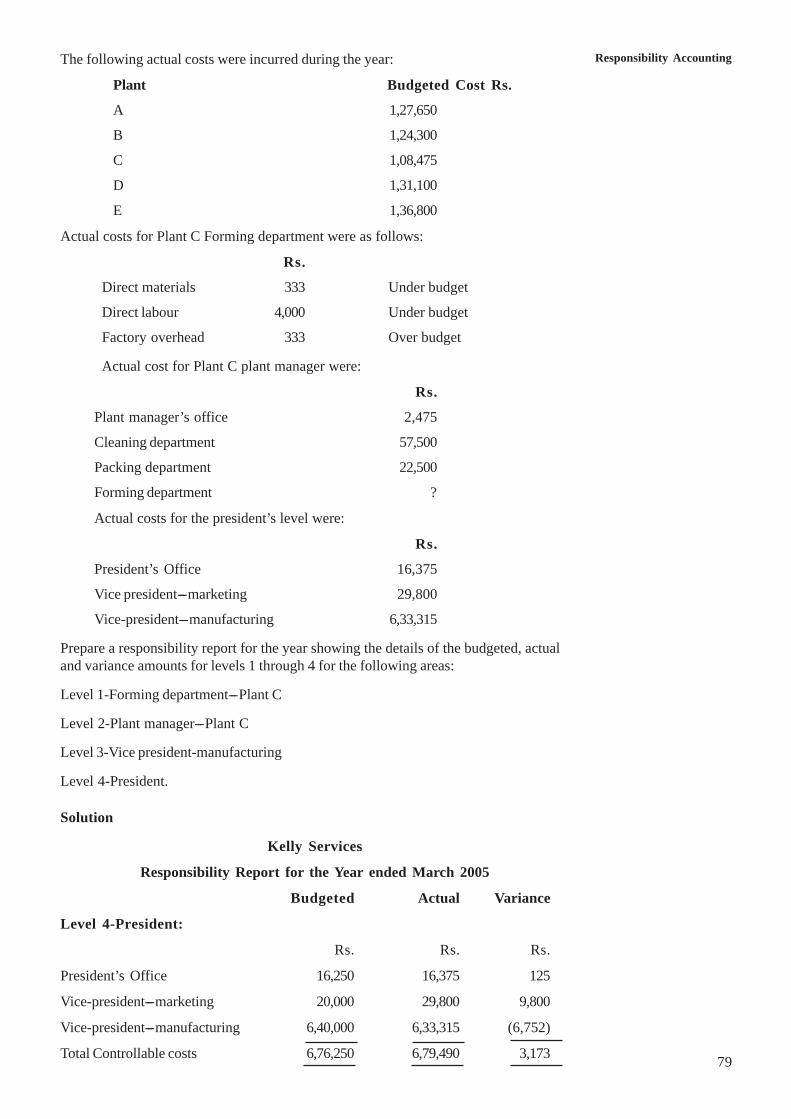
79
Responsibility AccountingThe following actual costs were incurred during the year:
Plant Budgeted Cost Rs.
A 1,27,650
B 1,24,300
C 1,08,475
D 1,31,100
E 1,36,800
Actual costs for Plant C Forming department were as follows:
Rs.
Direct materials 333 Under budget
Direct labour 4,000 Under budget
Factory overhead 333 Over budget
Actual cost for Plant C plant manager were:
Rs.
Plant manager’s office 2,475
Cleaning department 57,500
Packing department 22,500
Forming department ?
Actual costs for the president’s level were:
Rs.
President’s Office 16,375
Vice president---marketing 29,800
Vice-president---manufacturing 6,33,315
Prepare a responsibility report for the year showing the details of the budgeted, actualand variance amounts for levels 1 through 4 for the following areas:
Level 1-Forming department---Plant C
Level 2-Plant manager---Plant C
Level 3-Vice president-manufacturing
Level 4-President.
Solution
Kelly Services
Responsibility Report for the Year ended March 2005
Budgeted Actual Variance
Level 4-President:
Rs. Rs. Rs.
President’s Office 16,250 16,375 125
Vice-president---marketing 20,000 29,800 9,800
Vice-president---manufacturing 6,40,000 6,33,315 (6,752)
Total Controllable costs 6,76,250 6,79,490 3,173
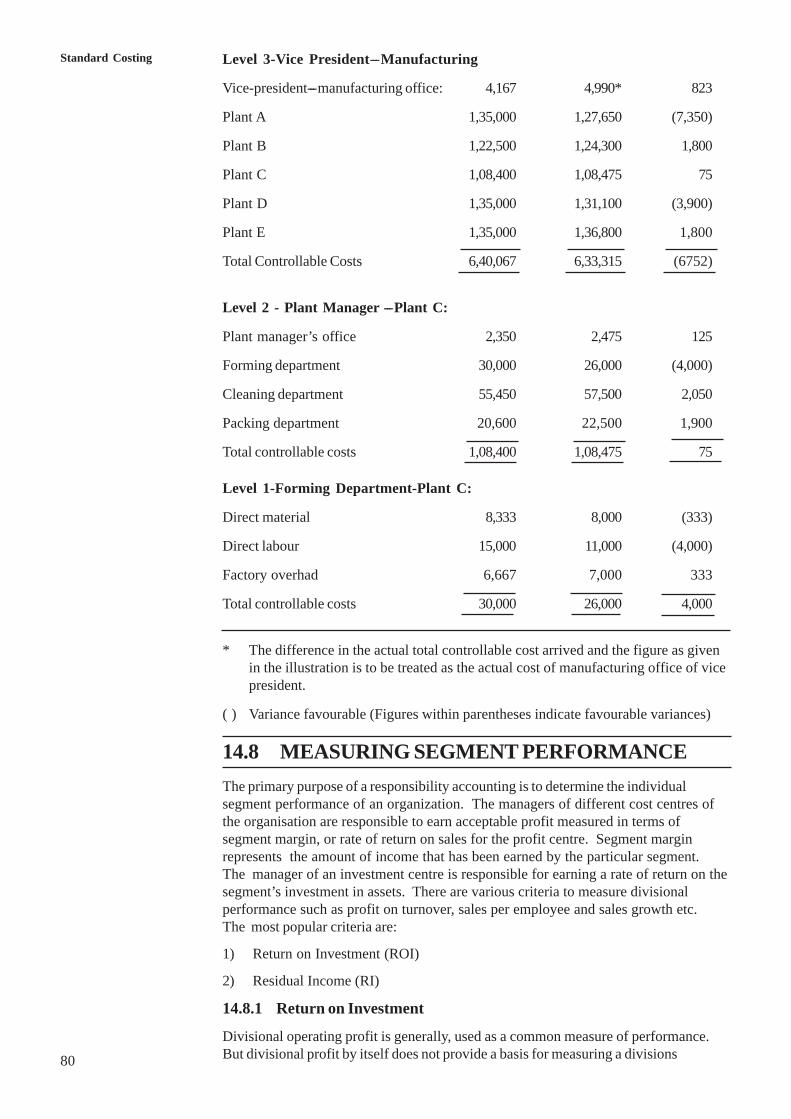
80
Standard Costing Level 3-Vice President---Manufacturing
Vice-president---manufacturing office: 4,167 4,990* 823
Plant A 1,35,000 1,27,650 (7,350)
Plant B 1,22,500 1,24,300 1,800
Plant C 1,08,400 1,08,475 75
Plant D 1,35,000 1,31,100 (3,900)
Plant E 1,35,000 1,36,800 1,800
Total Controllable Costs 6,40,067 6,33,315 (6752)
Level 2 - Plant Manager ---Plant C:
Plant manager’s office 2,350 2,475 125
Forming department 30,000 26,000 (4,000)
Cleaning department 55,450 57,500 2,050
Packing department 20,600 22,500 1,900
Total controllable costs 1,08,400 1,08,475 75
Level 1-Forming Department-Plant C:
Direct material 8,333 8,000 (333)
Direct labour 15,000 11,000 (4,000)
Factory overhad 6,667 7,000 333
Total controllable costs 30,000 26,000 4,000
* The difference in the actual total controllable cost arrived and the figure as givenin the illustration is to be treated as the actual cost of manufacturing office of vicepresident.
( ) Variance favourable (Figures within parentheses indicate favourable variances)
14.8 MEASURING SEGMENT PERFORMANCEThe primary purpose of a responsibility accounting is to determine the individualsegment performance of an organization. The managers of different cost centres ofthe organisation are responsible to earn acceptable profit measured in terms ofsegment margin, or rate of return on sales for the profit centre. Segment marginrepresents the amount of income that has been earned by the particular segment.The manager of an investment centre is responsible for earning a rate of return on thesegment’s investment in assets. There are various criteria to measure divisionalperformance such as profit on turnover, sales per employee and sales growth etc.The most popular criteria are:
1) Return on Investment (ROI)
2) Residual Income (RI)
14.8.1 Return on Investment
Divisional operating profit is generally, used as a common measure of performance.But divisional profit by itself does not provide a basis for measuring a divisions
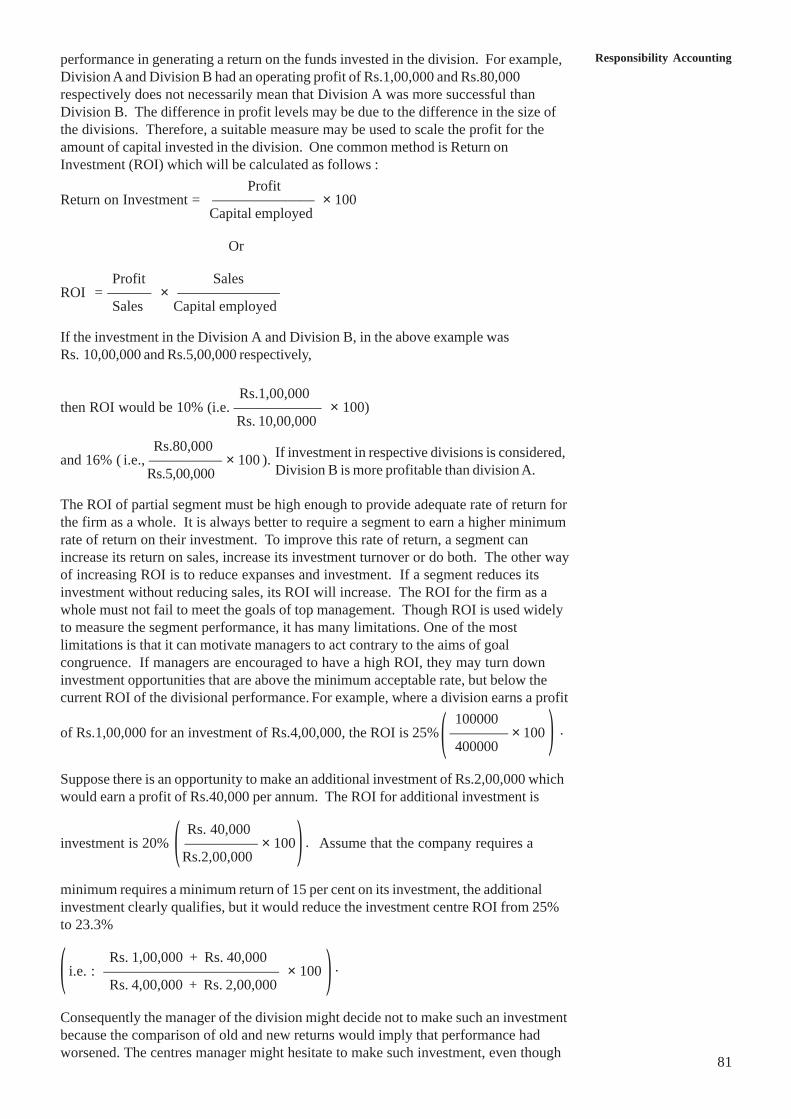
81
Responsibility Accountingperformance in generating a return on the funds invested in the division. For example,Division A and Division B had an operating profit of Rs.1,00,000 and Rs.80,000respectively does not necessarily mean that Division A was more successful thanDivision B. The difference in profit levels may be due to the difference in the size ofthe divisions. Therefore, a suitable measure may be used to scale the profit for theamount of capital invested in the division. One common method is Return onInvestment (ROI) which will be calculated as follows :
ProfitReturn on Investment = ——————— × 100
Capital employed
Or
Profit SalesROI = ——— × ———————
Sales Capital employed
If the investment in the Division A and Division B, in the above example wasRs. 10,00,000 and Rs.5,00,000 respectively,
Rs.1,00,000then ROI would be 10% (i.e. —————— × 100)
Rs. 10,00,000
Rs.80,000and 16% ( i.e., ————— × 100 ). If investment in respective divisions is considered,
Rs.5,00,000 Division B is more profitable than division A.
The ROI of partial segment must be high enough to provide adequate rate of return forthe firm as a whole. It is always better to require a segment to earn a higher minimumrate of return on their investment. To improve this rate of return, a segment canincrease its return on sales, increase its investment turnover or do both. The other wayof increasing ROI is to reduce expanses and investment. If a segment reduces itsinvestment without reducing sales, its ROI will increase. The ROI for the firm as awhole must not fail to meet the goals of top management. Though ROI is used widelyto measure the segment performance, it has many limitations. One of the mostlimitations is that it can motivate managers to act contrary to the aims of goalcongruence. If managers are encouraged to have a high ROI, they may turn downinvestment opportunities that are above the minimum acceptable rate, but below thecurrent ROI of the divisional performance. For example, where a division earns a profit
100000of Rs.1,00,000 for an investment of Rs.4,00,000, the ROI is 25% ———— × 100
400000
Suppose there is an opportunity to make an additional investment of Rs.2,00,000 whichwould earn a profit of Rs.40,000 per annum. The ROI for additional investment is
Rs. 40,000investment is 20% ————— × 100 Assume that the company requires a
Rs.2,00,000
minimum requires a minimum return of 15 per cent on its investment, the additionalinvestment clearly qualifies, but it would reduce the investment centre ROI from 25%to 23.3%
Rs. 1,00,000 + Rs. 40,000 i.e. : ———————————— × 100
Rs. 4,00,000 + Rs. 2,00,000
Consequently the manager of the division might decide not to make such an investmentbecause the comparison of old and new returns would imply that performance hadworsened. The centres manager might hesitate to make such investment, even though
( )
)(
)( .
.
.
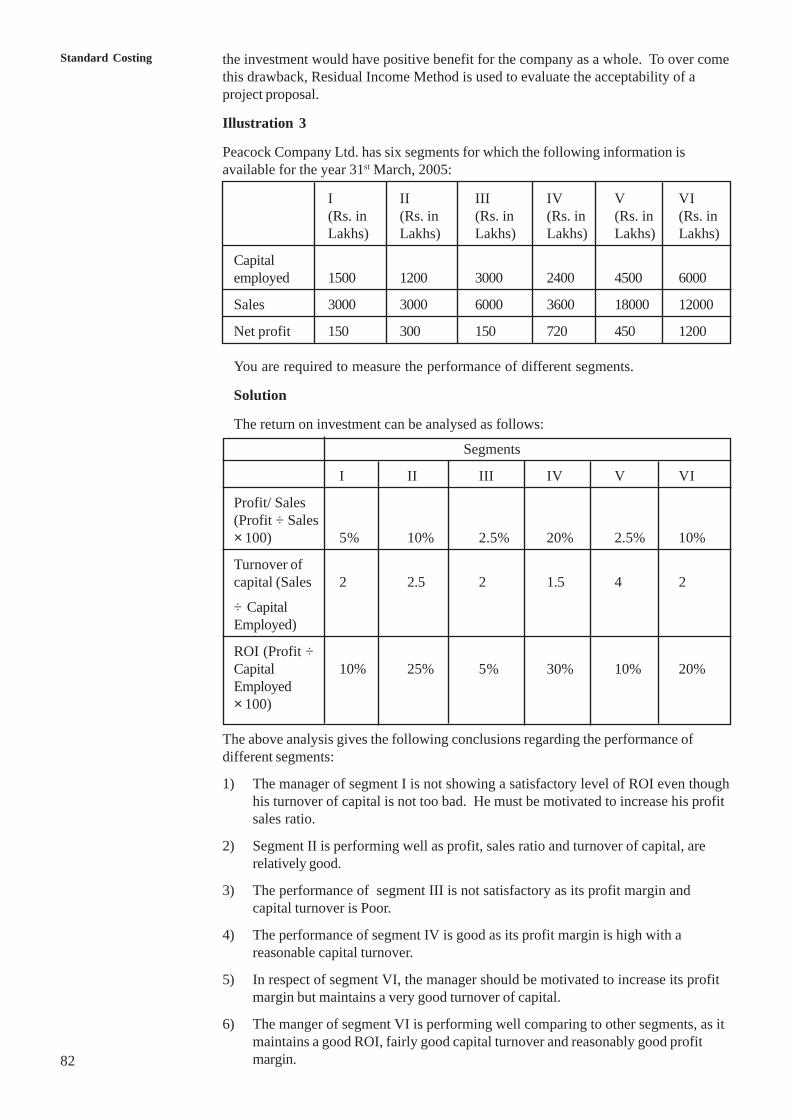
82
Standard Costing the investment would have positive benefit for the company as a whole. To over comethis drawback, Residual Income Method is used to evaluate the acceptability of aproject proposal.
Illustration 3
Peacock Company Ltd. has six segments for which the following information isavailable for the year 31st March, 2005:
I II III IV V VI(Rs. in (Rs. in (Rs. in (Rs. in (Rs. in (Rs. inLakhs) Lakhs) Lakhs) Lakhs) Lakhs) Lakhs)
Capitalemployed 1500 1200 3000 2400 4500 6000
Sales 3000 3000 6000 3600 18000 12000
Net profit 150 300 150 720 450 1200
You are required to measure the performance of different segments.
Solution
The return on investment can be analysed as follows:
Segments
I II III IV V VI
Profit/ Sales(Profit ÷ Sales× 100) 5% 10% 2.5% 20% 2.5% 10%
Turnover ofcapital (Sales 2 2.5 2 1.5 4 2
÷ CapitalEmployed)
ROI (Profit ÷Capital 10% 25% 5% 30% 10% 20%Employed× 100)
The above analysis gives the following conclusions regarding the performance ofdifferent segments:
1) The manager of segment I is not showing a satisfactory level of ROI even thoughhis turnover of capital is not too bad. He must be motivated to increase his profitsales ratio.
2) Segment II is performing well as profit, sales ratio and turnover of capital, arerelatively good.
3) The performance of segment III is not satisfactory as its profit margin andcapital turnover is Poor.
4) The performance of segment IV is good as its profit margin is high with areasonable capital turnover.
5) In respect of segment VI, the manager should be motivated to increase its profitmargin but maintains a very good turnover of capital.
6) The manger of segment VI is performing well comparing to other segments, as itmaintains a good ROI, fairly good capital turnover and reasonably good profitmargin.
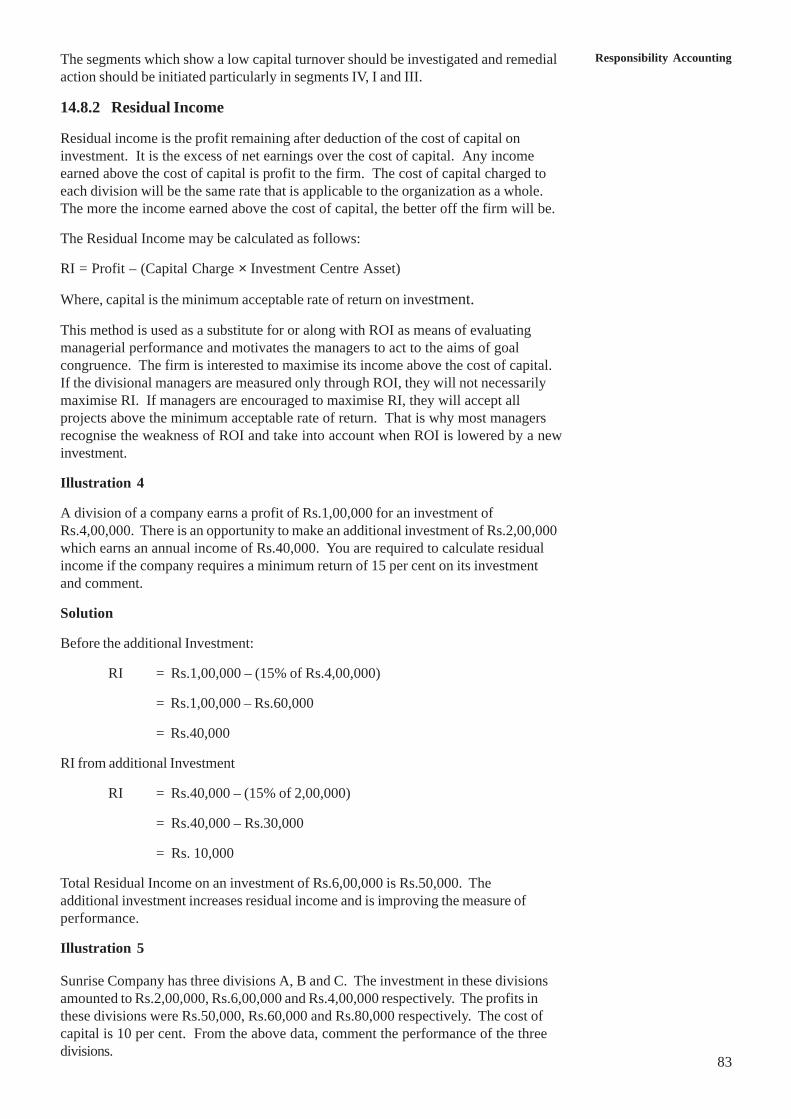
83
Responsibility AccountingThe segments which show a low capital turnover should be investigated and remedialaction should be initiated particularly in segments IV, I and III.
14.8.2 Residual Income
Residual income is the profit remaining after deduction of the cost of capital oninvestment. It is the excess of net earnings over the cost of capital. Any incomeearned above the cost of capital is profit to the firm. The cost of capital charged toeach division will be the same rate that is applicable to the organization as a whole.The more the income earned above the cost of capital, the better off the firm will be.
The Residual Income may be calculated as follows:
RI = Profit – (Capital Charge × Investment Centre Asset)
Where, capital is the minimum acceptable rate of return on investment.
This method is used as a substitute for or along with ROI as means of evaluatingmanagerial performance and motivates the managers to act to the aims of goalcongruence. The firm is interested to maximise its income above the cost of capital.If the divisional managers are measured only through ROI, they will not necessarilymaximise RI. If managers are encouraged to maximise RI, they will accept allprojects above the minimum acceptable rate of return. That is why most managersrecognise the weakness of ROI and take into account when ROI is lowered by a newinvestment.
Illustration 4
A division of a company earns a profit of Rs.1,00,000 for an investment ofRs.4,00,000. There is an opportunity to make an additional investment of Rs.2,00,000which earns an annual income of Rs.40,000. You are required to calculate residualincome if the company requires a minimum return of 15 per cent on its investmentand comment.
Solution
Before the additional Investment:
RI = Rs.1,00,000 – (15% of Rs.4,00,000)
= Rs.1,00,000 – Rs.60,000
= Rs.40,000
RI from additional Investment
RI = Rs.40,000 – (15% of 2,00,000)
= Rs.40,000 – Rs.30,000
= Rs. 10,000
Total Residual Income on an investment of Rs.6,00,000 is Rs.50,000. Theadditional investment increases residual income and is improving the measure ofperformance.
Illustration 5
Sunrise Company has three divisions A, B and C. The investment in these divisionsamounted to Rs.2,00,000, Rs.6,00,000 and Rs.4,00,000 respectively. The profits inthese divisions were Rs.50,000, Rs.60,000 and Rs.80,000 respectively. The cost ofcapital is 10 per cent. From the above data, comment the performance of the threedivisions.
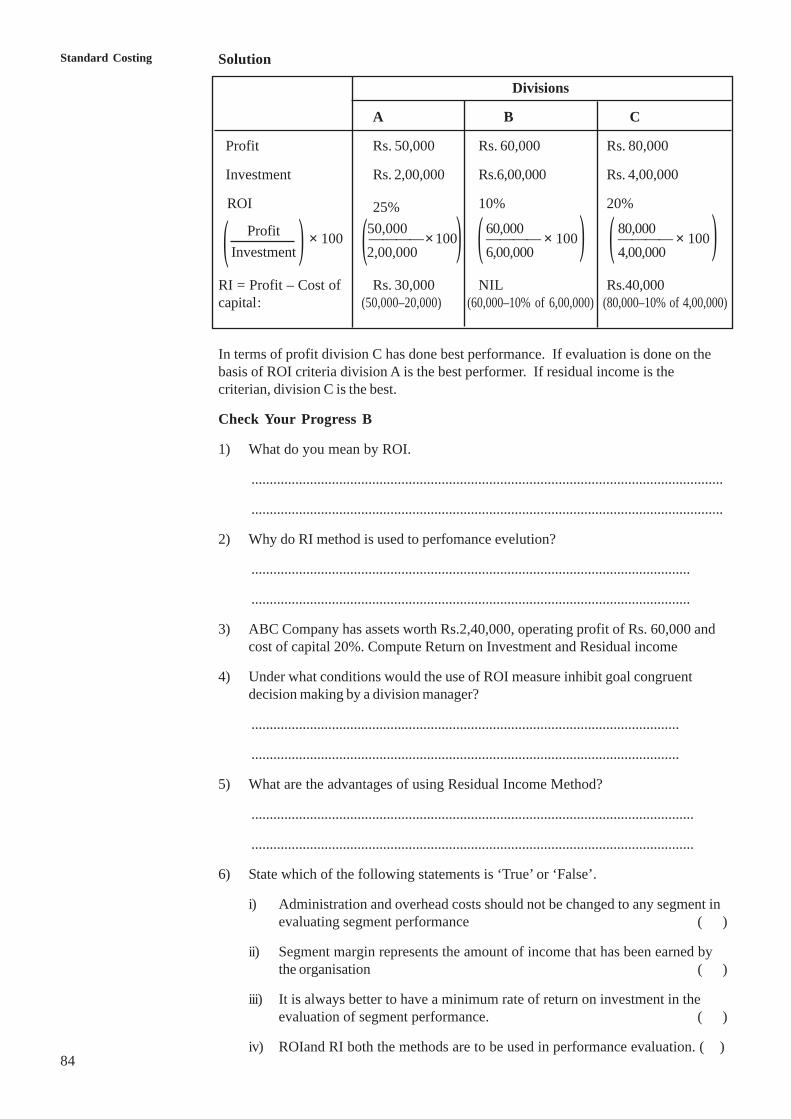
84
Standard Costing Solution
Divisions
A B C
Profit Rs. 50,000 Rs. 60,000 Rs. 80,000
Investment Rs. 2,00,000 Rs.6,00,000 Rs. 4,00,000
ROI 25% 10% 20% 50,000 60,000 80,000
× 100 ————×100 ———— × 100 ———— × 100 2,00,000 6,00,000 4,00,000
RI = Profit – Cost of Rs. 30,000 NIL Rs.40,000capital : (50,000–20,000) (60,000–10% of 6,00,000) (80,000–10% of 4,00,000)
In terms of profit division C has done best performance. If evaluation is done on thebasis of ROI criteria division A is the best performer. If residual income is thecriterian, division C is the best.
Check Your Progress B
1) What do you mean by ROI.
.................................................................................................................................
.................................................................................................................................
2) Why do RI method is used to perfomance evelution?
........................................................................................................................
........................................................................................................................
3) ABC Company has assets worth Rs.2,40,000, operating profit of Rs. 60,000 andcost of capital 20%. Compute Return on Investment and Residual income
4) Under what conditions would the use of ROI measure inhibit goal congruentdecision making by a division manager?
.....................................................................................................................
.....................................................................................................................
5) What are the advantages of using Residual Income Method?
.........................................................................................................................
.........................................................................................................................
6) State which of the following statements is ‘True’ or ‘False’.
i) Administration and overhead costs should not be changed to any segment inevaluating segment performance ( )
ii) Segment margin represents the amount of income that has been earned bythe organisation ( )
iii) It is always better to have a minimum rate of return on investment in theevaluation of segment performance. ( )
iv) ROIand RI both the methods are to be used in performance evaluation. ( )
ProfitInvestment )( )( )( )(
85
Responsibility Accounting14.9 TRANSFER PRICINGLarge businesses are organized into different divisions for effective managementcontrol. When the business is organized into divisions and if one division supplies itsfinished output as input to another division, there arise the question of transfer pricing.Transfer price is the price at which the supplying division prices its transfer of output tothe user division. The price assigned to the interdivisional transfer of output representsa revenue of the selling division and a cost of the buying division. It should be notedthat there is only an internal transfer and not a ‘sale’. Transfer prices are set at thetime of the transfer rather than waiting until the manufacturing process is completedand the goods are sold to someone outside the company. As the pricing of these goodsor services is likely to have an impact on the performance evaluation of divisions,setting an appropriate transfer pricing is a problem. Questions like what should be thetransfer price? Whether it should be equal to manufacturing cost of selling division orthe amount at which the selling division could sell its output externally? Or should thetransfer price be negotiated amount between the selling division’s cost ofmanufacturing and the external market price? etc. whould arise. Selection of transferprice to some extent depends upon the nature of the product, type of the product andpolicy of the organization. Transferer would like to obtain the highest possible pricewhile the transferee would require the lowest possible price. Goal congruence shouldbe taken into account while fixing the transfer price because the actions of one divisionshould not have a detrimental effect on the group as a whole.
14.10 METHODS OF TRANSFER PRICINGThere are different methods for pricing the output of one division to another. Theselection of an appropriate transfer price will have significant impact on decisionmaking, product costing and performance evaluation of different divisions in theorganization.
Generally transfer pricing methods can be classified into two broad categories. Theyare: (1) Market Price Based and (2) Cost -based. There are a number of alternativemethods within each of the above two methods and these are discussed below.
14.10.1 Market Price BasedThis method consist of the following methods:
a) Market Price
b) Adjusted Market Price, and
c) Negotiated Price
a) Market Price: When a market price is available or when there is a comparableproduct on the market and its price is available, this price can be used as a transferprice. Both the selling and buying divisions can sell and buy as much as they can atthis market price. Managers of both the selling and buying divisions are indifferenttrading with each other or with outsiders. From the company’s perspective this is fineas long as the supplying unit is operating at capacity. The market price is useful forfixing transfer price when there is a competitive external market for the transferredproduct. An advantage of this method is that it can be regarded as the opportunity costto a division in so far as there is choice whether or not to purchase from externalmarket. Additionally managers have control over their transfer price so performancemeasurement is facilitated. Another advantage of this method is that it helps to assureprofit independence of the divisions. Any gain of the selling division do not get passedon to the buying division.
b) Adjusted Market Price: This price is based on the above market price, but it isadjusted to allow for the fact that such cost as sales commission and bad debts shouldnot be incurred within the divisions.
86
Standard Costing c) Negotiated Price: This price can occur when there is some basis on which tonegotiate between the divisional managers. The negotiated price, normally, may be amarket price or a cost price. For example, one basis may be the contribution marginon the product being transferred divided between the transferor and the transferee or itmay be the total cost which the transferer could suggest or the market price which thetransferee could suggest. Both the divisions could negotiate between these twofigures. Sometimes the negotiated price may be based on manufacturing cost plus anextra percentage added to approximate market price.
Whatever the basis chosen, the company should be careful in avoiding arbitrary pricebetween the divisions. The arbitrary price may be rewarding to one division andprevailing to another division. Some times negotiated prices are imposed by companytop level, but this could not hamper the autonomy of divisional managers and distortingthe financial performance of any division.
14.10.2 Cost Price Based
Another method to be followed for charging transfer price for the transfer of outputfrom one division to another division is Cost Price. When external markets do not existor when the information about external market prices is not readily available,companies may elect to use some of cost based transfer pricing methods as statedbelow:
a) Absorption Cost
b) Cost Plus Profit Margin
c) Marginal Cost
d) Standard Cost
e) Opportunity Cost
Let us study about these methods in brief.
a) Absorption Cost: Absorption or full cost is based on the total cost incurred inmanufacturing a product. When cost alone is used for transfer pricing, the sellingdivision cannot realise any profit on the goods transferred. This method has adisadvantage that any excess cost on account of inefficiency may be passed on to theother divisions.
b) Cost Plus Profit Margin: Under absorption costing when cost alone is used fortransfer pricing, the selling division cannot make any profit on the goods transferred.This is disincentive to selling division. To overcome this problem, some companies settransfer price on cost plus profit margin. This includes the cost of the item plus a markup or other profit allowance. Under this method, the selling division obtains a profitcontribution on the units transferred. It also benefits the transferring division ifperformance is measured on the basis of divisional operating profits. At the same time,it has also similar drawback of absorption costing that the inefficiencies if any, mayalso creep into the other divisions.
c) Marginal Cost: Another method to be followed for transfer pricing is themarginal cost. All costs that change in response to the change in the level of activityshould be taken into account for the transfer price while transferring output from onedivision to another division. But this method fails to motivate divisional managersbecause it makes no contribution towards fixed overheads and profit.
d) Standard Cost: If actual costs are used as the basis for the transfer, anyvariances or inefficiencies in the selling division are passed along to the buying division.To promote responsibility in the selling division and to isolate variances within divisions,standard costs are usually used as a basis for transfer pricing in cost based systems.Use of standard costs reduces risk to the buyer. The buyer knows that the standardcosts will be transferred and avoids being charged with the seller’s cost overruns.
87
Responsibility Accountinge) Opportunity Cost: It represents the opportunity which has been foregone byfollowing one course of action rather than another. Thus, if goods are transferredinternally the organization could lose a contribution to profit which could have beenobtained from an external sale. Generally, an opportunity cost approach will be used toestablish a range of transfer prices in situations where the market is imperfect.
If the selling division has sufficient sales in the intermediate market such that it wouldhave had to forgo those sales to transfer internally, the transfer price should be equalto differential cost to the selling division plus implicit opportunity cost to company ifgoods are transferred internally. The formulae is:
Transfer Price = Differential cost to the selling division + Implicit opportunity cost tocompany if goods are transferred internally.
Differencial costs are those costs that change in response to alternative course ofaction. In estimating differential cost, the manager concerned unit has to determinewhich costs will be effected by an action and how much they will change. As long asthe transfer price is greater than the opportunity cost of the selling division and lessthan the opportunity cost of the buying division, a transfer will be encouraged. Atransfer is in the best interest of the company if the opportunity cost for the sellingdivision is less than the opportunity cost for the buying division.
Transfer Prices are an important factor in the measurement of divisionalperformance. Whatever the method of transfer pricing is adopted it should be not onlyfair to each division concerned but it should also be in the best interest of thecompany as a whole. Use of bad transfer price may lead to conflict among thedifferent divisions of the organisation and hamper the ultimate objective of theenterprise.
14.11 LET US SUM UPResponsibility cost information is one of the three types of management and costaccounting information. The two others are full cost, and differential costinformation. Responsibility accounting, also called “Responsibility reporting” is asystem of responsibility reporting and control at each managerial level. It is builtaround functional activity for which specific managers are accountable. In designinga system, one has to look into its structure and the process. The four fundamentalprinciples or techniques of responsibility accounting are: (i) Restructuring theorganization in terms of responsibility centres viz. cost revenue, profit or investmentcentres, (ii) Bifurcating costs into controllable and uncontrollable categories, (iii)Flexible budgeting, and (iv) Performance reporting. The first technique gives thestructure; and the other three the process of implementing responsibility accounting.Since the focus is on responsibility centres, it has several uses and gives manybenefits. It is an important aid in the management control process. A responsibilityaccounting system provides information that helps control operations, and evaluate theperformance of subordinates. It facilitates corrective action, management byobjectives, and delegation of authority. It is a morale booster too as rewards arelinked to the accomplishment. The success of the system depends, apart from otherthings, on active cooperation amongst the managers. Further, it is adopted by largedecentralized organizations where departments and divisions could be treated asmanagerial levels of responsibility.
The primary purpose of responsibility accounting is to measure the performance ofindividual divisions. The most popular criteria to be used in measuring the divisionalperformance is Return on Investment and Residual Income.
Transfer price is the price at which the supplying division prices its transfer of output tothe user division. The selection of an appropriate transfer price will have significantimpact on decision making and performance evaluation of different divisions of thecompany. There are different methods at which transfer price can be set. Thesemethods can be classified as Market Price based and Cost based. The market price
88
Standard Costing based consists of (a) market price, (b) adjusted market price, and (c) negotiated pricemethods. Cost based method may again be sub-divided into (a) absorption cost(b) Cost plus profit margin, (c) Marginal Cost, (d) Standard cost and (e) Opportunitycost methods. Whatever the method of transfer price followed, the divisionalmanagers should not forget goal congruence of the organisation because the action ofone division should not have a detrimental effect on the group as a whole.
14.12 KEY WORDSCost Centre: A responsibility level where employees are concerned only with costmanagement.
Controllable Cost: A cost for which the departmental supervisor is able to exertinfluence over the amount spent.
Flexible Budget: A budget prepared using the actual sales volume realized by asegment. It is used for computing the effects of differences between actual salesprices and costs, and budgeted sales prices and costs on the profit goals of thesegment.
Investment Centre: A responsibility level whose manager is concerned not only withcost management but also with revenue generation and investment decisions.
Management by Exception: A management principle by which managersconcentrate their attention on exceptional or unusual items in the performance reports.
Non-controllable Cost: A cost assigned to a department or responsibility centre thatis not incurred or controlled by the department head.
Negotiated Price: Either the market price or cost price which is negotiated betweendivisional managers.
Performance Report: A report produced by each decision centre which disclosesbudgeted and performance measures, and variances from the budget.
Profit Center: A responsibility level in which performance is measured in terms ofbudgeted profits and has responsibility for both income and expenses.
Responsibility Centre (RC): A unit or segment of the organization in which aspecific manager has the authority and responsibility to make decisions.
Transfer Price: The price at which the supplying division prices its transfer of outputto the user division.
14.13 ANSWERS TO CHECK YOU PROGRESSA) 4) i) True ii) False iii) True iv) False v) True
B) 3) ROI : 25% and RI : Rs. 1200
6) i) True, ii) True, iii) False, iv) True
14.14 TERMINAL QUESTIONS1) “Responsibility accounting is a responsibility set-up of management accounting”.
Comment.
2) Define Responsibility Accounting. How does it differ from conventional costaccounting?
3) Is it fair to opine that responsibility accounting is a method of budgeting andperformance reporting created around the structure?
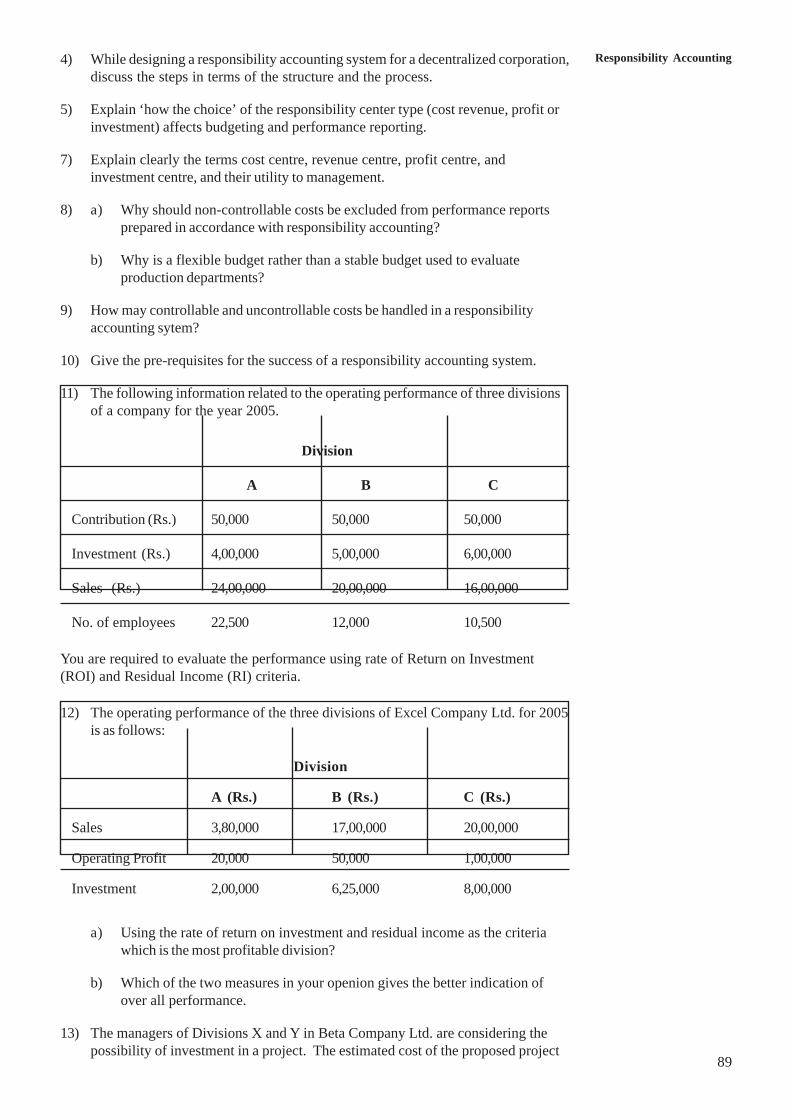
89
Responsibility Accounting4) While designing a responsibility accounting system for a decentralized corporation,discuss the steps in terms of the structure and the process.
5) Explain ‘how the choice’ of the responsibility center type (cost revenue, profit orinvestment) affects budgeting and performance reporting.
7) Explain clearly the terms cost centre, revenue centre, profit centre, andinvestment centre, and their utility to management.
8) a) Why should non-controllable costs be excluded from performance reportsprepared in accordance with responsibility accounting?
b) Why is a flexible budget rather than a stable budget used to evaluateproduction departments?
9) How may controllable and uncontrollable costs be handled in a responsibilityaccounting sytem?
10) Give the pre-requisites for the success of a responsibility accounting system.
11) The following information related to the operating performance of three divisionsof a company for the year 2005.
Division
A B C
Contribution (Rs.) 50,000 50,000 50,000
Investment (Rs.) 4,00,000 5,00,000 6,00,000
Sales (Rs.) 24,00,000 20,00,000 16,00,000
No. of employees 22,500 12,000 10,500
You are required to evaluate the performance using rate of Return on Investment(ROI) and Residual Income (RI) criteria.
12) The operating performance of the three divisions of Excel Company Ltd. for 2005is as follows:
Division
A (Rs.) B (Rs.) C (Rs.)
Sales 3,80,000 17,00,000 20,00,000
Operating Profit 20,000 50,000 1,00,000
Investment 2,00,000 6,25,000 8,00,000
a) Using the rate of return on investment and residual income as the criteriawhich is the most profitable division?
b) Which of the two measures in your openion gives the better indication ofover all performance.
13) The managers of Divisions X and Y in Beta Company Ltd. are considering thepossibility of investment in a project. The estimated cost of the proposed project
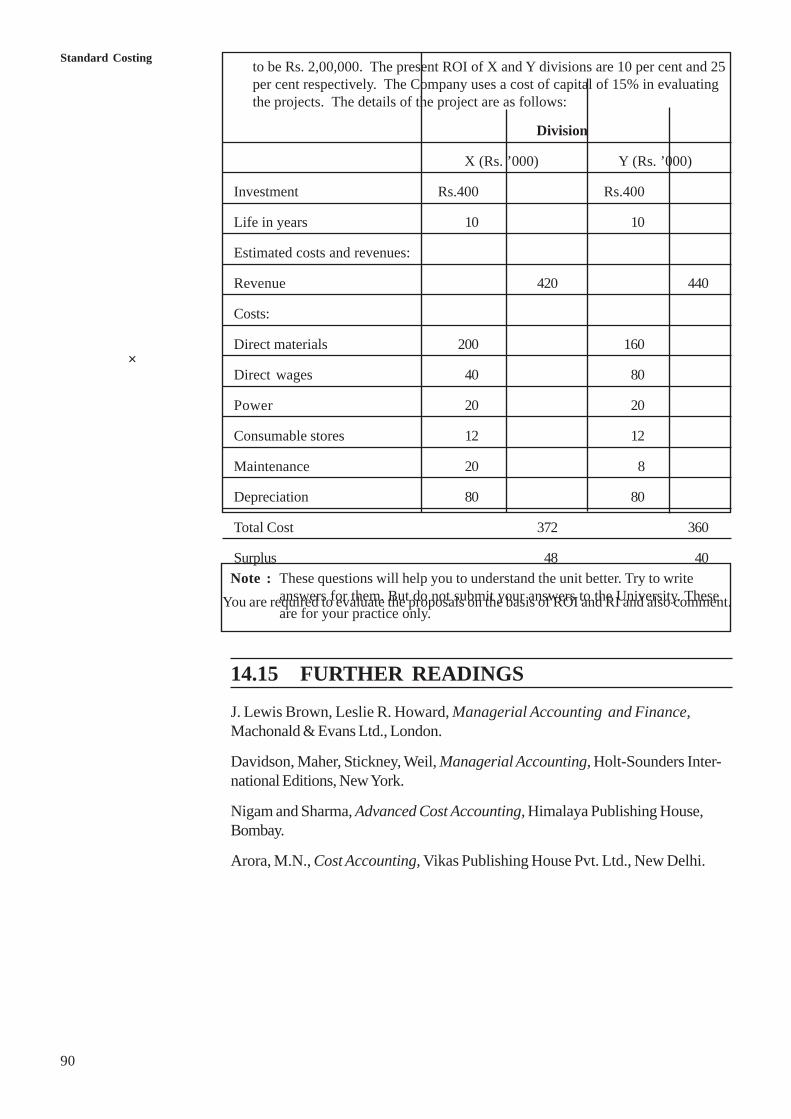
90
Standard Costingto be Rs. 2,00,000. The present ROI of X and Y divisions are 10 per cent and 25per cent respectively. The Company uses a cost of capital of 15% in evaluatingthe projects. The details of the project are as follows:
Division
X (Rs. ’000) Y (Rs. ’000)
Investment Rs.400 Rs.400
Life in years 10 10
Estimated costs and revenues:
Revenue 420 440
Costs:
Direct materials 200 160
Direct wages 40 80
Power 20 20
Consumable stores 12 12
Maintenance 20 8
Depreciation 80 80
Total Cost 372 360
Surplus 48 40
You are required to evaluate the proposals on the basis of ROI and RI and also comment.Note : These questions will help you to understand the unit better. Try to write
answers for them. But do not submit your answers to the University. Theseare for your practice only.
14.15 FURTHER READINGS
J. Lewis Brown, Leslie R. Howard, Managerial Accounting and Finance,Machonald & Evans Ltd., London.
Davidson, Maher, Stickney, Weil, Managerial Accounting, Holt-Sounders Inter-national Editions, New York.
Nigam and Sharma, Advanced Cost Accounting, Himalaya Publishing House,Bombay.
Arora, M.N., Cost Accounting, Vikas Publishing House Pvt. Ltd., New Delhi.
×
UNIT 15 MARGINAL COSTINGStructure15.0 Objectives
15.1 Introduction
15.2 Segregation of Mixed Costs
15.3 Concept of Marginal Cost and Marginal Costing
15.4 Income Statement under Marginal Costing and Absorption Costing
15.5 Marginal Costing Equation and Contribution Margin
15.6 Profit-Volume Ratio
15.7 Managerial Uses of Marginal Costing
15.8 Limitations of Marginal Costing
15.9 Summery
15.10 Key Words
15.11 Answers to Check Your Progress
15.12 Terminal Questions
15.13 Further Readings
15.0 OBJECTIVESThe aims of this unit are:
! to introduce you with the concept of marginal costing;
! to explain the income statement under marginal costing and how it differs fromabsorption costing; and
! to discuss the merits and limitations of marginal costing along with developing amarginal cost equation uses of marginal costing in managerial decisions.
15.1 INTROUDCTIONThe elements of costs can be divided into fixed and variable costs. You have learntthese elements of cost in detail under Unit 2. You have also learnt that there arecertain costs which are a combination of fixed and variable costs. These costs arecalled semi-variable costs. It is necessary to segregate the mixed costs into fixed andvariable costs for managerial decisions. In this unit you will study about differentmethods of segregating mixed costs, the concept of marginal cost and marginal costingand its managerial uses in decision making.
15.2 SEGREGATION OF MIXED COSTSThe elements of cost can be divided into two categories. Fixed and variable costs.Fixed costs are those costs which do not very but remain constant within a givenperiod of time in spite of fluctuations in production Variable costs changes in directproportion to the change in output. There are certain costs, which are a combination offixed, and variable costs. It contains a fixed element as well as a unit cost for variable 1
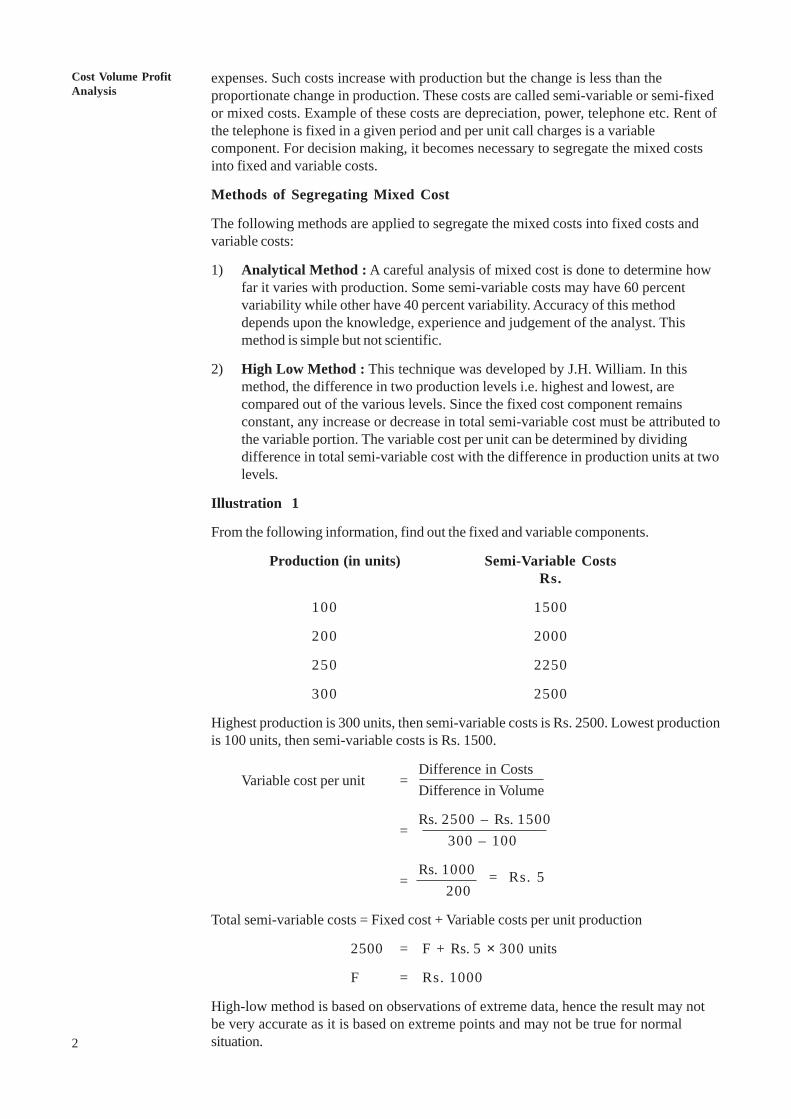
2
An OverviewCost Volume ProfitAnalysis
expenses. Such costs increase with production but the change is less than theproportionate change in production. These costs are called semi-variable or semi-fixedor mixed costs. Example of these costs are depreciation, power, telephone etc. Rent ofthe telephone is fixed in a given period and per unit call charges is a variablecomponent. For decision making, it becomes necessary to segregate the mixed costsinto fixed and variable costs.
Methods of Segregating Mixed Cost
The following methods are applied to segregate the mixed costs into fixed costs andvariable costs:
1) Analytical Method : A careful analysis of mixed cost is done to determine howfar it varies with production. Some semi-variable costs may have 60 percentvariability while other have 40 percent variability. Accuracy of this methoddepends upon the knowledge, experience and judgement of the analyst. Thismethod is simple but not scientific.
2) High Low Method : This technique was developed by J.H. William. In thismethod, the difference in two production levels i.e. highest and lowest, arecompared out of the various levels. Since the fixed cost component remainsconstant, any increase or decrease in total semi-variable cost must be attributed tothe variable portion. The variable cost per unit can be determined by dividingdifference in total semi-variable cost with the difference in production units at twolevels.
Illustration 1
From the following information, find out the fixed and variable components.
Production (in units) Semi-Variable CostsRs.
100 1500
200 2000
250 2250
300 2500
Highest production is 300 units, then semi-variable costs is Rs. 2500. Lowest productionis 100 units, then semi-variable costs is Rs. 1500.
Variable cost per unit =Difference in CostsDifference in Volume
=Rs. 2500 – Rs. 1500 300 – 100
=Rs. 1000 = Rs. 5 200
Total semi-variable costs = Fixed cost + Variable costs per unit production
2500 = F + Rs. 5 × 300 units
F = Rs. 1000
High-low method is based on observations of extreme data, hence the result may notbe very accurate as it is based on extreme points and may not be true for normalsituation.
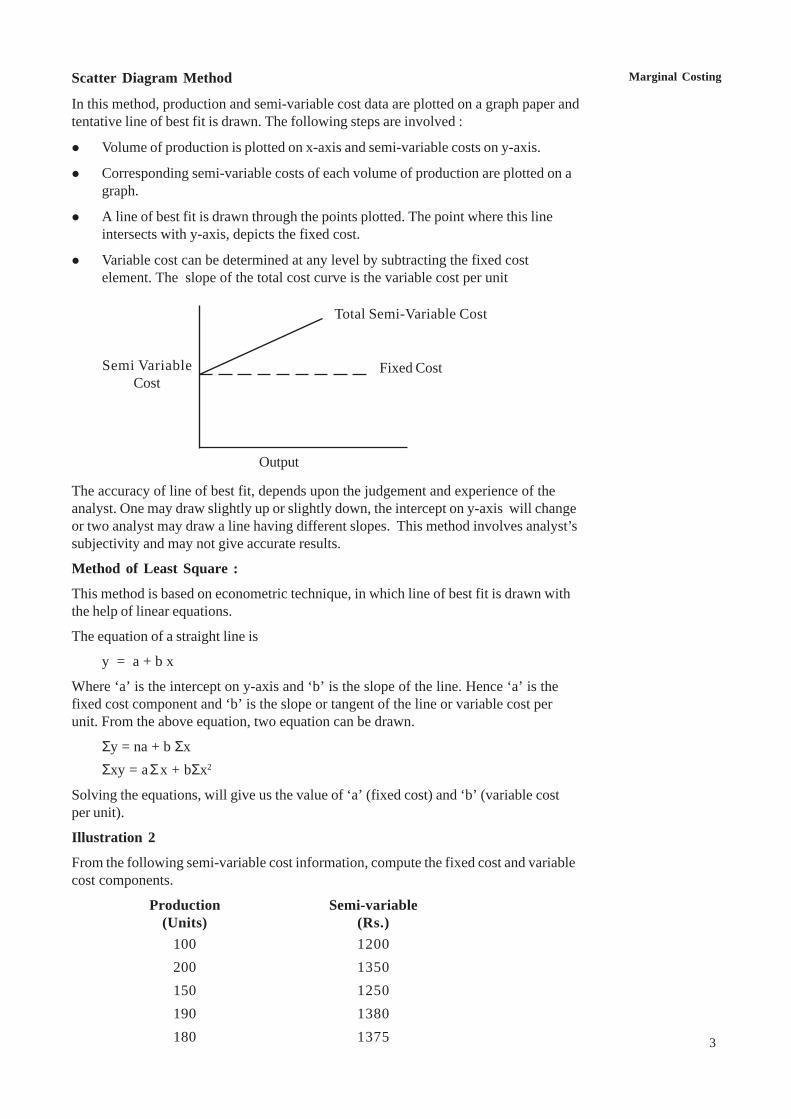
Marginal Costing
3
Scatter Diagram Method
In this method, production and semi-variable cost data are plotted on a graph paper andtentative line of best fit is drawn. The following steps are involved :
! Volume of production is plotted on x-axis and semi-variable costs on y-axis.
! Corresponding semi-variable costs of each volume of production are plotted on agraph.
! A line of best fit is drawn through the points plotted. The point where this lineintersects with y-axis, depicts the fixed cost.
! Variable cost can be determined at any level by subtracting the fixed costelement. The slope of the total cost curve is the variable cost per unit
Total Semi-Variable Cost
Semi VariableCost
Fixed Cost
Output
The accuracy of line of best fit, depends upon the judgement and experience of theanalyst. One may draw slightly up or slightly down, the intercept on y-axis will changeor two analyst may draw a line having different slopes. This method involves analyst’ssubjectivity and may not give accurate results.
Method of Least Square :
This method is based on econometric technique, in which line of best fit is drawn withthe help of linear equations.
The equation of a straight line is
y = a + b x
Where ‘a’ is the intercept on y-axis and ‘b’ is the slope of the line. Hence ‘a’ is thefixed cost component and ‘b’ is the slope or tangent of the line or variable cost perunit. From the above equation, two equation can be drawn.
Σy = na + b ΣxΣxy = aΣx + bΣx2
Solving the equations, will give us the value of ‘a’ (fixed cost) and ‘b’ (variable costper unit).
Illustration 2
From the following semi-variable cost information, compute the fixed cost and variablecost components.
Production Semi-variable(Units) (Rs.)
100 1200200 1350150 1250190 1380180 1375
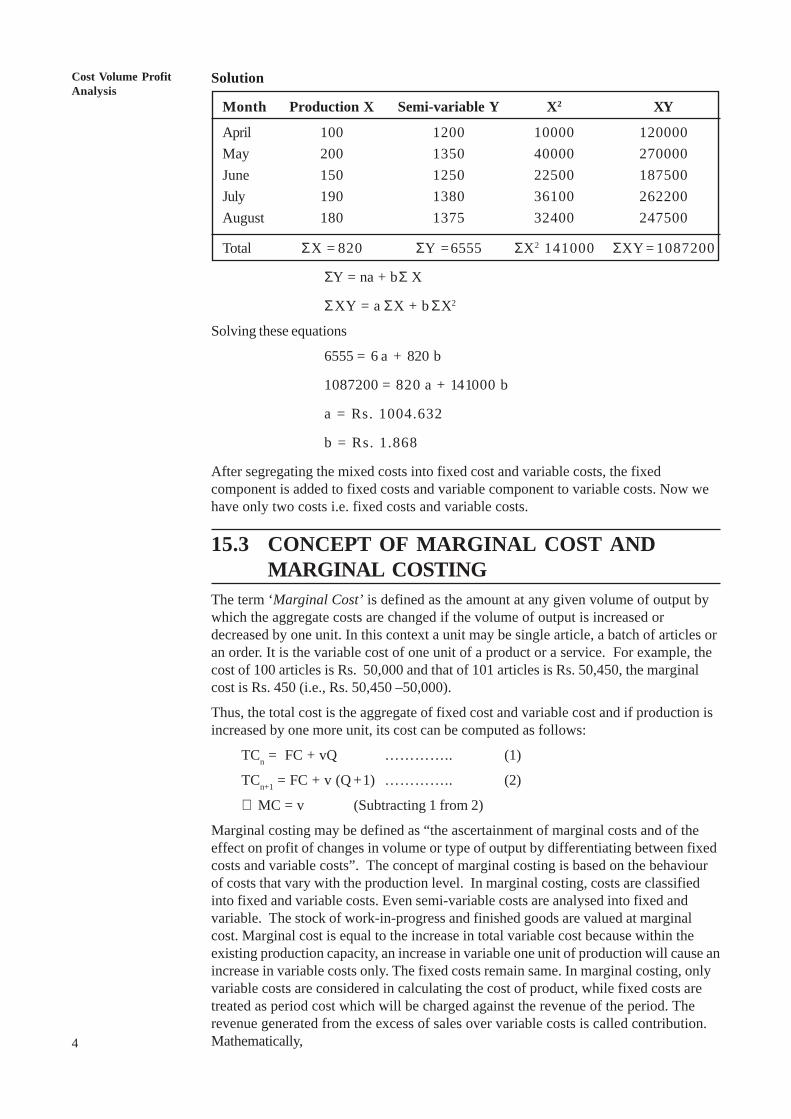
4
An OverviewCost Volume ProfitAnalysis
Solution
Month Production X Semi-variable Y X2 XY
April 100 1200 10000 120000May 200 1350 40000 270000June 150 1250 22500 187500July 190 1380 36100 262200August 180 1375 32400 247500
Total ΣX = 820 ΣY =6555 ΣX2 141000 ΣXY = 1087200
ΣY = na + bΣ X
ΣXY = a ΣX + b ΣX2
Solving these equations
6555 = 6 a + 820 b
1087200 = 820 a + 141000 b
a = Rs. 1004.632
b = Rs. 1.868
After segregating the mixed costs into fixed cost and variable costs, the fixedcomponent is added to fixed costs and variable component to variable costs. Now wehave only two costs i.e. fixed costs and variable costs.
15.3 CONCEPT OF MARGINAL COST ANDMARGINAL COSTING
The term ‘Marginal Cost’ is defined as the amount at any given volume of output bywhich the aggregate costs are changed if the volume of output is increased ordecreased by one unit. In this context a unit may be single article, a batch of articles oran order. It is the variable cost of one unit of a product or a service. For example, thecost of 100 articles is Rs. 50,000 and that of 101 articles is Rs. 50,450, the marginalcost is Rs. 450 (i.e., Rs. 50,450 –50,000).
Thus, the total cost is the aggregate of fixed cost and variable cost and if production isincreased by one more unit, its cost can be computed as follows:
TCn = FC + vQ ………….. (1)
TCn+1 = FC + v (Q +1) ………….. (2)
∴ MC = v (Subtracting 1 from 2)
Marginal costing may be defined as “the ascertainment of marginal costs and of theeffect on profit of changes in volume or type of output by differentiating between fixedcosts and variable costs”. The concept of marginal costing is based on the behaviourof costs that vary with the production level. In marginal costing, costs are classifiedinto fixed and variable costs. Even semi-variable costs are analysed into fixed andvariable. The stock of work-in-progress and finished goods are valued at marginalcost. Marginal cost is equal to the increase in total variable cost because within theexisting production capacity, an increase in variable one unit of production will cause anincrease in variable costs only. The fixed costs remain same. In marginal costing, onlyvariable costs are considered in calculating the cost of product, while fixed costs aretreated as period cost which will be charged against the revenue of the period. Therevenue generated from the excess of sales over variable costs is called contribution.Mathematically,
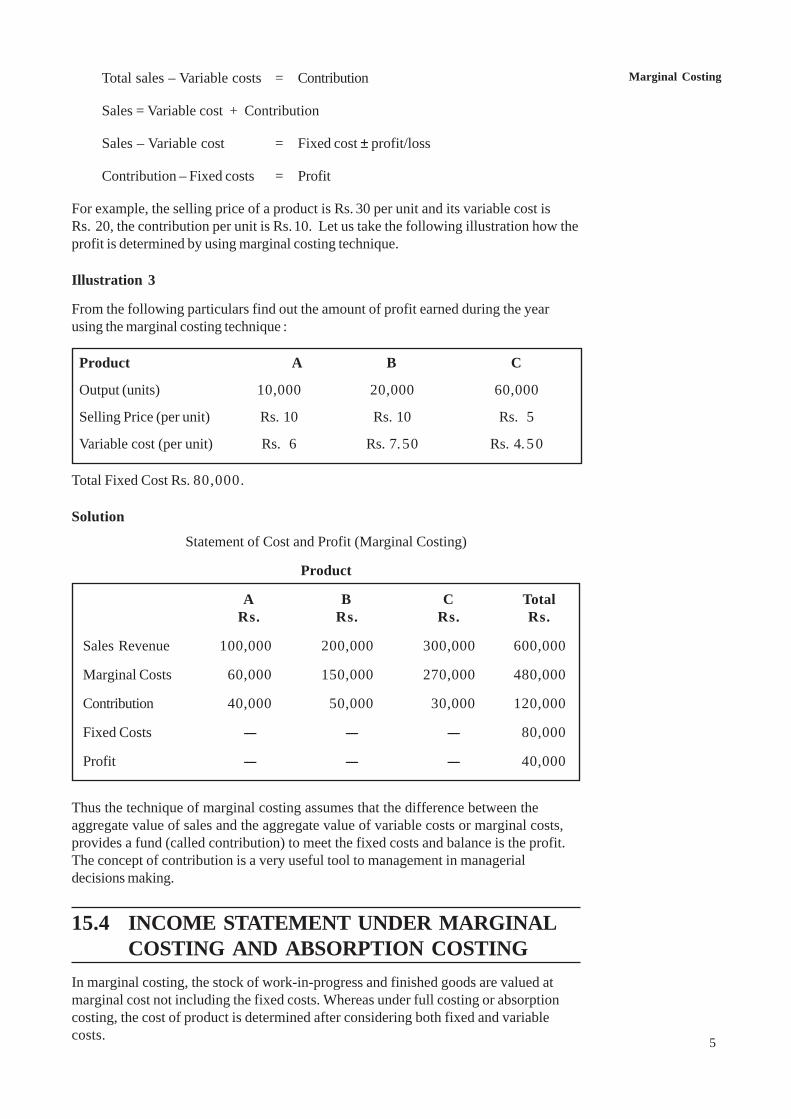
Marginal Costing
5
Total sales – Variable costs = Contribution
Sales = Variable cost + Contribution
Sales – Variable cost = Fixed cost ± profit/loss
Contribution – Fixed costs = Profit
For example, the selling price of a product is Rs. 30 per unit and its variable cost isRs. 20, the contribution per unit is Rs.10. Let us take the following illustration how theprofit is determined by using marginal costing technique.
Illustration 3
From the following particulars find out the amount of profit earned during the yearusing the marginal costing technique :
Product A B C
Output (units) 10,000 20,000 60,000
Selling Price (per unit) Rs. 10 Rs. 10 Rs. 5
Variable cost (per unit) Rs. 6 Rs. 7.50 Rs. 4.5 0
Total Fixed Cost Rs. 80,000.
Solution
Statement of Cost and Profit (Marginal Costing)
Product
A B C TotalRs. Rs. Rs. Rs.
Sales Revenue 100,000 200,000 300,000 600,000
Marginal Costs 60,000 150,000 270,000 480,000
Contribution 40,000 50,000 30,000 120,000
Fixed Costs ---- ---- ---- 80,000
Profit ---- ---- ---- 40,000
Thus the technique of marginal costing assumes that the difference between theaggregate value of sales and the aggregate value of variable costs or marginal costs,provides a fund (called contribution) to meet the fixed costs and balance is the profit.The concept of contribution is a very useful tool to management in managerialdecisions making.
15.4 INCOME STATEMENT UNDER MARGINALCOSTING AND ABSORPTION COSTING
In marginal costing, the stock of work-in-progress and finished goods are valued atmarginal cost not including the fixed costs. Whereas under full costing or absorptioncosting, the cost of product is determined after considering both fixed and variablecosts.
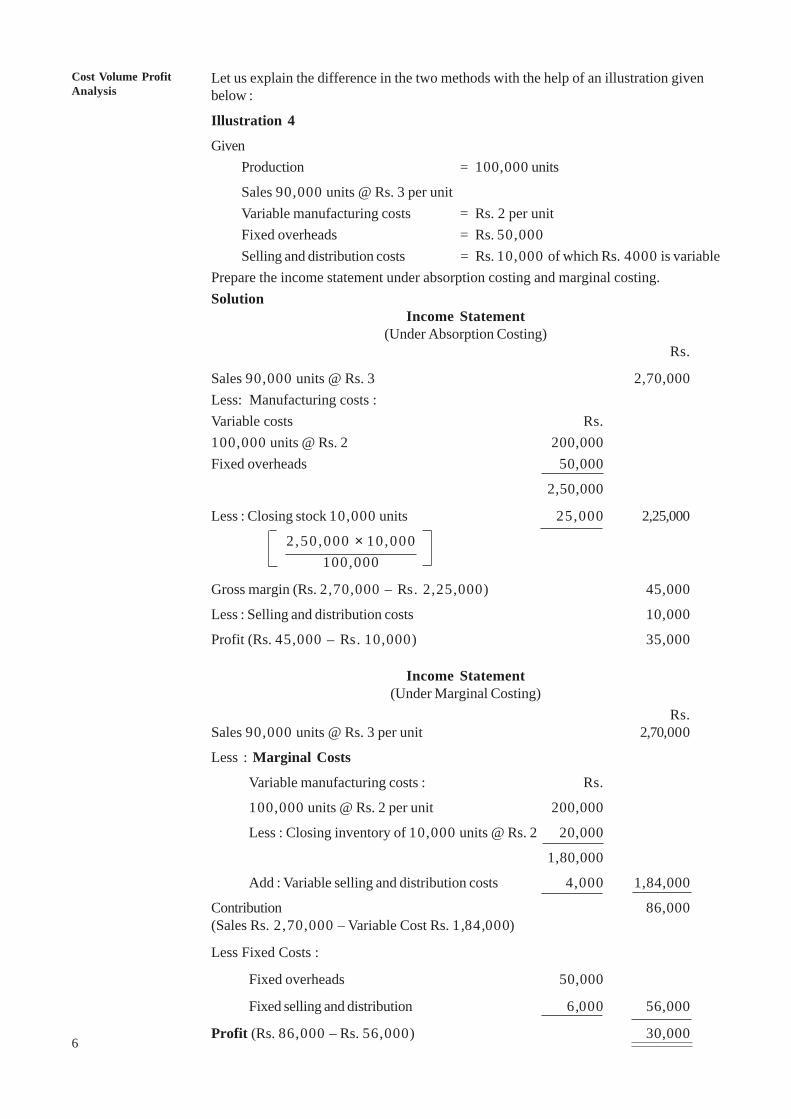
6
An OverviewCost Volume ProfitAnalysis
Let us explain the difference in the two methods with the help of an illustration givenbelow :
Illustration 4
GivenProduction = 100,000 units
Sales 90,000 units @ Rs. 3 per unitVariable manufacturing costs = Rs. 2 per unitFixed overheads = Rs. 50,000Selling and distribution costs = Rs. 10,000 of which Rs. 4000 is variable
Prepare the income statement under absorption costing and marginal costing.Solution
Income Statement(Under Absorption Costing)
Rs.
Sales 90,000 units @ Rs. 3 2,70,000Less: Manufacturing costs :Variable costs Rs.100,000 units @ Rs. 2 200,000Fixed overheads 50,000
2,50,000
Less : Closing stock 10,000 units 25,000 2,25,000
2,50 ,000 × 10 ,000100,000
Gross margin (Rs. 2,70,000 – Rs. 2,25,000) 45,000
Less : Selling and distribution costs 10,000
Profit (Rs. 45,000 – Rs. 10,000) 35,000
Income Statement(Under Marginal Costing)
Rs.Sales 90,000 units @ Rs. 3 per unit 2,70,000
Less : Marginal Costs
Variable manufacturing costs : Rs.
100,000 units @ Rs. 2 per unit 200,000
Less : Closing inventory of 10,000 units @ Rs. 2 20,000
1,80,000
Add : Variable selling and distribution costs 4,000 1,84,000
Contribution 86,000(Sales Rs. 2,70,000 – Variable Cost Rs. 1,84,000)
Less Fixed Costs :
Fixed overheads 50,000
Fixed selling and distribution 6,000 56,000
Profit (Rs. 86,000 – Rs. 56,000) 30,000
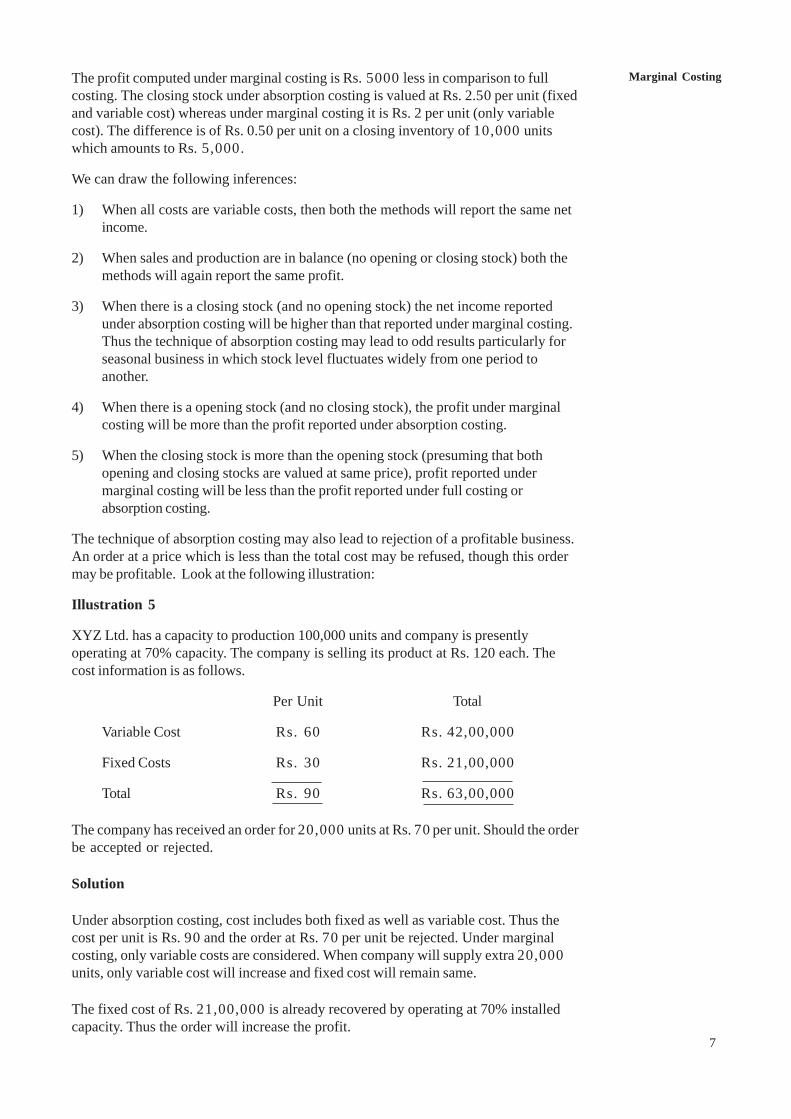
Marginal Costing
7
The profit computed under marginal costing is Rs. 5000 less in comparison to fullcosting. The closing stock under absorption costing is valued at Rs. 2.50 per unit (fixedand variable cost) whereas under marginal costing it is Rs. 2 per unit (only variablecost). The difference is of Rs. 0.50 per unit on a closing inventory of 10,000 unitswhich amounts to Rs. 5,000.
We can draw the following inferences:
1) When all costs are variable costs, then both the methods will report the same netincome.
2) When sales and production are in balance (no opening or closing stock) both themethods will again report the same profit.
3) When there is a closing stock (and no opening stock) the net income reportedunder absorption costing will be higher than that reported under marginal costing.Thus the technique of absorption costing may lead to odd results particularly forseasonal business in which stock level fluctuates widely from one period toanother.
4) When there is a opening stock (and no closing stock), the profit under marginalcosting will be more than the profit reported under absorption costing.
5) When the closing stock is more than the opening stock (presuming that bothopening and closing stocks are valued at same price), profit reported undermarginal costing will be less than the profit reported under full costing orabsorption costing.
The technique of absorption costing may also lead to rejection of a profitable business.An order at a price which is less than the total cost may be refused, though this ordermay be profitable. Look at the following illustration:
Illustration 5
XYZ Ltd. has a capacity to production 100,000 units and company is presentlyoperating at 70% capacity. The company is selling its product at Rs. 120 each. Thecost information is as follows.
Per Unit Total
Variable Cost Rs. 60 Rs. 42,00,000
Fixed Costs Rs. 30 Rs. 21,00,000
Total Rs. 90 Rs. 63,00,000
The company has received an order for 20,000 units at Rs. 70 per unit. Should the orderbe accepted or rejected.
Solution
Under absorption costing, cost includes both fixed as well as variable cost. Thus thecost per unit is Rs. 90 and the order at Rs. 70 per unit be rejected. Under marginalcosting, only variable costs are considered. When company will supply extra 20,000units, only variable cost will increase and fixed cost will remain same.
The fixed cost of Rs. 21,00,000 is already recovered by operating at 70% installedcapacity. Thus the order will increase the profit.
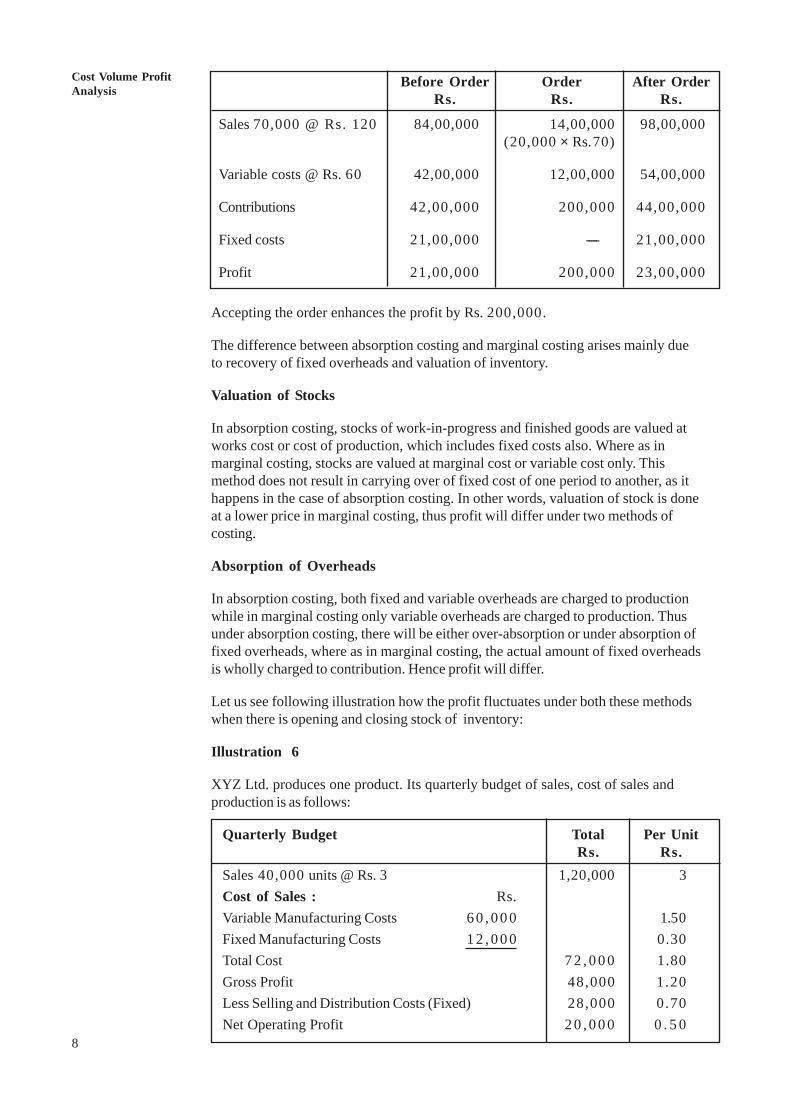
8
An OverviewCost Volume ProfitAnalysis
Before Order Order After OrderRs. Rs. Rs.
Sales 70,000 @ Rs. 120 84,00,000 14,00,000 98,00,000(20,000 × Rs. 70)
Variable costs @ Rs. 60 42,00,000 12,00,000 54,00,000
Contributions 42,00,000 200,000 44,00,000
Fixed costs 21,00,000 ----- 21,00,000
Profit 21,00,000 200,000 23,00,000
Accepting the order enhances the profit by Rs. 200,000.
The difference between absorption costing and marginal costing arises mainly dueto recovery of fixed overheads and valuation of inventory.
Valuation of Stocks
In absorption costing, stocks of work-in-progress and finished goods are valued atworks cost or cost of production, which includes fixed costs also. Where as inmarginal costing, stocks are valued at marginal cost or variable cost only. Thismethod does not result in carrying over of fixed cost of one period to another, as ithappens in the case of absorption costing. In other words, valuation of stock is doneat a lower price in marginal costing, thus profit will differ under two methods ofcosting.
Absorption of Overheads
In absorption costing, both fixed and variable overheads are charged to productionwhile in marginal costing only variable overheads are charged to production. Thusunder absorption costing, there will be either over-absorption or under absorption offixed overheads, where as in marginal costing, the actual amount of fixed overheadsis wholly charged to contribution. Hence profit will differ.
Let us see following illustration how the profit fluctuates under both these methodswhen there is opening and closing stock of inventory:
Illustration 6
XYZ Ltd. produces one product. Its quarterly budget of sales, cost of sales andproduction is as follows:
Quarterly Budget Total Per UnitRs. Rs.
Sales 40,000 units @ Rs. 3 1,20,000 3Cost of Sales : Rs.Variable Manufacturing Costs 6 0 , 0 0 0 1.50Fixed Manufacturing Costs 1 2 , 0 0 0 0.30Total Cost 7 2 , 0 0 0 1.80Gross Profit 48,000 1.20Less Selling and Distribution Costs (Fixed) 28,000 0.70Net Operating Profit 2 0 , 0 0 0 0 . 5 0
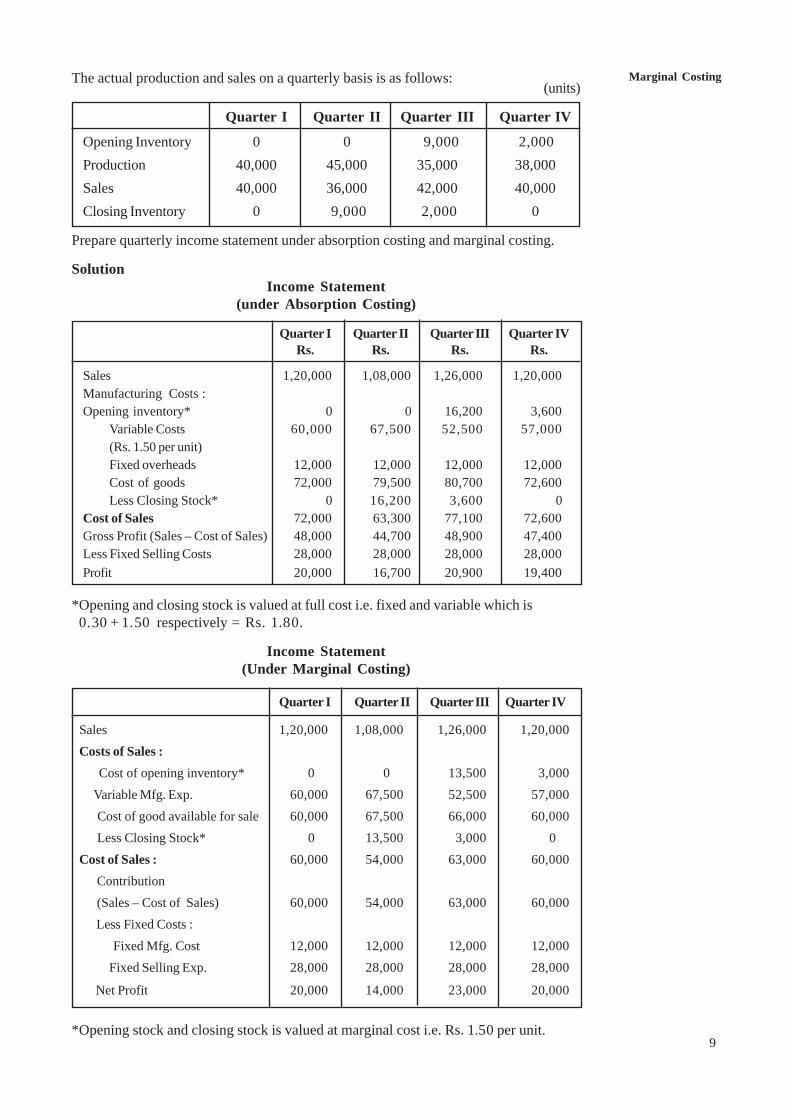
Marginal Costing
9
The actual production and sales on a quarterly basis is as follows:(units)
Quarter I Quarter II Quarter III Quarter IV
Opening Inventory 0 0 9,000 2,000Production 40,000 45,000 35,000 38,000Sales 40,000 36,000 42,000 40,000Closing Inventory 0 9,000 2,000 0
Prepare quarterly income statement under absorption costing and marginal costing.
SolutionIncome Statement
(under Absorption Costing)
Quarter I Quarter II Quarter III Quarter IVRs. Rs. Rs. Rs.
Sales 1,20,000 1,08,000 1,26,000 1,20,000Manufacturing Costs :Opening inventory* 0 0 16,200 3,600
Variable Costs 60,000 67,500 52,500 57,000(Rs. 1.50 per unit)Fixed overheads 12,000 12,000 12,000 12,000Cost of goods 72,000 79,500 80,700 72,600Less Closing Stock* 0 16,200 3,600 0
Cost of Sales 72,000 63,300 77,100 72,600Gross Profit (Sales – Cost of Sales) 48,000 44,700 48,900 47,400Less Fixed Selling Costs 28,000 28,000 28,000 28,000Profit 20,000 16,700 20,900 19,400
*Opening and closing stock is valued at full cost i.e. fixed and variable which is0.30 + 1.50 respectively = Rs. 1.80.
Income Statement(Under Marginal Costing)
Quarter I Quarter II Quarter III Quarter IV
Sales 1,20,000 1,08,000 1,26,000 1,20,000Costs of Sales : Cost of opening inventory* 0 0 13,500 3,000 Variable Mfg. Exp. 60,000 67,500 52,500 57,000 Cost of good available for sale 60,000 67,500 66,000 60,000 Less Closing Stock* 0 13,500 3,000 0Cost of Sales : 60,000 54,000 63,000 60,000 Contribution (Sales – Cost of Sales) 60,000 54,000 63,000 60,000 Less Fixed Costs : Fixed Mfg. Cost 12,000 12,000 12,000 12,000 Fixed Selling Exp. 28,000 28,000 28,000 28,000
Net Profit 20,000 14,000 23,000 20,000
*Opening stock and closing stock is valued at marginal cost i.e. Rs. 1.50 per unit.
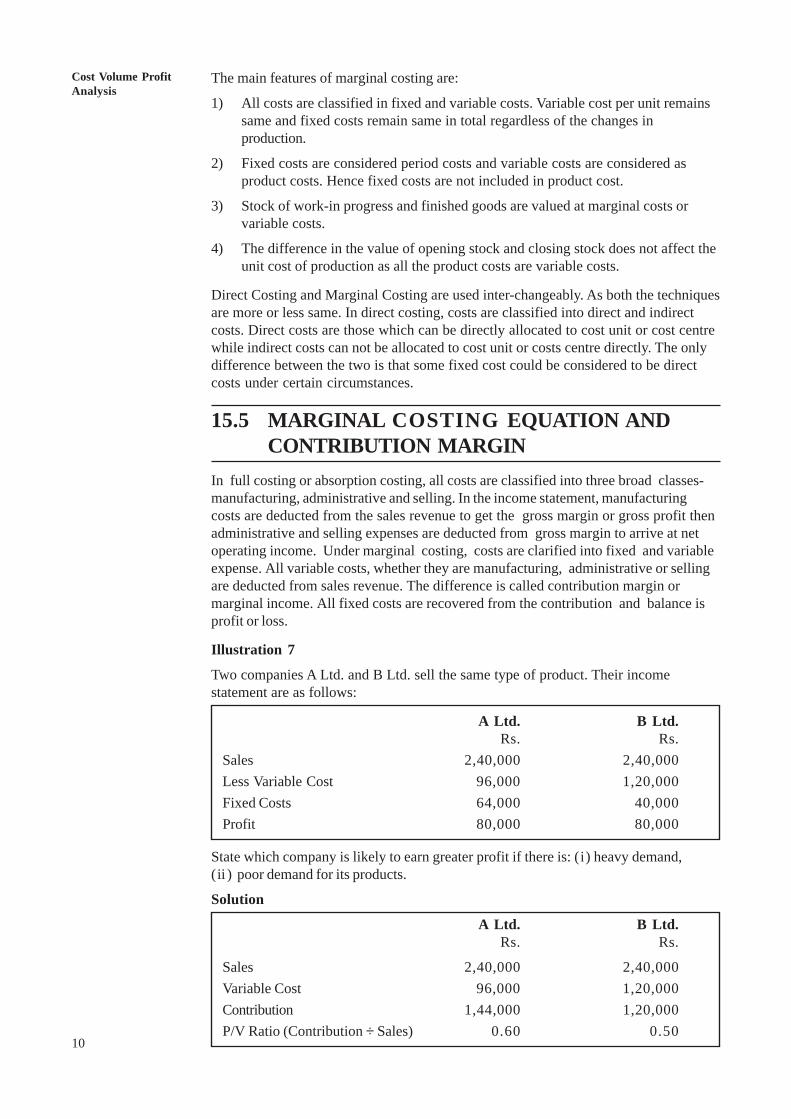
10
An OverviewCost Volume ProfitAnalysis
The main features of marginal costing are:
1) All costs are classified in fixed and variable costs. Variable cost per unit remainssame and fixed costs remain same in total regardless of the changes inproduction.
2) Fixed costs are considered period costs and variable costs are considered asproduct costs. Hence fixed costs are not included in product cost.
3) Stock of work-in progress and finished goods are valued at marginal costs orvariable costs.
4) The difference in the value of opening stock and closing stock does not affect theunit cost of production as all the product costs are variable costs.
Direct Costing and Marginal Costing are used inter-changeably. As both the techniquesare more or less same. In direct costing, costs are classified into direct and indirectcosts. Direct costs are those which can be directly allocated to cost unit or cost centrewhile indirect costs can not be allocated to cost unit or costs centre directly. The onlydifference between the two is that some fixed cost could be considered to be directcosts under certain circumstances.
15.5 MARGINAL COSTING EQUATION ANDCONTRIBUTION MARGIN
In full costing or absorption costing, all costs are classified into three broad classes-manufacturing, administrative and selling. In the income statement, manufacturingcosts are deducted from the sales revenue to get the gross margin or gross profit thenadministrative and selling expenses are deducted from gross margin to arrive at netoperating income. Under marginal costing, costs are clarified into fixed and variableexpense. All variable costs, whether they are manufacturing, administrative or sellingare deducted from sales revenue. The difference is called contribution margin ormarginal income. All fixed costs are recovered from the contribution and balance isprofit or loss.
Illustration 7
Two companies A Ltd. and B Ltd. sell the same type of product. Their incomestatement are as follows:
A Ltd. B Ltd.Rs. Rs.
Sales 2,40,000 2,40,000Less Variable Cost 96,000 1,20,000Fixed Costs 64,000 40,000Profit 80,000 80,000
State which company is likely to earn greater profit if there is: (i) heavy demand,(ii ) poor demand for its products.
Solution
A Ltd. B Ltd.Rs. Rs.
Sales 2,40,000 2,40,000Variable Cost 96,000 1,20,000Contribution 1,44,000 1,20,000P/V Ratio (Contribution ÷ Sales) 0.60 0.50
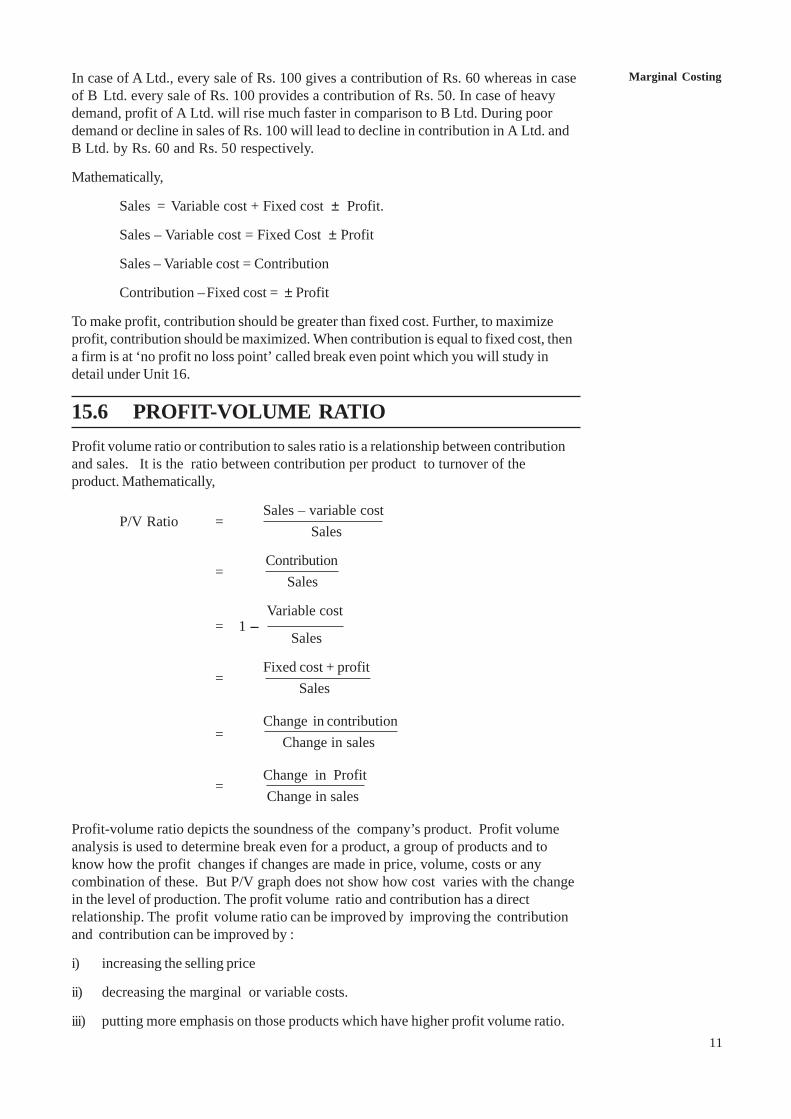
Marginal Costing
11
In case of A Ltd., every sale of Rs. 100 gives a contribution of Rs. 60 whereas in caseof B Ltd. every sale of Rs. 100 provides a contribution of Rs. 50. In case of heavydemand, profit of A Ltd. will rise much faster in comparison to B Ltd. During poordemand or decline in sales of Rs. 100 will lead to decline in contribution in A Ltd. andB Ltd. by Rs. 60 and Rs. 50 respectively.
Mathematically,
Sales = Variable cost + Fixed cost ± Profit.
Sales – Variable cost = Fixed Cost ± Profit
Sales – Variable cost = Contribution
Contribution –Fixed cost = ± Profit
To make profit, contribution should be greater than fixed cost. Further, to maximizeprofit, contribution should be maximized. When contribution is equal to fixed cost, thena firm is at ‘no profit no loss point’ called break even point which you will study indetail under Unit 16.
15.6 PROFIT-VOLUME RATIOProfit volume ratio or contribution to sales ratio is a relationship between contributionand sales. It is the ratio between contribution per product to turnover of theproduct. Mathematically,
P/V Ratio =Sales – variable cost Sales
= Contribution Sales
Variable cost= 1 ---
Sales
=Fixed cost + profit Sales
=Change in contribution Change in sales
=Change in Profit Change in sales
Profit-volume ratio depicts the soundness of the company’s product. Profit volumeanalysis is used to determine break even for a product, a group of products and toknow how the profit changes if changes are made in price, volume, costs or anycombination of these. But P/V graph does not show how cost varies with the changein the level of production. The profit volume ratio and contribution has a directrelationship. The profit volume ratio can be improved by improving the contributionand contribution can be improved by :
i) increasing the selling price
ii) decreasing the marginal or variable costs.
iii) putting more emphasis on those products which have higher profit volume ratio.
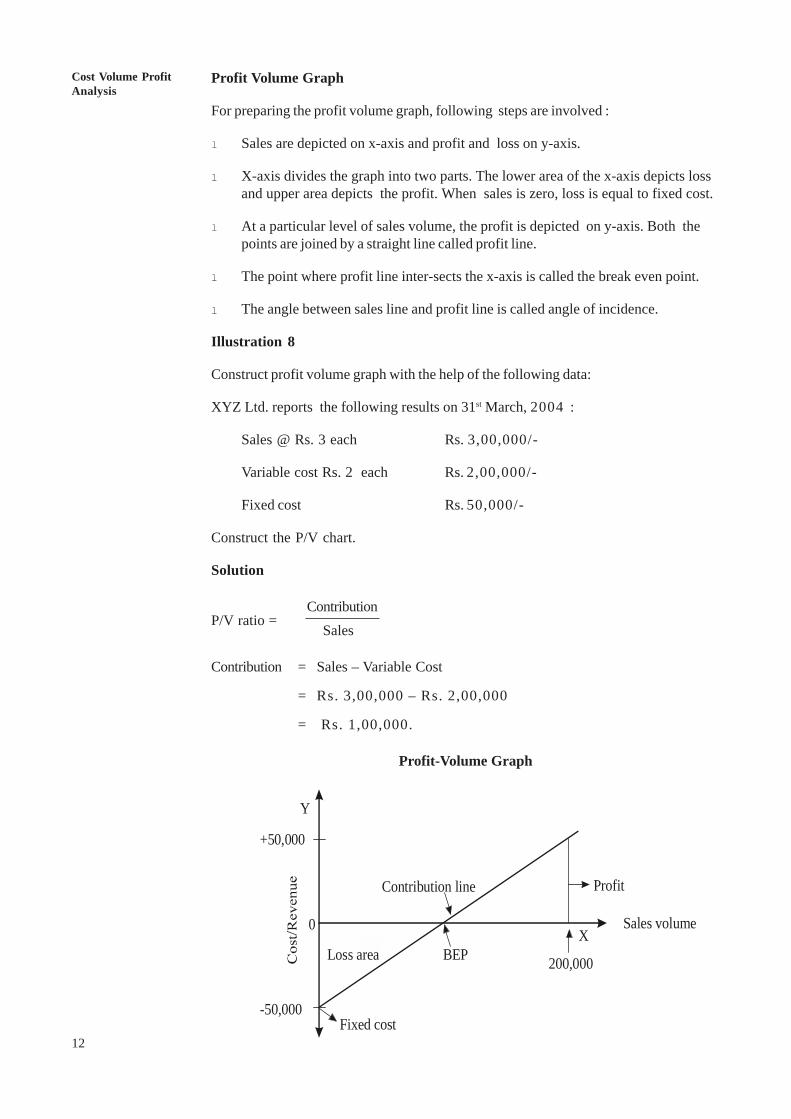
12
An OverviewCost Volume ProfitAnalysis
Profit Volume Graph
For preparing the profit volume graph, following steps are involved :
l Sales are depicted on x-axis and profit and loss on y-axis.
l X-axis divides the graph into two parts. The lower area of the x-axis depicts lossand upper area depicts the profit. When sales is zero, loss is equal to fixed cost.
l At a particular level of sales volume, the profit is depicted on y-axis. Both thepoints are joined by a straight line called profit line.
l The point where profit line inter-sects the x-axis is called the break even point.
l The angle between sales line and profit line is called angle of incidence.
Illustration 8
Construct profit volume graph with the help of the following data:
XYZ Ltd. reports the following results on 31st March, 2004 :
Sales @ Rs. 3 each Rs. 3,00,000/-
Variable cost Rs. 2 each Rs. 2,00,000/-
Fixed cost Rs. 50,000/-
Construct the P/V chart.
Solution
ContributionP/V ratio = Sales
Contribution = Sales – Variable Cost
= Rs. 3,00,000 – Rs. 2,00,000
= Rs. 1,00,000.
Profit-Volume Graph
X
Y
Fixed cost
Contribution line Profit
Sales volume
BEPLoss area
0
200,000
+50,000
-50,000
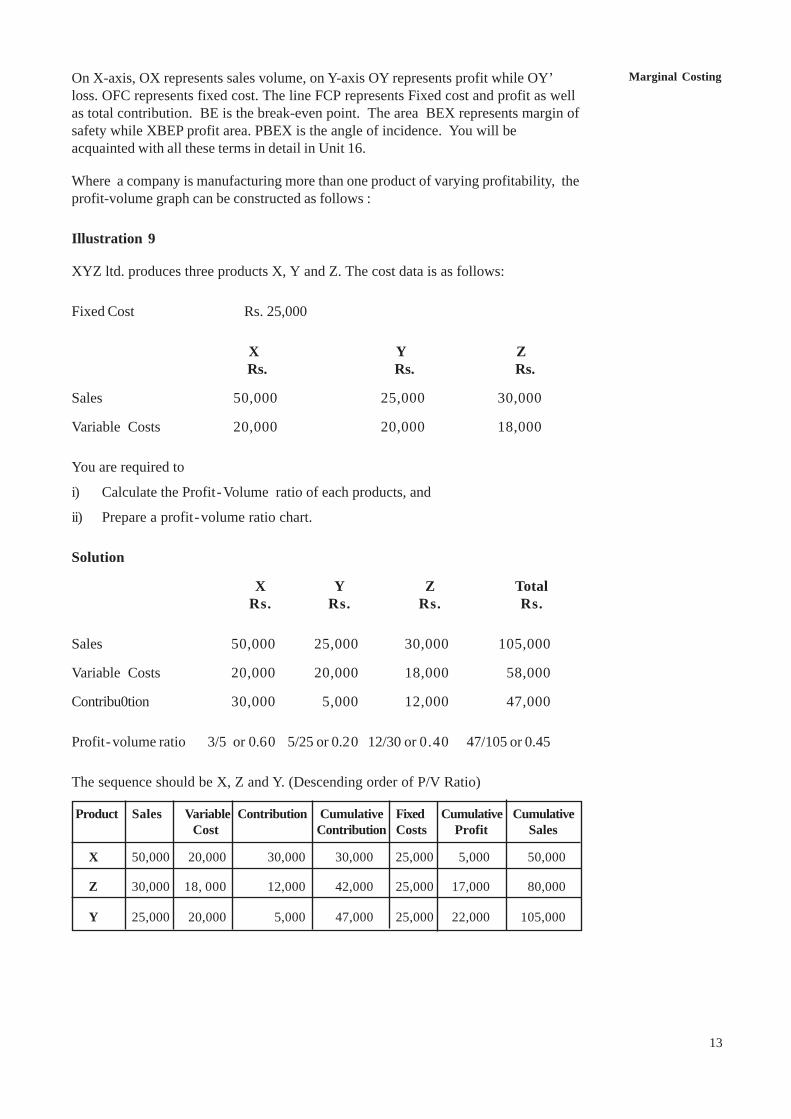
Marginal Costing
13
On X-axis, OX represents sales volume, on Y-axis OY represents profit while OY’loss. OFC represents fixed cost. The line FCP represents Fixed cost and profit as wellas total contribution. BE is the break-even point. The area BEX represents margin ofsafety while XBEP profit area. PBEX is the angle of incidence. You will beacquainted with all these terms in detail in Unit 16.
Where a company is manufacturing more than one product of varying profitability, theprofit-volume graph can be constructed as follows :
Illustration 9
XYZ ltd. produces three products X, Y and Z. The cost data is as follows:
Fixed Cost Rs. 25,000
X Y Z Rs. Rs. Rs.
Sales 50,000 25,000 30,000
Variable Costs 20,000 20,000 18,000
You are required to
i) Calculate the Profit-Volume ratio of each products, and
ii) Prepare a profit-volume ratio chart.
Solution
X Y Z TotalRs. Rs. Rs. Rs.
Sales 50,000 25,000 30,000 105,000
Variable Costs 20,000 20,000 18,000 58,000
Contribu0tion 30,000 5,000 12,000 47,000
Profit -volume ratio 3/5 or 0.60 5/25 or 0.20 12/30 or 0.40 47/105 or 0.45
The sequence should be X, Z and Y. (Descending order of P/V Ratio)
Product Sales Variable Contribution Cumulative Fixed Cumulative Cumulative Cost Contribution Costs Profit Sales
X 50,000 20,000 30,000 30,000 25,000 5,000 50,000
Z 30,000 18, 000 12,000 42,000 25,000 17,000 80,000
Y 25,000 20,000 5,000 47,000 25,000 22,000 105,000
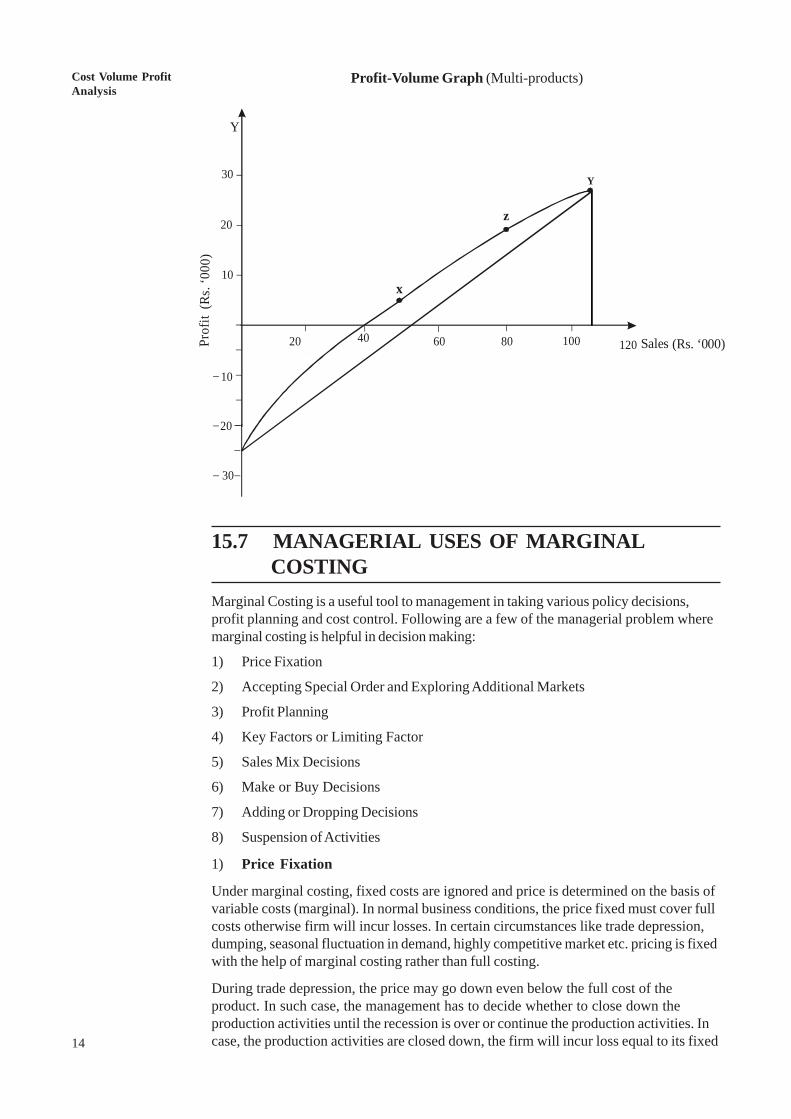
14
An OverviewCost Volume ProfitAnalysis
15.7 MANAGERIAL USES OF MARGINAL COSTING
Marginal Costing is a useful tool to management in taking various policy decisions,profit planning and cost control. Following are a few of the managerial problem wheremarginal costing is helpful in decision making:
1) Price Fixation
2) Accepting Special Order and Exploring Additional Markets
3) Profit Planning
4) Key Factors or Limiting Factor
5) Sales Mix Decisions
6) Make or Buy Decisions
7) Adding or Dropping Decisions
8) Suspension of Activities
1) Price Fixation
Under marginal costing, fixed costs are ignored and price is determined on the basis ofvariable costs (marginal). In normal business conditions, the price fixed must cover fullcosts otherwise firm will incur losses. In certain circumstances like trade depression,dumping, seasonal fluctuation in demand, highly competitive market etc. pricing is fixedwith the help of marginal costing rather than full costing.
During trade depression, the price may go down even below the full cost of theproduct. In such case, the management has to decide whether to close down theproduction activities until the recession is over or continue the production activities. Incase, the production activities are closed down, the firm will incur loss equal to its fixed
Profit-Volume Graph (Multi-products)
Sales
Y
12010080604020
10
10
20
20
Y
z
x
30
ofit
30
Pr (Rs. ‘000)
(Rs.
‘00 0
)
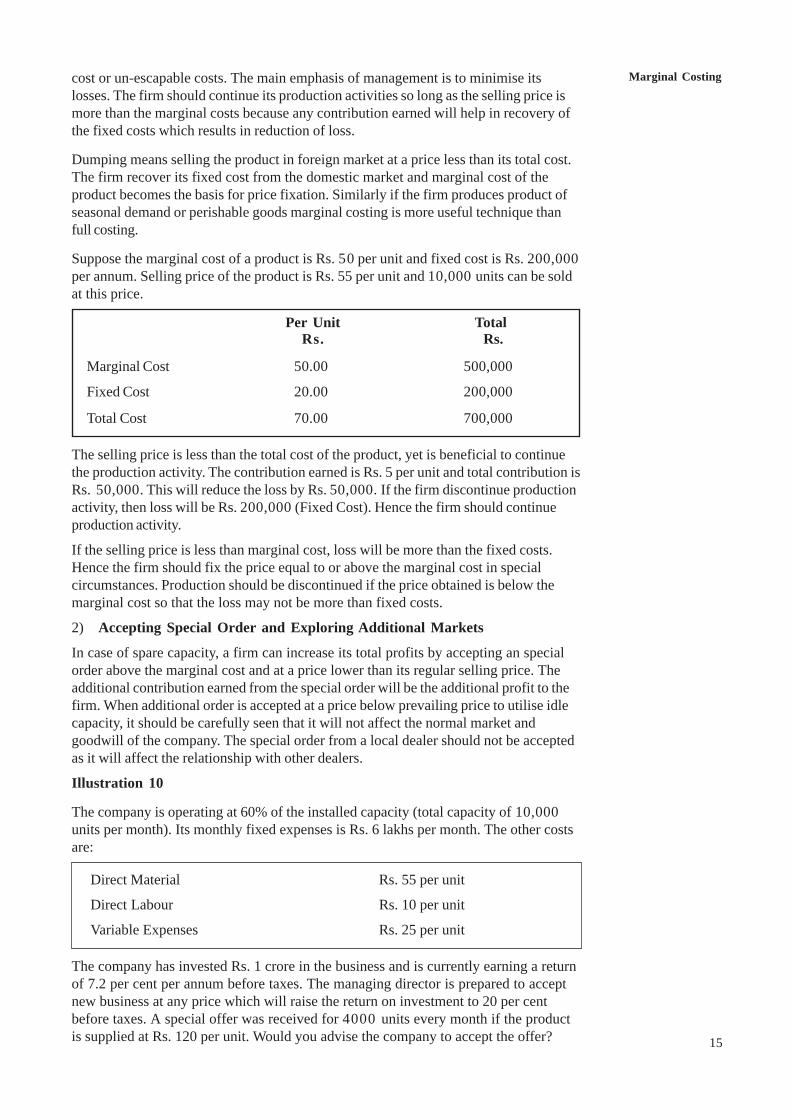
Marginal Costing
15
cost or un-escapable costs. The main emphasis of management is to minimise itslosses. The firm should continue its production activities so long as the selling price ismore than the marginal costs because any contribution earned will help in recovery ofthe fixed costs which results in reduction of loss.
Dumping means selling the product in foreign market at a price less than its total cost.The firm recover its fixed cost from the domestic market and marginal cost of theproduct becomes the basis for price fixation. Similarly if the firm produces product ofseasonal demand or perishable goods marginal costing is more useful technique thanfull costing.
Suppose the marginal cost of a product is Rs. 50 per unit and fixed cost is Rs. 200,000per annum. Selling price of the product is Rs. 55 per unit and 10,000 units can be soldat this price.
Per Unit TotalRs. Rs.
Marginal Cost 50.00 500,000
Fixed Cost 20.00 200,000
Total Cost 70.00 700,000
The selling price is less than the total cost of the product, yet is beneficial to continuethe production activity. The contribution earned is Rs. 5 per unit and total contribution isRs. 50,000. This will reduce the loss by Rs. 50,000. If the firm discontinue productionactivity, then loss will be Rs. 200,000 (Fixed Cost). Hence the firm should continueproduction activity.
If the selling price is less than marginal cost, loss will be more than the fixed costs.Hence the firm should fix the price equal to or above the marginal cost in specialcircumstances. Production should be discontinued if the price obtained is below themarginal cost so that the loss may not be more than fixed costs.
2) Accepting Special Order and Exploring Additional Markets
In case of spare capacity, a firm can increase its total profits by accepting an specialorder above the marginal cost and at a price lower than its regular selling price. Theadditional contribution earned from the special order will be the additional profit to thefirm. When additional order is accepted at a price below prevailing price to utilise idlecapacity, it should be carefully seen that it will not affect the normal market andgoodwill of the company. The special order from a local dealer should not be acceptedas it will affect the relationship with other dealers.
Illustration 10
The company is operating at 60% of the installed capacity (total capacity of 10,000units per month). Its monthly fixed expenses is Rs. 6 lakhs per month. The other costsare:
Direct Material Rs. 55 per unit
Direct Labour Rs. 10 per unit
Variable Expenses Rs. 25 per unit
The company has invested Rs. 1 crore in the business and is currently earning a returnof 7.2 per cent per annum before taxes. The managing director is prepared to acceptnew business at any price which will raise the return on investment to 20 per centbefore taxes. A special offer was received for 4000 units every month if the productis supplied at Rs. 120 per unit. Would you advise the company to accept the offer?
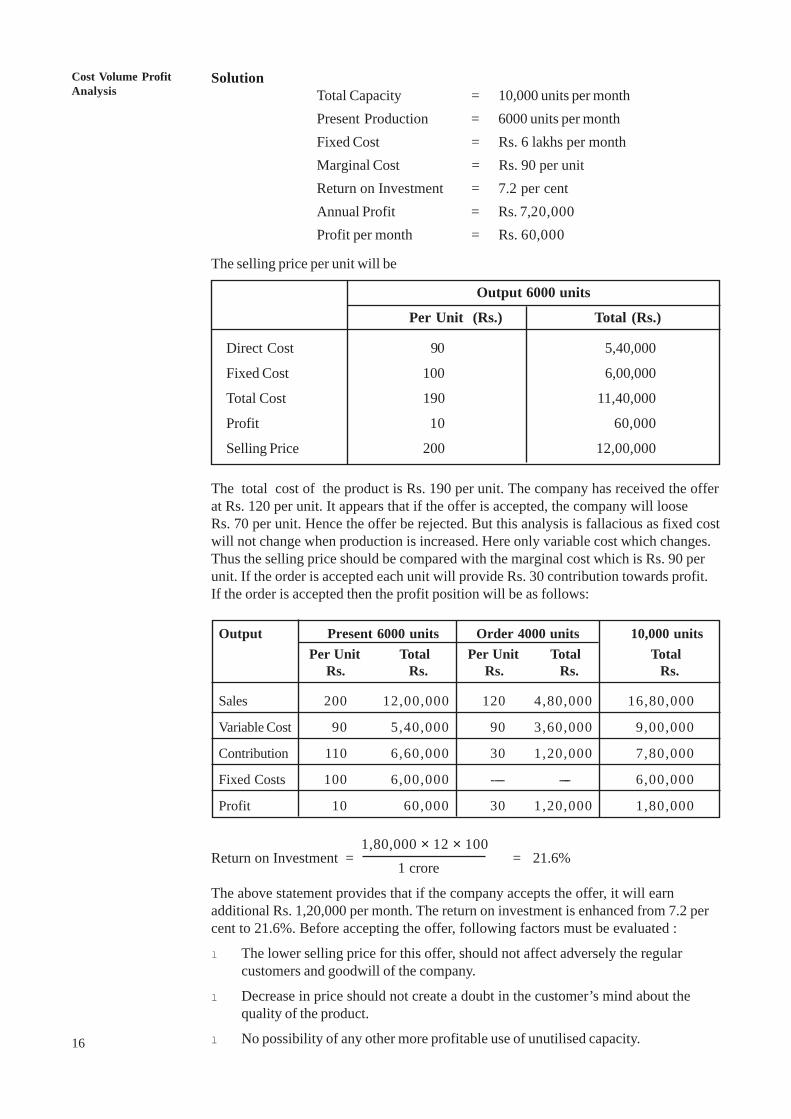
16
An OverviewCost Volume ProfitAnalysis
SolutionTotal Capacity = 10,000 units per monthPresent Production = 6000 units per monthFixed Cost = Rs. 6 lakhs per monthMarginal Cost = Rs. 90 per unitReturn on Investment = 7.2 per centAnnual Profit = Rs. 7,20,000Profit per month = Rs. 60,000
The selling price per unit will be
Output 6000 units
Per Unit (Rs.) Total (Rs.)
Direct Cost 90 5,40,000
Fixed Cost 100 6,00,000
Total Cost 190 11,40,000
Profit 10 60,000
Selling Price 200 12,00,000
The total cost of the product is Rs. 190 per unit. The company has received the offerat Rs. 120 per unit. It appears that if the offer is accepted, the company will looseRs. 70 per unit. Hence the offer be rejected. But this analysis is fallacious as fixed costwill not change when production is increased. Here only variable cost which changes.Thus the selling price should be compared with the marginal cost which is Rs. 90 perunit. If the order is accepted each unit will provide Rs. 30 contribution towards profit.If the order is accepted then the profit position will be as follows:
Output Present 6000 units Order 4000 units 10,000 units Per Unit Total Per Unit Total Total Rs. Rs. Rs. Rs. Rs.
Sales 200 12,00,000 120 4,80,000 16,80,000
Variable Cost 90 5,40,000 90 3,60,000 9,00,000
Contribution 110 6,60,000 30 1,20,000 7,80,000
Fixed Costs 100 6,00,000 ---- ---- 6,00,000
Profit 10 60,000 30 1,20,000 1,80,000
1,80,000 × 12 × 100Return on Investment = = 21.6%
1 crore
The above statement provides that if the company accepts the offer, it will earnadditional Rs. 1,20,000 per month. The return on investment is enhanced from 7.2 percent to 21.6%. Before accepting the offer, following factors must be evaluated :
l The lower selling price for this offer, should not affect adversely the regularcustomers and goodwill of the company.
l Decrease in price should not create a doubt in the customer’s mind about thequality of the product.
l No possibility of any other more profitable use of unutilised capacity.
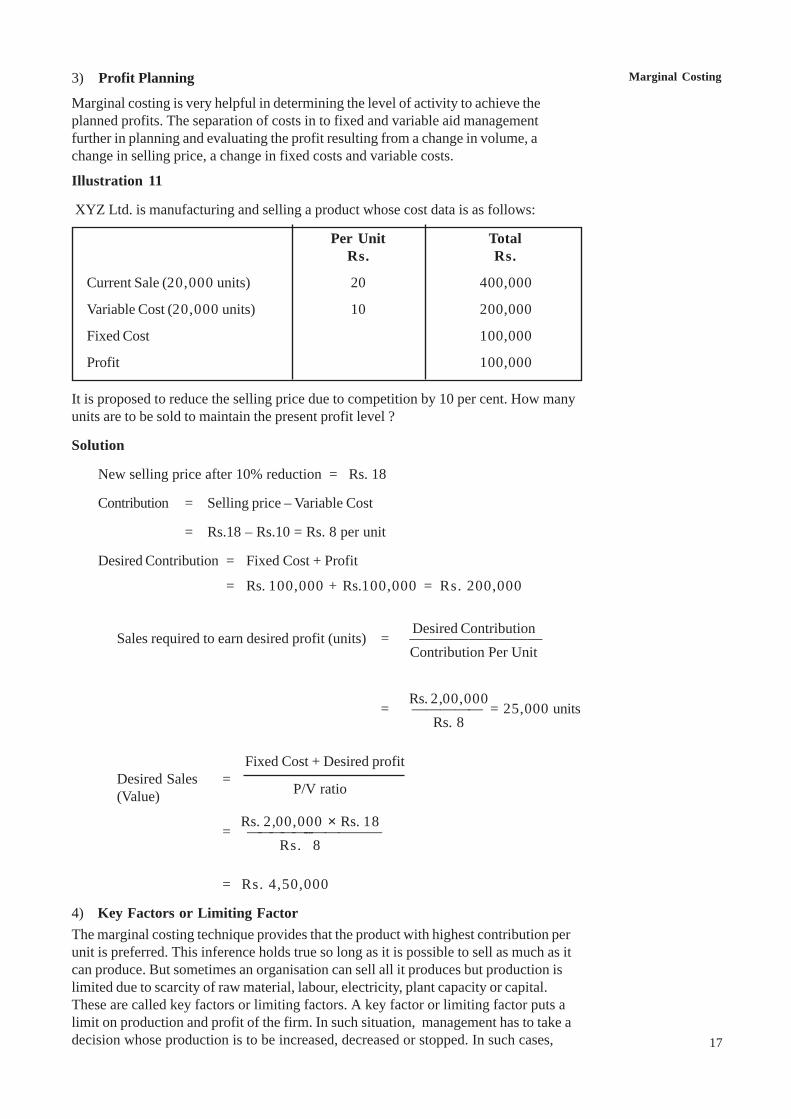
Marginal Costing
17
3) Profit Planning
Marginal costing is very helpful in determining the level of activity to achieve theplanned profits. The separation of costs in to fixed and variable aid managementfurther in planning and evaluating the profit resulting from a change in volume, achange in selling price, a change in fixed costs and variable costs.
Illustration 11
XYZ Ltd. is manufacturing and selling a product whose cost data is as follows:
Per Unit TotalRs. Rs.
Current Sale (20,000 units) 20 400,000
Variable Cost (20,000 units) 10 200,000
Fixed Cost 100,000
Profit 100,000
It is proposed to reduce the selling price due to competition by 10 per cent. How manyunits are to be sold to maintain the present profit level ?
Solution
New selling price after 10% reduction = Rs. 18
Contribution = Selling price – Variable Cost
= Rs.18 – Rs.10 = Rs. 8 per unit
Desired Contribution = Fixed Cost + Profit
= Rs. 100,000 + Rs.100,000 = Rs. 200,000
Desired ContributionSales required to earn desired profit (units) = —————————
Contribution Per Unit
Rs. 2,00,000= ————— = 25,000 units
Rs. 8
Fixed Cost + Desired profitDesired Sales =(Value) P/V ratio
Rs. 2,00,000 × Rs. 18= —————---—————
Rs. 8
= Rs. 4,50,000
4) Key Factors or Limiting FactorThe marginal costing technique provides that the product with highest contribution perunit is preferred. This inference holds true so long as it is possible to sell as much as itcan produce. But sometimes an organisation can sell all it produces but production islimited due to scarcity of raw material, labour, electricity, plant capacity or capital.These are called key factors or limiting factors. A key factor or limiting factor puts alimit on production and profit of the firm. In such situation, management has to take adecision whose production is to be increased, decreased or stopped. In such cases,
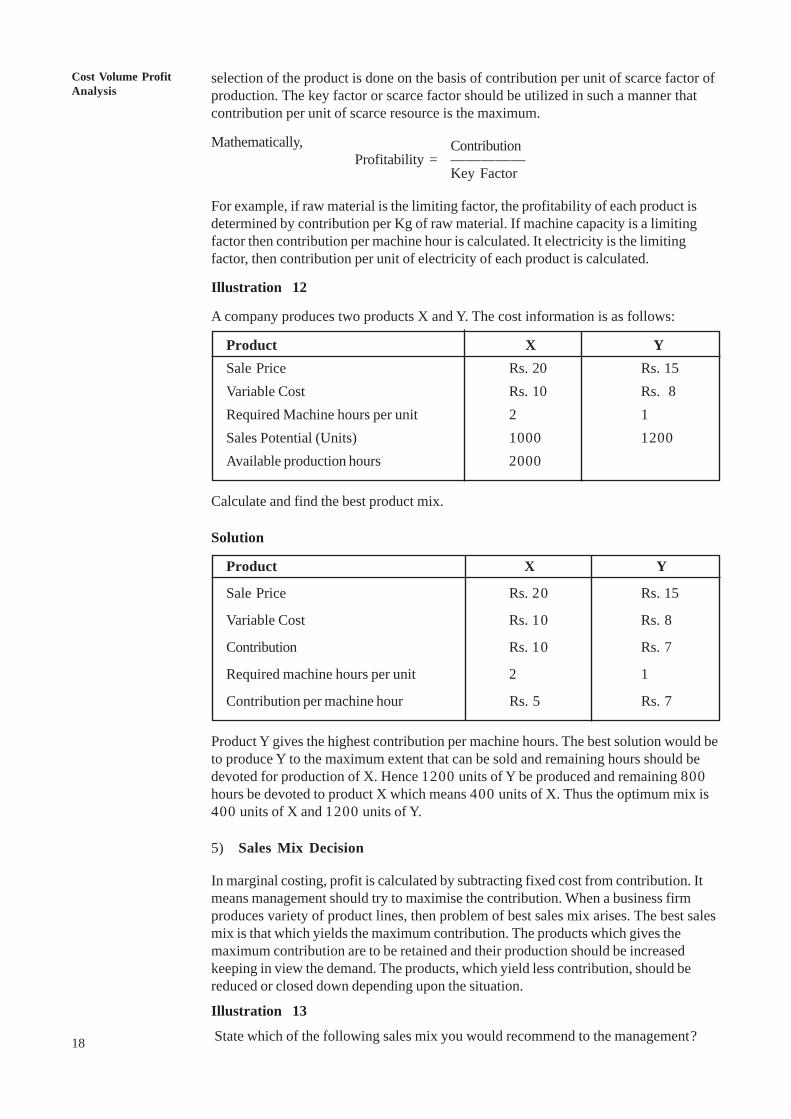
18
An OverviewCost Volume ProfitAnalysis
selection of the product is done on the basis of contribution per unit of scarce factor ofproduction. The key factor or scarce factor should be utilized in such a manner thatcontribution per unit of scarce resource is the maximum.
Mathematically, ContributionProfitability = —————
Key Factor
For example, if raw material is the limiting factor, the profitability of each product isdetermined by contribution per Kg of raw material. If machine capacity is a limitingfactor then contribution per machine hour is calculated. It electricity is the limitingfactor, then contribution per unit of electricity of each product is calculated.
Illustration 12
A company produces two products X and Y. The cost information is as follows:
Product X YSale Price Rs. 20 Rs. 15Variable Cost Rs. 10 Rs. 8Required Machine hours per unit 2 1Sales Potential (Units) 1000 1200Available production hours 2000
Calculate and find the best product mix.
Solution
Product X Y
Sale Price Rs. 20 Rs. 15
Variable Cost Rs. 10 Rs. 8
Contribution Rs. 10 Rs. 7
Required machine hours per unit 2 1
Contribution per machine hour Rs. 5 Rs. 7
Product Y gives the highest contribution per machine hours. The best solution would beto produce Y to the maximum extent that can be sold and remaining hours should bedevoted for production of X. Hence 1200 units of Y be produced and remaining 800hours be devoted to product X which means 400 units of X. Thus the optimum mix is400 units of X and 1200 units of Y.
5) Sales Mix Decision
In marginal costing, profit is calculated by subtracting fixed cost from contribution. Itmeans management should try to maximise the contribution. When a business firmproduces variety of product lines, then problem of best sales mix arises. The best salesmix is that which yields the maximum contribution. The products which gives themaximum contribution are to be retained and their production should be increasedkeeping in view the demand. The products, which yield less contribution, should bereduced or closed down depending upon the situation.
Illustration 13
State which of the following sales mix you would recommend to the management?
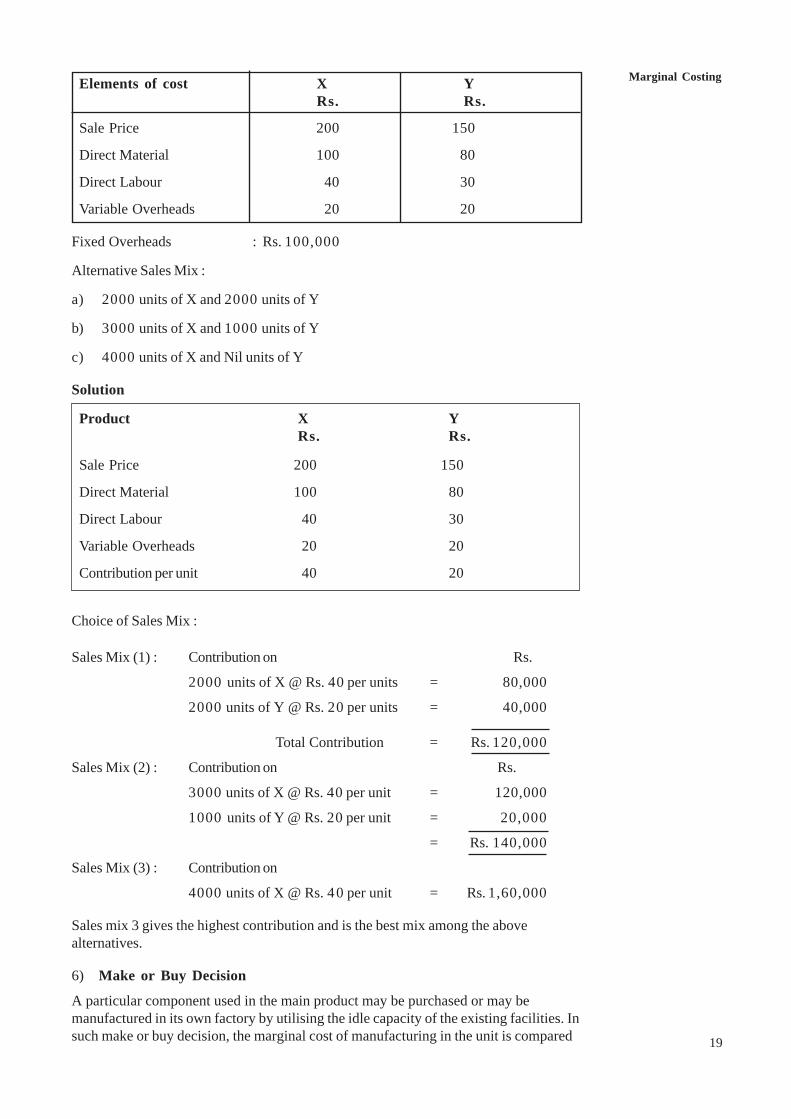
Marginal Costing
19
Elements of cost X YRs. Rs.
Sale Price 200 150
Direct Material 100 80
Direct Labour 40 30
Variable Overheads 20 20
Fixed Overheads : Rs. 100,000
Alternative Sales Mix :
a) 2000 units of X and 2000 units of Y
b) 3000 units of X and 1000 units of Y
c) 4000 units of X and Nil units of Y
Solution
Product X YRs. Rs.
Sale Price 200 150
Direct Material 100 80
Direct Labour 40 30
Variable Overheads 20 20
Contribution per unit 40 20
Choice of Sales Mix :
Sales Mix (1) : Contribution on Rs.
2000 units of X @ Rs. 40 per units = 80,000
2000 units of Y @ Rs. 20 per units = 40,000
Total Contribution = Rs. 120,000
Sales Mix (2) : Contribution on Rs.
3000 units of X @ Rs. 40 per unit = 120,000
1000 units of Y @ Rs. 20 per unit = 20,000
= Rs. 140,000
Sales Mix (3) : Contribution on
4000 units of X @ Rs. 40 per unit = Rs. 1,60,000
Sales mix 3 gives the highest contribution and is the best mix among the abovealternatives.
6) Make or Buy Decision
A particular component used in the main product may be purchased or may bemanufactured in its own factory by utilising the idle capacity of the existing facilities. Insuch make or buy decision, the marginal cost of manufacturing in the unit is compared
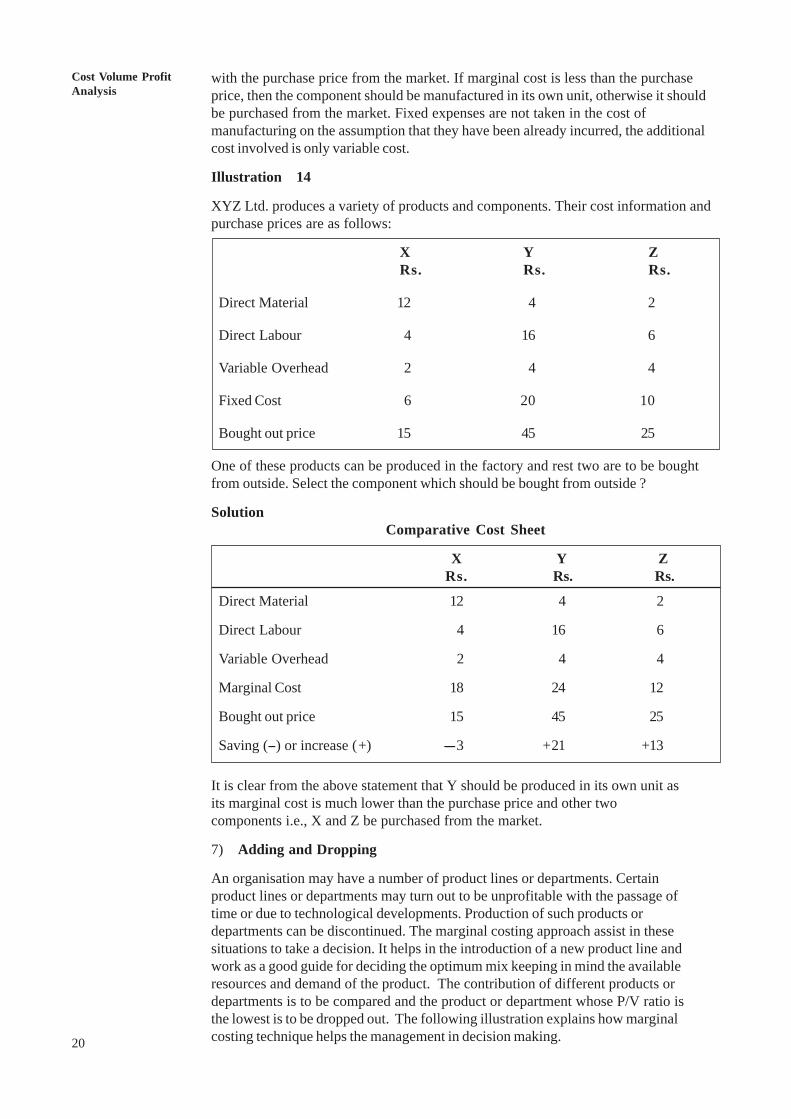
20
An OverviewCost Volume ProfitAnalysis
with the purchase price from the market. If marginal cost is less than the purchaseprice, then the component should be manufactured in its own unit, otherwise it shouldbe purchased from the market. Fixed expenses are not taken in the cost ofmanufacturing on the assumption that they have been already incurred, the additionalcost involved is only variable cost.
Illustration 14
XYZ Ltd. produces a variety of products and components. Their cost information andpurchase prices are as follows:
X Y ZRs. Rs. Rs.
Direct Material 12 4 2
Direct Labour 4 16 6
Variable Overhead 2 4 4
Fixed Cost 6 20 10
Bought out price 15 45 25
One of these products can be produced in the factory and rest two are to be boughtfrom outside. Select the component which should be bought from outside ?
SolutionComparative Cost Sheet
X Y ZRs. Rs. Rs.
Direct Material 12 4 2
Direct Labour 4 16 6
Variable Overhead 2 4 4
Marginal Cost 18 24 12
Bought out price 15 45 25
Saving (--) or increase (+) ----3 +21 +13
It is clear from the above statement that Y should be produced in its own unit asits marginal cost is much lower than the purchase price and other twocomponents i.e., X and Z be purchased from the market.
7) Adding and Dropping
An organisation may have a number of product lines or departments. Certainproduct lines or departments may turn out to be unprofitable with the passage oftime or due to technological developments. Production of such products ordepartments can be discontinued. The marginal costing approach assist in thesesituations to take a decision. It helps in the introduction of a new product line andwork as a good guide for deciding the optimum mix keeping in mind the availableresources and demand of the product. The contribution of different products ordepartments is to be compared and the product or department whose P/V ratio isthe lowest is to be dropped out. The following illustration explains how marginalcosting technique helps the management in decision making.
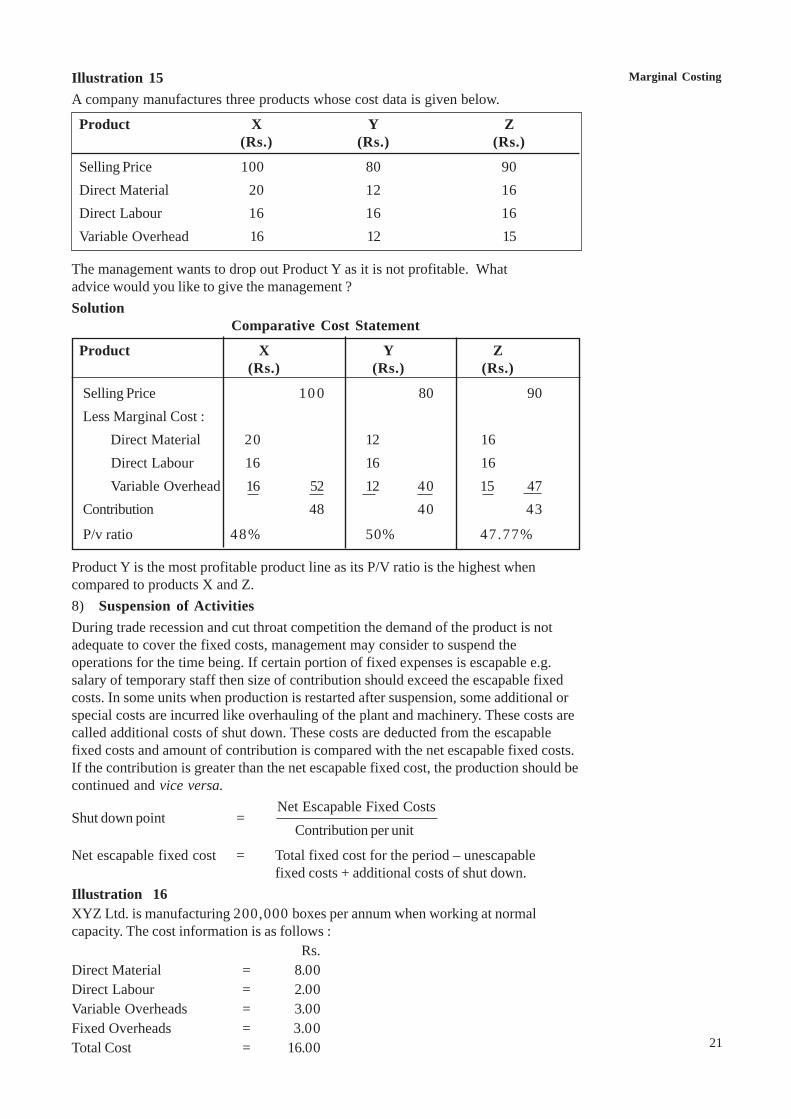
Marginal Costing
21
Illustration 15A company manufactures three products whose cost data is given below.
Product X Y Z(Rs.) (Rs.) (Rs.)
Selling Price 100 80 90Direct Material 20 12 16Direct Labour 16 16 16Variable Overhead 16 12 15
The management wants to drop out Product Y as it is not profitable. Whatadvice would you like to give the management ?Solution
Comparative Cost Statement
Product X Y Z(Rs.) (Rs.) (Rs.)
Selling Price 10 0 80 90Less Marginal Cost : Direct Material 20 12 16 Direct Labour 16 16 16 Variable Overhead 16 52 12 40 15 47Contribution 48 40 43
P/v ratio 48% 50% 47.77%
Product Y is the most profitable product line as its P/V ratio is the highest whencompared to products X and Z.8) Suspension of ActivitiesDuring trade recession and cut throat competition the demand of the product is notadequate to cover the fixed costs, management may consider to suspend theoperations for the time being. If certain portion of fixed expenses is escapable e.g.salary of temporary staff then size of contribution should exceed the escapable fixedcosts. In some units when production is restarted after suspension, some additional orspecial costs are incurred like overhauling of the plant and machinery. These costs arecalled additional costs of shut down. These costs are deducted from the escapablefixed costs and amount of contribution is compared with the net escapable fixed costs.If the contribution is greater than the net escapable fixed cost, the production should becontinued and vice versa.
Shut down point = Net Escapable Fixed Costs
Contribution per unit
Net escapable fixed cost = Total fixed cost for the period – unescapablefixed costs + additional costs of shut down.
Illustration 16XYZ Ltd. is manufacturing 200,000 boxes per annum when working at normalcapacity. The cost information is as follows :
Rs.Direct Material = 8.00Direct Labour = 2.00Variable Overheads = 3.00Fixed Overheads = 3.00Total Cost = 16.00
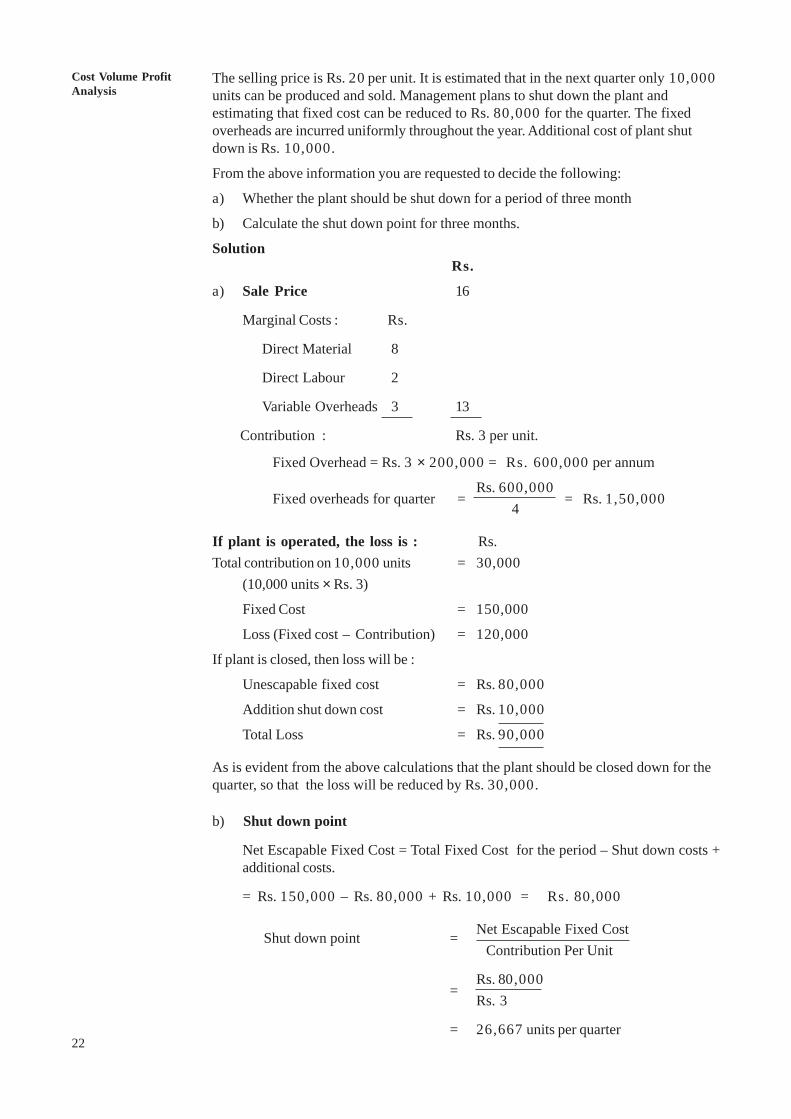
22
An OverviewCost Volume ProfitAnalysis
The selling price is Rs. 20 per unit. It is estimated that in the next quarter only 10,000units can be produced and sold. Management plans to shut down the plant andestimating that fixed cost can be reduced to Rs. 80,000 for the quarter. The fixedoverheads are incurred uniformly throughout the year. Additional cost of plant shutdown is Rs. 10,000.
From the above information you are requested to decide the following:
a) Whether the plant should be shut down for a period of three month
b) Calculate the shut down point for three months.
SolutionRs.
a) Sale Price 16
Marginal Costs : Rs.
Direct Material 8
Direct Labour 2
Variable Overheads 3 13
Contribution : Rs. 3 per unit.
Fixed Overhead = Rs. 3 × 200,000 = Rs. 600,000 per annum
Fixed overheads for quarter =Rs. 600,000 = Rs. 1,50,000 4
If plant is operated, the loss is : Rs.Total contribution on 10,000 units = 30,000
(10,000 units × Rs. 3)
Fixed Cost = 150,000
Loss (Fixed cost – Contribution) = 120,000
If plant is closed, then loss will be :
Unescapable fixed cost = Rs. 80,000
Addition shut down cost = Rs. 10,000
Total Loss = Rs. 90,000
As is evident from the above calculations that the plant should be closed down for thequarter, so that the loss will be reduced by Rs. 30,000.
b) Shut down point
Net Escapable Fixed Cost = Total Fixed Cost for the period – Shut down costs +additional costs.
= Rs. 150,000 – Rs. 80,000 + Rs. 10,000 = Rs. 80,000
Shut down point = Net Escapable Fixed Cost Contribution Per Unit
=Rs. 80,000Rs. 3
= 26,667 units per quarter
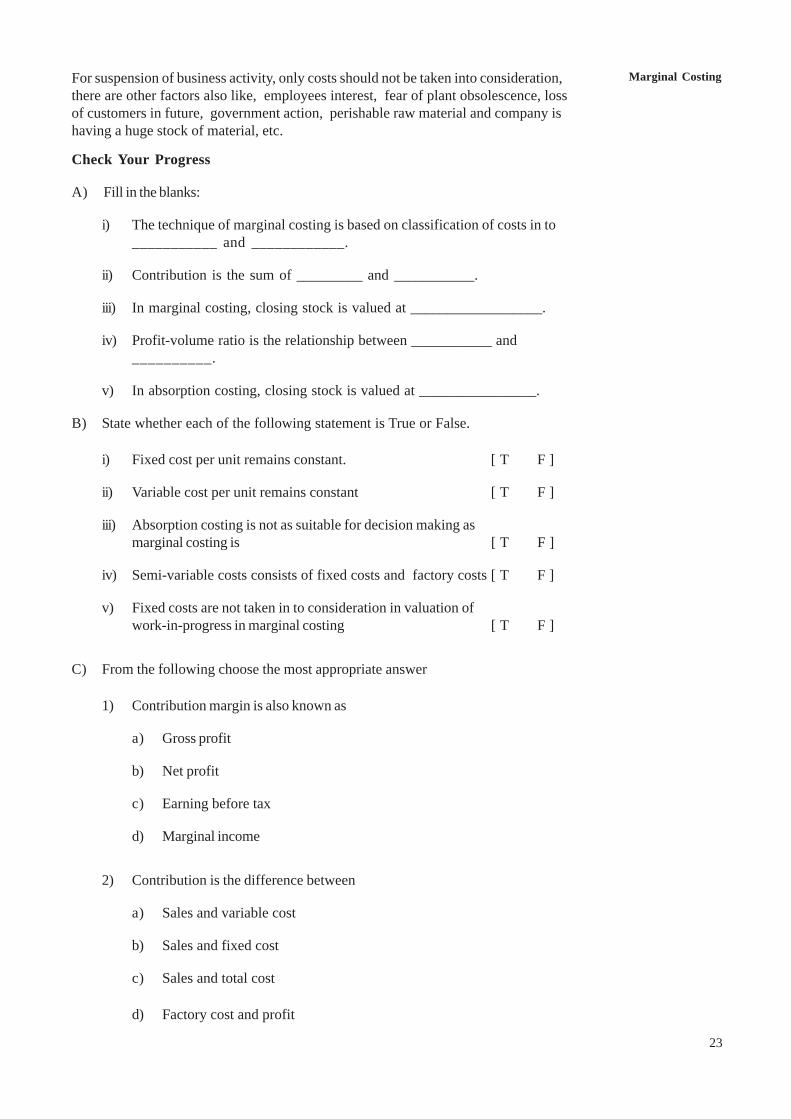
Marginal Costing
23
For suspension of business activity, only costs should not be taken into consideration,there are other factors also like, employees interest, fear of plant obsolescence, lossof customers in future, government action, perishable raw material and company ishaving a huge stock of material, etc.
Check Your Progress
A) Fill in the blanks:
i) The technique of marginal costing is based on classification of costs in to___________ and ____________.
ii) Contribution is the sum of _________ and ___________.
iii) In marginal costing, closing stock is valued at __________________.
iv) Profit-volume ratio is the relationship between ___________ and__________.
v) In absorption costing, closing stock is valued at ________________.
B) State whether each of the following statement is True or False.
i) Fixed cost per unit remains constant. [ T F ]
ii) Variable cost per unit remains constant [ T F ]
iii) Absorption costing is not as suitable for decision making asmarginal costing is [ T F ]
iv) Semi-variable costs consists of fixed costs and factory costs [ T F ]
v) Fixed costs are not taken in to consideration in valuation ofwork-in-progress in marginal costing [ T F ]
C) From the following choose the most appropriate answer
1) Contribution margin is also known as
a) Gross profit
b) Net profit
c) Earning before tax
d) Marginal income
2) Contribution is the difference between
a) Sales and variable cost
b) Sales and fixed cost
c) Sales and total cost
d) Factory cost and profit
24
An OverviewCost Volume ProfitAnalysis
3) When fixed cost is Rs. 20,000 and Profit volume ratio is 25 per cent, thenbreak even point will occur at
a) Rs. 5000
b) 5000 units
c) Rs. 80,000
d) 80,000 units
4) Period cost means
a) Variable cost
b) Fixed costs
c) Prime cost
d) Factory cost
5) If profit-volume ratio is 25 per cent and sales is Rs. 100,000, the variablecost will be
a) Rs. 25,000
b) Rs. 50,000
c) Rs. 75,000
d) None of the above
6) The valuation of stock in marginal costing as compared to absorptioncosting is
a) Higher
b) Lower
c) Same
d) None of the above
15.8 LIMITATIONS OF MARGINAL COSTINGThe marginal costing has the following limitations :
1) Difficulty in cost Analysis : Separation of costs into fixed and variablebecomes very difficult under certain circumstances and in certain businesssituations. The accuracy of marginal costing results depends upon how accuratelycosts are classified.
2) Inappropriate basis of pricing : In marginal costing, there is a danger of toomany sales being made at marginal cost or marginal cost plus some contribution,resulting in under recovery of fixed overheads. This situation will arise duringdepression or increasing competition.
3) Under valuation of inventory : In marginal costing, inventories are valued atvariable costs. It may create problems in inter firm transfer of goods at marginalcosts resulting in higher profits. Employees may demand higher salaries and otherbenefits. Exclusion of fixed costs from inventory cost seems to be against theaccepted accounting procedure.
4) Same marginal cost per unit : This assumption is partly true within a limitedrange of activity. Scarcity of labour and material brings change in price, tradediscount of bulk purchases, changes in the productivity of men etc. will influencethe marginal cost per unit.
Marginal Costing
25
5) Not suitable to all concerns : This technique may not be suitable in thoseindustries which have large stock of work-in-progress e.g. contact and shipbuilding industry. If fixed expenses are not included in valuation of work-in-progress losses may occur in the initial years till the contract is completed. Oncompletion of the contract, huge profit will be depicted.
6) New Technology : With the development of science and technology, new costefficient machines are available resulting in reduction in labour costs andincreased fixed costs. The system of costing, which ignores significant portion ofcost i.e. fixed cost, can not be very effective.
15.9 LET US SUM UPThe elements of costs are material, labour and expenses. These elements of costs arebroadly put into two categories: fixed and variable costs. The cost of product orprocess can be ascertained by absorption costing and marginal costing. In absorptioncosting or full costing, cost of a product is determined after considering both fixed andvariable cost. Whereas in marginal costing only variable costs are considered incalculating the cost of product and fixed costs are charged against the revenue(consideration) of the period. Marginal costing is a definite improvement over theabsorption costing.
Marginal costing involves computation of marginal cost. The marginal cost is alsocalled variable costs. It comprises of direct material, direct labour and variableoverheads. Marginal costing helps the management in taking various managerialdecisions like price fixation, profit planning, add and drop decisions, make or buydecision, sales mix decision etc.
Marginal costing technique has some limitations. The categorisation of expenses intofixed and variable elements is tedious and complex task. The behaviour of per unitvariable and total fixed cost is questionable as assumed in marginal costing. Inspite ofthese limitations, marginal costing is a useful technique for decisions making in severalbusiness decisions.
15.10 KEY WORDSAbsorption costing or full costing: A technique where all costs, fixed and variable,are allocated to cost unit.Break Even Point: A level of production activity, where sales revenue is equal tovariable cost and fixed cost or contribution equal to fixed cost. It is also called ‘noprofit, no loss’ point.Contribution: The difference between sale price and variable costs is calledcontribution.Marginal Cost: It comprises of direct material, direct labour and variable overheadsor cost of producing one additional unit.Marginal Costing: It is a technique where only variable costs are considered whilecomputing the cost of product. The fixed costs are met against the total contribution ofall the products taken together.
15.11 ANSWERS TO CHECK YOUR PROGRESSA) i) Fixed and Variable, ii) Fixed Cost and Profit, iii) variable cost,
iv) contribution and sales, v) full costB) i) F, ii) T, iii) T, iv) F, v) TC) 1) D, 2) A, 3) C, 4) B, 5) C, 6) D
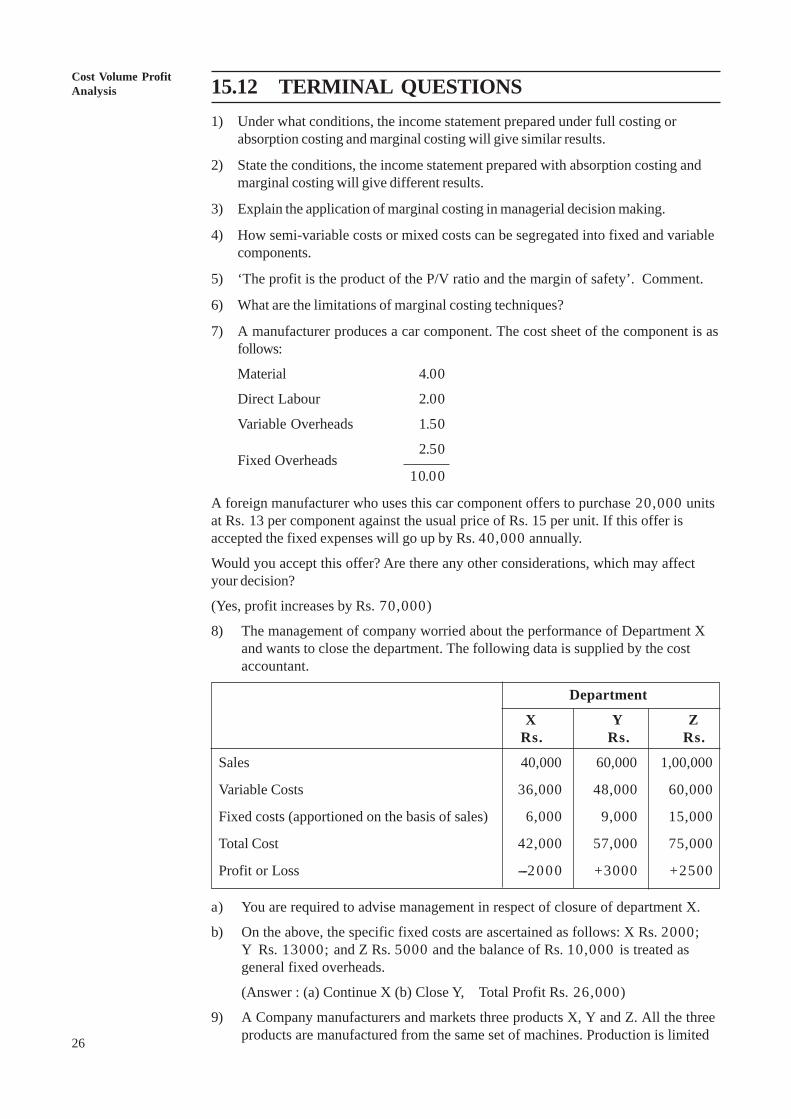
26
An OverviewCost Volume ProfitAnalysis 15.12 TERMINAL QUESTIONS
1) Under what conditions, the income statement prepared under full costing orabsorption costing and marginal costing will give similar results.
2) State the conditions, the income statement prepared with absorption costing andmarginal costing will give different results.
3) Explain the application of marginal costing in managerial decision making.
4) How semi-variable costs or mixed costs can be segregated into fixed and variablecomponents.
5) ‘The profit is the product of the P/V ratio and the margin of safety’. Comment.
6) What are the limitations of marginal costing techniques?
7) A manufacturer produces a car component. The cost sheet of the component is asfollows:
Material 4.00
Direct Labour 2.00
Variable Overheads 1.50
Fixed Overheads2.50
10.00
A foreign manufacturer who uses this car component offers to purchase 20,000 unitsat Rs. 13 per component against the usual price of Rs. 15 per unit. If this offer isaccepted the fixed expenses will go up by Rs. 40,000 annually.
Would you accept this offer? Are there any other considerations, which may affectyour decision?
(Yes, profit increases by Rs. 70,000)
8) The management of company worried about the performance of Department Xand wants to close the department. The following data is supplied by the costaccountant.
Department
X Y ZRs. Rs. Rs.
Sales 40,000 60,000 1,00,000
Variable Costs 36,000 48,000 60,000
Fixed costs (apportioned on the basis of sales) 6,000 9,000 15,000
Total Cost 42,000 57,000 75,000
Profit or Loss --- 2000 +3000 +2500
a) You are required to advise management in respect of closure of department X.
b) On the above, the specific fixed costs are ascertained as follows: X Rs. 2000;Y Rs. 13000; and Z Rs. 5000 and the balance of Rs. 10,000 is treated asgeneral fixed overheads.
(Answer : (a) Continue X (b) Close Y, Total Profit Rs. 26,000)
9) A Company manufacturers and markets three products X, Y and Z. All the threeproducts are manufactured from the same set of machines. Production is limited
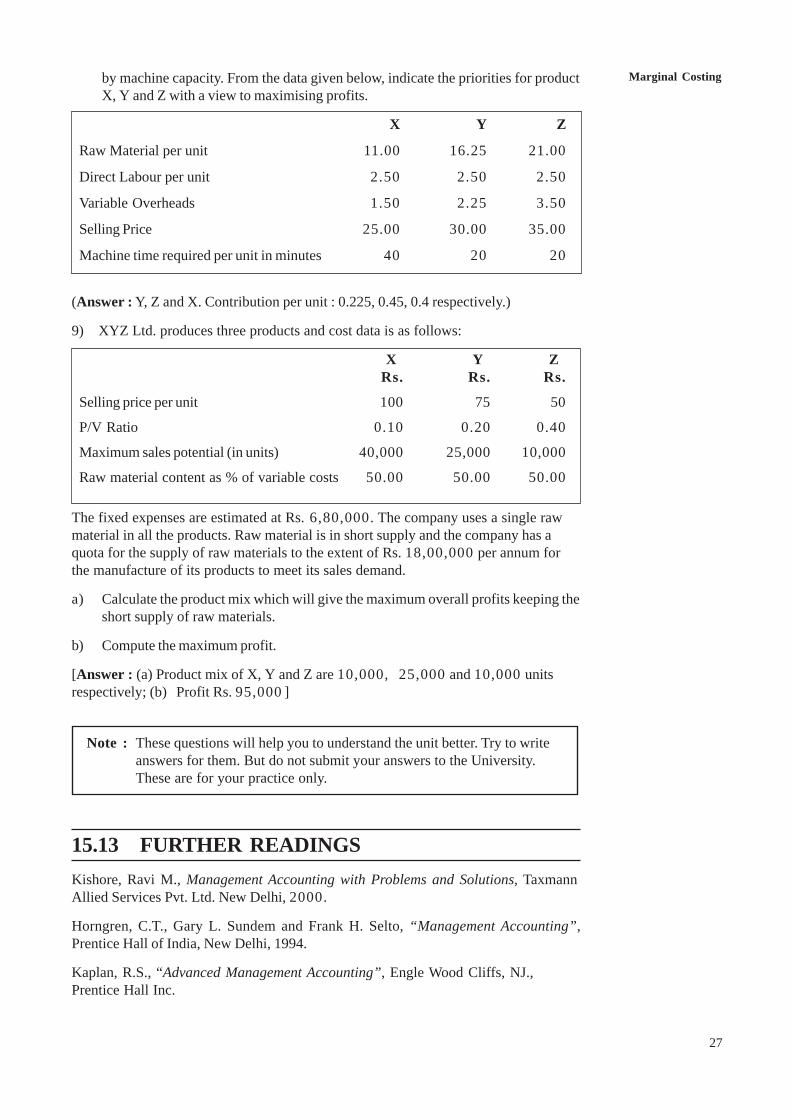
Marginal Costing
27
by machine capacity. From the data given below, indicate the priorities for productX, Y and Z with a view to maximising profits.
X Y Z
Raw Material per unit 11.00 16.25 21.00
Direct Labour per unit 2.50 2.50 2.50
Variable Overheads 1.50 2.25 3.50
Selling Price 25.00 30.00 35.00
Machine time required per unit in minutes 40 20 20
(Answer : Y, Z and X. Contribution per unit : 0.225, 0.45, 0.4 respectively.)
9) XYZ Ltd. produces three products and cost data is as follows:
X Y ZRs. Rs. Rs.
Selling price per unit 100 75 50
P/V Ratio 0.10 0.20 0.40
Maximum sales potential (in units) 40,000 25,000 10,000
Raw material content as % of variable costs 50.00 50.00 50.00
The fixed expenses are estimated at Rs. 6,80,000. The company uses a single rawmaterial in all the products. Raw material is in short supply and the company has aquota for the supply of raw materials to the extent of Rs. 18,00,000 per annum forthe manufacture of its products to meet its sales demand.
a) Calculate the product mix which will give the maximum overall profits keeping theshort supply of raw materials.
b) Compute the maximum profit.
[Answer : (a) Product mix of X, Y and Z are 10,000, 25,000 and 10,000 unitsrespectively; (b) Profit Rs. 95,000 ]
15.13 FURTHER READINGSKishore, Ravi M., Management Accounting with Problems and Solutions, TaxmannAllied Services Pvt. Ltd. New Delhi, 2000.
Horngren, C.T., Gary L. Sundem and Frank H. Selto, “Management Accounting”,Prentice Hall of India, New Delhi, 1994.
Kaplan, R.S., “Advanced Management Accounting”, Engle Wood Cliffs, NJ.,Prentice Hall Inc.
Note : These questions will help you to understand the unit better. Try to writeanswers for them. But do not submit your answers to the University.These are for your practice only.
UNIT 16 BREAK EVEN ANALYSISStructure16.0 Objectives
16.1 Introduction
16.2 Break Even Analysis
16.3 Break Even Point
16.4 Impact of Changes in Sales Price, Volume, Variable Costs and Fixed Costson Profits
16.5 Required Sales for Desired Profit
16.6 Sales Volume Required to Earn a Desired Profit Per Unit
16.7 Sales Required to Maintain Present Profit
16.8 Margin of Safety
16.9 Angle of Incidence
16.10 Break Even Charts
16.11 Profit Volume Graph
16.12 Assumption in Break Even Analysis
16.13 Let Us Sum Up
16.14 Key Words
16.15 Answers to Check Your Progress
16.16 Terminal Questions
16.17 Further Readings
16.0 OBJECTIVESAfter studying this unit you should be able to:
l understand the concept of break even analysis, impact of change in salesvolume, price, variable cost, fixed costs on profits;
l apply cost-volume profit relationship for profit planning;
l understand the concept of margin of safety, angle of incidence, and profitvolume ratio in decision making; and
l examine the assumptions and limitations of the break even analysis
16.1 INTRODUCTIONIn this unit you will learn about the concept of break-event point and finding out ofbreak even point through mathematical equation and graphic representation Youwill be acquainted with the relationship between Cost, Volume and Profit and itsimpact on planning and evaluation of business operations. You will also study theconcepts of margin of safety, angle of incidence, limiting factor and profit volumeratio in decision making. The unit also deals with the underlying assumptions ofbreak even analysis.32
Break Even Analysis
33
16.2 BREAK EVEN ANALYSISThe analysis of cost behaviour is necessary for planning, control and decision making.Analysis of cost behaviour means analysis of variability of each cost element inrelation to the level of output. Every cost follows some definite behaviour pattern. Forexample total variable costs varies in direct proportion to the volume of output but perunit variable cost remains same. Examples of such costs are direct material, directlabour, packaging expenses, selling commission etc. These costs are called productcosts and are controllable, as they incur only when production takes place. Whereasfixed costs remains same irrespective to the level of output but per unit fixed cost goeson decreasing with the increasing level of out put as fixed cost scattered over a largenumber of units. Examples of such expenses are rent, rates and insurance, executives’salary, audit fees etc. These costs are also called period costs and are uncontrollable.The mixed costs or semi-variable costs have both the elements variable and fixed.These costs also change in the same direction in which volume of output changes butthis change is less than proportionate change in output. Examples of such costs arepower, telephone, depreciation, etc. Thus the concept of break even analysis is alogical extension of marginal costing. It is based on the same principle of classifyingthe costs into fixed and variable.
Semi-variable costs are segregated in fixed and variable components as discussed inthe earlier chapter. Fixed component is added in fixed costs and variable componentwith variable cost. Thus the costs are classified into two water tight compartments i.e.fixed and variable.
The cost behaviour play a significant role in decision making. The relationships involume, cost and profit shows that if volume increase by 10 per cent (say), then costwill not increase by 10 per cent. Because only variable cost will increase and fixedcosts remain same and unit fixed cost declines. Consequently, profit will not increaseby 10 per cent but more than that and vice versa. The level of production changesdue to many reasons, such as recession or boom, competition, introduction of newproduct, increase in demand, scarce raw material etc. The management wants toknow the effect of these changes on profit. The break-even analysis helps themanagement in decision making in these situations.
The study of cost-volume-profit relationship is some time called as “break evenanalysis.” In the opinion of some, it is a misnomer as break even analysis depicts apoint where costs and total sales revenue is same. Beyond this point, it is called cost-volume-profit relationship. Some hold the view, that break even analysis can beinterpreted in two senses – narrow and broad sense. In narrow sense, it refers todetermine the level of output where total costs equal to total revenue i.e. no profit, noloss. In the broad sense, it is used to determine the probable profit at any level ofoutput.
16.3 BREAK EVEN POINT
It is a point where sales revenue equals the costs to make and sell the product and noprofit or loss is reported. In the words of Keller and Ferrara, “the break even point ofa company or a unit of a company is the level of sales income which will equal to thesum of its fixed costs and variable costs.” Charles T. Horngren define it, “the breakeven point is that point of activity (sales volume) where total revenues and totalexpenses are equal, it is the point of zero profit and zero loss.”
There are two methods of calculating break even point. Mathematical method andGraphical method.
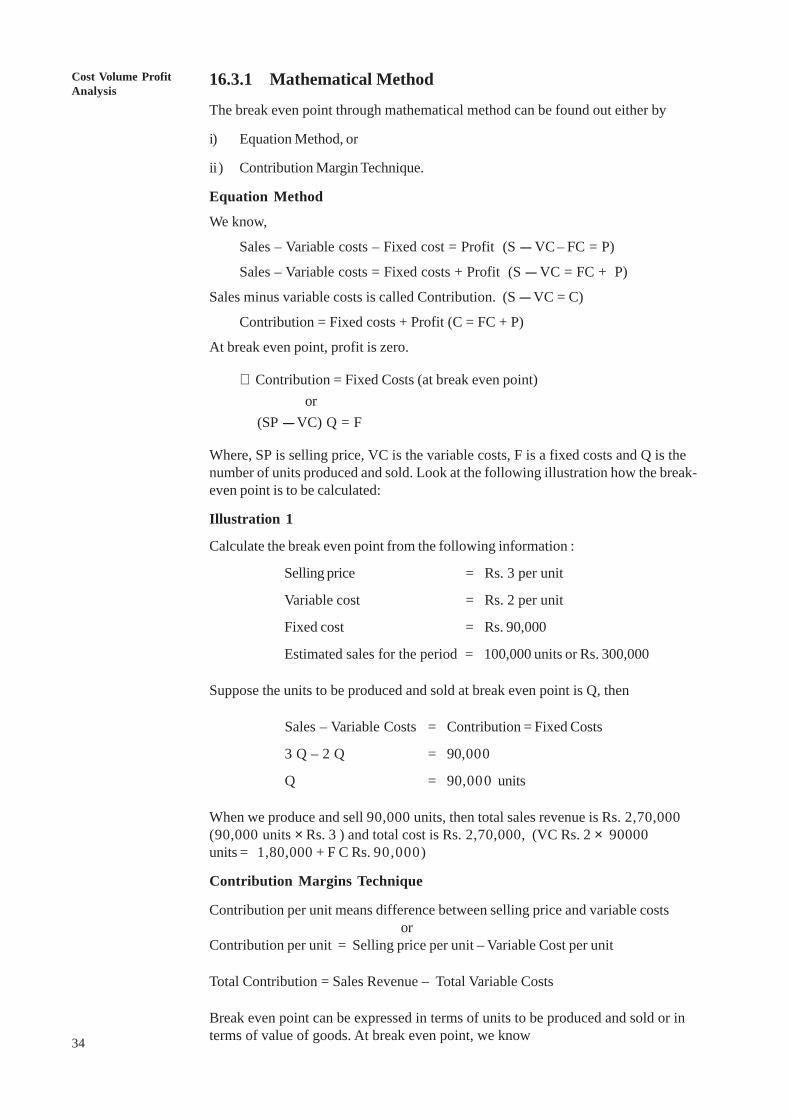
34
Cost Volume ProfitAnalysis
16.3.1 Mathematical Method
The break even point through mathematical method can be found out either by
i) Equation Method, or
ii ) Contribution Margin Technique.
Equation Method
We know,
Sales – Variable costs – Fixed cost = Profit (S --- VC – FC = P)
Sales – Variable costs = Fixed costs + Profit (S --- VC = FC + P)
Sales minus variable costs is called Contribution. (S --- VC = C)
Contribution = Fixed costs + Profit (C = FC + P)
At break even point, profit is zero.
∴ Contribution = Fixed Costs (at break even point)or
(SP ---- VC) Q = F
Where, SP is selling price, VC is the variable costs, F is a fixed costs and Q is thenumber of units produced and sold. Look at the following illustration how the break-even point is to be calculated:
Illustration 1
Calculate the break even point from the following information :
Selling price = Rs. 3 per unit
Variable cost = Rs. 2 per unit
Fixed cost = Rs. 90,000
Estimated sales for the period = 100,000 units or Rs. 300,000
Suppose the units to be produced and sold at break even point is Q, then
Sales – Variable Costs = Contribution = Fixed Costs
3 Q – 2 Q = 90,000
Q = 90,000 units
When we produce and sell 90,000 units, then total sales revenue is Rs. 2,70,000(90,000 units × Rs. 3 ) and total cost is Rs. 2,70,000, (VC Rs. 2 × 90000units = 1,80,000 + F C Rs. 90,000)
Contribution Margins Technique
Contribution per unit means difference between selling price and variable costsor
Contribution per unit = Selling price per unit – Variable Cost per unit
Total Contribution = Sales Revenue – Total Variable Costs
Break even point can be expressed in terms of units to be produced and sold or interms of value of goods. At break even point, we know
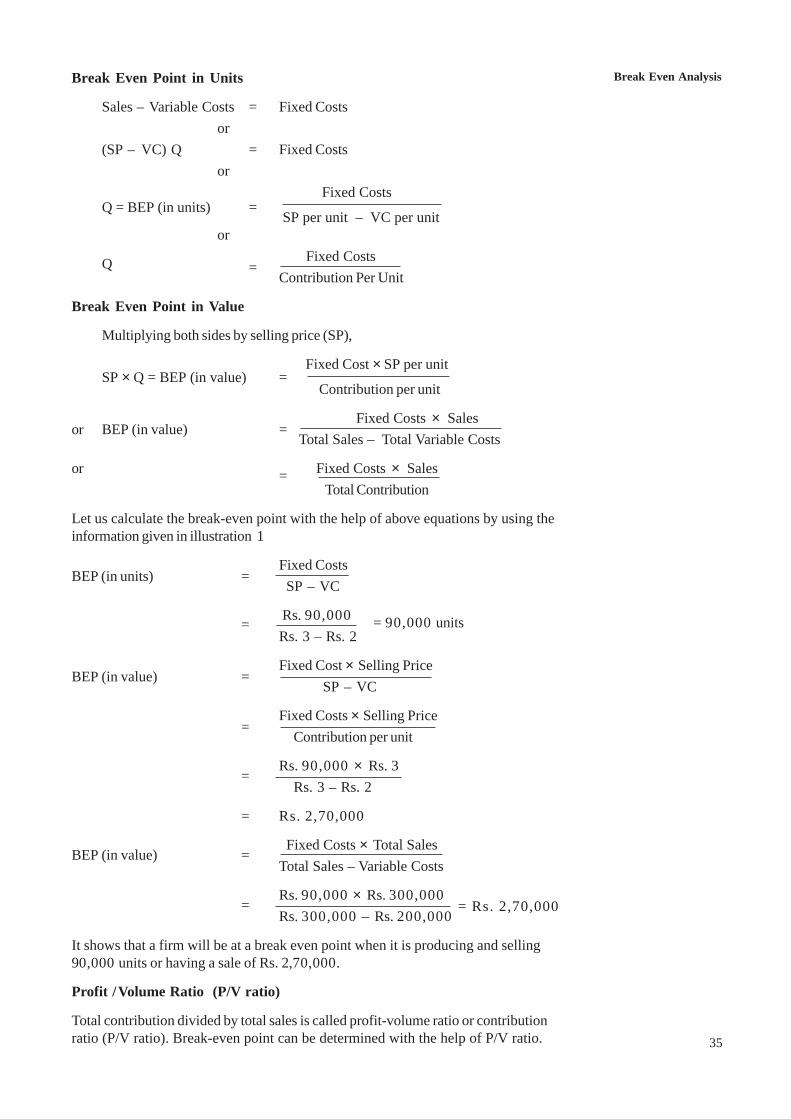
Break Even Analysis
35
Break Even Point in Units
Sales – Variable Costs = Fixed Costs or(SP – VC) Q = Fixed Costs or
Q = BEP (in units) = Fixed Costs SP per unit – VC per unit
or
Q = Fixed CostsContribution Per Unit
Break Even Point in Value
Multiplying both sides by selling price (SP),
SP × Q = BEP (in value) =Fixed Cost × SP per unit
Contribution per unit
or BEP (in value) = Fixed Costs × Sales
Total Sales – Total Variable Costs
or = Fixed Costs × SalesTotal Contribution
Let us calculate the break-even point with the help of above equations by using theinformation given in illustration 1
BEP (in units) =Fixed CostsSP – VC
= Rs. 90,000 = 90,000 unitsRs. 3 – Rs. 2
BEP (in value) =Fixed Cost × Selling Price
SP – VC
=Fixed Costs × Selling Price
Contribution per unit
=Rs. 90,000 × Rs. 3
Rs. 3 – Rs. 2
= Rs. 2,70,000
BEP (in value) =Fixed Costs × Total Sales
Total Sales – Variable Costs
=Rs. 90,000 × Rs. 300,000 = Rs. 2,70,000Rs. 300,000 – Rs. 200,000
It shows that a firm will be at a break even point when it is producing and selling90,000 units or having a sale of Rs. 2,70,000.
Profit /Volume Ratio (P/V ratio)
Total contribution divided by total sales is called profit-volume ratio or contributionratio (P/V ratio). Break-even point can be determined with the help of P/V ratio.
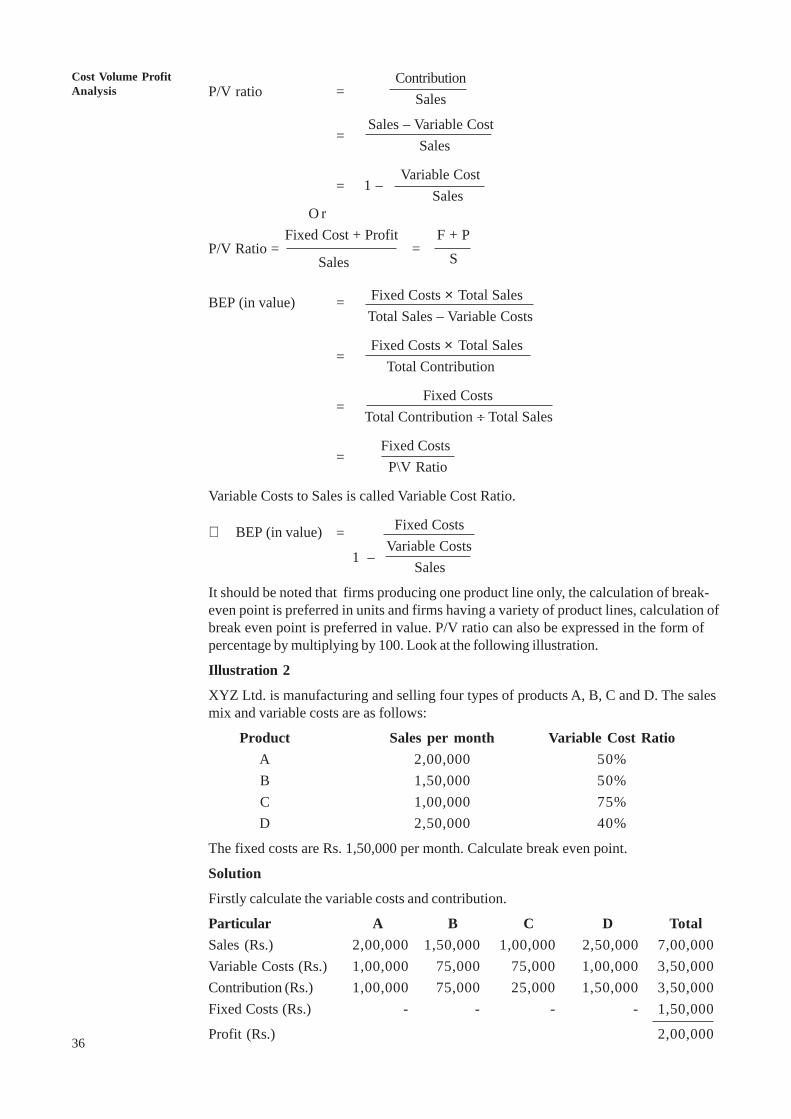
36
Cost Volume ProfitAnalysis P/V ratio =
ContributionSales
=Sales – Variable Cost
Sales
= Variable Cost
Sales O r
Fixed Cost + Profit F + PP/V Ratio = =
Sales S
BEP (in value) = Fixed Costs × Total Sales Total Sales – Variable Costs
= Fixed Costs × Total Sales Total Contribution
= Fixed Costs
Total Contribution ÷ Total Sales
= Fixed Costs
P\V Ratio
Variable Costs to Sales is called Variable Cost Ratio.
∴ BEP (in value) Fixed Costs=
1 – Variable Costs Sales
It should be noted that firms producing one product line only, the calculation of break-even point is preferred in units and firms having a variety of product lines, calculation ofbreak even point is preferred in value. P/V ratio can also be expressed in the form ofpercentage by multiplying by 100. Look at the following illustration.
Illustration 2
XYZ Ltd. is manufacturing and selling four types of products A, B, C and D. The salesmix and variable costs are as follows:
Product Sales per month Variable Cost RatioA 2,00,000 50%B 1,50,000 50%C 1,00,000 75%D 2,50,000 40%
The fixed costs are Rs. 1,50,000 per month. Calculate break even point.
Solution
Firstly calculate the variable costs and contribution.
Particular A B C D TotalSales (Rs.) 2,00,000 1,50,000 1,00,000 2,50,000 7,00,000Variable Costs (Rs.) 1,00,000 75,000 75,000 1,00,000 3,50,000Contribution (Rs.) 1,00,000 75,000 25,000 1,50,000 3,50,000Fixed Costs (Rs.) - - - - 1,50,000
Profit (Rs.) 2,00,000
1 –
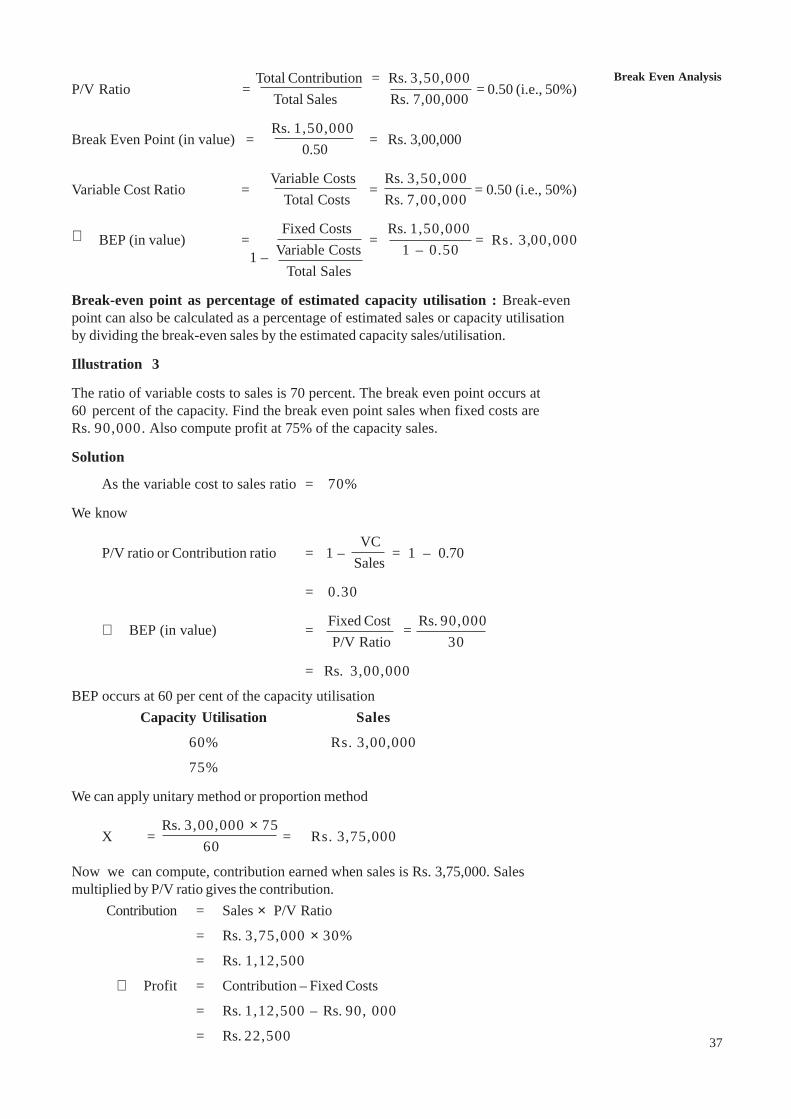
Break Even Analysis
37
P/V Ratio = Total Contribution = Rs. 3,50,000
= 0.50 (i.e., 50%)Total Sales Rs. 7,00,000
Break Even Point (in value) = Rs. 1,50,000
= Rs. 3,00,000 0.50
Variable Cost Ratio = Variable Costs
= Rs. 3,50,000
= 0.50 (i.e., 50%) Total Costs Rs. 7,00,000
∴ BEP (in value) = Fixed Costs
= Rs. 1,50,000
= Rs. 3,00,0001 – Variable Costs 1 – 0.50
Total Sales
Break-even point as percentage of estimated capacity utilisation : Break-evenpoint can also be calculated as a percentage of estimated sales or capacity utilisationby dividing the break-even sales by the estimated capacity sales/utilisation.
Illustration 3
The ratio of variable costs to sales is 70 percent. The break even point occurs at60 percent of the capacity. Find the break even point sales when fixed costs areRs. 90,000. Also compute profit at 75% of the capacity sales.
Solution
As the variable cost to sales ratio = 70%
We know
P/V ratio or Contribution ratio = 1 – VC= 1 – 0.70
Sales
= 0.30
∴ BEP (in value) = Fixed Cost = Rs. 90,000 P/V Ratio 30
= Rs. 3,00,000
BEP occurs at 60 per cent of the capacity utilisationCapacity Utilisation Sales
60% Rs. 3,00,000
75%
We can apply unitary method or proportion method
X = Rs. 3,00,000 × 75
= Rs. 3,75,000 60
Now we can compute, contribution earned when sales is Rs. 3,75,000. Salesmultiplied by P/V ratio gives the contribution.
Contribution = Sales × P/V Ratio
= Rs. 3,75,000 × 30%
= Rs. 1,12,500
∴ Profit = Contribution – Fixed Costs
= Rs. 1,12,500 – Rs. 90, 000
= Rs. 22,500
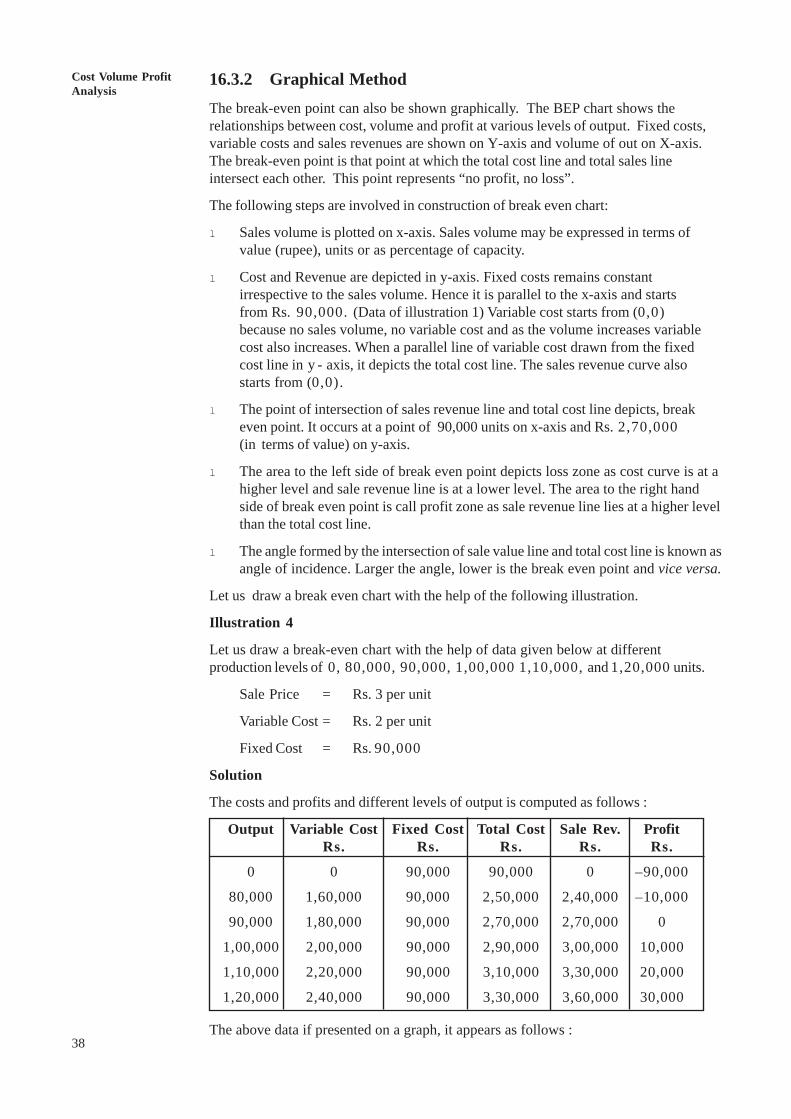
38
Cost Volume ProfitAnalysis
16.3.2 Graphical MethodThe break-even point can also be shown graphically. The BEP chart shows therelationships between cost, volume and profit at various levels of output. Fixed costs,variable costs and sales revenues are shown on Y-axis and volume of out on X-axis.The break-even point is that point at which the total cost line and total sales lineintersect each other. This point represents “no profit, no loss”.
The following steps are involved in construction of break even chart:
l Sales volume is plotted on x-axis. Sales volume may be expressed in terms ofvalue (rupee), units or as percentage of capacity.
l Cost and Revenue are depicted in y-axis. Fixed costs remains constantirrespective to the sales volume. Hence it is parallel to the x-axis and startsfrom Rs. 90,000. (Data of illustration 1) Variable cost starts from (0,0)because no sales volume, no variable cost and as the volume increases variablecost also increases. When a parallel line of variable cost drawn from the fixedcost line in y - axis, it depicts the total cost line. The sales revenue curve alsostarts from (0,0).
l The point of intersection of sales revenue line and total cost line depicts, breakeven point. It occurs at a point of 90,000 units on x-axis and Rs. 2,70,000(in terms of value) on y-axis.
l The area to the left side of break even point depicts loss zone as cost curve is at ahigher level and sale revenue line is at a lower level. The area to the right handside of break even point is call profit zone as sale revenue line lies at a higher levelthan the total cost line.
l The angle formed by the intersection of sale value line and total cost line is known asangle of incidence. Larger the angle, lower is the break even point and vice versa.
Let us draw a break even chart with the help of the following illustration.
Illustration 4
Let us draw a break-even chart with the help of data given below at differentproduction levels of 0, 80,000, 90,000, 1,00,000 1,10,000, and 1,20,000 units.
Sale Price = Rs. 3 per unit
Variable Cost = Rs. 2 per unit
Fixed Cost = Rs. 90,000
Solution
The costs and profits and different levels of output is computed as follows :
Output Variable Cost Fixed Cost Total Cost Sale Rev. ProfitRs. Rs. Rs. Rs. Rs.
0 0 90,000 90,000 0 –90,000
80,000 1,60,000 90,000 2,50,000 2,40,000 –10,000
90,000 1,80,000 90,000 2,70,000 2,70,000 0
1,00,000 2,00,000 90,000 2,90,000 3,00,000 10,000
1,10,000 2,20,000 90,000 3,10,000 3,30,000 20,000
1,20,000 2,40,000 90,000 3,30,000 3,60,000 30,000
The above data if presented on a graph, it appears as follows :
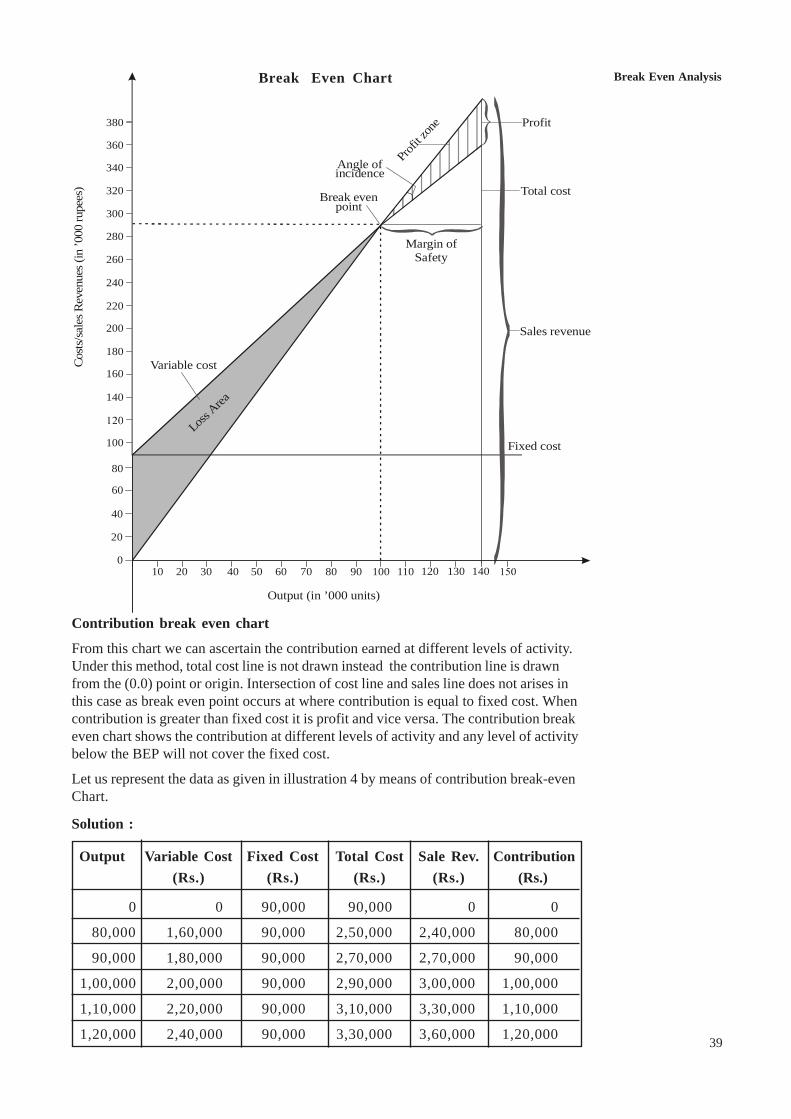
Break Even Analysis
39
Break Even Chart
Contribution break even chart
From this chart we can ascertain the contribution earned at different levels of activity.Under this method, total cost line is not drawn instead the contribution line is drawnfrom the (0.0) point or origin. Intersection of cost line and sales line does not arises inthis case as break even point occurs at where contribution is equal to fixed cost. Whencontribution is greater than fixed cost it is profit and vice versa. The contribution breakeven chart shows the contribution at different levels of activity and any level of activitybelow the BEP will not cover the fixed cost.
Let us represent the data as given in illustration 4 by means of contribution break-evenChart.
Solution :
Output Variable Cost Fixed Cost Total Cost Sale Rev. Contribution(Rs.) (Rs.) (Rs.) (Rs.) (Rs.)
0 0 90,000 90,000 0 0
80,000 1,60,000 90,000 2,50,000 2,40,000 80,000
90,000 1,80,000 90,000 2,70,000 2,70,000 90,000
1,00,000 2,00,000 90,000 2,90,000 3,00,000 1,00,000
1,10,000 2,20,000 90,000 3,10,000 3,30,000 1,10,000
1,20,000 2,40,000 90,000 3,30,000 3,60,000 1,20,000
Break even point
Angle of incidence
Profit
zone
Margin ofSafety
Loss A
rea
Variable cost
Profit
Total cost
Sales revenue
Fixed cost100
140
160
180
200
220
240
260
280
300
320
340
360
380
80
Cost
s/sa
les R
even
ues (
in ’0
00 ru
pees
)
60
40
20
0
Output (in ’000 units)
10 20 30 40 50 60 70 80 90 100 110 120 130 140
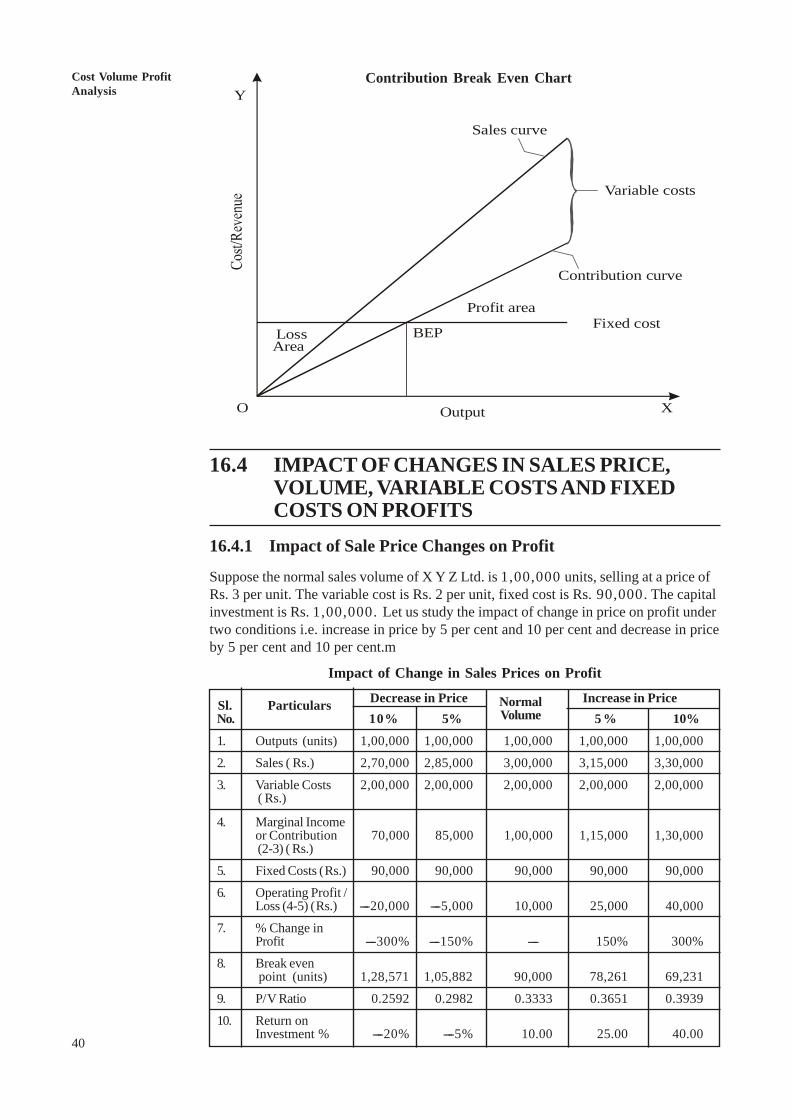
40
Cost Volume ProfitAnalysis
Contribution Break Even Chart
16.4 IMPACT OF CHANGES IN SALES PRICE,VOLUME, VARIABLE COSTS AND FIXEDCOSTS ON PROFITS
16.4.1 Impact of Sale Price Changes on Profit
Suppose the normal sales volume of X Y Z Ltd. is 1,00,000 units, selling at a price ofRs. 3 per unit. The variable cost is Rs. 2 per unit, fixed cost is Rs. 90,000. The capitalinvestment is Rs. 1,00,000. Let us study the impact of change in price on profit undertwo conditions i.e. increase in price by 5 per cent and 10 per cent and decrease in priceby 5 per cent and 10 per cent.m
Impact of Change in Sales Prices on Profit
Sl. Particulars Decrease in Price Normal Increase in PriceNo. 10% 5% Volume 5 % 10%1. Outputs (units) 1,00,000 1,00,000 1,00,000 1,00,000 1,00,000
2. Sales ( Rs.) 2,70,000 2,85,000 3,00,000 3,15,000 3,30,000
3. Variable Costs 2,00,000 2,00,000 2,00,000 2,00,000 2,00,000 ( Rs.)
4. Marginal Incomeor Contribution 70,000 85,000 1,00,000 1,15,000 1,30,000 (2-3) ( Rs.)
5. Fixed Costs (Rs.) 90,000 90,000 90,000 90,000 90,000
6. Operating Profit /Loss (4-5) (Rs.) ----20,000 ----5,000 10,000 25,000 40,000
7. % Change inProfit ----300% ----150% ---- 150% 300%
8. Break even point (units) 1,28,571 1,05,882 90,000 78,261 69,231
9. P/V Ratio 0.2592 0.2982 0.3333 0.3651 0.3939
10. Return onInvestment % ----20% ----5% 10.00 25.00 40.00
XO
Y
Sales curve
Variable costs
Contribution curve
Profit areaFixed cost
BEPLossArea
Output
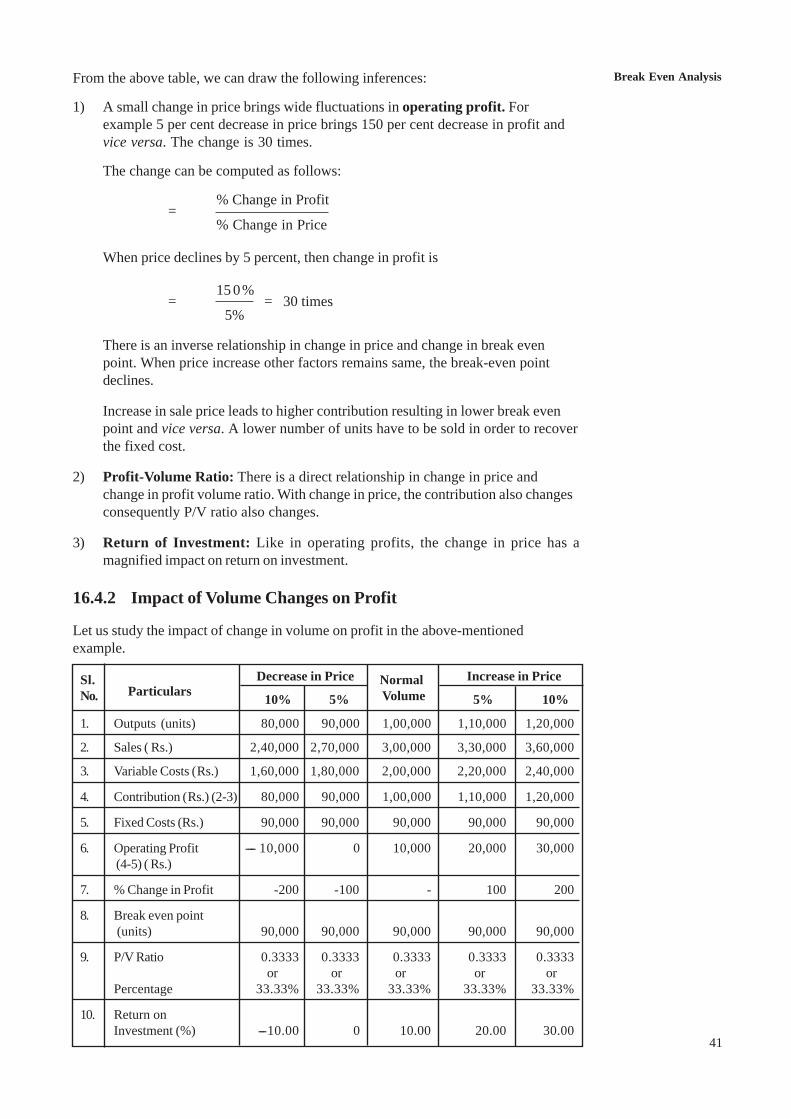
Break Even Analysis
41
From the above table, we can draw the following inferences:
1) A small change in price brings wide fluctuations in operating profit. Forexample 5 per cent decrease in price brings 150 per cent decrease in profit andvice versa. The change is 30 times.
The change can be computed as follows:
=% Change in Profit
% Change in Price
When price declines by 5 percent, then change in profit is
=
15 0%= 30 times
5%
There is an inverse relationship in change in price and change in break evenpoint. When price increase other factors remains same, the break-even pointdeclines.
Increase in sale price leads to higher contribution resulting in lower break evenpoint and vice versa. A lower number of units have to be sold in order to recoverthe fixed cost.
2) Profit-Volume Ratio: There is a direct relationship in change in price andchange in profit volume ratio. With change in price, the contribution also changesconsequently P/V ratio also changes.
3) Return of Investment: Like in operating profits, the change in price has amagnified impact on return on investment.
16.4.2 Impact of Volume Changes on Profit
Let us study the impact of change in volume on profit in the above-mentionedexample.
Sl. Particulars
Decrease in Price Normal Increase in PriceNo. 10% 5% Volume 5% 10%
1. Outputs (units) 80,000 90,000 1,00,000 1,10,000 1,20,000
2. Sales ( Rs.) 2,40,000 2,70,000 3,00,000 3,30,000 3,60,000
3. Variable Costs ( Rs.) 1,60,000 1,80,000 2,00,000 2,20,000 2,40,000
4. Contribution ( Rs.) (2-3) 80,000 90,000 1,00,000 1,10,000 1,20,000
5. Fixed Costs (Rs.) 90,000 90,000 90,000 90,000 90,000
6. Operating Profit ---- 10,000 0 10,000 20,000 30,000 (4-5) ( Rs.)
7. % Change in Profit -200 -100 - 100 200
8. Break even point (units) 90,000 90,000 90,000 90,000 90,000
9. P/V Ratio 0.3333 0.3333 0.3333 0.3333 0.3333or or or or or
Percentage 33.33% 33.33% 33.33% 33.33% 33.33%
10. Return onInvestment (%) ---10.00 0 10.00 20.00 30.00
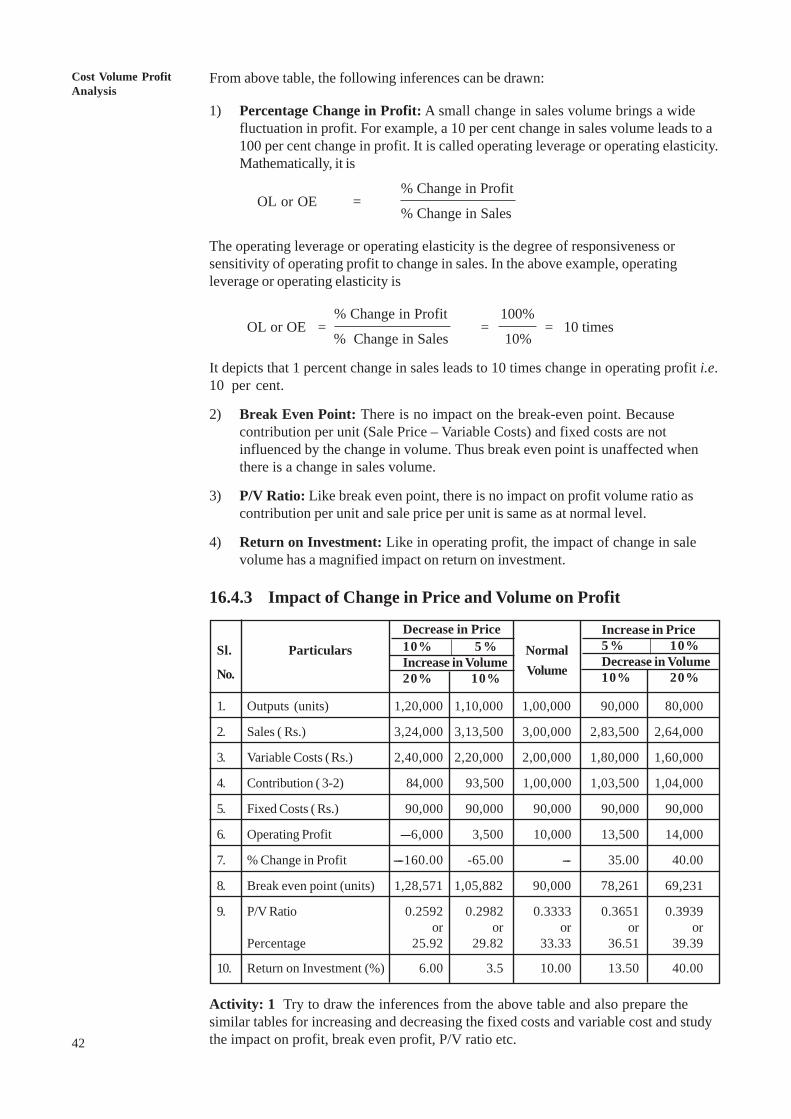
42
Cost Volume ProfitAnalysis
From above table, the following inferences can be drawn:
1) Percentage Change in Profit: A small change in sales volume brings a widefluctuation in profit. For example, a 10 per cent change in sales volume leads to a100 per cent change in profit. It is called operating leverage or operating elasticity.Mathematically, it is
OL or OE =% Change in Profit
% Change in Sales
The operating leverage or operating elasticity is the degree of responsiveness orsensitivity of operating profit to change in sales. In the above example, operatingleverage or operating elasticity is
OL or OE = % Change in Profit
= 100%
= 10 times% Change in Sales 10%
It depicts that 1 percent change in sales leads to 10 times change in operating profit i.e.10 per cent.
2) Break Even Point: There is no impact on the break-even point. Becausecontribution per unit (Sale Price – Variable Costs) and fixed costs are notinfluenced by the change in volume. Thus break even point is unaffected whenthere is a change in sales volume.
3) P/V Ratio: Like break even point, there is no impact on profit volume ratio ascontribution per unit and sale price per unit is same as at normal level.
4) Return on Investment: Like in operating profit, the impact of change in salevolume has a magnified impact on return on investment.
16.4.3 Impact of Change in Price and Volume on Profit
Sl. Particulars Normal
No. Volume
1. Outputs (units) 1,20,000 1,10,000 1,00,000 90,000 80,000
2. Sales ( Rs.) 3,24,000 3,13,500 3,00,000 2,83,500 2,64,000
3. Variable Costs (Rs.) 2,40,000 2,20,000 2,00,000 1,80,000 1,60,000
4. Contribution ( 3-2) 84,000 93,500 1,00,000 1,03,500 1,04,000
5. Fixed Costs ( Rs.) 90,000 90,000 90,000 90,000 90,000
6. Operating Profit ----6,000 3,500 10,000 13,500 14,000
7. % Change in Profit ----160.00 -65.00 --- 35.00 40.00
8. Break even point (units) 1,28,571 1,05,882 90,000 78,261 69,231
9. P/V Ratio 0.2592 0.2982 0.3333 0.3651 0.3939or or or or or
Percentage 25.92 29.82 33.33 36.51 39.39
10. Return on Investment (%) 6.00 3.5 10.00 13.50 40.00
Activity: 1 Try to draw the inferences from the above table and also prepare thesimilar tables for increasing and decreasing the fixed costs and variable cost and studythe impact on profit, break even profit, P/V ratio etc.
Increase in Price5 % 10%Decrease in Volume10% 20%
Decrease in Price10% 5 %Increase in Volume20% 10%
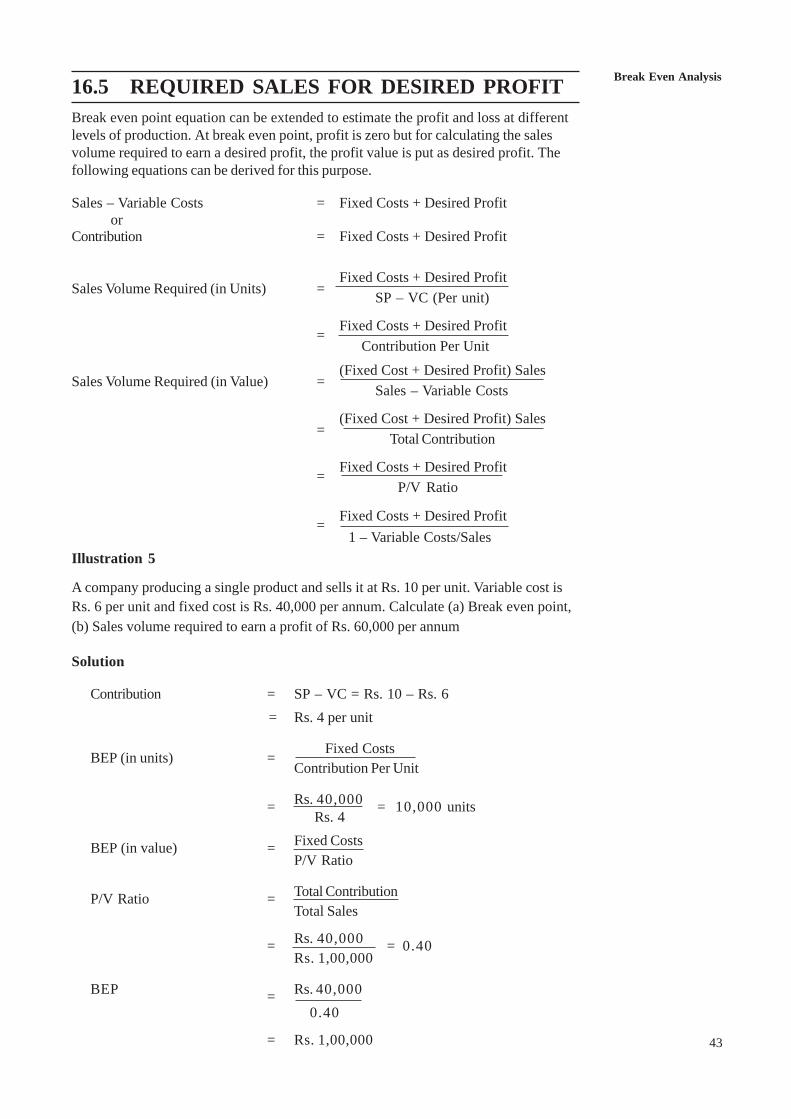
Break Even Analysis
43
16.5 REQUIRED SALES FOR DESIRED PROFITBreak even point equation can be extended to estimate the profit and loss at differentlevels of production. At break even point, profit is zero but for calculating the salesvolume required to earn a desired profit, the profit value is put as desired profit. Thefollowing equations can be derived for this purpose.
Sales – Variable Costs = Fixed Costs + Desired Profit or
Contribution = Fixed Costs + Desired Profit
Sales Volume Required (in Units) =Fixed Costs + Desired Profit
SP – VC (Per unit)
= Fixed Costs + Desired Profit Contribution Per Unit
Sales Volume Required (in Value) =(Fixed Cost + Desired Profit) Sales
Sales – Variable Costs
=(Fixed Cost + Desired Profit) Sales
Total Contribution
= Fixed Costs + Desired ProfitP/V Ratio
= Fixed Costs + Desired Profit 1 – Variable Costs/Sales
Illustration 5
A company producing a single product and sells it at Rs. 10 per unit. Variable cost isRs. 6 per unit and fixed cost is Rs. 40,000 per annum. Calculate (a) Break even point,(b) Sales volume required to earn a profit of Rs. 60,000 per annum
Solution
Contribution = SP – VC = Rs. 10 – Rs. 6 = Rs. 4 per unit
BEP (in units) = Fixed CostsContribution Per Unit
= Rs. 40,000 = 10,000 units Rs. 4
BEP (in value) = Fixed CostsP/V Ratio
P/V Ratio = Total ContributionTotal Sales
= Rs. 40,000 = 0.40Rs. 1,00,000
BEP = Rs. 40,000 0.40
= Rs. 1,00,000
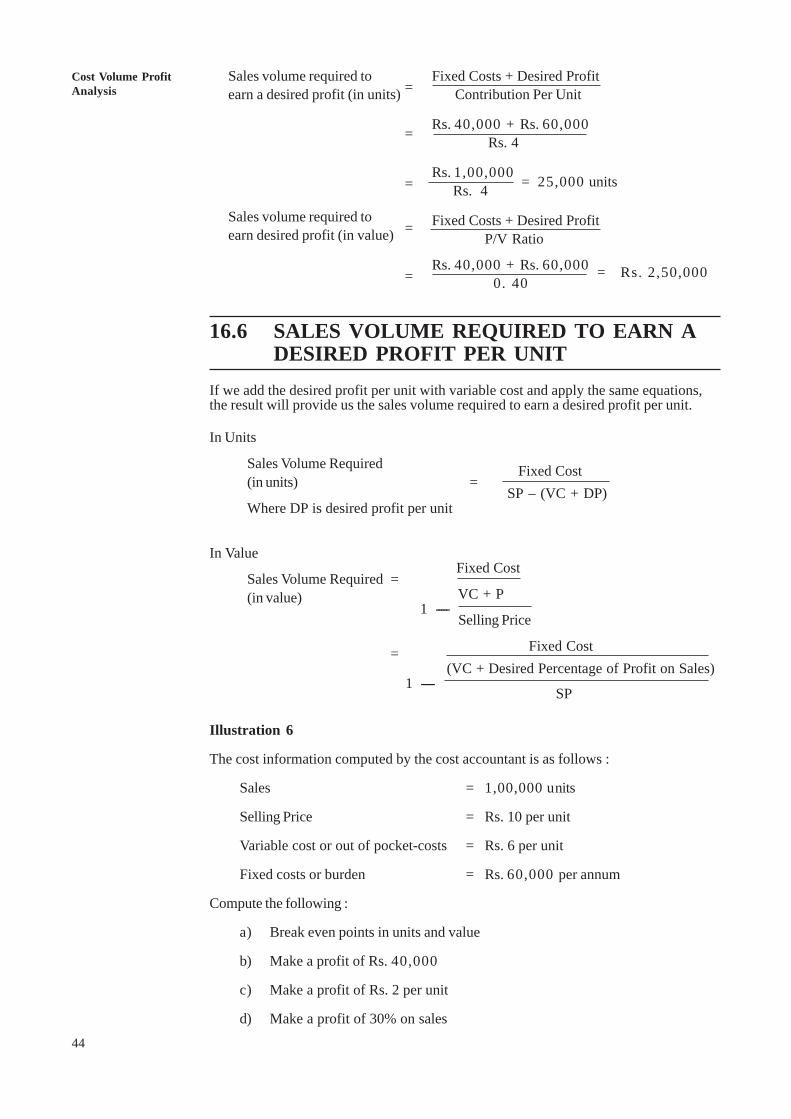
44
Cost Volume ProfitAnalysis
Sales volume required to=
Fixed Costs + Desired Profitearn a desired profit (in units) Contribution Per Unit
= Rs. 40,000 + Rs. 60,000 Rs. 4
=Rs. 1,00,000 = 25,000 units Rs. 4
Sales volume required to= Fixed Costs + Desired Profit
earn desired profit (in value) P/V Ratio
=Rs. 40,000 + Rs. 60,000 = Rs. 2,50,000 0. 40
16.6 SALES VOLUME REQUIRED TO EARN ADESIRED PROFIT PER UNIT
If we add the desired profit per unit with variable cost and apply the same equations,the result will provide us the sales volume required to earn a desired profit per unit.
In Units
Sales Volume Required=
Fixed Cost(in units)
SP – (VC + DP)Where DP is desired profit per unit
In Value
Sales Volume Required = Fixed Cost
(in value) VC + P1 -----
Selling Price
= Fixed Cost (VC + Desired Percentage of Profit on Sales)1 -----
SP
Illustration 6
The cost information computed by the cost accountant is as follows :
Sales = 1,00,000 units
Selling Price = Rs. 10 per unit
Variable cost or out of pocket-costs = Rs. 6 per unit
Fixed costs or burden = Rs. 60,000 per annum
Compute the following :
a) Break even points in units and value
b) Make a profit of Rs. 40,000
c) Make a profit of Rs. 2 per unit
d) Make a profit of 30% on sales
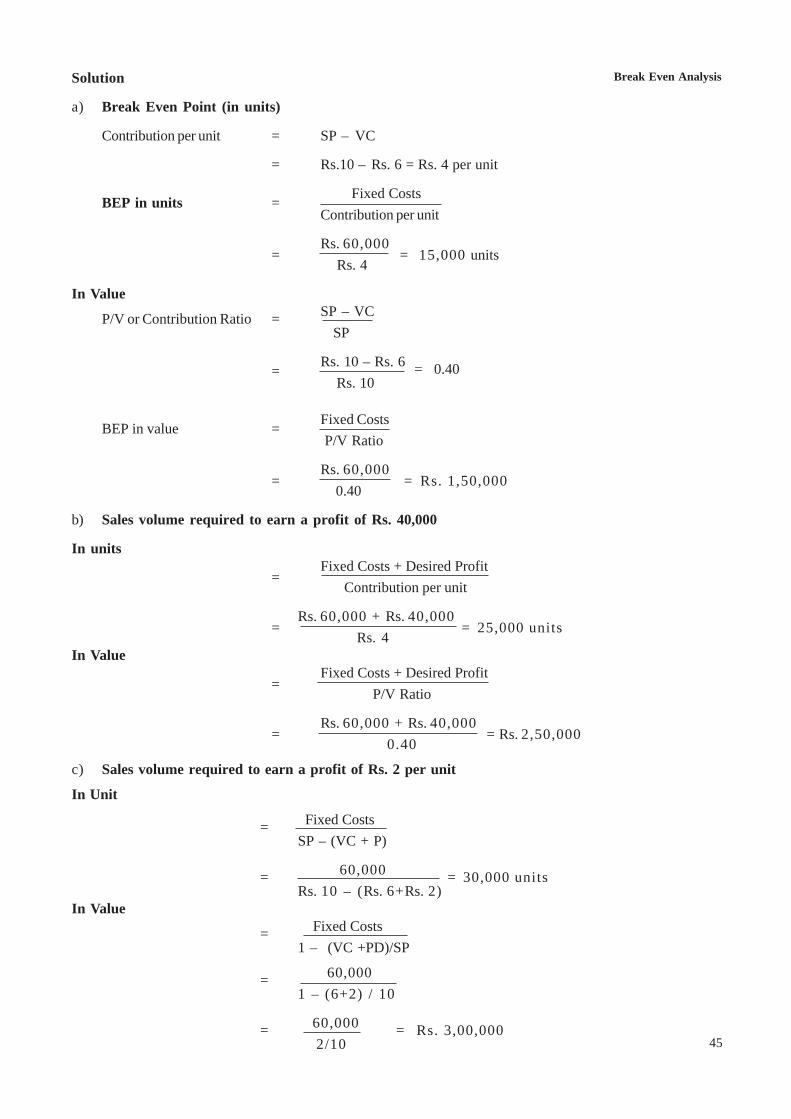
Break Even Analysis
45
Solution
a) Break Even Point (in units)
Contribution per unit = SP – VC
= Rs.10 – Rs. 6 = Rs. 4 per unit
BEP in units = Fixed CostsContribution per unit
=Rs. 60,000
= 15,000 units Rs. 4
In Value
P/V or Contribution Ratio = SP – VC SP
= Rs. 10 – Rs. 6 = 0.40 Rs. 10
BEP in value = Fixed Costs
P/V Ratio
=Rs. 60,000
= Rs. 1,50,000 0.40
b) Sales volume required to earn a profit of Rs. 40,000
In units
=Fixed Costs + Desired Profit Contribution per unit
=Rs. 60,000 + Rs. 40,000
= 25,000 unitsRs. 4
In Value
=Fixed Costs + Desired Profit P/V Ratio
=Rs. 60,000 + Rs. 40,000
= Rs. 2,50,000 0.40
c) Sales volume required to earn a profit of Rs. 2 per unit
In Unit
= Fixed CostsSP – (VC + P)
= 60,000 = 30,000 unitsRs. 10 – (Rs. 6+Rs. 2)
In Value
= Fixed Costs1 – (VC +PD)/SP
= 60,0001 – (6+2) / 10
= 60,000 = Rs. 3,00,000 2/10
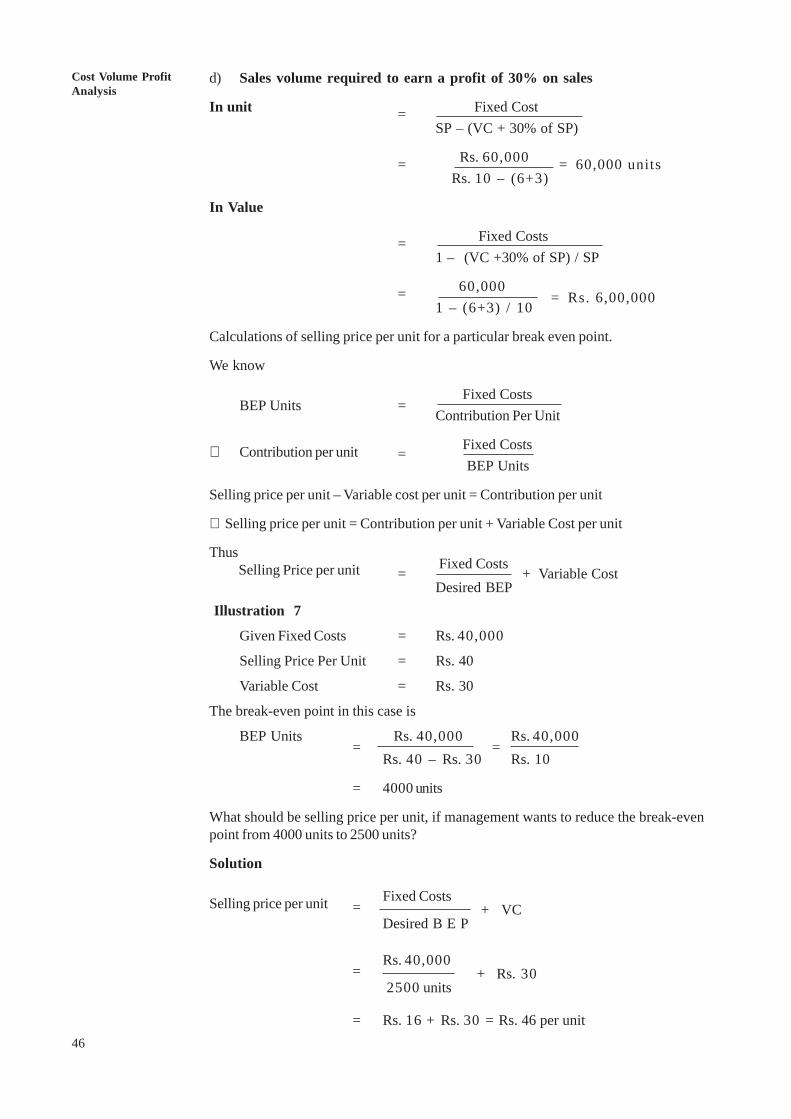
46
Cost Volume ProfitAnalysis
d) Sales volume required to earn a profit of 30% on sales
In unit = Fixed CostSP – (VC + 30% of SP)
= Rs. 60,000 = 60,000 units Rs. 10 – (6+3)
In Value
= Fixed Costs1 – (VC +30% of SP) / SP
= 60,000 = Rs. 6,00,000
1 – (6+3) / 10
Calculations of selling price per unit for a particular break even point.
We know
BEP Units = Fixed CostsContribution Per Unit
∴ Contribution per unit = Fixed Costs BEP Units
Selling price per unit – Variable cost per unit = Contribution per unit
∴ Selling price per unit = Contribution per unit + Variable Cost per unit
Thus Fixed CostsSelling Price per unit = + Variable CostDesired BEP
Illustration 7
Given Fixed Costs = Rs. 40,000
Selling Price Per Unit = Rs. 40
Variable Cost = Rs. 30
The break-even point in this case is
BEP Units=
Rs. 40,000=
Rs. 40,000Rs. 40 – Rs. 30 Rs. 10
= 4000 units
What should be selling price per unit, if management wants to reduce the break-evenpoint from 4000 units to 2500 units?
Solution
Selling price per unit =Fixed Costs
+ VCDesired B E P
=Rs. 40,000
+ Rs. 30 2500 units
= Rs. 16 + Rs. 30 = Rs. 46 per unit
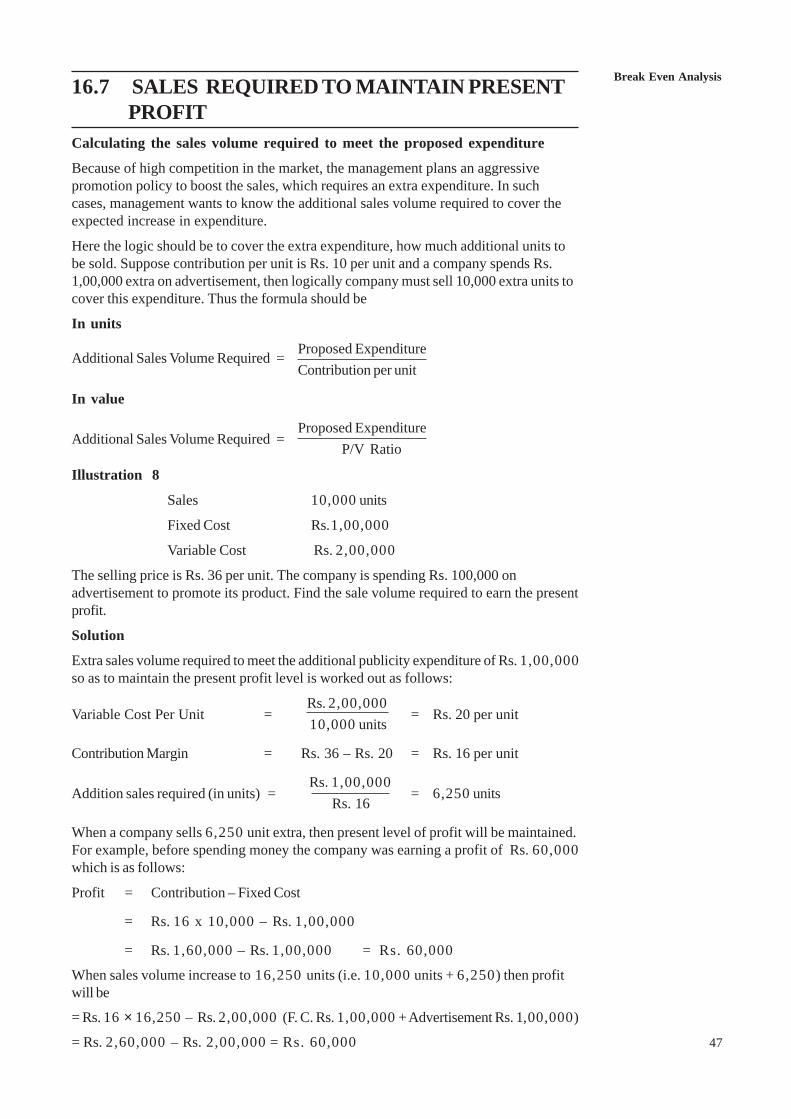
Break Even Analysis
47
16.7 SALES REQUIRED TO MAINTAIN PRESENTPROFIT
Calculating the sales volume required to meet the proposed expenditure
Because of high competition in the market, the management plans an aggressivepromotion policy to boost the sales, which requires an extra expenditure. In suchcases, management wants to know the additional sales volume required to cover theexpected increase in expenditure.
Here the logic should be to cover the extra expenditure, how much additional units tobe sold. Suppose contribution per unit is Rs. 10 per unit and a company spends Rs.1,00,000 extra on advertisement, then logically company must sell 10,000 extra units tocover this expenditure. Thus the formula should be
In units
Additional Sales Volume Required = Proposed ExpenditureContribution per unit
In value
Additional Sales Volume Required =Proposed Expenditure
P/V Ratio
Illustration 8
Sales 10,000 units
Fixed Cost Rs.1,00,000
Variable Cost Rs. 2,00,000
The selling price is Rs. 36 per unit. The company is spending Rs. 100,000 onadvertisement to promote its product. Find the sale volume required to earn the presentprofit.
Solution
Extra sales volume required to meet the additional publicity expenditure of Rs. 1,00,000so as to maintain the present profit level is worked out as follows:
Variable Cost Per Unit =Rs. 2,00,000
= Rs. 20 per unit 10,000 units
Contribution Margin = Rs. 36 – Rs. 20 = Rs. 16 per unit
Addition sales required (in units) = Rs. 1,00,000
= 6,250 units Rs. 16
When a company sells 6,250 unit extra, then present level of profit will be maintained.For example, before spending money the company was earning a profit of Rs. 60,000which is as follows:
Profit = Contribution – Fixed Cost
= Rs. 16 x 10,000 – Rs. 1,00,000
= Rs. 1,60,000 – Rs. 1,00,000 = Rs. 60,000
When sales volume increase to 16,250 units (i.e. 10,000 units + 6,250) then profitwill be
= Rs. 16 × 16,250 – Rs. 2,00,000 (F. C. Rs. 1,00,000 + Advertisement Rs. 1,00,000)
= Rs. 2,60,000 – Rs. 2,00,000 = Rs. 60,000
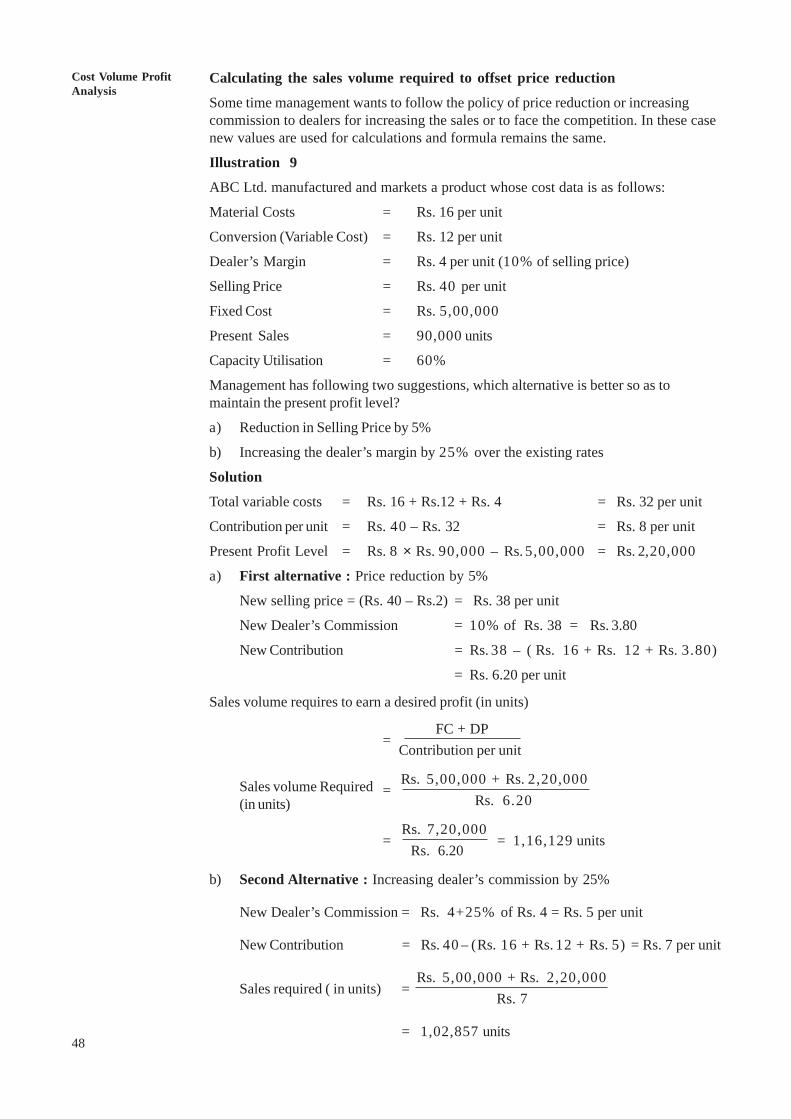
48
Cost Volume ProfitAnalysis
Calculating the sales volume required to offset price reduction
Some time management wants to follow the policy of price reduction or increasingcommission to dealers for increasing the sales or to face the competition. In these casenew values are used for calculations and formula remains the same.
Illustration 9
ABC Ltd. manufactured and markets a product whose cost data is as follows:
Material Costs = Rs. 16 per unit
Conversion (Variable Cost) = Rs. 12 per unit
Dealer’s Margin = Rs. 4 per unit (10% of selling price)
Selling Price = Rs. 40 per unit
Fixed Cost = Rs. 5,00,000
Present Sales = 90,000 units
Capacity Utilisation = 60%
Management has following two suggestions, which alternative is better so as tomaintain the present profit level?
a) Reduction in Selling Price by 5%
b) Increasing the dealer’s margin by 25% over the existing rates
Solution
Total variable costs = Rs. 16 + Rs.12 + Rs. 4 = Rs. 32 per unit
Contribution per unit = Rs. 40 – Rs. 32 = Rs. 8 per unit
Present Profit Level = Rs. 8 × Rs. 90,000 – Rs. 5,00,000 = Rs. 2,20,000
a) First alternative : Price reduction by 5%
New selling price = (Rs. 40 – Rs.2) = Rs. 38 per unit
New Dealer’s Commission = 10% of Rs. 38 = Rs. 3.80
New Contribution = Rs. 38 – ( Rs. 16 + Rs. 12 + Rs. 3.80)
= Rs. 6.20 per unit
Sales volume requires to earn a desired profit (in units)
= FC + DP
Contribution per unit
Sales volume Required = Rs. 5,00,000 + Rs. 2,20,000
(in units) Rs. 6.20
=Rs. 7,20,000 = 1,16,129 units
Rs. 6.20
b) Second Alternative : Increasing dealer’s commission by 25%
New Dealer’s Commission = Rs. 4+25% of Rs. 4 = Rs. 5 per unit
New Contribution = Rs. 40 – (Rs. 16 + Rs. 12 + Rs. 5) = Rs. 7 per unit
Sales required ( in units) =Rs. 5,00,000 + Rs. 2,20,000
Rs. 7
= 1,02,857 units
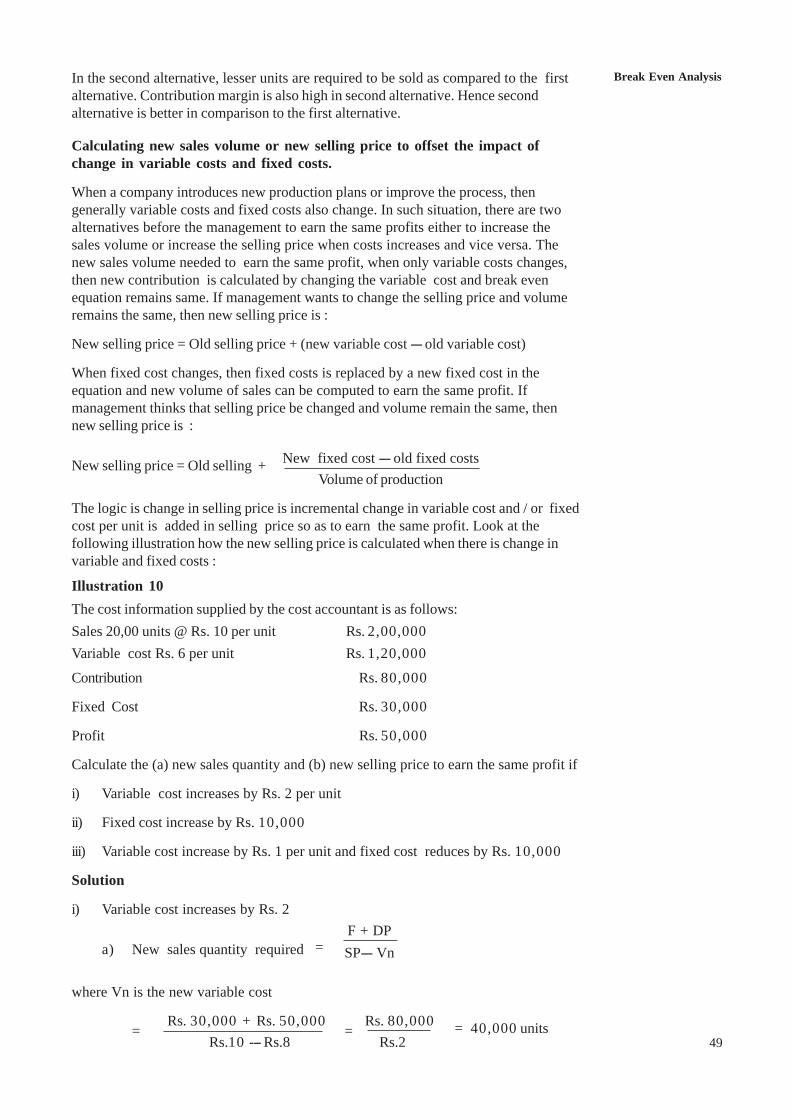
Break Even Analysis
49
In the second alternative, lesser units are required to be sold as compared to the firstalternative. Contribution margin is also high in second alternative. Hence secondalternative is better in comparison to the first alternative.
Calculating new sales volume or new selling price to offset the impact ofchange in variable costs and fixed costs.
When a company introduces new production plans or improve the process, thengenerally variable costs and fixed costs also change. In such situation, there are twoalternatives before the management to earn the same profits either to increase thesales volume or increase the selling price when costs increases and vice versa. Thenew sales volume needed to earn the same profit, when only variable costs changes,then new contribution is calculated by changing the variable cost and break evenequation remains same. If management wants to change the selling price and volumeremains the same, then new selling price is :
New selling price = Old selling price + (new variable cost --- old variable cost)
When fixed cost changes, then fixed costs is replaced by a new fixed cost in theequation and new volume of sales can be computed to earn the same profit. Ifmanagement thinks that selling price be changed and volume remain the same, thennew selling price is :
New selling price = Old selling + New fixed cost --- old fixed costsVolume of production
The logic is change in selling price is incremental change in variable cost and / or fixedcost per unit is added in selling price so as to earn the same profit. Look at thefollowing illustration how the new selling price is calculated when there is change invariable and fixed costs :
Illustration 10The cost information supplied by the cost accountant is as follows:Sales 20,00 units @ Rs. 10 per unit Rs. 2,00,000Variable cost Rs. 6 per unit Rs. 1,20,000
Contribution Rs. 80,000
Fixed Cost Rs. 30,000
Profit Rs. 50,000
Calculate the (a) new sales quantity and (b) new selling price to earn the same profit if
i) Variable cost increases by Rs. 2 per unit
ii) Fixed cost increase by Rs. 10,000
iii) Variable cost increase by Rs. 1 per unit and fixed cost reduces by Rs. 10,000
Solution
i) Variable cost increases by Rs. 2
a) New sales quantity required =
F + DPSP--- Vn
where Vn is the new variable cost
=Rs. 30,000 + Rs. 50,000
= Rs. 80,000 = 40,000 units
Rs.10 --- Rs.8 Rs.2
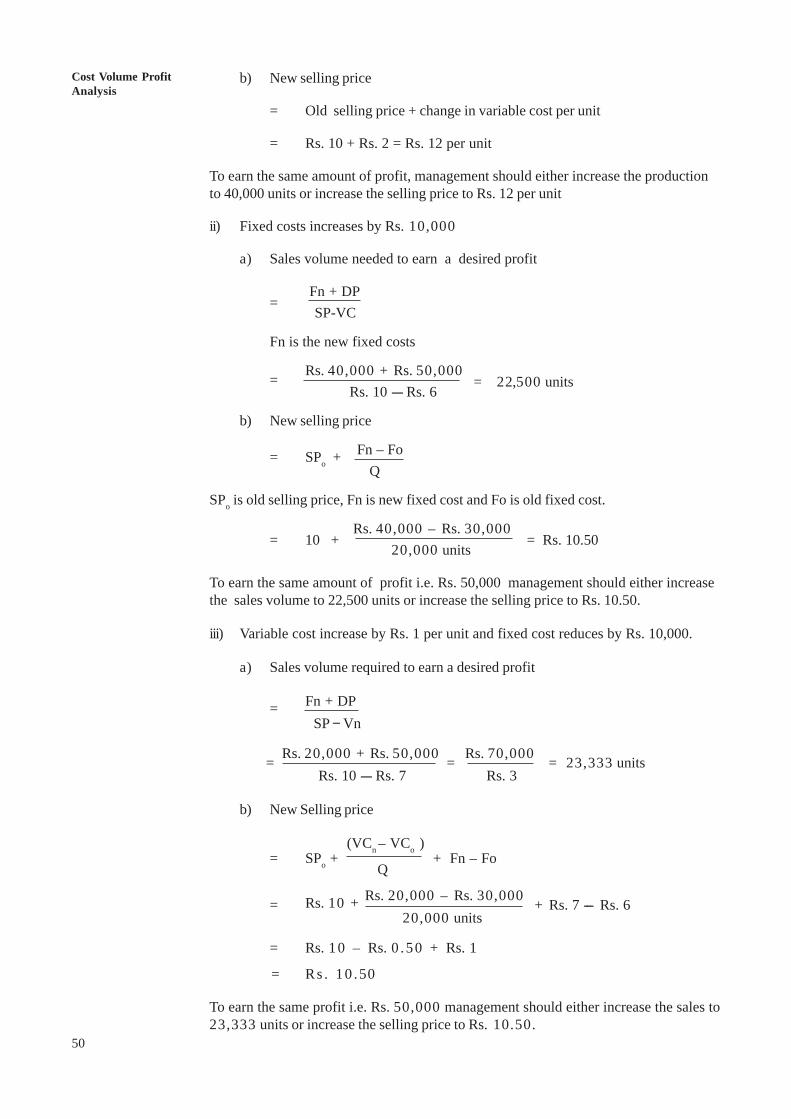
50
Cost Volume ProfitAnalysis
b) New selling price
= Old selling price + change in variable cost per unit
= Rs. 10 + Rs. 2 = Rs. 12 per unit
To earn the same amount of profit, management should either increase the productionto 40,000 units or increase the selling price to Rs. 12 per unit
ii) Fixed costs increases by Rs. 10,000
a) Sales volume needed to earn a desired profit
= Fn + DP SP-VC
Fn is the new fixed costs
= Rs. 40,000 + Rs. 50,000 = 22,500 units
Rs. 10 --- Rs. 6
b) New selling price
= SPo + Fn – Fo Q
SPo is old selling price, Fn is new fixed cost and Fo is old fixed cost.
= 10 +Rs. 40,000 – Rs. 30,000
= Rs. 10.50 20,000 units
To earn the same amount of profit i.e. Rs. 50,000 management should either increasethe sales volume to 22,500 units or increase the selling price to Rs. 10.50.
iii) Variable cost increase by Rs. 1 per unit and fixed cost reduces by Rs. 10,000.
a) Sales volume required to earn a desired profit
= Fn + DP SP − Vn
= Rs. 20,000 + Rs. 50,000 = Rs. 70,000 = 23,333 units Rs. 10 --- Rs. 7 Rs. 3
b) New Selling price
= SPo + (VCn – VCo ) + Fn – Fo Q
= Rs. 10 + Rs. 20,000 – Rs. 30,000 + Rs. 7 --- Rs. 6 20,000 units
= Rs. 10 – Rs. 0 .50 + Rs. 1
= Rs . 10 .50
To earn the same profit i.e. Rs. 50,000 management should either increase the sales to23,333 units or increase the selling price to Rs. 10.50.
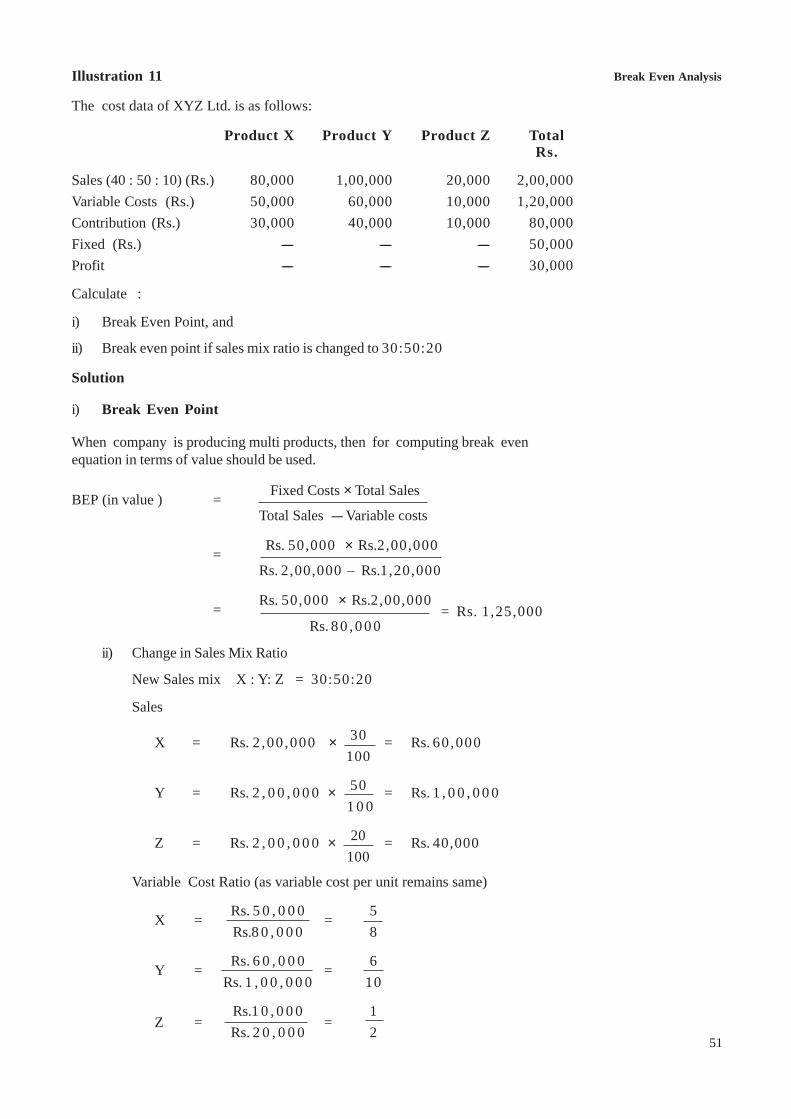
Break Even Analysis
51
Illustration 11
The cost data of XYZ Ltd. is as follows:
Product X Product Y Product Z TotalRs.
Sales (40 : 50 : 10) (Rs.) 80,000 1,00,000 20,000 2,00,000Variable Costs (Rs.) 50,000 60,000 10,000 1,20,000Contribution (Rs.) 30,000 40,000 10,000 80,000Fixed (Rs.) ----- ----- ----- 50,000Profit ----- ----- ----- 30,000
Calculate :
i) Break Even Point, and
ii) Break even point if sales mix ratio is changed to 30:50:20
Solution
i) Break Even Point
When company is producing multi products, then for computing break evenequation in terms of value should be used.
BEP (in value ) = Fixed Costs × Total Sales
Total Sales --- Variable costs
= Rs. 50,000 × Rs.2,00,000
Rs. 2,00,000 – Rs.1,20,000
= Rs. 50,000 × Rs.2,00,000 = Rs. 1,25,000
Rs. 8 0 , 0 0 0
ii) Change in Sales Mix Ratio
New Sales mix X : Y: Z = 30:50:20
Sales
X = Rs. 2 ,00 ,000 × 30 = Rs. 60 ,000100
Y = Rs. 2 , 0 0 , 0 0 0 × 50 = Rs. 1 , 0 0 , 0 0 0 1 0 0
Z = Rs. 2 , 0 0 , 0 0 0 × 20 = Rs. 40,000100
Variable Cost Ratio (as variable cost per unit remains same)
X = Rs. 5 0 , 0 0 0 = 5Rs.8 0 , 0 0 0 8
Y = Rs. 6 0 , 0 0 0 = 6Rs. 1 , 0 0 , 0 0 0 10
Z =Rs.1 0 , 0 0 0
=1
Rs. 2 0 , 0 0 0 2
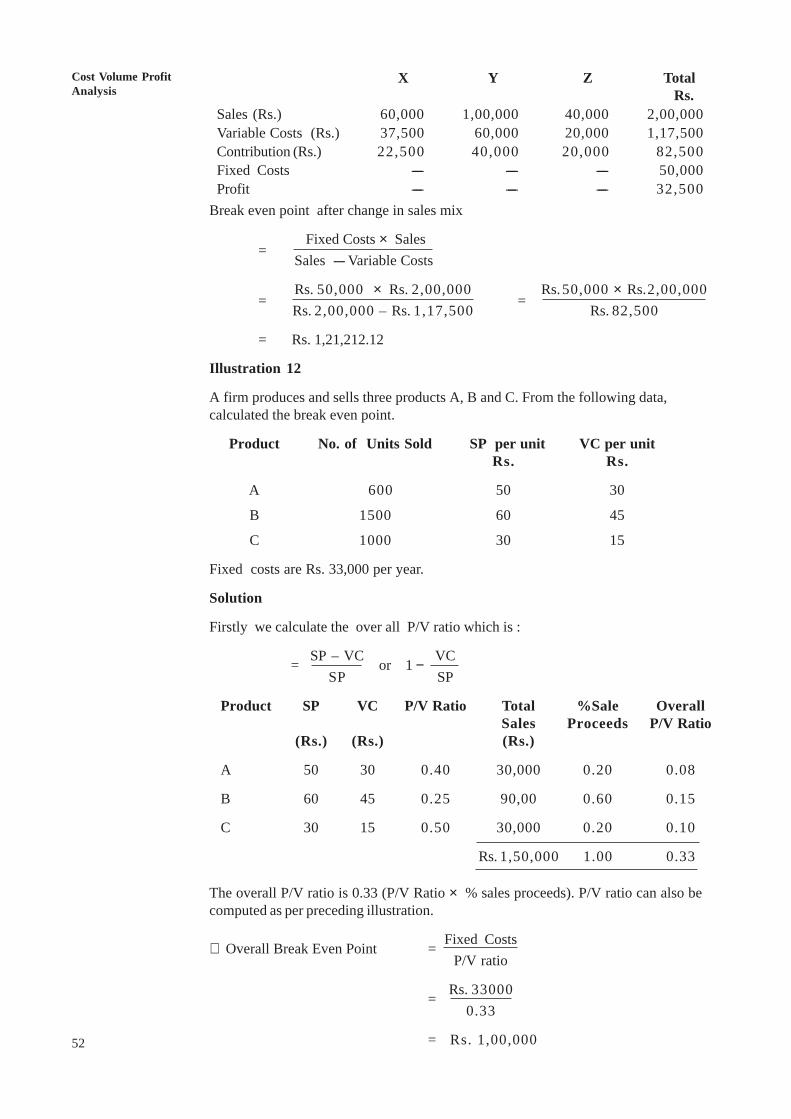
52
Cost Volume ProfitAnalysis
X Y Z Total Rs.
Sales (Rs.) 60,000 1,00,000 40,000 2,00,000Variable Costs (Rs.) 37,500 60,000 20,000 1,17,500Contribution (Rs.) 22,500 40,000 20,000 82,500Fixed Costs ----- ----- ----- 50,000Profit ----- ----- ----- 32,500
Break even point after change in sales mix
= Fixed Costs × Sales
Sales --- Variable Costs
=Rs. 50,000 × Rs. 2,00,000
=Rs.50,000 × Rs.2,00,000
Rs. 2,00,000 – Rs. 1,17,500 Rs. 82,500
= Rs. 1,21,212.12
Illustration 12
A firm produces and sells three products A, B and C. From the following data,calculated the break even point.
Product No. of Units Sold SP per unit VC per unitRs. Rs.
A 600 50 30
B 1500 60 45
C 1000 30 15
Fixed costs are Rs. 33,000 per year.
Solution
Firstly we calculate the over all P/V ratio which is :
= SP – VC or 1 − VCSP SP
Product SP VC P/V Ratio Total %Sale OverallSales Proceeds P/V Ratio
(Rs.) (Rs.) (Rs.)
A 50 30 0.40 30,000 0.20 0.08
B 60 45 0.25 90,00 0.60 0.15
C 30 15 0.50 30,000 0.20 0.10
Rs. 1,50,000 1.00 0.33
The overall P/V ratio is 0.33 (P/V Ratio × % sales proceeds). P/V ratio can also becomputed as per preceding illustration.
∴ Overall Break Even Point = Fixed CostsP/V ratio
= Rs. 330000.33
= Rs. 1,00,000
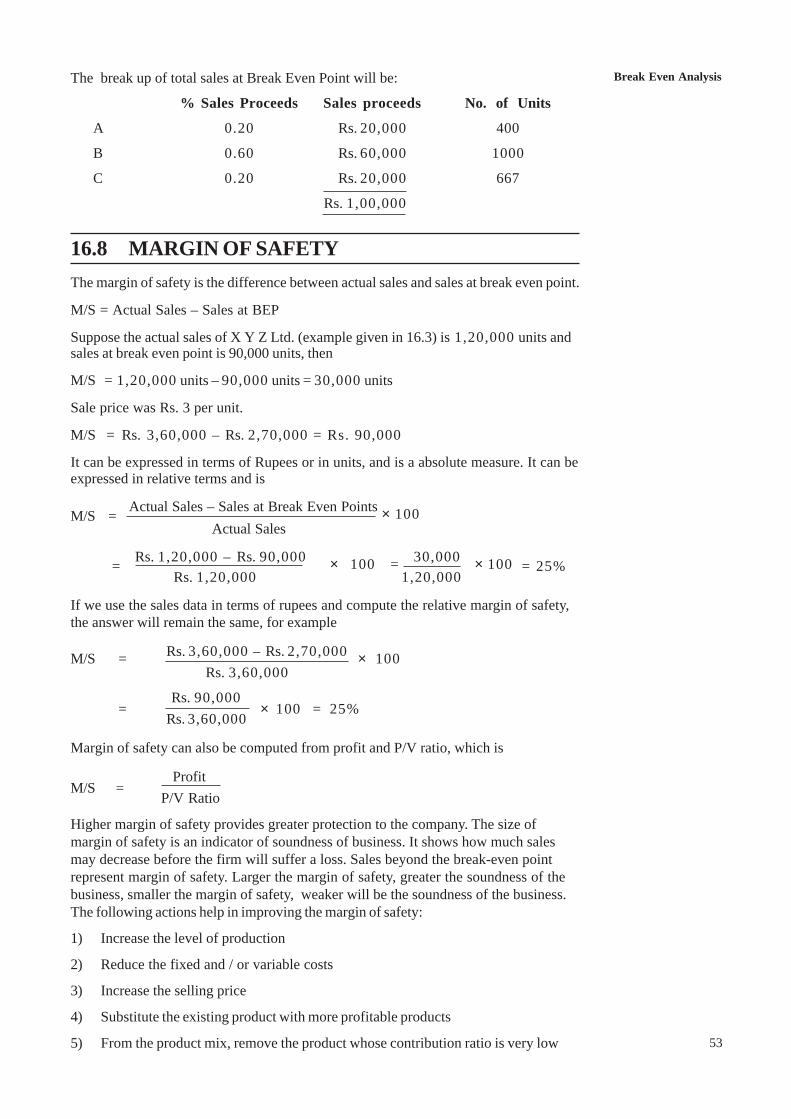
Break Even Analysis
53
The break up of total sales at Break Even Point will be:
% Sales Proceeds Sales proceeds No. of Units
A 0.20 Rs. 20,000 400
B 0.60 Rs. 60,000 1000
C 0.20 Rs. 20,000 667
Rs. 1,00,000
16.8 MARGIN OF SAFETYThe margin of safety is the difference between actual sales and sales at break even point.
M/S = Actual Sales – Sales at BEP
Suppose the actual sales of X Y Z Ltd. (example given in 16.3) is 1,20,000 units andsales at break even point is 90,000 units, then
M/S = 1,20,000 units – 90,000 units = 30,000 units
Sale price was Rs. 3 per unit.
M/S = Rs. 3,60,000 – Rs. 2,70,000 = Rs. 90,000
It can be expressed in terms of Rupees or in units, and is a absolute measure. It can beexpressed in relative terms and is
M/S = Actual Sales – Sales at Break Even Points × 100 Actual Sales
= Rs. 1,20,000 – Rs. 90,000 × 100 = 30,000 × 100 = 25% Rs. 1,20,000 1,20,000
If we use the sales data in terms of rupees and compute the relative margin of safety,the answer will remain the same, for example
M/S = Rs. 3,60,000 – Rs. 2,70,000 × 100 Rs. 3,60,000
= Rs. 90,000
× 100 = 25%Rs. 3,60,000
Margin of safety can also be computed from profit and P/V ratio, which is
M/S = ProfitP/V Ratio
Higher margin of safety provides greater protection to the company. The size ofmargin of safety is an indicator of soundness of business. It shows how much salesmay decrease before the firm will suffer a loss. Sales beyond the break-even pointrepresent margin of safety. Larger the margin of safety, greater the soundness of thebusiness, smaller the margin of safety, weaker will be the soundness of the business.The following actions help in improving the margin of safety:
1) Increase the level of production
2) Reduce the fixed and / or variable costs
3) Increase the selling price
4) Substitute the existing product with more profitable products
5) From the product mix, remove the product whose contribution ratio is very low
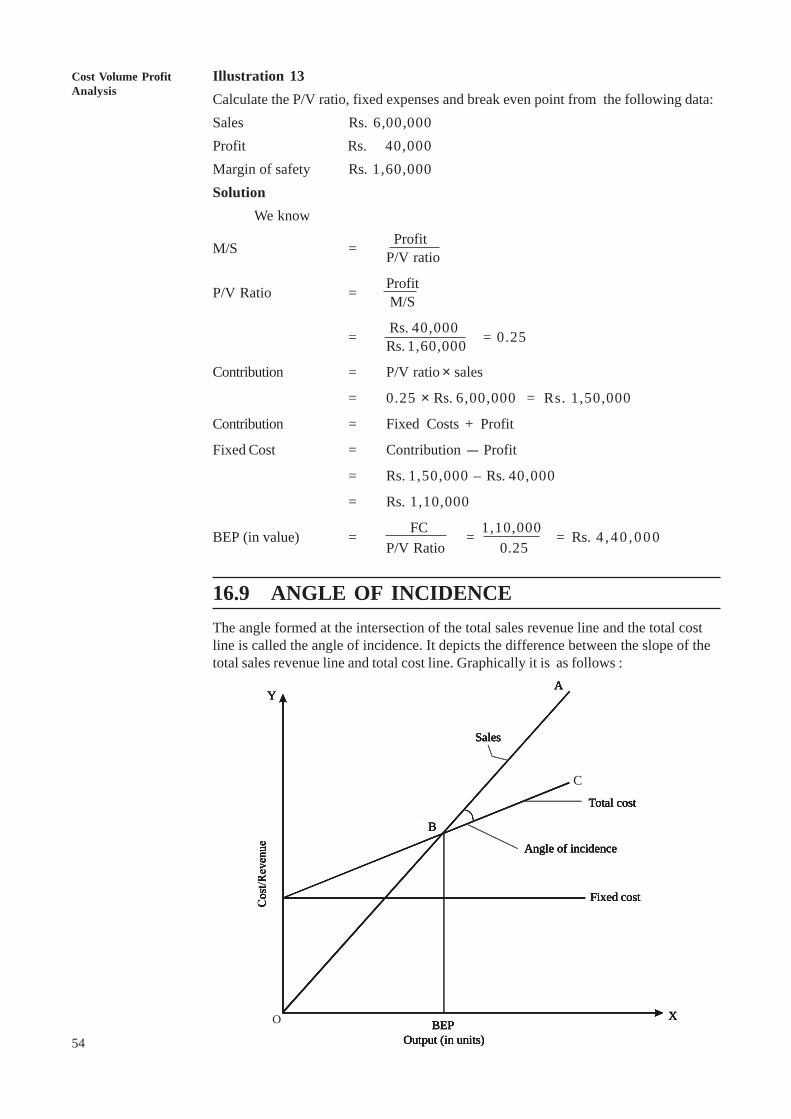
54
Cost Volume ProfitAnalysis
Illustration 13Calculate the P/V ratio, fixed expenses and break even point from the following data:Sales Rs. 6,00,000Profit Rs. 40,000Margin of safety Rs. 1,60,000Solution
We know
M/S = ProfitP/V ratio
P/V Ratio = Profit M/S
= Rs. 40,000 = 0.25Rs. 1,60,000
Contribution = P/V ratio × sales
= 0.25 × Rs. 6,00,000 = Rs. 1,50,000
Contribution = Fixed Costs + Profit
Fixed Cost = Contribution --- Profit
= Rs. 1,50,000 – Rs. 40,000
= Rs. 1,10,000
BEP (in value) = FC = 1,10,000 = Rs. 4 ,40 ,000P/V Ratio 0.25
16.9 ANGLE OF INCIDENCEThe angle formed at the intersection of the total sales revenue line and the total costline is called the angle of incidence. It depicts the difference between the slope of thetotal sales revenue line and total cost line. Graphically it is as follows :
BEPX
Y
Sales
B
A
Fixed cost
Total cost
Angle of incidence
Output (in units)BEP
X
Y
Sales
B
A
Fixed cost
Total cost
Angle of incidence
Output (in units)BEP
X
Y
Sales
B
A
Fixed cost
Total cost
Angle of incidence
Output (in units)BEP
XO
Y
Sales
B
A
Fixed cost
Total cost
Angle of incidence
Output (in units)
C
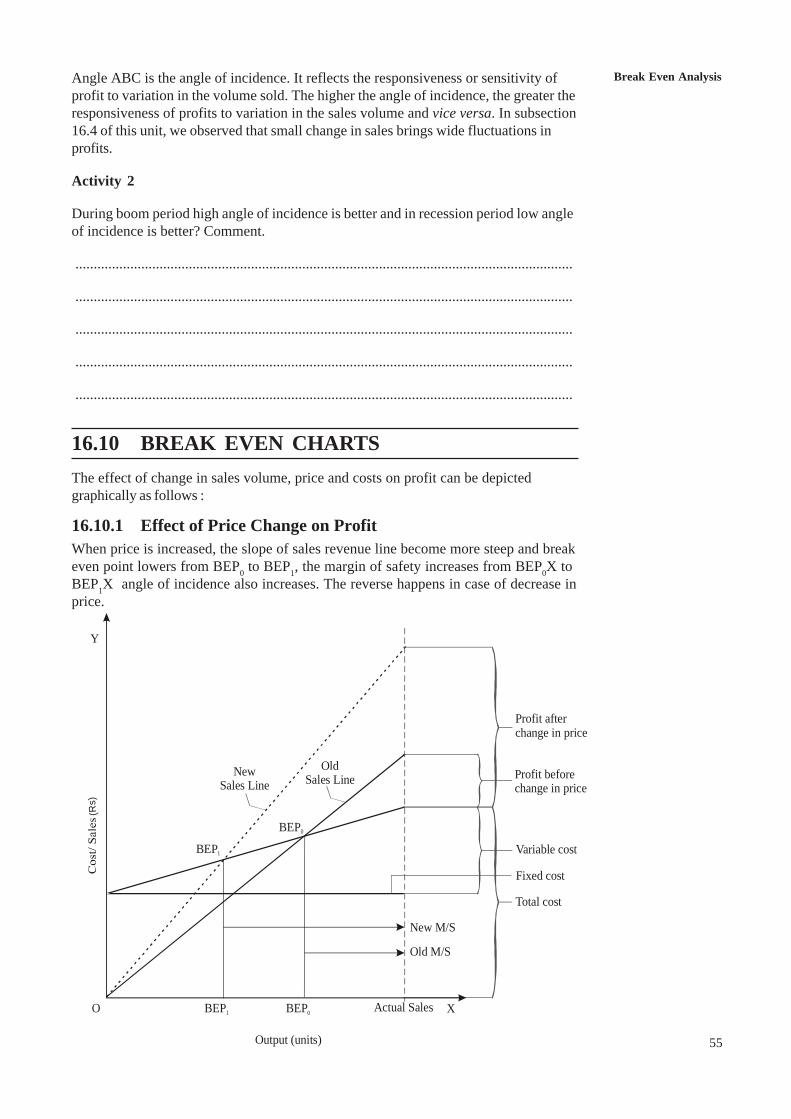
Break Even Analysis
55
Angle ABC is the angle of incidence. It reflects the responsiveness or sensitivity ofprofit to variation in the volume sold. The higher the angle of incidence, the greater theresponsiveness of profits to variation in the sales volume and vice versa. In subsection16.4 of this unit, we observed that small change in sales brings wide fluctuations inprofits.
Activity 2
During boom period high angle of incidence is better and in recession period low angleof incidence is better? Comment.
........................................................................................................................................
........................................................................................................................................
........................................................................................................................................
........................................................................................................................................
........................................................................................................................................
16.10 BREAK EVEN CHARTSThe effect of change in sales volume, price and costs on profit can be depictedgraphically as follows :
16.10.1 Effect of Price Change on ProfitWhen price is increased, the slope of sales revenue line become more steep and breakeven point lowers from BEP0 to BEP1, the margin of safety increases from BEP0X toBEP1X angle of incidence also increases. The reverse happens in case of decrease inprice.
New Sales Line
Old Sales Line
Profit after change in price
Profit before change in price
BEP1
BEP0
New M/S
Old M/S
Output (units)
Actual SalesBEP1 BEP0 XO
Y
Total cost
Variable cost
Fixed cost
(Rs)
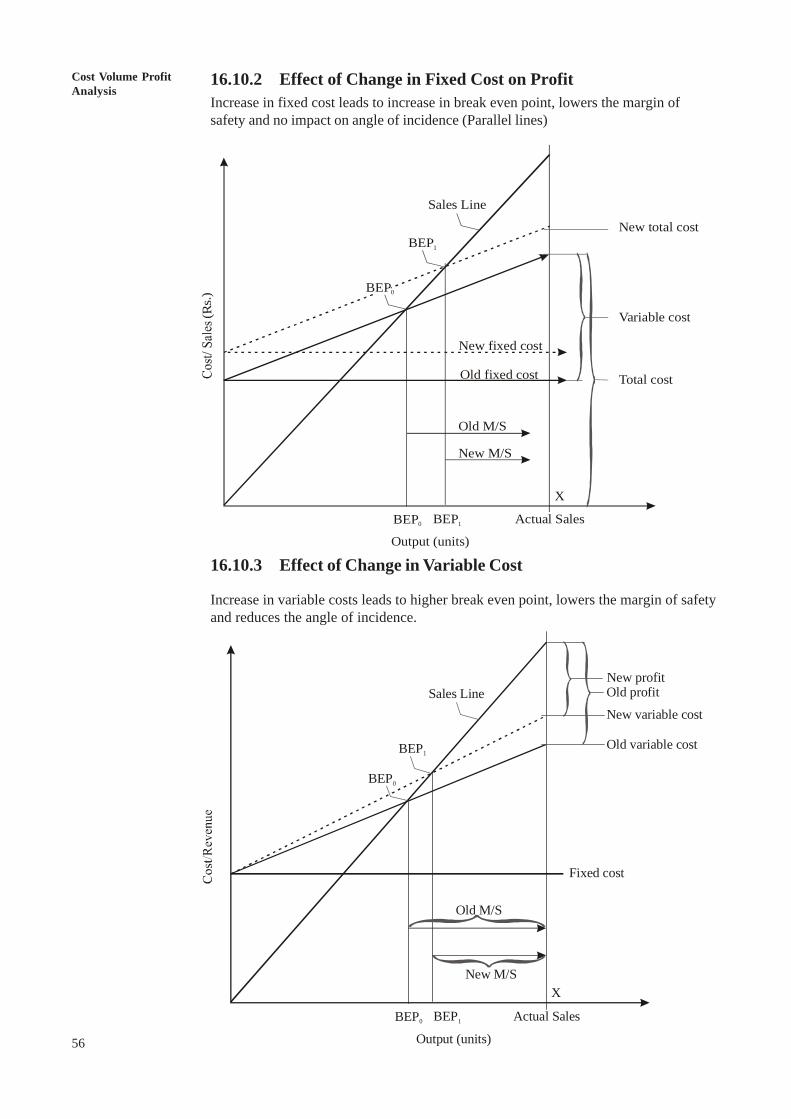
56
Cost Volume ProfitAnalysis
16.10.2 Effect of Change in Fixed Cost on ProfitIncrease in fixed cost leads to increase in break even point, lowers the margin ofsafety and no impact on angle of incidence (Parallel lines)
16.10.3 Effect of Change in Variable Cost
Increase in variable costs leads to higher break even point, lowers the margin of safetyand reduces the angle of incidence.
New M/S
Actual SalesBEP1BEP0
X
Sales Line
BEP1
BEP
(Rs.)
0
New total cost
Variable cost
New fixed cost
Old fixed cost
Output (units)
Total cost
Old M/S
New M/S
Actual SalesBEP1BEP0
X
Sales Line
BEP1
BEP0
New profit
New variable cost
Fixed cost
Old M/S
Old profit
Old variable cost
Output (units)
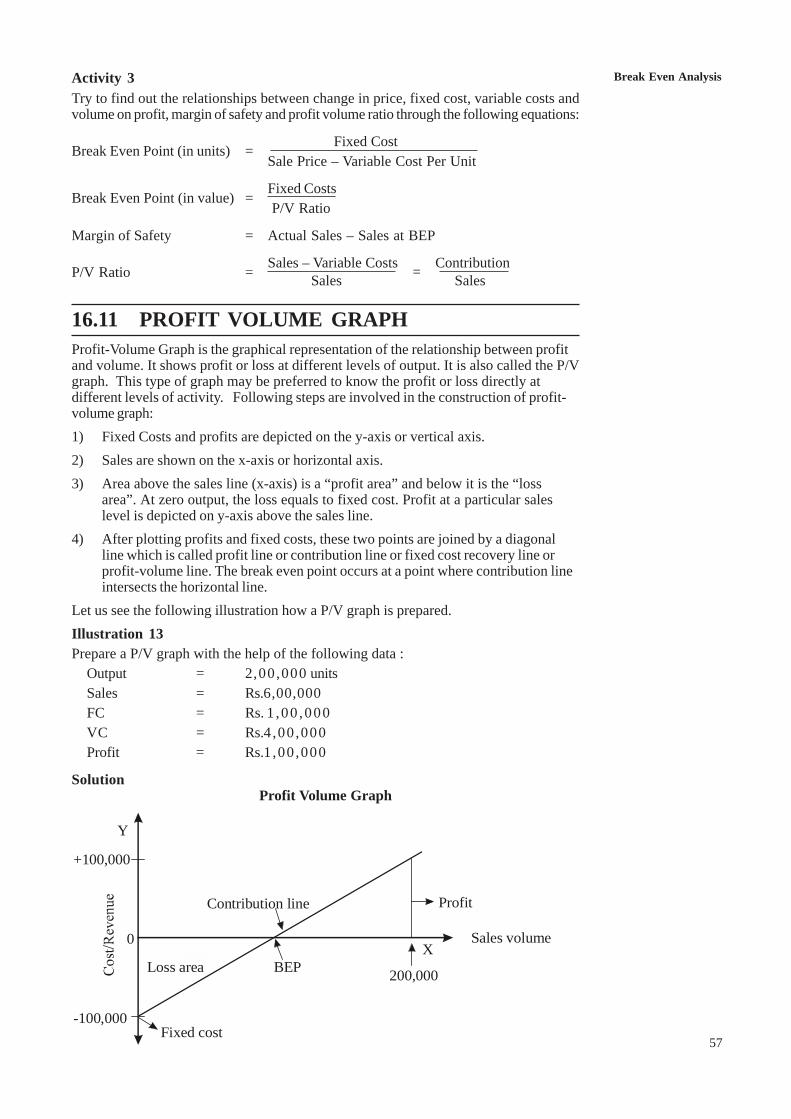
Break Even Analysis
57
Activity 3Try to find out the relationships between change in price, fixed cost, variable costs andvolume on profit, margin of safety and profit volume ratio through the following equations:
Break Even Point (in units) = Fixed CostSale Price – Variable Cost Per Unit
Break Even Point (in value) = Fixed Costs P/V Ratio
Margin of Safety = Actual Sales – Sales at BEP
P/V Ratio = Sales – Variable Costs = ContributionSales Sales
16.11 PROFIT VOLUME GRAPHProfit-Volume Graph is the graphical representation of the relationship between profitand volume. It shows profit or loss at different levels of output. It is also called the P/Vgraph. This type of graph may be preferred to know the profit or loss directly atdifferent levels of activity. Following steps are involved in the construction of profit-volume graph:1) Fixed Costs and profits are depicted on the y-axis or vertical axis.2) Sales are shown on the x-axis or horizontal axis.3) Area above the sales line (x-axis) is a “profit area” and below it is the “loss
area”. At zero output, the loss equals to fixed cost. Profit at a particular saleslevel is depicted on y-axis above the sales line.
4) After plotting profits and fixed costs, these two points are joined by a diagonalline which is called profit line or contribution line or fixed cost recovery line orprofit-volume line. The break even point occurs at a point where contribution lineintersects the horizontal line.
Let us see the following illustration how a P/V graph is prepared.Illustration 13Prepare a P/V graph with the help of the following data :
Output = 2,00,000 unitsSales = Rs.6,00,000FC = Rs. 1 ,00 ,000VC = Rs.4 ,00 ,000Profit = Rs.1 ,00 ,000
SolutionProfit Volume Graph
X
Y
Fixed cost
Contribution line Profit
Sales volume
BEPLoss area
0
200,000
+100,000
-100,000
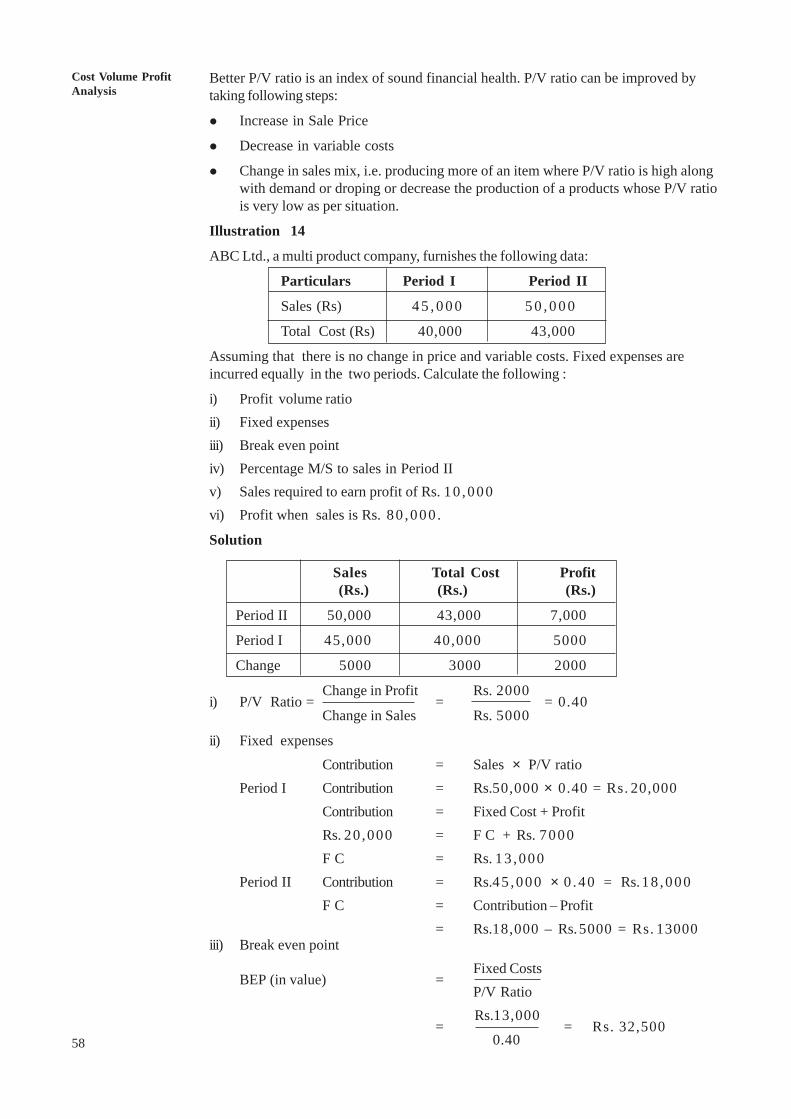
58
Cost Volume ProfitAnalysis
Better P/V ratio is an index of sound financial health. P/V ratio can be improved bytaking following steps:
! Increase in Sale Price
! Decrease in variable costs
! Change in sales mix, i.e. producing more of an item where P/V ratio is high alongwith demand or droping or decrease the production of a products whose P/V ratiois very low as per situation.
Illustration 14
ABC Ltd., a multi product company, furnishes the following data:
Particulars Period I Period II
Sales (Rs) 4 5 , 0 0 0 5 0 , 0 0 0
Total Cost (Rs) 40,000 43,000
Assuming that there is no change in price and variable costs. Fixed expenses areincurred equally in the two periods. Calculate the following :
i) Profit volume ratioii) Fixed expensesiii) Break even pointiv) Percentage M/S to sales in Period IIv) Sales required to earn profit of Rs. 10 ,000vi) Profit when sales is Rs. 80 ,000 .
Solution
Sales Total Cost Profit (Rs.) (Rs.) (Rs.)
Period II 50,000 43,000 7,000
Period I 45,000 40,000 5000
Change 5000 3000 2000
i) P/V Ratio =Change in Profit
=Rs. 2000
= 0.40Change in Sales Rs. 5000
ii) Fixed expensesContribution = Sales × P/V ratio
Period I Contribution = Rs.50,000 × 0.40 = Rs. 20,000Contribution = Fixed Cost + ProfitRs. 20 ,000 = F C + Rs. 7000F C = Rs. 13 ,000
Period II Contribution = Rs.45 ,000 × 0 .40 = Rs.18 ,000F C = Contribution – Profit
= Rs.18,000 – Rs.5000 = Rs. 13000iii) Break even point
BEP (in value) =Fixed CostsP/V Ratio
= Rs.13,000
= Rs. 32,500 0.40
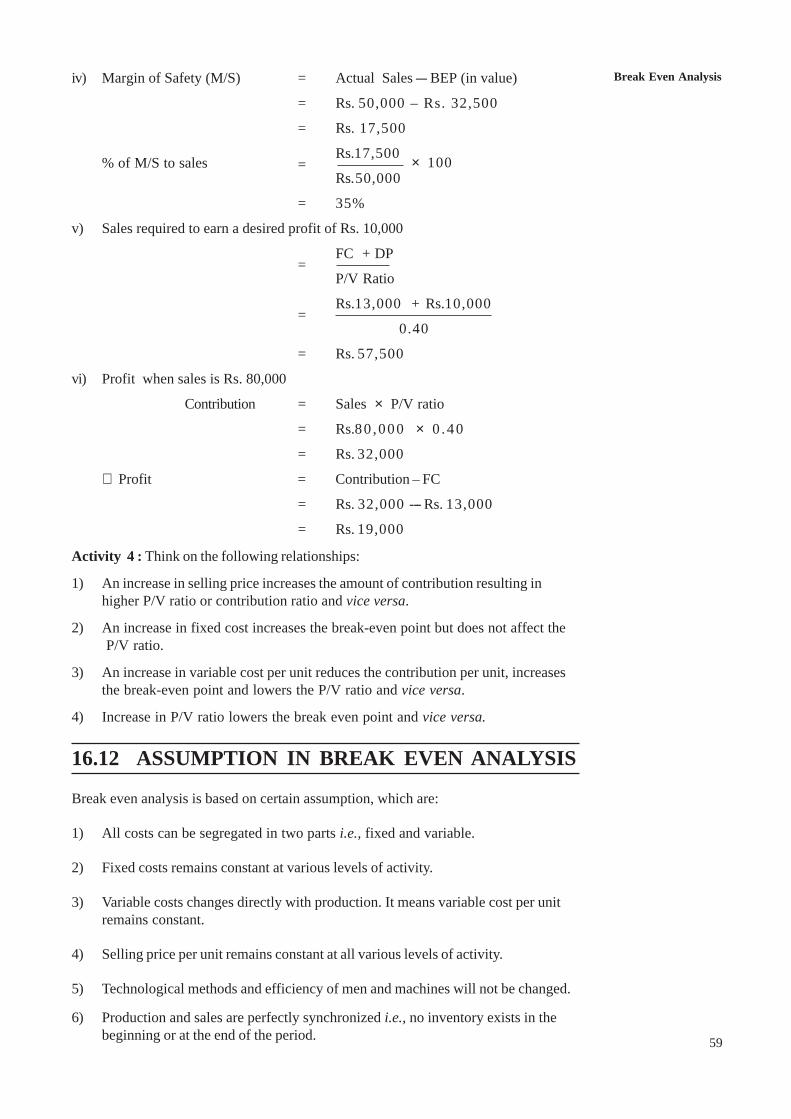
Break Even Analysis
59
iv) Margin of Safety (M/S) = Actual Sales --- BEP (in value)
= Rs. 50,000 – Rs. 32,500
= Rs. 17,500
% of M/S to sales =Rs.17,500 × 100Rs.50,000
= 35%
v) Sales required to earn a desired profit of Rs. 10,000
=FC + DP
P/V Ratio
=Rs.13,000 + Rs.10,000
0.40
= Rs. 57,500
vi) Profit when sales is Rs. 80,000
Contribution = Sales × P/V ratio
= Rs.80 ,000 × 0 .40
= Rs. 32,000
∴ Profit = Contribution – FC
= Rs. 32,000 --- Rs. 13,000
= Rs. 19,000
Activity 4 : Think on the following relationships:
1) An increase in selling price increases the amount of contribution resulting inhigher P/V ratio or contribution ratio and vice versa.
2) An increase in fixed cost increases the break-even point but does not affect the P/V ratio.
3) An increase in variable cost per unit reduces the contribution per unit, increasesthe break-even point and lowers the P/V ratio and vice versa.
4) Increase in P/V ratio lowers the break even point and vice versa.
16.12 ASSUMPTION IN BREAK EVEN ANALYSIS
Break even analysis is based on certain assumption, which are:
1) All costs can be segregated in two parts i.e., fixed and variable.
2) Fixed costs remains constant at various levels of activity.
3) Variable costs changes directly with production. It means variable cost per unitremains constant.
4) Selling price per unit remains constant at all various levels of activity.
5) Technological methods and efficiency of men and machines will not be changed.
6) Production and sales are perfectly synchronized i.e., no inventory exists in thebeginning or at the end of the period.
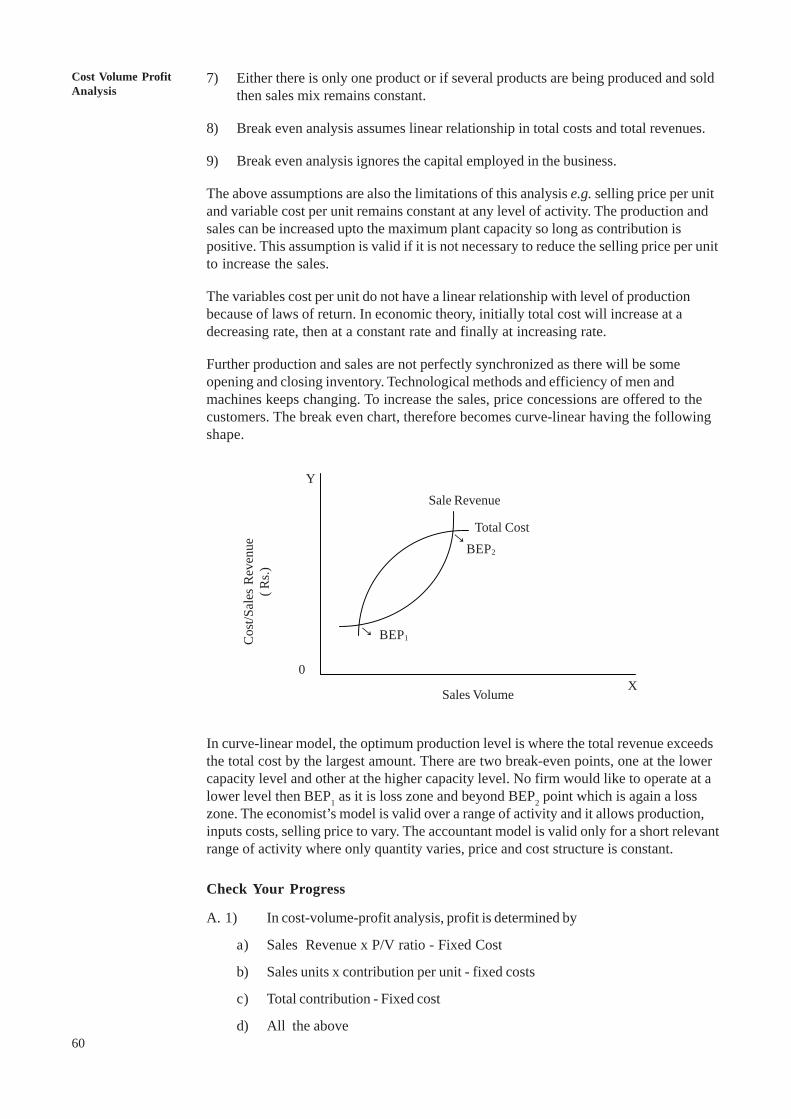
60
Cost Volume ProfitAnalysis
7) Either there is only one product or if several products are being produced and soldthen sales mix remains constant.
8) Break even analysis assumes linear relationship in total costs and total revenues.
9) Break even analysis ignores the capital employed in the business.
The above assumptions are also the limitations of this analysis e.g. selling price per unitand variable cost per unit remains constant at any level of activity. The production andsales can be increased upto the maximum plant capacity so long as contribution ispositive. This assumption is valid if it is not necessary to reduce the selling price per unitto increase the sales.
The variables cost per unit do not have a linear relationship with level of productionbecause of laws of return. In economic theory, initially total cost will increase at adecreasing rate, then at a constant rate and finally at increasing rate.
Further production and sales are not perfectly synchronized as there will be someopening and closing inventory. Technological methods and efficiency of men andmachines keeps changing. To increase the sales, price concessions are offered to thecustomers. The break even chart, therefore becomes curve-linear having the followingshape.
In curve-linear model, the optimum production level is where the total revenue exceedsthe total cost by the largest amount. There are two break-even points, one at the lowercapacity level and other at the higher capacity level. No firm would like to operate at alower level then BEP1 as it is loss zone and beyond BEP2 point which is again a losszone. The economist’s model is valid over a range of activity and it allows production,inputs costs, selling price to vary. The accountant model is valid only for a short relevantrange of activity where only quantity varies, price and cost structure is constant.
Check Your Progress
A. 1) In cost-volume-profit analysis, profit is determined by
a) Sales Revenue x P/V ratio - Fixed Cost
b) Sales units x contribution per unit - fixed costs
c) Total contribution - Fixed cost
d) All the above
Sale Revenue
Y
0
Total CostBEP2
BEP1
Sales Volume X
Cos
t/Sal
es R
even
ue
( R
s.)
→
→
Break Even Analysis
61
2) Variable costs per unit
a) Goes on increasing with production
b) Goes on decreasing with production
c) Remains constant with change in production
d) None of these
3) Variable cost are those which
a) Are directly apportioned to cost unit or cost centre
b) Varies directly with production
c) Depends upon the demand
d) Depends upon the sale
4) In accounting, marginal cost per unit goes on, __________ with increase in
production
a) Increases
b) Decreases
c) Remain constant
d) None of these
5) Which is not a fixed cost
a) Property tax
b) Power
c) Insurance premium
d) Rent
6) Fixed cost per unit _________with increase in production
a) Increases
b) Decreases
c) Remains constant
d) Can’t say
7) Semi variable cost are segregated into fixed and variable costs with the help of
a) Scatter diagram
b) Method of least square
c) High and low points method
d) All the above
8) Telephone charges is a
a) Fixed cost
b) Variable cost
c) Semi-variable cost
d) Marginal cost
62
Cost Volume ProfitAnalysis
9) The break even points in units is equal to
a) Fixed cost/PV ratio
b) Fixed cost x sales/total contribution
c) Fixed cost/contribution per unit
d) Fixed cost/total contribution
10) At the break-even point, which equation will be true.
a) Variable cost - fixed cost = contribution
b) Sales = variable cost + fixed cost
c) Sales - fixed cost = contribution
d) Sales – contribution = variable cost
11) When fixed costs increases, the break even point
a) Increases
b) Decreases
c) No effect
d) Can’t say
12) When variable costs decreases, then break even point
a) Increases
b) Decreases
c) No effect
d) Can’t say
13) When selling price decreases, then break even point
a) Increases
b) Decreases
c) No effect
d) Can’t say
14) When sales increases then break even point
a) Increases
b) Decreases
c) Remains constant
d) None of these
15) Contribution is
a) Fixed cost + profit
b) Sales - variable cost
c) Fixed cost – loss
d) All the above
Break Even Analysis
63
16) P/V ratio is
a) Profit/volume
b) Contribution/sales
c) Profit/contribution
d) Profit/sales
17) Profit - volume ratio is improved by reducing
a) Variable cost
b) Fixed cost
c) Both of them
d) None of them
18) The price reduction policy, ______ the P/V ratio and _______ the break evenpoint
a) Reduces, reduces
b) Reduces, increases
c) Increases, reduces
d) Increases, increases
19) Shut down point occurs when
a) Net profit is zero
b) Sale revenue - variable cost + fixed costs
c) Losses are greater than fixed cost
d) None of the above
20) The break even point and shut down point are
a) Synonymous
b) Anonymous
c) Different
d) Can’t say
21) The sales of a firm is Rs. 3,00,000, fixed cost is Rs. 90,000, and variable costsare Rs. 2,00,000, the break even point will occur at
a) 2,70,000 units
b) Rs. 2,70,000
c) Rs. 3,25,000
d) 3,25,000 units
22) The financial accounts of a firm reveals the position at two time periods is asfollows:
Period Sales Rs. Profit Rs.
I 2,30,000 50,000
II 3,00,000 80,000
64
Cost Volume ProfitAnalysis
The profit volume ratio for the firm will be
a) 3/7
b) 5/8
c) 3/8
d) 13/53
23) The fixed cost of a firm is Rs. 90,000, variable cost per unit is Rs. 2 and saleprice is Rs. 3 per unit. The break even point will occur at
a) 30,000 units
b) 50,000 units
c) 90,000 units
d) Rs. 90,000
24) The sales volume in value required to earn the target profit, the formula is
a) Target profit/contribution per unit
b) (Fixed cost + Target profit) P/V ratio
c) Fixed cost + Target profit/contribution on per unit
d) (Fixed cost + Target profit) / PV ratio
25) The contribution per unit is Rs. 2 and fixed costs are Rs. 15,000 for earning aprofit of Rs. 50,000, the company must have sales of
a) Rs. 1,30,000
b) Rs. 1,00,000
c) 32,500 units
d) Rs. 32,500
26) Margin of safety is expressed as
a) Profit / P/V ratio
b) (Actual sales --- sales at BEP ) / Actual sales
c) Actual sales --- Sales at BEP
d) All of the above
27) The margin of safety point lies
a) To the left of break even point
b) To the right of break even point
c) On break even point
d) Can’t say
Break Even Analysis
65
28) The sale at a BEP for a firm is Rs. 4,80,000 and the actual sales made by thefirm Rs. 8,00,000, the margin of safety will be
a) Rs. 12,80,000
b) Rs. 3,20,000
c) Rs. 4 ,80 ,000/8 ,00,000
d) Rs. 800,000
29) The profit of a company is Rs. 30,000 by selling 10,000 units at a price of Rs.10 per unit. The variable cost to sale ratio is 60 per cent. Find margin of safetylevel.
a) Rs. 75,000
b) Rs. 30,000
c) Rs. 1,00,000
d) Rs. 12,000
30) In the above question, determine the break even point
a) Rs. 20,000
b) Rs. 25,000
c) Rs. 30,000
d) Rs. 40 ,000
B) State whether the following statement are True or False.
i) Contribution is the difference between the total sales and fixed cost [ ]
ii) At break even point contribution equals to fixed cost [ ]
iii) Profit volume graph shows profit or loss at different levels of sales [ ]
iv) Profit volume graph can also be called P/V graph [ ]
v) P/V ration can be improved by decreasing the selling price [ ]
vi) P/v ratio can be improved by reducing the fixed costs [ ]
vii) Margin of safety may be improved by increasing selling price and reducingfixed cost [ ]
viii) At break-even point sales equal to total cost [ ]
16.13 LET US SUM UPBreak even analysis helps is ascertaining the level of production where total costsequals to total revenue. Below this level of production, there are losses and above thispoint depicts the profit zone. Like marginal costing this analysis is also based on costclassification into fixed and variable costs. Break even analysis helps in measuring theeffect of charges in volume, costs, selling price and product mix on profit. In fact,break even analysis is cost-volume profit analysis.
Break even point can be determined both mathematically (equation technique andcontribution margin technique) and graphically. It is expressed in terms of units or in
66
Cost Volume ProfitAnalysis
value terms. This technique is very useful in profit planning and decision making. It canbe applied to estimate profits at a given sales volume, sales volume required to earn adesired profit, calculating sale volume required to offset price reduction, ascertaining themargin of safety, measuring the effect of changes in profit factors etc. The other tools inthis analysis are profit-volume ratio, margin of safety and angle of incidence.
There are inherent limitations in the break even analysis –classification of costs intofixed and variable costs, fixed costs remains fixed, variable cost per unit is constant,selling price per unit is constant etc. In spite of its limitation the break even point is auseful technique in decision making if it used by those who understand its limitations.
16.14 KEY WORDSBreak Even Point is the level of sales (volume or value) where total costs equals tototal revenue or no profit no loss point.
Cost-volume-Profit analysis is technique to study the effects of costs and volumevariations on profit.
Margin of Safety is the difference between actual sales and sales at break even point.It shows the amount by which sales may decrease before losses occur.
Profit Volume Ratio is a relationship between contribution to sales.
Mixed Costs are those costs which has both fixed and variable elements. These arealso known as semi-variable costs.
16.15 ANSWERS TO CHECK YOUR PROGRESSA
1 d 7 d 1 3 a 1 9 c 2 5 c
2 c 8 c 1 4 c 2 0 c 2 6 d
3 b 9 c 1 5 d 2 1 b 2 7 c
4 c 1 0 b 1 6 b 2 2 a 2 8 b
5 b 11 a 1 7 a 2 3 c 2 9 a
6 b 1 2 b 1 8 b 2 4 d 3 0 b
B) i) False ii) True iii) True iv) True v) False vi) False vii) True viii) True
16.16 TERMINAL QUESTIONS1) ‘Cost-volume profit analysis and break even point analysis are same’ Comment?
2) What are different methods of computing break even point?
3) “The break even chart is an excellent planning device” Comment.
4) Explain the significance of Profit-Volume ratio, Margin of Safety and Angle ofIncidence?
5) What is Contribution ? How does it helps the management in taking managerialdecisions?
Break Even Analysis
67
6) Describe three ways to lower down the break even point?
7) What are various ways to improve the margin of safety and P/V ratio?
8) ‘A 10 per cent increase in production and sales leads to more than 10 percentincrease in profit’ Explain
9) ABC Ltd. manufactures and sells four type of products under the brand namesof P, Q, R and S. The sale mix in value comprises of 34%, 40%, 16% and 10%of P,Q, R and S respectively. The total budgeted sales (100%) are Rs. 60,000 permonth. Operating costs are:
Variables costs ratio is (variable costs on % of sales)
P 60%
Q 65%
R 70%
S 40%
Fixed costs is Rs. 15,000 per month. Calculate the break even point for theproducts on an overall basis. (Ans BEP Rs. 39062.50)
10) Explain from the following data, how the reduction in selling price would affectthe break even point and margin of safety.Selling price per unit Rs. 20
Variable costs Material Rs. 6
Labour Rs. 4
Variable overheads Rs. 2
Fixed overheads is Rs. 8000. Full capacity of the plant is 5000 units. Reducedselling price is Rs. 16 per unit.
[Ans. BEP increase by 1000 units and M/S decrease by Rs. 32000]
11) The sales manager of a company found that with fixed cost Rs. 50,000, salesare increased from Rs. 30,000 to Rs. 4,00,000 and profit increased by Rs.40,000. Compute the profit when sales is Rs. 5,00,000.
[Ans. Rs. 1 ,50,000]
12) ABC Ltd., has a margin of safety 37.5% with an overall contribution sale ratioof 40%. The fixed cost is Rs. 5 lakhs.
Calculate the following:
i) Break even point
ii) Total Sales
iii) Total variables costs
iv) Profit
[Ans. (i) Rs. 12,50,000 (ii) Rs. 20,00,000 (iii) Rs. 12,00,000(iv) Rs. 3,00,000]
13) The P/V ratio of a concern is 50% and margin of safety is 40%. Calculate thenet profit of the sales is Rs. 1,00,000.[Ans. Profit Rs. 20,000]
68
Cost Volume ProfitAnalysis
Note : These questions will help you to understand the unit better. Try to writeanswers for them. But do not submit your answers to the University.These are for your practice only.
14) X Ltd has earned a contribution of Rs. 2,00,000 and net profit of Rs. 1,50,000on sales of Rs. 8,00,000. What is the break even point and margin of safety.[Ans. Rs. 2 ,00,000 M/S is Rs. 6,00,000]
15) From the following cost information:2001 2002
Sales (Rs) 1,50,000 2,00,000
Profit (Rs.) 30,000 50,000
Calculate:
i) P/V ratio
ii) Break even point
iii) Sales required to earn a profit of Rs. 80,000
iv) Profit when sales is Rs. 2,50,000
[Ans. (i) 0.40) (ii) Rs. 75,000 (iii) Rs. 2,75,000 (iv) Rs. 70,000 ]
16.17 FURTHER READINGS
Horngren, C.T., Gary L. Sundem and Frank H. Selto, “Management Accounting”,Prentice Hall of India, New Delhi, 1994.
Kaplan, R.S., s, Engle Wood Cliffs, NJ., Prentice Hall Inc.
UNIT 17 RELEVANT COSTS FORDECISION MAKING
Structure17.0 Objectives
17.1 Introduction
17.2 Relevant Costs for Decision Making
17.2.1 Concept of Relevant Costs
17.2.2 Concept of Differential Costs
17.2.3 Decision-Making Process
17.2.4 Selling Price Decisions
17.2.5 Exploring New Markets
17.2.6 Make or Buy Decisions
17.2.7 Expand and Contract
17.2.8 Sales Mix Decisions
17.2.9 Alternative Methods of Production
17.2.10 Plant Shut Down Decisions
17.2.11 Acceptance of Special Order
17.2.12 Adding or Dropping a Product Line
17.2.13 Replacement of Machinery
17.3 Let Us Sum Up
17.4 Key Words
17.5 Answers to Check Your Progress
17.6 Terminal Questions
17.0 OBJECTIVESAfter studying this unit, you should be able to:
! distinguish between the different types of costs;
! distinguish between the nature of costs;
! present different alternatives before the decision making; and
! selection out of different alternatives.
17.1 INTRODUCTIONThe analysis of costs plays a vital role in selecting the alternatives available before themanagement. Costs could shape alternative opportunities and therefore, it influencesand shapes future profits. Management is not only interested in the historical costanalysis but it is also interested to study those costs, which are influencing the future 69
70
Cost Volume ProfitAnalysis
operations. After analyzing different types of costs according to their nature, one canbe able to select one out of the various optimal alternatives. When costs are futureoriented then only they remain important for the decision maker. In this unit you willstudy the importance of relevant costs for decision making.
17.2 RELEVANT COSTS FOR DECISION MAKINGWith different objectives the different costs concept is always there. It is pertinent touse the word relevant while providing the information about costs. When the costs arenot changing with the different alternatives and remain fixed in nature then theybecome irrelevant or sunk costs. When management wants to select any of thealternatives available before them and take decision then the relevant costs becomevery important.
17.2.1 Concept of Relevant Costs
Relevant cost is a cost of decision. You may call it decision cost, as it is alwaysrelevant with the selection of one out of different alternatives. If decision is beingtaken and any cost is increased because of the change in decision, that particular costbecomes relevant cost. Relevant cost is always for future and not for the analysis ofthe past decisions. These costs are ‘Future Costs’ and they differ to differentalternatives. We focus on the future whether it may be 10 seconds after or it may be10 years later.
Relevant costs are also known as differential costs. Relevant costs differ among thedifferent alternatives. For example, if an engineering graduate wants to start his ownwork shop and he has a choice to complete his post–graduation. Relevant costs tocontinue his studies are fees and books. Irrelevant costs are clothes and his residentialarrangements, which will incur under both the circumstances.
17.2.2 Concept of Differential Costs
Differential cost is the difference between the costs of alternatives. Difference in totalcost between the two alternatives available. It is also known as net relevant cost.Differential cost is not calculated per unit. It is calculated as total cost and then thedifference is being calculated between the two levels of production or is beingcalculated between the two alternatives. Both variable costs and fixed costs may bedifferential cost when there is a change in both these costs in response to alternativecourse of action. When a decision does not affect either the variable or fixed coststhen there is no differential costs. It is a technique of costing and not a method. Onlyrelevant costs of the option are being considered. It is normally calculated on salesbasis, which gives revenue. Decision cannot be taken only on the basis of differentialcost analysis as other factors like government policies, social and financial causes,investment and the behaviour of the workers are also the influential part of thedecision-making process. Conditions and costs of different alternatives always differ,so the differential costs once calculated cannot be used without adjustments for theother decisions. As differential costs are relevant costs for future, so irrelevant costsshould be known. The costs which do not change as a result of decision are irrelevantcosts. Fixed costs are irrelevant costs as they do not change if production is expandedupto certain level.
17.2.3 Decision-Making Process
Decision-making is a process of selecting any of the alternatives available afterevaluation of all the options. Selection of one alternative out of two or more shouldmaximize the profits of the concern. Decision-making is very much related with
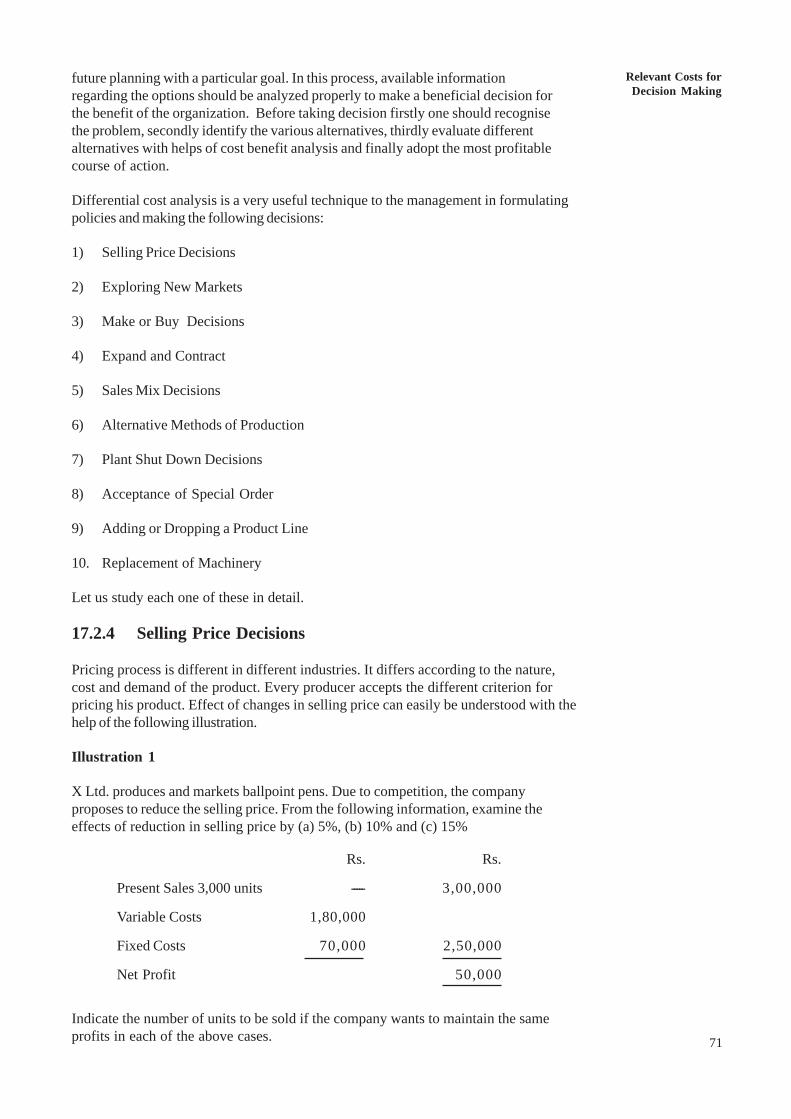
Relevant Costs forDecision Making
71
future planning with a particular goal. In this process, available informationregarding the options should be analyzed properly to make a beneficial decision forthe benefit of the organization. Before taking decision firstly one should recognisethe problem, secondly identify the various alternatives, thirdly evaluate differentalternatives with helps of cost benefit analysis and finally adopt the most profitablecourse of action.
Differential cost analysis is a very useful technique to the management in formulatingpolicies and making the following decisions:
1) Selling Price Decisions
2) Exploring New Markets
3) Make or Buy Decisions
4) Expand and Contract
5) Sales Mix Decisions
6) Alternative Methods of Production
7) Plant Shut Down Decisions
8) Acceptance of Special Order
9) Adding or Dropping a Product Line
10. Replacement of Machinery
Let us study each one of these in detail.
17.2.4 Selling Price Decisions
Pricing process is different in different industries. It differs according to the nature,cost and demand of the product. Every producer accepts the different criterion forpricing his product. Effect of changes in selling price can easily be understood with thehelp of the following illustration.
Illustration 1
X Ltd. produces and markets ballpoint pens. Due to competition, the companyproposes to reduce the selling price. From the following information, examine theeffects of reduction in selling price by (a) 5%, (b) 10% and (c) 15%
Rs. Rs.
Present Sales 3,000 units ----- 3,00,000
Variable Costs 1,80,000
Fixed Costs 70,000 2,50,000
Net Profit 50,000
Indicate the number of units to be sold if the company wants to maintain the sameprofits in each of the above cases.
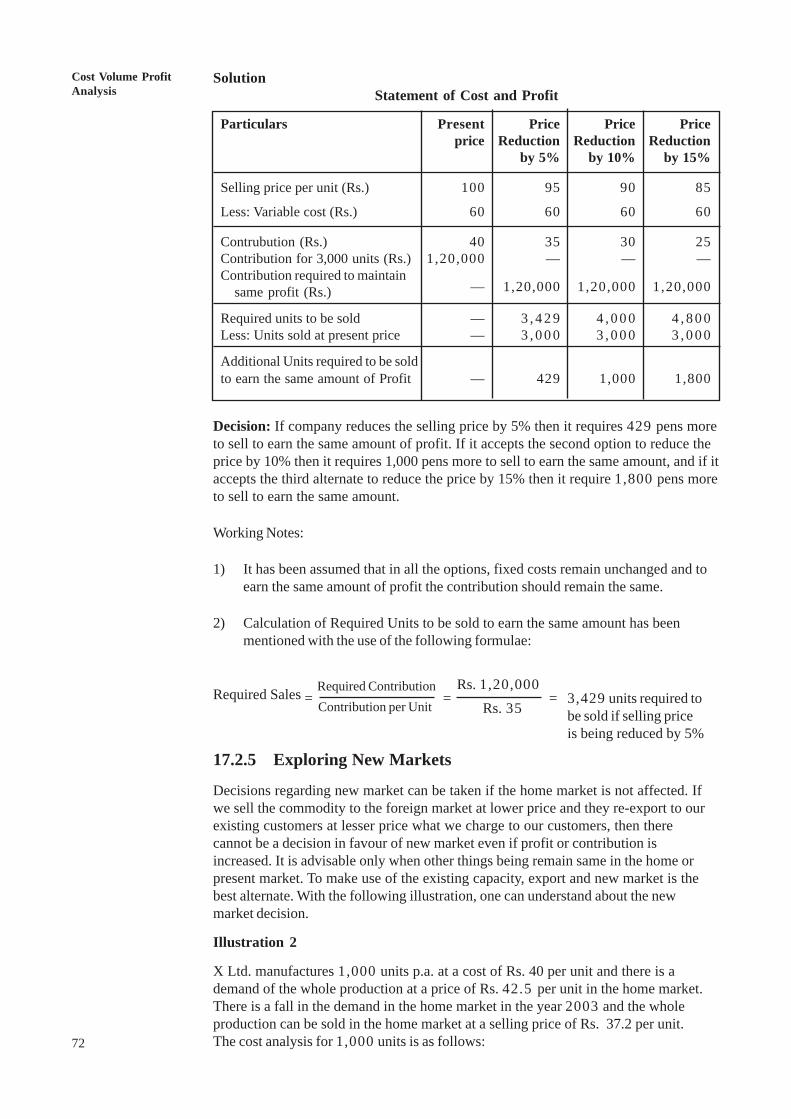
72
Cost Volume ProfitAnalysis
SolutionStatement of Cost and Profit
Particulars Present Price Price Priceprice Reduction Reduction Reduction
by 5% by 10% by 15%
Selling price per unit (Rs.) 100 95 90 85
Less: Variable cost (Rs.) 60 60 60 60
Contrubution (Rs.) 40 35 30 25Contribution for 3,000 units (Rs.) 1,20,000 — — —Contribution required to maintain
— 1,20,000 1,20,000 1,20,000same profit (Rs.)
Required units to be sold — 3 , 4 2 9 4 , 0 0 0 4 , 8 0 0Less: Units sold at present price — 3 , 0 0 0 3 , 0 0 0 3 , 0 0 0
Additional Units required to be soldto earn the same amount of Profit — 429 1,000 1,800
Decision: If company reduces the selling price by 5% then it requires 429 pens moreto sell to earn the same amount of profit. If it accepts the second option to reduce theprice by 10% then it requires 1,000 pens more to sell to earn the same amount, and if itaccepts the third alternate to reduce the price by 15% then it require 1,800 pens moreto sell to earn the same amount.
Working Notes:
1) It has been assumed that in all the options, fixed costs remain unchanged and toearn the same amount of profit the contribution should remain the same.
2) Calculation of Required Units to be sold to earn the same amount has beenmentioned with the use of the following formulae:
Rs. 1,20,000Required Sales = = = 3,429 units required to
Rs. 35 be sold if selling priceis being reduced by 5%
17.2.5 Exploring New Markets
Decisions regarding new market can be taken if the home market is not affected. Ifwe sell the commodity to the foreign market at lower price and they re-export to ourexisting customers at lesser price what we charge to our customers, then therecannot be a decision in favour of new market even if profit or contribution isincreased. It is advisable only when other things being remain same in the home orpresent market. To make use of the existing capacity, export and new market is thebest alternate. With the following illustration, one can understand about the newmarket decision.
Illustration 2
X Ltd. manufactures 1,000 units p.a. at a cost of Rs. 40 per unit and there is ademand of the whole production at a price of Rs. 42.5 per unit in the home market.There is a fall in the demand in the home market in the year 2003 and the wholeproduction can be sold in the home market at a selling price of Rs. 37.2 per unit.The cost analysis for 1,000 units is as follows:
Contribution per UnitRequired Contribution
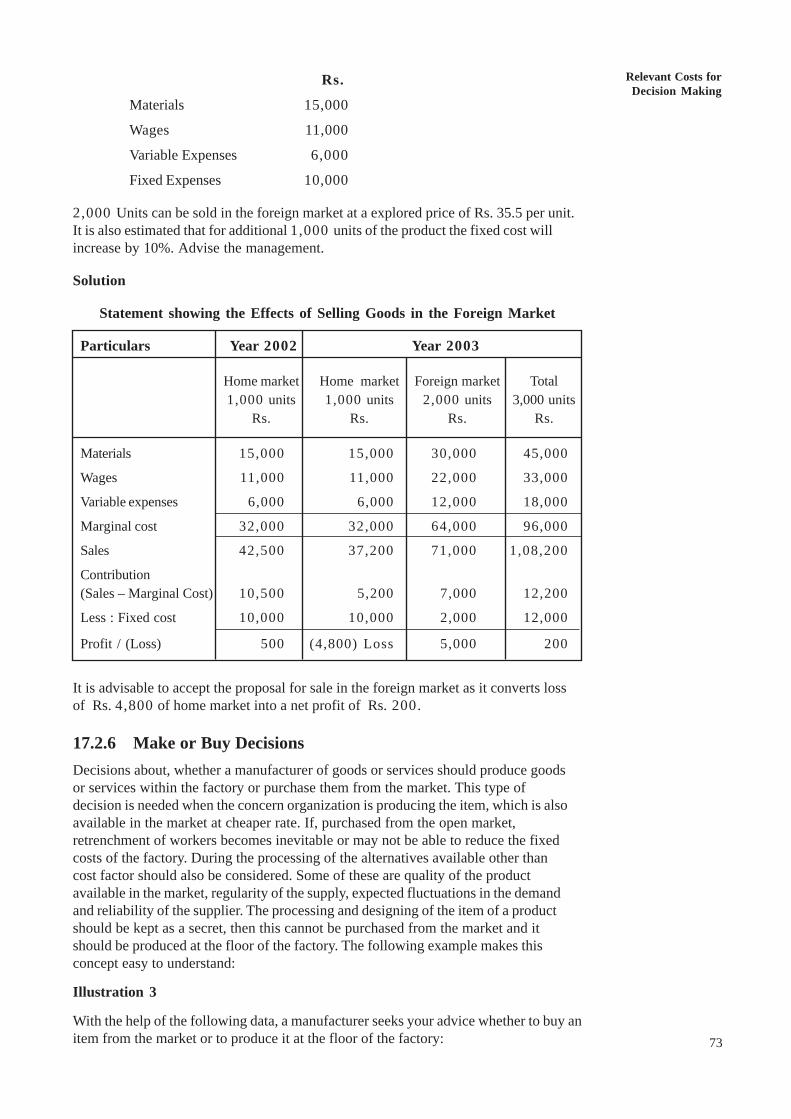
Relevant Costs forDecision Making
73
Rs.
Materials 15,000
Wages 11,000
Variable Expenses 6,000
Fixed Expenses 10,000
2,000 Units can be sold in the foreign market at a explored price of Rs. 35.5 per unit.It is also estimated that for additional 1,000 units of the product the fixed cost willincrease by 10%. Advise the management.
Solution
Statement showing the Effects of Selling Goods in the Foreign Market
Particulars Year 2002 Year 2003
Home market Home market Foreign market Total1,000 units 1,000 units 2,000 units 3,000 units
Rs. Rs. Rs. Rs.
Materials 15,000 15,000 30,000 45,000
Wages 11,000 11,000 22,000 33,000
Variable expenses 6,000 6,000 12,000 18,000
Marginal cost 32,000 32,000 64,000 96,000
Sales 42,500 37,200 71,000 1,08,200
Contribution(Sales – Marginal Cost) 10,500 5,200 7,000 12,200
Less : Fixed cost 10,000 10,000 2,000 12,000
Profit / (Loss) 500 (4,800) Loss 5,000 200
It is advisable to accept the proposal for sale in the foreign market as it converts lossof Rs. 4,800 of home market into a net profit of Rs. 200.
17.2.6 Make or Buy DecisionsDecisions about, whether a manufacturer of goods or services should produce goodsor services within the factory or purchase them from the market. This type ofdecision is needed when the concern organization is producing the item, which is alsoavailable in the market at cheaper rate. If, purchased from the open market,retrenchment of workers becomes inevitable or may not be able to reduce the fixedcosts of the factory. During the processing of the alternatives available other thancost factor should also be considered. Some of these are quality of the productavailable in the market, regularity of the supply, expected fluctuations in the demandand reliability of the supplier. The processing and designing of the item of a productshould be kept as a secret, then this cannot be purchased from the market and itshould be produced at the floor of the factory. The following example makes thisconcept easy to understand:
Illustration 3
With the help of the following data, a manufacturer seeks your advice whether to buy anitem from the market or to produce it at the floor of the factory:
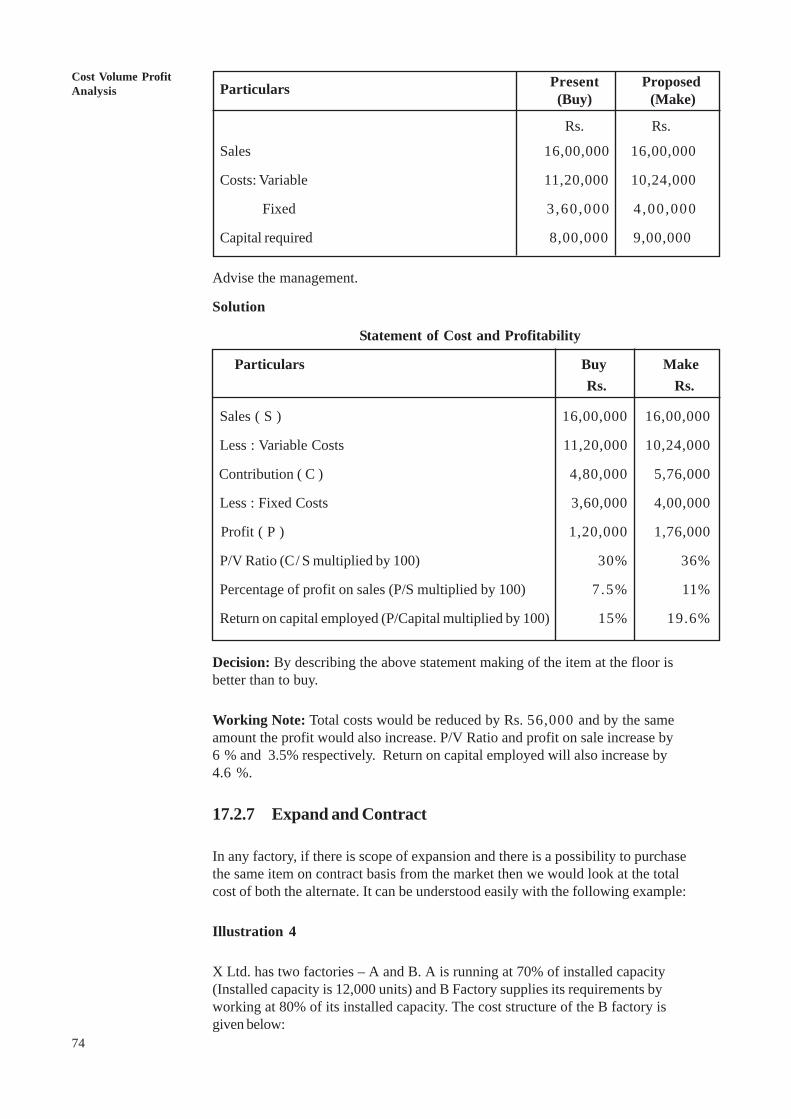
74
Cost Volume ProfitAnalysis Particulars Present Proposed
(Buy) (Make)
Rs. Rs.
Sales 16,00,000 16,00,000
Costs: Variable 11,20,000 10,24,000
Fixed 3 ,60 ,000 4 ,00 ,000
Capital required 8,00,000 9,00,000
Advise the management.
Solution
Statement of Cost and Profitability
Particulars Buy Make Rs. Rs.
Sales ( S ) 16,00,000 16,00,000
Less : Variable Costs 11,20,000 10,24,000
Contribution ( C ) 4,80,000 5,76,000
Less : Fixed Costs 3,60,000 4,00,000
Profit ( P ) 1,20,000 1,76,000
P/V Ratio (C/ S multiplied by 100) 30% 36%
Percentage of profit on sales (P/S multiplied by 100) 7.5% 11%
Return on capital employed (P/Capital multiplied by 100) 15% 19.6%
Decision: By describing the above statement making of the item at the floor isbetter than to buy.
Working Note: Total costs would be reduced by Rs. 56,000 and by the sameamount the profit would also increase. P/V Ratio and profit on sale increase by6 % and 3.5% respectively. Return on capital employed will also increase by4.6 %.
17.2.7 Expand and Contract
In any factory, if there is scope of expansion and there is a possibility to purchasethe same item on contract basis from the market then we would look at the totalcost of both the alternate. It can be understood easily with the following example:
Illustration 4
X Ltd. has two factories – A and B. A is running at 70% of installed capacity(Installed capacity is 12,000 units) and B Factory supplies its requirements byworking at 80% of its installed capacity. The cost structure of the B factory isgiven below:
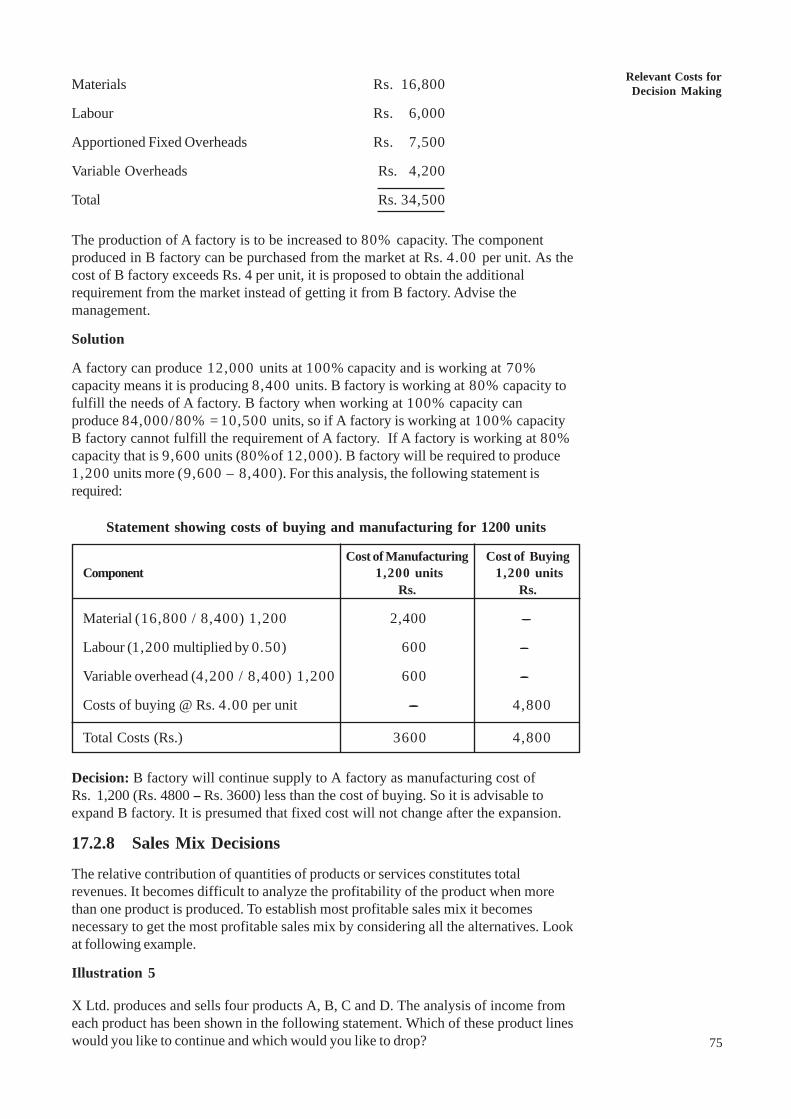
Relevant Costs forDecision Making
75
Materials Rs. 16,800
Labour Rs. 6,000
Apportioned Fixed Overheads Rs. 7,500
Variable Overheads Rs. 4,200
Total Rs. 34,500
The production of A factory is to be increased to 80% capacity. The componentproduced in B factory can be purchased from the market at Rs. 4.00 per unit. As thecost of B factory exceeds Rs. 4 per unit, it is proposed to obtain the additionalrequirement from the market instead of getting it from B factory. Advise themanagement.
Solution
A factory can produce 12,000 units at 100% capacity and is working at 70%capacity means it is producing 8,400 units. B factory is working at 80% capacity tofulfill the needs of A factory. B factory when working at 100% capacity canproduce 84,000 / 80% = 10,500 units, so if A factory is working at 100% capacityB factory cannot fulfill the requirement of A factory. If A factory is working at 80%capacity that is 9,600 units (80%of 12,000). B factory will be required to produce1,200 units more (9,600 – 8,400). For this analysis, the following statement isrequired:
Statement showing costs of buying and manufacturing for 1200 units
Cost of Manufacturing Cost of BuyingComponent 1,200 units 1,200 units
Rs. Rs.
Material (16,800 / 8,400) 1,200 2,400 -----
Labour (1,200 multiplied by 0.50) 600 -----
Variable overhead (4,200 / 8,400) 1,200 600 -----
Costs of buying @ Rs. 4.00 per unit ----- 4,800
Total Costs (Rs.) 3600 4,800
Decision: B factory will continue supply to A factory as manufacturing cost ofRs. 1,200 (Rs. 4800 -- Rs. 3600) less than the cost of buying. So it is advisable toexpand B factory. It is presumed that fixed cost will not change after the expansion.
17.2.8 Sales Mix Decisions
The relative contribution of quantities of products or services constitutes totalrevenues. It becomes difficult to analyze the profitability of the product when morethan one product is produced. To establish most profitable sales mix it becomesnecessary to get the most profitable sales mix by considering all the alternatives. Lookat following example.
Illustration 5
X Ltd. produces and sells four products A, B, C and D. The analysis of income fromeach product has been shown in the following statement. Which of these product lineswould you like to continue and which would you like to drop?
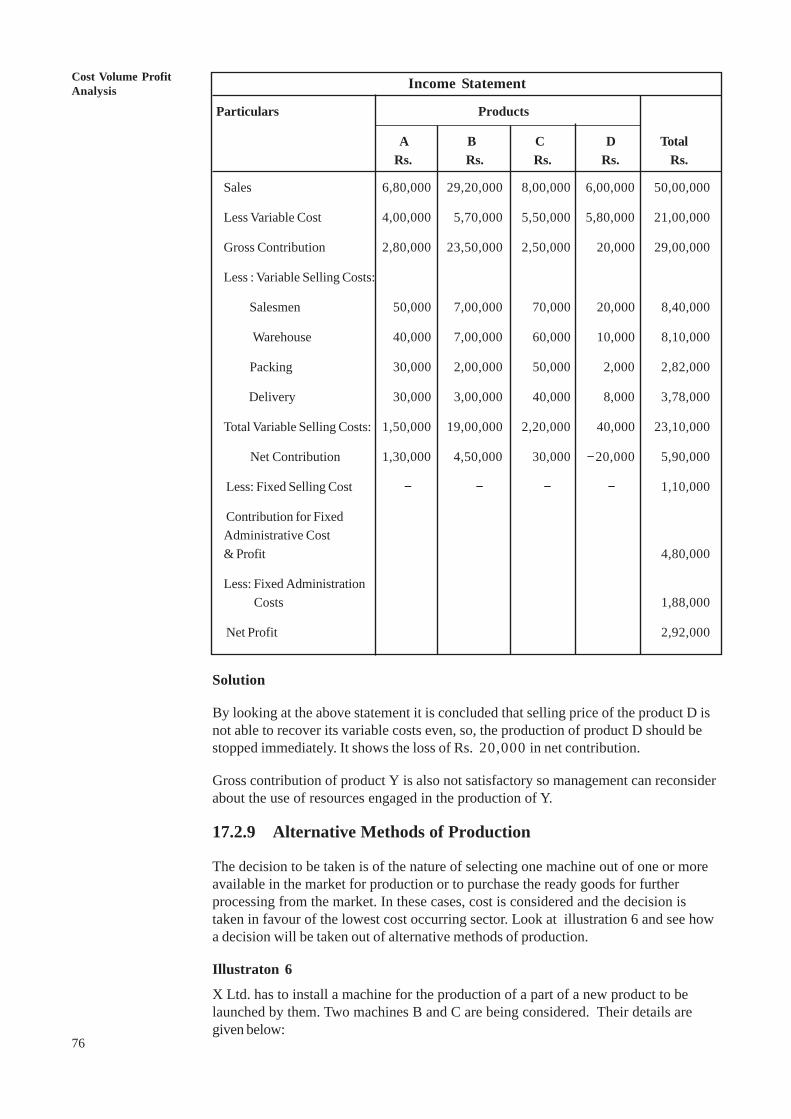
76
Cost Volume ProfitAnalysis Income Statement
Particulars Products
A B C D TotalRs. Rs. Rs. Rs. Rs.
Sales 6,80,000 29,20,000 8,00,000 6,00,000 50,00,000
Less Variable Cost 4,00,000 5,70,000 5,50,000 5,80,000 21,00,000
Gross Contribution 2,80,000 23,50,000 2,50,000 20,000 29,00,000
Less : Variable Selling Costs:
Salesmen 50,000 7,00,000 70,000 20,000 8,40,000
Warehouse 40,000 7,00,000 60,000 10,000 8,10,000
Packing 30,000 2,00,000 50,000 2,000 2,82,000
Delivery 30,000 3,00,000 40,000 8,000 3,78,000
Total Variable Selling Costs: 1,50,000 19,00,000 2,20,000 40,000 23,10,000
Net Contribution 1,30,000 4,50,000 30,000 − 20,000 5,90,000
Less: Fixed Selling Cost − − − − 1,10,000
Contribution for FixedAdministrative Cost& Profit 4,80,000
Less: Fixed Administration Costs 1,88,000
Net Profit 2,92,000
Solution
By looking at the above statement it is concluded that selling price of the product D isnot able to recover its variable costs even, so, the production of product D should bestopped immediately. It shows the loss of Rs. 20,000 in net contribution.
Gross contribution of product Y is also not satisfactory so management can reconsiderabout the use of resources engaged in the production of Y.
17.2.9 Alternative Methods of Production
The decision to be taken is of the nature of selecting one machine out of one or moreavailable in the market for production or to purchase the ready goods for furtherprocessing from the market. In these cases, cost is considered and the decision istaken in favour of the lowest cost occurring sector. Look at illustration 6 and see howa decision will be taken out of alternative methods of production.
Illustraton 6
X Ltd. has to install a machine for the production of a part of a new product to belaunched by them. Two machines B and C are being considered. Their details aregiven below:
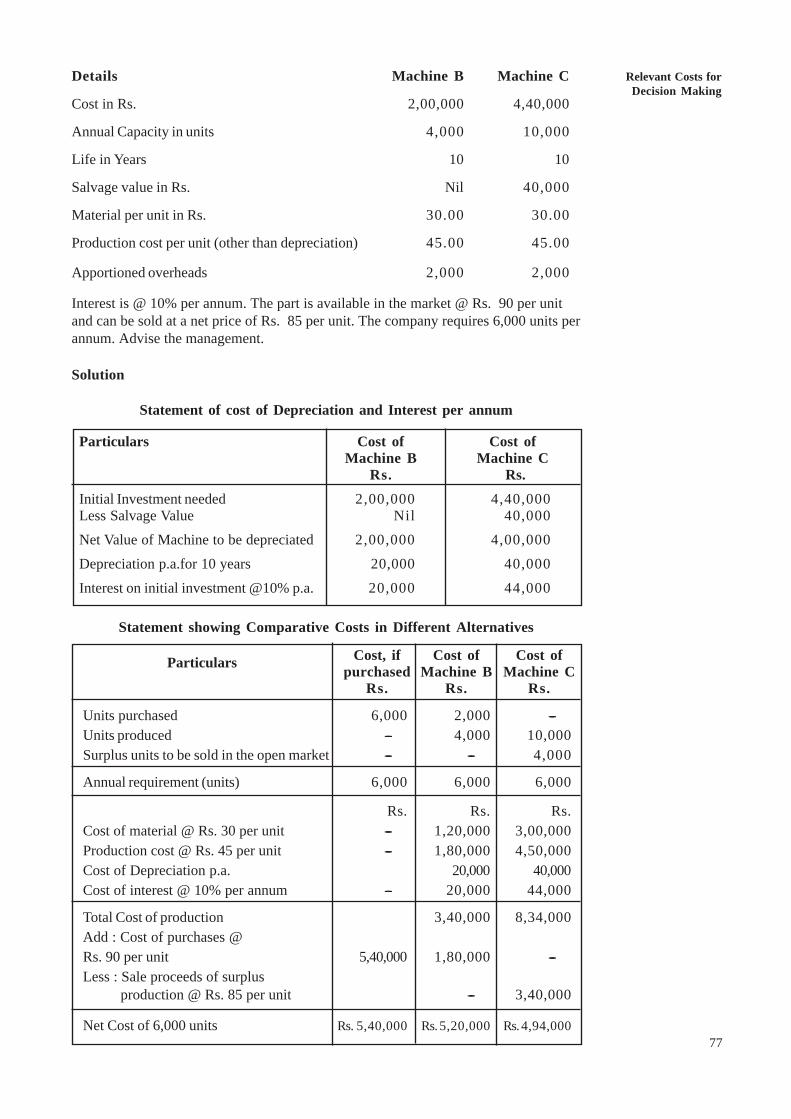
Relevant Costs forDecision Making
77
Details Machine B Machine C
Cost in Rs. 2,00,000 4,40,000
Annual Capacity in units 4,000 10,000
Life in Years 10 10
Salvage value in Rs. Nil 40,000
Material per unit in Rs. 30.00 30.00
Production cost per unit (other than depreciation) 45.00 45.00
Apportioned overheads 2,000 2,000
Interest is @ 10% per annum. The part is available in the market @ Rs. 90 per unitand can be sold at a net price of Rs. 85 per unit. The company requires 6,000 units perannum. Advise the management.
Solution
Statement of cost of Depreciation and Interest per annum
Particulars Cost of Cost ofMachine B Machine C
Rs. Rs.Initial Investment needed 2,00,000 4,40,000Less Salvage Value Nil 40,000
Net Value of Machine to be depreciated 2,00,000 4,00,000
Depreciation p.a.for 10 years 20,000 40,000
Interest on initial investment @10% p.a. 20,000 44,000
Statement showing Comparative Costs in Different Alternatives
Particulars Cost, if Cost of Cost ofpurchased Machine B Machine C
Rs. Rs. Rs.
Units purchased 6,000 2,000 ----Units produced ---- 4,000 10,000Surplus units to be sold in the open market ---- ---- 4,000
Annual requirement (units) 6,000 6,000 6,000
Rs. Rs. Rs.Cost of material @ Rs. 30 per unit ---- 1,20,000 3,00,000Production cost @ Rs. 45 per unit ---- 1,80,000 4,50,000Cost of Depreciation p.a. 20,000 40,000Cost of interest @ 10% per annum ---- 20,000 44,000
Total Cost of production 3,40,000 8,34,000Add : Cost of purchases @Rs. 90 per unit 5,40,000 1,80,000 ----Less : Sale proceeds of surplus production @ Rs. 85 per unit ---- 3,40,000
Net Cost of 6,000 units Rs. 5,40,000 Rs. 5,20,000 Rs.4,94,000
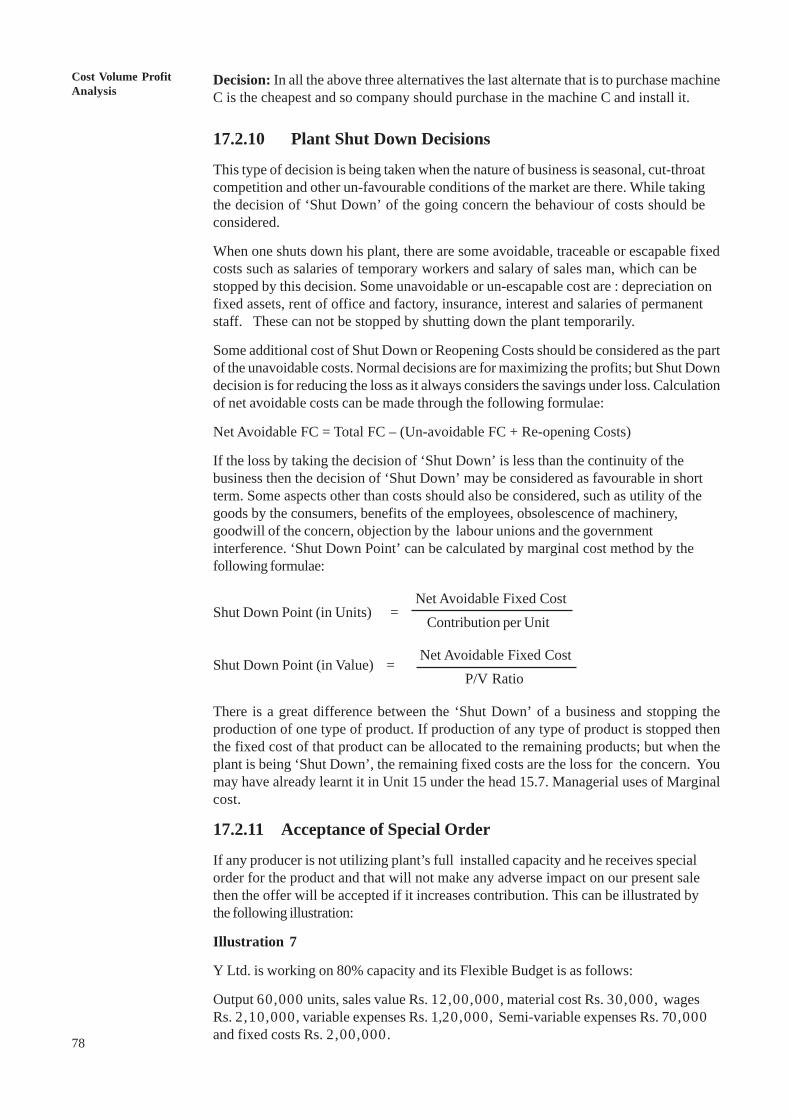
78
Cost Volume ProfitAnalysis
Decision: In all the above three alternatives the last alternate that is to purchase machineC is the cheapest and so company should purchase in the machine C and install it.
17.2.10 Plant Shut Down Decisions
This type of decision is being taken when the nature of business is seasonal, cut-throatcompetition and other un-favourable conditions of the market are there. While takingthe decision of ‘Shut Down’ of the going concern the behaviour of costs should beconsidered.
When one shuts down his plant, there are some avoidable, traceable or escapable fixedcosts such as salaries of temporary workers and salary of sales man, which can bestopped by this decision. Some unavoidable or un-escapable cost are : depreciation onfixed assets, rent of office and factory, insurance, interest and salaries of permanentstaff. These can not be stopped by shutting down the plant temporarily.
Some additional cost of Shut Down or Reopening Costs should be considered as the partof the unavoidable costs. Normal decisions are for maximizing the profits; but Shut Downdecision is for reducing the loss as it always considers the savings under loss. Calculationof net avoidable costs can be made through the following formulae:
Net Avoidable FC = Total FC – (Un-avoidable FC + Re-opening Costs)
If the loss by taking the decision of ‘Shut Down’ is less than the continuity of thebusiness then the decision of ‘Shut Down’ may be considered as favourable in shortterm. Some aspects other than costs should also be considered, such as utility of thegoods by the consumers, benefits of the employees, obsolescence of machinery,goodwill of the concern, objection by the labour unions and the governmentinterference. ‘Shut Down Point’ can be calculated by marginal cost method by thefollowing formulae:
Net Avoidable Fixed CostShut Down Point (in Units) =
Contribution per Unit
Net Avoidable Fixed CostShut Down Point (in Value) =
P/V Ratio
There is a great difference between the ‘Shut Down’ of a business and stopping theproduction of one type of product. If production of any type of product is stopped thenthe fixed cost of that product can be allocated to the remaining products; but when theplant is being ‘Shut Down’, the remaining fixed costs are the loss for the concern. Youmay have already learnt it in Unit 15 under the head 15.7. Managerial uses of Marginalcost.
17.2.11 Acceptance of Special Order
If any producer is not utilizing plant’s full installed capacity and he receives specialorder for the product and that will not make any adverse impact on our present salethen the offer will be accepted if it increases contribution. This can be illustrated bythe following illustration:
Illustration 7
Y Ltd. is working on 80% capacity and its Flexible Budget is as follows:
Output 60,000 units, sales value Rs. 12,00,000, material cost Rs. 30,000, wagesRs. 2,10,000, variable expenses Rs. 1,20,000, Semi-variable expenses Rs. 70,000and fixed costs Rs. 2,00,000.
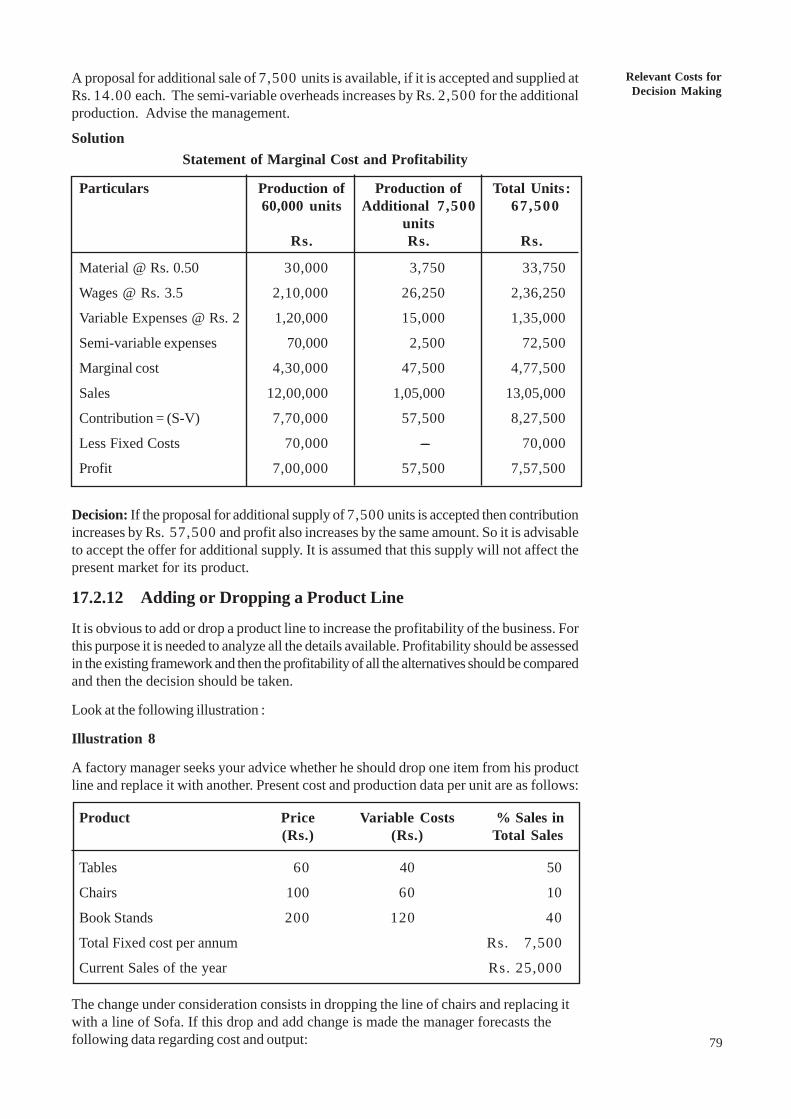
Relevant Costs forDecision Making
79
A proposal for additional sale of 7,500 units is available, if it is accepted and supplied atRs. 14.00 each. The semi-variable overheads increases by Rs. 2,500 for the additionalproduction. Advise the management.
SolutionStatement of Marginal Cost and Profitability
Particulars Production of Production of Total Units:60,000 units Additional 7,500 67,500
unitsRs. Rs. Rs.
Material @ Rs. 0.50 30,000 3,750 33,750
Wages @ Rs. 3.5 2,10,000 26,250 2,36,250
Variable Expenses @ Rs. 2 1,20,000 15,000 1,35,000
Semi-variable expenses 70,000 2,500 72,500
Marginal cost 4,30,000 47,500 4,77,500
Sales 12,00,000 1,05,000 13,05,000
Contribution = (S-V) 7,70,000 57,500 8,27,500
Less Fixed Costs 70,000 ----- 70,000
Profit 7,00,000 57,500 7,57,500
Decision: If the proposal for additional supply of 7,500 units is accepted then contributionincreases by Rs. 57,500 and profit also increases by the same amount. So it is advisableto accept the offer for additional supply. It is assumed that this supply will not affect thepresent market for its product.
17.2.12 Adding or Dropping a Product Line
It is obvious to add or drop a product line to increase the profitability of the business. Forthis purpose it is needed to analyze all the details available. Profitability should be assessedin the existing framework and then the profitability of all the alternatives should be comparedand then the decision should be taken.
Look at the following illustration :
Illustration 8
A factory manager seeks your advice whether he should drop one item from his productline and replace it with another. Present cost and production data per unit are as follows:
Product Price Variable Costs % Sales in(Rs.) (Rs.) Total Sales
Tables 60 40 50
Chairs 100 60 10
Book Stands 200 120 40
Total Fixed cost per annum Rs. 7,500
Current Sales of the year Rs. 25,000
The change under consideration consists in dropping the line of chairs and replacing itwith a line of Sofa. If this drop and add change is made the manager forecasts thefollowing data regarding cost and output:
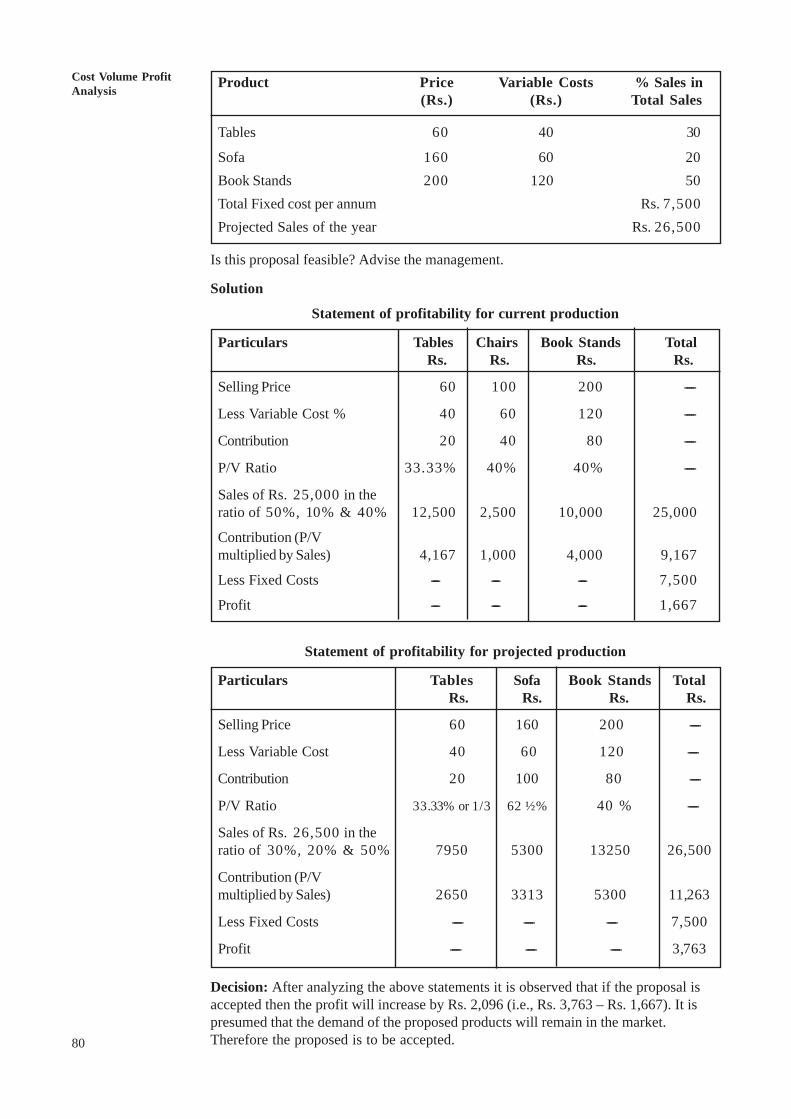
80
Cost Volume ProfitAnalysis Product Price Variable Costs % Sales in
(Rs.) (Rs.) Total Sales
Tables 60 40 30
Sofa 160 60 20Book Stands 200 120 50Total Fixed cost per annum Rs. 7,500Projected Sales of the year Rs. 26,500
Is this proposal feasible? Advise the management.
Solution
Statement of profitability for current production
Particulars Tables Chairs Book Stands Total Rs. Rs. Rs. Rs.
Selling Price 60 100 200 -----
Less Variable Cost % 40 60 120 -----
Contribution 20 40 80 -----
P/V Ratio 33.33% 40% 40% -----
Sales of Rs. 25,000 in theratio of 50%, 10% & 40% 12,500 2,500 10,000 25,000
Contribution (P/Vmultiplied by Sales) 4,167 1,000 4,000 9,167
Less Fixed Costs ----- ----- ----- 7,500
Profit ---- ----- ----- 1,667
Statement of profitability for projected production
Particulars Tables Sofa Book Stands Total Rs. Rs. Rs. Rs.
Selling Price 60 160 200 -----
Less Variable Cost 40 60 120 -----
Contribution 20 100 80 -----
P/V Ratio 33.33% or 1/3 62 ½% 40 % -----
Sales of Rs. 26,500 in theratio of 30%, 20% & 50% 7950 5300 13250 26,500
Contribution (P/Vmultiplied by Sales) 2650 3313 5300 11,263
Less Fixed Costs ----- ----- ----- 7,500
Profit ----- ----- ----- 3,763
Decision: After analyzing the above statements it is observed that if the proposal isaccepted then the profit will increase by Rs. 2,096 (i.e., Rs. 3,763 – Rs. 1,667). It ispresumed that the demand of the proposed products will remain in the market.Therefore the proposed is to be accepted.
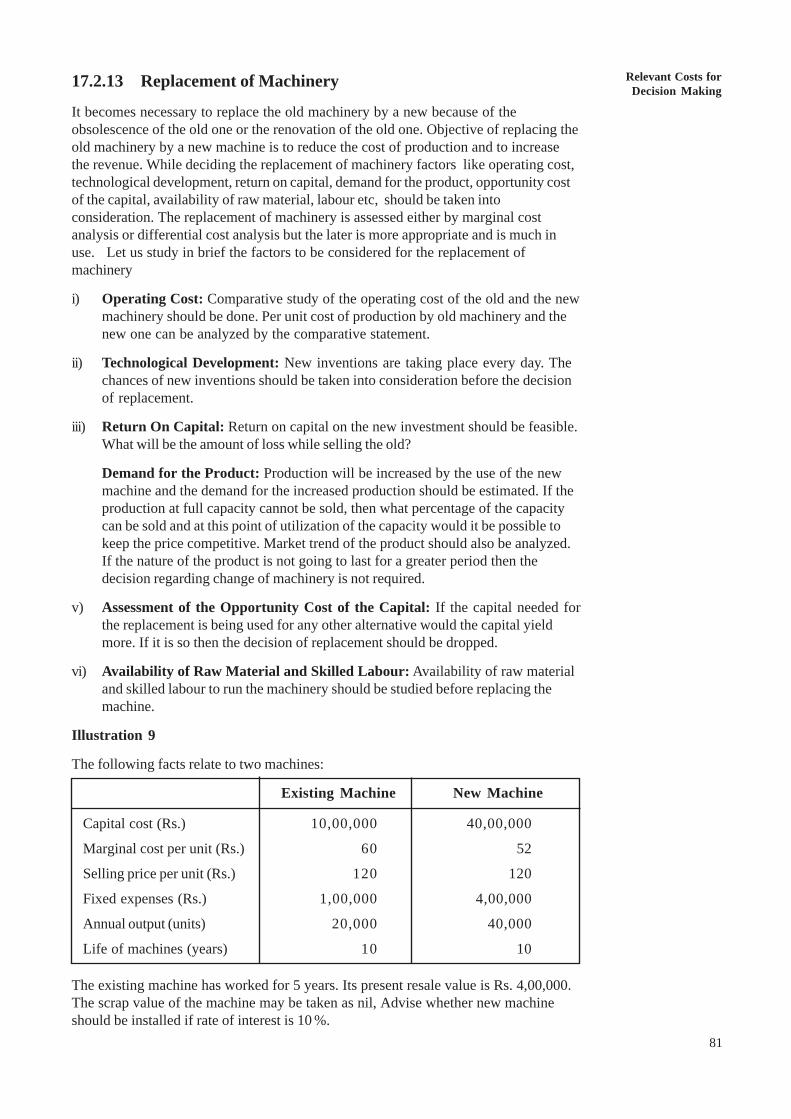
Relevant Costs forDecision Making
81
17.2.13 Replacement of Machinery
It becomes necessary to replace the old machinery by a new because of theobsolescence of the old one or the renovation of the old one. Objective of replacing theold machinery by a new machine is to reduce the cost of production and to increasethe revenue. While deciding the replacement of machinery factors like operating cost,technological development, return on capital, demand for the product, opportunity costof the capital, availability of raw material, labour etc, should be taken intoconsideration. The replacement of machinery is assessed either by marginal costanalysis or differential cost analysis but the later is more appropriate and is much inuse. Let us study in brief the factors to be considered for the replacement ofmachinery
i) Operating Cost: Comparative study of the operating cost of the old and the newmachinery should be done. Per unit cost of production by old machinery and thenew one can be analyzed by the comparative statement.
ii) Technological Development: New inventions are taking place every day. Thechances of new inventions should be taken into consideration before the decisionof replacement.
iii) Return On Capital: Return on capital on the new investment should be feasible.What will be the amount of loss while selling the old?
Demand for the Product: Production will be increased by the use of the newmachine and the demand for the increased production should be estimated. If theproduction at full capacity cannot be sold, then what percentage of the capacitycan be sold and at this point of utilization of the capacity would it be possible tokeep the price competitive. Market trend of the product should also be analyzed.If the nature of the product is not going to last for a greater period then thedecision regarding change of machinery is not required.
v) Assessment of the Opportunity Cost of the Capital: If the capital needed forthe replacement is being used for any other alternative would the capital yieldmore. If it is so then the decision of replacement should be dropped.
vi) Availability of Raw Material and Skilled Labour: Availability of raw materialand skilled labour to run the machinery should be studied before replacing themachine.
Illustration 9
The following facts relate to two machines:
Existing Machine New Machine
Capital cost (Rs.) 10,00,000 40,00,000
Marginal cost per unit (Rs.) 60 52
Selling price per unit (Rs.) 120 120
Fixed expenses (Rs.) 1,00,000 4,00,000
Annual output (units) 20,000 40,000
Life of machines (years) 10 10
The existing machine has worked for 5 years. Its present resale value is Rs. 4,00,000.The scrap value of the machine may be taken as nil, Advise whether new machineshould be installed if rate of interest is 10 %.
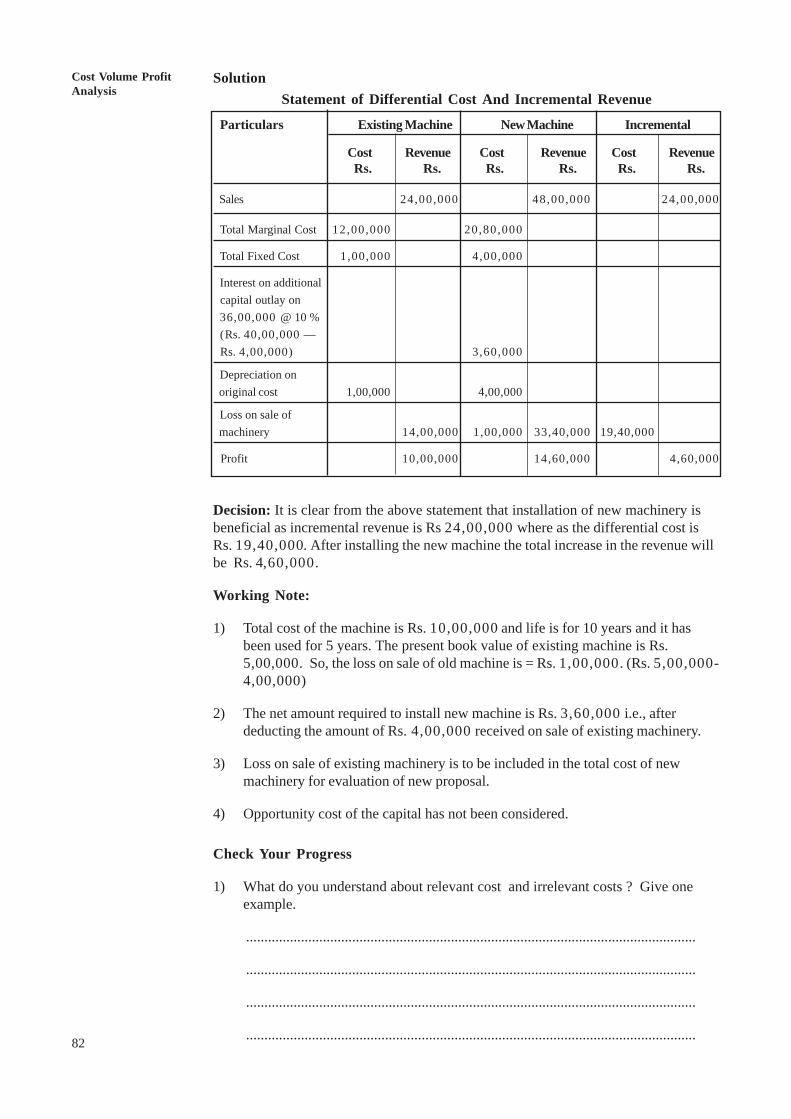
82
Cost Volume ProfitAnalysis
SolutionStatement of Differential Cost And Incremental Revenue
Particulars Existing Machine New Machine Incremental
Cost Revenue Cost Revenue Cost Revenue Rs. Rs. Rs. Rs. Rs. Rs.
Sales 24,00,000 48,00,000 24,00,000
Total Marginal Cost 12,00,000 20,80,000
Total Fixed Cost 1,00,000 4,00,000
Interest on additional capital outlay on 36,00,000 @ 10 % (Rs. 40,00,000 — Rs. 4,00,000) 3,60,000
Depreciation on original cost 1,00,000 4,00,000
Loss on sale of machinery 14,00,000 1,00,000 33,40,000 19,40,000
Profit 10,00,000 14,60,000 4,60,000
Decision: It is clear from the above statement that installation of new machinery isbeneficial as incremental revenue is Rs 24,00,000 where as the differential cost isRs. 19,40,000. After installing the new machine the total increase in the revenue willbe Rs. 4,60,000.
Working Note:
1) Total cost of the machine is Rs. 10,00,000 and life is for 10 years and it hasbeen used for 5 years. The present book value of existing machine is Rs.5,00,000. So, the loss on sale of old machine is = Rs. 1,00,000. (Rs. 5,00,000-4,00,000)
2) The net amount required to install new machine is Rs. 3,60,000 i.e., afterdeducting the amount of Rs. 4,00,000 received on sale of existing machinery.
3) Loss on sale of existing machinery is to be included in the total cost of newmachinery for evaluation of new proposal.
4) Opportunity cost of the capital has not been considered.
Check Your Progress
1) What do you understand about relevant cost and irrelevant costs ? Give oneexample.
...........................................................................................................................
...........................................................................................................................
...........................................................................................................................
...........................................................................................................................
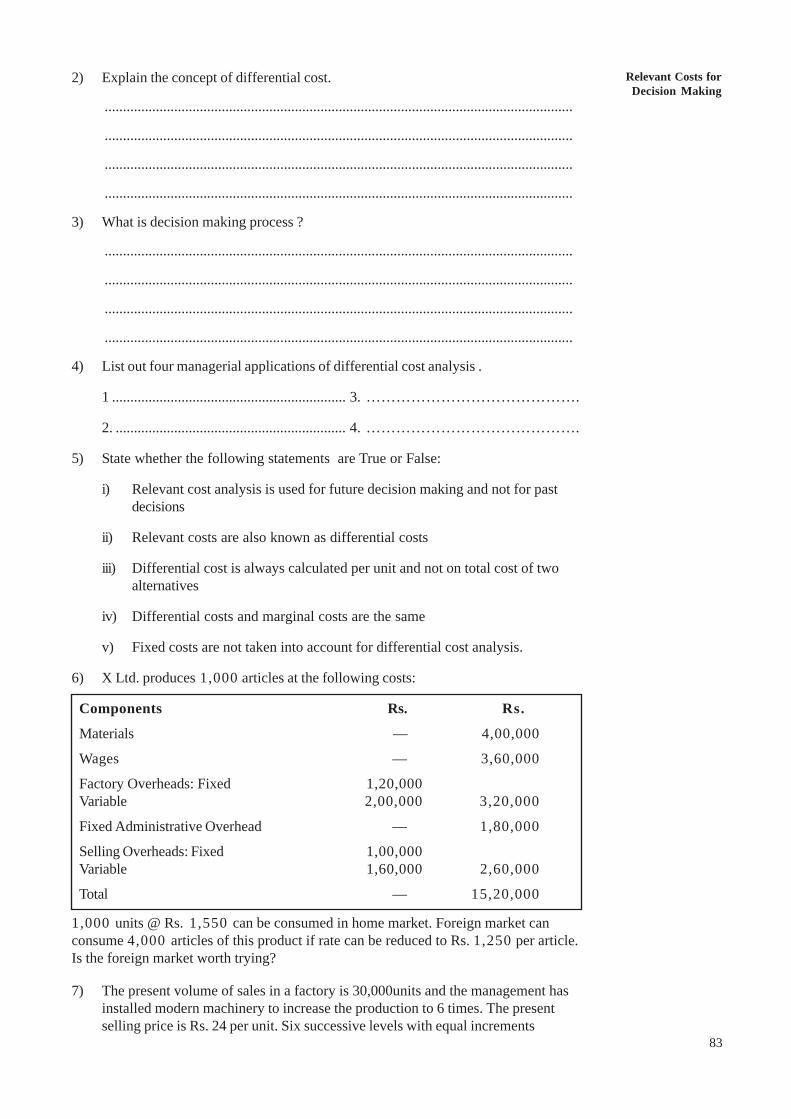
Relevant Costs forDecision Making
83
2) Explain the concept of differential cost.
................................................................................................................................
................................................................................................................................
................................................................................................................................
................................................................................................................................
3) What is decision making process ?
................................................................................................................................
................................................................................................................................
................................................................................................................................
................................................................................................................................
4) List out four managerial applications of differential cost analysis .
1 ................................................................ 3. …………………………………….
2. ............................................................... 4. …………………………………….
5) State whether the following statements are True or False:
i) Relevant cost analysis is used for future decision making and not for pastdecisions
ii) Relevant costs are also known as differential costs
iii) Differential cost is always calculated per unit and not on total cost of twoalternatives
iv) Differential costs and marginal costs are the same
v) Fixed costs are not taken into account for differential cost analysis.
6) X Ltd. produces 1,000 articles at the following costs:
Components Rs. Rs.
Materials — 4,00,000
Wages — 3,60,000
Factory Overheads: Fixed 1,20,000Variable 2,00,000 3,20,000
Fixed Administrative Overhead — 1,80,000
Selling Overheads: Fixed 1,00,000Variable 1,60,000 2,60,000
Total — 15,20,000
1,000 units @ Rs. 1,550 can be consumed in home market. Foreign market canconsume 4,000 articles of this product if rate can be reduced to Rs. 1,250 per article.Is the foreign market worth trying?
7) The present volume of sales in a factory is 30,000units and the management hasinstalled modern machinery to increase the production to 6 times. The presentselling price is Rs. 24 per unit. Six successive levels with equal increments
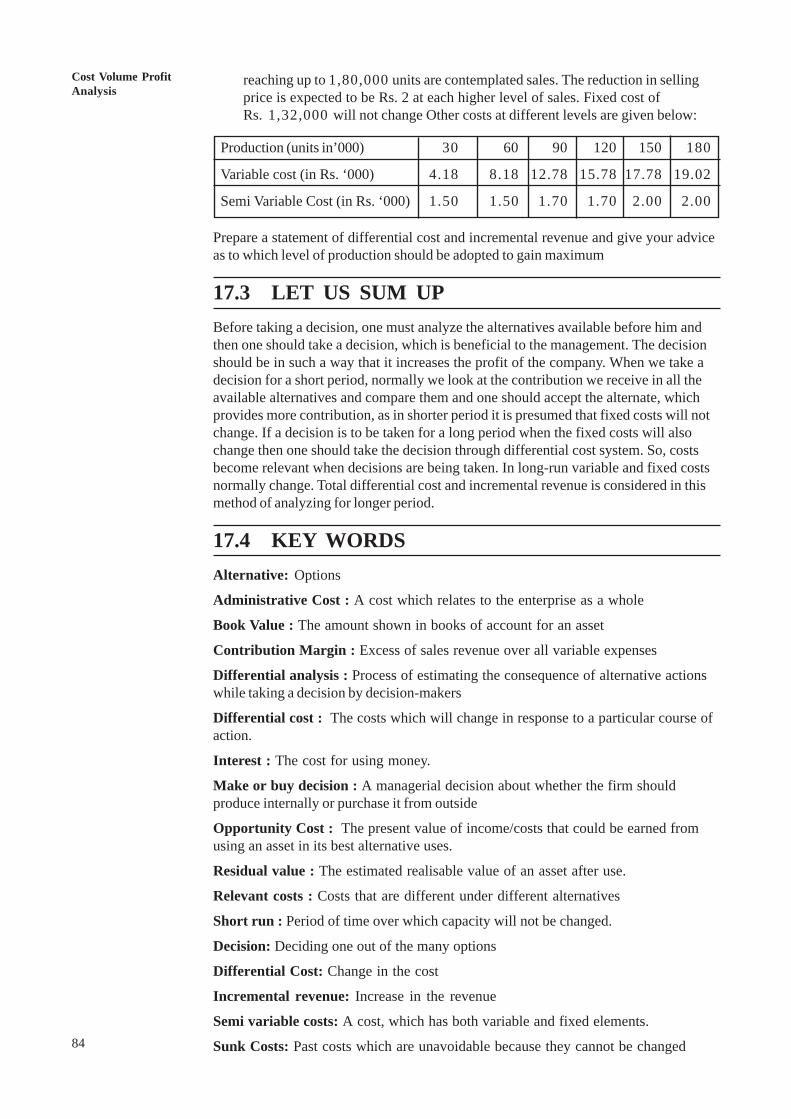
84
Cost Volume ProfitAnalysis
reaching up to 1,80,000 units are contemplated sales. The reduction in sellingprice is expected to be Rs. 2 at each higher level of sales. Fixed cost ofRs. 1,32,000 will not change Other costs at different levels are given below:
Production (units in’000) 30 60 90 120 150 180
Variable cost (in Rs. ‘000) 4.18 8.18 12.78 15.78 17.78 19.02
Semi Variable Cost (in Rs. ‘000) 1.50 1.50 1.70 1.70 2.00 2.00
Prepare a statement of differential cost and incremental revenue and give your adviceas to which level of production should be adopted to gain maximum
17.3 LET US SUM UPBefore taking a decision, one must analyze the alternatives available before him andthen one should take a decision, which is beneficial to the management. The decisionshould be in such a way that it increases the profit of the company. When we take adecision for a short period, normally we look at the contribution we receive in all theavailable alternatives and compare them and one should accept the alternate, whichprovides more contribution, as in shorter period it is presumed that fixed costs will notchange. If a decision is to be taken for a long period when the fixed costs will alsochange then one should take the decision through differential cost system. So, costsbecome relevant when decisions are being taken. In long-run variable and fixed costsnormally change. Total differential cost and incremental revenue is considered in thismethod of analyzing for longer period.
17.4 KEY WORDSAlternative: Options
Administrative Cost : A cost which relates to the enterprise as a whole
Book Value : The amount shown in books of account for an asset
Contribution Margin : Excess of sales revenue over all variable expenses
Differential analysis : Process of estimating the consequence of alternative actionswhile taking a decision by decision-makers
Differential cost : The costs which will change in response to a particular course ofaction.
Interest : The cost for using money.
Make or buy decision : A managerial decision about whether the firm shouldproduce internally or purchase it from outside
Opportunity Cost : The present value of income/costs that could be earned fromusing an asset in its best alternative uses.
Residual value : The estimated realisable value of an asset after use.
Relevant costs : Costs that are different under different alternatives
Short run : Period of time over which capacity will not be changed.
Decision: Deciding one out of the many options
Differential Cost: Change in the cost
Incremental revenue: Increase in the revenue
Semi variable costs: A cost, which has both variable and fixed elements.
Sunk Costs: Past costs which are unavoidable because they cannot be changed
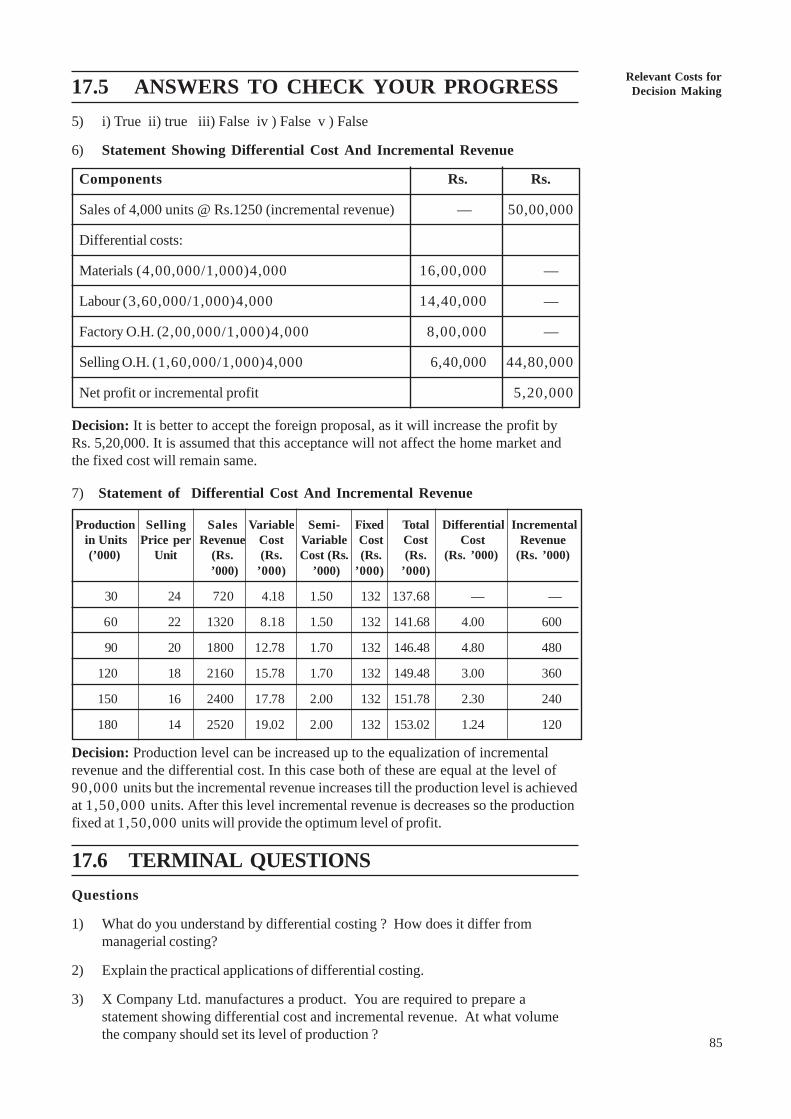
Relevant Costs forDecision Making
85
17.5 ANSWERS TO CHECK YOUR PROGRESS5) i) True ii) true iii) False iv ) False v ) False
6) Statement Showing Differential Cost And Incremental Revenue
Components Rs. Rs.
Sales of 4,000 units @ Rs.1250 (incremental revenue) — 50,00,000
Differential costs:
Materials (4,00,000/1,000)4,000 16,00,000 —
Labour (3,60,000/1,000)4,000 14,40,000 —
Factory O.H. (2,00,000/1,000)4,000 8,00,000 —
Selling O.H. (1,60,000/1,000)4,000 6,40,000 44,80,000
Net profit or incremental profit 5,20,000
Decision: It is better to accept the foreign proposal, as it will increase the profit byRs. 5,20,000. It is assumed that this acceptance will not affect the home market andthe fixed cost will remain same.
7) Statement of Differential Cost And Incremental Revenue
Production Selling Sales Variable Semi- Fixed Total Differential Incremental in Units Price per Revenue Cost Variable Cost Cost Cost Revenue (’000) Unit (Rs. (Rs. Cost (Rs . (Rs. (Rs. (Rs. ’000) (Rs. ’000)
’000) ’000) ’000) ’000) ’000)
30 24 720 4.18 1.50 132 137.68 — —
60 22 1320 8.18 1.50 132 141.68 4.00 600
90 20 1800 12.78 1.70 132 146.48 4.80 480
120 18 2160 15.78 1.70 132 149.48 3.00 360
150 16 2400 17.78 2.00 132 151.78 2.30 240
180 14 2520 19.02 2.00 132 153.02 1.24 120
Decision: Production level can be increased up to the equalization of incrementalrevenue and the differential cost. In this case both of these are equal at the level of90,000 units but the incremental revenue increases till the production level is achievedat 1,50,000 units. After this level incremental revenue is decreases so the productionfixed at 1,50,000 units will provide the optimum level of profit.
17.6 TERMINAL QUESTIONSQuestions
1) What do you understand by differential costing ? How does it differ frommanagerial costing?
2) Explain the practical applications of differential costing.
3) X Company Ltd. manufactures a product. You are required to prepare astatement showing differential cost and incremental revenue. At what volumethe company should set its level of production ?
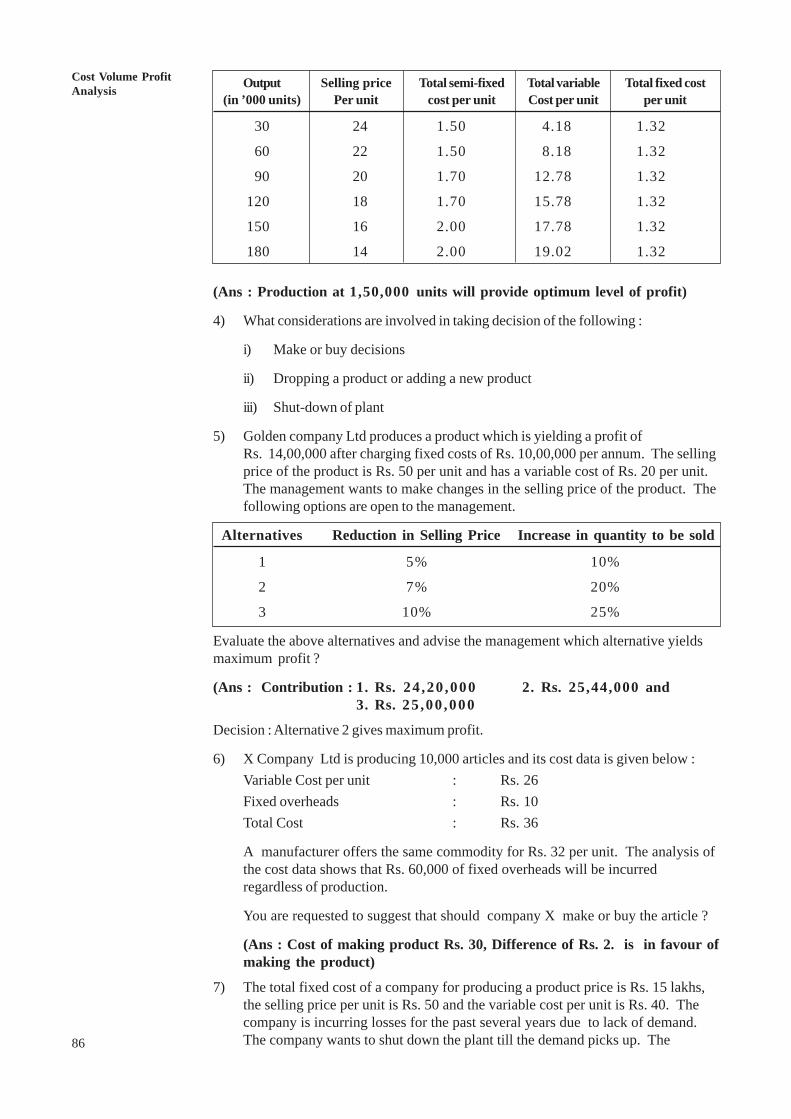
86
Cost Volume ProfitAnalysis Output Selling price Total semi-fixed Total variable Total fixed cost
(in ’000 units) Per unit cost per unit Cost per unit per unit
30 24 1.50 4.18 1.32
60 22 1.50 8.18 1.32
90 20 1.70 12.78 1.32
120 18 1.70 15.78 1.32
150 16 2.00 17.78 1.32
180 14 2.00 19.02 1.32
(Ans : Production at 1,50,000 units will provide optimum level of profit)
4) What considerations are involved in taking decision of the following :
i) Make or buy decisions
ii) Dropping a product or adding a new product
iii) Shut-down of plant
5) Golden company Ltd produces a product which is yielding a profit ofRs. 14,00,000 after charging fixed costs of Rs. 10,00,000 per annum. The sellingprice of the product is Rs. 50 per unit and has a variable cost of Rs. 20 per unit.The management wants to make changes in the selling price of the product. Thefollowing options are open to the management.
Alternatives Reduction in Selling Price Increase in quantity to be sold
1 5% 10%
2 7% 20%
3 10% 25%
Evaluate the above alternatives and advise the management which alternative yieldsmaximum profit ?
(Ans : Contribution : 1. Rs. 24 ,20 ,000 2. Rs. 25,44,000 and3. Rs. 25 ,00 ,000
Decision : Alternative 2 gives maximum profit.
6) X Company Ltd is producing 10,000 articles and its cost data is given below :Variable Cost per unit : Rs. 26Fixed overheads : Rs. 10Total Cost : Rs. 36
A manufacturer offers the same commodity for Rs. 32 per unit. The analysis ofthe cost data shows that Rs. 60,000 of fixed overheads will be incurredregardless of production.
You are requested to suggest that should company X make or buy the article ?
(Ans : Cost of making product Rs. 30, Difference of Rs. 2. is in favour ofmaking the product)
7) The total fixed cost of a company for producing a product price is Rs. 15 lakhs,the selling price per unit is Rs. 50 and the variable cost per unit is Rs. 40. Thecompany is incurring losses for the past several years due to lack of demand.The company wants to shut down the plant till the demand picks up. The
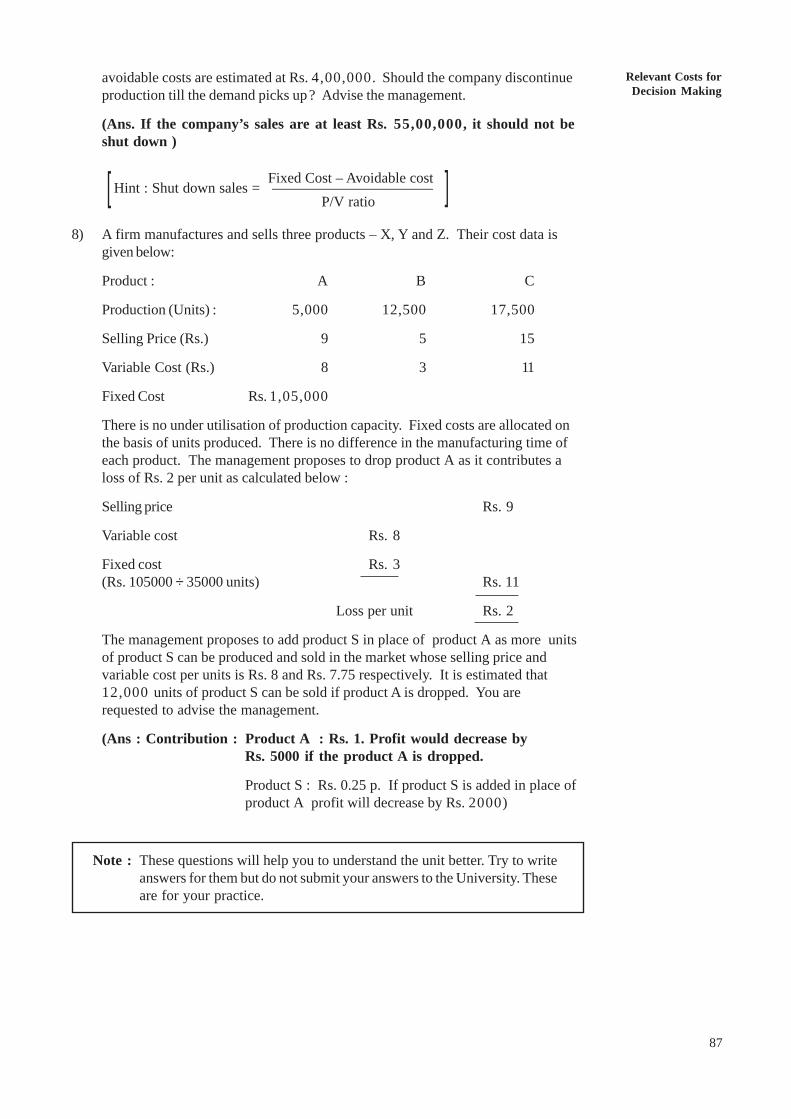
Relevant Costs forDecision Making
87
avoidable costs are estimated at Rs. 4,00,000. Should the company discontinueproduction till the demand picks up? Advise the management.
(Ans. If the company’s sales are at least Rs. 55,00,000, it should not beshut down )
Fixed Cost – Avoidable cost Hint : Shut down sales = ———————————
P/V ratio
8) A firm manufactures and sells three products – X, Y and Z. Their cost data isgiven below:
Product : A B C
Production (Units) : 5,000 12,500 17,500
Selling Price (Rs.) 9 5 15
Variable Cost (Rs.) 8 3 11
Fixed Cost Rs. 1,05,000
There is no under utilisation of production capacity. Fixed costs are allocated onthe basis of units produced. There is no difference in the manufacturing time ofeach product. The management proposes to drop product A as it contributes aloss of Rs. 2 per unit as calculated below :
Selling price Rs. 9
Variable cost Rs. 8
Fixed cost Rs. 3(Rs. 105000 ÷ 35000 units) Rs. 11
Loss per unit Rs. 2
The management proposes to add product S in place of product A as more unitsof product S can be produced and sold in the market whose selling price andvariable cost per units is Rs. 8 and Rs. 7.75 respectively. It is estimated that12,000 units of product S can be sold if product A is dropped. You arerequested to advise the management.
(Ans : Contribution : Product A : Rs. 1. Profit would decrease byRs. 5000 if the product A is dropped.
Product S : Rs. 0.25 p. If product S is added in place ofproduct A profit will decrease by Rs. 2000)
Note : These questions will help you to understand the unit better. Try to writeanswers for them but do not submit your answers to the University. Theseare for your practice.
[ ]
UNIT 18 REPORTING TOMANAGEMENT
Structure18.0 Objectives
18.1 Introduction
18.2 Concept of Management Reporting
18.3 Objectives of Reporting
18.4 Reporting Needs at Different Managerial Levels
18.5 Types of Reports
18.6 Modes of Reporting
18.7 Essentials of Successful Reporting (Guiding Principles)
18.8 Let Us Sum Up
18.9 Key Words
18.10 Answers to Check Your Progress
18.11 Terminal Questions
18.0 OBJECTIVESAfter studying this unit, you should be able to :
! understand the report for the specific purpose;
! follow the pattern of reports and apply these to your decisions;
! prepare good reports;
! know the needs of the reports; and
! use the reports for data base.
18.1 INTRODUCTIONThe purpose of reporting is to provide the information needed by the concerned party.The value of information is determined by how the information meets the needs of theusers. This information creates an atmosphere for internal decision makers. Thecommunication of the information between two or more parties through reports isknown as reporting. Report is the essence of the management information system.Report is a statement containing facts and if they contain accounting information anddata they are called accounting reports. So, report may be known as process ofproviding accounting information to those who needs to make decisions. Report maybe for the past, present and for the future developments. In this unit you will studyabout the objectives of reporting, need of reporting at different managerial levels, typesand modes of reporting and essentials of a successful reporting.
18.2 CONCEPT OF MANAGEMENT REPORTINGReporting can be defined as communication of statements with related informationbetween the two parties. The process of providing information to the management isknown as management reporting. These reports are provided to the various levels of88
Reporting toManagement
89
management on regular basis to keep the management abreast about the effectivenessof their respective responsibility. Reporting is an important function of the managementaccountant as the efficient and smooth working of the business depends upon the goodreporting. The effectiveness of reporting to management to a large extent dependsupon the form and timing of its presentation. The process of reporting to managementis concerned with proper selection of financial and operating data, arranginginformation in a proper form, analysing and interpreting the data and then reporting it tothe management through an appropriate method.
18.3 OBJECTIVES OF REPORTINGMain objectives of reporting can be divided under the following heads:
Accounting reports consist of financial statistics. Management cannot analyse allsignificant facts regarding its business especially in case of large scale productionwhere the business operations are more complex in nature. Accounting reports helpsto get full information about the its entire operative activity of the firm.
i) Providing accounting information: Accounting reports consist of financialstatistics. Management may not analyse all significant facts regarding its businessoperations especially in case of large scale production where the businessoperations are more complex in nature. Accounting reports help to get fullinformation about its entire operative activity of the firm. Thus importantobjective of the reporting is to provide accounting information to operating and toplevel management in accurate form in understandable brief manner.
ii) To take right decision: To help the management in taking the right decisionswith suitable statements provided by the management accountant.
iii) Acceptability of the decision by all: Reporting leads to motivate people,increases efficiency and boosting the morale of the people engaged in the variousaspects of the work of the enterprise.
iv) Maximizing the profits: To achieve this ultimate goal of any business reportingat the right time, at right place to the right person in right manner becomes anessential feature.
v) For better control: Abnormal events can be checked in time by obtaining thenecessary information in respect of each operating activity. Control throughreports become effective as compared to personal investigations.
18.4 REPORTING NEEDS AT DIFFERENTMANAGERIAL LEVELS
Reporting is the lifeline of the organization. It helps in planning and control and worksas a media of communication and stimulates corrective action. Accounting systembecomes useless, if the business has no system of reporting because all decisions arenormally based on reporting system.
Need of reporting differs at different management levels. This also differs to the usercommunity also. There are three levels of management and the reports can beclassified according to the needs as follows:
1) Top-Level Management Reports
2) Middle Level Management Reports
3) Lower Level Management Reports
90
Cost Volume ProfitAnalysis
1) Top Management Reports
At this level reports are concerned with the following matters:
l For determining the aims of the enterprise;
l For formulation of policies and plans;
l For delegation of responsibility in successful manner to executives for the bestutlization of resources; and
l For formulating special significant plans.
It can be assumed that top brass of the business only needs reports for cost andoperational control. The report submitted to the level should be brief or we can callit a summarized statement, which provides an overall view on the subject. Previouslythese reports used to be submitted within the time framework. The time frameworkmay be monthly, quarterly or yearly. With the use of information technology and thereal time accounting, the whole time framework has been changed and now thesecan be made available online.
Reports to top level management consist of the following:
a) Reports to the Board of Directors
b) Reports to the Chief Finance Officer
c) Reports to the Chief Production officer, and
d) Reports to the Chief Executive Marketing and Sales .
Let us study these reports in brief.
a) Reports to the Board of Directors : Generally, following reports are to besubmitted to the Board of Directors and the Chief Executive Officer (C.E.O.):i) Different budgets,
ii) Machine utilization statement
iii) Work force utilization statement
iv) Cost analysis statement
v ) Fund flow statement
vi) Cash flow statement, and
vii) Balance sheet and income statement
b) Reports to the Chief Finance Officer : Following reports are to besubmitted to the Chief Finance Officer (C.F.O.) :
i) Cash flow statement,
ii) Funds flow statement,
iii) Abstract of receipts and payments and
iv) Report regarding any special problem such as make or buy,replacement of old assets or any other.
c) Reports to the Chief Production Officer: Following reports are to besubmitted to the Chief Production Officer (C.P.O.) :
i) Cost analysis statement
ii) Machine utilization report
iii) Work force utilization statement
Reporting toManagement
91
iv) Materials statement,
v) Production statement showing budgeted and actual with variance and
vi) Overheads cost statementd ) Report to the Chief Executive Marketing and Sales : Following reports
are to be submitted to the Chief Executive Marketing and Sales:i ) Sales summary
ii) Reports on credit collection
iii) Reports of orders received and executed and outstanding orders
iv) Report on stock of finished goods
2) Middle Level Management ReportsThe middle level management consists of the heads of various departments. Thereports at this level should show the efficiency and cost data relating to differentdepartments. At this level execution of plans formulated by the top managementis worked out and all the managers in each department are concerned with this.It is also the function of middle level management to coordinate differentactivities of different departments. The reports at middle level managementconsists of the following:a) Report to the General Manager : The following Reports are to be submitted
to the General Manager :
i) Administration budget,
ii) Cash and capital budget,
iii) Salaries statement of staff and
iv) Research and development budgetb) Report to the Finance Manager : The reports to be submitted to the Finance
Manager are:
i) Funds flow statement
ii) Cash flow statement
iii) Cash and bank reports
iv) Debtor’s collection period reports
v) Average payment period reportsc) Reports to the Purchase Manager : The following reports are to be
submitted to the Purchase Manager:
i) Stock level of raw material,
ii) Use of raw material,
iii) Raw material budget and actual purchases, and
iv) Budgeted cost and actual cost of purchasesd) Reports to the Works Manager : The reports submitted to the Works
Manager are:i) Production cost report
ii) Raw material budget and actual consumption
iii) Production budget and actual production
iv) Idle time report
v) Idle capacity report
92
Cost Volume ProfitAnalysis
e) Reports to the Sales and Marketing Managers : The following reportsare to be submitted to the Sales and Marketing Manager:
i) Report of budgeted and actual sales,
ii) Report of orders booked and executed,
iii) Statement of sales ,
iv) Finished goods stock position and
v) Position of collections and debtors.
With modernization and adoption of computers in the business house, thereporting period has been reduced tremendously and the data are ready athand and these can be used to prepare reports instantly. Middle levelmanagement is connected on line with the computers within the organization,so preparation of reports has become easy.
3) Lower Level Management Reports
At this level foremen and supervisors are concerned at the floor and theyprepare their reports physically without any expert opinion. They areconcerned with the daily work and they infuse a certain amount ofcompetitive spirit among the workers by comparing the output per man perhour in a similar job. These reports include the following factors:
i) Workers efficiency report,
ii) Daily production report,
iii) Workers utilization report and
iv) Scrap report
v) Over-time report
vi) Material spoilage report
vii) Accident report etc.
18.5 TYPES OF REPORTSReports can be classified in various ways in which the different reports are presentedto the management such as :
1) Users Reports
2) Reports Based on Information
3) Reports Based on Nature
4) Functional Classification of Reports
Let us study each of them in brief.
1) Users Reports
Depending upon users, reports can be classified as follows :
i) Internal Users Report
ii) Special Reports
iii) Routine Reports
iv) Management Level Reports
v) External Users Reports
Reporting toManagement
93
Reports can be prepared according to the users. They can be:
i) Internal Users: Reports, which are prepared for the use of different levelsof management and for the use of the employees are known as the reports forinternal users. These are not public documents. These reports are aimed todifferent levels of management.
ii) Special Reports: These reports play a vital part in decision-making. Theyare prepared for specific reasons. While preparing this type of report the problemunder study should be clearly be defined and understood and effect of cost andincome should be considered. Comparison of cost of study and estimation ofcost and income relating to the problem should also be considered. Thesereports can be prepared for any of the problems relating to : i) market analysisii) Make or buy decisions iii) Problems of raw material iv) Technologicalchanges v) labour problems vi) Cost reduction schemes or any other problemsas discussed in Unit 18 of this course.
iii) Routine Reports: These are only control reports and they are required onlywhen a control system exists. These are prepared daily as per scheduled timeregarding activities. Production operation reports, cost reports, research anddevelopment reports, various budget reports, utilization of man, machine andmaterial reports, report regarding customer default, sales and distribution report,administration reports, income statement and balance sheet and cash flowstatement are included in this classification.
iv) Management Level Reports: Main classification of these reports havebeen provided while describing the reporting needs at different managementlevels at 18.3.3.
v) Reports for External Users: These reports are prepared for the externalusers who have interest in the enterprise. They are the shareholders,debenture holders, creditors, bankers, other financial institutions, stockexchange and the Government. They may be interested in knowing thefinancial position, progress made, future-plans and growth of the company.While preparing these reports, the information regarding the interest of allthe external users should be taken into consideration. For example, theprofit and loss account and balance sheet are prepared every year and thesestatements are to be filed with the Registrar of Companies and also stockexchange authorities.
2) Reports Based on Information
There are two types of information reports. They are : i) Operating Reports,and ii) Financial Reports.
i) Operating Reports: These reports convey the information regarding theoperations of the business at different functional levels. These reports areused to review and control the total production and to improve the inter-departmental efficiency. Operating reports can further be classified asinformation reports and the control reports.
l Information Reports: The reports prepared for this purpose should besimple and clear in respect of various operating activities. These reportsare of three types, viz., trend reports, analytical reports and activity report.In trend reports, comparative information is provided over a periodregarding the direction or trend of different activities. Analytical reportsare based on the horizontal comparison of results. This provides informationin an analytical manner about comparison of different activities for aparticular period. When reports are prepared for any particular activityof the business then they are known as activity reports. Segment reportsare also information reports.
94
Cost Volume ProfitAnalysis
l Control Reports : These reports are prepared to help the managersin controlling the operations of the business. Various responsibilitycenters are established in every business to have an effective control.To know the performance of each responsibility center reports areprepared for them. First important aspect regarding the performanceof the center manager and the other is concerned with the economicperformance of the center towards the goal or the business, are themain features of these reports. These reports can be current controlreports or they can be summary control reports. Summary controlreports can be master summary control reports or these can besubsidiary summary control reports.
ii) Financial Reports : Financial reports differ from control or informationreports. They are necessary to know the success or failure of themanagement’s responsibility to shareholders through the accounting. Thesereports can be of two types viz., dynamic financial reports and staticfinancial reports. Dynamic financial reports show the changes took placeduring the year in the financial position of the business. These reportsinclude report of financial change, financial control reports and effective useof funds reports. Static financial reports provide the information regardingthe position of assets and liabilities. They include balance sheet and certainadditional statements for individual items of the balance sheet.
3) Reports Based on Nature
There are three types of reports based on nature:
i) Enterprise Reports : These are the reports, which give a detaileddescription of the various operating activities and financial position of thebusiness. They are generally meant for the external users i.e. bankers,financial institutions, shareholders and government authorities. They aregenerally regular and include annual accounts, directors’ reports, auditorsreport. It is obligatory under Companies Act to furnish these reports.
ii) Control Reports : These reports have already been discussed under thehead reports based on information.
iii) Investigative Reports : These reports are specially prepared only whento investigate a particular problem. These types of reports contain findingsand suggestions to solve the problem. These reports are helpful in taking adecision on a particular problem.
4) Functional Classification of Reports
These reports are normally for the particular function or for a particular departmentor for joint activity. They are also of two types:
i) Individual Activity Report : Report is prepared for the individual activityof a single department working under the supervision of one executive isknown as individual activity report.
ii) Joint Activity Report : This report is prepared when joint efforts aremade in performing the activity. When the details are necessary then theyshould be included in appendix. Then the results of all the joint activities areconsidered under the supervision of the main supervisor.
18.6 MODES OF REPORTINGThere are three modes of reporting:, 1) Written 2) Graphic, and 3) Oral. Thesereports are further divided as follows :

Reporting toManagement
95
Modes of Reporting
Written Graphic Oral
1. Financial Statements 1. Charts 1. Group meetings
2. Tabulated Information 2. Diagram and Pictures 2. Conferences andConferences and 3. Graphs Individual talksIndividual Talks
3. Accounting Ratios
1) Written Reports : Written reports are prepared in the different forms to provideinformation. These are as follows:
l Financial Statements: These statements provide the information regardingthe data of actual performance with budgeted figures and comparativestatements containing information over a period.
l Tabulated Information: Information related with expenditure, production,sales and distribution is furnished in the form of tables so that the data caneasily be analyzed.
l Accounting Ratios: Accounting ratios play a vital role for theinterpretation of accounting and financial statements. Different liquidityratios, profitability ratios, efficiency ratios and capital structure ratios may beused for this purpose
2) Graphic Reporting: Graphic reporting is very common in these days to presentinformation to the management. These reports can be submitted in the form ofgraphs, diagram, pictures and charts. They are prepared when quick action isneeded.
The common charts and diagrams usually included in a report are :
i) Line Graphs : To show, for example, cumulative actual sales againstbudget and/or against previous year’s actuals;
ii) Bar Charts : Generally used for showing comparison of month-wise salesand expenses – budgeted and actuals;
iii) Pie Charts : Commonly used to show in a circular diagram the distributionof the total sales revenue among costs, profits as also the total costs amongthe different constituent elements.
3) Oral Reporting : Oral reporting may take place in the form of (1) Groupmeeting, (2) Conferences, and (3) Individual talks. These oral meetings cannot bepart of important decisions, but they furnish a common platform to discuss theproblems genuinely. For decision- making the written reports have a upper handover all types of reports.
18.7 ESSENTIALS OF SUCCESSFUL REPORTING(GUIDING PRINCIPLES)
Business report is a media of communication that contains factual, correct and clearinformation and it should be able to add to the knowledge of the recipient. It should beeasy to understand the problem of the event reported to him. Accounting reportsbecome ideal if they follow the following guidelines:
96
Cost Volume ProfitAnalysis
1) Content and the shape : While making a draft of the report the following headsshould be kept in mind:
1.1 Suitable title : Title should be short and suitable to the content.
1.2 Time : It should give time and the person for whom it is prepared.
1.3 Facts : Report should contain facts and not the opinions.
1.4 Totals : Where statistics are required, only relevant data should be providedand details may be given in appendix.
1.5 Objectives : Contents should serve the purpose for which it is prepared.
1.6 Synchronize : The contents should be in logical sequence.
2) Precise : Report should not be lengthy. It should be precise, specific and concise.It should not contain irrelevant matter. If details are necessary then they shouldbe included in appendix.
3) Accuracy : The information provided in the reports should be accurate.
4) Comparable : It should be prepared in such a manner that comparison with pastand predetermined standards can be made.
5) Simple : Report should be simple and should not contain any ambiguity.
6) Timeliness : Reports should be prepared and presented in time, so that decisionscan be taken promptly and further deviations checked.
7) Consistency : For comparison consistency is necessary. Uniform system ofcollection, classification and presentation of the information should be followed.
8) Attractiveness : The report should be eye-catching in the sense that it does notgo unheeded by the users.
9) Jargon : All technical jargon should be avoided as for possible since the readermay not understand these and, therefore, may become hostile to even the spirit ofthe report.
10) Highlighting Deviations : Report should highlight the variations and troublespots which are significant to the organisation.
11) Assumptions : Assumptions used in the preparation of reports should be statedneatly, precisely and separately.
12) Effective Communication : Report that communicates effectively to all levelsof management stimulates action and influence decisions. Detailed planning,codification and timely processing of data are the essential requisites for effectivereporting.
13) Figures and data : These should be presented is a tabular form preferably inannexure at the end of the report.
Check Your Progress
1) Define reporting to management.
................................................................................................................................
................................................................................................................................
................................................................................................................................
Reporting toManagement
97
2) Explain any two objectives of reporting.
................................................................................................................................
................................................................................................................................
................................................................................................................................
3) What is control report?
................................................................................................................................
................................................................................................................................
................................................................................................................................
4) What are the types of reports, which are required by the middle level ofmanagement? Name any five.
1. ................................................... 3 ................................... 5 ...............................
2. ................................................... 4 ...................................
5) What are the different modes of reporting?
................................................................................................................................
................................................................................................................................
................................................................................................................................
18.8 LET US SUM UPOne should be very clear about the objective of the report before preparing it. Heshould be able to clearly define and understand the problem for which the report isgoing to be presented. Needs of report differs at different management levels. So thisshould be decided that which level of management will use the particular report. Modeof reporting is also important regarding the presentation. Report will be a users reportor information report or any other type of report. Certain guiding principles such asbrief, sequencing, consistency, comparability, timeliness, accuracy, attractiveness,simplicity, shape and contents are very important and these should be taken into mindwhile preparing a report.
18.9 KEY WORDSStatic Financial Report : Providing information about the position of assets andliabilities of the concern.
Graphic Reports : Information supplied in the form of Charts, Diagrams, Picturesetc.
Reporting : Providing information to the person concerned.
Dynamic Financial Report : The information regarding the change that took place inthe position of assets and liabilities of a firm
Operating Reports : Information regarding the operating of a business at differentfunctional levels
Accuracy: correct, right
Consistency: Uniformity
Synchronize: Clear sequence
98
Cost Volume ProfitAnalysis 18.10 ANSWERS TO CHECK YOUR PROGRESS
4) Names of five reports:
1. Administrative Budget
2. Funds Flow Statement
3. Cash Flow Statement
4. Stock Level of Raw Material
5. Production Cost Report
5) Modes of Reporting:
1. Written: Financial Statements
Tabulated Information
Accounting Ratios
2. Graphic: Charts
Diagram and Pictures
Graphs
3. Oral: Group Meetings
Conferences and Individual Talks
18.11 TERMINAL QUESTIONS1) What do you mean by accounting reports? What are the different types of
reports for internal use? Discuss each of them.
2) What are the special reports? What matters may be covered by the specialreports?
3) Describe the reporting needs of different levels of management and how asystem of reporting can satisfy it?
4) What are the essentials of a good report? Describe.
5) Explain the different types of the reports that are used in an enterprise
6) “Accounting Reports are a matter of necessity for the management and not amatter of convenience” Discuss.
Note: These questions will help you to understand the unit better. Try to writeanswers for them. But do not submit your answers to the University.These are for your practice only.
UNIT 19 RECENT DEVELOPMENTSIN ACCOUNTING
Structure19.0 Objectives
19.1 Introduction
19.2 Scope and Limitation of Conventional Financial Accounting
19.3 Inflation Accounting
19.4 Human Resources Accounting
19.5 Social Accounting
19.6 Environmental Accounting
19.7 International Accounting
19.8 Strategic Cost Management
19.9 Activity Based Costing
19.10 IT Developments in Accounting
19.11 Let Us Sum Up
19.12 Terminal Questions
19.13 Further Readings
19.0 OBJECTIVESThe objectives of this unit are to:
! explain some of the recent developments in financial and managementaccounting;
! give an overview on special accounting issues like inflation accounting, humanresources accounting, environmental accounting and international accounting;
! give an overview on activity based costing and cost reduction methods; and
! review developments of information technology that are related to accounting.
19.1 INTRODUCTIONThe primary role of accounting is to record financial transaction and summarise thesame in a useful format. Financial accountants prepare three principal financialstatements by summarising huge volume of financial transactions namely Profit andLoss Account, Balance Sheet and Cash Flow Statement. While these three arereported in annual reports, they also prepare a number of statements for internalpurpose. Cost Accountants prepare a number of statements mainly for internalpurpose and the primary objective of the exercise is to find out the cost ofproduction. However, the world of accounting or accountant is fast changing.Modern accountants are expected to be more intelligent than doing a merecompiling job. You might have seen that even smaller companies are started usingcomputer software for accounting. With simplification in tax laws, the role of 99
100
Cost Volume ProfitAnalysis
accountant in tax administration is also diminishing. Accountants are also expected toprovide more information about the non-conventional information. When machinesdominate industrial world, accountants are asked to provide more information aboutmaterial things of the firm. Today, in many firms, knowledge is asset. Since financialreports stated above are not geared to provide such information, accountants are askedto provide additional information. There is also lot of concerns about the socialbehaviour of corporate sector. Hence many are interested in knowing the firms’ efforton social responsibility and environment. Special reports are devised to address someof these issues. In this unit, we will briefly discuss some of these reports and recentdevelopments. Each item discussed here are full subject on its own and depending onyour interest, you can specialise in one or more of the subjects either taking up somespecific issue and mastering them by reading some specialised books or attendingsome courses on these topics. It is to be noted that accountants today, are expected tobe more intelligent since computers replaced conventional accountants in many firms.
Activity 1
1) It is the time for you to interact with some of your friends who are in accountingprofession. Have a general chat with them and note down what they haveobserved as recent trends in accounting profession.
................................................................................................................................
................................................................................................................................
................................................................................................................................
2) Take any annual report of some well known companies and find out how much ofspace they spend in providing non-financial information?
................................................................................................................................
................................................................................................................................
................................................................................................................................
19.2 SCOPE AND LIMITATION OFCONVENTIONAL FINANCIAL ACCOUNTING
It is interesting to know why companies are suddenly focussing on some of the reports,which we mentioned in the introduction. Alternatively, what is the wrong with theconventional accounting reports? Accounting reports such as profit and loss account,balance sheet and cash flow statements provide wealth of information but the questionis whether it is adequate to know about the current or future performance of thecompanies. Secondly, not all stakeholders are interested only in knowing the profit orincome details. Future of companies depends on current strength and such strength isnot reflected in the accounting reports. This is particularly true for new economy orknowledge based companies, which is seeing phenomenal growth in recent times.Also, many stakeholders would be interested to corporate social behaviour. Some ofthe prominent limitations are listed below:
a) The balance sheet is often based on historical value. It fails to show the truevalue of the firm in that context. Suppose a company owns 10 acres land in Delhior Mumbai, which was purchased some 40 years back at the rate of Rs. 10000per acre. Is it right on the part of the company to show the value of the land atthe same price in 2003 when the cost of land is several 100 times more than thepurchase value? The above applies to many industrial machines which are usedin the firm but are efficiently managed beyond their normal life. How to reflecttrue and fair value of such assets?
Recent Developments inAccounting
101
b) Is human resource of a firm not an asset? Today, every company is proudlystating that they have so many engineers, doctors, etc. in their company. If so,what is the value of such intangible pool of expertise inside the company?Conventional accounting treat salaries and wages paid to such employees as anexpense but fails to recognise the value of human resources.
c) Can a company be focussed narrowly and always aiming to maximise profit? Is itnot fair to provide something to society particularly when they spoil naturalresources in their normal operation? Many developed nations are shifting theirhigh-pollution industries to the third world countries to have a clean air in theircountries. When these countries shift their base to third world nations, it islegitimate expectation of the citizens of these countries that these companiesspend sufficient amount to control pollution and other side effects.
d) Companies have changed the way in which it is operating business. Manyconcepts such as just in time (JIT), Total Quality Management (TQM), FlexibleManufacturing System, etc. are common today. But only very few companieshave changed their costing system. For instance, salaries and wages of manymanufacturing companies constitute an insignificant portion of the total cost butour costing system not only report the labour cost but also uses the same as costallocation basis in some cases. Is it not desirable to change our costing system toget some reliable cost data?
e) Traditionally, firms use IT only for accounting purpose and such accounting wasstandalone without any linkages to mainstream business operation. Today,accounting information is extensively used and also IT is extensively usedthroughout the organisation. Is it right or economical or efficient to havestandalone IT system for each functional area? Is it not desirable to have anintegrated accounting system or more specifically enterprise wide resourceplanning (ERP), which performs not only accounting but several other businessoperations in a total integrative manner?
Activity 2
1) We listed few reasons why accounting or accountants need to change fromconventional outlook. Can you apply these ideas into anyone of the companies orto your own company and list out your findings?
................................................................................................................................
................................................................................................................................
................................................................................................................................
2) Find out from your IT friend how ERP is different from that of accounting pageslike Tally.
................................................................................................................................
................................................................................................................................
................................................................................................................................
3) Do you feel that spending money on social and environment is wastage ofcorporate resources? What do these firms get in return by spending such amount?
................................................................................................................................
................................................................................................................................
................................................................................................................................
102
Cost Volume ProfitAnalysis 19.3 INFLATION ACCOUNTING
Inflation rate is the percentage change in the price level from the previous period. Theprimary objective of inflation accounting is to correct conventional historical costaccounts for the understatement of inventory and plant used in production, i.e. the costof goods sold and depreciation, in order to prevent erosion of capital during inflation.That is, inflation accounting is used to provide information that is useful to present andpotential investors and creditors and other users in making decisions (and) in assessingthe amounts, timing, and uncertainty of prospective cash receipts from dividends orinterest and the proceeds from the sale, redemption, or maturities of securities or loans.Inflation accounting was of interest when many developing economies were sufferinginflation rates of 25% or more. Now that rates are in single figures, the debate on theneed of inflation accounting is subdued. Some of the related objectives are:
a) To show the real profit and loss for the period under consideration as against theprofit or loss on the basis of historical cost;
b) To show the real value of the assets and liabilities instead of historical cost; and
c) To ensure that sufficient funds will be available to replace the various assetswhen the replacement becomes due.
This objective is generally achieved by the current cost method, which is also muchmore responsive to the general objectives of financial reporting. There are alternativemethods like Current Purchasing Power Method, Constant Dollar Accounting Method,etc. Under the current cost accounting method, fixed assets, stocks, stocks consumed,etc. are shown in the financial statements at their value to the business and not at thedepreciated value or original cost. Depreciation for the year is calculated on thecurrent value of the fixed assets. All these things normally leads to reduction in profitworked out under this method compared to normal historical based profit. Since thediscussion beyond this input is out of the scope of the subject, interested students areadvised to refer to Statement of Standard Accounting Practice (SSAP) 16.
There are limitations to inflation accounting and the failure to recognize them has led tounnecessary complexity in some methods. Inflation accounting cannot isolate orcondense into one earnings number all of the effects of inflation on a company. It issimply an improved system of measurement which brings financial statements intoharmony with current costs and values. Such improved statements provide afoundation for analysis of a company’s economic earnings and financial position in aninflationary environment, including any special effects of inflation.
Activity 3
1) What is the purpose of using inflation index in the preparation of accounting?
................................................................................................................................
................................................................................................................................
................................................................................................................................
2) Suppose a company provides inflation-adjusted accounting. In your opinion, whogains most by using such accounting statement?
................................................................................................................................
................................................................................................................................
................................................................................................................................
Recent Developments inAccounting
103
3) Identify a few old cement or fertiliser companies, which have been establishedsome 20 years back. Compare their book value and market value of the companyor price per share. Do you feel that the book value is not representative of currentmarket value? If so, do you feel that use of inflation accounting resolve suchinconsistency?
................................................................................................................................
................................................................................................................................
................................................................................................................................
19.4 HUMAN RESOURCES ACCOUNTINGIn the case of manufacturing firms, most of the assets are in physical form. Thesecould be easily traced and valued. Hence it’s not much difficult to find the value of thefirm. Other than the physical assets, manufacturing firms also have assets likeintangible assets like goodwill, brand value etc. are to a greater extent possible to givean approximate value. The most important is human capital, the ability of employees todo the things that ultimately make the company work and succeed, particularly in thecase of software firms, the main asset is human being. Is it possible to value humanbeing? Can we assign a value every individual in the firm? Should we have to value thehuman beings, just because they form the main asset in the IT firms? Yes it is utmostnecessary. As in most software companies though the projects are completed on ateam basis, the skills of each individual and his contribution is utmost important. Further,its not only important only for IT firms it could also be more helpful if such value isgiven to employees in manufacturing firm also, so that human beings get to know whatis the value they are contributing to the organisation and how much are they able toimprove in providing the value addition. Hence human resource accounting becameimportant. But not every company understands their contribution to the bottom line orknows how to manage them to drive even better financial results, even though theyaccount for as much as 80 per cent of the worth of a corporation.
What is needed is measurement of abilities of all employees in a company, at everylevel, to produce value from their knowledge and capability. Human ResourceAccounting (HRA) is basically an information system that tells management whatchanges are occurring over time to the human resources of the business. HRA alsoinvolves accounting for investment in people and their replacement costs, and also theeconomic value of people in an organization. The current accounting system is not ableto provide the actual value of employee capabilities and knowledge. This indirectlyaffects future investments of a company, as each year the cost on human resourcedevelopment and recruitment increases.
The information generated by HRA systems can be put to use for taking a variety ofmanagerial decisions like recruitment planning, turnover analysis, personneladvancement analysis and capital budgeting, which can help companies save a lot oftrouble in the future. In India, there are very few companies like BHEL, Infosys andReliance Industries, which have implemented HRA and some are working on it.Infosys, which started showing human resource as an asset in its balance sheet, hasbeen reaping high market valuations.
Companies can derive many benefits by going in for HRA. Not only can they measurethe return on capital employed on total organisational assets (including the humanassets), but the resources can also be planned accordingly. Once organisations realisethe actual benefit and take it as a growth process, it will only help them in increasingtheir shareholders’ value. When a company is able to assess an individual’s worth, ithelps in increasing its own worth. Basically HRA can be tracked through two
104
Cost Volume ProfitAnalysis
methods: cost-based analysis and value-based analysis. The cost-based approachfocuses on the cost parameters, which may relate to historical cost, replacement cost,or opportunity cost. The value-based approach suggests that the value of humanresources depends upon their capacity to generate revenue. This approach can befurther sub-divided into two broad categories: non-monetary and monetary.
The disposition of resources can also be examined by allocating relative human assetvalues to different job grades. HRA also helps in examining expenditure on personneland in re-appraisal of expenditure on services and training. It can also serve as a keyfactor in case of mergers and takeover decisions, where the human asset valuebecomes a relevant factor. Another very significant role, which HRA can help increating, is goodwill for a company. The company can project itself in having bestpractices with superior policies in place. Experts believe that this may help theorganisation attract more investments.
Infosys in its balance sheets shows Human Resources value at Rs. 9539.15 cr. as onMarch 31, 2002. The HRA section of Infosys Annual Report states the following:
The dichotomy in accounting between human and non-human capital is fundamental. Thelatter is recognized as an asset and is therefore recorded in the books and reported in thefinancial statements, whereas the former is totally ignored by accountants. The definitionof wealth as a source of income inevitably leads to the recognition of human capital as oneof several forms of wealth such as money, securities and physical capital.
The Lev & Schwartz model has been used by Infosys to compute the value of the humanresources as on March 31, 2002. The evaluation is based on the present value of the futureearnings of the employees and on the following assumptions:
1. Employee compensation includes all direct and indirect benefits earned both in Indiaand abroad.
2. The incremental earnings based on group/age have been considered.
3. The future earnings have been discounted at 17.17% (previous year – 21.08%), thisrate being the cost of capital for Infosys. Beta has been assumed at 1.41 based on theaverage beta for software stocks in US.
While HRA as a concept has been present in India for more than a decade, withBHEL taking a lead, it is only now that the awareness is being translated intoapplication. However, in terms of awareness and acceptance, the level is still low asmany companies take little initiative to make the numbers public to shareholders,despite having the data. And there is a lack of an industry standard. This means thatevery company has to evolve its own standard, which can become a tedious process,considering that most of them are still involved in improving their business. Industrybodies like Nasscom can help set a standard.
Activity 4
1) What is HRA? How different is it from Human Resource Management.................................................................................................................................
................................................................................................................................
................................................................................................................................
2) How wide is the application in the area of human resources valuation in India?Name few companies that are implementing HR valuation.................................................................................................................................
................................................................................................................................
................................................................................................................................
Recent Developments inAccounting
105
3) What are the benefits of human resource accounting for the companies and alsofor the employees?
................................................................................................................................
................................................................................................................................
................................................................................................................................
19.5 SOCIAL ACCOUNTINGSocial accountability is about being answerable to the people affected by your actions.Leading organizations now engage relevant stakeholders, including employees,suppliers, consumers, regulators, NGOs and communities, in open, consequentialdialogue at all levels of business decision-making and activity. They also volunteerinformation to these stakeholders on their social performance, thereby makingthemselves accountable to these interest groups. Social and ethical accounting, auditingand reporting is still relatively new in many developing or third world nations, but isgaining acceptance internationally as the primary demonstration of socialaccountability. A social report is the result of a thorough evaluative process focused onthe social impact of a business on all its various stakeholders.
Social accounting and audit is a framework which allows an organisation to build onexisting documentation and reporting and develop a process whereby it can accountfor its social performance, report on that performance and draw up an action plan toimprove on that performance, and through which it can understand its impact on thecommunity and be accountable to its key stakeholders. The social accounting processshould be driven by a rigorous methodology that involves the collection, analysis andinterpretation of quantitative and qualitative data. The accounting systems should bestandardized to facilitate verification by a third party. A social report represents thedisclosure of the company’s social performance in the same way that the annual reportdiscloses financial performance.
Social accounting is not just a public relation exercise but a strategic intervention that,in addition to disclosing social performance, serves to steer the company in atransformation process. This strategic effect is achieved by adhering to the principle offull disclosure. Both negative and positive performances are declared in the finalreport. Consequently the corporation is compelled to perform and the social report hasa level of legitimacy that run-of-the-mill PR efforts do not have.
Effective reputational risk management contributes significantly to gaining andmaintaining a competitive advantage. Today’s informed consumers are increasinglyconcerned with the ethical characteristics of a business. And companies that havevalues closely aligned with wider societal demands are better placed to recruit andretain talented employees. A brand associated with ethical business conduct is betterprotected in the global market because it enjoys hardier loyalty. Engaging in a socialaccounting process, thoroughly and transparently, will enhance your company’scompetitive edge. Some of the social indicators are as follows:
1) Quality of Management2) Human Rights3) Environmental Performance4) Health and Safety5) Stakeholder Relationships6) Corporate Social Investment7) Employment Equity8) Products and Services
106
Cost Volume ProfitAnalysis
Through dialogue with stakeholders, an organization identifies social and ethicalindicators that will objectively reflect its performance in relation to corporate valuesand objectives. The choice of indicators is based on the organization’s statement ofvalues and the standards, codes and guidelines to which the organization subscribes; onstakeholders’ perception of the organization’s performance against its values, and inrespect of their specific needs and concerns; and on best practices established insocieties that are part of the social accounting scope, weighed against the societalneeds of the South African context.
Decision-makers must consequently determine which parts of the organization, such asdivisions, departments or sites, are to be measured. The process of improving socialand ethical performance takes time and an organization may choose to limit disclosurewhile setting performance targets and goals for more comprehensive reporting overtime. These decisions should be declared in the social report if credibility is to bemaintained. Once indicators have been established and the parts of the organization tobe evaluated identified, relevant data must be collected. Initially this may provechallenging because there is seldom a system in place for deliberately measuring socialimpacts. Producing the first social performance report will educate the organization asto the nature of Social Impact Accounting Systems (SIAS) needed for rigorously andobjectively measuring performance.
Collected data is analysed and a social performance report is produced. The manner inwhich publication and distribution is addressed may be taken as indicative of theorganization’s commitment to ethical and socially responsible business practice.Consequently, the report should be afforded the care and status devoted to thetraditional annual report on financial performance. And in the same way that acompany’s financial performance is audited for assurance, social performance shouldbe submitted to the same intense scrutiny.
The core business of community and social enterprises and of community organisationsis to achieve some form of social, community or environmental benefit. Financialsustainability or profitability is essential to achieving that benefit, but subsidiary to it.The organisation and all the people associated with it or affected by it need to know ifit is achieving its objectives, if it is living up to its values and if those objectives andvalues are relevant and appropriate. That is what the social accounting process aims tofacilitate.
A full set of Social Accounts is likely to include the following:
1) A report on performance against the stated objectives (How well have we donewhat we said we would do? )
2) An assessment of the impact on the community (Can this be measured? What dopeople think?)
3) The views of stakeholders on our Objectives and Values (Are we doing the“right” things? Are we “walking our talk”?)
4) A report on environmental performance (Are we “living lightly” and minimizingresource consumption?)
5) A report on how we implement equal opportunities (Do we effectively encouragesocial inclusion?)
6) A report on our compliance with statutory and voluntary quality and proceduralstandards (Do we do what is expected of us, and more?)
Keeping social accounts gives us the information we need qualitative and quantitativeto tell us how we are performing and what people think about what we do, and howwe do it. This is a social balance sheet so that all stakeholders can decide for
Recent Developments inAccounting
107
themselves whether to use, work for, support, or invest in the organisation. Through theproduction of audited social accounts the organisation can fulfil its accountability to itsstakeholders. The overarching principle of social accounting and audit is to achievecontinuously improved performance relative to the chosen social objectives and to thestated values. Six specific key principles have been identified from recent theory andpractice as underpinning the concept and good practice.
19.6 ENVIRONMENTAL ACCOUNTINGEnvironmental accounting is defined as the accountants’ contribution towardsenvironmental sensitivity in organizations. It gained prominence in the 1990s. Theemphasis on the social responsibilities of the accountancy profession is not new, havingbeen led to prominence by the social accounting debate of the 1970s. The socialconsciousness of the accountancy profession was started to receive its attention. Itfocused on extending accountability to numerous stakeholders by necessitatingdisclosure of social information in corporate annual reports. The accountability functionof accounting was believed to be fulfilled by reporting (financial and social) informationthat stakeholders would find useful in their decision making process.
This led to the appearance of environmental, employee and ethical information on avoluntary basis in modern day corporate annual reports. Unfortunately, socialaccounting as discussed in the earlier section, failed to make its way into themainstream accounting agenda, largely due to lack of mandatory standards to guide itand value judgments associated with determination of social responsibilities of anorganization. In spite of this, there has been renewed interest in social accounting inthe 1990s, triggered by the urgency associated with reducing environmental problemsthat exist today.
Practical developments of environmental accounting saw tremendous growth inresearch, with various initiatives and proposals being put forward by accountancybodies and related international organizations. In essence, environmental accountingnow plays a vital role in daily commercial undertakings, attempting to ensure thatdevelopment is not at odds with environmental protection. The potential foraccountants to make a significant contribution towards environmental consciousness inorganizations has been envisaged through their managerial, auditing and reporting skills.Increasingly, the emphasis has shifted from social accounting in general to a morespecific environmental accounting. These days, social accounting has becomesynonymous with the term social and environmental accounting (SEA), a linkage thatplaces due emphasis on the importance of environmental issues.
The fundamental premise behind environmental accounting is that organizations shouldinternalize environmental costs. Currently, these costs are externalized, which meansthat the society bears the impact of an organization’s adverse activities on theenvironment, largely due to the fact that is a “public good”. Internal environmentalaccounting mechanisms such as life cycle costing or even full cost accounting attemptto trace costs of the organization’s activities on the environment. It is believed thatonce organizations are made accountable for these costs, they would be compelled tominimize the potentially harmful effects of such activities. Further, environmentalaccounting requires organizations to forecast the potential environmental impact oftheir activities and accordingly estimate contingent liabilities and create provisions forenvironmental risk.
Accountants’ role in environmental issues extends beyond management of the internalmechanisms (environmental management accounting). They could be responsible forthe disclosure of environmental information, primarily in corporate annual reports, butalso through some other communication media. Environmental reporting providesaccountability to the wider society of the organization’s commitment to environmental
108
Cost Volume ProfitAnalysis
consciousness. Disclosure could constitute monetary information such asenvironmental costs, liabilities, provisions and contingencies, coupled with quantitativeand descriptive information such as ecological data (for example, physicalmeasurement of environmental impacts), environmental policies, targets andachievements.
The Environmental Accounting was first considered a new field in accounting in during1998 by the intergovernmental work group ISAR (United Nations Inter governmentalWorking Group of Experts on International Standards of Accounting and Reporting).Jointly with this work, ISAR has been coordinating efforts with IAPC (InternationalAuditing Practices Committee) to formalize a group of audit standards for verificationof the environmental performance reported on accounting statements. This work groupbasically emphasised the need for environmental accounting to cover the followingbasic objectives: (a) assistance of professionals in other fields of knowledge; (b) givethe status of the information system of the analyzed company, as regards thepreparation of its internal controls to provide its financial accounting with relevantinformation on environmental aspects; and (c) effective contribution of variousexternal intervenors, as the consulting specialists, certification companies andindependent auditors, to grant an independent opinion on specific aspects of the report.
The concept of sustainable development catching on rapidly, corporate and industrialhouses across the world are increasingly incorporating the environmental element intheir day-to-day business operations. They are clear in their perception that along withquality, safety of the environment, too, is an important factor in making a businesssuccessful.
Activity 5
1) Take the annual report of top 5 companies in the Petrochemicals industry and findout which part of the report covers the environmental accounting if given?
...............................................................................................................................
...............................................................................................................................
...............................................................................................................................
...............................................................................................................................
2) How efficiently companies follow the environmental accounting requirements?Do you find any deviance from what they actually practice and what they reportin their financial reports? If so, given an instance of any company violating thesame.
...............................................................................................................................
...............................................................................................................................
...............................................................................................................................
...............................................................................................................................
19.7 INTERNATIONAL ACCOUNTINGMany Indian companies, particularly in pharmaceutical and software industry haveoverseas operations. With trade liberalisation in place, many Indian companies wouldbe future multinationals. When firms operations move international, not only onmanufacturing and marketing but also investors, accounting of different businessoperations located at different countries under one roof becomes difficult. There aretwo potential problems that an accountant faces in dealing with such consolidation.
Recent Developments inAccounting
109
Accounting standards differ in several countries and investors of those countriesrequire the financial statements using their countries accounting standards to enablethem to compare the company with other company. For instance, if you are ashareholder of Hindustan Lever Ltd., or Castrol India Ltd. you would like to have thefinancial statements under Indian GAAP. Think about an investor of Unilever locatedeither in Netherlands or UK, who has majority stake in Hindustan Lever. Whileconsolidating the Hindustan Levers Ltd. financial statements with Unilever statements,the investors of Unilever expects Hindustan Levers Ltd., financial data also reflectstheir countries GAAP. The task turns complex further if the shareholders are locatedin different countries. For instance, Infosys or many other top rated Indian companiesshares are held by several FIIs whose investors are located across the globe andinvestors of ADR of these companies are also located in different parts of globe. IfInfosys prepares financial statements only on the basis of Indian GAAP, they will notbe happy. By virtue of agreement with overseas stock exchanges, Infosys may berequired to present a separate statement following the US GAAP. But what about theinvestors in Japan, who has also purchased shares of infosys either directly orindirectly through FII. Today, many companies started giving separate financialstatement using major countries GAAP to satisfy the investors of those countries.While it adds cost of compiling financial reports, it brings lot of goodwill.
Firms operating in different countries also have certain peculiar problem. For instance,your company’s overseas venture would have posted increased profit during a periodbut when you convert the profit in your currency, you might be alarmed to see thatprofit has actually come down from the previous year if there is a currencydepreciation in the country. On the other hand, the performance of overseas countrymight have actually come down but when we convert the same to our currency, theperformance might have improved if our currency appreciates during the period.Handling multi-currency business operations in consolidation is another complex task ininternational accounting.
Activity 6
1) Collect or download from the company’s website the annual report of Infosys orWipro or Asian Paints. Read the statement of significant accounting polices ofconsolidated financial statements. List down your observation/understanding?
...............................................................................................................................
...............................................................................................................................
...............................................................................................................................
2) Visit http://www.icai.org and locate Accounting Standard page. Download AS 21and AS 27. Write a one page note on each accounting standard after reading thesame.
...............................................................................................................................
...............................................................................................................................
...............................................................................................................................
19.8 STRATEGIC COST MANAGEMENTThe field of management accounting has also seen considerable changes in recenttimes. When industrialisation was limited and economies were closed for externalcompetition and also having restricted internal competition, managers decision makingscope was normally restricted to few operational decision making such as productionoptimisation, product mix, setting discount policies, etc. Conventional cost and financialaccounting provide adequate information for such decisions. However, over a periodof time, business environment has completely changed and internal and external
110
Cost Volume ProfitAnalysis
competitions have become the order of the day. Top management of any firm, small,medium, large or multinational, are increasingly spending time on strategic decision andcost and financial data are extensively used along with input drawn from theenvironment, which includes competitors’ financial and non-financial information. Anew discipline called ‘strategic cost management’ or ‘strategic managementaccounting’ addresses these issues. The following issues are typically addressed usingcost input from strategic perspective:
a) Value Chain Analysis : Let us take an example of a product say televisionwhich we use daily in our life to understand the concept. The television setwhich you are using is giving you some value - educative or entertainment value.There are so many organisations, which are involved in the whole process ofmanufacturing and delivering the television to you. All these organisations areadding value at each stage to the product and what you get finally the collectiveamount of all value addition. The value chain analysis looks into how much ofvalue addition has taken place at each stage of the whole process. It helps theorganisations to identify the place where they need to be there to maximise thereward and at the same time using their expertise. If all organisations try toreduce the total cost of the value chain, then customers get benefit out of suchexercise. For instance, if you are manufacturing PET bottles, which are used bymany mineral water manufacturing companies you have two options in setting upyour plant. One, you can put up a centralised huge plant to achieve economies ofscale but force your customers to hold more inventory since without bottles, it isdifficult to run the plant. Alternatively, you can put up smaller plants nearmanufacturer. While this will add cost of manufacturing, but it will bring downinventory level. As PET bottle manufacturer, you need to look beyond yourcosting and see the value chain.
b) Activity-based-costing (ABC) : ABC looks into a firm as a bunch of activitiesand hence focuses more on activity analysis, cost associated in performing suchactivities and then finally ways to perform the activities better while reducing thecost. ABC provides more accurate cost data than conventional costing systemand such reliable costing is often required for strategic decision. ABC is alsouseful to identify value added and non-valued activities.
c) Customer cost analysis : Do you feel all your customers are equally importantto you? If you ask this question to MD of a large company, the answer will bemost probably ‘Yes’ since today every company wants to be customer focussedand it is immaterial whether the customer is small customer or large customer.Suppose you ask another question to the same MD - are all your customersequally profitable? The answer need not be ‘Yes’ and often the answer is ‘No’.Customers are increasingly demanding and hence the cost of providing servicesto customers significantly differ from customers to customers. How manycompanies trace the cost up to the customer level? They normally stop costingexercise upto the product level and that too with some ad hoc overheadallocation. You need reliable cost data to measure customer profitability.
d) Competitor cost analysis: Can you run a company without understandingcompetitor? The answer would be probably ‘yes’ in some 15 years back andtoday it is a strong ‘NO’. What do you want know about the competitor ?Apart from several other things, you would like to know their cost structure. Anunderstanding of their cost structure is helpful in several ways. For instance, ifthe material cost of the competitors is lower than your company, you can startlooking for alternative source of buying or changing material quality or change.
e) Target costing: Here, costing of product starts before the product gets into theproduction stage. Many experts find that the best way to reduce the cost is spendtime while products are under development. Because, once a product design is
Recent Developments inAccounting
111
completed, about 80% of the costs are pre-determined. For instance, imagine youwant to construct a hotel and run profitably. The operating cost of running a hotelis relatively small compared to fixed cost. So the best way to reduce the cost isto spend more time and energy in drawing the construction plans andeconomically using the space, material and other items. This applies to manymanufactured products like watch or television or air-conditioner. Target costing isdone with the help of set of employees drawn from several functional areas, whotogether participate in the development exercise with a single goal of designing aproduct whose cost is less than target cost.
In addition to the above, there are several other strategic cost management techniqueslike life-cycle costing, capacity costing, etc. For all these techniques, activity basedcosting is used as a principle cost information. we will discuss briefly the activity basedcosting. Under 19.9 of this Unit.
Activity 7
1) How value chain analysis is different from value analysis?
................................................................................................................................
................................................................................................................................
................................................................................................................................
2) Indian Railways moves passengers and goods from one place to other place. Canyou perform value chain analysis for Indian Railways and find out how they canadd value to passengers and business communities, which use the freight service?
................................................................................................................................
................................................................................................................................
................................................................................................................................
3) Compare whether the profit changes are in line with the changes in cash flowfrom operating activities.
................................................................................................................................
................................................................................................................................
................................................................................................................................
4) Suppose one of the co-operative banks want to consult you in helping customercost analysis. Can you briefly tell how you can go about in helping the bank?
................................................................................................................................
................................................................................................................................
................................................................................................................................
19.9 ACTIVITY BASED COSTINGAccurate and relevant cost information is critical to any organisation that hopes tomaintain, or improve, its competitive position. For years, firms operated under theassumption that their cost information actually reflected the costs of their products andservices when, in reality, it did nothing of the kind. Over-generalised cost systems wereactually misleading decision makers, causing them to make decisions inconsistent withtheir organisations’ needs and goals, principally because of misallocated costs.
112
Cost Volume ProfitAnalysis
Activity-based costing (ABC) is a valuable concept that can be used to correct theshortcomings in the cost systems of the past. It is a means of creating a system thatultimately directs an organisation’s costs to the products and services that require thosecosts to be incurred. ABC can be used this way because it provides a cross-functional,integrated view of the firm, its activities and its business processes.
As a result, in many organisations, ABC has evolved beyond the point of simplydeveloping more accurate and relevant product, process, service and activity costs.These organisations use ABC as a means of improving operations by managing thedrivers of the activities that cause costs to be incurred. They are using ABC to supportmajor decisions on product lines, market segments and customer relationships, as wellas to simulate the impact of process improvements. Organisations involved in TotalQuality Management processes are using both the financial and non-financialinformation of ABC as a measurement system.
The basic distinction between traditional cost accounting and ABC is as follows:traditional cost accounting techniques allocate costs to products based on attributes ofa single unit. Typical attributes include the number of direct labour hours required tomanufacture a unit, purchase cost of merchandise resold, or number of days occupied.Allocations, therefore, vary directly with the volume of units produced, cost ofmerchandise sold, or days occupied by the customer. In contrast, ABC systems focuson activities required to produce each product or provide each service based on eachproduct’s or service’s consumption of the activities.
Using ABC, overhead costs are traced to products and services by identifying theresources, activities and their costs and quantities to produce output. A unit of output(a driver) is used to calculate the cost of each activity. Cost is traced to the product orservice by determining how many units of output each activity consumed during anygiven period of time. An ABC system can be viewed in two different ways. The costassignment view provides information about resources, activities and cost objects. Theprocess view provides operational (often non-financial) information about cost drivers,activities and performance.
ABC does not only apply to manufacturing organisations, it is also appropriate forservice organisations such as financial institutions, and medical care providers andgovernment units. In fact, some banking firms have been applying the concept foryears under another name - unit costing. Unit costing is used to calculate the cost ofbanking services by determining the cost and consumption of each unit of output offunctions required to deliver the service.
Activity 8
1) How ABC is different from that of conventional costing?
................................................................................................................................
................................................................................................................................
................................................................................................................................
2) Can you list at least three examples where ABC gives different cost valuecompared to conventional costing?
................................................................................................................................
................................................................................................................................
................................................................................................................................
Recent Developments inAccounting
113
3) List down any three uses of ABC in strategic cost application?
................................................................................................................................
................................................................................................................................
................................................................................................................................
19.10 IT DEVELOPMENTS IN ACCOUNTINGAccounting is one of the earliest operation that has seen computerisation in thecommercial world. Today, we have reached a stage in which almost all accountingoperations are done through computers. What is the use of computers in accounting?Book-keeping is monotonous job and it is best done by machine than men. Further,accuracy and speed of the operation improves considerably. Most importantly,transactions are entered only once and all further operations are done by the machine.Compare this with manual operations in which someone keep basic day books,someone posts it to ledger and prepares trial balance and someone prepares financialreports. When the level of computerisation expands and includes several otherbusiness operations, the task improves considerably.
Today, many companies are using Enterprise Resource Planning (ERP) software likeSAP, Peoplesoft, etc. ERP attempts to integrate all departments and functions across acompany to create a single software program that runs off one database. For instance,if your planning is very good, the ERP system operates like this. Suppose, the inventorylevel has come down below certain level. Your ERP system immediately generatespurchase order and electronically placed the same to the pre-defined vendor. When thevendor supplies the material, you are making two entries - one at the stores level forthe receipt of the material and one at the accounts department for invoice data. Themachine compares the two and pass the bill for payment. On the due date, chequesare printed and accounting of payment is done electronically.
What is the use of such integration? It avoids duplication of systems and data entry ordata transport from system to another. Major benefit of ERP is better planning andcontrol. Suppose, you have made a plan for the next year sometime around January2003 (for the period of April 2003 to March 2004). Sometime around July you havefound that the performance of the first quarter is better than what you have expectedand hence you want to increase your target and reset the budget. While it may beeasier to change overall budget values, no one knows what will be changes required atvarious stages unless there is an integration. Planning doesn’t end with the boardroom.To translate the planning into action, changes are required every stages and peopleshould realise what kind of problems it may pose when we change the plan. Forinstance, such an upward revision may require additional working capital or identifyingnew supplier for the material or booking of additional railway wagon. ERP softwaretypically identifies all such problems and helps you to optimise using simple to advancemodelling.
19.11 LET US SUM UPAccounting primarily complies monetary transactions taken place between thecompany and others and prepares financial statements. Accounting information is usedby several users. A significant part of the accounting system is today handled bycomputers and hence requires accountants to upgrade the skills. Top management aswell as other stakeholders expect accountant to provide useful information in additionto traditional income statement and balance sheet. For instance, the profit shown underprofit and loss account is unreliable in a situation of high inflation or when the assetsare very old. The company may not have adequate funds to meet the expenditure.
114
Cost Volume ProfitAnalysis
Accountants are expected to provide insight on the future growth prospects ofcompanies in an inflationary condition. Similarly, stakeholders, particularly those otherthan shareholders, would be interested to know the contribution of company to socialcauses and how it respects environmental and other issues. Though in a narrow sense,shareholders are not concerned on this issue, their interest is also affected if the firmfails to consider the interest of society. Shareholders interest of automobile companies,textile companies, tobacco companies, etc. is affected if these companies fail tocomply environmental issues. Accountants are also expected to provide information ofintangibles, which are particularly relevant for knowledge-based companies and otherservice organisations. Human Resources Accounting, Brand Valuation, etc. areimportant pieces of information that stakeholders expect to be incorporated in thebalance sheet. In addition to these inputs, accountants are expected to provide lot ofinputs that are used for strategic decision making process. For instance, accountantshave to collect the details on product-wise, geographic-wise, customer-wise, etc. andalso information pertaining to competitors. Accountant inputs are extensively used forbench marking exercises and also decision such as out-sourceing. Since thestakeholders are geographically spread all over the world, many companies areshowing accounting results under several accounting standards to satisfy the needs ofinvestors, employees, suppliers, customers and government authorities of severalcountries. Modern accountants are also expected to be computer-savvy and befamiliar to work in a computerised networking environment. Companies spendsubstantial money in IT and integrate all their operations. While on the one hand,accountants role is declining on account of computerisation, accountant contributionand involvement at high-end are increasing. For instance, today accounting processesare centralised and concepts like shared service operation are emerging. In this, theshared service operation provider maintains the accounts of several companies andgeneral many value added reports for the management. In other words, accountingprofession is as challenging as any other professions and also highly rewarding.
Interested students can refer the Shareholders Information section of the AnnualReport of Infosys Technologies Limited (page numbers (page number 137 to 162).It covers intangible assets score sheet, human resources accounting and value-addedstatement, brand valuation, balance sheet (including intangible assets), current-cost-adjusted financial statements, economic value-added (EVA) statement, ratio analysis,statutory obligations, value reporting and management structure. It gives you a real lifeperspective on current trends in accounting. You can download the report from thecompany’s website (http://infosys.com/investor/reports/annual/Infosys_AR03.pdf).
19.12 TERMINAL QUESTIONS1) When conducting a social audit, what are the things must a company do?
2) What is the benefit of companies being socially responsible?
3) For what type of industries, Human Resource Accounting is most suitable? Is itrelevant to countries like India? Explain.
4) Inflation rates have come down in the last few years in many countries includingIndia. Do you feel inflation accounting has a role? Discuss your answer.
5) Is environmental accounting PR exercise? How do you perform environmentalaccounting and auditing of fertiliser company?
6) How does activity based costing differ from traditional costing approach?
7) What is the role of cost accounting/cost data in strategic management?
8) Suppose your company wants to pursue product differentiation strategy. How as anaccountant you will be useful for this exercise?
Recent Developments inAccounting
115
9) List down some of the major benefits to a company on account of computerisedaccounting system.
10) How implementation of ERP is different from computerisation of accounting function?
19.13 FURTHER READINGSBowman, E. H. and M. Haire. 1976. Social Impact Disclosure and Corporate AnnualReports. Accounting, Organizations and Society 1(1): 11-21.
Brandon, C. H. and J. P. Matoney, Jr. 1975. Social Responsibility Financial Statement.Management Accounting (November): 31-34.
Cowen, S. S., L.. B. Ferreri and L. D. Parker. 1987. The Impact of CorporateCharacteristics on Social Responsibility Disclosure: A Typology and Frequency-basedAnalysis. Accounting, Organizations and Society 12(2): 111-122.
Elias, N. and M. Epstein. 1975. Dimensions of corporate social reporting. ManagementAccounting (March): 36-40.
Geoffrey Whittington (1983), Inflation Accounting: An Introduction to the Debate,Cambridge University Press.
Gray, R. 2002. The Social Accounting Project and Accounting Organizations andSociety Privileging Engagement, Imaginings, New Accountings and Pragmatism OverCritique? Accounting, Organizations and Society 27(7): 687-708.
Jack Quarter, Laurie Mook, Betty Jane Richmond (2002),What Counts: SocialAccounting for Non Profits and Cooperatives, Prentice -Hall.
Lehman, G. 1999. Disclosing new worlds: A Role for Social and EnvironmentalAccounting and Auditing. Accounting, Organizations and Society 24(3): 217-241
Lyn M Fraser and Aileen Ormiston, Understanding Financial Statements(Sixth Edition), Prentice-Hall of India Private Ltd. New Delhi
Pramanik, Kumar A. (2002) Environmental Accounting and Reporting, New Delhi,Deep & Deep, 2002.
Robert Bloom Araya Bebessay, Inflation Accounting: Reporting of General andSpecific Price Changes, Greenwood Publishing Group.
Roberts, R. W. 1992. Determinants of Corporate Social Responsibility Disclosure:An application of stakeholder theory. Accounting, Organizations and Society17(6): 595-612.
Note : These questions will help you to understand the unit better. Try to writeanswers for them. But do not submit your answers to the University.These are for your practice only.