accounting diphthongs: duration as contrast in vowel
TRANSCRIPT

ACCOUNTING FOR DIPHTHONGS:
DURATION AS CONTRAST IN VOWEL DISPERSION THEORY
A Dissertation
submitted to the Faculty of the
Graduate School of Arts and Sciences
of Georgetown University
in partial fulfillment of the requirements for the degree of
Doctor of Philosophy
in Linguistics
By
Stacy Jennifer Petersen, M.S.
Washington, DC
June 12, 2018

ii
Copyright ©2018 by Stacy Jennifer Petersen
All Rights Reserved
iii
ACCOUNTING FOR DIPHTHONGS: DURATION AS CONTRAST IN VOWEL
DISPERSION THEORY
Stacy Jennifer Petersen, M.S.
Thesis Advisor: Elizabeth Zsiga, Ph.D.
ABSTRACT
This dissertation investigates the production and perception properties of diphthong
vowels at different speech rates in order to advance the understanding of diphthong phonetics
and to incorporate diphthongs into the phonological theory of vowel dispersion. Dispersion
Theory (Flemming, 2004; Liljencrants & Lindblom, 1972; Lindblom, 1986) models vowel
inventories in terms of contrast between all vocalic elements, yet currently only accounts for
quality contrasts. Problematically, diphthongs have been excluded from previous acoustic and
theoretical work due to their complex duality of being composed of two vowel targets while
acting as one phonological unit. Two experiments are presented which test diphthong production
and perception by altering speech rate and duration to determine fundamental properties of
diphthongs cross-linguistically.
In an elicitation experiment that uses a novel methodology for speech rate modulation, it
is shown that speakers maintain diphthong endpoint targets in Vietnamese, Faroese, and
Cantonese. Both diphthong endpoints and monophthong targets show similar movement as a
natural effect of reduction of the vowel space at faster speech rates, unifying monophthongs and
diphthongs in terms of their phonetic properties. Contra the predictions of Gay (1968), it is
shown that diphthong slope is variable across speech rates and slope variability is language-
dependent.
The second section examines the effect of duration manipulation on diphthong perception
with a vowel identification experiment. Results show that the effect of duration manipulation is
iv
dependent on phonological vowel length, but otherwise increasing duration improves perception
through an increase in percent correct, lower confusability, and lower reaction times. Increasing
duration also reduces confusability between diphthongs and monophthongs.
This study finds that duration is an important dimension of contrast both within
diphthongs and the vowel inventory as a whole. The analysis shows that in order to adapt
Dispersion Theory to account for diphthongs, the theory must include an additional contrast
dimension of time. Based on the results of the experiments, three constraints are proposed to
initiate the inclusion of diphthongs into Dispersion Theory: *DUR, MINDIST ONSET, and MINDIST
OFFSET. Including duration in theoretical models of vowel dispersion is the first step in
accounting for vocalic elements that are contrastive along multiple dimensions.
v
ACKNOWLEDGMENTS
I am eternally grateful for the dedication, support, and inspiration of several people who
made this work possible. First, I must thank my long-time mentor and advisor Lisa Zsiga, who
re-inspired my love of phonetics with her incredibly vast knowledge and passion. She has helped
me since my first days at Georgetown and working with her and learning from her has been an
invaluable experience. I also thank Youngah Do, who first sparked my interest in phonological
acquisition and whose rigorous teaching and mentorship challenged and inspired me. She has
always encouraged me to look at the bigger picture, and has been very influential for me, even
across the globe in Hong Kong. I also would like to thank Jen Nycz for her technical expertise,
helpful comments, and constant encouragement. Finally, I thank Hannah Sande, whose
immediate help and unwavering kindness quickly made her a close mentor and a valuable
member of my committee. I would also like to thank all of my other Georgetown professors,
especially Ruth Kramer for her friendly support and enthusiasm.
Thank you to all of the experiment participants, whose contributions are at the heart of
this work. I owe thanks to all of my helpers in the Linguistics Lab at Georgetown University and
the MITRE Corporation. I especially would like to everyone at the University of the Faroe
Islands, who readily helped me collect data at their beautiful campus.
I owe a large thanks to my many friends and peers at Georgetown who have provided
years of insight, fun, and inspiration. Thanks to the PhonLab (née SoundPhiles) members,
especially Kate Riestenberg, Alexandra Pfiffner, Amelia Becker, Maya Barzilai, Maddie Oakley,
Jon Havenhill, and Shuo Zhang, for putting up with me talking about diphthongs for so long and
for essential technical help. To my study buddies and friends Shannon Mooney, Morgan Rood

vi
Staley, Dan Simonson, and Laura Bell: you’re awesome and I can’t thank you enough for all the
fun times, long work days, and late nights.
Special thanks to my good friends who have been there for me during these long years
both in California and DC. To Liz Merkhofer, Christine Harvey, Justin Roy, Kiya Kashanijou,
and my D&D group, thank you for keeping me sane and for your constant friendship and love.
To Linly Sergel, thank you for the weirdness, moral support, and more wine than you can even
account for.
This work is dedicated to my loving family—Marilyn, Jerry, and Chris Petersen. Their
intellect, creativity, drive, humor, and unwavering support have forever been my foundation and
I am forever indebted to them. Last but not least, I dedicate this to Watson, my little ball of
unconditional love.
vii
TABLE OF CONTENTS
Chapter 1 Introduction and Literature Review ............................................................................... 1
1.1 Introduction ...................................................................................................................... 1
1.2 Vowel Systems and Dispersion Theory ........................................................................... 2
1.2.1 Introduction ............................................................................................................... 2
1.2.2 Vowel Dispersion...................................................................................................... 3
1.2.3 Diphthong Typology and Markedness .................................................................... 13
1.2.3.1 Typological Trends in Diphthongs .................................................................. 13
1.2.3.2 Diphthong Markedness, Contrast and Confusability ....................................... 22
1.2.4 Diphthongs in Dispersion Theory ........................................................................... 24
1.2.5 Summary ................................................................................................................. 27
1.3 Diphthong Parameters and Definition ............................................................................ 28
1.3.1 Introduction ............................................................................................................. 28
1.3.2 Phonetic Parameters of Diphthongs ........................................................................ 29
1.3.2.1 Targets and Steady States ................................................................................ 33
1.3.2.2 Trajectory/Slope .............................................................................................. 38
1.3.2.3 Summary of Phonetic Parameters .................................................................... 40
1.3.3 Phonological Representation ................................................................................. 41
1.3.3.1 Phonological Contrasts .................................................................................... 42
1.3.3.2 Moraic Structure .............................................................................................. 48
1.3.4 Diphthong Definition .............................................................................................. 49
1.3.4.1 Contour Tone ................................................................................................... 52
1.3.5 Summary ................................................................................................................. 55

viii
1.4 Durational Cues .............................................................................................................. 56
1.4.1 Competing Hypotheses: Slope or Frequencies? ..................................................... 57
1.4.1.1 Slope-Constant Hypothesis.............................................................................. 58
1.4.1.2 Frequency-Constant Hypothesis ...................................................................... 62
1.4.2 Transition Duration Patterns ................................................................................... 65
1.4.3 Summary ................................................................................................................. 72
1.5 Chapter Overview .......................................................................................................... 72
Chapter 2 Production Experiment ................................................................................................. 74
2.1 Introduction .................................................................................................................... 74
2.2 Language Background.................................................................................................... 75
2.2.1 Faroese .................................................................................................................... 76
2.2.2 Vietnamese .............................................................................................................. 81
2.2.3 Cantonese ................................................................................................................ 85
2.3 Methodology .................................................................................................................. 89
2.3.1 Experimental Paradigm ........................................................................................... 89
2.3.2 Participants .............................................................................................................. 90
2.3.2.1 Faroese Participants ......................................................................................... 90
2.3.2.2 Vietnamese Participants .................................................................................. 90
2.3.2.3 Cantonese Participants ..................................................................................... 91
2.3.3 Materials ................................................................................................................. 91
2.3.4 Procedure ................................................................................................................ 94
2.3.5 Data Analysis Methodology ................................................................................... 98
2.3.5.1 Measurement ................................................................................................... 99

ix
2.3.5.2 Normalization ................................................................................................ 104
2.3.5.3 Distance ......................................................................................................... 105
2.3.5.4 Slope .............................................................................................................. 106
2.4 Results .......................................................................................................................... 107
2.4.1 Language Data ...................................................................................................... 108
2.4.1.1 Faroese ........................................................................................................... 108
2.4.1.2 Vietnamese .................................................................................................... 113
2.4.1.3 Cantonese....................................................................................................... 119
2.4.2 Distance................................................................................................................. 123
2.4.3 Slope ..................................................................................................................... 126
2.4.4 Diphthong Endpoints ............................................................................................ 129
2.4.4.1 Endpoint Regression ...................................................................................... 130
2.4.4.2 Endpoint Variance ......................................................................................... 130
2.4.4.3 Spectral Overlap: Pillai Score ........................................................................ 132
2.4.5 Tone ...................................................................................................................... 140
2.5 Discussion and Conclusions ......................................................................................... 143
2.5.1 Speech Rate ........................................................................................................... 144
2.5.2 Distance................................................................................................................. 145
2.5.3 Slope ..................................................................................................................... 145
2.5.4 Endpoints .............................................................................................................. 146
2.5.5 Tone ...................................................................................................................... 147
2.5.6 Conclusions ........................................................................................................... 148
Chapter 3 Perception Experiment ............................................................................................... 150

x
3.1 Introduction .................................................................................................................. 150
3.2 Methodology ................................................................................................................ 152
3.2.1 Experiment Paradigm............................................................................................ 152
3.2.2 Language and Participants .................................................................................... 153
3.2.3 Materials ............................................................................................................... 155
3.2.4 Procedure .............................................................................................................. 159
3.3 Results .......................................................................................................................... 161
3.3.1 Noise ..................................................................................................................... 161
3.3.2 Percent Correct...................................................................................................... 162
3.3.2.1 Duration ......................................................................................................... 166
3.3.2.2 Slope .............................................................................................................. 168
3.3.2.3 Distance ......................................................................................................... 169
3.3.3 Bias ....................................................................................................................... 170
3.3.4 Confusability ......................................................................................................... 175
3.3.5 Reaction Time ....................................................................................................... 181
3.4 Discussion and Conclusions ......................................................................................... 185
Chapter 4 Analysis and Conclusions .......................................................................................... 189
4.1 Introduction .................................................................................................................. 189
4.2 Dispersion Theory Overview ....................................................................................... 190
4.2.1 Vietnamese Monophthongs .................................................................................. 192
4.3 Experimental Results.................................................................................................... 196
4.3.1 Production Experiment ......................................................................................... 196
4.3.2 Perception Experiment .......................................................................................... 197
xi
4.3.3 Duration ................................................................................................................ 199
4.4 Accounting for Diphthongs: Constraints...................................................................... 201
4.4.1 Maximize Contrasts and *Dur .............................................................................. 202
4.4.2 Maximizing Trajectory: HearClear F1 and F2...................................................... 206
4.4.3 Minimum Distance: Onset and Offset .................................................................. 209
4.5 Conclusions .................................................................................................................. 213
Appendix A: Production Experiment Materials and Data ......................................................... 215
Appendix B: Perception Experiment Data ................................................................................. 226
References ................................................................................................................................... 227
xii
LIST OF FIGURES
Figure 1.1 Vowel systems predictions by the Lindblom (1986) model .......................................... 7
Figure 1.2 Flemming (2004) vowel matrix; (a) matrix, (b) F1 Mindist inherent ranking .............. 9
Figure 1.3 Diphthong typology data from UPSID (1992) ............................................................ 16
Figure 1.4 Diphthong typology data from SPhA (combined monophonematic, biphonematic,
allophonic data) ..................................................................................................................... 16
Figure 1.5 Diphthong typology data from Weeda (1983)............................................................. 17
Figure 1.6 Confusability matrix of initial vowels for American English from Cutler et al.
(2004). ................................................................................................................................... 23
Figure 1.7 Diphthongs in Potter and Peterson (1948: Figure 6) ................................................... 30
Figure 1.8 Spectrogram of Faroese diphthong [ʊi] ....................................................................... 31
Figure 1.9 Schematic of a diphthong from Dolan and Mimori (1986) ......................................... 32
Figure 1.10 Australian English [ɔɪ] diphthong in F1-F2-F3 space from Clermont
(1993: Figure 4) .................................................................................................................... 39
Figure 1.11 Phonological positioning of diphthongs in Sánchez Miret (1998) ............................ 42
Figure 1.12 Visual comparison of holding either (a) the slope of F2 constant or (b) the endpoint
frequencies constant .............................................................................................................. 58
Figure 1.13 Schematic illustration of stimuli used to produce /a~aɪ/ shift. I = patterns whose
second formant onsets remain fixed, T = patterns whose second formant offsets remain
fixed ...................................................................................................................................... 59
Figure 1.14 Preferred identification (shown as a label) assigned to the curtailed stimuli in
Bladon (1985). ...................................................................................................................... 64
Figure 1.15 Stimuli from Bond (1978) (glide = transition) ......................................................... 66
xiii
Figure 1.16 Peeters (1991) continuum of temporal patterns; total duration of each = 240 ms .... 68
Figure 1.17 Mean acoustic distance in mel units plotted against mean transition duration
percentage for /ai/ and /au/ in Hausa, Arabic, Chinese, and English from Lindau et al.
(1990: 13) .............................................................................................................................. 70
Figure 2.1 Map of dialects in Faroe Islands, as divided by Helgason (2002)............................... 77
Figure 2.2 Faroese surface vowel inventory of monophthongs (left) and diphthongs (right) ...... 79
Figure 2.3 Basic hierarchical structure of Vietnamese syllable .................................................... 81
Figure 2.4 Vietnamese vowel inventory of monophthongs (left), diphthongs (center), and
triphthongs (right) ................................................................................................................. 85
Figure 2.5 Basic hierarchical structure of Cantonese syllable ...................................................... 87
Figure 2.6 Cantonese vowel inventory ......................................................................................... 88
Figure 2.7 Screenshots of Faroese acoustic experiment; note how red bar reduces in size to
indicate the remaining time for each sentence ...................................................................... 97
Figure 2.8 Flow chart of acoustic experiment .............................................................................. 98
Figure 2.9 Vowel duration measurement .................................................................................... 100
Figure 2.10 Monophthong duration and midpoint measurement................................................ 100
Figure 2.11 Trajectory segmentation schemata from Dolan and Mimori (1986) ....................... 102
Figure 2.12 Diphthong segmentation schemata .......................................................................... 103
Figure 2.13 Diphthong trajectory duration ................................................................................. 104
Figure 2.14 Faroese vowel chart with scaled Lobanov normalization ....................................... 108
Figure 2.15 Faroese average vowel duration (left) and trajectory duration (right) by speech
rate....................................................................................................................................... 111
Figure 2.16 Faroese vowels by speech rate ................................................................................ 113

xiv
Figure 2.17 Vietnamese vowel chart with scaled Lobanov normalization ................................. 114
Figure 2.18 Vietnamese vowel chart of triphthongs with scaled Lobanov normalization ......... 114
Figure 2.19 Vietnamese average vowel duration (left) and trajectory duration (right) by speech
rate....................................................................................................................................... 117
Figure 2.20 Vietnamese vowels by speech rate .......................................................................... 118
Figure 2.21 Cantonese vowel chart with scaled Lobanov normalization ................................... 119
Figure 2.22 Cantonese average vowel duration (left) and trajectory duration (right) by speech
rate....................................................................................................................................... 121
Figure 2.23 Cantonese vowels by speech rate ............................................................................ 122
Figure 2.24 Average diphthong distance in Faroese (left), Vietnamese (center), and Cantonese
(right) .................................................................................................................................. 123
Figure 2.25 Vietnamese [ɔi] average trajectories at fast, normal, and slow speech rates ........... 125
Figure 2.26 Average diphthong slope in Faroese (left), Vietnamese (center), and Cantonese
(right) .................................................................................................................................. 126
Figure 2.27 Faroese [ʉu] (/sʉus/) at the slow speech rate (slope = 4.8) (left) and fast speech rate
(slope = 2.3) (right) at a 30ms window ............................................................................... 129
Figure 2.28 Fast and slow density distribution of /i/ in Faroese /ai:/ .......................................... 135
Figure 2.29 Fast and slow density distribution of /a/ in Faroese /ai:/ ......................................... 135
Figure 2.30 Density distribution of /ɤ/ in Vietnamese /ɯɤ/ ........................................................ 136
Figure 2.31 Density distribution of /u/ in Vietnamese /ʌu/ ........................................................ 137
Figure 2.32 Density distribution of Faroese /o:/ ......................................................................... 139
Figure 2.33 Density distribution of Faroese /œ/ ......................................................................... 140
Figure 2.34 Vietnamese tone by average vowel duration ........................................................... 141
xv
Figure 2.35 Vietnamese tone by average trajectory duration ..................................................... 142
Figure 2.36 Vietnamese average distance by tone ...................................................................... 143
Figure 3.1 Faroese stimuli in the vowel space ............................................................................ 156
Figure 3.2 Stimuli digital manipulation process ......................................................................... 159
Figure 3.3 Flow chart of perception experiment ......................................................................... 159
Figure 3.4 Average percent correct between noise and noiseless conditions ............................. 162
Figure 3.5 Average percent correct by duration condition ......................................................... 163
Figure 3.6 Diphthong average percent correct by duration condition ........................................ 164
Figure 3.7 Percent correct by duration (with overall trend line)................................................. 166
Figure 3.8 Percent correct by duration (with individual vowel trend lines) ............................... 167
Figure 3.9 Percent correct by slope (with overall trend line) ..................................................... 168
Figure 3.10 Percent correct by slope (with individual vowel trend lines) .................................. 169
Figure 3.11 Average percent correct by average distance .......................................................... 170
Figure 3.12 Original condition accuracy and precision .............................................................. 172
Figure 3.13 Half condition accuracy and precision .................................................................... 173
Figure 3.14 Double condition accuracy and precision................................................................ 173
Figure 3.15 False positive rate .................................................................................................... 174
Figure 3.16 Confusability at original duration condition............................................................ 176
Figure 3.17 Confusability at double duration condition ............................................................. 177
Figure 3.18 Confusability at half duration condition .................................................................. 178
Figure 3.19 Combined confusability results from all durations ................................................. 179
Figure 3.20 Reaction time by correct vowel (all conditions)...................................................... 182
Figure 3.21 Average reaction time by duration condition .......................................................... 183
xvi
Figure 3.22 Average reaction time by average duration ............................................................. 184
Figure 3.23 Average reaction time by duration and manipulation condition ............................. 185
Figure 4.1 Vietnamese monophthongs (a) circled in the similarity space and (b) showing average
production ........................................................................................................................... 193
Figure 4.2 F1 onset and offset minimum distance similarity space ............................................ 211
Figure 4.3 F2 onset and offset minimum distance similarity space ............................................ 211

xvii
LIST OF TABLES
Table 1.1 Common diphthongs from Maddieson (1984: Table 8.6) ............................................ 19
Table 1.2 Summary of typological findings ................................................................................. 21
Table 1.3 Comparisons of English diphthong and monophthong elements in previous literature 34
Table 1.4 Number of diphthongs attested from 78 languages (Bladon 1985) .............................. 61
Table 2.1 Monophthongs and Diphthongs as given in Árnason (2011) ....................................... 78
Table 2.2 Vietnamese vowel inventory with examples and classifications .................................. 84
Table 2.3 Cantonese vowel inventory from Matthew and Yip (2011) ......................................... 86
Table 2.4 Faroese formant means averaged across speech rates (scaled Lobanov
normalized) ......................................................................................................................... 109
Table 2.5 Faroese vowel duration and trajectory duration significance summary ..................... 112
Table 2.6 Vietnamese formant means averaged across speech rates (scaled Lobanov
normalized) ......................................................................................................................... 115
Table 2.7 Vietnamese vowel duration and trajectory duration significance summary ............... 118
Table 2.8 Cantonese formant means averaged across speech rates (scaled Lobanov
normalized) ......................................................................................................................... 120
Table 2.9 Cantonese vowel duration and trajectory duration significance summary ................. 122
Table 2.10 Distance Tukey HSD post-hoc test results ............................................................... 124
Table 2.11 Average coefficients of variation .............................................................................. 131
Table 2.12 Faroese diphthong Pillai scores ................................................................................ 133
Table 2.13 Cantonese diphthong Pillai scores ............................................................................ 133
Table 2.14 Vietnamese diphthong Pillai scores .......................................................................... 134
Table 2.15 Faroese monophthong Pillai scores .......................................................................... 138

xviii
Table 2.16 Cantonese monophthong Pillai scores ...................................................................... 138
Table 2.17 Vietnamese monophthong Pillai scores .................................................................... 139
Table 3.1 Faroese monophthong tokens ..................................................................................... 153
Table 3.2 Faroese diphthong tokens ........................................................................................... 153
Table 3.3 Summary of Faroese vowel data ................................................................................. 156
Table 3.4 Perception experiment correct and incorrect count data ............................................. 165
Table 3.5 Perception experiment confusion matrices by vowel ................................................. 171
Table 3.6 Participant responses by condition ............................................................................. 180
Table 3.7 Reaction time significance .......................................................................................... 182
1
Chapter 1
Introduction and Literature Review
1.1 Introduction
The aim of this dissertation is to incorporate diphthongs into the phonological theory of
vowel dispersion by examining the effect of changes in duration on diphthong production and
perception properties. Current work in Dispersion Theory (Lindblom, 1986; Flemming, 2004)
analyzes vowel inventories as systems of contrast between their vocalic elements, which follow
governing principles of effort minimization in the production domain and confusion
minimization in the perception domain. Dispersion Theory is currently configured to derive
monophthongal vowel systems with contrasts along frequency dimensions F1 and F2.
Diphthongs, however, show movement along the frequency dimensions and the time dimension.
Dispersion Theory cannot currently account for this interaction in quantity and quality. The
complexity of diphthongs has often led to their omission in theoretical analysis of vowel systems
(Becker-Kristal, 2010; Crothers, 1978; De Boer, 2000; Sedlak, 1969). Accounting for the
interaction of quantity and quality furthers the goal of explaining vowel system universals and
typology; a theory that derives systems that only contrast in quality is incomplete. The theory
should reflect the complexity and richness present in the vocalic systems of all languages.
Diphthong properties are not well understood, especially outside of English. This study
introduces novel data from a production experiment on three languages: Faroese, Vietnamese,
and Cantonese. These languages all have large vowel inventories of monophthongs and
diphthongs, come from different language families, and are understudied compared to English
and Romance languages. These data provide crucial cross-linguistic information on the
fundamental acoustic properties of diphthongs at different tempos. Faroese diphthongs are also
2
examined in a perception experiment, which provides data on how Faroese diphthongs contrast
with other Faroese vowels and the role of duration in diphthong perception.
The main cue discussed throughout this study is that of the interaction of duration and
quality. Prior literature has found that diphthong properties may be sensitive to changes in
speech rate, and this study significantly expands our understanding of the phonetic properties of
diphthongs.
This chapter reviews the previous literature on theories of vowel dispersion and vowel
inventory typology, diphthong phonetic and phonological properties, and the role of the
durational cue in diphthong production and perception. The previous literature shows that much
work remains, and that diphthongs are often left out of discussions of vowel inventories and
experimentation on vowel production and perception. Theoretical work outside of Germanic
languages, especially outside of English, is rare. The experiments conducted in the subsequent
chapters seek to address the gaps in the previous literature and contribute to current phonological
theory.
1.2 Vowel Systems and Dispersion Theory
1.2.1 Introduction
The structure and dimensions of the vowel space and cross-linguistic trends of dispersion
within it have long interested phonologists since the popularity of Structuralism (Sapir, 1933;
Trubetskoy, 1939). Particularly, what role does phonetics play in shaping common vowel
inventories, and how does vowel interaction and contrast contribute to these cross-linguistic
trends? Lindblom (1986) states there should be a phonetic explanation of language universals;
sound systems should reflect the fact that they are spoken and theories explaining language
universals should be based upon properties of speech production and perception.
3
Section 1.2.2 reviews literature and theoretical models of vowel dispersion: how vowels
are organized in the vowel space. These models seek to predict the typology of vowel systems
cross-linguistically. One large problem is that as of yet, major works have neither successfully
incorporated diphthongs into these models (see Section 1.2.4 for these studies) nor included
duration as a factor to create contrast1; current models focus exclusively on the F1 and F2
acoustic dimensions. The goal of the present work is to incorporate diphthongs into theoretical
models of vowel dispersion. Because the aim of dispersion models is to predict typological
trends in vowel systems, Section 1.2.3 discusses work on typological trends of diphthongs. Using
typological evidence, previous literature makes predictions about diphthong markedness;
however, for methodological reasons, using typology alone to make these predictions has led to
contradictory conclusions. Section 1.2.4 shows that the few attempts to model diphthong
typology are insufficient.
While they seek to predict language universals and typology, models of vowel systems
rely on phonetically-motivated processes and properties (Donegan, 1979; Stampe, 1973). The
phonetic properties of diphthongs are therefore described in Sections 1.3 and 1.4.
1.2.2 Vowel Dispersion
The principle of maximal perceptual contrast and the role it plays in the structure of
vowel systems has long been discussed in Structuralist linguistic literature (cf. de Groot, 1931;
Jakobson, 1941; Martinet, 1955). This principle, in which languages evolve so that sounds are
maximally perceptually distinct, derives from the theory that communication relies on the
1 Flemming (1995) originally included a discussion of durational enhancement, including a MAXDUR αF constraint,
which maximizes the duration of an auditory feature. However, he does not intend for this constraint to create
contrast between members of a vowel system; rather, it is an enhancing feature that increases distinctiveness of
preexisting contrasts. In a revised version of Flemming (1995), he eliminates the MAXDUR constraints, leaving only
MINDIST constraints on auditory representations.
4
successful recovery of the auditory information and disfavors confusable sounds which might
lead to misunderstanding. A phonology, therefore, regulates the contrasts in a language to
minimize perceptual confusion. These perceptual goals are in direct contrast with articulatory
goals, which are to minimize the articulatory effort to produce sounds and to disfavor extreme
(effortful) pronunciation.
The Theory of Adaptive Dispersion (TAD) (Crothers, 1978; Flemming, 2004;
Liljencrants & Lindblom, 1972; Lindblom, 1986) emphasizes that systems of sounds follow
systemic and relational principles, which allow vowel systems to evolve to maximize both their
efficiency and intelligibility. The main tenet of TAD is that the speech sounds in a phonological
inventory must be easy to distinguish, and that this contrast in the perceptual domain supports
contrasts in the phonology. Because these perceptual and articulatory goals are predicted to be
universal, formalization of this theory seeks to predict vowel systems that reflect typological
trends.
Adaptive Dispersion was developed in a series of papers, starting with Liljencrants and
Lindblom (1972), and further developed in Crothers (1978), Lindblom (1986), Ferrari-Disner
(1984), Schwartz, Boë, Vallée, and Abry (1997), Flemming (2004), and Becker-Kristal (2010),
with many variations and adaptations in additional literature.
Liljencrants and Lindblom (1972) built on the older Structuralist work by implementing a
quantitative methodology and numerical model for calculating the extent to which the principle
of maximal perceptual contrast is exemplified in vowel systems. The model is therefore built to
explain linguistic universals in vowel systems and evaluate to what extent this principle can
predict typological trends in vowel inventory structure. For all vowels in an inventory, the
maximal perceptual contrast is measured by taking the sum of the inverse of the intra-vowel

5
distances, using a transformation to convert values from the linear frequency scale into
perceptual distance of the mel scale. Liljencrants and Lindblom’s model produces accurate
results for smaller three-, four-, five-, and six-vowel systems, but runs into errors with larger
systems. According to Lindblom:
[Predicted] systems with seven or more vowels turn out to have too many high vowels
compared with natural systems. The seven- and eight-vowel systems lack interior mid
vowels such as [ø] and exhibit four rather than three or two degrees of backness in the
high vowels. The nine-, ten-, eleven-, and twelve-vowel systems have five degrees of
backness in the high vowels, which is one too many. (1986: 21)
Predictions for vowel systems greater than twelve are not provided, and it is not clear how well
the model would perform for these large-scale vowel systems.
In his chapter on phonetic universals in vowel systems, Lindblom (1986) makes two
amendments to his earlier work. He criticizes previous work (Liljencrants & Lindblom, 1972) for
using purely formant-based acoustic parameters to define perceptual distance. Lindblom (1986)
proposes a model using dimensions relating to the auditory system to map out the vowel space,
citing evidence that listeners’ auditory systems do not track formant information alone. The
newer model transforms the acoustic specifications to derive the auditory representation of
steady state vowels, primarily through conversion of Hz into Bark and a series of calibration
metrics, to better simulate aspects of human hearing. Lindblom (1986) also replaces the idea of
maximal perceptual contrast with sufficient contrast. While maximal perceptual contrast
specifies there should be a maximal distance between the vowels in the system, allowing for the
most accurate perception between vowels, Lindblom found that just using maximal perceptual

6
contrast did not predict all variations present in the vowel systems, prompting the change to
sufficient contrast, wherein contrast between vowels is not necessarily optimal, and instead is
only distant enough for listeners to make sufficient distinctions. If it is assumed that sufficient
contrast tends to be invariant across languages and system sizes, it predicts a larger amount of
variation in small vowel inventories than large ones. Lindblom shows that this prediction is
supported with data from Crothers (1978) by inspecting the variation in the transcriptions of
vowels that function as /i/, /a/, /u/: in smaller systems there is more variation, where [u, o, ʊ, ɯ]
are found for /u/, etc., whereas in larger systems /u/ is [u] or [ʊ]. The addition of sufficient
contrast also allows for the model to recognize articulatory constraints of economy, or a
minimization of effort, on the part of the speaker.
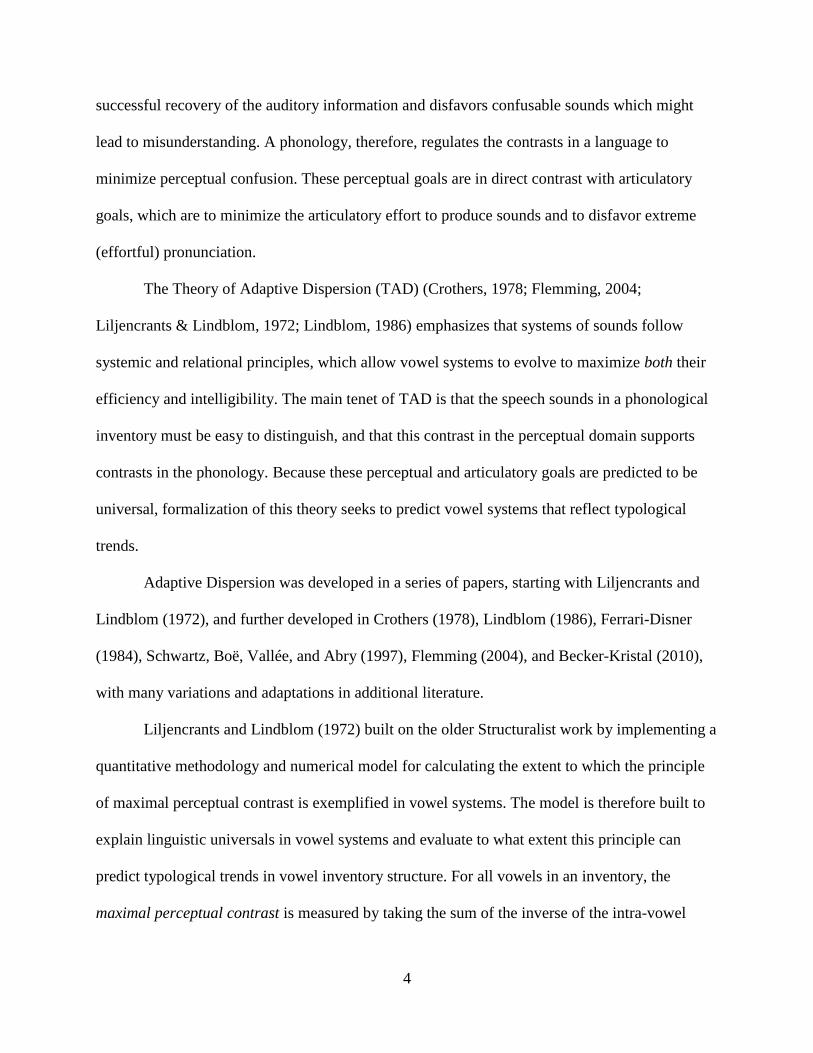
Figure 1.1, from Lindblom (1986, Figure 2.8 and Table 2.4), shows vowel system
predicted distributions (output of the auditory filter) for inventories of 3 to 11 vowels made by
the quantitative model, with a comparison of the predicted vowel qualities to those found in
Crothers (1978)’s typological survey. In this figure, System type(s) are C=Crothers (1978)2,
L=loudness density pattern predictions, and F=auditory filter output predictions. Figure 1.1
shows the predictions of F.
As for the accuracy of the predictions (how closely the predicted models resemble the
Crothers corpus common vowel systems), the L and F models are in overall good agreement with
C, with a few atypical predictions in both L and F. For example, both L and F are missing the
mid, central vowel of C-1 in the seven-vowel system. While these results may be accurate for the
most common vowel systems of this particular corpus, it is unclear how the model might predict
2 These are normalized vowel qualities and are listed as the most common vowel systems types by frequency of
occurrence in the Crothers corpus.
7
more asymmetrical models, vertical vowel inventories, models with larger vowel inventories,
and those with quantity contrasts (long vowels, diphthongs).
Figure 1.1 Vowel systems predictions by the Lindblom (1986) model
In more recent work on vowel dispersion, Flemming (2004) recognizes that the
articulatory and perceptual constraints present in Lindblom’s and Liljencrants and Lindblom’s
models fit well into a constraint-based theoretical framework, such as Optimality Theory
(hereafter OT) (Prince & Smolensky, 1993). Based on Lindblom’s TAD, Flemming’s
‘Dispersion Theory’ is a shift from OT’s focus on articulatory priorities in phonology to a
perception-based account of contrast. To account for the goal of minimizing confusable contrasts
directly in the phonology, Flemming (2004) proposes Optimality-Theoretic constraints which
favor less confusable contrasts over more confusable contrasts. This approach differs from
traditional OT in that constraints are operating over differences between forms at one level (the
output), instead of differences between an output form and input form. Due to the perceptual-
8
based nature of this approach, the property of markedness must shift from being a property of
individual sounds in an articulatory-based approach to a property of contrasts. The notion of
deriving markedness from contrasts arises from the properties of perceptual difficulty: whereas
articulatory difficulty lies in effort, perceptual difficulties arise in correctly categorizing sounds
(233). Perceiving sounds themselves does not take effort on the part of the listener. In his
analysis, the markedness of a sound is not determined inherently by its acoustic or perceptual
properties alone. Instead, a sound may be marked depending on the contrasts it enters into, as
predicted by constraints on the distinctiveness of contrasts (235).
Flemming (2004) focuses on three functional goals that are fundamental to the selection
of phonological contrasts:
i. Maximize the distinctiveness of contrasts.
ii. Minimize articulatory effort.
iii. Maximize the number of contrasts.
These goals are inherently conflicting: generally, the more distinctive a sound becomes, the more
effort it takes to produce. The more contrasts there are, the less distinctive each can be. The
combination of and competition between these goals leads to an inventory that balances effort,
number of contrasts, and distinctiveness.
A constraint-based framework is well-suited to Dispersion Theory, as it promotes
competition between conflicting goals (e.g., markedness and faithfulness) and is therefore
directly able to incorporate Dispersion Theory's three main goals given above. The OT
framework resolves these conflicts on a language-by-language basis through a system of
constraint ranking.

9
To formalize constraints on contrasts, a multidimensional similarity space is needed to
map out the distance between the stimuli. This multidimensional map can be simplified to
distinctness across a single dimension. An example of a sound matrix with multiple dimensions
(F1 and F2)3 is given in (Figure 1.2a) and as a one-dimensional (F1) ranking in (Figure 1.2b)
(Flemming 2004:238-239).
a. b. MINDIST = F1:1 » MINDIST = F1:2 » … »
MINDIST = F1:4
Figure 1.2 Flemming (2004) vowel matrix; (a) matrix, (b) F1 MINDIST inherent ranking
Vowel sounds in the F1 and F2 dimensions in (Figure 1.2a) are given values (the closest IPA
symbol) based on their coordinates; sound distinctiveness can be calculated by the differences of
pairs of vowels along these dimensions. Minimum distance constraints, such as those given in
the ranking in Figure 1.2b, are in the format Dimension:distance. For example, MINDIST = F1:1
indicates that contrasting sounds must differ by at least 1 unit on the F1 dimension. A vowel pair
of [ɑ] and [ɔ] would violate MINDIST = F1:2 but not MINDIST = F1:1.
In addition to the minimum distance constraints, which promote the goal of maximizing
distinctiveness in contrasts, there must also be a constraint that promotes the goal of maximizing
the number of contrasts. Flemming (2004) proposes MAXIMIZE CONTRASTS, which is a positive
3 Flemming (2004) does include F3 in his Figure 6 (238), but states that this third dimension of F3 less clearly
contributes to the main dimensions of the similarity space for vowels.
10
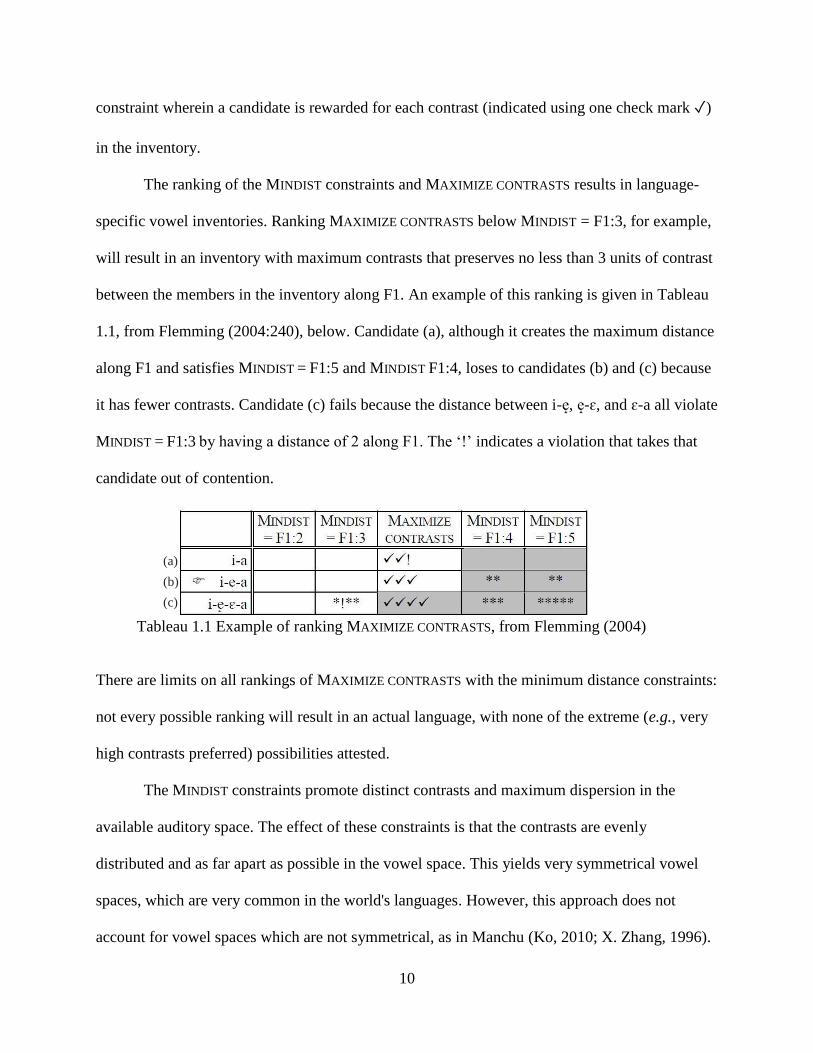
constraint wherein a candidate is rewarded for each contrast (indicated using one check mark ✓)
in the inventory.
The ranking of the MINDIST constraints and MAXIMIZE CONTRASTS results in language-
specific vowel inventories. Ranking MAXIMIZE CONTRASTS below MINDIST = F1:3, for example,
will result in an inventory with maximum contrasts that preserves no less than 3 units of contrast
between the members in the inventory along F1. An example of this ranking is given in Tableau
1.1, from Flemming (2004:240), below. Candidate (a), although it creates the maximum distance
along F1 and satisfies MINDIST = F1:5 and MINDIST F1:4, loses to candidates (b) and (c) because
it has fewer contrasts. Candidate (c) fails because the distance between i-e̝, e̝-ɛ, and ɛ-a all violate
MINDIST = F1:3 by having a distance of 2 along F1. The ‘!’ indicates a violation that takes that
candidate out of contention.
There are limits on all rankings of MAXIMIZE CONTRASTS with the minimum distance constraints:
not every possible ranking will result in an actual language, with none of the extreme (e.g., very
high contrasts preferred) possibilities attested.
The MINDIST constraints promote distinct contrasts and maximum dispersion in the
available auditory space. The effect of these constraints is that the contrasts are evenly
distributed and as far apart as possible in the vowel space. This yields very symmetrical vowel
spaces, which are very common in the world's languages. However, this approach does not
account for vowel spaces which are not symmetrical, as in Manchu (Ko, 2010; X. Zhang, 1996).
Tableau 1.1 Example of ranking MAXIMIZE CONTRASTS, from Flemming (2004)
(a)
(b)
(c)

11
In Manchu (inventory of /i, u, ʊ, ɔ, ə, a/), /i/ is the only front vowel; it is also a neutral vowel,
which is phonetically [ATR] but does not trigger ATR harmony. Dispersion Theory cannot
account for this asymmetry in the vowel inventory when different vowels have different statuses
in the phonology; that is, different vowels may trigger phonological processes while others do
not, regardless of their phonetic properties.
MINDIST constraints can account for contrast neutralization if effort minimization is also
taken into account. Neutralization in contexts where acoustic cues are weak is a pervasive
characteristic in phonology (Steriade, 1997). Flemming (2004) includes the general constraint
*EFFORT: if the contrast cannot satisfy a higher-ranking minimum distance constraint without
violating *EFFORT, the contrast will be neutralized in a given context (see Ranking 1.1 below). It
follows that neutralization occurs in contexts with weak cues because it will take too much effort
on the part of the speaker to reach the necessary dispersion level to prevent confusability.
(Ranking 1.1) MINDIST = d, *EFFORT » MAXIMIZE CONTRASTS
As Flemming (2004:243) states, the possibility of realizing a contrast that satisfies
minimum distance constraints without violating *EFFORT is highly dependent on context, as is
articulatory effort. The properties of the *EFFORT constraint are not straightforward; it is not
clear if this is a categorical, gradient, or binary constraint. Flemming is hesitant to completely
formalize the effort minimization constraint, as it is very dependent on articulatory and
contextual factors which are beyond the scope of his paper. Flemming (2004) does show how the
Dispersion Theory analysis of neutralization accounts for vowel reduction in Italian dialects.
Here, *EFFORT is not only context dependent, but also depends on its relative ranking amongst
other effort constraints (e.g., *SHORT LOW V, requiring short vowels in unstressed syllables).

12
In sum, Flemming (2004)’s analysis adapts the ranking and competition framework of
OT to the goals and hypotheses of Dispersion Theory. Two of the three main goals are
perception-based: (1) maximize the distinctiveness between the contrasts for sounds in the
inventory (or context) by maximizing their distance in the auditory space with the MINDIST
constraint, and (2) maximize the number of contrasts the speaker can make in the auditory space
with the MAXIMIZE CONTRASTS constraint. These perception-based goals are also in competition
with a speaker-oriented goal: (3) minimize effort of articulation with the *EFFORT constraint.
One central question facing Dispersion Theory is how it can explain vowel system
typology while only accounting for contrast in quality. Lass (1984) warns against specious
universals that may arise as a result of errors made in typological studies, including omission of
diphthongs. For example, by omitting diphthongs, Sedlak (1969: 36) provides German and
Hungarian as examples of the ‘same’ system type; however, Lass points out that a closer look at
the full inventories of contrastive vowels in both languages reveals that German has three
diphthongs /ai, au, ou/. Lass argues that including quantity is necessary in vowel typology,
stating that “quality and quantity are often two sides of the same coin, and are not in the
‘necessary’:‘contingent’ relation suggested by much of the typological tradition,” (1984:99).
Diphthongs are a problem for Flemming not only because they contrast in quantity and
quality, but also because typological trends of diphthongs in vowels systems are not widely
studied. Little work on implicational relationships has been done for diphthongs, and there are
disagreements on what an ideally ‘contrastive’ diphthong is. Should diphthong endpoints be
contrastive with monophthongs, or should they be contrastive within a diphthong? If contrasts
follow perceptual and articulatory goals, how are diphthongs produced and perceived, and what
are the most relevant phonetic properties? The previous work on diphthong typology and
13
markedness is reviewed in the following section, and diphthong phonetic properties are reviewed
in Section 1.3.
1.2.3 Diphthong Typology and Markedness
1.2.3.1 Typological Trends in Diphthongs
As stated above, the goal of models of vowel dispersion is to explain and model the
typology of vowel systems in the world’s languages. Often work on vowel typology and
universals of vowel systems do not mention anything about diphthongs and their place in vowel
systems (Becker-Kristal, 2010; Crothers, 1978; De Boer, 2000). Models which are meant to
predict dispersion in the vowel space tend to ignore diphthongs; vowels with two targets were
not integrated into the models (Becker-Kristal, 2010; De Boer, 2000; Flemming, 2004;
Liljencrants & Lindblom, 1972; Lindblom, 1986) . In order to include diphthongs in these
models, the typology of diphthongs must be discussed. Although some descriptive and
typological work has been done on diphthong inventories, there is little to no literature
concerning how diphthong markedness should be defined and little experimental evidence to
support hypotheses made in the literature. In the typological studies that do include diphthongs,
these only take the features of the onset and offset target vowels into account, but do not address
temporal relations.
One reason for using typological data is that phonological preferences concerning
markedness and phonotactics that are components of our phonological system become apparent
through the frequency of languages exhibiting certain patterns. Unmarked vocalic sequences

14
should be present in more languages than marked sequences.4 The typological data on
diphthongs is sparse, but it provides insights into preferences about diphthongs cross-
linguistically.
In the typological studies that do contain work on diphthongs, two competing theories on
cross-linguistic diphthong preferences have surfaced, likely as a result of differing criteria for
what qualifies as a diphthong in the different databases. The first theory is that languages prefer
maximum perceptual differentiation between endpoints, leading to the greatest trajectory. The
second theory argues that diphthongs that begin or end with a high vowel are preferred. Details
of each are discussed in this section.
In his work on vowel universals, Lindblom (1986) briefly discusses diphthongs. His
observations were primarily made based on data from a typological study of 80 languages by
Edström (1971). Lindblom concedes that due to the heterogeneous and secondhand nature of
these data5, he can draw few generalizations from it. He suggests that, according to the
typological data, diphthongs that have a greater distance (trajectory) between the two targets
have a greater frequency cross-linguistically. Lindblom (1986) provides the following hierarchy:
[aj, aw] » [ej, ow] » [uj, iw].6 In sum, diphthongs with lower onsets are preferred over
diphthongs with high vowel onsets, indicating a preference for a sonority difference along F1.
Notably, Lindblom’s hierarchy omits many of the diphthongs that occur in the world’s languages
and does not include diphthongs with high vowel onsets and low offsets such as [ia, ua]. Despite
4 It should be noted, however, that caution should be taken when interpreting results from typological studies,
especially if data are retrieved from multiple sources. Methodology, assumptions, and descriptive quality vary
between corpora, and it may be difficult to reconcile differences between these factors to arrive at valid results. 5 Although he does not state explicitly why the secondhand data is insufficient, Lindblom likely felt that the data set
was not representative enough to draw definitive typological conclusions. 6 These older transcriptions most likely correspond to [aɪ, aʊ] » [eɪ, oʊ] » [uɪ, ɪʊ].
15
these remarks, Lindblom (1986) does not incorporate diphthongs into his own typological
prediction model.
Sánchez Miret (1998) seeks to explain the differences in characterizations of diphthong
properties in the earlier literature with a typological study. He examines cross-linguistic data
from the Stanford Phonology Archive (SPhA)(Crothers, Lorentz, Sherman, & Vihman, 1979),
the UCLA Phonological Segment Inventory Database (UPSID) (Maddieson, 1984), and Weeda
(1983) for frequency and combinatorial patterns. Sánchez Miret finds diphthongs from 48
languages7 from UPSID’s 451 languages (1992 version). He notes that UPSID only takes into
account ‘monophonematic’8 diphthongs, which is why so few are listed in that database. He finds
55 languages with diphthongs (monophonematic, biphonematic, and allophonic) from the 197
languages in SPhA. However, as Sands (2004) notes, inconsistencies and exclusions with respect
to the sequences in the SPhA skew the database and make it problematic for sampling. From
Weeda’s study of 26 languages, Sánchez Miret includes 21 that have diphthongs. Sánchez Miret
summarizes the typological data from these three sources in a series of figures, reproduced in
Figure 1.5-Figure 1.5.
7 Sánchez Miret acknowledges in a footnote that Bladon (1985:14) found 78 languages with diphthongs in
Maddieson (1981) while Maddieson (1984) found 23, which leads to differences in their frequency data. Sánchez
Miret omits nasal, pharyngealized, and breathy voiced diphthongs. 8 In Weeda’s study, monophonematic = tautosyllabic diphthongs as described in this study; biphonematic = vowel +
vowel sequences (hiatus) and vowel + glide sequences.

16
second element
firs
t el
emen
t
i u ɪ ʊ e o ɛ ɔ æ a ə total
i 2 6 1 1 1 5 1 17
u 8 4 3 5 20
ɪ 1 1
ʊ 1 1
e 7 3 1 1 12
o 6 5 1 2 14
ɛ 3 1 4
ɔ 6 6
æ 3 3
a 19 18 37
ə 2 4 3 4 1 14
total 55 32 0 0 11 10 2 0 1 11 7 129
Figure 1.3 Diphthong typology data9 from UPSID (1992)
second element
firs
t el
emen
t
j w i u ɪ ʊ e o ɛ ɔ æ a ɐ ɜ ə total
j 5 2 2 1 2 1 13
w 1 3 1 1 2 8
i 4 2 2 8
u 4 1 2 1 8
ɪ 1 1 2 2 6
ʊ 1 1 1 2 1 6
e 7 3 1 3 1 1 1 2 19
o 3 5 2 4 1 1 1 1 1 1 20
ɛ 3 1 1 1 1 1 8
ɔ 2 2 3 7
æ 1 1 1 3 6
a 6 3 5 4 2 1 1 1 1 24
ɐ 1 1
ɜ 1 1 1 1 4
ə 0
total 31 14 14 10 10 2 9 10 7 3 3 10 0 0 15 138
Figure 1.4 Diphthong typology data from SPhA (combined monophonematic, biphonematic,
allophonic data)
9 See Sánchez Miret for changes made to transcriptions.
17
second element
firs
t el
emen
t
j w i u ɪ ʊ e o ɛ ɔ æ a ə total
j 1 2 1 1 1 1 2 1 10
w 1 1 2
i 1 1 4 2 1 2 1 2 1 15
u 1 1 5 1 1 3 2 1 2 1 18
ɪ 0
ʊ 1 1
e 1 2 2 1 1 1 1 1 1 11
o 1 2 1 2 1 3 1 11
ɛ 1 2 2 5
ɔ 1 1 1 2 1 6
æ 1 1
a 2 1 5 7 4 1 1 2 3 1 1 28
ə 1 1 1 1 4
total 10 8 17 19 10 2 7 8 9 5 0 11 6 112
Figure 1.5 Diphthong typology data from Weeda (1983)
These frequency findings provided in the above figures should be used with caution,
however, as Sánchez Miret omits several segments for space reasons (see Sánchez Miret 1998
for details), and also has altered some of the transcription notation, causing some
inconsistencies10. A very thorough review of these databases can be found in Sands (2004).
By examining the most frequent diphthongs from these data sets, Sánchez Miret
concludes that the most important factor for possible diphthongs is the difference in sonority of
the components: diphthongs tend not to have two sounds of equal sonority because if both onset
and offset targets have the potential to be nuclei in separate syllables, they may be mistaken for
hiatus. Ideal diphthongs are therefore clearly tautosyllabic. Frequency data supports this, as
combinations of low vowels in diphthongs are not well attested. The typology also suggests that
10 Sands (2004) provides the following example in footnote [20]: “among the diphthongs from Weeda (1983) that
enter into Sánchez Miret’s frequency counts, we find /aj/ listed as occurring in 2 languages, /ai̯/ in 5, and /aɪ/ in 4,
while meanwhile /aj/ (2 languages) and /ɑɪ/ (1 language) are omitted, their existence recoverable only from the
footnote. In all probability, /ai/, one phonemic sequence, occurs in 14 languages.” (18-19)

18
changes in both backness and height, as opposed to height or backness changes alone, between
the two diphthong targets leads to maximal differentiation, and diphthongs with both height and
backness differences are typologically more frequent. This echoes Lindblom (1986)'s findings
that suggest preferred diphthongs have the greatest trajectory and maximum perceptual
differentiation of endpoints. Phonetic diphthongs such as [eɪ] and [oʊ] in English do not seem to
require maximal differentiation, but this may be due to their phonological status in English as
phonetic variants; it is unclear from Sánchez Miret’s hypothesis why other languages allow for
phonemic /eɪ/ and /oʊ/, which have small changes in sonority. These data also show that
diphthongs containing a central vowel as the onset or offset are rare.
In Patterns of Sounds, along with an extensive overview of vowel systems and phoneme
inventories, Maddieson (1984) briefly remarks on cross-linguistic preferences concerning
diphthongs. Out of the languages inventoried (n = 317), he found 83 diphthongal segments from
a total of 23 different languages.11 Maddieson notes that this is such a small number due to the
criteria needed to be met to classify as a diphthong in the database; only diphthongs that are
phonemically contrastive in the vowel inventory are counted: diphthongs that are not contrastive
(phonetic) are not included. Maddieson found that languages prefer diphthongs that begin or end
with a high vowel; this supports Sánchez Miret's findings that combinations of low vowels are
dispreferred. However, Maddieson's findings contradict Sánchez Miret and Lindblom in that
maximizing the distinctiveness between targets does not explain the patterns Maddieson found in
UPSID, as diphthongs with short trajectories are among the most common types of diphthongs.
11 2,549 monophthongal vowel entries are in the UPSID database, accordingly only 3% of vowel entries are
diphthongal. This is an unexpected percentage, considering Lindau et al. (1990)’s estimate that based on UPSID
data, diphthongs occur in about one third of the world’s languages.

19
Table 1.1 shows Maddieson's findings of the most common diphthongs (those that occur in more
than 2 languages).
Table 1.1 Common diphthongs from Maddieson (1984: Table 8.6)
Diphthong Count
/ei/ 6
/ai/ 5
/au/ 5
/ou/ 4
/ui/ 4
/io/ 4
/ie/ 3
/oi/ 3
It is clear that the literature on cross-linguistic preferences in diphthongs is not in
agreement. This may be due to various factors, including variances in the criteria these
typological studies used to differentiate between diphthongs, hiatus, off-gliding of
monophthongs, etc. It appears that the difference between the two targets is important, but
whether it is maximum distance or merely height (sonority) which plays a bigger role in
diphthong dispersion and cross-linguistic preferences is not clear from Sánchez Miret (1998),
Lindblom (1986), and Maddieson (1984) alone.
A very thorough analysis is found in Sands (2004)’s dissertation on the typology of
vocalic sequences, including diphthongs, glide + vowel sequences, and triphthongs. Sands
examines vocalic sequence patterns cross-linguistically and finds that both Dispersion Theory
and Sonority Sequencing principles underlie typological preferences. This is the first work to use
Dispersion Theory principles to explain trends in vocalic sequences. After collecting typological
data and creating a database of 42 representative languages that contain vocalic sequences, Sands
finds several prominent patterns, generally based in frequency across vowel inventories, given
below:

20
1. High Prevalence: at least one member or each pair of adjacent vocalics is high (/ia/>/oa/)
2. Back-Round Dispreference: adjacency of two back-round vocalics is dispreferred
(/ei/>/ou/)
3. Maximized Formant Trajectory: backness patterns with corresponding rounding
(producing greater F2 contrast) across the sequence are preferred (/ui/>/yi/); greater
height/F1 differences between adjacent elements are preferred (/ai/>/ei/)
4. Alternating Backness Dispreference Pattern: trivocalic sequences which alternate in
backness with each vocalic are dispreferred (/uei/>/ueu/)
5. Left-Edge Distinctiveness Pattern: the middle element of a trivocalic sequence typically
patterns with the right-most element in backness, together in opposition to the left-most
element (/uei/, /iou/, not /ieu/)
The patterns given above from Sands (2004) encompass prior observations by Sánchez
Miret (1998), Lindblom (1986), and Maddieson (1984). Sands (2004) explains that the strongest
principle leading to these cross-linguistic patterns is the principle of maximum distinctiveness
from Dispersion Theory (Flemming, 2004). Distinctiveness between the two elements of a
diphthong, whether in height, backness, or both, creates a more salient sequence for the listener.
Preference for certain sequencing patterns, especially in triphthongs, can also be explained by the
Sonority Sequencing and Dispersion principles.
The main findings in this section are summarized in Table 1.2.

21
Table 1.2 Summary of typological findings
Maximum
Formant
Trajectory
(backness and
height)
Maximum
Sonority
Difference
(height)
High Prevalence
(at least one high
vowel)
Back-Round
Dispreference
Edström (1971)
in Lindblom
(1986) ✓ ✓
Sánchez Miret
(1998) ✓ ✓
Maddieson
(1984) ✓
Sands (2004) ✓ ✓ ✓
One problem with Sands’ and Maddieson’s results is that they are based on frequency
count alone, which is a problematic measure for making typological conclusions concerning
diphthong markedness. This is due to the fact that the presence of diphthongs in certain prevalent
language families could distort the frequencies; additional work on implicational relations of
diphthongs in inventories will lead to valid typological conclusions about diphthong markedness.
Implicational work on diphthongs, however, is rare or non-existent. Still, the work presented in
this section is a significant step forward in understanding cross-linguistic diphthong patterning.
Notably, all typological studies concerning diphthongs only take the features of the onset
and offset target vowels into account, but do not address temporal relations. However, the
perception experiments discussed in Section 1.4 suggest that duration is an integral part of
diphthong identity. The interaction of vowel quality and time is what differentiates diphthongs
from monophthongs and thus creates an additional level of contrast in vowel systems.
Additionally, previous literature (Section 1.4) shows that diphthong phonetic properties are
sensitive to changes in duration themselves, which makes temporal relations a particularly

22
meaningful factor to consider. By not including information regarding temporal relations in the
studies on typology, it is yet unknown how diphthong duration cues may affect the structure of
vowel systems.
1.2.3.2 Diphthong Markedness, Contrast and Confusability
In Dispersion Theory, the markedness of a sound depends on the contrasts it enters into.
This theory predicts that languages will prefer less confusable contrasts over more confusable
contrasts, thereby improving perceptual intelligibility. Perceptual confusability between vowels
and between consonants has been tested in prior work and results are often presented in
confusability (or confusion) matrices (Luce, 1963). Confusability matrices provide essential
information about the perceptual system, but matrices are rare outside of English consonants and
monophthongs (Cutler, Weber, Smits, & Cooper, 2004; Miller & Nicely, 1955; M. D. Wang &
Bilger, 2005). One exception is a study on Dutch vowel production and perception (Klein,
Plomp, & Pols, 1970).
For extensive work on English vowel and consonant and confusions made by native
speakers compared to non-native (Dutch) speakers, see Cutler et al. (2004). The confusability
matrix for initial vowels (VC) by American English speakers from Cutler et al. is provided in
Figure 1.6. In general, monophthongs are seldom confused with diphthongs, and vice versa.
When confusions with diphthongs did occur, the most frequent were /oʊ/ for /aʊ/ (8.2%), /ɪ/ for
/aɪ/ (6%), and /aʊ/ for /ɔɪ/ (2.3%).
23
Figure 1.6 Confusability matrix of initial vowels for American English from Cutler et al. (2004).
Percentages of pooled results over all participants and consonant contexts.
The data derived from studies in perceptual confusability has also been used in other
areas of phonological theory. The relative perceptibility of different contrasts in different
positions is central to Steriade (2001)’s P-Map (P for perceptibility) proposal for OT, in which
the P-Map is used to rank faithfulness constraints. The P-map is essentially a repository of the
knowledge speakers have about perceptibility between contrasts in different phonological
environments. Steriade argues that in OT, the P-map may be used to solve the “too many
solutions” problem (in which OT over-predicts the typology of repairs) by allowing faithfulness
constraints to get their default rankings from the P-map: constraints penalizing big changes
should outrank constraints penalizing small changes.
In order to advance theory based in perception, it is necessary to continue work on
confusability in non-English languages. Little is known regarding confusion between diphthongs,
though prior research on diphthong perception is discussed in Section 1.4. The results of the
perception experiment in Chapter 3 contribute to the work being done in this domain.

24
1.2.4 Diphthongs in Dispersion Theory
The models of vowel dispersion discussed above, namely Lindblom (1986) and
Flemming (2004) notably only accurately predict the distributions in vowel systems containing
relatively small to medium monophthong vowel systems. Few works have attempted to analyze
dispersion of diphthongs; in those discussed below, it is used as secondary support to an
argument rather than to predict diphthong typology itself.
Difficulties in incorporating diphthongs in Dispersion Theory stem from both theoretical
and empirical issues. Dispersion Theory developed as a contrast-based theory of markedness
between sounds in order to explain, predict, and derive vowel quality systems. The main
principles governing the relationships between sounds are: (i) maximize distinctiveness, (ii)
minimize articulatory effort, (iii) maximize number of contrasts. These phonological principles
are phonetically supported by evidence in perception, production, and typological studies of
vowel quality. However, diphthongs have traditionally been omitted from these larger-scale
perception, production, and typological studies. As a result, principles of diphthong dispersion,
contrast, and markedness are not well understood. Literature reviewed in the previous section has
suggested that typologically, diphthongs with maximally disperse endpoints are preferred and
there may be trends regarding high vowels and back round vowels (see Section 1.2.3). Despite
these findings, there are additional gaps in the literature concerning temporal relations and their
effects on diphthong phonetic properties, typology, and markedness. The work discussed in this
section focuses only on diphthong endpoint dispersion, which may be an incorrect assumption,
as it ignores the role of temporal relations. Previous work (Lass, 1984) has suggested that any
work on vowel system universals and typology would be incomplete without inclusion of both
quality and quantity.
25
Bermúdez-Otero (2003) uses evidence of diphthong raising and of flapping in Canadian
English counterbleeding as support for a Stratal OT model. Crucially, this analysis proposes the
constraint CLEARDIPH, a context-free markedness constraint that favors diphthongs with
maximum auditory distance between the onset and offset targets. Bermúdez-Otero also proposes
a context-sensitive markedness constraint CLIPDIPH, which demands a minimization of the
distance between the two targets. These two markedness constraints are in direct opposition, and
it is not clear why both should be present in the constraint inventory; additionally, neither are
grounded nor motivated outside the data set given. Context-free versions of these constraints are
used in Minkova and Stockwell (2003).
The main goal of Minkova and Stockwell (2003) is to derive English vowel shifts in
bimoraic nuclei (nucleus-glide dissimilation, nucleus-glide assimilation, chain shift, and merger).
They argue that this phonological restructuring is due to competing phonetic and phonological
goals to create 'optimal' diphthongs. For Minkova and Stockwell, 'optimal' diphthongs have the
maximum distance (ΔF1 and ΔF2) between the two targets. Minkova and Stockwell provide
relevant constraints for diphthong analysis, HEARCLEAR and *EFFORT, both which function
similarly to CLEARDIPH and CLIPDIPH, with the exception that they are both context-free.
HEARCLEAR is based on the goal of maximizing perceptual distance, based on the F1 (height)
and F2 (backness) parameters, between the onset and offset targets:
HEARCLEAR: Maximize the auditory distance between the nuclear vowel and the
following glide (measured in formant frequency).
This constraint is grounded in the findings that vowel inventories seek to maximize the
distinctiveness of contrasts (Flemming 2004, Lindblom 1986, Sánchez Miret 1998), although it
26
has not yet been shown experimentally that speakers prefer to maximize distinctiveness of
contrasts between the two elements of a diphthong.
Deriving their methodology from Flemming's earlier work (1995a), Minkova and
Stockwell's HEARCLEAR is separated into its two parameters: HEARCLEAR F1 and HEARCLEAR
F2; determining violations follows a similar framework Flemming's (1995a, 2004) matrix.
Minkova and Stockwell also follow Flemming (1995a) in including the MINDIST constraints, as
described in Section 1.2.2. However, diphthong candidates are evaluated one at a time rather
than the entire diphthong inventory at once.
Minkova and Stockwell diverge from Flemming in using additional constraints (IDENT
IO(CONTRAST)) at the input-output level, as opposed to Flemming’s single-level. They argue that
once an inventory is derived, it becomes an input phonology subject to speaker and listener
evaluation, leading to phenomena such as chain shift and merger. This is an interesting concept;
however, it is inconsistent with Flemming’s Dispersion Theory principles that should
theoretically take both production and perception into account to fully derive vowel inventories.
Minkova and Stockwell hypothesize that different rankings of HEARCLEAR, MINDIST, *EFFORT,
and IDENT IO(CONTRAST) can derive English merger, chain shift, nucleus-glide dissimilation, and
nucleus-glide assimilation.
Amos (2011) is the first to derive a small diphthong inventory as part of a larger study on
diphthongs. Amos focuses mainly on the sociolinguistic distribution and use of the diphthongs
[aɪ, aʊ, ɔɪ] in Mersea Island English, a language spoken off the coast of southeast England. Amos
proposes diphthong-internal constraints DIPHCONT2 and DIPHCONT1, constraints that enforce
separation of the two diphthongal elements by 2 units of height and 1 unit of height, respectively
(Amos simplifies Flemming (2004)'s matrix into three rows and three columns). Diphthong

27
inventories are then evaluated in a single tableau. With Amos's simplifications, there would be
no way to scale to larger diphthong inventories or include monophthongs. Her analysis does not
lead to any broader generalizations concerning diphthong typology or have implications for the
theory; it is simply a way of describing the diphthong inventory in Mersea Island English. Amos
can also only account for differences in height, but not differences in backness—both of which
are important to diphthong identity.12 Finally, Amos does not include the goal of effort
conservation in Dispersion Theory into the analysis, as no *EFFORT constraint is used.
These previous attempts to incorporate diphthongs (Amos, 2011; Bermúdez-Otero, 2003;
Minkova & Stockwell, 2003) operate on the assumption that maximum distance between the
onset and offset points is the most relevant cue to diphthong dispersion (rather than duration or
slope). Typologically, this may be the wrong assumption, as is discussed in Section 1.2.3.
1.2.5 Summary
This section has discussed diphthongs in vowel systems, including how dispersion in the
vowel space has been modeled and current hypotheses of typology and markedness of
diphthongs. Theories of vowel dispersion hypothesize that competition of constraints of
maximum distinctiveness of contrasts, minimum articulatory effort, and maximum number of
contrasts lead to optimal vowel inventories. It is still unclear what an ‘optimal’ inventory
including diphthongs looks like. Typology suggests that either maximum sonority or maximum
distance between the two targets of a diphthong is preferred cross-linguistically, but this has
never been tested though implicational work or through artificial language learning
experimentation. Several gaps remain in the literature, including how to incorporate both
12 If an inherent ranking of F1 and F2 constraints is found, it might give an insight into whether backness or height is
more important for diphthong perception typologically.
28
diphthongs and contrastive duration into models of vowel dispersion and a thorough
understanding of cross-linguistic preferences of diphthongs.
Ultimately, models of vowel dispersion are based on phonetic production and perception
properties. To fully incorporate diphthongs into these models and to explain typological trends,
the phonetic properties of diphthongs must be fully explored. Sections 1.3 and 1.4 review
previous literature on diphthong phonetics, including production and perception.
1.3 Diphthong Parameters and Definition
1.3.1 Introduction
Diphthongs provide an interesting insight into the interface of phonetics and phonology.
In literature dating back to the early-20th century, leading linguistic figures such as Jan Baudouin
de Courtenay (1845 - 1929), Ferdinand de Saussure (1857 - 1913), and Nikolay Trubetzkoy
(1890 – 1938) developed the idea of a separation between the concrete, physical study of
phonetics and the more psychological, abstract study of phonology. Both the phonetics and
phonology of diphthongs are important to the present study. As a physical phonetic entity, a
diphthong is composed of a complex transitional movement through the vowel space over time.
The speech signal of a diphthong is dynamic and continuous, yet speakers and listeners are able
to identify diphthongs as discrete, categorical elements of language despite the complexity of the
speech signal. The dynamic nature of a diphthong has led to differences in the phonological
descriptions of diphthongs in previous literature and differences in how languages utilize vocalic
movement in their phonological inventories.
The purpose of this section is to review the phonetic properties and proposed
phonological representations of diphthongs and discuss differences that have arisen in previous
literature. The first section 1.3.2 discusses the physical, phonetic elements of diphthongs,

29
including onset and offset targets, steady states, and transitional trajectory. The second section
1.3.3 places diphthongs along a phonological spectrum between monophthongs, hiatus, and
vowel-glide sequences in order to establish the phonological properties of diphthongs. Because
there has been a large debate concerning what a diphthong is in previous literature, the final
section 1.3.4 combines aspects from the previous two sections to provide a definition of
diphthong to be used in this study. The final section also draws from parallel discussions on the
debate of representations of contour tones in previous literature; contour tones and diphthongs
share many phonetic and phonological properties, and many of the arguments for a
compositional vs. unitary definition of contour tones also apply to diphthongs. Both contour tone
and diphthongs are discussed as members of a broader category of ‘contour segments’ in Q-
Theory, a representational theory of subsegmental phonology.
1.3.2 Phonetic Parameters of Diphthongs
Although diphthongs form a continuous movement in the speech signal, it is useful for
both phonetic and phonological analysis to discuss the phonetic elements diphthongs are
composed of in greater detail. The properties discussed in this section are those that are mainly
focused upon in previous literature: targets, steady states, and trajectories. Separation of a
diphthong’s acoustic signal into these components allows them to be compared experimentally
(Gottfried, Miller, & Meyer, 1993) to identify the most perceptually relevant cues of diphthongs.
In this section, multiple diagrams from many different sources—including the present work—
depict formant movement in diphthongs.
The study of the acoustic properties of diphthongs emerged out of early literature on
vowel measurement. As acoustic technology improved in the 1940s and 1950s, there was a rush
of interest to find a clear way of portraying visible speech. After Potter, Kopp, and Green’s
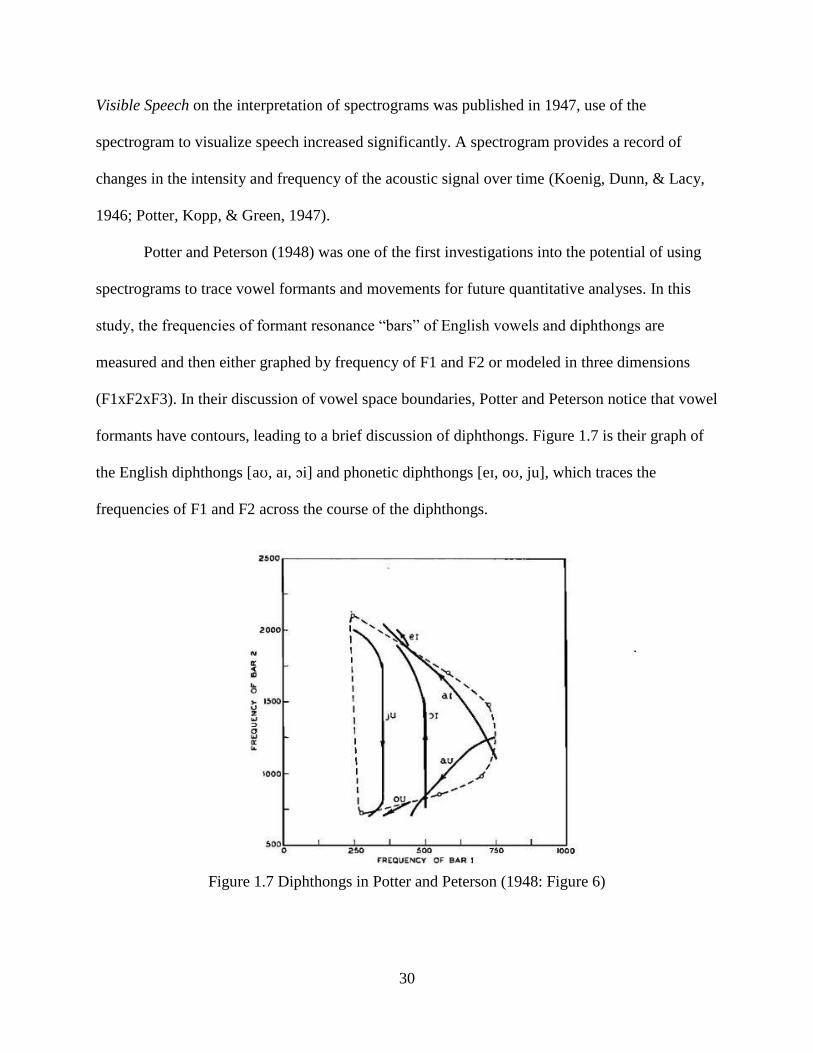
30
Visible Speech on the interpretation of spectrograms was published in 1947, use of the
spectrogram to visualize speech increased significantly. A spectrogram provides a record of
changes in the intensity and frequency of the acoustic signal over time (Koenig, Dunn, & Lacy,
1946; Potter, Kopp, & Green, 1947).
Potter and Peterson (1948) was one of the first investigations into the potential of using
spectrograms to trace vowel formants and movements for future quantitative analyses. In this
study, the frequencies of formant resonance “bars” of English vowels and diphthongs are
measured and then either graphed by frequency of F1 and F2 or modeled in three dimensions
(F1xF2xF3). In their discussion of vowel space boundaries, Potter and Peterson notice that vowel
formants have contours, leading to a brief discussion of diphthongs. Figure 1.7 is their graph of
the English diphthongs [aʊ, aɪ, ɔi] and phonetic diphthongs [eɪ, oʊ, ju], which traces the
frequencies of F1 and F2 across the course of the diphthongs.
Figure 1.7 Diphthongs in Potter and Peterson (1948: Figure 6)

31
The authors note that the "traces tend to follow the shortest route, moving directly across the area
from the first vowel element to the second"; no details on the duration measurements were given,
it is only stated that measurements were made at “various points in time for each diphthong”
(531). Potter and Peterson anticipated the role spectrograms would have in future work in
phonetics; their innovations led to extensive research on vowel movement and formant analysis.
An example of a modern spectrogram of a diphthong is shown in Figure 1.8, which is the
Faroese diphthong [ʊi]. This spectrogram provides an example of the amount of complexity, in
terms of formant movement, which occurs across the course of a diphthong.
Figure 1.8 Spectrogram of Faroese diphthong [ʊi]
The following diagram, adapted from Dolan and Mimori (1986), depicts a diphthong
schematically and shows how it is divided into the parameters discussed in this section. Note that

32
the trajectory shown is F2; F1 and F3 are not shown13. From left to right, Figure 1.9 shows a
period of onset steady state, period of trajectory, and offset steady state. The onset and offset
targets are marked at the beginning and end (avoiding perseveratory and anticipatory consonant
transitions) of the onset steady state and the offset steady state, respectively, or at the beginning
and end of the trajectory if steady states are not present14. For measurement consistency, Dolan
and Mimori (1986) define the beginning of the transition as a change in F2 of at least 15 Hz (for
English) or 20 Hz (for Japanese)15 over a period of 10 ms. Measurements for the end of the
transition are the mirror of the onset.
Figure 1.9 Schematic of a diphthong from Dolan and Mimori (1986)
13 Although F2 is primarily considered in work on diphthong trajectories, findings in Clermont (1993) suggests the
F3 transition may also contain perceptual cues. This possibility is discussed in Section 1.3.2.2. 14 See Section 1.3.2.1 for a description of the variability of diphthong steady states. 15 These Hz figures were chosen relatively arbitrarily through trial and error; they provided the most accurate change
in Hz for Dolan and Mimori (1986)’s software to classify the correct portions of the diphthong as either steady states
or transitions.
Offset
Target
Fre
quen
cy (
Hz)
Duration
Offset steady state
Onset Target +15-20 Hz
-15-20 Hz
Trajectory
Onset steady state

33
The details of this schematic are discussed as follows: Section 1.3.2.1 reviews literature
pertaining to the targets and steady states of diphthongs; Section 1.3.2.2 reviews aspects of a
diphthong’s trajectory; the duration of the diphthong and the trajectory’s slope are further
discussed in Section 1.4.
1.3.2.1 Targets and Steady States
Onset and Offset Targets
Onset and offset targets are points of measurement at either end of a diphthong. These
points are not necessarily taken during the steady state, as previous research has shown that
steady states are inconsistent across speech rates, different languages, and across diphthongs
themselves (Borzone de Manrique, 1979; Gay, 1968; Peeters, 1991). More precisely, they are
point measurements taken directly after the perseveratory consonant transition into the diphthong
("initial transition," e.g., the transition between [b] and [aɪ] in [baɪd] bide) and directly before the
anticipatory consonant transition out of the diphthong ("final transition," e.g., the transition
between [aɪ] and [d] in [baɪd] bide). While these consonantal transitions are relevant for both
vowel and consonant perception and identification (Strange, Edman, & Jenkins, 1979), a study
concerning the diphthong elements themselves should exclude effects of formant movements
that are caused by the surrounding consonants. Thomas (2011) suggests using a specified
distance, such as 25-35 ms from the beginning of the vowel and from the end of the vowel, to be
sufficient measurement points for obtaining the onset and offset target values without influence
from perseveratory and anticipatory coarticulation.
Production studies have shown that the onset and offset target formant values are
different from formant value measurements of comparable monophthongs and/or semi-vowels.
Although Lehiste and Peterson (1961) do not make a numerical comparison of diphthong

34
formant values to monophthong formants, they do mention that the labels used for the diphthong
nuclei are intended simply as placeholders: "Neither of the elements comprising the diphthong is
ordinarily phonetically identifiable with any stressed English monophthong; for example, in /aɪ/
the first element is neither /a/ nor /æ/, and the second element is neither /i/ nor /ɪ/" (276). Several
studies have made closer comparisons between each diphthong element and their monophthongal
counterparts, including Holbrook (1958), Lehiste (1964), Holbrook and Fairbanks (1962), Wise
(1965) and Collier, Bell-Berti, and Raphael (1982). These studies focus primarily on the initial
and final segments of the English diphthongs [aɪ, aʊ, ɔɪ, eɪ, oʊ], although it should be mentioned
that a limited amount of research has been done in this area on non-English languages, including
Dutch (Collier et al., 1982), Japanese (Dolan & Mimori, 1986), Arabic, Hausa, and a Pekingese
dialect of Mandarin Chinese (Lindau, Norlin, & Svantesson, 1990). A summary of the findings
in this literature is given in Table 1.3; each cell indicates their descriptions of the closest
monophthong(s) to the onset and offset segments. These studies came to these results through
formant comparison using production data obtained through wordlist elicitation.
Table 1.3 Comparisons of English diphthong and monophthong elements in previous literature
Segment: /a/ in /aɪ/ /a/ in /aʊ/ /ɪ/ in /aɪ/ and /ɔɪ/ /ʊ/ in /aʊ/ /ʊ/ in /oʊ/
Holbrook &
Fairbanks (1962)
between /a/
and /æ/
between /a/
and /ɑ/ /ɛ/ /ɔ/ -
Lehiste (1964) - - /ɪ/
neither /u/ nor
/ʊ/ -
Wise (1965)
- - either /i/ or /ɪ/
anywhere
from [u] to
[ʊ] to [o]
either /u/ or
/ʊ/
To further distinguish diphthong endpoints from monophthongs, it is useful to investigate
how diphthongs are acquired in L1 (i.e., in one’s native language). Lee, Potamianos, and
Narayanan (2014) investigates variation and developmental trends in the acoustic properties of
diphthongs by age and gender in children and adults. Using a large corpus (436 children and

35
adolescents 5-18 years old16, 56 adults 25-50 years old), Lee et al. compared F1-F2 values of
diphthong onset and offset points to nearby monophthongs to determine if distance between
diphthong and monophthong values change over time or vary by gender; duration and F0 was
also examined. Results from this study suggest that onset and offset positions of diphthongs co-
evolve in the acoustic space with monophthongs; as speakers grow older, the onset and offset
positions become farther in the vowel space from nearby monophthongs. Euclidean distances
from the offset to the closest monophthong were 50-70% greater than onset distances from the
monophthongs. Children, therefore, may use monophthongs as initial anchors for diphthong
positions, but diphthong onset and offset values do become independent targets as children age.
A recent study (Chanethom, 2015) on bilingual and monolingual acquisition of monophthongs
and diphthongs confirms the hypothesis that English and French diphthongs’ onsets and offsets
do not coincide with the monophthongs they are transcribed with, especially for diphthong
offsets. The importance of these studies for the present research is that they show that diphthongs
should be treated as individual members of the entire vowel system, rather than as combinations
or variations of existing monophthongs. The quality of a diphthong's endpoints should not be
assumed to match that of a language's monophthongs.
The onset and offset target points have been shown to be relevant perceptual cues to both
monophthong and diphthong identification (Bladon, 1985; Gottfried et al., 1993; Morrison,
2013; Nearey & Assmann, 1986; Pitermann, 2000). Gottfried, Miller, and Meyer (1993) examine
the three main approaches to characterizing diphthongs by evaluating their performance in a
16 There have been several studies on vowel acoustic space development in children (for a thorough review of these
studies, see Vorperian and Kent (2007)). Yang and Fox (2013) point out that most previous studies argue vowel
acquisition is generally achieved in children by age 3, though Yang and Fox find that from 3 to 7, children continue
to refine phonetic characteristics, especially in the back vowels. In interpreting the results of Lee et al. (2014), note
that several factors affect vowel development outside of general establishment of a language-appropriate acoustic
representation, including emergence of male-female differences, vowel tract growth, and increase of sensitivity to
phonotactic probability.
36
statistical pattern recognition task. In this way, the hypothesis that defines diphthongs with the
most acoustically relevant properties (onset + offset, onset + slope, or onset + direction) which
produces the best parameters for Bayesian classification of diphthongs, even under varying
conditions of tempo and stress, is identified. American English diphthong data was recorded
from 4 speakers at two rates and with two different stress patterns. These hypotheses were
evaluated by means of a Bayesian classifier, which uses the statistical properties of classes of
diphthongs to classify tokens. The results show that while each of the three hypotheses yielded
very accurate results (>90%), the highest percentages that were obtained were for the onset +
offset hypothesis, which averaged at 96% correct classification.
Pitermann (2000) tests whether dynamically modeling formant transitions can outperform
models that simply use steady-states in accounting for results of a perceptual identification task.
In his study, [iai] and [iɛi] sequences were produced at different speaking rates and with different
stress patterns; this corpus was tested in a perceptual identification task by seven listeners.
Pitermann then tested both static and dynamic models to see if they could replicate the accuracy
of the listeners’ perception results. Pitermann found that the models that included dynamic
information did not correlate with the perception data, while static information was more
important than expected and was sufficient. In a review of current literature, Morrison (2013)
found that overall, the evidence points to the onset + offset hypothesis as the most accurate
model to account for perceptual aspects of diphthongs and vowel inherent spectral change in
monophthongs. Models that use formant measurements taken at the endpoints (Nearey &
Assmann, 1986) or at steady-states (Pitermann, 2000) outperform curve-fitting models (Zahorian
& Jagharghi, 1993) when it comes to correct classification of tokens and consistency with
listeners’ results in perception studies. These studies provide evidence that suggests onset and
37
offset target values provide relevant perceptual cues for diphthongs. The perceptual importance
of onset and offset targets is further reviewed in Section 1.4.1, which discusses relative
perceptual importance of onset and offset targets versus the dynamic trajectory that connects
them.
Steady States
A period of duration with minimal spectral movement at the beginning or end of a
diphthong is called a steady state. In the earliest literature on diphthongs, steady states at the
beginning and end of diphthongs were considered to be crucial elements that distinguished
diphthongs from diphthongized vowels (termed glides in Lehiste & Peterson (1961)), which
were described as having only one steady state with a transition either to or from it. Lehiste &
Peterson (1961) define the steady state as “the time interval within the syllable nucleus where the
formants are parallel to the time axis,” (272) with an arbitrary minimum duration of 200 ms.
Subsequent literature (Borzone de Manrique, 1979; Jha, 1985) have followed Lehiste & Peterson
(1961)’s methodology of measuring steady states, albeit without the minimum duration
requirement. Steady states have received less attention in later literature than endpoint targets
and transitional glides, likely because they have been shown to be highly variable.
Studies by Gay (1967, 1968) showed that duration and speech rate may affect the length
and/or presence of steady states in diphthongs. Gay (1968) examines the rate of formant
frequency change in the set of diphthongs [aʊ, aɪ, eɪ, ɔɪ, oʊ] in English by investigating five
speakers' productions of minimal pairs at three different speech rates. His results showed that
each part was shorter when overall duration was reduced in the fast rate condition. Also, the
onset or the offset steady state target was either very small or not present in the fast condition,
whereas both targets (steady states of at least 15ms) were present in the normal and slow
38
conditions. Steady states were the least prominent and glide durations were the longest for the
allophonic diphthongs [eɪ, oʊ], suggesting that diphthongized monophthongs in English behave
differently than phonemic diphthongs; because [eɪ, oʊ] are not contrastive diphthongs in English,
it is unclear if there are differences in steady state behaviors for diphthongs with longer and
shorter trajectories.
In a study of Spanish diphthongs, Borzone de Manrique (1976) found results similar to
Gay (1968) concerning the variability of steady states. In her spectral analysis, Borzone de
Manrique shows that either one or both of the diphthong endpoints may not reach a steady state,
and that this depends on speaking rate, stress placement, and vowel quality. In sum, “when the
stress is placed on the vowels /i, u/, in which case the vowel sequence does not form a
diphthong17, the steady states of these vowels is longer than that of the open ones. On the
contrary, when the stress is placed on the open vowels, the duration relations between both
steady states […] are evident.” While the steady state relations may be a cue to classifying a
vowel sequence in Spanish as either hiatus or diphthong, she concludes that listeners must rely
on other acoustic cues to identify diphthongs.
Inconsistencies across languages, lack of evidence, and the shown variability of steady
states in diphthongs suggests that steady states are not reliable enough to be used to define
universal properties of diphthongs.
1.3.2.2 Trajectory/Slope
A trajectory is the connecting movement between the two targets of a diphthong. The
trajectory is often measured by its slope, which is the rate of change in Hz (cycles per second)
17 In Spanish, stress cues and contextual factors contribute to the classification of a vocal sequence as a diphthong or
hiatus (see Section 1.3.3.1), although this is not completely consistent.

39
over a given duration of time. Previous literature has differed in methodology when measuring a
diphthong’s trajectory. In Dolan and Mimori (1986)’s schematic, reproduced in Figure 1.9, the
trajectory begins at the point when there is at least a 15 Hz change in F2 over a period of 10ms.
Most studies do not have such a precise methodology as Dolan and Mimori (1986); the
beginning and ending of the trajectory is commonly segmented by hand, e.g., in Gay (1968),
Borzone de Manrique (1976), Jha (1985), Aguilar (1999), and is defined more generally as “the
transition of F2 from the initial vowel to the final vowel,” (Borzone de Manrique 1976:196).
The studies mentioned so far demonstrate the prevailing trend to measure the transition
between diphthong endpoint targets by the change in F2 alone. Few studies have attempted to
include dynamic trends of F1-F2-F3 besides Clermont (1993), whose study on Australian
English diphthongs suggests that F3 contours of back-to-front diphthongs (e.g., [ɔɪ]) are found to
be V-shaped, rather than the previously assumed linear shape (Figure 1.10), and concludes
diphthong trajectories cannot be represented by a linear line.
Figure 1.10 Australian English [ɔɪ] diphthong in F1-F2-F3 space from Clermont (1993: Figure 4)
Clermont (1993) finds that while the F1-F2 plane are likely the most relevant dimensions
for measuring endpoint targets, the F2-F3 plane may be significant in characterizing a
diphthong’s trajectory (of back-to-front diphthongs in particular) in that they exhibit notable

40
nonlinear features. The difficulties in measuring and interpreting the importance of F1 and F3 in
addition to the traditional F2 may have prevented subsequent studies from adopting this practice,
although future work would benefit from exploring F1 and F3 transitional movement further.
Clermont predicts a greater degree of naturalness in synthesized diphthongs used in perception
experiments if they were to include F3 contours.
The importance of the trajectory and F2 slope as relevant perceptual cues to a
diphthong’s identity has been much debated in the literature. The competing hypotheses
concerning duration, slope, and speaking rate are discussed in Section 1.4.1.
1.3.2.3 Summary of Phonetic Parameters
This section has provided an overview of the acoustic elements present in the speech
signal of diphthongs, including onset and offset targets, steady states, and trajectories, and has
reviewed discussions of these elements in the previous literature. In sum, endpoints are found at
the beginning and end of the diphthong (excluding consonant transitions) and are not consistent
with the vocalic quality of monophthongs/semi-vowels used to transcribe them. Steady states are
intervals at the beginning and/or end of a diphthong that have the quality of being steady across
their duration with minimal changes along the frequency domain; they are often omitted in
perception studies due to their variable nature across speaking rates. Trajectories connect the
diphthong endpoints, and their slopes are commonly measured as the rate of change in F2 over
the duration of the transition. The current understanding about phonetic parameters of
diphthongs is that a diphthongs’ endpoints or trajectory are the two most reliable phonetic
features that compose a diphthong; however, there is some disagreement in the previous
literature concerning whether a diphthong should be defined as a composition of two targets or
41
as a unitary movement. The next section moves beyond the acoustic properties of diphthongs to
discuss phonological representation.
1.3.3 Phonological Representation
The complexity of a diphthong’s speech signal has led to differences in how diphthongs
are included as members of vowel inventories cross-linguistically, as well as how researchers
have interpreted diphthongs phonologically. In part, the differences can be attributed to the fact
that all vocalic elements are dynamic. Even monophthongs show substantial formant movement
throughout their duration; this movement, called Vowel Inherent Spectral Change (VISC), has
been shown to affect speech perception (Hillenbrand, 2013; Morrison, 2013; Nearey &
Assmann, 1986). Models that incorporate VISC can more accurately separate vowel categories
than models only including steady-state measurements; in perception studies, listeners show a
greater accuracy rate in identification of naturally spoken signals (95.5%) and synthesized
signals with original formant contours (88.5%) than synthetic vowels with flat-formants at the
steady-state measurement (73.8%) (Hillenbrand, 2013).
What is important for this study is the point in which the movement to a secondary target
creates a phonemic contrast in a language. In this section, the phonological properties of
diphthongs are established by comparing them to monophthongs, vowel hiatus, and vowel-
glide/glide-vowel sequences. Separating diphthongs from other types of vocalic sequences will
allow us to define diphthongs in terms of both phonetic properties and phonological behavior in
Section 1.3.4. It is also important to create this phonological division, as other vocalic sequences
may be phonetically quite similar to diphthongs but behave differently phonologically. The
inclusion of diphthongs as a part of broader phonological representational theory of contour
segments is discussed at the end of Section 1.3.4.
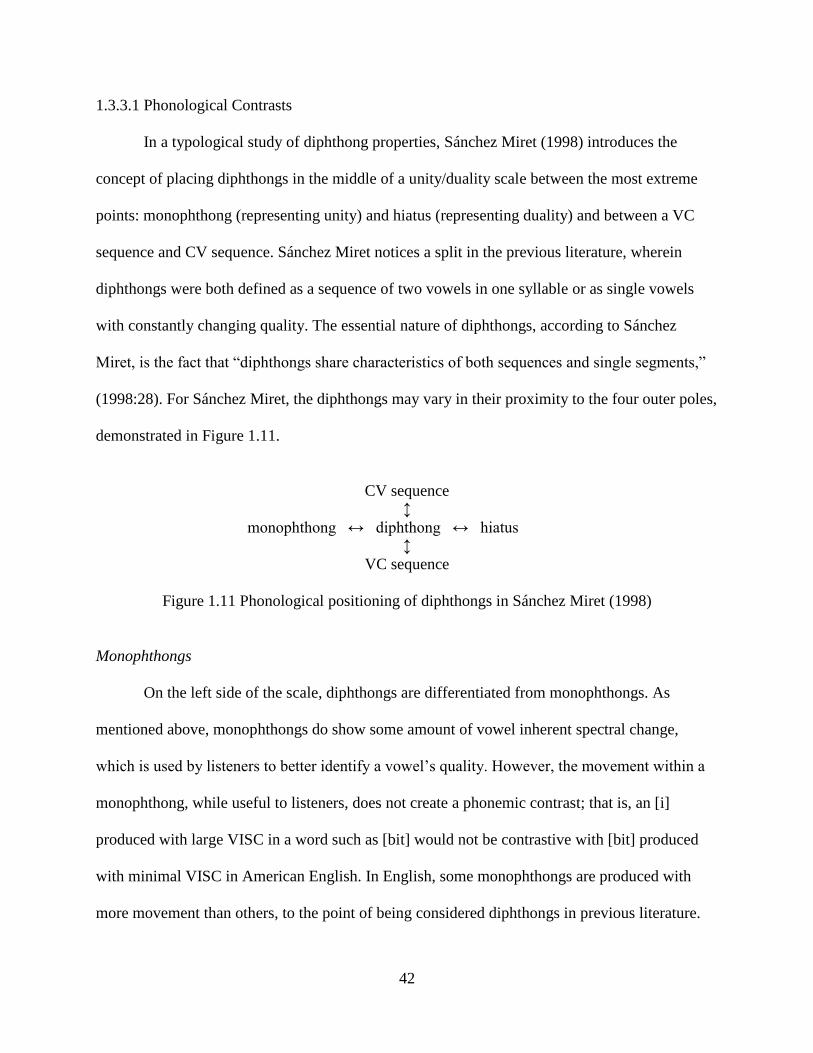
42
1.3.3.1 Phonological Contrasts
In a typological study of diphthong properties, Sánchez Miret (1998) introduces the
concept of placing diphthongs in the middle of a unity/duality scale between the most extreme
points: monophthong (representing unity) and hiatus (representing duality) and between a VC
sequence and CV sequence. Sánchez Miret notices a split in the previous literature, wherein
diphthongs were both defined as a sequence of two vowels in one syllable or as single vowels
with constantly changing quality. The essential nature of diphthongs, according to Sánchez
Miret, is the fact that “diphthongs share characteristics of both sequences and single segments,”
(1998:28). For Sánchez Miret, the diphthongs may vary in their proximity to the four outer poles,
demonstrated in Figure 1.11.
CV sequence
↕
monophthong ↔ diphthong ↔ hiatus______
↕
VC sequence
Figure 1.11 Phonological positioning of diphthongs in Sánchez Miret (1998)
Monophthongs
On the left side of the scale, diphthongs are differentiated from monophthongs. As
mentioned above, monophthongs do show some amount of vowel inherent spectral change,
which is used by listeners to better identify a vowel’s quality. However, the movement within a
monophthong, while useful to listeners, does not create a phonemic contrast; that is, an [i]
produced with large VISC in a word such as [bit] would not be contrastive with [bit] produced
with minimal VISC in American English. In English, some monophthongs are produced with
more movement than others, to the point of being considered diphthongs in previous literature.

43
Indeed, one will often find the set of American English diphthongs transcribed as /aɪ, aʊ, ɔɪ, eɪ,
oʊ/. However, for the purposes of this study, the set [eɪ, oʊ] are considered to be allophonic
variants of [e, o], as they do not create a lexical contrast.
One of the first papers to remark on the possible phonemic differences between American
English [eɪ, oʊ, ij, uw]18 and [aɪ, aʊ, ɔɪ] was Pike (1947). His observations arose out of difficulty
in teaching diphthongs to his approximately seven hundred phonetics students from 1937-1947.
While students could easily transcribe, produce, and perceive the diphthongs [aɪ, aʊ, ɔɪ], students
had significant problems learning to recognize and produce both vowels in [eɪ, oʊ, ij, uw]. This
led Pike to hypothesize that these two sets of diphthongs should be treated differently
phonemically: [eɪ, oʊ, ij, uw] act phonetically as complex single phonemes (monophonemic) and
[aɪ, aʊ, ɔɪ] function as sequences of two phonemes (biphonemic). This study was mainly based
on observation—without instrumental measurements—supported by evidence from intonation,
stress, and lexical distribution. The evidence from intonation and stress can both be attributed to
reduction patterning: the monophonemic set reduced completely in rapid rate speech and in
unstressed contexts, and the biphonemic set retained features of both vowels. For example, bait
in the sentence The bait is 'spoiled loses its 'diphthongal character' when primary stress falls on
‘spoiled’ whereas buys in He buys meat for the 'dog here retains 'strong diphthongization' when
‘dog’ has primary stress (155). Essentially, the “biphonemic” set retains its structural integrity
even in reduced contexts. Pike's observations were innovative in a time before spectrograms
were widely used, although it is unclear how he might have expanded this theory on the
phonemic status of diphthongs to languages other than English.
18 I have updated these to the modern transcriptions for consistency and comparability with the modern literature.
Pike's original transcriptions are [eɪ, oU, ɪi, Uu].
44
To summarize, monophthongs have one vowel target and are monophonemic, whereas
diphthongs contain two targets and are also monophonemic. In English, tense English
monophthongs are diphthongized, but this movement does not create a phonemic contrast.
Hiatus
On the right side of the scale, diphthongs are differentiated from hiatus, or vowel-vowel
sequences. The main difference between a diphthong and hiatus is that hiatus is a sequence of
two phonemes in separate syllables, while a diphthong consists of two targets in a single
monophonemic syllable.
Much of the work on the differences between diphthongs and hiatus has been done on
Spanish. Borzone de Manrique (1976), Aguilar (1999), and Hualde and Prieto (2002) are just a
few studies out of the extensive body of literature that examines the acoustic distinction between
diphthongs and hiatus in Spanish. Although stress cues and contextual factors contribute to the
classification of a vocalic sequence as a hiatus or a diphthong, the syllabification of many words
in Spanish can still be unpredictable and varies by dialect. In this sense, the main difference
between diphthongs and hiatus is based on syllabicity; however, syllabicity alone is not
phonetically defined—it is a lexical property.
These studies found that speakers are not consistent when it comes to syllabification
tasks, and many speakers were not in complete agreement about where stress falls. As a result of
this inconsistency, Borzone de Manrique (1976), Aguilar (1999), and Hualde and Prieto (2002)
sought an explanation grounded in acoustics for the diphthong/hiatus contrast. These studies
found two main acoustic differences: duration and F2 trajectory. In Spanish, hiatuses have a
45
longer overall duration than diphthongs by an average of 36% (F = 457, p < .001)19 (Aguilar,
1999). Aguilar compares the degree of curvature of F1 and F2 trajectory formant tracts between
the onset and the offset by converting the trajectory into a polynomial equation ax2 + bx + c. She
found that in comparing the coefficient resulting from this equation, hiatuses have a greater
degree of curvature than diphthongs (in terms of its parabolic formant shape). These differences
are similar to the acoustic differences Collier et al. (1982) found between Dutch vowel + glide
sequences and diphthongs, supporting the hypothesis that both hiatus and vowel + glide
sequences should be considered biphonemic. In Spanish, there also appears to be a difference in
reduction patterns between the hiatus and diphthong; Aguilar (1999) showed that across
communicative situations, as reduction increased, vowels in hiatus reduced to diphthongs, while
diphthongs monophthongized; this difference results in the phonological difference between
diphthongs and hiatus: hiatus is biphonemic and diphthongs are monophonemic.
There has been some debate in the literature on the monophonemic status of diphthongs.
Although the monophonemic status of diphthongs is now widely accepted, Berg (1986) used
evidence from speech error patterns to challenge this view. According to Berg, if diphthongs are
single, cohesive units, the two elements comprising them should not be able to be transposed in
slips of the tongue. Berg’s analysis on German speech errors, word games, and talking
backwards provides counter-examples to this assumption. There are several problems with
Berg’s challenge to the monophonemic status of diphthongs. The first is the very limited number
of examples (n = 14); it is not clear whether these counter-examples are statistically significant
evidence or simply a statistical anomaly. Second, Berg argues that the diphthongal elements of
the nucleus should be separate at the phonemic level and joined at a suprasegmental tier level;
19 Using a map task, Aguilar elicited a set of pre-determined words (toponyms) containing hiatus and diphthong
based on stress and lexical properties.

46
however, there is no way in this analysis to distinguish between vowel + semivowel sequences
and diphthongs—a difference which is discussed in the next section.
CV/VC Sequences
On the vertical axis of Figure 1.11, diphthongs are placed between CV and VC
sequences. This placement creates a distinction between diphthongs and glide + vowel / vowel +
glide combinations. The difference between diphthongs and glide + vowel sequences is
comparably smaller and more contentious than the difference between diphthongs and
monophthongs or hiatus; some researchers hold that diphthongs themselves are composed of
sequences of a vowel and a glide (Trager & Smith, 1951). Phonetically, glide + vowel sequences
are auditorily very similar to diphthongs. However, phonologically, the glide (or semivowel) is
not a member of the nucleus of the syllable—that is, it is not syllabic (Ladefoged, 2006;
Ladefoged & Maddieson, 1996). A diphthong by contrast contains both vowel targets in the
nucleus of the syllable. The following studies also provide evidence of phonetic differences
between diphthongs and vowel + glide sequences.
Support for the diphthong and vowel + glide sequence differentiation comes mostly from
studies on languages outside of English. In Collier et al. (1982)'s investigation of "pseudo" and
"genuine" Dutch diphthongs, the differences between the onset and offset target vowels were
quantified through acoustic and electromyographic (EMG) signals. The purpose of this study
was to determine if differences in the physiological domain would support grouping contrastive
Dutch diphthongs by two classifications: "pseudo," which consist of a vowel and semivowel
sequence /a, o, u/ + /j/ and /e, i/ + /w/; "genuine," which are relatively low vowel and high vowel
sequences /ɛ, ɔ, œ/ + /i, u, y/, respectively. Collier et al. found that genuine diphthongs have a
gradual increase in muscular activity with a smooth movement of the tongue upward and either

47
forward or backward, while pseudo diphthongs had a sharp increase in muscular activity and
abrupt movement between the vowel and the glide. Collier et al. (1982) conclude that the
differences between the two sets of data support a phonological separation; the contrasting
muscle activity suggests that the vowel + glide sequences should be analyzed biphonemically
while true diphthongs (a vowel + vowel sequence) should be treated as monophonemic.
In some languages, the difference between vowel + glide sequences and diphthongs may
involve a durational contrast. In San Lucas Quiaviní Zapotec, a Western Valley Zapotec variety,
these different sequences can be separated according to the length of each segment (Uchihara &
Pérez Báez, in progress). True diphthongs contain vowel sequences where the first element is
longer than the second element, leading to an overall long duration. Vowel + glide and glide +
vowel sequences behave differently, where the 'glide' element of the sequence is much shorter in
either position. The separation in the vowel inventory between these types of sequences is
supported by additional distribution data.
Diphthongs and glide + vowel sequences in Romanian are very similar phonetically, but
differ in phonological patterning. Chitoran (2002) compared the Romanian diphthongs [ea, oa]
with the glide + vowel sequences [ja, wa] using a production and perception experiment. In the
production experiment, all speakers maintained a statistically significant difference for all
parameters tested, including duration, onset target value, and F2 transition rate between [ea] and
[ja], but not for [oa] and [wa]. Results for the perception experiment were consistent with the
production results: [ea] and [ja] were significantly correctly identified, but [oa] and [wa] were
not. Chitoran (2002) concludes that [ja] and [ea] have phonologically different representations
supported by production and perception data; the phonological difference between [wa] and [oa]
is not encoded in the phonetics, but may have undergone phonetic neutralization due to the

48
difficultly of maintaining contrast between back rounded phonemes [w] and [o] before [a]. The
case of Romanian vocalic sequences shows how the phonetics and phonology of diphthongs and
glide + vowel sequences are closely tied.
Researchers will occasionally group hiatus or glide + vowel sequences with diphthongs
in order to include or compare data from languages with these vocalic sequences in their
research. One such study is Dolan and Mimori (1986), who use vowel + vowel sequences
(hiatus) in Japanese as diphthongs and compares them with English phonemic and allophonic
diphthongs. This may be problematic, as there are differences in articulation and structure of
these vocalic sequences in comparison with diphthongs, as described in this section.
1.3.3.2 Moraic Structure
Phonological processes often depend on syllable structure; moraic structure provides an
additional level of representation. The moraic structure of diphthongs cross-linguistically is not
well agreed upon; it appears that despite having the duration of a long vowel, diphthongs can be
treated as monomoraic or bimoraic, depending on the language's phonology. Hayes (1989)
emphasizes that languages differ in the use of moraic structure in their phonology; commonly,
languages that have contrastive vowel length assign (a) one mora to short vowels and (b) two
moras to long vowels and diphthongs, with the following underlying structure:
(a) σ (b) σ
| | \
μ μ μ
| \/
V VV
short vowel long vowel/diphthong
49
Some languages that have contrastive vowel length, however, also contain contrastive
short and long diphthongs that pattern as phonologically similar to short and long monophthongs.
For example, Tohono O'odham (Miyashita, 2011) shows a phonological differentiation between
light (monomoraic) and heavy (bimoraic) diphthongs, supported by their behavior with respect to
stress assignment and reduplication. In Tohono O'odham, both short vowels and light diphthongs
can occur in either stressed or unstressed syllables, whereas long vowels and heavy diphthongs
only can occur in stressed syllables; this distinction is supported by reduplication processes
sensitive to weight. A similar moraic distribution occurs in Faroese (Casserly, 2012), where
monomoraic diphthongs pattern with short vowels and long bimoraic diphthongs pattern with
long vowels in their syllable structure. Syllables with monomoraic diphthongs are followed by
geminate consonants word-internally or word-finally, while syllables with bimoraic consonants
are followed by singleton consonants. In English, diphthongs pattern with tense vowels: words
with tense/heavy vowels and diphthongs can appear in open monosyllabic content words (e.g.,
[bi] 'bee' and [baɪ] 'bye') but lax/light vowels cannot (e.g., *[bɪ], *[bɛ]). As the analysis of the
moraic structure of diphthongs is highly language specific, a thorough discussion is not included
here (for further literature, see Broselow, Chen, & Huffman, 1997; Gordon, 2002; Yongsung
Lee, 1997).
1.3.4 Diphthong Definition
The previous sections have described in detail the phonetic parameters and phonological
properties of diphthongs. Disagreements in previous literature about the relevant phonetic and
phonological features of diphthongs have led to many different definitions of ‘diphthong’ and
varying assumptions about their properties and behaviors.

50
In order to establish a working definition of diphthong for the present study, it is
important to note the differences between the definitions and interpretations of diphthongs
provided in the previous literature. The two main views are that diphthongs are (a)
compositional: consisting of two targets (e.g., Lehiste & Petersen, 1961) or (b) unitary: defined
by the trajectory (e.g., Gay, 1968). Both views emphasize one phonetic aspect of the diphthong
over the other: (a) stresses the importance of a diphthong’s endpoints, whereas (b) highlights the
transitional trajectory. A definition should also distinguish diphthongs from other vocalic
sequences in terms of their phonological properties.
Previous literature that made different assumptions about what counts as a ‘diphthong’
phonologically has led to difficulties comparing diphthongs cross-linguistically. Related
opposing views have been developed for the analyses of contour tones; the discussion of the
parallels between diphthongs and contour tones provided at the end this section highlights the
difficulties of defining phonetic/phonological entities that involve complex movement in pitch
(in contour tones) or formants (in diphthongs).
The simplest definition of a diphthong is probably found in Ladefoged (2006), as "a
vowel in which there is a change in quality during a single syllable." Note that he does not
include specifics on the nature of the quality change. Others include a greater amount of detail in
their definitions, often referring to the phonetic parts of the diphthong. Lehiste & Peterson (1961:
276) specify that diphthongs are characterized by two steady state durations at the beginning and
end of the diphthong and a transitional glide connecting the two targets that has a duration longer
that either steady state; neither steady state elements are necessarily identifiable phonetically
with any stressed monophthong. Their description notably excludes the English [eɪ, oʊ] from
51
being defined as diphthongs, stating that these have only one steady state target instead of two,
and term the second portion glides.
Gay (1968) found that speech rate affects the presence of the steady state portions of
diphthongs, and therefore he more liberally describes diphthongs as unit phonemes in which
there is movement from one position in the vowel space toward, but not necessarily reaching,
another position. While similar to Ladefoged's definition, Gay (1968) crucially states that the
second target is not necessarily reached, and is more of an ideal goal to be reached for. Others
(Dolan & Mimori, 1986; Pols, 1977) stress that the overall spectral change, or more specifically
the change in F2, is crucial to the characterization of diphthongs.
For the purposes of this study, both phonetic and phonological considerations are
considered as part of a diphthong’s definition. Phonetically, a diphthong consists of two target
elements with a connective transition. Phonologically, diphthongs are tautosyllabic and
monophonemic; additionally, the presence of two targets must be phonologically contrastive.
It is important to exclude allophonic diphthongs, such as [eɪ, oʊ] in English, from the
present definition, as their phonological status may impact their phonetic behaviors and
properties. Cross-linguistic variation, variation across speech rate, and lack of evidence
concerning steady states led to their omission in this definition. The presence of the two targets is
crucial, while steady durations of these targets (steady states) appear to be non-crucial.
This definition places diphthongs in a phonologically contrastive relationship with
monophthongs, hiatus, and vowel + glide / glide + vowel sequences. The assumption that
diphthongs are essentially two targets is well supported in previous literature by perceptual
studies; it also makes specific predictions about how diphthongs vary with changes in duration
(speech rate). See Section 1.4 for further discussion of perception literature and duration effects.

52
In sum, a diphthong is defined by the following phonetic and phonological components:
(a) two target elements with a connective transition
(b) tautosyllabic
(c) monophonemic
(d) two targets = phonologically contrastive
(e) steady states optional
This definition differs from that of researchers (e.g., Catford, 1977; Gay, 1968; Jha,
1985) who emphasize the trajectory movement itself as being the crucial element of a diphthong.
One possible facet of this view would be that speakers store the contour shape itself as a mental
representation. It should be noted that both views are logically possible; neither is inherently
superior. However, one can look at what varies—and what is consistent—in terms of production
and perception to support one view or the other. As we will see in Section 1.4.1, arguments for a
dynamic definition –wherein the movement defines the diphthong and is one target—are not well
supported by production or perception evidence. Further evidence is provided from the results of
the production experiment in Chapter 2. The following section discusses similarities between
contour tone and diphthong representation, and how they are a part of the broader subsegmental
phonological category of ‘contour segments.’
1.3.4.1 Contour Tone
A parallel argument concerning contour representation vs. compositional representation
exists for contour tones. Zhang (2001a; 2001b) has previously pointed out similarities between
analyses of diphthongs and analyses of contour tone representation. In addition to both
containing similar complex movement from one target to another, Zhang (2001a) argues that,
like contour tones, diphthongs prefer positions with longer inherent duration such as stressed
53
syllables and word- or phrase-final syllables. Relevant to this study, however, is the comparison
between contour tone representation and diphthong representation.
Tones resemble vowels in that they have pitch movements in different directions, with
varying slope and shape. Contour tones resemble diphthongs in that they both inherently have
endpoints and a transitional slope. Previous literature has argued for many different views on the
composition of contour tones: as separate pitch levels and pitch contours, concatenated pitch
HL/LH, single unit contours, and as sequences of H+L targets.
To simplify, these views can be split into two groups, those who support a representation
of concatenated or sequential high and low targets, and those who support a single unit contour
tone analysis. Supporters of the first view (Duanmu, 1994; Leben, 1973; Liberman &
Pierrehumbert, 1984; Pierrehumbert, 1980; Woo, 1969) argue that contour tones are
combinations of level tones where primitive high (H) and low (L) are linked to the TBU by two
consecutive tonal nodes, creating falling and rising tones. There exists some disagreement on
how and where H and L are attached, for details see Duanmu (1994), Xu (1998). Support for the
HL/LH target view is that it allows for spreading or deletion of one or other of their composite
parts to adjacent morphemes or words.
The second view is that contour tones function as units. Supporters for this view
(Abramson, 1978, 1979; Pike, 1984; W. S.-Y. Wang, 1967; Xu, 1998) argue that contour tones
can act as unitary contours and can spread or duplicate whole. In some languages, there appears
to be a great phonetic difference between level H and level L and the H and L that appear in
contour segments. For these reasons, Abramson (1979) on Thai tones, finds that it would be
“psychologically far more reasonable to suppose that the speaker of Thai stores a suitable tonal
shape as part of his internal representation of each monosyllabic lexical item” than to try and
54
convert HL into the tonal shapes that exist (but see Morén & Zsiga, 2006). Xu (1998) finds that
speakers move entire contour tones further into the later part of a syllable and argues that only
unitary contours would behave this way. Duanmu (1994) argues against this view of contour
tone units, stating that allowing for contour segments over-predicts possible segments than are
found in natural languages. He provides extensive examples and arguments against the ability of
contour tones to act as a unit in spreading and in initial association.
This brief review demonstrates the similarity between diphthongs and contour tones in
the ongoing debate concerning contour elements: whether they are compositionally combinations
of their endpoints or single dynamic units. Compositional representational theories such as
Aperture Theory (Steriade, 1993, 1994) and Q-Theory (Inkelas & Shih, 2016) have sought to
unify representation of contour segments such as diphthongs and contour tones, but also broaden
the analysis to include pre- and post-nasalized segments (e.g., nd, dn), affricates (e.g., ʧ, ʤ), pre-
and post-laryngealized segments (e.g., hk, kh), and consonants with on- and off-glides (e.g., pj,
kw). These compositional theories account for behavior of contour segments by introducing
greater complexity into segmental representations on the level of the subsegment. This addresses
the problem of complex phonological segments that act as both one unit in some processes and
as sequences in others.
In Q-Theory, the traditional segment ‘Q’ is composed of three segments: Q(q1, q2, q3). Q
varies over ‘V’ (for vowel) and ‘C’ (for consonant) and subsegments ‘q’ vary over ‘v’ and ‘c’.
These subsegmental divisions are discrete and not associated with specific phonetic durations,
though they are inherently and temporally sequenced. The subsegments interact and can be
referenced directly by the grammar. Inkelas and Shih states that Q-Theory is capable of
representing triphthongs and diphthongs, for which the subsegments would be derived as V(v1,

55
v2, v3) for triphthongs and V(v1, v1, v2) or V(v1, v2, v2) for diphthongs. It is possible that the
differences between these two proposed structures for diphthongs can be used to model
differences in timing of diphthong transitions across languages, an approach taken by Inkelas to
model differently timed contour tone transitions in Dinka (Remijsen, 2013). However, the
authors insist that Q is not a unit of time itself, but that phonological units of duration can be
associated with Q or its subsegments (Inkelas, 2013; Inkelas & Shih, 2016). Inkelas and Shih
claim that Q-Theory has the power to model subsegmental behavior and capture the
phonological patterning of diphthongs, though it is left to future work to test this prediction. Note
that the Q-Theory analysis of diphthongs is only consistent with the theory that diphthongs are
composed of vowel targets at the endpoints, and not as single sloping units (being defined by the
trajectory slope). Also left to future work is how to connect subsegmental quantity (through
possible subsegment deletion or accretion) to phonetic duration and/or phonological length
contrasts. Although no claims regarding phonological representation are made here, possible
implications for representational analysis of contour segments is discussed in Chapter 4.
1.3.5 Summary
The dynamic interface of phonetics and phonology is well demonstrated in diphthongs,
which have a multifaceted phonetic structure and a unique phonological position seated between
monophthongs, vowel + glide sequences, and hiatus. Their bi-target duality and phonological
status have long been a source of debate in previous literature. After reviewing their phonetic and
phonological properties, diphthongs are defined here as phonemically contrastive,
monophonemic vowels that consist of two targets connected by a transition. This definition is
purely descriptive, and makes no featural or representational claims with regard to moras, root
nodes, etc.
56
Now that a definition is established, additional phonetic aspects and behaviors of
diphthongs beyond those presented so far can be discussed. One such aspect is the dimension of
time, or duration, and how it plays a role in what defines a diphthong. The following section
reviews the two hypotheses concerning the durational cues as well as their support in previous
literature.
1.4 Durational Cues
In order to incorporate diphthongs into Dispersion Theory, it is necessary to know the
fundamental components of a diphthong. The literature discussed so far has focused on phonetic
properties of diphthongs such as the onset and offset frequencies, steady states, and transitional
glides. One additional aspect that has been touched on in the literature is durational cues.
‘Duration’ for diphthongs as discussed in the previous literature may vary to mean the
entire diphthong vowel, including steady states, or the duration of the transition alone. The latter
is more commonly used, as steady state durations are variable and inconsistent (Aguilar, 1999;
Gay, 1968). Following previous literature, ‘duration’ for diphthongs here will refer to transition
duration unless explicitly stated otherwise.
One way of testing the phonetic constituents of a diphthong is to see what elements
remain constant and what are variable with changes in speech rate. Elements that remain
constant with changes in speech rate are likely to be essential to the identity of a diphthong, as
listeners can use them as perceptual cues to a diphthong’s identity.
Two leading hypotheses—referred to here as the Slope-Constant Hypothesis and
Frequency-Constant Hypothesis—have emerged concerning the interaction of transition duration
and endpoint frequency. Each theory argues for different parts of the diphthong remaining
constant with changes in duration, and therefore make different predictions about the

57
compositional or unitary nature of diphthongs. This, in turn, will affect the constraints to be used
when incorporating diphthongs in Dispersion Theory. This section discusses the two leading
hypotheses for duration patterns in diphthong trajectories. Chapter 2 tests these hypotheses using
three languages in a speech rate-controlled production experiment.
1.4.1 Competing Hypotheses: Slope or Frequencies?
The Slope-Constant Hypothesis, wherein the slope is constant across speech rates,
primarily came about as a result of findings in Gay (1968, 1970). Gay’s production and
perception evidence from English supports an analysis of diphthongs where the onset target
frequency and transitional slope are constant across speech rate and the offset target is not
necessarily reached. Figure 1.12a depicts onset frequency and F2 slope remaining constant as
duration increases, with the offset target varying. Gay’s findings are supported by Jha’s (1985)
study of Maithili diphthongs. This hypothesis is critiqued by researchers (Bladon, 1985;
Morrison, 2013) who find fault with the methodology and interpretation of Gay’s (1967, 1968)
experiments; these critiques are provided in Section 1.4.1.1.
The Frequency-Constant Hypothesis, wherein the endpoint frequencies are constant,
evolved as a result of findings (Dolan & Mimori, 1986) that are inconsistent with Gay (1968).
This hypothesis states that contrary to Gay (1968), onset and offset frequencies are constant and
slope varies as duration increases. Figure 1.12b depicts a transition that changes with increases in
duration. Evidence contrary to this hypothesis (Lindau et al., 1990), discussed below, suggests
the situation may be more complicated and variable cross-linguistically than previously thought.

58
a. Slope-Constant Hypothesis
Frequency
Duration
b. Frequency-Constant Hypothesis
Frequency
Duration
Figure 1.12 Visual comparison of holding either (a) the slope of F2 constant or (b) the endpoint
frequencies constant
The following two sections provide details of these two hypotheses and discuss the
support and/or opposition for them in previous literature. The third section discusses temporal
patterns of the transitional glide cross-linguistically. Finally, the role of the durational cue in
monophthongs is presented as additional support for the hypothesis that duration is an important
cue to the identification of diphthongs.
1.4.1.1 Slope-Constant Hypothesis
Gay (1970) is a shortened publication based on his (1967) dissertation. This perceptual
study of American English diphthongs pits duration cues against target frequency cues to
determine the primary identification cue for diphthongs in a series of two experiments. The first
experiment used synthetic speech to discover the relevant formant frequency transitions that
separate the phonemes /aʊ, aɪ, ɔɪ/. To test this, Gay synthesized two sets of vowels in the
following continua: /ɔɪ~aɪ/ and /aʊ~oʊ/. Onset and offset formants were varied to identify
preferred acoustic targets. Ten test subjects were played randomized lists of words from these
continua and asked to both identify the sound from the set /aʊ, aɪ, ɔɪ, o, a/ and rate its quality
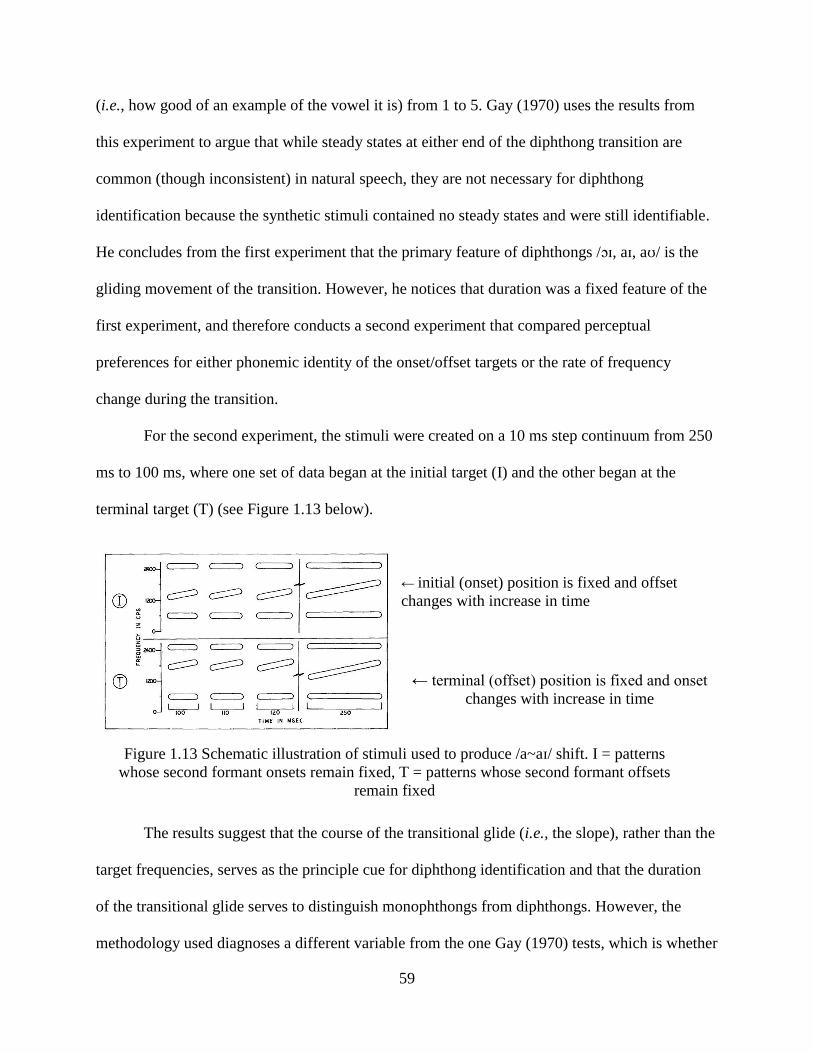
59
(i.e., how good of an example of the vowel it is) from 1 to 5. Gay (1970) uses the results from
this experiment to argue that while steady states at either end of the diphthong transition are
common (though inconsistent) in natural speech, they are not necessary for diphthong
identification because the synthetic stimuli contained no steady states and were still identifiable.
He concludes from the first experiment that the primary feature of diphthongs /ɔɪ, aɪ, aʊ/ is the
gliding movement of the transition. However, he notices that duration was a fixed feature of the
first experiment, and therefore conducts a second experiment that compared perceptual
preferences for either phonemic identity of the onset/offset targets or the rate of frequency
change during the transition.
For the second experiment, the stimuli were created on a 10 ms step continuum from 250
ms to 100 ms, where one set of data began at the initial target (I) and the other began at the
terminal target (T) (see Figure 1.13 below).
← initial (onset) position is fixed and offset
changes with increase in time
← terminal (offset) position is fixed and onset
changes with increase in time
The results suggest that the course of the transitional glide (i.e., the slope), rather than the
target frequencies, serves as the principle cue for diphthong identification and that the duration
of the transitional glide serves to distinguish monophthongs from diphthongs. However, the
methodology used diagnoses a different variable from the one Gay (1970) tests, which is whether
Figure 1.13 Schematic illustration of stimuli used to produce /a~aɪ/ shift. I = patterns
whose second formant onsets remain fixed, T = patterns whose second formant offsets
remain fixed

60
the onset and offset targets or the duration of the vowel is the primary perceptual cue. The
problem is that the slope of the second formant doesn't change with changes in time along the
continua, which would predict that the longer the diphthong is, the more it would increase the
formant quantity difference between the onset and the offset. The model above (Figure 1.12)
shows difference in having a set F2 slope with changes in duration versus set boundary
frequencies and changes in slope with duration.
Gay (1970) uses the model of type (a). The assumption behind a model that holds the
slope constant is that across speaking rates, offset targets are variable and the rate of change is a
fixed feature in diphthongs. These are exactly the findings of Gay (1968)'s study on the effect of
speech rate on diphthong movements; however, Gay (1968) data were drawn from production
measurements rather than perception.
Jacewicz, Fujimura, & Fox (2003) conducted a perception study using synthetic stimuli
similar to Gay (1970), but with the exclusion of duration variation. Two stimulus sets were
presented to 4 listeners; the first set held the onset F2 frequency constant and varied the offset F2
frequency stepwise to determine the point at which listeners' perception changed from [a] to [ai];
the second set held the offset F2 frequency constant and varied the onset F2 frequency stepwise
to determine the point at which listeners' perception changed from [ai] to [ei]. They conclude that
listeners can identify a diphthong relatively early (from [a] to [ai]) when only taking frequency
change into account, and that the frequency information in the offset is not essential to the
identity of the diphthong. This echoes Gay (1968)'s results which find that the offset frequency is
less important perceptually to the diphthong. Alternatively, their results may suggest that at there
is a point in the continuum between [a] and [ai] where the movement creates the phonemic
contrast and speakers categorize the sound as a diphthong. Consequently, the opposite

61
conclusion could be made, that the offset is essential to the identity of the diphthong in that
speakers are using the offset cue to identify and categorize the sound as a diphthong.
Additionally, their results may be due to the fact that in diphthongs, there are fewer
contrasts between offset targets than onset targets (Bladon, 1985; Maddieson, 1984): cross-
linguistically offsets tend to be high-front or high-back vowels. Bladon (1985) provides a table,
reproduced below, demonstrating the lack of competition for the offset vowel with data from
Maddieson (1981)20.
Table 1.4 Number of diphthongs attested from 78 languages (Bladon 1985)
firs
t el
emen
t
second element
i, ɪ e ɛ a ə ɑ ɔ o u, ʊ total
i, ɪ 6 2 8 8 1 1 3 5 34
e 18 1 2 3 24
ɛ 5 1 1 7
a 23 4 1 7 27 62
ə 5 3 8
ɑ 4 1 1 1 4 11
ɔ 2 1 5 8
o 17 1 1 1 15 35
u, ʊ 14 2 1 5 7 1 1 2 31
total 88 14 3 15 22 2 2 11 63 220
Bladon (1985) would likely argue that Jacewicz et al. (2003)'s experiment was flawed
due to the limited set available to listeners for identification (only [a], [ai], or [ei]). Having a
smaller set of vowels to choose from raises the probability of a correct identification and also
doesn’t allow for misidentifications for vowels not in the provided set (e.g., if a listener heard
[oi] but that wasn’t an option to select). Jacewicz et al. were also limited, as they only
investigated the diphthong [ai] and they did not vary duration in their perception stimuli.
20 This table differs from the table given in Sánchez Miret (1998) and reviewed in Section 1.2.3.1 due to the criteria
used by Bladon and Sánchez Miret of what qualifies as a diphthong.
62
Jha (1985) provides support for the Slope-Constant Hypothesis with production data from
Maithili. Jha finds that the two diphthongs in Maithili have constant onsets and F2 slopes across
speech rates. Unfortunately, no statistical analysis was done to confirm that his results were
statistically significant and the sample size of the experiment was not provided, although it
appears to be a single speaker case study. In sum, the studies that claim to endorse the Slope-
Constant Hypothesis have problematic methodology and provide weak evidence to support their
claims.
1.4.1.2 Frequency-Constant Hypothesis
Subsequent literature has cast doubt on the validity of Gay's (1967, 1968, 1970)
conclusions that transition duration is the most important perceptual cue to the difference
between diphthongs and monophthongs. Morrison (2013) states that the synthetic stimuli used in
Gay (1970) confounded offset and slope or duration and slope, leading to unclear results. Bladon
(1985) also objects to Gay (1970)'s results, stating that is "possible to conclude from Gay's data
that they are wholly compatible with the alternative view to the one he espouses: the data could
support the view that what is of prime interest to the perceptual system are the diphthong
endpoint spectra" (147). Bladon claims that Gay overlooks differences in the F1 onset
frequencies across diphthongs, rendering the conclusions that Gay draws concerning formant
change misleading.
In an attempt to replicate the results of Gay (1968), Dolan and Mimori (1986) examine
both English diphthongs and Japanese vowel sequences. Dolan and Mimori find that speech rate
in fact has a highly significant effect on transition slope for English (p < .0001). They also find a
correlation between rate of transition and the distance traversed on the frequency scale: the
further the F2 has to travel, the faster the rate of transition. These results support model Figure

63
1.12b rather than Figure 1.12a, as was suggested by Gay (1968)'s results. Consistent with Figure
1.12b, Dolan and Mimori (1986) find that while the offset showed some variability of the offset
frequency, ANOVA results show that this variation is not directly linked to speech rate. One
possible explanation of this difference is that the larger variability seen for offsets is due to the
fact that offset targets have a larger available acoustic space than diphthong onsets because they
enter into less competition for contrasts (see Table 1.4). Because they used high-quality
recordings, a larger sample size, computational methods, and a better experimental design, Dolan
and Mimori's (1986) arguments for the importance of endpoint targets have stronger statistical
validity and are more convincing than Gay's arguments for transition duration.
Another argument against the Slope-Constant Hypothesis comes from a perceptual study
by Bladon (1985). Gay (1967) assumes that the offset target variability that comes with changes
in duration does not matter for diphthong perception; the duration itself cues listeners in to the
identity of the diphthong. Bladon (1985) tests this hypothesis by seeing how listeners transcribe a
diphthong such as [ia] that has been shortened so the endpoint terminates as [iɛ] (with a steady
rate of change). If Gay (1967)'s slope hypothesis is correct, we would expect listeners to identify
said diphthong as [ia] rather than [iɛ] because they would be using the slope as the main cue
rather than the offset value. The results (summarized in Figure 1.14) show that responses
corresponded directly with the target that was attained in each stimulus; no listeners chose [ia]
for [iɛ]. Diphthongs with a shorter distance between the endpoint frequencies also took less time
to be perceived as "reached" (that is, [ie] to be perceived as [ie]) than diphthongs with a larger
distance to cover.21
21 [ie] at 75 ms; [iɛ] at 100 ms; [ia] at 150 ms.

64
Figure 1.14 Preferred identification (shown as a label) assigned to the curtailed stimuli in
Bladon (1985). Each data point represents a stimulus, plotted as its F1 frequency (Bark) versus
its time to cutoff. (Bladon 1985)
However, it is hard to compare the results of these two studies due to the nature of the
tasks of both experiments: Gay’s subjects only had American English diphthongs to choose from
for their judgment, whereas Bladon’s subjects were tested to see if they could capture minute
phonetic differences along a non-English diphthong continuum. As Bladon (1985) mentions, the
subjects in Gay (1967) may have been making use of the large acoustic differences between
English diphthongs that may be evident even when the tokens are curtailed. The differences
between these studies make it difficult to compare results, and it is evident that more research is
needed to test the interaction of duration, endpoints, and slope in (especially non-English)
diphthongs.
To summarize, support has emerged for two hypotheses on the behavior of slope in
diphthongs across changes in duration. Beginning with Gay (1968), the Slope-Constant
Hypothesis developed wherein a diphthong onset target and slope remain constant with changes
in speech rate and the offset target varied. This hypothesis is not well supported in the literature

65
due to inconsistencies in methodology and lack of statistically significant evidence. The
Frequency-Constant Hypothesis is supported by more recent literature, especially a detailed
study by Dolan and Mimori (1986). This hypothesis states that frequencies of a diphthong’s
endpoints are consistent across speech rate and the transitional trajectory adjusts in slope to
maintain consistent endpoint targets. Studies on both sides of the argument find that there may be
variability in the offset, but this may be due to the large acoustic space available to speakers, thus
reducing the need to produce this target with accuracy. These hypotheses, however, only seek to
explain how diphthongs vary across changes in speech rate. Currently missing is literature
exploring to what extent duration itself aids in the perceptibility of different diphthongs in
different languages. The few studies on glide duration patterns discussed in Section 1.4.2 show
mixed results.
1.4.2 Transition Duration Patterns
This section provides a brief review of studies that have tested or measured the duration
of the transitional glide in diphthongs in English and in other languages. Bond (1978) conducted
a study on the effects of varying transition durations on diphthong identification, but the
methodology used in his experiments is also problematic. Following Gay (1970), Bond used
synthesized English diphthongs [aɪ, aʊ, ɔɪ] with transitions that varied in duration from 0ms-
140ms and in fundamental frequency (100 Hz, 125 Hz, 167 Hz, 250 Hz).22 Also included in the
test items were diphthongs with a varied gap duration (a period of silence) between the onset and
offset steady state targets, and diphthongs with no transition duration (0ms). Examples of the
22 Early speech synthesis technology used in Bond (1978) was done by a Rockland Digital Speech Synthesizer,
which used pitch period units. For this reason, duration could not be specified independently of fundamental
frequency. Each diphthong was synthesized at four F0 values to separate these two variables.

66
stimuli used in Bond (1978) are given in Figure 1.15. The left-most spectrogram in this figure
shows the diphthong /aʊ/ with a 140 ms long transition. The center spectrogram is of the same
diphthong with 0ms transition; the onset steady state was approximately 72 ms and the offset
steady state was approximately 40 ms. The right-most spectrogram shows the diphthong with a
silent gap duration between the steady states.
Figure 1.15 Stimuli from Bond (1978) (glide = transition)
Results varied across fundamental frequencies, suggesting F0 plays a role in transition
perception; however, this may also be due to varying quality in the synthesized vowels at
different fundamental frequencies with this relatively new technology in 1978. Interestingly,
subjects identified vowel sequences as diphthongs even when the transition duration was very
short or nonexistent. Subjects also identified [aɪ] and [ɔɪ] as VV sequences (hiatus) instead of as
diphthongs at both ends of the duration continuum: with a gap and with a long transition, at F0
above 100 Hz. Bond (1978) concludes that the willingness of the subjects to classify vowel
sequences with very short transition durations as diphthongs may be due to their perception of
these diphthongs being spoken at a fast speech rate; at fast rates, diphthongs have a short
transitional period (Gay 1968). Bladon (1985) criticizes this study for not varying the steady
state durations and for incorrectly presenting the identification task to the subjects; the

67
identification task was not difficult enough to evoke different responses from the subjects. As a
result, the only cases which were not identified as diphthongs were stimuli with transitions and
final steady states of 10 ms or less.
Bladon followed his perception experiment on curtailed diphthongs with a perception
experiment wherein the transitions of diphthongs were deleted, in order to show that removing
the transition (only the steady states present, see center of Figure 1.15) would not affect the
identification of the diphthong. This in turn would provide evidence that a diphthong’s endpoints
are the most auditorily relevant cues to diphthong identity. Listeners were able to identify the
transitionless diphthongs as their corresponding (British) English words (hay [heɪ], hoe [həʊ],
how [haʊ], Hoy [hɔɪ], here [hɪɔ]) with 100% accuracy. Also included in the stimuli were
transition-only stimuli (stimuli with no steady states), which had an error rate of 54% (a forced
choice out of 10 options) and were described as being much harder to identify by the subjects.
Bladon concludes that the endpoint targets, rather than the transition, are essential to a
diphthong’s identity, and that diphthongs cannot be defined by their transition alone.
Interestingly, he suggests that the spectral change in the signal (the transition) may act as a
pointer to cue listeners to pay attention to diphthong endpoints, which are functioning as a
diphthong’s main cues. This study suffers from similar methodological problems as Bond
(1978). In both studies, the task of identifying test items as their corresponding words was not
difficult enough, as evidenced by the 100% success rates; additionally, they do not precisely test
how duration of the transition affects the perceptibility of diphthongs with different trajectory
length. That is, given the choice between English words, it would not be difficult to classify the
test items; rather, an AXB test would more effectively test minute differences in perceptibility
along a duration continuum.
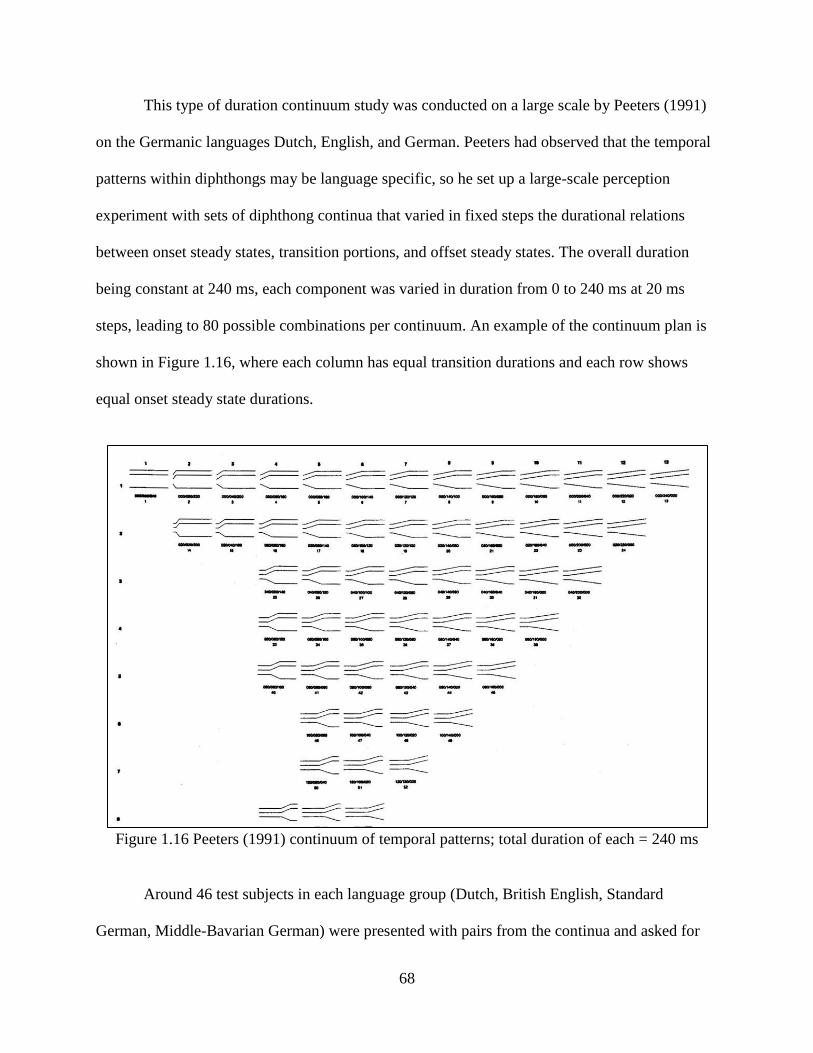
68
This type of duration continuum study was conducted on a large scale by Peeters (1991)
on the Germanic languages Dutch, English, and German. Peeters had observed that the temporal
patterns within diphthongs may be language specific, so he set up a large-scale perception
experiment with sets of diphthong continua that varied in fixed steps the durational relations
between onset steady states, transition portions, and offset steady states. The overall duration
being constant at 240 ms, each component was varied in duration from 0 to 240 ms at 20 ms
steps, leading to 80 possible combinations per continuum. An example of the continuum plan is
shown in Figure 1.16, where each column has equal transition durations and each row shows
equal onset steady state durations.
Figure 1.16 Peeters (1991) continuum of temporal patterns; total duration of each = 240 ms
Around 46 test subjects in each language group (Dutch, British English, Standard
German, Middle-Bavarian German) were presented with pairs from the continua and asked for
69
preference judgments in order to find a 'best diphthong' for each language. Results showed that
the different languages did have different preferences concerning the time variations within the
diphthongs, but no larger consistencies were found. English speakers preferred longer onsets
than Dutch speakers; German speakers preferred more monophthong-like vowels. In a review of
Peeters (1991), Bond criticizes the usage of the same test items for each group of speakers, as
some of the stimuli did not match English or German pronunciation, thereby affecting the results.
Bond also remarks that Peeters does not include any information about the vowel inventories or
spectral properties of the diphthongs in the investigated languages. While Peeters (1991) makes
interesting observations concerning cross-linguistic temporal preferences for diphthongs, the
study does not answer questions about preferences between diphthongs themselves and their
position in the vowel space. The methodology of this study prevents making such conclusions
from the results: the subjects were only asked to rank their preferences (i.e., "Which represents
the best diphthong"), a question that might not have much meaning for untrained subjects.
Few studies have examined the durational cue in diphthongs beyond those of English or
Dutch, much less cross-linguistically. One preliminary study by Lindau et al. (1990) found
differences in diphthong production between Arabic, Hausa, Mandarin, and English. This study
primarily focused on the duration of the F2 transition (taken as a percentage of the total duration
of the entire diphthong) as well as the Euclidean distance between the onset and offset targets of
the two diphthongs [au] and [ai] in F1/F2 space measured in mel. Hausa and Arabic both have a
five-vowel system [i, e, a, o, u] and only two diphthongs [au, ai]; these two languages patterned
together, with the transition taking up only 16-20% of the diphthong. Mandarin also has a five-
vowel system, but with an estimated eleven diphthongs; the transitional duration takes up 40-
50% of the diphthong duration. The longest transition durations were found in English, with 73%

70
of /au/ and 60% of /ai/. To test whether the durational differences could be attributed to the
acoustic distance between the two targets, Lindau et al. (1990) examined the correlation between
the transition duration and distance between the two targets, but could find no correlation when
the vowels were evaluated as a group. They did find a strong correlation between the duration
percentage of the transition and the acoustic distance travelled for the diphthong /ai/ (r = 0.87),
suggesting that for upward moving diphthongs, the longer the distance between the targets the
longer it takes to reach. The plot of mean acoustic distance in mel units against mean transition
duration percentage for /ai/ and /au/ in Hausa, Arabic, Chinese, and English from Lindau et al.
(1990) is provided in Figure 1.17.
Figure 1.17 Mean acoustic distance in mel units plotted against mean transition duration
percentage for /ai/ and /au/ in Hausa, Arabic, Chinese, and English from Lindau et al. (1990: 13)
The same trend held for the four upward-moving diphthongs in Chinese, with a
correlation of (r = 0.7, n = 14). The authors hypothesize that there are language-specific
differences in diphthong transition duration and distance. However, they lack the data to make
definitive conclusions, as they only examined [au] and [ai], which have relatively similar
acoustic distances between endpoints. Two issues with this study are that their data was drawn
from different sources and speech rate was not controlled consistently, making it difficult to
draw definitive conclusions. In order to make these conclusions, languages with a large set of
71
acoustically different diphthongs need to be studied from both a perception and production
standpoint. In sum, Lindau et al. (1990) make several interesting predictions concerning the role
that a vowel inventory can play in influencing a diphthong's features, stating that languages with
larger inventories had longer transitions than languages with smaller vowel inventories.
Studies on individual languages suggest cross-linguistic variation in diphthong duration
patterns, but differences in methodology make comparison difficult. In Dutch, Nooteboom &
Slis (1972) and Strik & Konst (1992) both found that /œy/ and /ɛi/ had the longest durations,
followed by /øː/, /oː/, /ɑu/, and /eː/, whereas Adank, van Hout, & Smits (2004) found the longest
durations23 were of /a/, /ɔu/, /œy/, and /ɛi/. In Welsh, diphthong durations were not found to
differ significantly with the exception of /əɪ/ (Mayr & Davies, 2011). In a study of Meixian
Hakka Chinese, Man (2007) found that the 11 diphthongs could be grouped by their temporal
properties: [ie, ia, io, ua, uo] tend to have short onset steady states, short transitions, and long
offset steady states, while [eu, ui, oi, au, ai, iu] have transitions that are longer than either steady
state. [iu, io, ie, ai] have the longest overall durations and [eu, au, ui] have the shortest overall
durations. Without the actual measurements or statistical calculations, it is hard to draw
conclusions for Meixian Hakka, although Man suggests the temporal differences serve as a cue
to distinguish between pairs from each category (i.e., [eu] might be distinguished from [iu] by
the difference in their temporal structures).
Cross-linguistic reflections on diphthongs are difficult to make considering the sparsity of
large-scale acoustic analyses of diphthong duration. Differences in measurement methodology,
diphthong quality, and diphthong inventory complicate the matter further. Additionally, none of
the studies cited here include analyses of differences in speech rate.
23 Differences between these were non-significant.
72
1.4.3 Summary
This section has provided an overview of the durational cue in diphthongs as it has been
measured and tested in the previous literature. Although widely cited in current literature, the
conclusion drawn by Gay (1968) that slope is a consistent feature of diphthongs across speech
rates in English (the Slope-Constant Hypothesis) did not hold when rigorously tested in Dolan
and Mimori (1986), who found that slope varies with speech rate at a significant level (the
Frequency-Constant Hypothesis). Duration therefore has an effect on slope, at least in English
diphthongs; results for other languages are still needed and the experiment presented in Chapter
2 explores this further.
Duration’s effect on diphthong perception is even less clear. Subjects appear able to
identify diphthongs by their endpoints alone (Bladon, 1985; Bond, 1978), but the tasks required
for these studies were simple enough for the participants to respond correctly for each test item,
indicating that the task was not formatted in such a way to test varying durations on the
perceptibility of the diphthongs. Also, tests for differences between diphthongs with varying
trajectory lengths were not included. Cross-linguistic studies (Lindau et al., 1990; Peeters, 1991)
were either too limited or too large, respectively, to draw decisive conclusions.
1.5 Chapter Overview
The previous literature reviewed here shows not only the amount of complexity involved
in the analysis of diphthong vowels, but also the vast amount of work that remains to be done.
Diphthongs are unique in that they are composed of two targets in a single vowel nucleus.
Phonetically, they are composed of steady states, endpoint targets, and a trajectory connecting
the endpoints. Phonologically, diphthongs are distinctive members of a set of vocalic sequences
including monophthongs, hiatus, and glide + vowel sequences. Languages may use
73
diphthongization of monophthongs allophonically, but these phonetic diphthongs may behave
differently from phonemic diphthongs and are therefore excluded from the present study.
The primary findings in the literature are that diphthong endpoints—instead of the
slope—perhaps hold the greatest cues to diphthong identification, and that these endpoints are
consistent across changes in speech rate, whereas slope varies. However, a thorough analysis of
the role of duration cues cross-linguistically has not yet been done.
The experiment in Chapter 2 addresses this gap by examining the production of
diphthongs in large vowel inventories from three languages. The diphthong endpoints, slope, and
Euclidean distance are analyzed at three different speech rates and are evaluated for cross-
linguistic tendencies. The results of the production experiment provide evidence against the
Slope-Constant Hypothesis and show how diphthong endpoint targets are reduced along with
monophthongs at faster speech rates.
Diphthong perception is then tested in Chapter 3 in Faroese with vowel stimuli that have
been manipulated by duration. The perception experiment provides data on the confusability of
diphthongs at different durations and provides evidence on how duration creates contrast in
diphthongs and monophthongs.
The purpose of these production and perception studies is to understand how diphthongs
behave with changes in duration in order to incorporate them into Dispersion Theory. In Chapter
4, the results of the experiments in Chapters 2 and 3 are used to propose constraints in which
duration is used as a dimension over which dispersion can be calculated. Chapter 4 also provides
an overview of Dispersion Theory, a summary of the results of the experiments, a discussion of
the implications of this work, and suggestions for future research.
74
Chapter 2
Production Experiment
2.1 Introduction
Dispersion Theory is phonetically-driven, meaning its fundamental principles which
predict typology of vowel systems are based in phonetic patterns involving ease of articulation
and perception. This work seeks to create a more unified theory by including diphthongs in
Dispersion Theory. In order to accomplish this, the phonetic patterns of diphthongs must be
investigated to determine how to incorporate them into Dispersion Theory; as the literature
review in Chapter 1 showed, there are several gaps in our understanding of diphthong properties.
In this chapter, the articulatory features of diphthongs are tested in a production
experiment with varying speech rate. Previous literature has hypothesized that diphthong
properties are sensitive to changes across speech rates, but the results have varied. This chapter
tests the two competing hypotheses regarding the phonetic properties that are fundamental to the
identity of a diphthong. First, the Slope-Constant Hypothesis states that the diphthong transition
is a central feature and that slope is a predetermined element. In this hypothesis, diphthong
endpoints vary with changes in speech rate, and slope itself would need to be incorporated into
phonological theory on diphthong dispersion. Second, the Frequency-Constant Hypothesis states
that diphthong endpoints targets are maintained by speakers and the transition is incidental. In
this hypothesis, the endpoint targets themselves are central to the identity of the diphthong and
should be incorporated into the theory. In both cases, duration is the essential variable used to
test these properties and verify one of the hypotheses.
In this experiment, speakers of three languages—Faroese, Vietnamese, and Cantonese—
were recorded producing wordlists at three speech rates. These languages all have large
monophthong and diphthong inventories, yet come from different language families, thereby

75
providing much-needed diversity to the study of diphthongs. A new methodology was used to
control speech rate across participants and languages, which led to consistent results and
maximum comparability across languages. Results show that in all three languages, speakers
maintain their endpoints in a reduced vowel space at faster speeds, causing a reduced Euclidean
distance. The languages tested show variation in the consistency of slope across speech rates,
indicating that the Slope-Constant Hypothesis is either language-specific or that slope is
dependent upon how much a language varies diphthong endpoint distance. This experiment is an
important contribution to the literature on diphthong production because it investigates
diphthongs with respect to the entire inventory rather than the diphthongs alone. This holistic
approach is crucial to the analysis of diphthongs as equal members of vowel systems, when they
have commonly been excluded in previous analyses.
In this chapter, the first section provides an overview of the languages investigated,
including their vowel inventories and relevant phonological information. The second section
details the methods of the experiment: the experimental paradigm, participants, materials, and
experiment procedure. The third section presents the results. The last section provides an
analysis and discussion of the results. All additional information, including wordlists and
supplementary data, can be found in Appendix A.
2.2 Language Background
The review of previous literature in Chapter 1 showed that much work remains in
examining cross-linguistic differences of diphthong properties, as most of the research only
addresses English diphthongs24. The three languages used in this experiment—Faroese,
24 Lindau et al. (1990), though only a pilot study, were some of the first researchers to discuss possible differences
and similarities between languages of different families, including Arabic, Hausa, Mandarin, and English.
76
Vietnamese, and Cantonese—were chosen for their large inventories of both monophthongs and
diphthongs, distinct language families, and lack of their representation in the literature on
diphthongs. The language populations also greatly differ; Cantonese and Vietnamese have
several million speakers while Faroese has less than 100,000. This section provides details of the
vowel inventories and syllabic structure of each language.
2.2.1 Faroese
Faroese is an Insular Scandinavian, West-Scandinavian, North Germanic language
spoken by approximately 48,000 people in the Faroe Islands and a total of 69,000 including
those abroad (Simons & Fennig, 2018). Faroese is generally considered to have three to four
dialects, and descriptions of the dialects vary by source. Most sources make a minimum
distinction between the North and the South, with the division at Skopunarfjørður, a strait
between the islands Streymoy and Sandoy. Major differences between the North and South
include, but are not limited to, distinction between plural and dual pronominal inflection, lexical
differences, aspiration, intonation, and some phonological differences (see Árnason, 2011;
Þráinsson, 2004).
Three dialect divisions are made in Helgason (2002), who follows H. Petersen (1994) in
splitting up the Faroe Islands according to the production of the Faroese VːC syllable. Helgason
divides the dialect areas as follows, also shown in the map of the Faroe Islands provided in
Figure 2.1:
(1) Northern Streymoy/Mykines, Vágar, Eysturoy
(2) Norðoyar, Southern Streymoy (including Tórshavn)
(3) Sandoy, Suðuroy
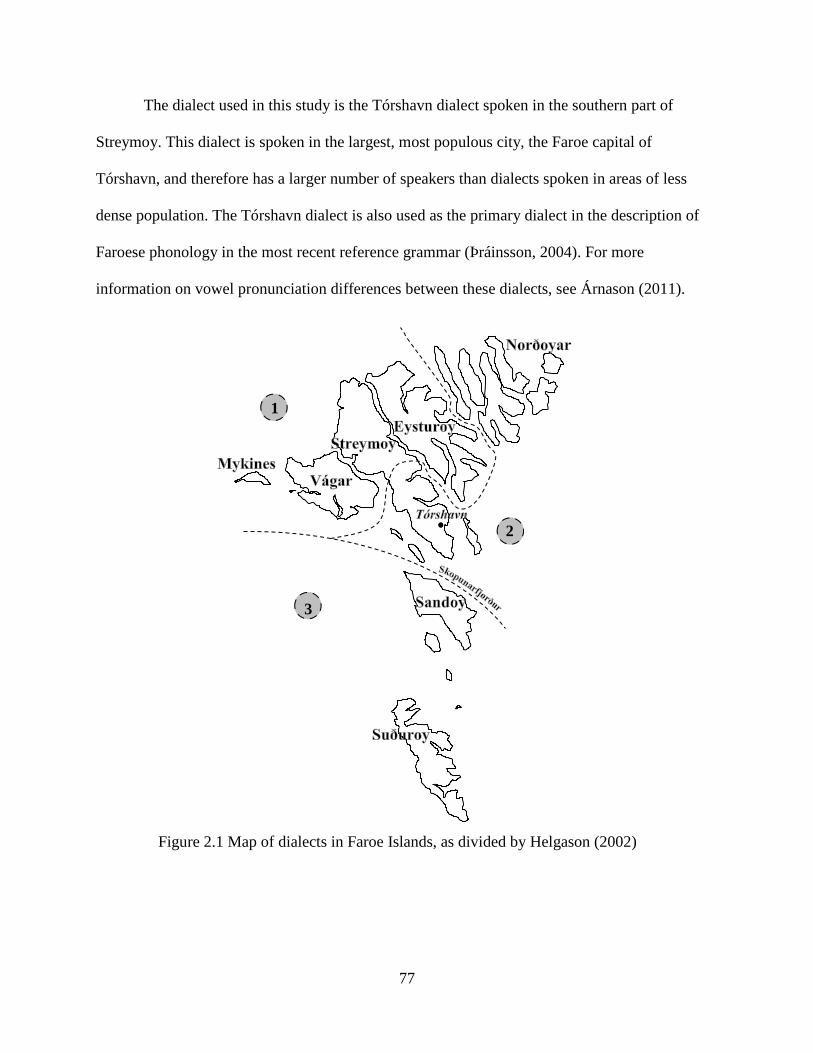
77
The dialect used in this study is the Tórshavn dialect spoken in the southern part of
Streymoy. This dialect is spoken in the largest, most populous city, the Faroe capital of
Tórshavn, and therefore has a larger number of speakers than dialects spoken in areas of less
dense population. The Tórshavn dialect is also used as the primary dialect in the description of
Faroese phonology in the most recent reference grammar (Þráinsson, 2004). For more
information on vowel pronunciation differences between these dialects, see Árnason (2011).
Figure 2.1 Map of dialects in Faroe Islands, as divided by Helgason (2002)
3
1
2
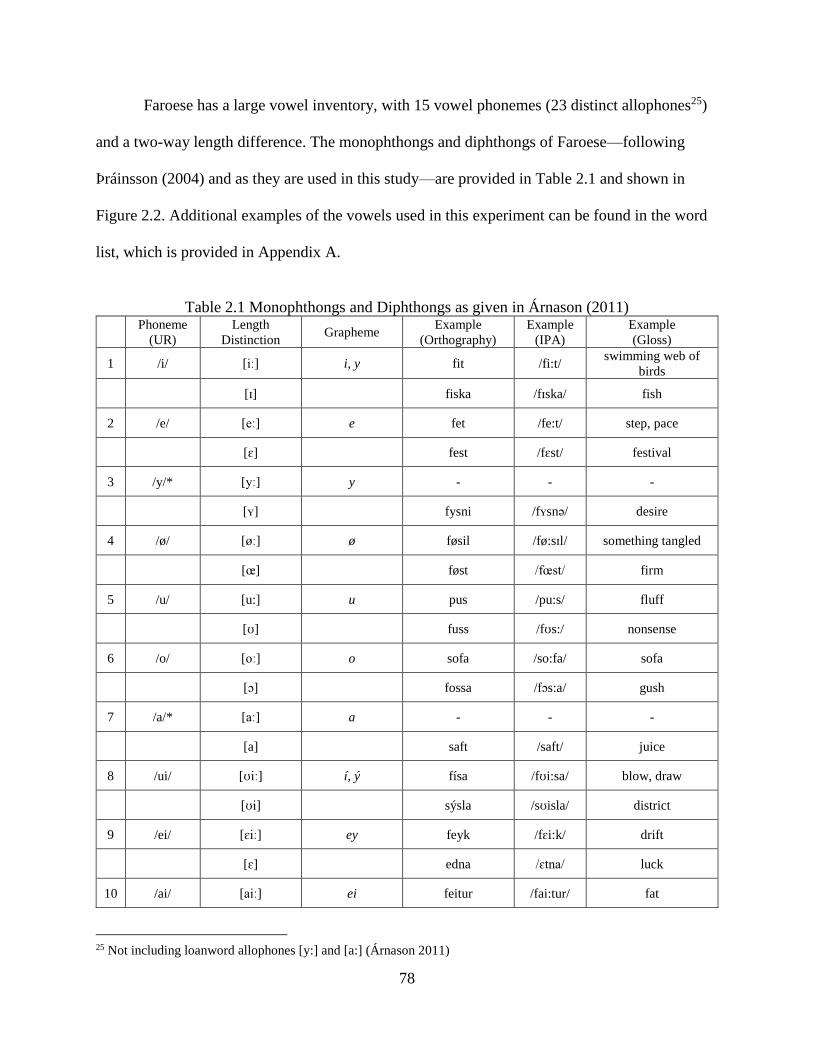
78
Faroese has a large vowel inventory, with 15 vowel phonemes (23 distinct allophones25)
and a two-way length difference. The monophthongs and diphthongs of Faroese—following
Þráinsson (2004) and as they are used in this study—are provided in Table 2.1 and shown in
Figure 2.2. Additional examples of the vowels used in this experiment can be found in the word
list, which is provided in Appendix A.
Table 2.1 Monophthongs and Diphthongs as given in Árnason (2011)
Phoneme
(UR)
Length
Distinction Grapheme
Example
(Orthography)
Example
(IPA)
Example
(Gloss)
1 /i/ [iː] i, y fit /fi:t/ swimming web of
birds
[ɪ] fiska /fɪska/ fish
2 /e/ [eː] e fet /fe:t/ step, pace
[ɛ] fest /fɛst/ festival
3 /y/* [yː] y - - -
[ʏ] fysni /fʏsnə/ desire
4 /ø/ [øː] ø føsil /fø:sɪl/ something tangled
[œ] føst /fœst/ firm
5 /u/ [u:] u pus /pu:s/ fluff
[ʊ] fuss /fʊs:/ nonsense
6 /o/ [oː] o sofa /so:fa/ sofa
[ɔ] fossa /fɔs:a/ gush
7 /a/* [aː] a - - -
[a] saft /saft/ juice
8 /ui/ [ʊiː] í, ý físa /fʊi:sa/ blow, draw
[ʊi] sýsla /sʊisla/ district
9 /ei/ [ɛiː] ey feyk /fɛi:k/ drift
[ɛ] edna /ɛtna/ luck
10 /ai/ [aiː] ei feitur /fai:tur/ fat
25 Not including loanword allophones [y:] and [a:] (Árnason 2011)

79
Phoneme
(UR)
Length
Distinction Grapheme
Example
(Orthography)
Example
(IPA)
Example
(Gloss)
[ai] seiggi /saiʧ:ə/ toughness
11 /oi/ [ɔiː] oy soytil /sɔi:tɪl/ (n.) bit
[ɔi] soytlar /sɔitlar/ (n.) bit (alternate
conjugation)
12 /ou/ [ɔuː] ó fóta /fɔu:ta/ get one’s footing
[œ] fólk /fœl̥k/ people
13 /ʉu/ [ʉuː] ú fúsur /fʉu:sur/ eager; losing card
[ʏ] súgv /sʏkf/ sow
14 /ɛa/ [ɛaː] a, œ fat /fɛa:t/ dish
[a] fast /fast/ hard, firm
15 /ɔa/ [ɔaː] á fá /fɔa:/ few
[ɔ] sárka /sɔʃka/ feel pity for someone
*[y:] and [a:] only occur in loanwords and borrowings, and are not included here
Monophthongs Diphthongs
Figure 2.2 Faroese surface vowel inventory of monophthongs (left) and diphthongs (right)
Faroese vowels have allophonic vowel length alternations, as can be seen in the columns
in Table 2.1. Long diphthongs enter into length alternations with both short diphthongs and short
monophthongs; consequently, some short monophthongs (i.e., [ɛ, œ, ʏ, a, ɔ]) are in allophonic
variation with more than one long vowel (e.g., [e:] ~ [ɛ] and [ɛi:] ~ [ɛ]). There have been many
different approaches to explain Faroese vowel lengthening in the previous literature, including a
rule-based account in Generative Phonology (Þráinsson 2004), a Moraic Phonology account

80
(Cathey, 1997), and a syllable-based analysis (Murray & Vennemann, 1983). Although the
approaches are from different frameworks, they seek to explain the same pattern of Faroese
vowel lengthening, which is briefly reviewed here. The pattern, broadly stated, is that a stressed
vowel is long in open syllables (i.e., if no more than one consonant26 follows it), and short in
closed syllables, with a few exceptions. If two consonants follow the stressed vowel, the vowel is
short, except when the cluster is composed of C1[p, t, k] + C2[r, l, j] (except [tl]).
Stress in Faroese is straightforward: primary stress falls on the initial root syllable, with
alternating weak secondary stress on every other syllable thereafter. Stressed syllables always
have either a long vowel or a coda consonant. This suggests Faroese follows the STRESS-TO-
WEIGHT and WEIGHT-BY-POSITION constraints from (Prince, 1990) and Hayes (1989),
respectively.
There is some debate concerning the phonological classification of the vowels [ɛaː] and
[ɔaː]. While some sources (Árnason, 2011) include these in the set of ‘true’ diphthongs with the
underlying phonemic identities /ɛa/ and /ɔa/, others (Rischel, 1968; Þráinsson, 2004) maintain
that these are underlyingly /æ/ and /ɔ/, respectively, and do not classify as true diphthongs;
rather, these sources state that [ɛaː] and [ɔaː] are “long low vowels with a quality change towards
[a]” (Þráinsson et al. 2004: 32). Þráinsson maintains that true diphthongs only have an [i] or [u]
offset, although it is not clear why this strict distinction is made. Because of the lack of evidence
to support Þráinsson, I follow Árnason (2011) and treat /ɛa/ and /ɔa/ as true diphthongs. As an
additional note, Faroese /y/ and /a/ only occur in loanwords and borrowings and will not be
included in this analysis.
26 Most consonants in Faroese have contrastive length and can be long or short. Long consonants are indicated by
double consonants in the orthography. Long consonants count as two consonants for stress purposes. Exceptions
include [j, h, ɲ, ŋ], which are short (Þráinsson 2004).

81
In sum, the richness of Faroese will add greatly to the body of work on diphthongs and
vowel space. Faroese diphthong perception is tested in the experiment reported in Chapter 3; a
combined analysis of Faroese production and perception of diphthongs is provided in Chapter 4.
2.2.2 Vietnamese
Vietnamese is part of the Austroasiatic language family and is spoken by approximately
68 million speakers in Vietnam and around the world (Simons & Fennig, 2018). Most
Vietnamese words are single-syllable words of the form: C1V(V)C2, where C1 can be any of the
20 consonants, and C2 can be one of the set of eight consonants, /p t k m n ŋ w j/; the syllable
structure is given in Figure 2.3.
σ
C1 (/w/) μ (μ)
| |
V(V) /w/, /j/, or C2
Figure 2.3 Basic hierarchical structure of Vietnamese syllable
Vietnamese has a very large monophthong and diphthong inventory; the complexity of
describing such a large inventory has contributed to its being analyzed as a 9-vowel system
(Haudricourt, 1952; B. T. Nguyễn, 1949, 1959; Thuật, 1977), a 10-vowel system (Crothers,
1978; Le-Van-Ly, 1960; Smalley & Van-Van, 1957), an 11-vowel system (Han, 1968; Đ.-H.
Nguyễn, 1966; Thompson, 1965), and a 33-vowel system (Emerich, 2012). The studies that
analyze Vietnamese as a 9-, 10-, or 11-vowel system count all Vietnamese vowels as
monophthongs and describe all diphthongs as vowel-glide sequences. The 33 vowels in Emerich
(2012) are split into 14 monophthongs and 19 vowel-glide ‘diphthongs’, discussed further below.
Due to the variation in descriptions of Vietnamese in the literature, this study will most closely
follow the recent, thorough analysis of Vietnamese monophthongs, diphthongs, and triphthongs
82
in Emerich's (2012) dissertation; however, as described below, Emerich’s classifications have
been adapted for consistency and to fit the phonological definitions set forth in Section 1.3.4.
Through phonetic and phonological experimentation, Emerich concludes that Vietnamese
should be described with 14 monophthongs /i, e, ɛ, a, ɐ, ʌ, ɤ, ɯ, u, o, ɔ, ie, ɯɤ, uo/ and with 19
diphthongs (ten vowel + /j/ sequences and nine vowel + /w/ sequences) /iw, ew, ɛw, aw, ɐw, ʌw,
ɯw, aj, ɐj, ʌj, ɤj, ɯj, uj, oj, ɔj, iew, ɯɤj, ɯɤw, uoj/ as previously established in the literature
cited above.
Emerich (2012) includes /ie/, /ɯɤ/, and /uo/ as members of the natural class of
monophthongs, calling them “contour vowels.” Emerich groups the ‘contour vowels’ with
monophthongs because they have similar duration patterns as the monophthongs and they can
both be analyzed as monomoraic elements. Emerich’s diphthongs—composed of a vowel and a
glide—are bimoraic, and he states the glide portions /j/ and /w/ do not phonetically align with /i/
and /u/ in a comparison of /i/, /j/, /w/, and /u/ first and second formant values. He finds that the
glides /j/ and /w/ show more variation in dispersion across the vowel space than the offsets /i/
and u/; additionally, the F1 and F2 formant values at the midpoint of the vowels and glides are
different. Emerich concludes that Vietnamese “diphthongs” therefore should be phonologically
classified as “vowel + glide sequences” according to the definitions and literature review in
Section 1.3. It should be noted that all other sources listed above also describe the Vietnamese
diphthongs as vowel + glide sequences. For consistency and comparability with the other
languages tested, /i/ and /u/ will be used in lieu of /j/ and /w/, respectively. Although Emerich
states that the glides do not phonetically match /i/ and /u/ in F1/F2 frequency or vowel space
dispersion and uses this as evidence to claim the Vietnamese diphthongs are vowel + glide
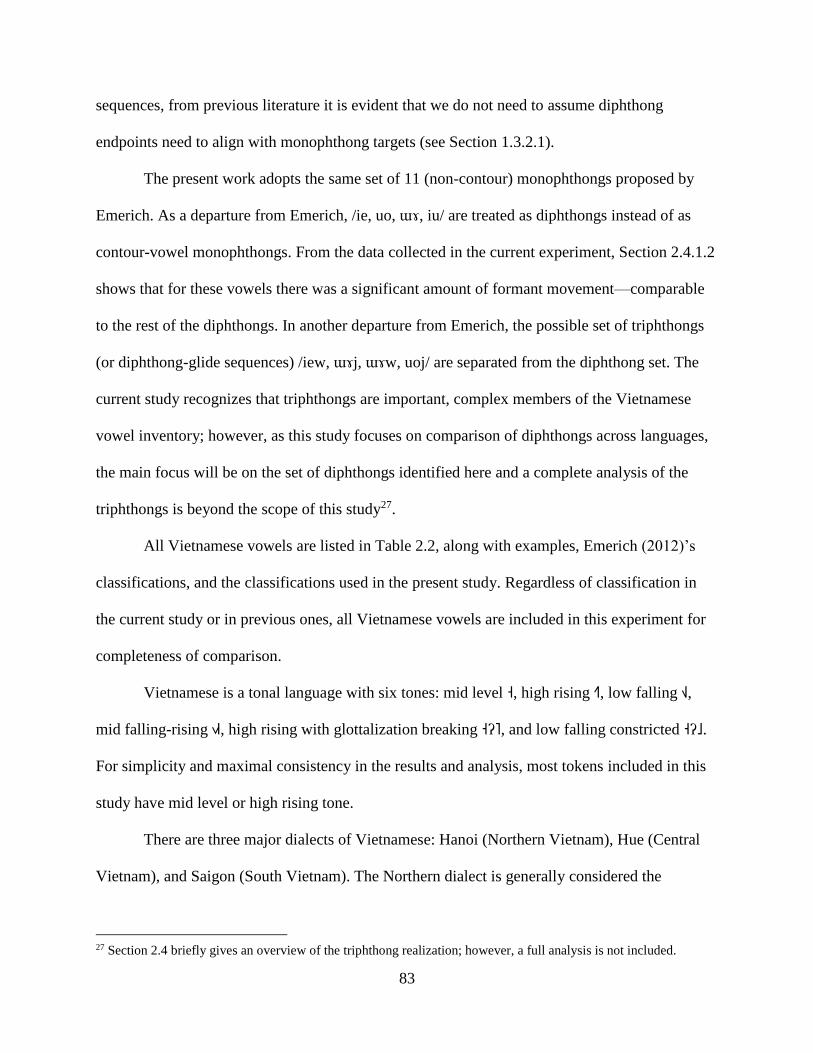
83
sequences, from previous literature it is evident that we do not need to assume diphthong
endpoints need to align with monophthong targets (see Section 1.3.2.1).
The present work adopts the same set of 11 (non-contour) monophthongs proposed by
Emerich. As a departure from Emerich, /ie, uo, ɯɤ, iu/ are treated as diphthongs instead of as
contour-vowel monophthongs. From the data collected in the current experiment, Section 2.4.1.2
shows that for these vowels there was a significant amount of formant movement—comparable
to the rest of the diphthongs. In another departure from Emerich, the possible set of triphthongs
(or diphthong-glide sequences) /iew, ɯɤj, ɯɤw, uoj/ are separated from the diphthong set. The
current study recognizes that triphthongs are important, complex members of the Vietnamese
vowel inventory; however, as this study focuses on comparison of diphthongs across languages,
the main focus will be on the set of diphthongs identified here and a complete analysis of the
triphthongs is beyond the scope of this study27.
All Vietnamese vowels are listed in Table 2.2, along with examples, Emerich (2012)’s
classifications, and the classifications used in the present study. Regardless of classification in
the current study or in previous ones, all Vietnamese vowels are included in this experiment for
completeness of comparison.
Vietnamese is a tonal language with six tones: mid level ˧, high rising ˧˥, low falling ˧˩,
mid falling-rising ˧˩˧, high rising with glottalization breaking ˧ʔ˥, and low falling constricted ˧ʔ˩.
For simplicity and maximal consistency in the results and analysis, most tokens included in this
study have mid level or high rising tone.
There are three major dialects of Vietnamese: Hanoi (Northern Vietnam), Hue (Central
Vietnam), and Saigon (South Vietnam). The Northern dialect is generally considered the
27 Section 2.4 briefly gives an overview of the triphthong realization; however, a full analysis is not included.
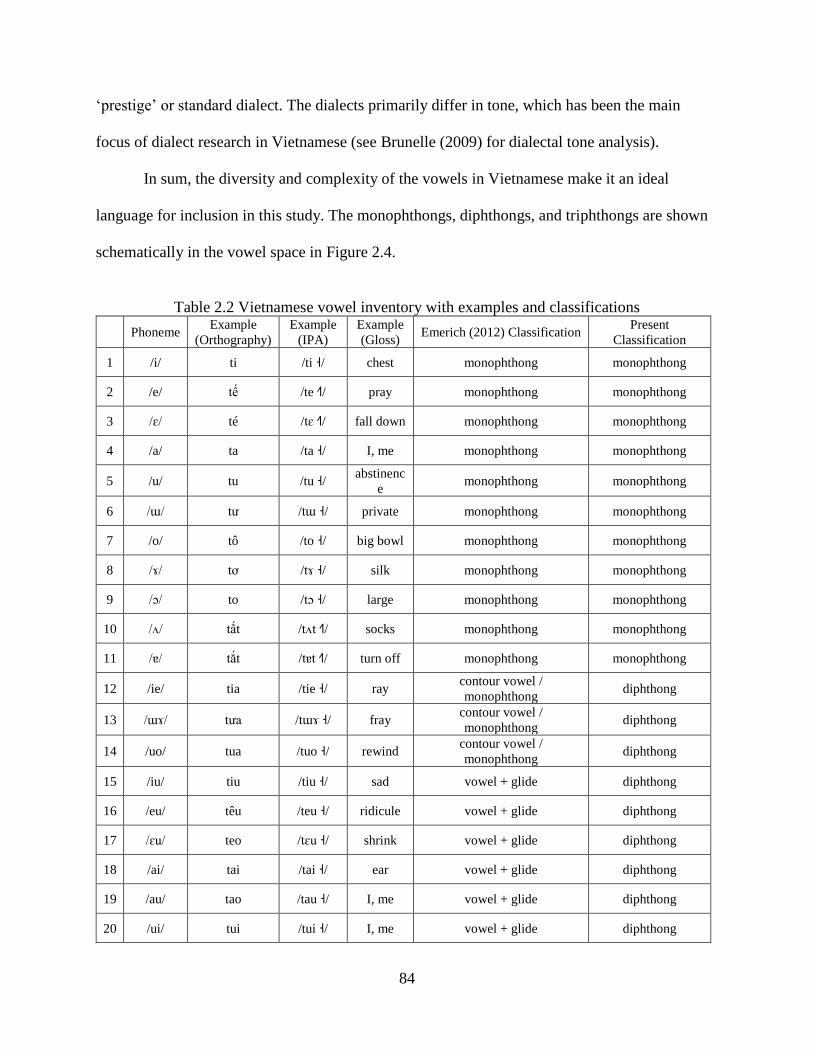
84
‘prestige’ or standard dialect. The dialects primarily differ in tone, which has been the main
focus of dialect research in Vietnamese (see Brunelle (2009) for dialectal tone analysis).
In sum, the diversity and complexity of the vowels in Vietnamese make it an ideal
language for inclusion in this study. The monophthongs, diphthongs, and triphthongs are shown
schematically in the vowel space in Figure 2.4.
Table 2.2 Vietnamese vowel inventory with examples and classifications
Phoneme Example
(Orthography)
Example
(IPA)
Example
(Gloss) Emerich (2012) Classification
Present
Classification
1 /i/ ti /ti ˧/ chest monophthong monophthong
2 /e/ tế /te ˧˥/ pray monophthong monophthong
3 /ɛ/ té /tɛ ˧˥/ fall down monophthong monophthong
4 /a/ ta /ta ˧/ I, me monophthong monophthong
5 /u/ tu /tu ˧/ abstinenc
e monophthong monophthong
6 /ɯ/ tư /tɯ ˧/ private monophthong monophthong
7 /o/ tô /to ˧/ big bowl monophthong monophthong
8 /ɤ/ tơ /tɤ ˧/ silk monophthong monophthong
9 /ɔ/ to /tɔ ˧/ large monophthong monophthong
10 /ʌ/ tất /tʌt ˧˥/ socks monophthong monophthong
11 /ɐ/ tắt /tɐt ˧˥/ turn off monophthong monophthong
12 /ie/ tia /tie ˧/ ray contour vowel /
monophthong diphthong
13 /ɯɤ/ tưa /tɯɤ ˧/ fray contour vowel /
monophthong diphthong
14 /uo/ tua /tuo ˧/ rewind contour vowel /
monophthong diphthong
15 /iu/ tiu /tiu ˧/ sad vowel + glide diphthong
16 /eu/ têu /teu ˧/ ridicule vowel + glide diphthong
17 /ɛu/ teo /tɛu ˧/ shrink vowel + glide diphthong
18 /ai/ tai /tai ˧/ ear vowel + glide diphthong
19 /au/ tao /tau ˧/ I, me vowel + glide diphthong
20 /ui/ tui /tui ˧/ I, me vowel + glide diphthong
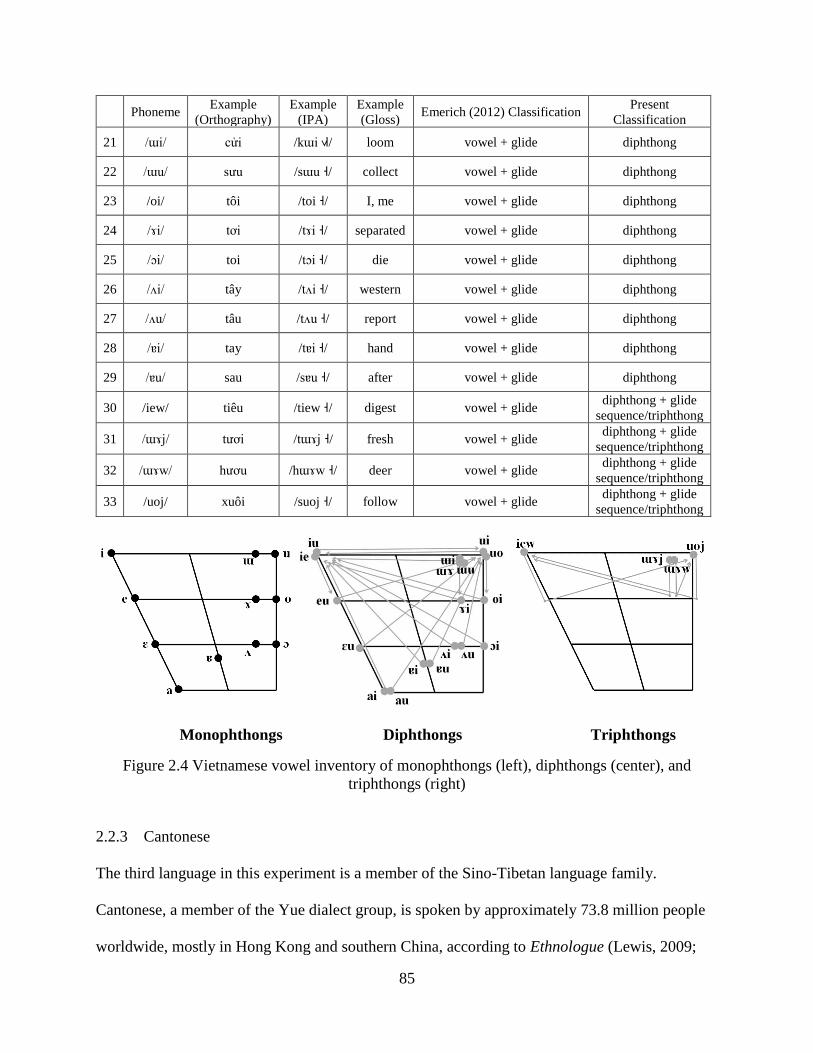
85
Phoneme Example
(Orthography)
Example
(IPA)
Example
(Gloss) Emerich (2012) Classification
Present
Classification
21 /ɯi/ cửi /kɯi ˧˩˧/ loom vowel + glide diphthong
22 /ɯu/ sưu /sɯu ˧/ collect vowel + glide diphthong
23 /oi/ tôi /toi ˧/ I, me vowel + glide diphthong
24 /ɤi/ tơi /tɤi ˧/ separated vowel + glide diphthong
25 /ɔi/ toi /tɔi ˧/ die vowel + glide diphthong
26 /ʌi/ tây /tʌi ˧/ western vowel + glide diphthong
27 /ʌu/ tâu /tʌu ˧/ report vowel + glide diphthong
28 /ɐi/ tay /tɐi ˧/ hand vowel + glide diphthong
29 /ɐu/ sau /sɐu ˧/ after vowel + glide diphthong
30 /iew/ tiêu /tiew ˧/ digest vowel + glide diphthong + glide
sequence/triphthong
31 /ɯɤj/ tươi /tɯɤj ˧/ fresh vowel + glide diphthong + glide
sequence/triphthong
32 /ɯɤw/ hươu /hɯɤw ˧/ deer vowel + glide diphthong + glide
sequence/triphthong
33 /uoj/ xuôi /suoj ˧/ follow vowel + glide diphthong + glide
sequence/triphthong
Monophthongs Diphthongs Triphthongs
Figure 2.4 Vietnamese vowel inventory of monophthongs (left), diphthongs (center), and
triphthongs (right)
2.2.3 Cantonese
The third language in this experiment is a member of the Sino-Tibetan language family.
Cantonese, a member of the Yue dialect group, is spoken by approximately 73.8 million people
worldwide, mostly in Hong Kong and southern China, according to Ethnologue (Lewis, 2009;
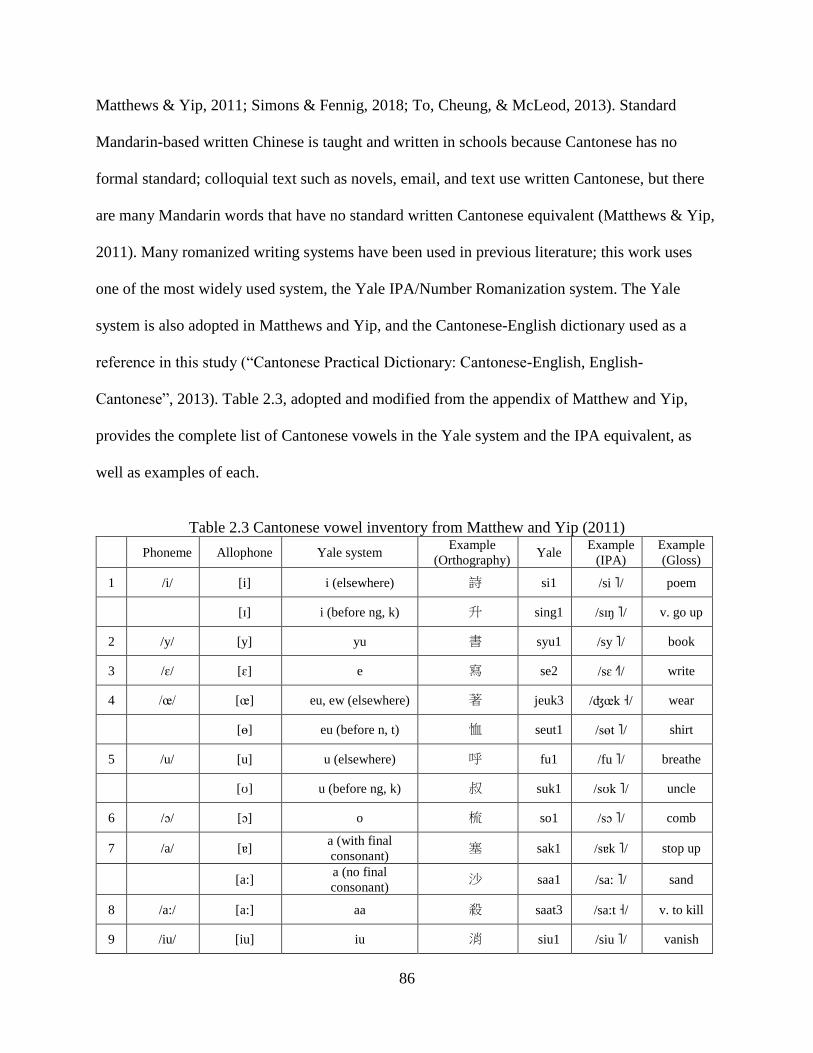
86
Matthews & Yip, 2011; Simons & Fennig, 2018; To, Cheung, & McLeod, 2013). Standard
Mandarin-based written Chinese is taught and written in schools because Cantonese has no
formal standard; colloquial text such as novels, email, and text use written Cantonese, but there
are many Mandarin words that have no standard written Cantonese equivalent (Matthews & Yip,
2011). Many romanized writing systems have been used in previous literature; this work uses
one of the most widely used system, the Yale IPA/Number Romanization system. The Yale
system is also adopted in Matthews and Yip, and the Cantonese-English dictionary used as a
reference in this study (“Cantonese Practical Dictionary: Cantonese-English, English-
Cantonese”, 2013). Table 2.3, adopted and modified from the appendix of Matthew and Yip,
provides the complete list of Cantonese vowels in the Yale system and the IPA equivalent, as
well as examples of each.
Table 2.3 Cantonese vowel inventory from Matthew and Yip (2011)
Phoneme Allophone Yale system Example
(Orthography) Yale
Example
(IPA)
Example
(Gloss)
1 /i/ [i] i (elsewhere) 詩 si1 /si ˥/ poem
[ɪ] i (before ng, k) 升 sing1 /sɪŋ ˥/ v. go up
2 /y/ [y] yu 書 syu1 /sy ˥/ book
3 /ɛ/ [ɛ] e 寫 se2 /sɛ ˧˥/ write
4 /œ/ [œ] eu, ew (elsewhere) 著 jeuk3 /ʤœk ˧/ wear
[ɵ] eu (before n, t) 恤 seut1 /sɵt ˥/ shirt
5 /u/ [u] u (elsewhere) 呼 fu1 /fu ˥/ breathe
[ʊ] u (before ng, k) 叔 suk1 /sʊk ˥/ uncle
6 /ɔ/ [ɔ] o 梳 so1 /sɔ ˥/ comb
7 /a/ [ɐ] a (with final
consonant) 塞 sak1 /sɐk ˥/ stop up
[a:] a (no final
consonant) 沙 saa1 /sa: ˥/ sand
8 /a:/ [a:] aa 殺 saat3 /sa:t ˧/ v. to kill
9 /iu/ [iu] iu 消 siu1 /siu ˥/ vanish
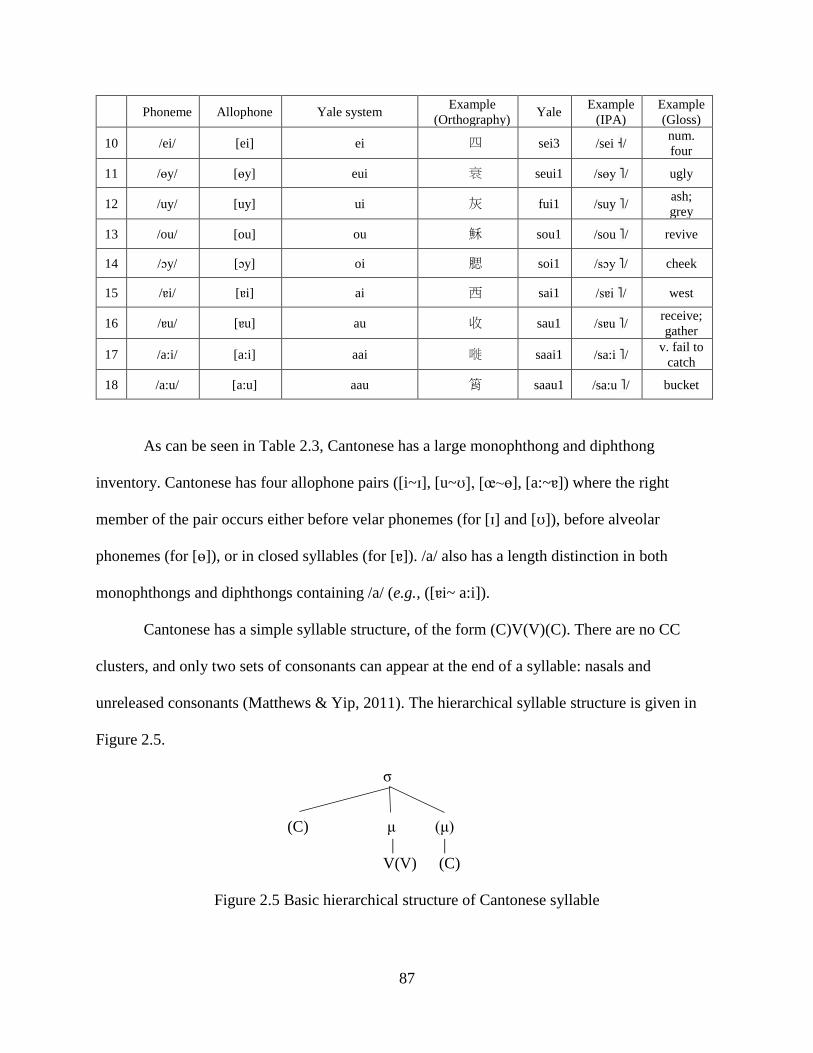
87
Phoneme Allophone Yale system Example
(Orthography) Yale
Example
(IPA)
Example
(Gloss)
10 /ei/ [ei] ei 四 sei3 /sei ˧/ num.
four
11 /ɵy/ [ɵy] eui 衰 seui1 /sɵy ˥/ ugly
12 /uy/ [uy] ui 灰 fui1 /suy ˥/ ash;
grey
13 /ou/ [ou] ou 穌 sou1 /sou ˥/ revive
14 /ɔy/ [ɔy] oi 腮 soi1 /sɔy ˥/ cheek
15 /ɐi/ [ɐi] ai 西 sai1 /sɐi ˥/ west
16 /ɐu/ [ɐu] au 收 sau1 /sɐu ˥/ receive;
gather
17 /a:i/ [a:i] aai 嘥 saai1 /sa:i ˥/ v. fail to
catch
18 /a:u/ [a:u] aau 筲 saau1 /sa:u ˥/ bucket
As can be seen in Table 2.3, Cantonese has a large monophthong and diphthong
inventory. Cantonese has four allophone pairs ([i~ɪ], [u~ʊ], [œ~ɵ], [a:~ɐ]) where the right
member of the pair occurs either before velar phonemes (for [ɪ] and [ʊ]), before alveolar
phonemes (for [ɵ]), or in closed syllables (for [ɐ]). /a/ also has a length distinction in both
monophthongs and diphthongs containing /a/ (e.g., ([ɐi~ a:i]).
Cantonese has a simple syllable structure, of the form (C)V(V)(C). There are no CC
clusters, and only two sets of consonants can appear at the end of a syllable: nasals and
unreleased consonants (Matthews & Yip, 2011). The hierarchical syllable structure is given in
Figure 2.5.
σ
(C) μ (μ)
| |
V(V) (C)
Figure 2.5 Basic hierarchical structure of Cantonese syllable

88
Like Vietnamese, Cantonese is a tonal language and has six distinctive pitch patterns:
1. * high level: 55 ˥
2. high/mid rising: 35 ˧˥
3. * mid level: 33 ˧
4. low falling: 21 ˨˩
5. low rising: 23 ˩˧
6. * low level: 22 ˨
Three of these six tones (marked with the asterisk *) have a ‘checked’ level tone variant that
occurs before an unreleased consonant or glottal stop. These are often called ‘entering tones’ as
in the Cantonese Pinyin romanization system. The checked and unchecked tones have the same
realization. The Yale system (as shown above) treats these tones the same as tones 1, 3, and 6,
respectively, because they are in complementary distribution. For consistency and simplicity,
most tokens in this experiment are high level, mid level, or high rising tone.
In sum, Cantonese has the largest population of native speakers of the languages included
in this study, as well as a large inventory of diphthongs and monophthongs. The vowel inventory
of Cantonese is shown schematically in Figure 2.6.
Monophthongs Diphthongs
Figure 2.6 Cantonese vowel inventory
89
2.3 Methodology
This production experiment is designed to test the phonetic properties of diphthongs and
their sensitivity to speech rate using a novel speech rate regulation technique. This new method
was developed specifically for this study to produce consistent results across speakers and
languages, and has not been used in any previous study28. This section describes the paradigm of
the experiment, participant information, materials used, experimental procedure, and the
analytical methods.
2.3.1 Experimental Paradigm
To test the phonetic properties of diphthongs in production, this experiment is designed
as a rate-controlled structured elicitation task. The reason for using structured elicitation is that
minute differences in the speech signal can be extracted and measured. With elicitation, all the
tokens necessary for measurement can be collected; this is essential when the languages used
have large vowel inventories. In conversational speech, it is unlikely that multiple instances of
each vowel in the inventory will occur in stressed positions, in monosyllabic words, and with
surrounding consonants that will minimally affect the vowel formants. At the sentence-level,
using a word list-style format minimizes vowel reduction and fluctuations in stress and prosody.
Additionally, the speech rate is better controlled in an elicitation task than in unstructured
speech, especially when many speech rates are being tested. The experimental procedure was the
same for all three languages to ensure comparable methodology and results. A repeated-
measures design was used, in that all participants (within each language) were recorded at all
three speech rates.
28 To the knowledge of the author.
90
2.3.2 Participants
2.3.2.1 Faroese Participants
12 native speakers (seven males, five females) of the Tórshavn dialect of Faroese
participated in the acoustic experiment. All recording took place in the city of Tórshavn at the
Department of Language and Literature at the University of the Faroe Islands (Fróðskaparsetur
Føroya) in a quiet room. All speakers self-reported as native Faroese speakers of the Tórshavn
dialect. One additional speaker was excluded from the results after reporting they spoke the
Northern Eysturoy dialect and it was verified in the data analysis that the vowels (including an
[ɔu] → [ɛu] shift) significantly differed from the other participants. All participants were
between the ages of 18 and 55.
2.3.2.2 Vietnamese Participants
Four native Vietnamese speakers (two males, two females) participated in the acoustic
experiment. Two speakers were recorded in a sound-attenuated recording booth in the
Linguistics Lab at Georgetown University and two speakers were recorded in a quiet room in
McLean, Virginia. Two speakers (one male, one female) self-reported to have a more Northern
Vietnamese dialect accent and two speakers self-reported to have a Southern Vietnamese dialect
accent. The dialect differences did not appear to meaningfully affect the results. To control for
any dialect differences, speaker was included as a random effect in all statistical tests29. All
participants were between the ages of 18 and 55.
29 Speaker was also used as a random effect for all tests in Faroese and Cantonese.

91
2.3.2.3 Cantonese Participants
12 native Cantonese speakers (1 male, 11 females) participated in the acoustic
experiment. All Cantonese speakers were recruited and recorded at Hong Kong University30. All
participants self-reported as native Cantonese speakers from the Hong Kong area. All
participants were between the ages of 18 and 55.
2.3.3 Materials
The tokens used were real words from each language; to the extent it was possible, words
were limited to a monosyllabic (and occasionally disyllabic, if necessary), neutral context. The
framing consonants surrounding the vowel were specifically chosen to reduce the effect of
perseveratory and anticipatory consonant transitions into and out of the token vowel and allow
for accurate measurements of the vowel.
Words in the carrier phrases that frame the target word were also carefully chosen to
minimize any phonetic effects (e.g., rhotics, nasalization, etc.) that might affect the target word.
The consonant frame was different for each of the languages tested due to phonotactic and
lexical constraints but was consistent within each language. To the extent that it was possible, all
effort was given to limit onsets and codas to labial fricatives and stops, and alveolar stops.
Each word list was reviewed by a native speaker to reduce error and confusion, and to
ensure the correct vowel qualities were being elicited for each token. Word lists were
randomized for each speaker and within each training and trial session. Full word lists used for
each language are provided in Appendix A.
30 Experiment was run by Hong Kong University Linguistics Professor Dr. Youngah Do. Many thanks to Dr. Do and
her team of researchers, who were able to make this experiment successful.

92
Faroese
The Faroese word list was compiled by hand from the Young & Clewer (1985) Faroese-
English dictionary and edited with the assistance of a native speaker of Faroese. The consonants
used to frame the target vowels are as follows:
Onsets: /f/, /p/, /s/, /t/
Codas: /f/, /p/, /s/, /t/, /ʃ/, /ʧ/, #31, /k/ (rarely)
Most of the vowels appeared in a /f_s/ context; each vowel was recorded in three different
contexts, mostly with /f, p, s/ as the onset (with /t/ occasionally substituting for one of these
three) and /f, p, s/ as coda. All vowels of the language inventory were included (see Table 2.1).
With 23 vowels in the Faroese inventory, this amounted to 69 words per speech rate, and 207
total words per speaker; at 12 speakers, 2,484 words were elicited overall.
Each word was embedded in a carrier phrase, which prevents word-level differences
caused by sentence-level stress and intonation differences, which may alter the duration of the
target vowel.
Carrier phrase: Eg sigi orðið ____ tvær ferð
IPA: [ɛi si ɔrə ____ tvɛr fɛr]32
English translation: ‘I say the word ____ twice’
Vietnamese
The Vietnamese word list was adapted from the word list used in Emerich (2012) and
edited with the assistance of a native speaker of Vietnamese. The Vietnamese word list contained
31 # represents a word boundary. 32 In the carrier phrase, often the first word [ɛi] was reduced to [ɛ], especially in the ‘fast’ contexts, but this did not
have an effect on the target vowel.

93
monosyllabic words of the structure CV(C). The consonants used to frame the target vowels are
as follows:
Onsets: /t/, /k/, /s/; with n ≤ 2 each of: /ɓ/, /ɣ/, /h/, /x/
Codas: /t/, #; with n = 2 of: /n/
Each vowel appeared in three different contexts, with at least one mid level tone ˧ and one high
rising tone ˧˥, where applicable to maintain the most minimal pairs. There was some variation
with regard to number of contexts (2-4) and tone. One vowel, /ɯj/ only appeared in the word list
with the falling-rising tone ˧˩˧. The most common minimal pairs were of the format: tV(t), kV(t),
and sV(t). Two vowels had two contexts and four vowels had four contexts, while the remaining
had three, leading to 100 total tokens in the word list. With 33 vowels and three contexts each,
100 tokens were recorded at each speech rate (x2 per carrier phrase). For four speakers, this
amounted to 2,400 tokens overall.
Each word was embedded in a carrier phrase, provided below. Each token was recorded
twice because it was included in the middle and at the end of the carrier phrase. The difference in
this carrier phrase was necessary to maintain the meaning of the phrase and to limit surrounding
words with phonemes that have minimal phonetic effects on the target word.
Carrier phrase: Tôi đọc từ ____ thêm một lần nữa: ____
IPA: [tɔi˧ ɗɔk˨ tɯ˨˩ ____ tʰɛm˧ mot˨ lʌn˨˩ nua˧ˀ˥ ____ ]
English translation: ‘I read this word ____ one more time: ____’
Cantonese
The Cantonese word list was compiled by hand from a Cantonese-English dictionary
(“Cantonese Practical Dictionary: Cantonese-English, English-Cantonese” 2013) and a
94
Cantonese reference grammar (Matthews & Yip 2011) and edited with the assistance of a native
speaker of Cantonese. The Cantonese word list contained only monosyllabic words with the
structure CV(C). The consonants used to frame the target vowels are as follows:
Onsets: /s/, /j/, /h/, /f/; with n = 2 each of: /g/, /ʧ/
Codas: /k/, /ng/, /t/, /n/, #
Allophones [ɪ, ʊ, œ] only occur before /k, ŋ/ and [ɵ] only occurs before /t, n/. For /a/, allophone
[ɐ] occurs in syllables with a coda, whereas [a:] occurs in syllables with no coda. All other word
list tokens have no coda. Refer to Section 2.2.3 for a more detailed description of the Cantonese
vowel system. Each vowel appeared in at least three different contexts (three vowels had four
contexts), with at least one context being the high level tone ˥ (Yale 1/7). All but three vowels
also had at least one context of the mid level tone ˧ (Yale 3/8). For the three exceptions, a high
rising tone ˧˥ (Yale 2) was used.
Each word was embedded in a carrier phrase, provided below. Each token occurs in the
sentence one time. With a total of 72 tokens at three speech rates and 12 participants, 2,592
tokens were elicited in total.
Carrier phrase: _____
Yale system: zoi3 duk6 do1 ci3 go3 _____ zi6
Gloss: again read more time quantifier.word _____ word
IPA: [ʦɔi dʊk dɔ ʦi go ___ ʦi]
Translation: ‘Read the word _____ one more time’
2.3.4 Procedure
The experiment was designed and run entirely in the free software PsychoPy (Peirce,
2007), a customizable experimentation platform in Python. Faroese and Vietnamese audio

95
recordings were made on a Digital Marantz PMD-660 digital recorder in .wav format at a
sampling rate of 44.1k Hz with an Audio-technica AT831b condenser lavalier microphone. The
Cantonese audio recordings were done on a Digital Marantz PMD-661 MKII with an Olympus
ME31 compact unidirectional electret microphone. The experiment duration was approximately
15 minutes.
In previous experiments (i.e., Borzone de Manrique, 1979; William B. Dolan & Mimori,
1986; Fourakis, 1991; Thomas John Gay, 1968, among many others), speakers were allowed to
determine their own individual paces as to what was ‘fast’, ‘normal’, and ‘slow’. When testing
larger populations, variation in what participants deem ‘fast’, ‘normal’, and ‘slow’ can lead to
significant differences between speech rates. In the present experiment, each speaker did not
determine their own pace, as these can differ very widely and can potentially beget the exclusion
of some participants who many not have been fast or slow ‘enough’ to have a significant
difference between their speech rates. Other previous experiments (Adams & Weismer, 1993;
Lane & Grosjean, 1973) elicited different speech rates that using an autophonic scaling
procedure in which participants were extensively trained to adjust speech rate after establishing a
baseline. The present experiment is similar to the autophonic scaling procedure but it is
implemented digitally with a much shorter training period.
For the first language, Faroese, the timing of the ‘normal’ speech rate was determined by
previously recording an additional speaker of Faroese (who did not participate in the subsequent
experiment) without timing constraints (that is, freedom to advance to the next word at will) and
measuring an average of the duration of each phrase. This averaged number was determined to
be the amount of time allotted for each phrase of the ‘normal’ rate session of the experiment. For
the next languages Vietnamese and Cantonese, the carrier phrases were each tested on a

96
language consultant using the Faroese timing as a baseline and rates were adjusted as necessary.
All timing was consistent within each language. Although this may not have been a true ‘normal’
for each speaker in the experiment (some speakers may naturally speak faster or slower), after a
brief training session and exposure to the carrier phrase, the participants self-reported it to be a
comfortable pace.
Faroese and Cantonese
For Faroese and Cantonese, the ‘normal’ rate was set to 2 seconds (i.e., participants were given 2
seconds to produce each token/carrier phrase in the normal rate condition). The ‘fast’ speech rate
was 1 second (2x faster than the ‘normal’ rate) and the ‘slow’ rate was 3.5 seconds (1.75x slower
than the ‘normal’ rate). Through pilot testing, 4 seconds (2x slower than the ‘normal’ rate) for
the ‘slow’ was so much time that participants either consistently left about 0.5 seconds at the end
of each phrase or inserted extra empty time between words in the phrase instead of lengthening
the sounds within the words. Slightly reducing the time fixed these issues.
Vietnamese
For Vietnamese, the carrier phrase was longer than Faroese and Cantonese, so 1 second was
added to each rate after consulting and testing the speech rates with a native speaker. Faroese and
Cantonese each have 7 syllables in the carrier phrase, while Vietnamese has 10. In Vietnamese,
the ‘normal’ speech rate was set to 3 seconds, the ‘fast’ rate was 2 seconds, and the ‘slow’ rate
was 4.5 seconds.
At the beginning of the experiment, each participant read a series of instructions and
completed a 5-token training session to become accustomed to the format of the experiment, the
carrier phrase, and the ‘normal’ pace. For each test item, a red timing/pacer bar at the bottom of

97
the page indicated how much time was left until the next item by shrinking in size. This
indication bar “ran out” as time progressed for each phrase. The bar moved faster in the fast
speech rate and slower in the slow speech rate according to the seconds allotted for each speech
rate. The bar was a very effective reminder for the participants to not speed up or slow down as
the experiment progressed, as it allowed for self-correction. For instance, if the red bar was
continuing to shrink after they finished the phrase, they could self-correct on the next item to
speak slower. To my knowledge, this methodology has not been previously used to regulate
speech rate. Another advantage of this methodology is that participants quickly adapted to each
speech rate and did not need extensive practice or training, as in previous studies (Adams &
Weismer, 1993; Lane & Grosjean, 1973). Figure 2.7 shows two screenshots of the experiment
and how the time bar reduces to indicated the timing.
Figure 2.7 Screenshots of Faroese acoustic experiment; note how red bar reduces in size to
indicate the remaining time for each sentence
Presenting each phrase individually on the computer screen minimized list intonation.
After the training session, the experiment moved to the trial session for the ‘normal’ pace. Next,
the participant was invited to take a brief break before taking another 5-item training session and
trial for the ‘fast’ pace. This procedure (break—training—trial) was repeated with the ‘slow’
pace. Figure 2.8 schematically shows the complete progression of the experiment. The

98
methodology was successfully tested in a pilot experiment on two native English speakers with
English words to ensure the experimental design was feasible.
Figure 2.8 Flow chart of acoustic experiment
2.3.5 Data Analysis Methodology
All recordings were processed for duration and formant extraction using a combination of
manual segmentation and scripting Praat (Boersma & Weenink, 2018). All audio files were
manually segmented33 for vowel duration and diphthong (trajectory) duration. Formant settings
were adjusted to fit to each individual speaker (e.g., male speakers have a lower range of
frequency and lower “maximum formant” setting than female speakers). For formant analysis,
Praat uses the Burg algorithm (Childers, 1978; Press, Teukolsky, Vetterling, & Flannery, 1992)
33 A sample of data from the beginning of the data set was re-checked to ensure annotation consistency after the
entire data set was annotated.
Consent and Instructions
Training Session for 'normal' pace
Trial Session for 'normal' pace
Break/Instructions for 'fast' pace
Training Session for 'fast' pace
Trial Session for 'fast' pace
Break/Instructions for 'slow' pace
Training Session for 'slow' pace
Trial Session for 'slow' pace
End of Experiment
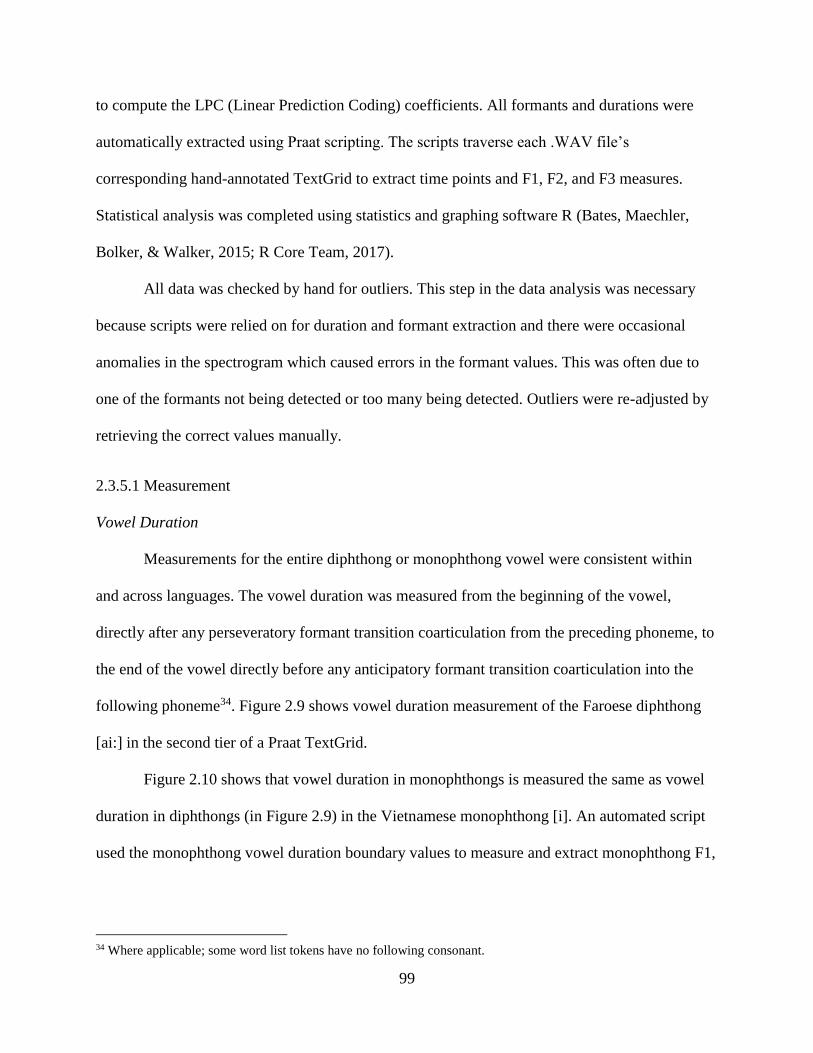
99
to compute the LPC (Linear Prediction Coding) coefficients. All formants and durations were
automatically extracted using Praat scripting. The scripts traverse each .WAV file’s
corresponding hand-annotated TextGrid to extract time points and F1, F2, and F3 measures.
Statistical analysis was completed using statistics and graphing software R (Bates, Maechler,
Bolker, & Walker, 2015; R Core Team, 2017).
All data was checked by hand for outliers. This step in the data analysis was necessary
because scripts were relied on for duration and formant extraction and there were occasional
anomalies in the spectrogram which caused errors in the formant values. This was often due to
one of the formants not being detected or too many being detected. Outliers were re-adjusted by
retrieving the correct values manually.
2.3.5.1 Measurement
Vowel Duration
Measurements for the entire diphthong or monophthong vowel were consistent within
and across languages. The vowel duration was measured from the beginning of the vowel,
directly after any perseveratory formant transition coarticulation from the preceding phoneme, to
the end of the vowel directly before any anticipatory formant transition coarticulation into the
following phoneme34. Figure 2.9 shows vowel duration measurement of the Faroese diphthong
[ai:] in the second tier of a Praat TextGrid.
Figure 2.10 shows that vowel duration in monophthongs is measured the same as vowel
duration in diphthongs (in Figure 2.9) in the Vietnamese monophthong [i]. An automated script
used the monophthong vowel duration boundary values to measure and extract monophthong F1,
34 Where applicable; some word list tokens have no following consonant.
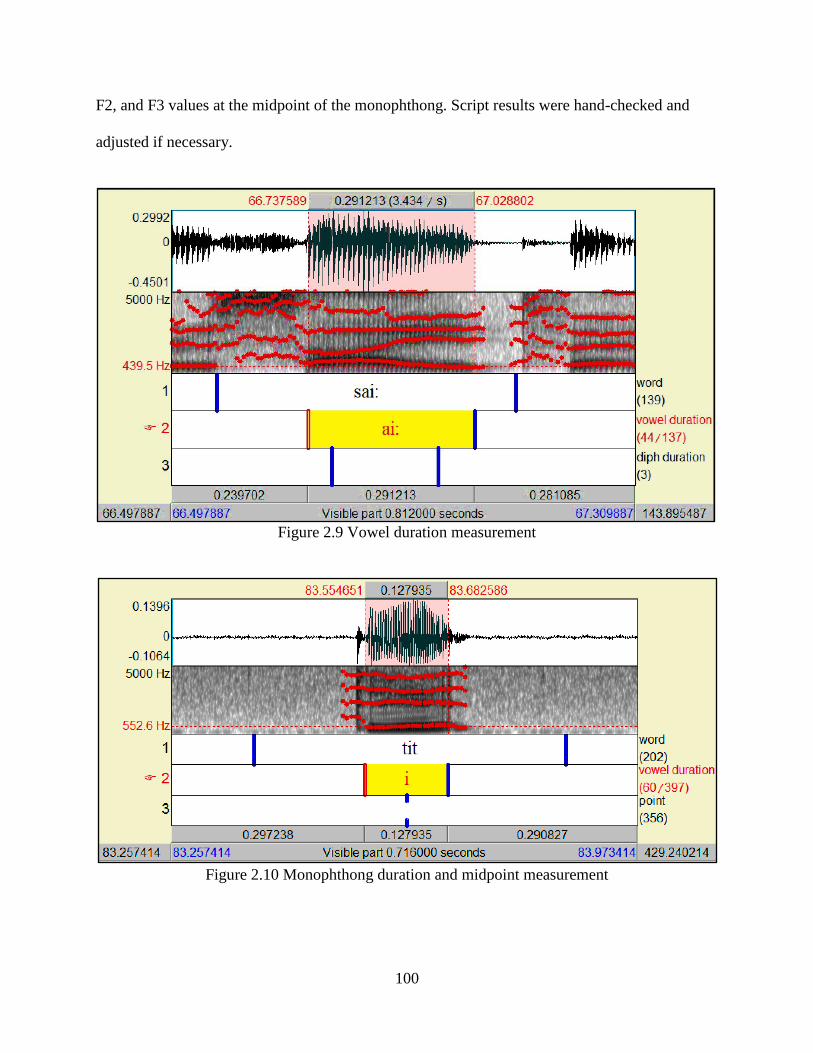
100
F2, and F3 values at the midpoint of the monophthong. Script results were hand-checked and
adjusted if necessary.
Figure 2.9 Vowel duration measurement
Figure 2.10 Monophthong duration and midpoint measurement
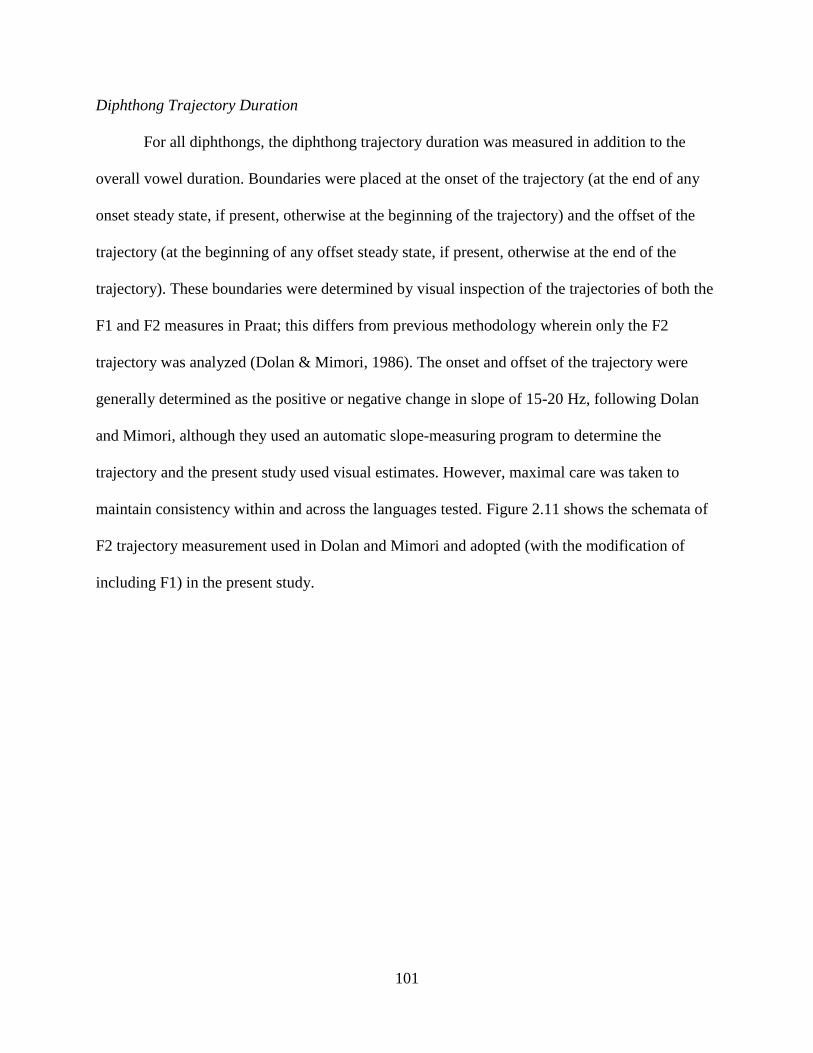
101
Diphthong Trajectory Duration
For all diphthongs, the diphthong trajectory duration was measured in addition to the
overall vowel duration. Boundaries were placed at the onset of the trajectory (at the end of any
onset steady state, if present, otherwise at the beginning of the trajectory) and the offset of the
trajectory (at the beginning of any offset steady state, if present, otherwise at the end of the
trajectory). These boundaries were determined by visual inspection of the trajectories of both the
F1 and F2 measures in Praat; this differs from previous methodology wherein only the F2
trajectory was analyzed (Dolan & Mimori, 1986). The onset and offset of the trajectory were
generally determined as the positive or negative change in slope of 15-20 Hz, following Dolan
and Mimori, although they used an automatic slope-measuring program to determine the
trajectory and the present study used visual estimates. However, maximal care was taken to
maintain consistency within and across the languages tested. Figure 2.11 shows the schemata of
F2 trajectory measurement used in Dolan and Mimori and adopted (with the modification of
including F1) in the present study.

102
An example of diphthong trajectory duration measurement can be seen in the third tier of
the Praat TextGrid in Figure 2.13 of the Faroese diphthong [ai:]. Note that unlike the schemata in
Figure 2.11, movement of both F1 and F2 are considered in the placement of the boundaries. F1
and F2 movement do not necessarily align temporally (e.g., F1 may continue movement while
F2 reaches a steady state). In these cases, boundaries were placed so all movement is captured,
that is, at the outermost edges of all movement for F1 and F2 combined. Accounting for all
movement in F1 and F2 is shown in the schemata used in this study, shown in Figure 2.12. In
this figure, the onset and offset boundaries are marked at the outermost boundaries (in this case,
those of F2, because it has a longer trajectory; note that F1 could have a longer trajectory, or both
may be staggered).
Onset steady state
Offset
Target
Fre
quen
cy (
Hz)
Duration
Offset steady state
Onset
Target +15-20 Hz
-15-20 Hz
Trajectory
Figure 2.11 Trajectory segmentation schemata from Dolan and Mimori (1986)
F2
F2

103
Diphthong F1, F2, and F3 formant measurements were taken at these onset and offset
boundaries using a Praat script with hand-checking of outliers. In the case of Cantonese
Triphthongs, boundaries were manually placed at the outermost boundaries (consistent with
diphthongs) and at a third point of transition (between V2 and V3) at the local maximum or local
minimum in slope.
Figure 2.12 Diphthong segmentation schemata
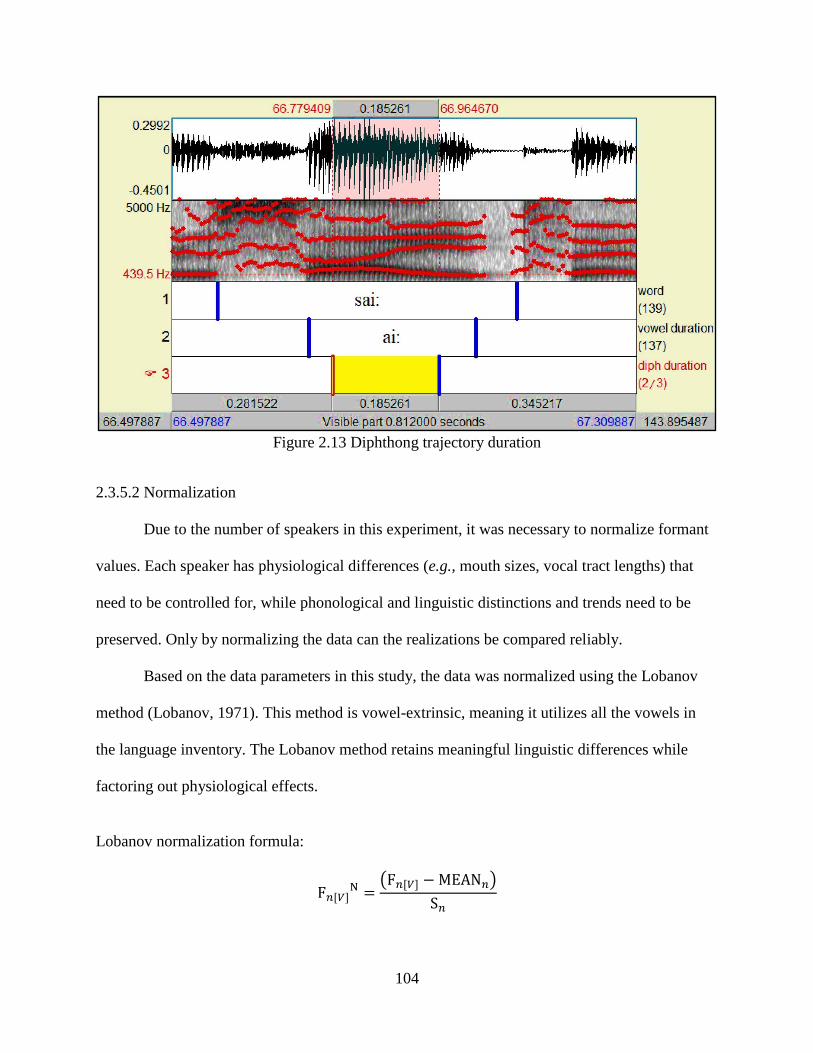
104
Figure 2.13 Diphthong trajectory duration
2.3.5.2 Normalization
Due to the number of speakers in this experiment, it was necessary to normalize formant
values. Each speaker has physiological differences (e.g., mouth sizes, vocal tract lengths) that
need to be controlled for, while phonological and linguistic distinctions and trends need to be
preserved. Only by normalizing the data can the realizations be compared reliably.
Based on the data parameters in this study, the data was normalized using the Lobanov
method (Lobanov, 1971). This method is vowel-extrinsic, meaning it utilizes all the vowels in
the language inventory. The Lobanov method retains meaningful linguistic differences while
factoring out physiological effects.
Lobanov normalization formula:
F𝑛[𝑉]N =
(F𝑛[𝑉] − MEAN𝑛)
S𝑛

105
where F𝑛[𝑉]N is the normalized value for F𝑛[𝑉] (i.e., for formant n of
vowel V). MEAN𝑛 is the mean value for formant n for the speaker in
question and S𝑛 is the standard deviation35 for the speaker's formant n.
The output of the Lobanov normalization formula is not in an easily readable format such
as Hertz or Bark values; therefore, a scaling algorithm is used to translate the normalizing output
into Hertz-like values. Normalization and scaling were performed with the Vowel Normalization
and Plotting Suite NORM (Thomas & Kendall, 2007), which uses the following scaling
algorithm:
F'1 = 250 + 500 (FN1 - F
N1MIN) / (FN
1MAX - FN1MIN)
F'2 = 850 + 1400 (FN2 - F
N2MIN) / (FN
2MAX - FN2MIN)
F'3 = 2000 + 1200 (FN3 - F
N3MIN) / (FN
3MAX - FN3MIN)
where FNi is a normalized value for formant i and FN
iMIN and FNiMAX are
the minimum and maximum normalized formant values for formant i.
2.3.5.3 Distance
The distance measurement is used to tell how far apart the onset and offset points of the
diphthongs are in the vowel space, without using a pre-proportioned map like that of Flemming
(2004). The formula is that of the Euclidean distance, following Emerich (2012), shown in
Equation 1. Note that movement in both the F1 and F2 dimensions is accounted for equally. This
differs from previous studies that only account for F2 movement (e.g., Dolan & Mimori, 1986;
Gay, 1968). F1 and F2 are both included in this study because some diphthongs in the languages
35 While Lobanov (1971) reported using rms deviation instead of standard deviation, recent practice (Adank et al.,
2004; Nearey, 1977) uses standard deviation. The overall result is the same, but standard practice is to use standard
deviation, which is also followed here.

106
tested have trajectory movement primarily along the F1 axis (e.g., [ɯɤ] in Vietnamese). A
distance formula where only F2 is included would disproportionately affect the distance
measurement of these more ‘vertical’ diphthongs. The resulting distance measurement is in Hertz
(Hz).
Equation 1. Distance (Euclidean)
√(𝒐𝒇𝒇𝒔𝒆𝒕𝑭𝟐𝒔 − 𝒐𝒏𝒔𝒆𝒕𝑭𝟐𝟏)𝟐 + (𝒐𝒇𝒇𝒔𝒆𝒕𝑭𝟏𝟐 − 𝒐𝒏𝒔𝒆𝒕𝑭𝟏𝟏)𝟐
This equation is also used in Emerich (2012) to measure what he terms ‘displacement’
between endpoints of diphthongs in Vietnamese as well as displacement along 5 internal points
along the trajectory (at 10%, 30%, 50%, 70%, and 90%). Emerich does not measure slope in his
study of Vietnamese diphthongs.
2.3.5.4 Slope
The slope measurement is used to determine the rate of change of the diphthong
trajectory. Because it is measuring a speed across a distance, the term ‘slope’ used here differs
from the conventional mathematical term used to describe the direction and steepness of a line
(∆y / ∆x), which can be a positive or negative number. Despite this difference, the term ‘slope’ is
used in this study as it is an established convention in previous work on diphthong phonetics. It
is necessary, therefore, to think of ‘slope’ in terms of measuring distance through time (in three
dimensions: F1, F2, time), rather than as a measurement of the gradient of a line (in two
dimensions: x, y).
The slope equation, provided in Equation 2, uses the equation for the Euclidean distance
divided by the trajectory duration (in ms). By using the Euclidean distance, this equation yields
only positive values; this necessarily treats rising and falling diphthongs equally.
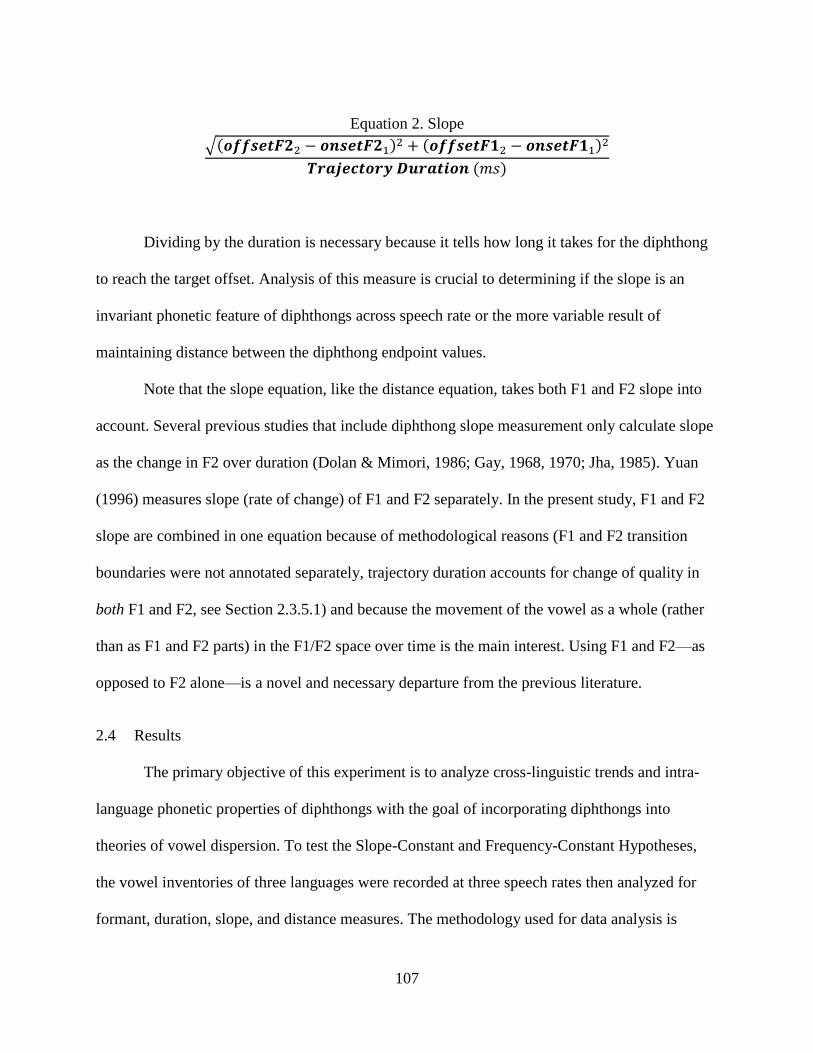
107
Equation 2. Slope
√(𝒐𝒇𝒇𝒔𝒆𝒕𝑭𝟐2 − 𝒐𝒏𝒔𝒆𝒕𝑭𝟐1)2 + (𝒐𝒇𝒇𝒔𝒆𝒕𝑭𝟏2 − 𝒐𝒏𝒔𝒆𝒕𝑭𝟏1)2
𝑻𝒓𝒂𝒋𝒆𝒄𝒕𝒐𝒓𝒚 𝑫𝒖𝒓𝒂𝒕𝒊𝒐𝒏 (𝑚𝑠)
Dividing by the duration is necessary because it tells how long it takes for the diphthong
to reach the target offset. Analysis of this measure is crucial to determining if the slope is an
invariant phonetic feature of diphthongs across speech rate or the more variable result of
maintaining distance between the diphthong endpoint values.
Note that the slope equation, like the distance equation, takes both F1 and F2 slope into
account. Several previous studies that include diphthong slope measurement only calculate slope
as the change in F2 over duration (Dolan & Mimori, 1986; Gay, 1968, 1970; Jha, 1985). Yuan
(1996) measures slope (rate of change) of F1 and F2 separately. In the present study, F1 and F2
slope are combined in one equation because of methodological reasons (F1 and F2 transition
boundaries were not annotated separately, trajectory duration accounts for change of quality in
both F1 and F2, see Section 2.3.5.1) and because the movement of the vowel as a whole (rather
than as F1 and F2 parts) in the F1/F2 space over time is the main interest. Using F1 and F2—as
opposed to F2 alone—is a novel and necessary departure from the previous literature.
2.4 Results
The primary objective of this experiment is to analyze cross-linguistic trends and intra-
language phonetic properties of diphthongs with the goal of incorporating diphthongs into
theories of vowel dispersion. To test the Slope-Constant and Frequency-Constant Hypotheses,
the vowel inventories of three languages were recorded at three speech rates then analyzed for
formant, duration, slope, and distance measures. The methodology used for data analysis is
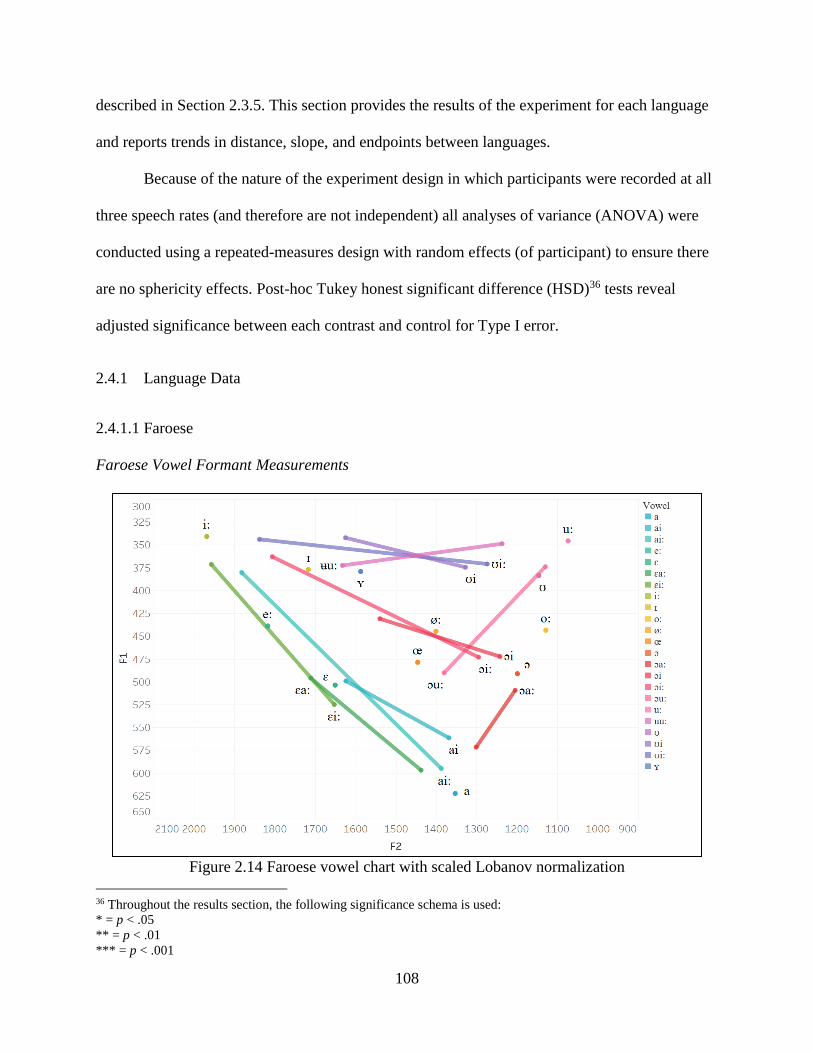
108
described in Section 2.3.5. This section provides the results of the experiment for each language
and reports trends in distance, slope, and endpoints between languages.
Because of the nature of the experiment design in which participants were recorded at all
three speech rates (and therefore are not independent) all analyses of variance (ANOVA) were
conducted using a repeated-measures design with random effects (of participant) to ensure there
are no sphericity effects. Post-hoc Tukey honest significant difference (HSD)36 tests reveal
adjusted significance between each contrast and control for Type I error.
2.4.1 Language Data
2.4.1.1 Faroese
Faroese Vowel Formant Measurements
Figure 2.14 Faroese vowel chart with scaled Lobanov normalization
36 Throughout the results section, the following significance schema is used:
* = p < .05
** = p < .01
*** = p < .001

109
The vowel chart in Figure 2.14 shows the averaged, Lobanov normalized Faroese
monophthongs and diphthongs (n = 23) from all three speech rates. Consistent with previous
literature on diphthong endpoint targets, the Faroese diphthong onsets and offsets do not entirely
align with their closest monophthong counterparts, but the trajectories of the diphthongs appear
to be moving toward these peripheral targets. Short diphthongs [ʊi, ai, ɔi] have notably shorter
distance trajectories than their corresponding long diphthongs. For all three diphthongs with a
length contrast, it appears that the onset vowels are relatively similar to the monophthongs,
although the onsets of the short diphthongs show some undershoot when compared with the long
diphthongs. The endpoints of the short diphthongs terminate about halfway along the long
diphthongs’ trajectories. This may be due to the extremely short duration of these short
diphthongs; as seen in Figure 2.15, these short diphthongs are about half the duration of all other
diphthongs at all speech rates. The phonetic difference in onset and offset targets between the
short and long diphthongs may serve as perceptual cue to their identity in addition to their
difference in length.
Table 2.4 provides the formant means for monophthongs (V1) and diphthongs (onset V1
and offset V2). These data are the scaled Lobanov means from all speakers (n = 12) at all speech
rates (fast, normal, slow).
Table 2.4 Faroese formant means averaged across speech rates (scaled Lobanov normalized)
V1 V2
F1 F2 F1 F2
[i:] 340.649 1968.74
[ɪ] 376.89 1717.33
[ʏ] 379.033 1587.52
[e:] 438.755 1817.69
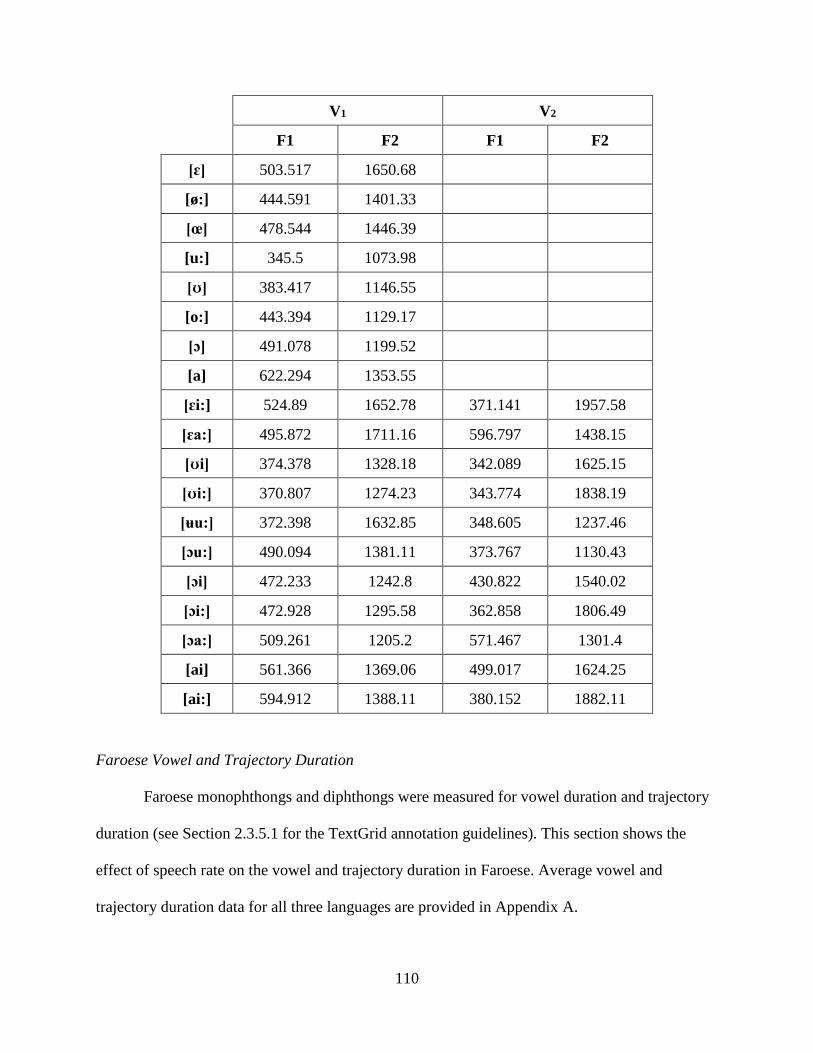
110
V1 V2
F1 F2 F1 F2
[ɛ] 503.517 1650.68
[ø:] 444.591 1401.33
[œ] 478.544 1446.39
[u:] 345.5 1073.98
[ʊ] 383.417 1146.55
[o:] 443.394 1129.17
[ɔ] 491.078 1199.52
[a] 622.294 1353.55
[ɛi:] 524.89 1652.78 371.141 1957.58
[ɛa:] 495.872 1711.16 596.797 1438.15
[ʊi] 374.378 1328.18 342.089 1625.15
[ʊi:] 370.807 1274.23 343.774 1838.19
[ʉu:] 372.398 1632.85 348.605 1237.46
[ɔu:] 490.094 1381.11 373.767 1130.43
[ɔi] 472.233 1242.8 430.822 1540.02
[ɔi:] 472.928 1295.58 362.858 1806.49
[ɔa:] 509.261 1205.2 571.467 1301.4
[ai] 561.366 1369.06 499.017 1624.25
[ai:] 594.912 1388.11 380.152 1882.11
Faroese Vowel and Trajectory Duration
Faroese monophthongs and diphthongs were measured for vowel duration and trajectory
duration (see Section 2.3.5.1 for the TextGrid annotation guidelines). This section shows the
effect of speech rate on the vowel and trajectory duration in Faroese. Average vowel and
trajectory duration data for all three languages are provided in Appendix A.
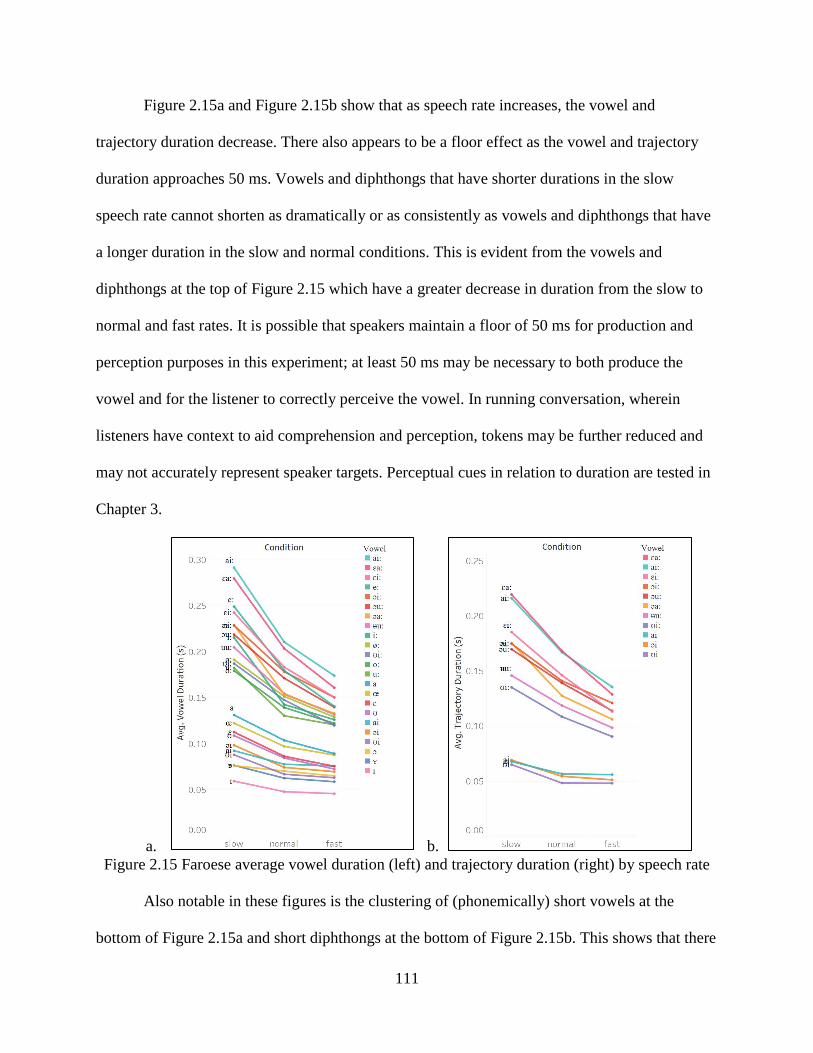
111
Figure 2.15a and Figure 2.15b show that as speech rate increases, the vowel and
trajectory duration decrease. There also appears to be a floor effect as the vowel and trajectory
duration approaches 50 ms. Vowels and diphthongs that have shorter durations in the slow
speech rate cannot shorten as dramatically or as consistently as vowels and diphthongs that have
a longer duration in the slow and normal conditions. This is evident from the vowels and
diphthongs at the top of Figure 2.15 which have a greater decrease in duration from the slow to
normal and fast rates. It is possible that speakers maintain a floor of 50 ms for production and
perception purposes in this experiment; at least 50 ms may be necessary to both produce the
vowel and for the listener to correctly perceive the vowel. In running conversation, wherein
listeners have context to aid comprehension and perception, tokens may be further reduced and
may not accurately represent speaker targets. Perceptual cues in relation to duration are tested in
Chapter 3.
a. b.
Figure 2.15 Faroese average vowel duration (left) and trajectory duration (right) by speech rate
Also notable in these figures is the clustering of (phonemically) short vowels at the
bottom of Figure 2.15a and short diphthongs at the bottom of Figure 2.15b. This shows that there
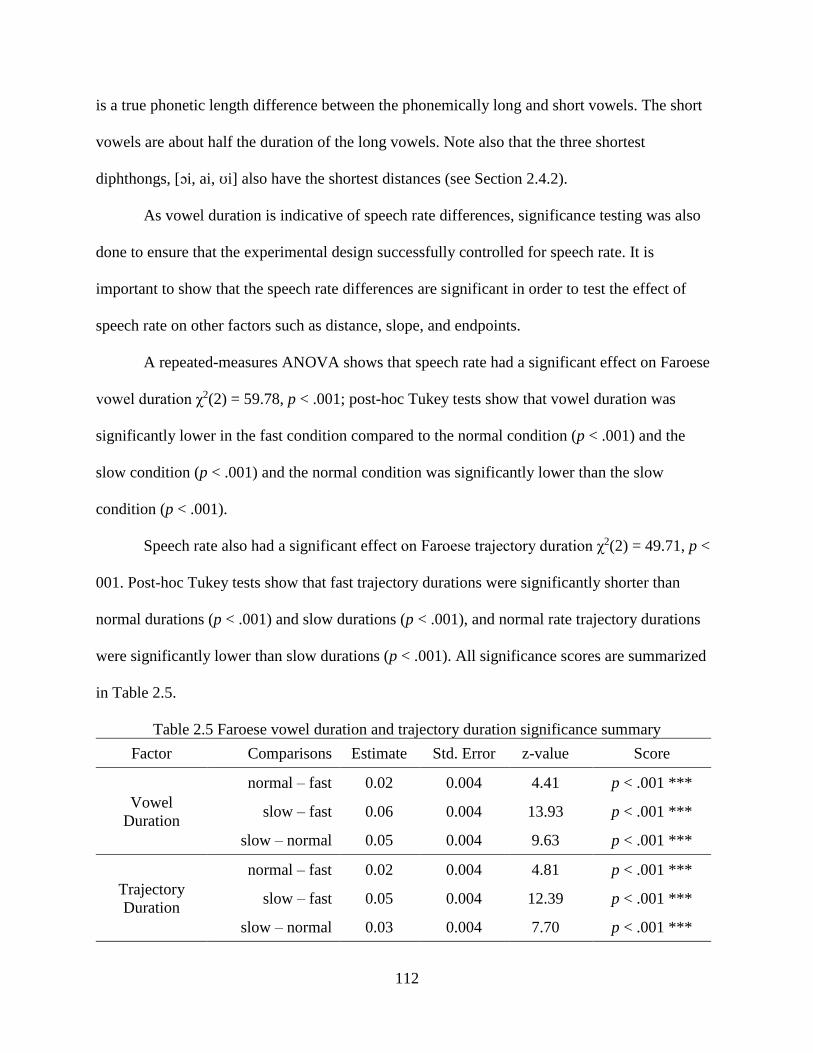
112
is a true phonetic length difference between the phonemically long and short vowels. The short
vowels are about half the duration of the long vowels. Note also that the three shortest
diphthongs, [ɔi, ai, ʊi] also have the shortest distances (see Section 2.4.2).
As vowel duration is indicative of speech rate differences, significance testing was also
done to ensure that the experimental design successfully controlled for speech rate. It is
important to show that the speech rate differences are significant in order to test the effect of
speech rate on other factors such as distance, slope, and endpoints.
A repeated-measures ANOVA shows that speech rate had a significant effect on Faroese
vowel duration χ2(2) = 59.78, p < .001; post-hoc Tukey tests show that vowel duration was
significantly lower in the fast condition compared to the normal condition (p < .001) and the
slow condition (p < .001) and the normal condition was significantly lower than the slow
condition (p < .001).
Speech rate also had a significant effect on Faroese trajectory duration χ2(2) = 49.71, p <
001. Post-hoc Tukey tests show that fast trajectory durations were significantly shorter than
normal durations (p < .001) and slow durations (p < .001), and normal rate trajectory durations
were significantly lower than slow durations (p < .001). All significance scores are summarized
in Table 2.5.
Table 2.5 Faroese vowel duration and trajectory duration significance summary
Factor Comparisons Estimate Std. Error z-value Score
Vowel
Duration
normal – fast 0.02 0.004 4.41 p < .001 ***
slow – fast 0.06 0.004 13.93 p < .001 ***
slow – normal 0.05 0.004 9.63 p < .001 ***
Trajectory
Duration
normal – fast 0.02 0.004 4.81 p < .001 ***
slow – fast 0.05 0.004 12.39 p < .001 ***
slow – normal 0.03 0.004 7.70 p < .001 ***

113
To further demonstrate differences in speech rate on Faroese vowel production, Figure
2.16 shows a comparison of all Faroese vowels at difference speech rates in the same vowel
space. This figure shows how there is a shrinking of the vowel space in the faster speech rates.
The red (slow) vowels occur further from the center and the green (fast) vowels tend to be more
centralized and higher.
2.4.1.2 Vietnamese
Vietnamese Vowel Formant Measurements
The vowel chart in Figure 2.17 shows the averaged, Lobanov normalized monophthongs,
diphthongs, and triphthongs of Vietnamese from all three speech rates. Vietnamese has the
greatest number of vowels (n = 33, including triphthongs) of the three languages tested. With
such a large inventory, Vietnamese makes use of the entire vowel space, including central
Figure 2.16 Faroese vowels by speech rate
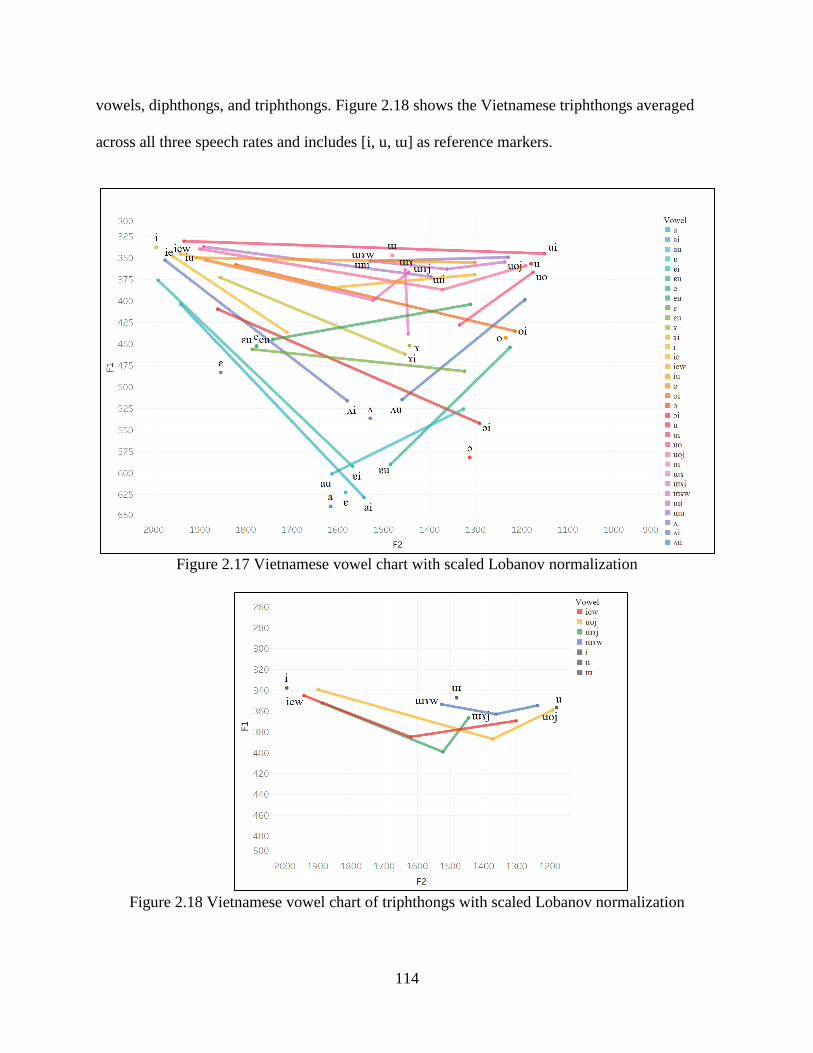
114
vowels, diphthongs, and triphthongs. Figure 2.18 shows the Vietnamese triphthongs averaged
across all three speech rates and includes [i, u, ɯ] as reference markers.
Figure 2.17 Vietnamese vowel chart with scaled Lobanov normalization
Figure 2.18 Vietnamese vowel chart of triphthongs with scaled Lobanov normalization
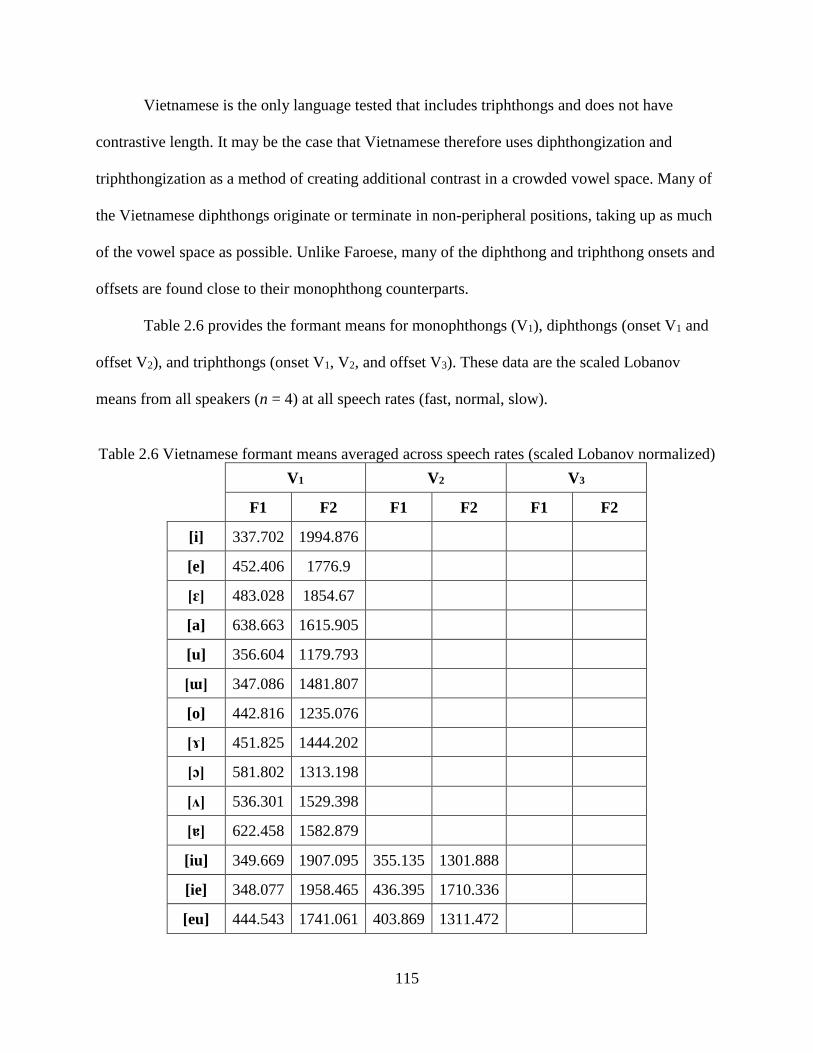
115
Vietnamese is the only language tested that includes triphthongs and does not have
contrastive length. It may be the case that Vietnamese therefore uses diphthongization and
triphthongization as a method of creating additional contrast in a crowded vowel space. Many of
the Vietnamese diphthongs originate or terminate in non-peripheral positions, taking up as much
of the vowel space as possible. Unlike Faroese, many of the diphthong and triphthong onsets and
offsets are found close to their monophthong counterparts.
Table 2.6 provides the formant means for monophthongs (V1), diphthongs (onset V1 and
offset V2), and triphthongs (onset V1, V2, and offset V3). These data are the scaled Lobanov
means from all speakers (n = 4) at all speech rates (fast, normal, slow).
Table 2.6 Vietnamese formant means averaged across speech rates (scaled Lobanov normalized)
V1 V2 V3
F1 F2 F1 F2 F1 F2
[i] 337.702 1994.876
[e] 452.406 1776.9
[ɛ] 483.028 1854.67
[a] 638.663 1615.905
[u] 356.604 1179.793
[ɯ] 347.086 1481.807
[o] 442.816 1235.076
[ɤ] 451.825 1444.202
[ɔ] 581.802 1313.198
[ʌ] 536.301 1529.398
[ɐ] 622.458 1582.879
[iu] 349.669 1907.095 355.135 1301.888
[ie] 348.077 1958.465 436.395 1710.336
[eu] 444.543 1741.061 403.869 1311.472
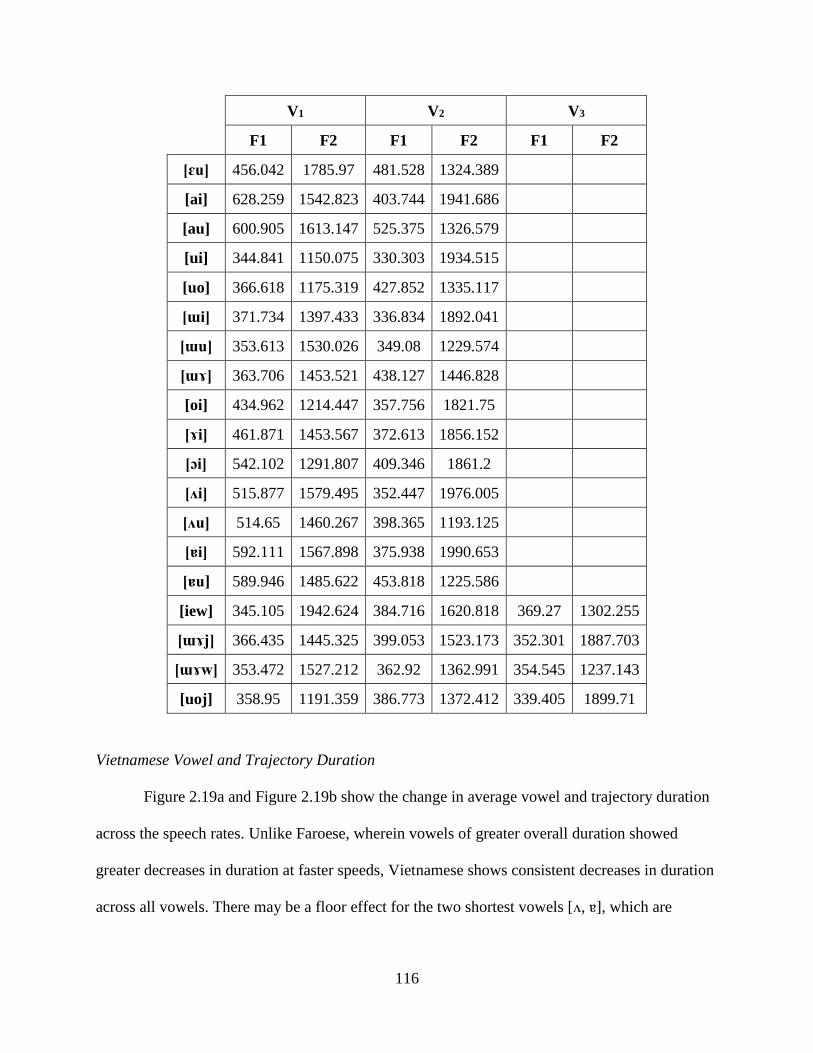
116
V1 V2 V3
F1 F2 F1 F2 F1 F2
[ɛu] 456.042 1785.97 481.528 1324.389
[ai] 628.259 1542.823 403.744 1941.686
[au] 600.905 1613.147 525.375 1326.579
[ui] 344.841 1150.075 330.303 1934.515
[uo] 366.618 1175.319 427.852 1335.117
[ɯi] 371.734 1397.433 336.834 1892.041
[ɯu] 353.613 1530.026 349.08 1229.574
[ɯɤ] 363.706 1453.521 438.127 1446.828
[oi] 434.962 1214.447 357.756 1821.75
[ɤi] 461.871 1453.567 372.613 1856.152
[ɔi] 542.102 1291.807 409.346 1861.2
[ʌi] 515.877 1579.495 352.447 1976.005
[ʌu] 514.65 1460.267 398.365 1193.125
[ɐi] 592.111 1567.898 375.938 1990.653
[ɐu] 589.946 1485.622 453.818 1225.586
[iew] 345.105 1942.624 384.716 1620.818 369.27 1302.255
[ɯɤj] 366.435 1445.325 399.053 1523.173 352.301 1887.703
[ɯɤw] 353.472 1527.212 362.92 1362.991 354.545 1237.143
[uoj] 358.95 1191.359 386.773 1372.412 339.405 1899.71
Vietnamese Vowel and Trajectory Duration
Figure 2.19a and Figure 2.19b show the change in average vowel and trajectory duration
across the speech rates. Unlike Faroese, wherein vowels of greater overall duration showed
greater decreases in duration at faster speeds, Vietnamese shows consistent decreases in duration
across all vowels. There may be a floor effect for the two shortest vowels [ʌ, ɐ], which are
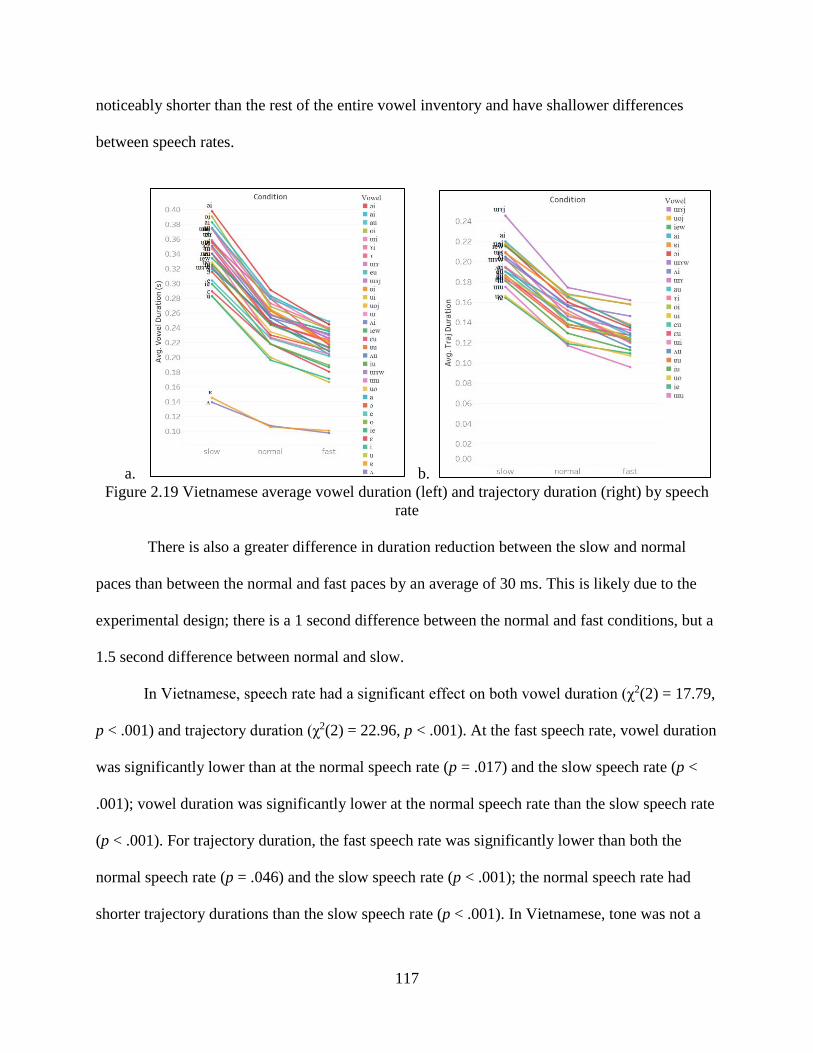
117
noticeably shorter than the rest of the entire vowel inventory and have shallower differences
between speech rates.
a. b.
Figure 2.19 Vietnamese average vowel duration (left) and trajectory duration (right) by speech
rate
There is also a greater difference in duration reduction between the slow and normal
paces than between the normal and fast paces by an average of 30 ms. This is likely due to the
experimental design; there is a 1 second difference between the normal and fast conditions, but a
1.5 second difference between normal and slow.
In Vietnamese, speech rate had a significant effect on both vowel duration (χ2(2) = 17.79,
p < .001) and trajectory duration (χ2(2) = 22.96, p < .001). At the fast speech rate, vowel duration
was significantly lower than at the normal speech rate (p = .017) and the slow speech rate (p <
.001); vowel duration was significantly lower at the normal speech rate than the slow speech rate
(p < .001). For trajectory duration, the fast speech rate was significantly lower than both the
normal speech rate (p = .046) and the slow speech rate (p < .001); the normal speech rate had
shorter trajectory durations than the slow speech rate (p < .001). In Vietnamese, tone was not a

118
significant predictor of vowel duration (p = .46) or trajectory duration (p = .63). Table 2.7
provides a summary of the results.
Table 2.7 Vietnamese vowel duration and trajectory duration significance summary
Factor Comparisons Estimate Std. Error z-value Score
Vowel
Duration
normal – fast 0.03 0.01 2.74 p = .017 *
slow – fast 0.12 0.01 10.56 p < .001 ***
slow – normal 0.09 0.01 7.83 p < .001 ***
Trajectory
Duration
normal – fast 0.02 0.009 2.37 p = .047 *
slow – fast 0.07 0.009 7.80 p < .001 ***
slow – normal 0.05 0.009 5.43 p < .001 ***
As in Faroese, Vietnamese also shows a shrinking of the vowel space with increases in
speech rate. This is shown in Figure 2.20; the green (fast) vowels are closer to the center of the
vowel space and the red (slow) vowels are lining the extremities of the vowel space.
Figure 2.20 Vietnamese vowels by speech rate
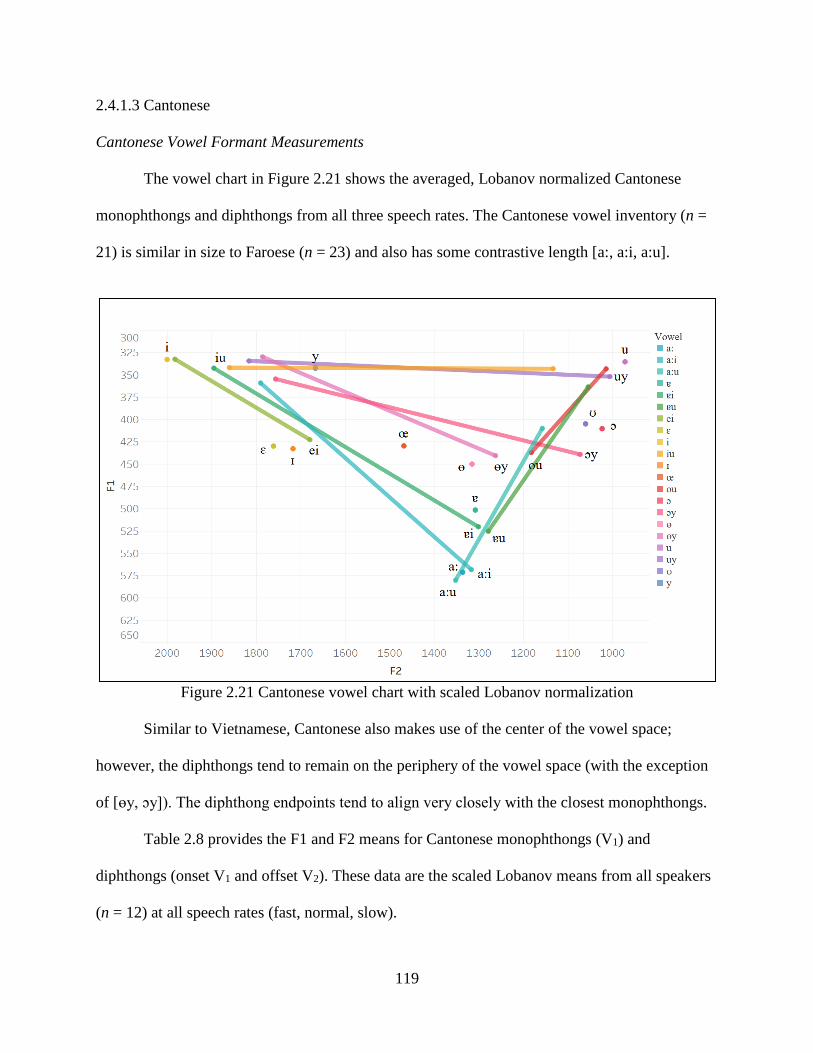
119
2.4.1.3 Cantonese
Cantonese Vowel Formant Measurements
The vowel chart in Figure 2.21 shows the averaged, Lobanov normalized Cantonese
monophthongs and diphthongs from all three speech rates. The Cantonese vowel inventory (n =
21) is similar in size to Faroese (n = 23) and also has some contrastive length [a:, a:i, a:u].
Figure 2.21 Cantonese vowel chart with scaled Lobanov normalization
Similar to Vietnamese, Cantonese also makes use of the center of the vowel space;
however, the diphthongs tend to remain on the periphery of the vowel space (with the exception
of [ɵy, ɔy]). The diphthong endpoints tend to align very closely with the closest monophthongs.
Table 2.8 provides the F1 and F2 means for Cantonese monophthongs (V1) and
diphthongs (onset V1 and offset V2). These data are the scaled Lobanov means from all speakers
(n = 12) at all speech rates (fast, normal, slow).
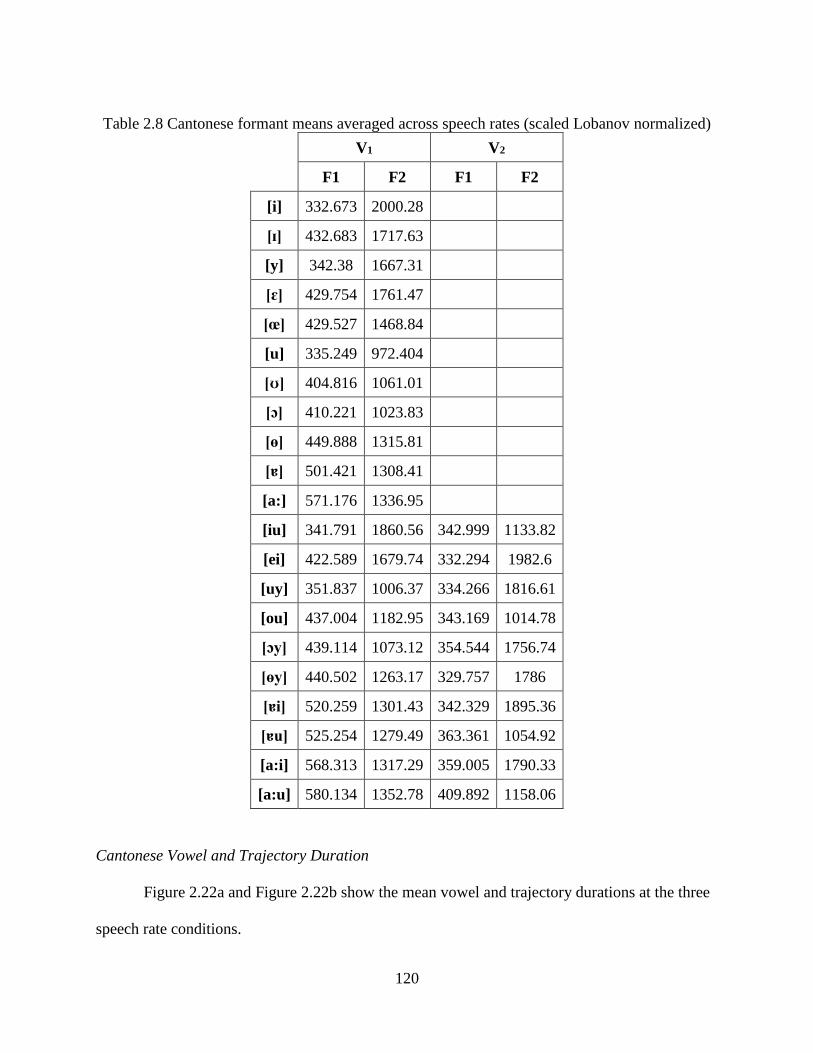
120
Table 2.8 Cantonese formant means averaged across speech rates (scaled Lobanov normalized)
V1 V2
F1 F2 F1 F2
[i] 332.673 2000.28
[ɪ] 432.683 1717.63
[y] 342.38 1667.31
[ɛ] 429.754 1761.47
[œ] 429.527 1468.84
[u] 335.249 972.404
[ʊ] 404.816 1061.01
[ɔ] 410.221 1023.83
[ɵ] 449.888 1315.81
[ɐ] 501.421 1308.41
[a:] 571.176 1336.95
[iu] 341.791 1860.56 342.999 1133.82
[ei] 422.589 1679.74 332.294 1982.6
[uy] 351.837 1006.37 334.266 1816.61
[ou] 437.004 1182.95 343.169 1014.78
[ɔy] 439.114 1073.12 354.544 1756.74
[ɵy] 440.502 1263.17 329.757 1786
[ɐi] 520.259 1301.43 342.329 1895.36
[ɐu] 525.254 1279.49 363.361 1054.92
[a:i] 568.313 1317.29 359.005 1790.33
[a:u] 580.134 1352.78 409.892 1158.06
Cantonese Vowel and Trajectory Duration
Figure 2.22a and Figure 2.22b show the mean vowel and trajectory durations at the three
speech rate conditions.

121
a. b.
Figure 2.22 Cantonese average vowel duration (left) and trajectory duration (right) by speech
rate
Like Vietnamese, Cantonese has very consistent rates of duration change between the
speech rates across the vowels with the exception of a set of short vowels at the bottom of the
figure [ʊ, ɪ¸ ɵ, ɐ]. These short vowels appear to exhibit a floor effect around .075 s.
Cantonese is also similar to Vietnamese in that there is a larger difference in durations
between the slow and normal rate than between the normal and fast rates by an average of 33 ms.
It is likely the experimental design contributed to these differences.
Speech rate had a significant effect on vowel duration in Cantonese, χ2(2) = 46.72, p <
.001. Post-hoc Tukey tests show that vowel duration is significantly shorter in the fast speech
rate than the normal speech rate (p = .002) and the slow speech rate (p < .001); vowel duration is
also significantly shorter in the normal speech rate compared to the slow speech rate (p < .001).
Speech rate also has a significant effect on trajectory duration in Cantonese, χ2(2) =
51.54, p < .001. Post-hoc Tukey tests show that trajectory duration is significantly shorter in the
fast speech rate than the normal speech rate (p < .001) and the slow speech rate (p < .001);
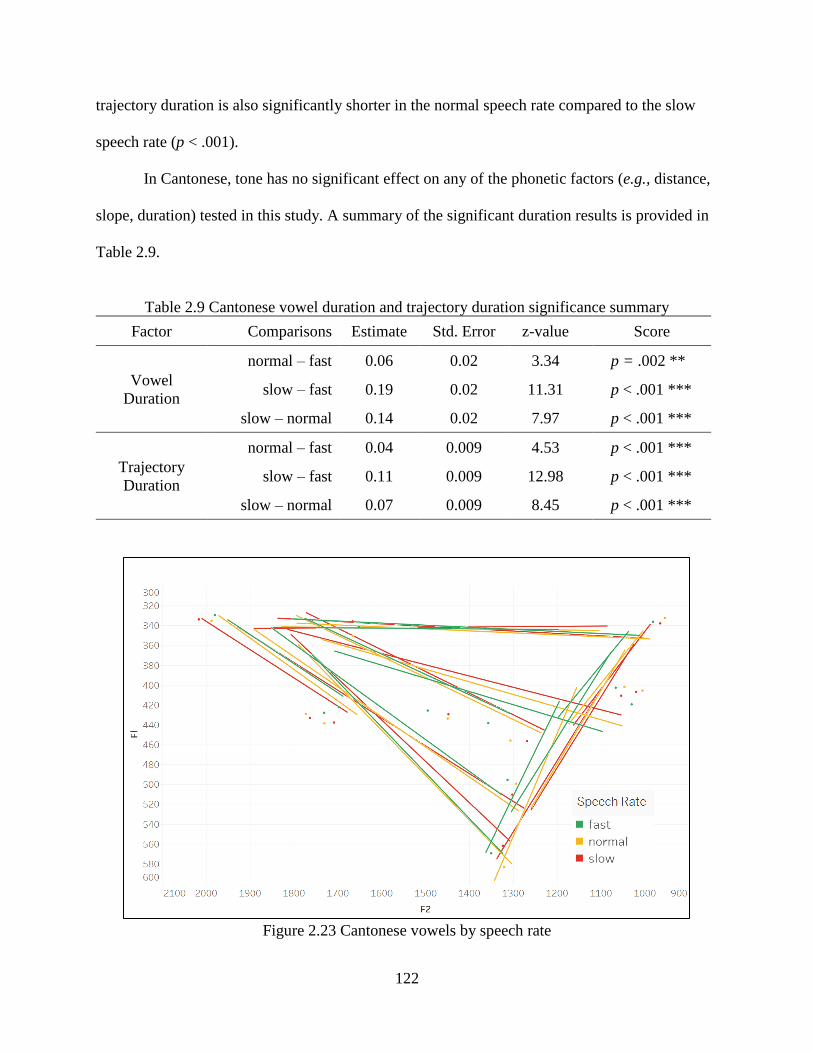
122
trajectory duration is also significantly shorter in the normal speech rate compared to the slow
speech rate (p < .001).
In Cantonese, tone has no significant effect on any of the phonetic factors (e.g., distance,
slope, duration) tested in this study. A summary of the significant duration results is provided in
Table 2.9.
Table 2.9 Cantonese vowel duration and trajectory duration significance summary
Factor Comparisons Estimate Std. Error z-value Score
Vowel
Duration
normal – fast 0.06 0.02 3.34 p = .002 **
slow – fast 0.19 0.02 11.31 p < .001 ***
slow – normal 0.14 0.02 7.97 p < .001 ***
Trajectory
Duration
normal – fast 0.04 0.009 4.53 p < .001 ***
slow – fast 0.11 0.009 12.98 p < .001 ***
slow – normal 0.07 0.009 8.45 p < .001 ***
Figure 2.23 Cantonese vowels by speech rate
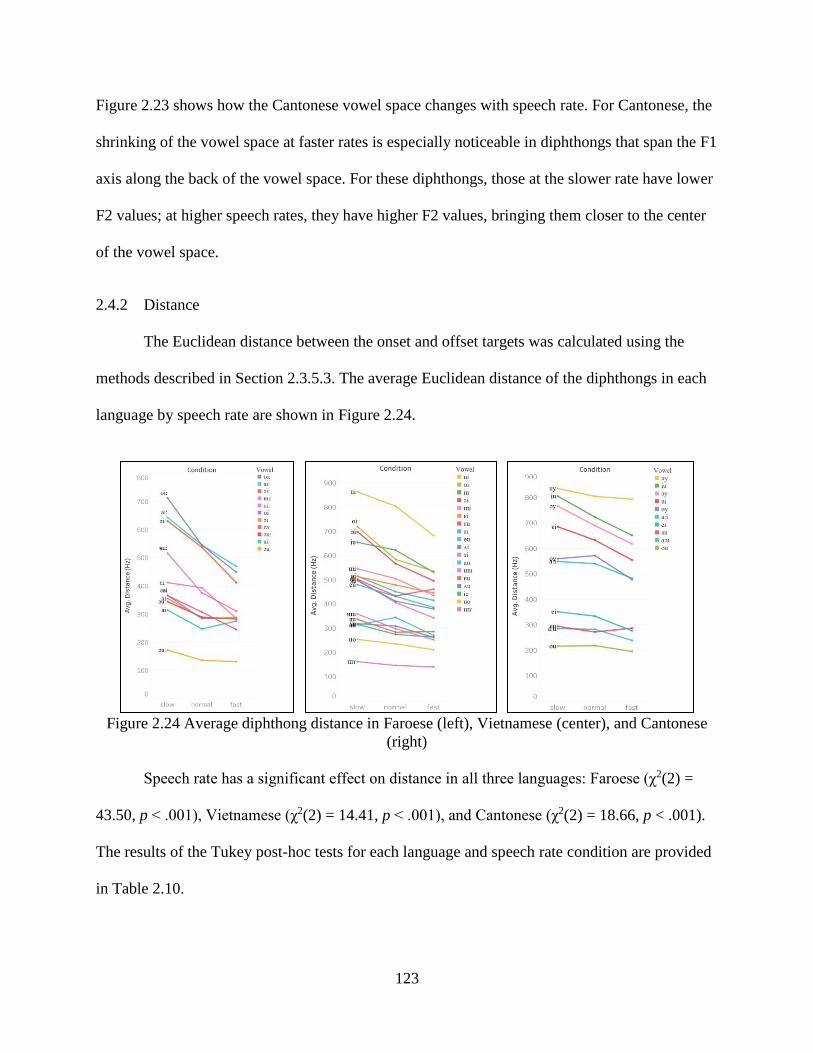
123
Figure 2.23 shows how the Cantonese vowel space changes with speech rate. For Cantonese, the
shrinking of the vowel space at faster rates is especially noticeable in diphthongs that span the F1
axis along the back of the vowel space. For these diphthongs, those at the slower rate have lower
F2 values; at higher speech rates, they have higher F2 values, bringing them closer to the center
of the vowel space.
2.4.2 Distance
The Euclidean distance between the onset and offset targets was calculated using the
methods described in Section 2.3.5.3. The average Euclidean distance of the diphthongs in each
language by speech rate are shown in Figure 2.24.
Figure 2.24 Average diphthong distance in Faroese (left), Vietnamese (center), and Cantonese
(right)
Speech rate has a significant effect on distance in all three languages: Faroese (χ2(2) =
43.50, p < .001), Vietnamese (χ2(2) = 14.41, p < .001), and Cantonese (χ2(2) = 18.66, p < .001).
The results of the Tukey post-hoc tests for each language and speech rate condition are provided
in Table 2.10.

124
Table 2.10 Distance Tukey HSD post-hoc test results
Language Comparisons Estimate Std. Error z-value Score
Faroese
normal – fast 48.05 11.60 4.14 p < .001 ***
slow – fast 129.43 11.88 10.90 p < .001 ***
slow – normal 81.38 11.91 6.83 p < .001 ***
Vietnamese
normal – fast 44.87 17.91 2.51 p = .033 *
slow – fast 96.58 17.91 5.39 p < .001 ***
slow – normal 51.71 17.89 2.89 p = .011 *
Cantonese
normal – fast 50.68 9.88 5.13 p < .001 ***
slow – fast 79.98 9.86 8.11 p < .001 ***
slow – normal 29.29 9.84 2.98 p < .01 **
It is likely that the significant differences in distance between the speech rates are due to
reduction happening at the onset and/or offset positions at the faster paces, although this varies
from vowel to vowel. Although the change in distance is significant for all conditions, it is not
clear from these results whether speakers maintain diphthong onset and offset targets or are
maintaining diphthong slope across speech rates. Endpoint results are given in Section 2.4.4.
The reduction in distance across speech rates displays a similar floor trend to the
reduction in vowel and trajectory duration. Diphthongs that span more distance across the vowel
space across all three speech rates reduce their distance in the normal and fast rates more than
shorter distance diphthongs. For example, Faroese [ʊi:] has the greatest distance at the slow
speech rate and reduces in distance by 260 Hz.
These empirical findings point to two possible explanations—one perceptual and one
articulatory. First, shorter distance diphthongs may not reduce to the same extent as longer
distance diphthongs because it is necessary for speakers to maintain some minimum amount of
distance between the targets for perceptual and contrastive reasons. With too short of a distance
between the onset and offset targets, the diphthong could possibly be mistaken as a
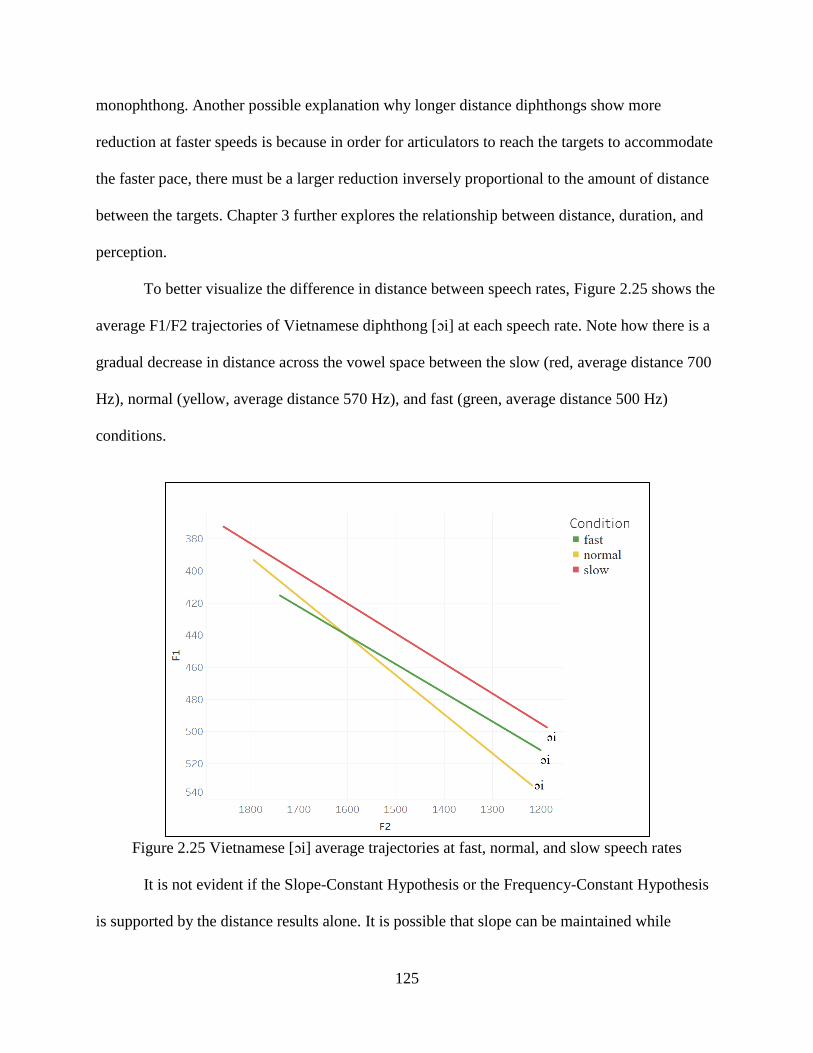
125
monophthong. Another possible explanation why longer distance diphthongs show more
reduction at faster speeds is because in order for articulators to reach the targets to accommodate
the faster pace, there must be a larger reduction inversely proportional to the amount of distance
between the targets. Chapter 3 further explores the relationship between distance, duration, and
perception.
To better visualize the difference in distance between speech rates, Figure 2.25 shows the
average F1/F2 trajectories of Vietnamese diphthong [ɔi] at each speech rate. Note how there is a
gradual decrease in distance across the vowel space between the slow (red, average distance 700
Hz), normal (yellow, average distance 570 Hz), and fast (green, average distance 500 Hz)
conditions.
Figure 2.25 Vietnamese [ɔi] average trajectories at fast, normal, and slow speech rates
It is not evident if the Slope-Constant Hypothesis or the Frequency-Constant Hypothesis
is supported by the distance results alone. It is possible that slope can be maintained while

126
distance varies, but it is also possible for the endpoints to not significantly change with changes
in distance. Sections 2.4.3 and 2.4.4 discuss the slope and endpoint results, respectively.
A Spearman’s correlation assessing the relationship between vowel duration and distance
in each language showed weak to moderate correlations between distance and vowel/trajectory
duration. In Faroese, vowel duration and distance have the strongest correlation for all three
languages (rs = .40, p < .01), and a similar correlation for trajectory duration and distance (rs =
.35, p < .01). Vietnamese and Cantonese have much weaker correlations. Vietnamese diphthong
duration has a higher correlation with distance (rs = .29, p < .01) than trajectory duration (rs =
.26, p < .01). Cantonese has the weakest correlations for vowel duration (rs = .15, p < .01) and
trajectory duration (rs = .15, p < .01).
2.4.3 Slope
The diphthong slope was calculated using Equation 2 as described in Section 2.3.5.4. The
slope is found by dividing the Euclidean distance of the diphthong by the trajectory duration. The
average slope across speech rates for each language is shown in Figure 2.26.
Figure 2.26 Average diphthong slope in Faroese (left), Vietnamese (center), and Cantonese
(right)

127
Visually, change in slope between the speech rates does not show as consistent of a trend
as change in duration or change in distance, especially in Faroese. Repeated-measures ANOVA
results show that differences in slope between speech rates is not consistent between or even
within languages. There is a significant main effect of speech rate on slope in Vietnamese (χ2(2)
= 18.76, p < .001) and Cantonese (χ2(2) = 37.55, p < .001), but no significant effect in Faroese.
In Faroese there is no significance of slope at any speech rate and there is no apparent
overall trend. Eight of the eleven diphthongs increase in slope from the slow condition to the fast
condition while three diphthongs decrease in slope.
In Vietnamese the difference between slow and fast rates is significant (p < .001) and the
difference between slow and normal rates is significant (p < .001), but the difference between the
normal and fast rates is non-significant. From the data there is a relatively consistent trend for
slope to increase with increases in speech rate. It is possible that there is a maximum slope or a
slope ceiling that Vietnamese reaches at the normal rate and does not increase further at the fast
rate.
In Cantonese, the difference in slope is significant between all speech rates: slow vs. fast
(p < .001), slow vs. normal (p < .001), normal vs. fast (p < .001). Cantonese shows a very
consistent, significant trend wherein the slope increases with increases in speech rate. Also, in
Cantonese, diphthongs with shorter slopes in the slow speech rate do not increase as much at
faster speech rates as diphthongs with larger slopes at the slow speech rate. This effect is not as
pronounced in Vietnamese and does not seem to be an effect at all in Faroese (albeit slope in
Faroese is non-significant). This may be an effect of distance because diphthongs with greater
overall slope also have the greatest distances. For example, a diphthong with a normalized
128
distance of 8 is always going to have a larger slope than a diphthong with a normalized distance
of 6 if speakers take the same amount of time to travel each (8/2 = 4 and 6/2 = 3).
A Spearman’s correlation was run to assess the relationship between slope and distance
in all three languages. There is a strong correlation between slope and distance in Faroese (rs =
.60, p < .01), Vietnamese (rs = .77, p < .01), and Cantonese (rs = .81, p < .01). It seems that
speakers plan for the amount of time they have and adjust the slope to travel the required
distance in that time. For diphthongs that have a small distance between endpoints, it does not
require as much time to reach the offset target and therefore the slope does not change as much
across speech rates. For diphthongs with a greater distance across the vowel space, speakers need
to make a much larger change in slope at faster speeds, otherwise they won’t reach the target in
the planned duration. This principle of “the further to go, the longer it takes” is supported by
Lindau et al. (1990) in their discussion of their positive correlation (r = .87) of transition duration
and acoustic distance in the vowel [ai]. One explanation behind this principle is the physical
restrictions of tongue body displacement and its rate of movement.
Within languages, there does appear to be an inverse relationship between changes in
slope and changes in distance. Faroese, which has no significant change in slope across speech
rates, has some of the most drastic changes in distance, while Cantonese has some of the most
drastic changes in slope and the least drastic changes in distance.
There are a few exceptions to the general trend that slope increases with faster speech
rates, such as the decrease in slope of Vietnamese [iu] (from normal to fast rates) and Faroese
[ʉu:], which can be seen in Figure 2.27. It appears that for these diphthongs, there is a reduction
of the slope that occurs at faster speech rate. This may be due to these diphthongs having less
change in F1, as even Faroese [ɔi:] has relatively little change in F1. However, there are also

129
many diphthongs with little change in F1 that have the opposite trend, such as Faroese [ʊi],
Vietnamese [ui], and Cantonese [iu]. The decreasing slope examples may therefore be
considered vowel-specific exceptions to the overall trend.
a. b.
Figure 2.27 Faroese [ʉu] (/sʉus/) at the slow speech rate (slope = 4.8) (left) and fast speech rate
(slope = 2.3) (right) at a 30ms window
2.4.4 Diphthong Endpoints
Diphthong onset and offset endpoints were measured at the beginning and end of the
diphthong trajectory, taking into account movement along both F1 and F2. This section analyzes
whether diphthong endpoints significantly differ across speech rate. Because of the nature of the
vowel measurements, which include Hz measures at both F1 and F2, diphthong endpoints were
analyzed by adopting techniques more commonly used in vowel merger analysis; these
techniques capture diverse aspects of vowel difference such as distance, spectral overlap, and
variance. These methods were originally designed to capture differences in vowel classes both in
terms of distance in acoustic space as well as overlap between vowel classes in acoustic space.
Vowel merger analysis techniques were chosen to analyze diphthong endpoints because they
focus on quantifying differences in realizations. Vowel classes in merger analysis are analogous
to speech rate in the present analysis; in both cases, the main interest is in determining whether
vowel realizations are members of different categories (in merger, vowel class; for diphthongs,
speech rate). In this section, diphthong onsets and offsets are analyzed to determine if there are
Fast Speech Rate Slow Speech Rate
130
significant differences in realizations at the three speech rates. Significant differences would
show that speakers are maintaining faithfulness to the diphthong slope and adjusting endpoint
positions accordingly; small differences would show that speakers are maintaining diphthong
endpoint targets with changes in speech rate.
2.4.4.1 Endpoint Regression
Using a repeated-measures ANOVA with speaker as a random factor, each dimension
(onset, offset, F1, F2) needed to be tested separately to see if speech rate significantly affected
the height or backness of the diphthong endpoints. The requirement to test each dimension
separately is one disadvantage of this method. For all 36 comparisons (4 dimensions x 3
languages x 3 speech rate comparisons), speech rate was only significant in two comparisons.
Speech rate had a significant effect on Vietnamese offset F1 (χ2(2) = 5.91, p = .05), where the
only comparison that was significant was between slow and fast (p = .019). Speech rate also had
a significant effect on Cantonese offset F1 (χ2(2) = 7.36, p = .025), where again only the slow –
fast comparison was significant (p = .014). This indicates that at the most extreme difference in
speech rate (between fast and slow), the backness of the offset endpoint is significantly affected
by speech rate in Vietnamese and Cantonese. With the exception of offset F1, these results show
an overall trend that onsets and offsets are not significantly different between speech rates.
However, overall distance is significant for all speech rates in all languages, indicating that the
non-significant differences in the individual dimensions combined do lead to significant
differences in the total distance.
2.4.4.2 Endpoint Variance
To test if the endpoint regression results were non-significant due to a high amount of
variability in the data, a coefficient of variation was calculated for each dimension (onset F1,
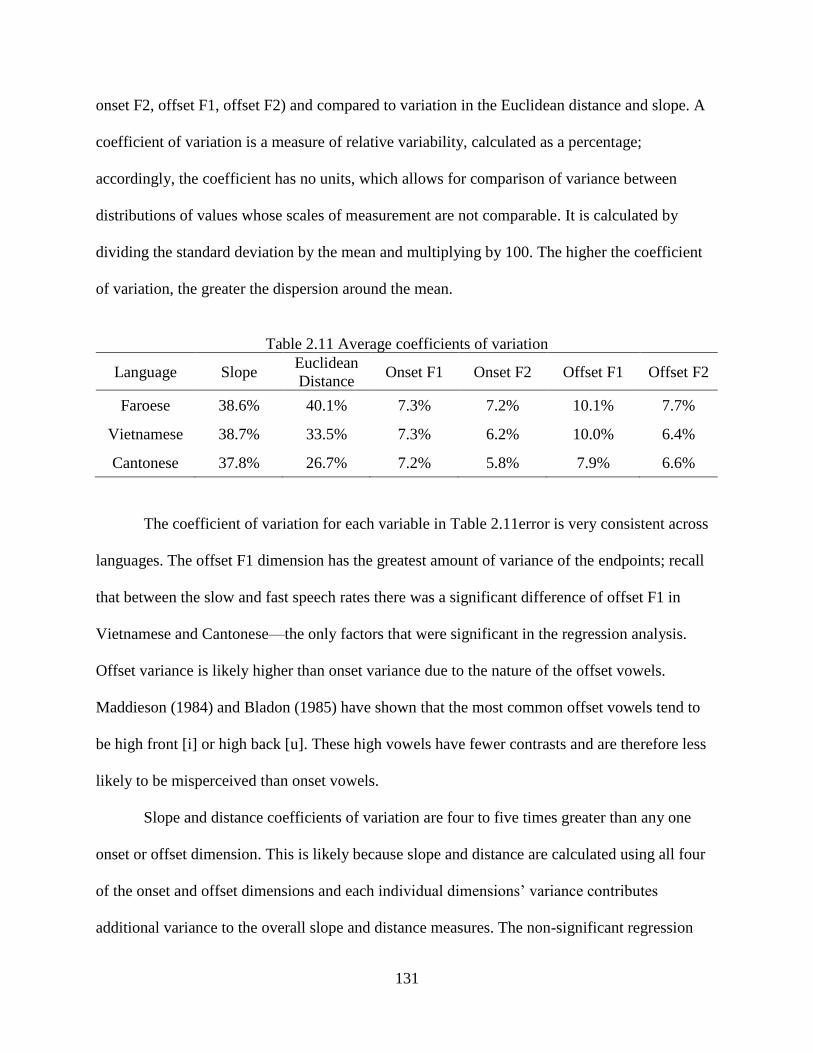
131
onset F2, offset F1, offset F2) and compared to variation in the Euclidean distance and slope. A
coefficient of variation is a measure of relative variability, calculated as a percentage;
accordingly, the coefficient has no units, which allows for comparison of variance between
distributions of values whose scales of measurement are not comparable. It is calculated by
dividing the standard deviation by the mean and multiplying by 100. The higher the coefficient
of variation, the greater the dispersion around the mean.
Table 2.11 Average coefficients of variation
Language Slope Euclidean
Distance Onset F1 Onset F2 Offset F1 Offset F2
Faroese 38.6% 40.1% 7.3% 7.2% 10.1% 7.7%
Vietnamese 38.7% 33.5% 7.3% 6.2% 10.0% 6.4%
Cantonese 37.8% 26.7% 7.2% 5.8% 7.9% 6.6%
The coefficient of variation for each variable in Table 2.11error is very consistent across
languages. The offset F1 dimension has the greatest amount of variance of the endpoints; recall
that between the slow and fast speech rates there was a significant difference of offset F1 in
Vietnamese and Cantonese—the only factors that were significant in the regression analysis.
Offset variance is likely higher than onset variance due to the nature of the offset vowels.
Maddieson (1984) and Bladon (1985) have shown that the most common offset vowels tend to
be high front [i] or high back [u]. These high vowels have fewer contrasts and are therefore less
likely to be misperceived than onset vowels.
Slope and distance coefficients of variation are four to five times greater than any one
onset or offset dimension. This is likely because slope and distance are calculated using all four
of the onset and offset dimensions and each individual dimensions’ variance contributes
additional variance to the overall slope and distance measures. The non-significant regression

132
results are therefore not likely the result of large amounts of variance in the endpoint data, as the
coefficient of variation of distance is much higher, and yet regression analysis shows distance is
significantly different across speech rates in all three languages. These results indicate that
smaller, non-significant differences in the onset F1, onset F2, offset F1, and offset F2 compound
and lead to significant differences in overall distance. It also shows that endpoints targets are
reasonably stable within the vowel space and do not disperse widely from their means, indicating
that speakers are maintaining vowel targets rather than maintaining diphthong slope trajectories.
2.4.4.3 Spectral Overlap: Pillai Score
One method of measuring differences between the endpoints at different speech rates can
be adopted from literature that seeks to measure spectral overlap in determining vowel merger
(Hall-Lew, 2009; Hay, Warren, & Drager, 2006; Nycz & Hall-Lew, 2014; Wong & Hall-Lew,
2014). If vowels at different speech rates are treated in the same way as vowels of different word
classes, it is possible to measure the overlap of the endpoints at different speech rates. This will
help determine if speakers are maintaining or moving their endpoints at different speech rates.
The Pillai score is a statistical output of multivariate analysis of variance (MANOVA), a model
which predicts variation of more than one outcome variable, such as F1 and F2. The Pillai score
is an abstract distance score ranging from 0 to 1 that indicates the difference between two
distributions (such as WORD CLASS X and WORD CLASS Y, or in this case, FAST RATE and SLOW
RATE) from the dependent outcome variables. A score of 0 indicates no difference between the
distributions and a score of 1 indicates no similarities; the MANOVA also generates a p value,
which indicates whether the difference of the Pillai scores for the distributions is significant.

133
Diphthong Results
The results of the Pillai score analysis are given in Table 2.12, Table 2.13, and Table
2.14. For each diphthong in each language tested, the results show the Pillai score, p value, and
significance rating for the onset and offset at each speech rate contrast.
Table 2.12 Faroese diphthong Pillai scores
Faroese
Onset Offset normal-fast normal-slow fast-slow normal-fast normal-slow fast-slow
Pillai Pr
(>F) Pillai
Pr
(>F) Pillai
Pr
(>F) Pillai
Pr
(>F) Pillai
Pr
(>F) Pillai
Pr
(>F)
ai .01 .698 .04 .331 .08 .106 .04 .319 .04 .334 .00 .998
ai: .06 .173 .01 .782 .08 .124 .19 .004 ** .29 .000 *** .45 .000 ***
ɛa: .08 .104 .10 .072 .23 .001 ** .12 .034 * .06 .194 .28 .000 ***
ɛi: .03 .420 .02 .645 .06 .192 .26 .000 *** .14 .024 * .35 .000 ***
ɔa: .03 .441 .07 .143 .12 .035 * .03 .470 .04 .331 .09 .078
ɔi .11 .050 .05 .261 .16 .013 * .01 .873 .01 .728 .00 .883
ɔi: .18 .005 ** .10 .058 .26 .000 *** .23 .001 *** .12 .031 * .41 .000 ***
ɔu: .13 .020 * .01 .844 .10 .069 .09 .070 .08 .141 .22 .002 **
ʊi .03 .606 .03 .678 .08 .297 .02 .764 .01 .905 .01 .800
ʊi: .10 .052 .15 .012 * .24 .001 *** .06 .178 .36 .000 *** .49 .000 ***
ʉu: .11 .041 * .13 .032 * .10 .061 .07 .155 .41 .000 *** .51 .000 ***
Table 2.13 Cantonese diphthong Pillai scores
Cantonese
Onset Offset normal-fast normal-slow fast-slow normal-fast normal-slow fast-slow
Pillai Pr
(>F) Pillai
Pr
(>F) Pillai
Pr
(>F) Pillai
Pr
(>F) Pillai
Pr
(>F) Pillai
Pr
(>F)
a:i .05 .267 .07 .138 .05 .224 .11 .049 * .07 .138 .15 0.010 *
a:u .15 .010 * .12 .025 * .09 .071 .14 .018 * .12 .025 * .50 0.000 ***
ɐi .11 .030 * .08 .101 .17 .004 ** .10 .044 * .08 .101 .14 0.012 *
ɐu .05 .142 .02 .442 .10 .018 * .02 .393 .02 .442 .14 0.003 **
ei .13 .021 * .00 .907 .13 .019 * .07 .122 .00 .907 .12 0.026 *
iu .00 .964 .05 .200 .03 .363 .21 .001 ** .05 .200 .34 0.000 ***
ou .03 .459 .03 .385 .11 .035 * .03 .447 .03 .385 .20 0.002 **
ɔy .12 .004 ** .05 .110 .20 .000 *** .09 .022 * .05 .110 .27 0.000 ***
ɵy .28 .000 *** .05 .226 .35 .000 *** .06 .193 .05 .226 .03 0.430
uy .03 .602 .00 .981 .03 .567 .03 .609 .00 .981 .06 0.362

134
Table 2.14 Vietnamese diphthong Pillai scores
Vietnamese
Onset Offset normal-fast normal-slow fast-slow normal-fast normal-slow fast-slow
Pillai Pr
(>F) Pillai
Pr
(>F) Pillai
Pr
(>F) Pillai
Pr
(>F) Pillai
Pr
(>F) Pillai
Pr
(>F)
ai .02 .636 .02 .506 .07 .114 .08 .093 .09 .067 .19 .002 **
ɐi .12 .225 .15 .123 .15 .148 .00 .994 .52 .000 *** .33 .008 **
au .07 .126 .01 .683 .01 .746 .10 .041 * .03 .393 .07 .125
ɐu .23 .005 ** .07 .236 .16 .027 * .16 .030 * .04 .438 .24 .003 **
eu .05 .353 .04 .454 .01 .751 .08 .191 .15 .032 * .28 .001 ***
ɛu .02 .620 .04 .447 .00 .912 .01 .765 .07 .216 .14 .041 *
ie .10 .106 .04 .466 .06 .289 .03 .476 .05 .323 .12 .064
iu .23 .005 ** .02 .662 .11 .094 .08 .171 .19 .013 * .29 .001 ***
ɯi .00 .985 .16 .025 * .12 .065 .32 .000 *** .05 .319 .16 .025 *
ɯu .10 .053 .13 .020 * .26 .000 *** .11 .043 * .05 .245 .12 .028 *
ɯɤ .01 .901 .14 .048 * .15 .043 * .00 .977 .08 .202 .11 .087
oi .12 .061 .05 .333 .21 .008 ** .06 .251 .20 .008 ** .27 .001 **
ɔi .07 .198 .33 .000 *** .24 .003 ** .17 .019 * .21 .007 ** .49 .000 ***
ui .12 .061 .04 .448 .21 .008 ** .13 .056 .10 .102 .31 .000 ***
uo .02 .595 .07 .133 .09 .062 .09 .071 .00 .999 .08 .080
ʌi .01 .845 .23 .004 ** .21 .007 ** .16 .027 * .27 .001 ** .40 .000 ***
ʌu .02 .717 .08 .201 .13 .054 .28 .001 ** .16 .030 * .46 .000 ***
ɤi .08 .186 .20 .009 ** .15 .032 * .08 .179 .12 .074 .29 .001 ***
The greatest differences occur in distributions of onsets and offsets between the slow and
fast rates, as these are the most extreme speech rates tested. For all languages, offsets have the
most differences by an average of 16%. This may be due to the nature of the location of the
offset vowels in the vowel space. As mentioned in Section 1.4.1.1, cross-linguistically,
diphthong offsets tend to be high vowels and therefore have less competition; this larger ‘space’
leads to a greater chance of undershoot at faster speeds.
Figure 2.28 and Figure 2.29 give a visual sense of distributions with high and low Pillai
scores using two-dimensional density contour maps. Figure 2.28 shows the offset /i/ in Faroese
/ai:/ at the fast and slow speech rates. This distribution has a Pillai score of .45 and p < .001.

135
Although there is a significant difference in these distributions, there is still over 50% overlap
and the highest density points of both distributions are relatively close to each other.
Figure 2.28 Fast and slow density distribution of /i/ in Faroese /ai:/
Figure 2.29 Fast and slow density distribution of /a/ in Faroese /ai:/
Pillai score: .45
p < .001
Pillai score: .08
p = .124

136
Figure 2.29 shows the onset /a/ in the same Faroese diphthong /ai:/ at the fast and slow speech
rates. This distribution has a Pillai score of .08 and p = .124. In this example, the difference in
distributions is non-significant, and the distributions overlap almost completely.
Figure 2.30 Density distribution of /ɤ/ in Vietnamese /ɯɤ/
Figure 2.30 provides an example in which the Pillai scores at all speech rate contrasts
(fast ~ slow: Pillai = .00, p > .05; fast ~ normal: Pillai = .08, p > .05; normal ~ slow: Pillai = .11,
p > .05) are non-significant. All of the density distributions are overlapping, with a few outlying
items (these are likely due to speaker differences).

137
Figure 2.31 Density distribution of /u/ in Vietnamese /ʌu/
Figure 2.31 provides an example in which all speech rate contrasts have significant
differences in the offset /u/ of Vietnamese diphthong /ʌu/. In this figure, between the fast and
slow rate there is the greatest amount of difference, with a Pillai score of .46, p < .001. The next
greatest difference is between the fast and normal rates, with a Pillai score of .28, p = .001. There
is the least difference between the slow rate and normal rate, in which there is a large amount of
overlap, Pillai = .16, p = .030. This density contour map also shows how at the slow and normal
rates there is the least amount of variance (with combined F1 and F2 coefficients of variation of
13.6% and 12.6%, respectively)—speakers are more consistent in reaching the target offset. At
the fast rate there is the greatest amount of variance (coefficient of variation = 15.8%).
Monophthong Results
Although the diphthong Pillai score results show that there are significant differences in
the distribution of onsets and offsets at different speech rates, it is important to compare the
diphthong results to the monophthongs to see how much speech rate effects alter monophthong
targets. If monophthongs have similar rates of Pillai score distribution and significance, it shows

138
that diphthong endpoints are acting similarly to monophthong targets. The Pillai score and
significance p score of the monophthongs in Faroese, Cantonese, and Vietnamese are given in
Table 2.15, Table 2.16, and Table 2.17.
Table 2.15 Faroese monophthong Pillai scores
Faroese
normal-fast normal-slow fast-slow
Pillai Pr (>F) Pillai Pr (>F) Pillai Pr (>F)
a .29 .000 *** .09 .065 .33 .000 ***
ɛ .11 .041 * .15 .018 * .30 .000 ***
e: .28 .000 *** .15 .013 * .38 .000 ***
ɪ .10 .082 .11 .069 .31 .000 ***
i: .11 .036 * .15 .015 * .29 .000 ***
ɔ .12 .033 * .24 .001 *** .33 .000 ***
o: .20 .002 ** .46 .000 *** .54 .000 ***
œ .00 .894 .09 .083 .05 .268
ø: .04 .342 .07 .152 .17 .009 **
ʊ .15 .012 * .22 .002 ** .48 .000 ***
u: .09 .093 .14 .027 * .35 .000 ***
ʏ .01 .713 .06 .218 .01 .739
Table 2.16 Cantonese monophthong Pillai scores
Cantonese
normal-fast normal-slow fast-slow
Pillai Pr (>F) Pillai Pr (>F) Pillai Pr (>F)
ɐ .01 .704 .08 0.106 .14 .017 *
a: .08 .006 ** .06 0.019 * .07 .007 **
ɛ .28 .000 *** .04 0.309 .09 .067
i .08 .083 .03 0.451 .09 .069
ɪ .20 .002 ** .04 0.315 .06 .150
ɔ .07 .125 .00 0.978 .06 .172
œ .04 .278 .05 0.241 .05 .221
ɵ .17 .006 ** .23 0.001 *** .36 .000 ***
u .06 .188 .04 0.324 .07 .118
ʊ .00 .895 .03 0.274 .06 .091
y .05 .262 .06 0.198 .04 .356

139
Table 2.17 Vietnamese monophthong Pillai scores
Vietnamese
normal-fast normal-slow fast-slow
Pillai Pr (>F) Pillai Pr (>F) Pillai Pr (>F)
a .18 .018 * .10 .117 .12 .075
ɐ .05 .367 .14 .042 * .23 .005 **
e .02 .588 .01 .812 .02 .651
ɛ .01 .765 .14 .041 * .13 .051
i .11 .091 .03 .511 .05 .361
ɯ .05 .480 .07 .387 .11 .220
o .04 .396 .27 .001 ** .33 .000 ***
ɔ .02 .714 .26 .002 ** .25 .002 **
u .01 .765 .13 .058 .22 .005 **
ʌ .08 .160 .13 .052 .32 .000 ***
ɤ .16 .128 .13 .156 .12 .224
There are significant Pillai scores for monophthongs in all three languages, with Faroese
having the largest amount significant different distributions.
Figure 2.32 is a density plot of the fast and slow rate distributions of Faroese /o:/, which
has the highest Pillai score out of all monophthongs and diphthongs at .54, p < .001.
Figure 2.32 Density distribution of Faroese /o:/
Pillai score: .54
p < .001

140
Figure 2.33 shows an example of a monophthong that has a non-significant Pillai score.
Faroese /œ/ has an almost completely overlapping distribution at the fast and slow speech rates,
with a Pillai score of .05, p > .05.
Figure 2.33 Density distribution of Faroese /œ/
Comparing Pillai scores of diphthongs to monophthongs across all three languages, 42%
of monophthongs and 41% of diphthongs have significantly different Pillai scores. For all
languages, the average significant Pillai score of monophthongs is .21 and diphthongs is .20—a
difference of only .01. the These similarities indicate that diphthongs and monophthongs pattern
the same in terms of spectral overlap across speech rates.
2.4.5 Tone
Much work has been done to show that vowel duration is inversely related to the
approximate average F0 (Kong, 1987), although the effect of tone on duration was not found to
Pillai score: .05
p > .05

141
be significant in Cantonese or Vietnamese in the present study. However, when examining vowel
quality, tone, and duration in Vietnamese, several trends are apparent.
In Figure 2.34 and Figure 2.36, all diphthongs and triphthongs ending in [i] and [j] are in
yellow, all diphthongs and triphthongs ending in [u] and [w] are in purple, all monophthongs are
in green, and diphthongs that do not end in [i] or [u] ([ɯɤ], [uo], [ie]) are in blue. With the
exception of [ɤ], all monophthongs have a lower vowel duration in the high rising condition than
the mid level condition, while diphthongs and triphthongs tend to have longer durations with a
high rising tone.
Figure 2.34 Vietnamese tone by average vowel duration

142
Figure 2.35 Vietnamese tone by average trajectory duration
Figure 2.35 shows how diphthong trajectory durations are affected by tone type.
Following the same color scheme as Figure 2.34, diphthongs that end in [i] tend to have longer
trajectory durations with high rising tone, whereas diphthongs that end in [u] tend to have higher
trajectory durations with mid level tone. Although the overall vowel length increases for
diphthongs in the high rising condition, it appears that diphthongs ending in a high front vowel
have longer trajectory durations when they co-occur with high rising tone.
In Vietnamese, tone has a significant effect (p = .003) on distance between mid level and
high rising tones (dipping tones are excluded because there are too few tokens). On average,
Vietnamese diphthongs with high rising tones have a greater distance than diphthongs with mid
level tones.
Figure 2.36 shows that for most diphthongs, those produced with high rising tone
have a greater distance than those with mid level tone. There are some exceptions, but the overall
trend is significant. No previous work has focused exclusively on the effect of tone on diphthong
distance and slope. From the data in the present study, it appears that vowel qualities ending in
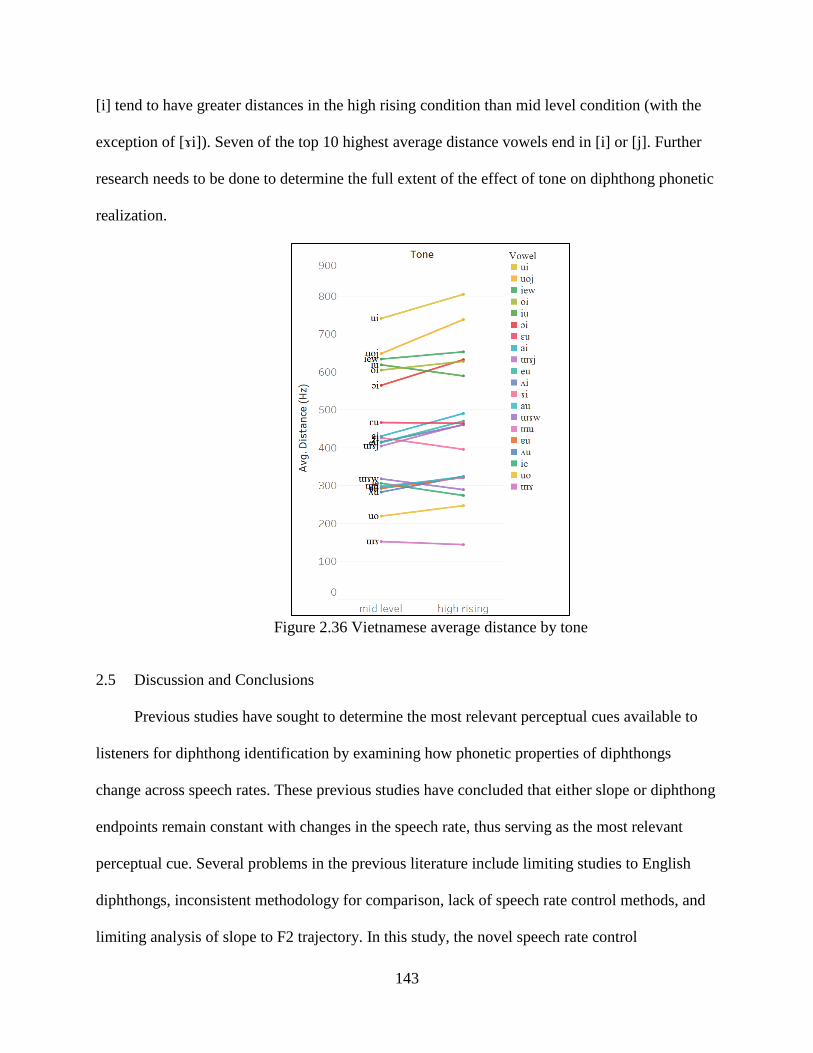
143
[i] tend to have greater distances in the high rising condition than mid level condition (with the
exception of [ɤi]). Seven of the top 10 highest average distance vowels end in [i] or [j]. Further
research needs to be done to determine the full extent of the effect of tone on diphthong phonetic
realization.
Figure 2.36 Vietnamese average distance by tone
2.5 Discussion and Conclusions
Previous studies have sought to determine the most relevant perceptual cues available to
listeners for diphthong identification by examining how phonetic properties of diphthongs
change across speech rates. These previous studies have concluded that either slope or diphthong
endpoints remain constant with changes in the speech rate, thus serving as the most relevant
perceptual cue. Several problems in the previous literature include limiting studies to English
diphthongs, inconsistent methodology for comparison, lack of speech rate control methods, and
limiting analysis of slope to F2 trajectory. In this study, the novel speech rate control
144
methodology and inclusion of three languages from different language families allows for
analysis of language-specific and language-independent trends. Section 2.4 provided the results
for each language’s vowel formants, duration, diphthong distance, slope, and endpoints. This
section discusses the implications of the results for both overall diphthong phonetic properties
and for the Slope-Constant and Frequency-Constant Hypotheses.
2.5.1 Speech Rate
Speech rate was controlled using a novel methodology that enforced consistent speech
rates across speakers within a language. For example, every speaker had to use the same ‘fast’
pace because it was regulated by the design of the experiment. As a result, the vowel duration
and trajectory duration at each speech rate were significantly different for every language.
Significant differences in vowel and trajectory duration are reasonable indicators that the speech
rate itself is significantly different and can be used to compare the additional phonetic properties
of diphthongs across speech rates.
In all three languages, vowels that are shorter at the slow rate do not shorten as much as
longer duration vowels. Although the correlations between diphthong distance and duration are
weak to moderate, there appear to be cross-linguistic trends between inherent duration of
different diphthongs. For average vowel duration, the diphthong /ai/ (or its variants in each
language) is the longest or second longest vowel. For Vietnamese and Cantonese, /au/ is also in
the top three longest vowels (it does not occur in Faroese). The diphthong /iu/ in Vietnamese and
Cantonese and a similar high front-to-back horizontal diphthong /ʉu:/ in Faroese37 are amongst
the shortest duration diphthongs.
37 excluding the phonemically contrastive short diphthongs in Faroese.

145
2.5.2 Distance
The Euclidean distance between endpoints is significantly different across speech rates in
each language. The distance measurements include the F1 and F2 formants of both the onset and
offset endpoints, accounting for movement along both the height and backness axes. These
results indicate that speakers reduce the distance between the onset and offset targets as they
increase speech rate. This measure does not indicate how the distance is affected other than by an
overall decrease or increase between both targets; that is, it does not specify if it is the onset or
offset (or both) that is reduced at faster speeds. Therefore, significant changes in distance do not
provide support for either the Slope-Constant or Frequency-Constant Hypotheses. The results
also show that there is a floor effect as the distance between diphthongs becomes smaller: greater
distance diphthongs reduce distance at faster speeds much more than shorter distance
diphthongs.
2.5.3 Slope
The slope measurement calculates the rate at which the Euclidean distance is traveled.
Unlike the distance results, significant changes in slope are not consistent either across or within
languages. Slope significantly increases with increases in every speech rate in Cantonese. In
Vietnamese, slope increases significantly between the most extreme rates fast and slow, and
between slow and normal, but not between normal and fast. There is an overall trend for slope to
increase as speech rate increases in Vietnamese. Faroese shows no significant difference in slope
between speech rates. Faroese does, however, show the greatest changes in distance across
speech rate, and this may have an effect on the slope results. Cantonese, with the least amount of
change in distance has some of the greatest changes in slope out of all three languages. The
146
results show that there is an average strong correlation (r = .73) across languages between slope
and distance.
The presence of any significant differences in slope, despite inconsistency between
languages, shows that the Slope-Constant Hypothesis, if correct, is not exceptionless. However,
two of the three languages tested in this experiment show that slope can vary across speech rate,
indicating that slope itself may not be a reliable perceptual cue for a diphthong. These results
also highlight the importance of cross-linguistic phonetic studies, which can reveal global trends.
2.5.4 Endpoints
Analysis of the diphthong onset and offset endpoints reveals that for the majority of
contrasts, there is no significant difference38 across speech rates of the endpoints along any one
dimension (onset F1, onset F2, offset F1, offsetF2). An analysis of the variation along each
dimension shows that diphthong endpoints in each language have similar rates of variance.
Additionally, the spectral overlap distribution analysis shows that any reduction across speech
rates in diphthongs closely parallels that of monophthongs. Changes in spectral distribution
across speech rates is consistent for both monophthongs and diphthong endpoints; therefore,
diphthong endpoints can be treated like production targets in the same way as monophthongs.
This also indicates that diphthong endpoints may be used as a perceptual cue to diphthong
vowels, just like monophthong targets.
One interesting result is that although the diphthong endpoints are not overall
significantly different along each dimension across speech rates, differences in Euclidean
distance are significant in all speech rate conditions in all languages. Recall that the measures for
Euclidean distance include all four dimensions of the endpoints (onset F1, onset F2, offset F1,
38 with the exception of Vietnamese and Cantonese offset F1 between the fast and slow speech rate conditions.

147
offset F2). The small, non-significant differences along each dimension compound, leading to
significant differences in Euclidean distance. The same effect was apparent in the results of the
coefficients of variation, in which the smaller variances caused a compounding effect on the
Euclidean distance and slope variances.
There is no evidence of diphthongs being cut short at the end of the trajectory, as
described in Gay (1968); rather, diphthong distances are reduced at faster speech rates due to an
overall reduction in the vowel space. This vowel space reduction is shown for all three languages
in Figure 2.16, Figure 2.20, and Figure 2.23. Previous studies (Fourakis, 1991) have also shown
an effect of vowel space reduction as a result of speech rate. Although Fourakis (1991)'s
experiment did not include diphthongs in his study of phonetic vowel reduction and vowel space
reduction as a result of stress patterns and speech rate, he did find that tempo and stress had no
significant effect on individual formant patterns, but together, a shift from the slow-stressed to
the fast-unstressed condition caused the vowel space to shrink by 30%. Turner, Tjaden, &
Weismer (1995) also found that vowel space reduction due to speaking rate accounted for 45%
of variance in speech intelligibility in a study on how speech rates affect vowel space and speech
intelligibility in subjects with amyotrophic lateral sclerosis (ALS) and a control group. In light of
previous studies on vowel space reduction and the results of the present experiment, endpoint
targets are naturally closer together in the compressed vowel space, thus causing decreases in
Euclidean distance.
2.5.5 Tone
It is worth noting that suprasegmental factors such as tone may affect the phonetic
realization of diphthongs, and that this effect may vary across languages. The present study
found that tone had no significant effect on Vietnamese or Cantonese vowel and trajectory

148
durations, although this has found to be a significant trend in previous literature (Kong, 1987).
One trend emerged regarding the vowel quality of Vietnamese diphthong offsets, trajectory
duration, and tone; diphthongs ending in [i] had increased trajectory durations in the high rising
condition, whereas diphthongs ending in [u] had higher trajectory durations in the mid level
condition. With the exception of [ɤ], all monophthongs had lower total vowel durations in the
high rising condition.
Tone was found to have a significant effect on Vietnamese diphthong distance, though
the underlying cause of this effect warrants further investigation. Tone did not have a significant
effect on Cantonese diphthong realization for any of the variables explored in this study,
suggesting that tone effects on diphthongs are language-specific.
It is necessary to be mindful that the diphthongs are affected by and interact multi-
dimensionally with other prosodic features such as tone, stress, and intonation. The design of this
experiment intentionally controlled for these factors in order to maintain a narrower focus on the
effect of speech rate. There are several iterations of this experiment that should be conducted in
future work that focus on the effects of suprasegmental factors on diphthong production and
perception.
2.5.6 Conclusions
The combined results of this experiment do not support the Slope-Constant Hypothesis,
although it appears possible that some languages do have fewer changes in slope across speech
rate, as in Faroese. However, evidence from Vietnamese and Cantonese suggests that slope is a
consequence of speakers attempting to maintain endpoint targets and may be affected by how
much a reduction occurs in the distance between endpoints across speech rates.
149
The results from this experiment provide support for the Frequency-Constant Hypothesis.
It has been shown that any differences in endpoints parallel those of monophthongs as a natural
effect of reduction of the vowel space at faster speech rates. This unites monophthongs and
diphthongs in terms of their phonetic properties. Both monophthongs and diphthongs have
internal movement (vowel inherent spectral change in monophthongs, slope in diphthongs) but
speakers are maintaining target positions. It is possible that languages, such as Faroese, which
maintain constant slope across speech rates may use slope as a secondary perceptual cue in
addition to the endpoints.
This chapter has shown how speech rate and duration changes affect diphthong phonetic
properties in production. Chapter 3 examines the effect of duration changes on diphthong
perception in Faroese.
150
Chapter 3
Perception Experiment
3.1 Introduction
As discussed in Section 1.4, the time dimension appears to play a role in creating
contrasts in both monophthongs and diphthongs. Due to inconsistencies and gaps in the
literature, it is still unclear how duration affects perception of diphthongs, although increased
duration has been shown to aid perception of confusable monophthongs (Ainsworth, 1972;
Bennett, 1968; Klatt, 1976). The purpose of this chapter is to determine how changes in duration
affect diphthong and monophthong perception in a language with a large vowel inventory. These
results will provide information about the cues listeners are using to identify diphthongs,
including slope, endpoints, distance, and duration. These perceptual cues, together with the
results of the production experiment, are used to incorporate diphthongs into Dispersion Theory
in Chapter 4.
In theories of vowel dispersion, competition between articulatory and perceptual goals is
fundamental to the selection of phonological contrasts. Flemming (2004) focuses on three
functional goals: (i) maximize perceptual distinctiveness of contrasts, (ii) minimize articulatory
effort, and (iii) maximize the number of contrasts. With regard to the first goal of contrast
distinctiveness, Flemming (2004) only allows for separation in the frequency domain. If two
contrasts are very confusable, over time the contrast will be neutralized (Steriade, 1997). Cross-
linguistically, diphthongs with a short distance trajectory are among the most frequent
(Maddieson, 1984); this contradicts current theory that optimal diphthongs have trajectories that
span the vowel space and are highly contrastive along the F1 and F2 dimensions (Sánchez Miret,
1998; Sands, 2004). As there is no implicational relation data on diphthong trends, it is necessary
151
to experimentally test perception of diphthongs with different trajectory lengths to determine
relevant cues to diphthong perception.
It is predicted that languages with large vowel inventories (monophthongs and/or
diphthongs) will use the time dimension to increase dispersion in the vowel space. Evidence
from the large-scale language database UPSID (Maddieson, 1984) shows that the probability of a
language using contrastive length in the vowel system increases with the number of vowel
quality contrasts. The increased duration is predicted to lead to better perception if duration
contributes to increased contrast in the vowel system. As a result, diphthongs with a shorter
distance between endpoints are predicted to be more confusable with monophthongs. Because
diphthongs with a larger distance to travel in the acoustic space will have a greater perceptual
contrast between the onset and the offset point, these diphthongs are predicted to rely less on
duration to reduce confusability.
Results of this experiment show that duration improves identification accuracy overall in
Faroese. Confusability is reduced, accuracy is increased, and reaction time is reduced when
increases or decreases in duration align with vowel length contrasts (i.e., short diphthongs have
greater perceptual accuracy when their duration is shortened, and vice versa for long
diphthongs).
A perceptual identification task was used to test the hypothesis and predictions. Thirteen
Faroese speakers were asked to listen to a set of naturally produced, digitally-manipulated
Faroese vowels and identify what they heard from a set of four syllables. The first section
provides an overview of the experimental paradigm, language, participants, and experiment
procedure. The second section shows the results of the experiment. The last section gives an
analysis and discussion of the results.
152
3.2 Methodology
3.2.1 Experiment Paradigm
Two of the standard experimental designs in speech perception research are identification
and discrimination tasks. The paradigm used in this experiment is an identification task rather
than a discrimination task. Discrimination experiments are prevalent in the previous literature on
diphthong identification because they allow for measurement of minute differences in categorical
vowel perception. In discrimination experiments, subjects distinguish between two or more
natural or manipulated stimuli, by choosing if the stimuli are the same or different (in AX tasks)
or whether X matches A or B (in AXB/XAB/ABX tasks), etc. By contrast, identification tasks
require subjects presented with sound(s) to either label the sound(s) from a closed set (e.g., “did
you hear [v] or [b]”) or an open set (e.g., “write what consonant you heard”).
Discrimination tasks were deemed unsuitable for this experiment because both the size of
the Faroese vowel inventory (n = 23) and the amount of trials needed to include every duration
manipulation condition would have made the experiment prohibitively long. Varying the
duration of such a large set of vowels would lead to too many stimuli to test in one experiment
and may affect the results due to fatigue of the participant. An identification task was found to be
much shorter and simpler for subjects to learn and could elicit very fast reaction times.
Disadvantages to using an identification task with a closed response set are that subjects are
forced to choose between a predetermined set of labels, and that the response set must be
relatively small to make the analysis possible.
The current experiment is an identification task that varies diphthong duration in the
understudied language Faroese. The vowel inventory of Faroese is large enough to avoid
problems such as those in Bond (1978), wherein participants scored well even on a difficult

153
confusion task due to English’s limited diphthong inventory. Only one language was selected for
this experiment due to scope and time constraints on the study; however, predictions may be
made for additional languages based on the results of this study.
3.2.2 Language and Participants
The language used in this experiment was Faroese. It was selected due to its large
inventory of monophthongs and diphthongs, its vowel length contrasts, and its
underrepresentation in the current literature. The Tórshavn dialect of Faroese has 23 distinct
vowels (allophones)39, including length contrasts in both the monophthongs and diphthongs. See
Section 2.2.1 for a more thorough description of the Faroese vowel inventory. The Faroese
vowel inventory and the syllables used as experiment tokens in this experiment are provided in
Table 3.1 and Table 3.2.
Table 3.1 Faroese monophthong tokens
Phoneme (UR) Long Experiment Syllable Short Experiment Syllable Grapheme
/i/ [iː] sis [ɪ] siss i, y
/e/ [eː] ses [ɛ] sess e, ey
/y/* [yː] -- [ʏ] súss y, ú
/ø/ [øː] søs [œ] søss ø, ó
/u/ [u:] sus [ʊ] suss u
/o/ [oː] sos [ɔ] sáss á, o
/a/* [aː] -- [a] sass a *[y:] and [a:] only occur in loanwords and borrowings, and are not included here
Table 3.2 Faroese diphthong tokens
Phoneme (UR) Long Experiment Syllable Short Experiment Syllable Grapheme
/ui/ [ʊiː] sýs [ʊi] sýss í, ý
/ei/ [ɛiː] seys [ɛ] sess e, ey
/ai/ [aiː] seis [ai] seiss ei
/oi/ [ɔiː] soys [ɔi] soyss oy
/ou/ [ɔuː] sós [œ] søss ø, ó
/ʉu/ [ʉuː] sús [ʏ] súss ú
/ɛa/ [ɛaː] sas [a] sass a, œ
/ɔa/ [ɔaː] sás [ɔ] sáss á, o
39 Not including loanword vowels [y:] and [a:]. (Árnason 2011)

154
In Table 3.1 and Table 3.2, the ‘Experiment Syllable’ column provides the orthographical
representation of that vowel ‘option’ in the experiment. These are nonsense syllables consisting
of the form /s_s(s)/ where the second ‘s’ in the coda was a clue to the participants that the vowel
was short or long. In Faroese, a stressed vowel is long in open syllables (i.e., if no more than one
consonant40 follows it), and short in closed syllables (two or more consonants following it), with
some specific consonant cluster exceptions. The Faroese vowel lengthening rule and a list of
exceptions is covered more extensively in Section 2.2.1. The consonant ‘s’ was chosen because it
frequently occurs in onset/coda position and in consonant clusters adjacent to all the Faroese
vowels, and it has minimal effects on the quality of the vowel41.
Note that some short monophthongs [ʏ, ɔ, ɛ, œ] enter into more than one length contrast,
with both a long monophthong and a long diphthong. In these cases, only one experiment
syllable was used so that each allophone is only included once in the test set. For example, the
only token used for [ɔ] is sáss; soss is not included. The pronunciation does not vary according to
the monophthongal or diphthongal length contrast.
The experiment was conducted in the Faroese capitol city of Tórshavn at the Department
of Language and Literature at the University of the Faroe Islands (Fróðskaparsetur Føroya).
Thirteen participants, composed of seven males and six females between the ages of 18 and 55,
completed the experiment. All participants reported normal hearing. These participants are the
same from the production experiment in Chapter 2.
40 Most consonants in Faroese have contrastive length and can be long or short. Long consonants are indicated by
double consonants in the orthography. Exceptions include [j, h, ɲ, ŋ], which are short (Þráinsson 2004). 41 For example, [tt] in coda position would cause pre-aspiration and [t] in onset position would cause post-aspiration.
Also, certain consonant clusters such as [pl, kr, pr], etc. in coda position would cause a lengthening effect on the
preceding vowel (see Section 2.2.1 for more details).

155
3.2.3 Materials
The stimuli tokens used in this experiment were collected from recordings of an
additional speaker (female, approximately 19 years old) of the Tórshavn dialect. Recordings
were made in a quiet room in Las Vegas, NV (where the speaker happened to reside). The
speaker was instructed to read the same wordlist used in production experiment (Appendix A) at
a “regular, natural” speed in the following carrier phrase:
Carrier phrase: Eg sigi orðið ____ tvær ferð
IPA: [ɛi si ɔrə ____ tvɛr fɛr]
English translation: ‘I say the word ____ twice’
The vowels were then extracted from the recordings using the acoustic software Praat
(Boersma & Weenink, 2018) and the initial and final steady states were removed, following Gay
(1967). Steady states were not included because they might have provided an additional cue for
the diphthong perception and the experiment is designed to specifically test duration effects with
regard to the diphthong onset, offset, and trajectory. All vowels were normalized to reduce
amplitude difference effects with RMS normalization.
Table 3.3 includes the diphthong duration, onset and offset F1 and F2 frequencies,
Euclidean distance, and slope. Descriptions of the Euclidean Distance and slope measure are
provided in Section 2.3.5. These data are averages across a single speaker (unnormalized). To
better visualize the data in Table 3.3, the plot in Figure 3.1 shows the stimuli vowels in the F1 x
F2 (Hz) space.
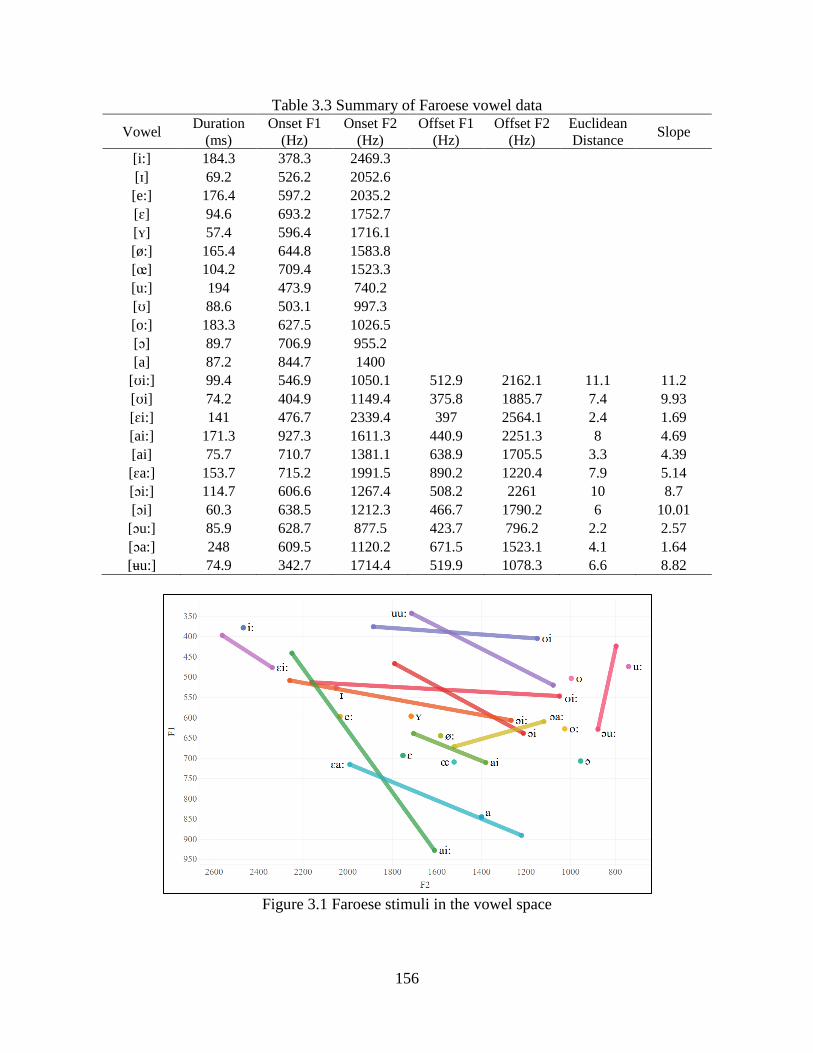
156
Table 3.3 Summary of Faroese vowel data
Vowel Duration
(ms)
Onset F1
(Hz)
Onset F2
(Hz)
Offset F1
(Hz)
Offset F2
(Hz)
Euclidean
Distance Slope
[i:] 184.3 378.3 2469.3
[ɪ] 69.2 526.2 2052.6
[e:] 176.4 597.2 2035.2
[ɛ] 94.6 693.2 1752.7
[ʏ] 57.4 596.4 1716.1
[ø:] 165.4 644.8 1583.8
[œ] 104.2 709.4 1523.3
[u:] 194 473.9 740.2
[ʊ] 88.6 503.1 997.3
[o:] 183.3 627.5 1026.5
[ɔ] 89.7 706.9 955.2
[a] 87.2 844.7 1400
[ʊi:] 99.4 546.9 1050.1 512.9 2162.1 11.1 11.2
[ʊi] 74.2 404.9 1149.4 375.8 1885.7 7.4 9.93
[ɛi:] 141 476.7 2339.4 397 2564.1 2.4 1.69
[ai:] 171.3 927.3 1611.3 440.9 2251.3 8 4.69
[ai] 75.7 710.7 1381.1 638.9 1705.5 3.3 4.39
[ɛa:] 153.7 715.2 1991.5 890.2 1220.4 7.9 5.14
[ɔi:] 114.7 606.6 1267.4 508.2 2261 10 8.7
[ɔi] 60.3 638.5 1212.3 466.7 1790.2 6 10.01
[ɔu:] 85.9 628.7 877.5 423.7 796.2 2.2 2.57
[ɔa:] 248 609.5 1120.2 671.5 1523.1 4.1 1.64
[ʉu:] 74.9 342.7 1714.4 519.9 1078.3 6.6 8.82
Figure 3.1 Faroese stimuli in the vowel space
157
Because the stimuli for the perception experiment were derived from a single speaker, it
was important to test the stimuli to make sure they are representative of typical Faroese vowels.
In a post-hoc analysis, the perception stimuli and average production results from the participants
in production experiment were compared. The overall difference between the slopes and the
Euclidean distance of the results of the production experiment (Chapter 2) and the stimuli used in
the perception experiment are non-significant, indicating that the stimuli used in the perception
experiment are representative of Faroese vowels. In paired t-tests, slope was non-significant,
t(10) = 0.87, p > .05, and Euclidean distance was non-significant, t(10) = 1.92, p > .05. For the
diphthong endpoints, one-way ANOVAs showed that for all vowels, onset F1, onset F2, offset
F1, offset F2 differences were all non-significant (p > .05). The results of these tests show that
the data used as stimuli are reasonable representatives of the overall set of Faroese vowels.
To test duration effects, the set of extracted vowels were manipulated in Praat using the
open-source Praat plugin software Praat Vocal Toolkit (Corretge, 2012) to create three set of
diphthongs at different durations: (i) the original duration, (ii) doubled duration (2 × original
duration), and (iii) halved duration (½ × original duration). The duration manipulation was done
through stretching and shrinking rather than by adding or cutting time at either end of the vowel;
this preserves the frequencies of the diphthong endpoints. The Praat Vocal Toolkit uses Praat’s
‘Overlap-add synthesis’ method to manipulate the acoustic speech signal duration. The Time-
Domain Pitch-Synchronous Overlap-and-Add (TD_PSOLATM) method, realized by Moulines &
Charpentier (1990), works by segmenting the waveform into a series of segments, which are
repeated (to increase the duration) or eliminated (to decrease the duration). The segments are re-
combined using the overlap-add signal processing method. By using this method, the vowel is
stretched (or shrunk) over the entirety of the length of the vowel with minimal distortion. The
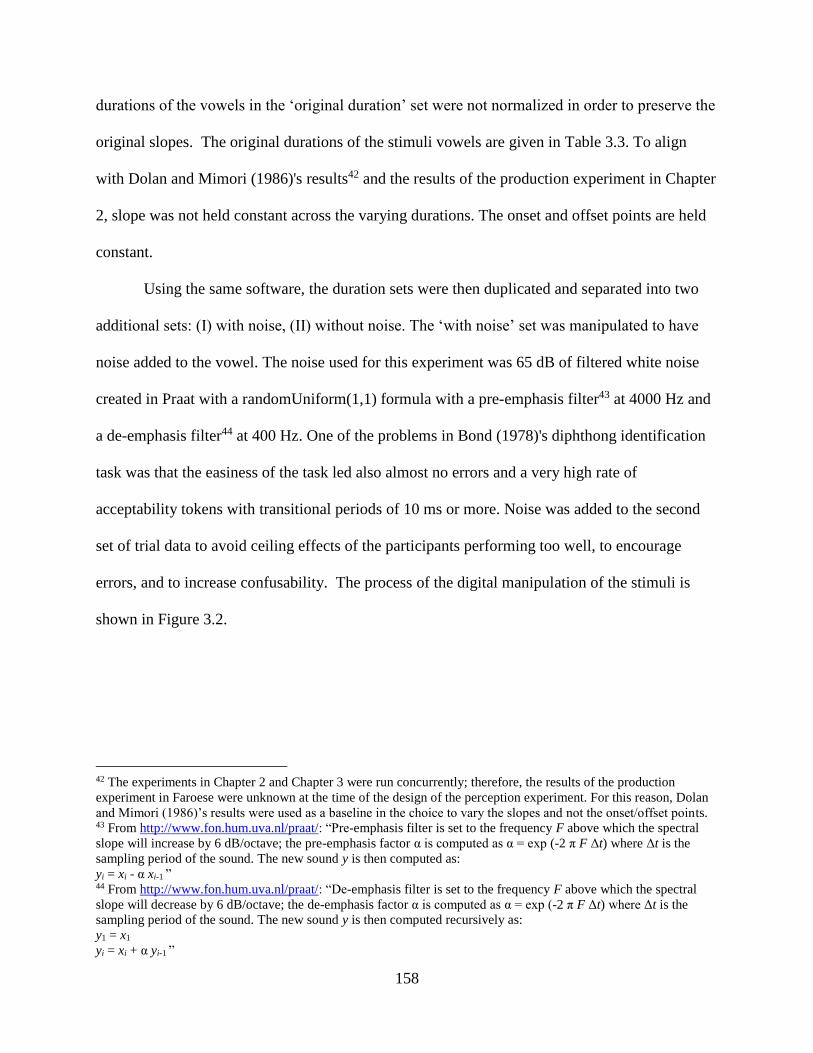
158
durations of the vowels in the ‘original duration’ set were not normalized in order to preserve the
original slopes. The original durations of the stimuli vowels are given in Table 3.3. To align
with Dolan and Mimori (1986)'s results42 and the results of the production experiment in Chapter
2, slope was not held constant across the varying durations. The onset and offset points are held
constant.
Using the same software, the duration sets were then duplicated and separated into two
additional sets: (I) with noise, (II) without noise. The ‘with noise’ set was manipulated to have
noise added to the vowel. The noise used for this experiment was 65 dB of filtered white noise
created in Praat with a randomUniform(1,1) formula with a pre-emphasis filter43 at 4000 Hz and
a de-emphasis filter44 at 400 Hz. One of the problems in Bond (1978)'s diphthong identification
task was that the easiness of the task led also almost no errors and a very high rate of
acceptability tokens with transitional periods of 10 ms or more. Noise was added to the second
set of trial data to avoid ceiling effects of the participants performing too well, to encourage
errors, and to increase confusability. The process of the digital manipulation of the stimuli is
shown in Figure 3.2.
42 The experiments in Chapter 2 and Chapter 3 were run concurrently; therefore, the results of the production
experiment in Faroese were unknown at the time of the design of the perception experiment. For this reason, Dolan
and Mimori (1986)’s results were used as a baseline in the choice to vary the slopes and not the onset/offset points. 43 From http://www.fon.hum.uva.nl/praat/: “Pre-emphasis filter is set to the frequency F above which the spectral
slope will increase by 6 dB/octave; the pre-emphasis factor α is computed as α = exp (-2 π F Δt) where Δt is the
sampling period of the sound. The new sound y is then computed as:
yi = xi - α xi-1 ” 44 From http://www.fon.hum.uva.nl/praat/: “De-emphasis filter is set to the frequency F above which the spectral
slope will decrease by 6 dB/octave; the de-emphasis factor α is computed as α = exp (-2 π F Δt) where Δt is the
sampling period of the sound. The new sound y is then computed recursively as:
y1 = x1
yi = xi + α yi-1 ”
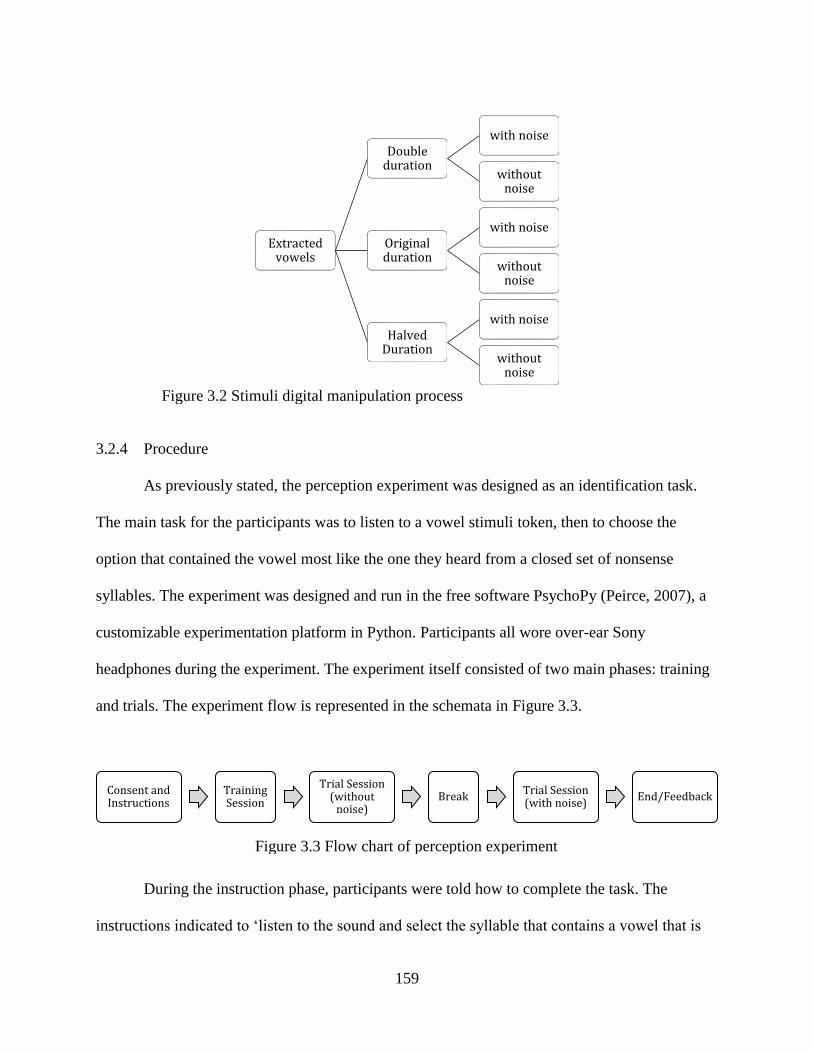
159
3.2.4 Procedure
As previously stated, the perception experiment was designed as an identification task.
The main task for the participants was to listen to a vowel stimuli token, then to choose the
option that contained the vowel most like the one they heard from a closed set of nonsense
syllables. The experiment was designed and run in the free software PsychoPy (Peirce, 2007), a
customizable experimentation platform in Python. Participants all wore over-ear Sony
headphones during the experiment. The experiment itself consisted of two main phases: training
and trials. The experiment flow is represented in the schemata in Figure 3.3.
During the instruction phase, participants were told how to complete the task. The
instructions indicated to ‘listen to the sound and select the syllable that contains a vowel that is
Consent and Instructions
Training Session
Trial Session (without
noise)Break
Trial Session (with noise)
End/Feedback
Figure 3.3 Flow chart of perception experiment
Extracted vowels
Double duration
with noise
without noise
Original duration
with noise
without noise
Halved Duration
with noise
without noise
Figure 3.2 Stimuli digital manipulation process
160
the most similar to the vowel you heard’. The participants were also informed that the
experiment was timed, and that they should try to move as fast and as accurately as possible. The
time component was added to encourage error and confusability. Although the stimuli were not
advancing on a timed schedule (the selection of an answer advanced the participant to the next
stimuli), the added idea of the timing and the encouragement of the fast pace were meant to
encourage error. The experiment took approximately 10 minutes to complete, depending on the
length of the break (participant-dependent) or if the participant required additional instruction.
The training session and the trial sessions were identical in procedure; the training
session included 5 stimuli items, while the trial sessions had the entire vowel set x 3 duration
conditions (n = 69/session). The training familiarized the participants to the task itself and
allowed participants a chance to ask any further questions about the procedure before moving on
to the trials. In all, 23 vowels at 3 speed conditions and 2 noise conditions from 13 participants
led to a sum of 1,794 instances.
Participants selected their choice from a closed set of four nonsense syllables of the form
/s_s(s)/ as described in Section 3.2.2. Each closed set contained the following options45:
1. correct response token
2. length variant (if applicable)
3. closest vowel to the onset in the vowel space (if applicable)
4. closest vowel to the offset in the vowel space (if applicable)
If the stimulus was a monophthong, options (3) and (4) were not applicable; in these cases, the
closest monophthongs and/or diphthongs in the vowel space were selected as the alternative
members of the response set. The options were numbered 1-4 and participants selected their
choice by selecting a number on a keyboard. The experiment advanced to the next token
45 An error in the experimental design caused the short length variant /ai/ of /ai:/ to be omitted from the closed set.

161
immediately after a selection was made. The order of the stimuli and the order of the options in
the response set were both randomized in each iteration of the experiment.
The experimentation software recorded: (i) the participants’ identification code (for
anonymization), (ii) date and time of the experiment, (iii) the system frame rate, (iv) responses to
each stimulus (1-4), (v) whether the response was correct or incorrect (1 or 0), and (vi) the
reaction time for each response. All analyses were conducted in the R Statistical Environment
(Bates, Maechler, Bolker, & Walker, 2015; R Core Team, 2017).
3.3 Results
This section provides the results of the identification experiment, which tests the effect of
duration manipulation on diphthong and monophthong perception in Faroese. The first section
tests the effect of noise on the percent correct results to find if errors increased with the
introduction of noise to the stimuli. The next section provides the percent correct results overall,
as well as the effects of duration and slope on the results. Next, the qualitative errors are
provided in the section on confusability. Finally, the last section provides the results of the
reaction time analysis. Where applicable, statistical tests were run using linear regression and
analysis of variance (ANOVA) with post-hoc Tukey honest significant difference (HSD) tests.
3.3.1 Noise
In the second trial session, the set of tokens included an overlay of 65 dB of filtered white
noise in order to introduce additional error into the experiment. However, linear regression
shows the difference in mean performance—i.e., average percent correct—was non-significant
between the noise condition (M= 0.728, SE = 0.028) and noiseless condition (M= 0.726, SE =
0.029) at F(1, 136) = .003, p > .05. For individual vowels, there was also no significant

162
difference between the noise conditions, F(45, 92) = 1.77, p > .05. The average percent correct
of the noise conditions by the percent correct is shown in Figure 3.4.
Figure 3.4 Average percent correct between noise and noiseless conditions
The lack of effect of noise on the results may be the result of a few different factors. First,
the noise trial session came after the trial session without noise for all participants (noise
condition trials were not counterbalanced by speaker); therefore, the participants may have
improved inherently as the task went on, and this improvement may have been mitigated by the
addition of noise. Alternatively, the noise may not have been loud enough to introduce additional
error into the task. Finally, the task may have been too easy overall—with or without noise—for
noise to have been a factor.
As the noise was non-significant, the results from both trial sessions (with and without
noise) have been combined to create a more robust analysis.
3.3.2 Percent Correct
The percent correct measures how often the correct vowel option was chosen out of the
closed set. It is a measure of accuracy for each vowel, but it is important to note that it does not

163
provide qualitative information regarding the type of errors made by participants; for error types,
see Section 3.3.4. All percent correct data are provided in Appendix B.
Figure 3.5 shows the average percent correct for each stimuli vowel at each duration
condition. When combining the individual vowels into a group average, the original condition
has the highest overall average percent correct, at 80.3%. The doubled duration condition has the
next highest average percent correct, at 72.6%. Accuracy is overall the worst in the halved
duration condition, at 63.5%. For all vowels, the difference between the percent correct
conditions is non-significant for all contrasts (F(2, 62) = 2.06, p > .05).
Figure 3.5 Average percent correct by duration condition
Figure 3.6 shows the average percent correct of only the set of Faroese diphthongs at
each duration condition. This figure demonstrates the differences in percent correct between long
and short diphthongs.
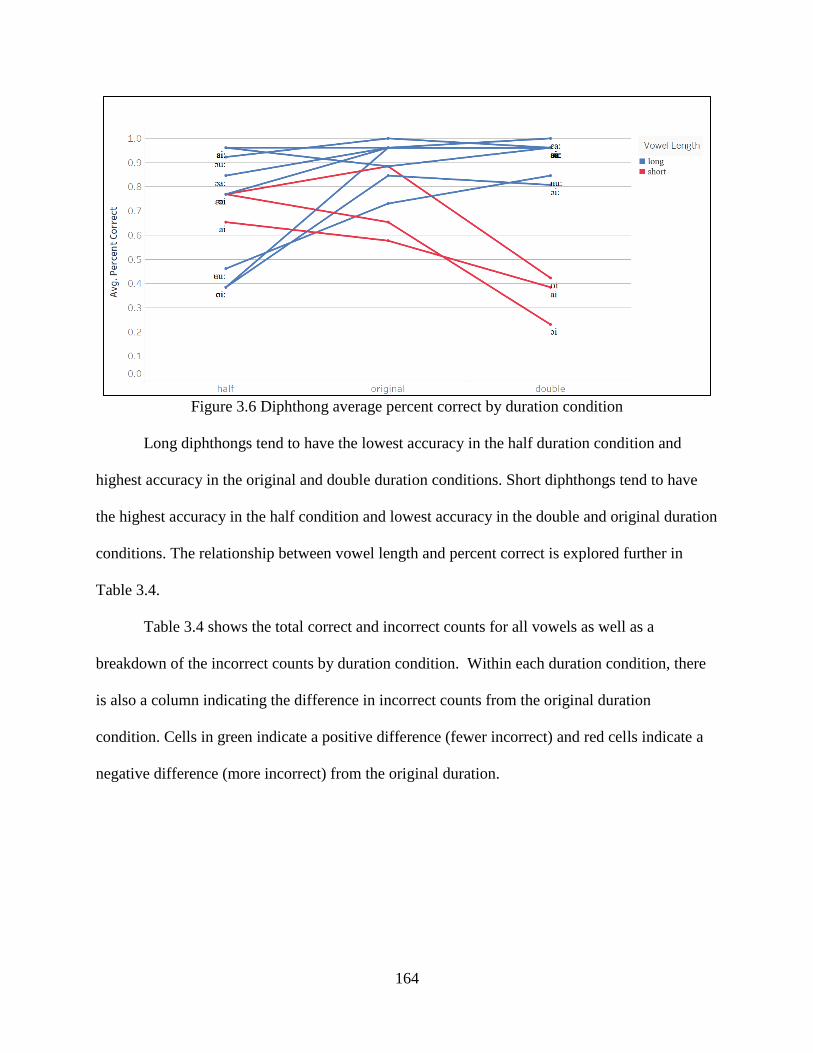
164
Figure 3.6 Diphthong average percent correct by duration condition
Long diphthongs tend to have the lowest accuracy in the half duration condition and
highest accuracy in the original and double duration conditions. Short diphthongs tend to have
the highest accuracy in the half condition and lowest accuracy in the double and original duration
conditions. The relationship between vowel length and percent correct is explored further in
Table 3.4.
Table 3.4 shows the total correct and incorrect counts for all vowels as well as a
breakdown of the incorrect counts by duration condition. Within each duration condition, there
is also a column indicating the difference in incorrect counts from the original duration
condition. Cells in green indicate a positive difference (fewer incorrect) and red cells indicate a
negative difference (more incorrect) from the original duration.

165
Table 3.4 Perception experiment correct and incorrect count data
Double Duration Half Duration
Vowel Length
Contrast Correct
Incorrect
(total)
Incorrect
(original
duration)
Incorrect
Difference
from
original
duration
Incorrect
Difference
from
original
duration
[ɛi:] 73 5 3 1 +2 1 +2
[ɛa:] 71 7 1 0 +1 6 -5
[ɔa:] 72 6 1 1 0 4 -3
[ɔu:] 75 3 0 1 -1 2 -2
[ʉu:] 53 25 7 4 +3 14 -7
[ʊi:] ✓ 60 18 1 1 0 16 -15
[ʊi] ✓ 54 24 3 15 -12 6 -3
[ɔi:] ✓ 53 25 4 5 -1 16 -12
[ɔi] ✓ 43 35 9 20 -11 6 +3
[ai:] (✓)46 75 3 1 1 0 1 +1
[ai] ✓ 42 36 11 16 -5 9 +2
[a] (✓)47 45 33 9 16 -7 8 +1
[e:] ✓ 60 18 5 0 +5 13 -8
[ɛ] ✓ 51 27 8 12 -4 7 +1
[i:] ✓ 64 14 2 0 +2 12 -10
[ɪ] ✓ 33 45 17 11 +6 17 0
[o:] ✓ 68 10 1 0 +1 9 -8
[ɔ] ✓ 42 36 8 13 -5 15 -7
[ø:] ✓ 58 20 5 0 +5 15 -10
[œ] ✓ 57 21 5 12 -7 4 +1
[u:] ✓ 60 18 1 1 0 16 -15
[ʊ] ✓ 40 38 10 17 -7 11 -1
[ʏ] (✓) 55 23 6 7 -1 10 -4
Table 3.4 further demonstrates the trend that perception of vowels with length contrasts
benefits from an increase or decrease in duration according to their length. Short vowels in a
length contrast have improved perception in a halved duration condition; these vowels are
especially worse in the doubled duration condition. Long vowels in a length contrast have similar
46 Due to an error in the experiment design, the closed set options for /ai:/ was missing the short counterpart /ai/. 47 The length contrasts of /a:/ and /y:/ were not included because they were excluded in these experiments due to
their exclusivity to loanwords.
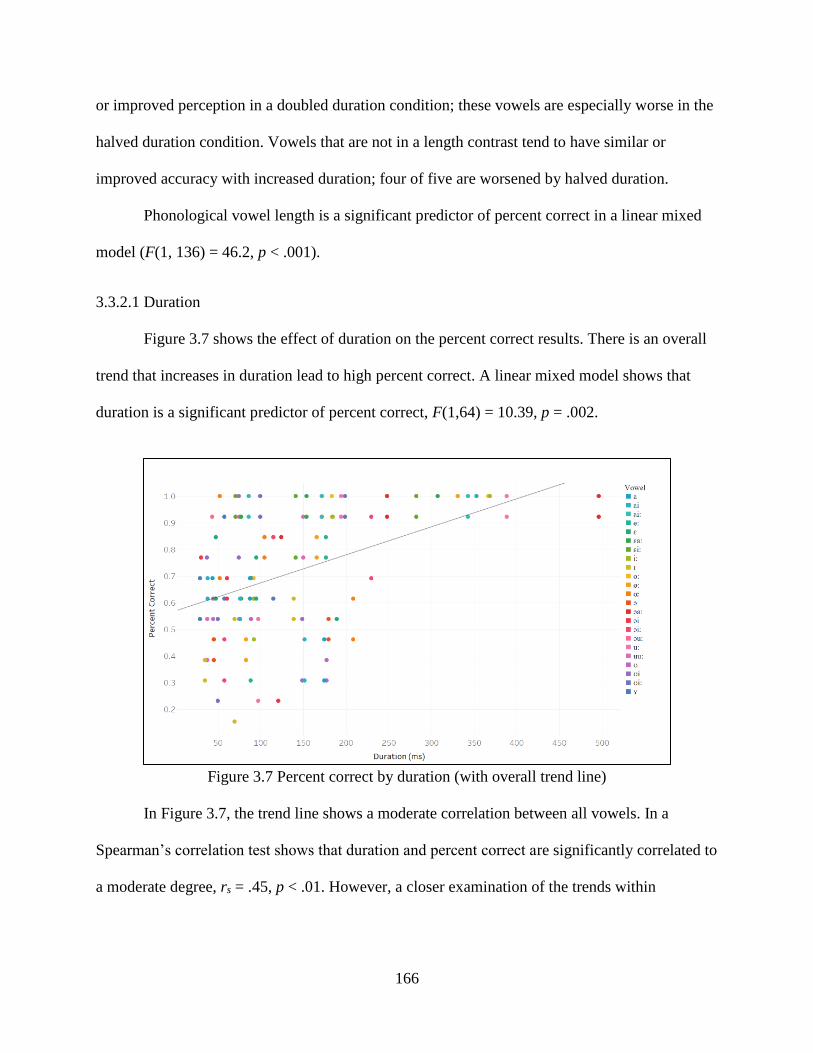
166
or improved perception in a doubled duration condition; these vowels are especially worse in the
halved duration condition. Vowels that are not in a length contrast tend to have similar or
improved accuracy with increased duration; four of five are worsened by halved duration.
Phonological vowel length is a significant predictor of percent correct in a linear mixed
model (F(1, 136) = 46.2, p < .001).
3.3.2.1 Duration
Figure 3.7 shows the effect of duration on the percent correct results. There is an overall
trend that increases in duration lead to high percent correct. A linear mixed model shows that
duration is a significant predictor of percent correct, F(1,64) = 10.39, p = .002.
Figure 3.7 Percent correct by duration (with overall trend line)
In Figure 3.7, the trend line shows a moderate correlation between all vowels. In a
Spearman’s correlation test shows that duration and percent correct are significantly correlated to
a moderate degree, rs = .45, p < .01. However, a closer examination of the trends within
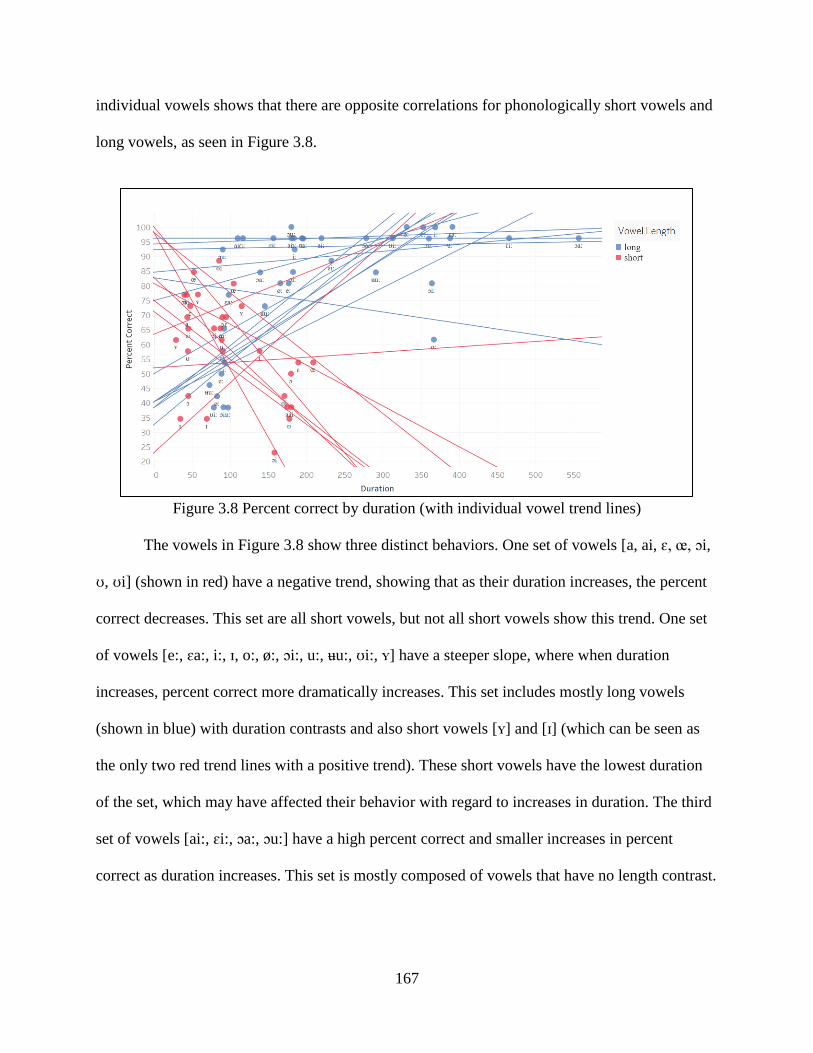
167
individual vowels shows that there are opposite correlations for phonologically short vowels and
long vowels, as seen in Figure 3.8.
Figure 3.8 Percent correct by duration (with individual vowel trend lines)
The vowels in Figure 3.8 show three distinct behaviors. One set of vowels [a, ai, ɛ, œ, ɔi,
ʊ, ʊi] (shown in red) have a negative trend, showing that as their duration increases, the percent
correct decreases. This set are all short vowels, but not all short vowels show this trend. One set
of vowels [e:, ɛa:, i:, ɪ, o:, ø:, ɔi:, u:, ʉu:, ʊi:, ʏ] have a steeper slope, where when duration
increases, percent correct more dramatically increases. This set includes mostly long vowels
(shown in blue) with duration contrasts and also short vowels [ʏ] and [ɪ] (which can be seen as
the only two red trend lines with a positive trend). These short vowels have the lowest duration
of the set, which may have affected their behavior with regard to increases in duration. The third
set of vowels [ai:, ɛi:, ɔa:, ɔu:] have a high percent correct and smaller increases in percent
correct as duration increases. This set is mostly composed of vowels that have no length contrast.
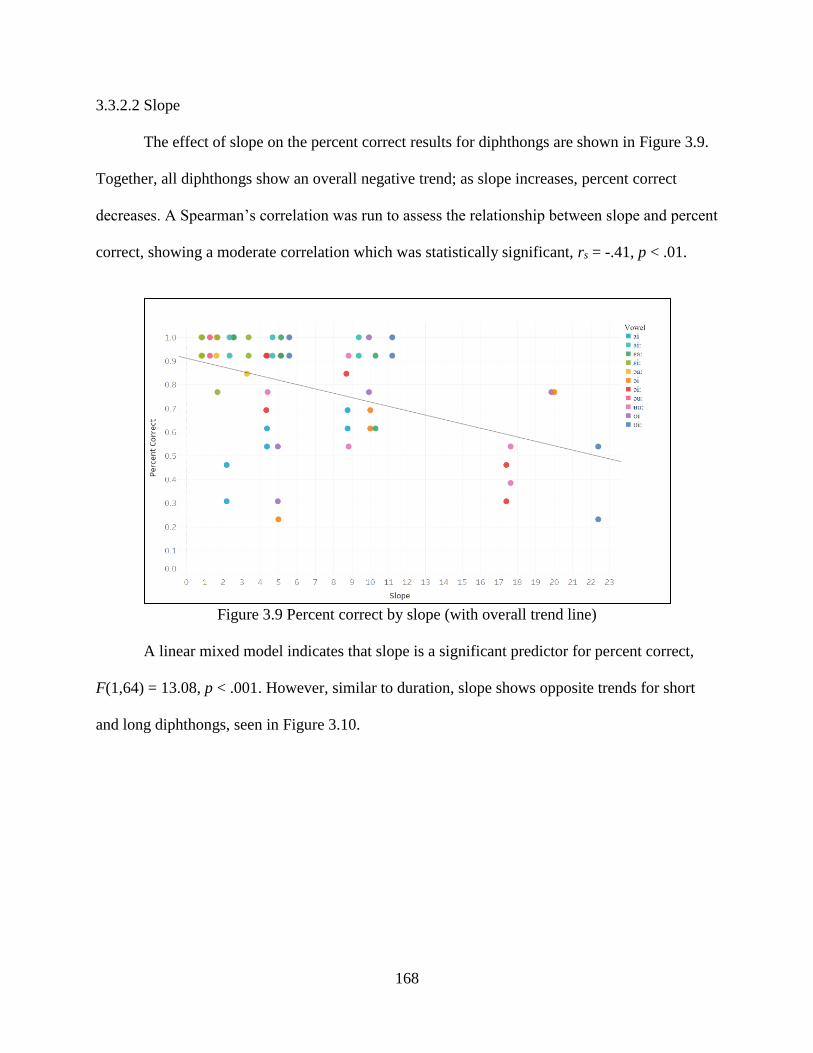
168
3.3.2.2 Slope
The effect of slope on the percent correct results for diphthongs are shown in Figure 3.9.
Together, all diphthongs show an overall negative trend; as slope increases, percent correct
decreases. A Spearman’s correlation was run to assess the relationship between slope and percent
correct, showing a moderate correlation which was statistically significant, rs = -.41, p < .01.
Figure 3.9 Percent correct by slope (with overall trend line)
A linear mixed model indicates that slope is a significant predictor for percent correct,
F(1,64) = 13.08, p < .001. However, similar to duration, slope shows opposite trends for short
and long diphthongs, seen in Figure 3.10.
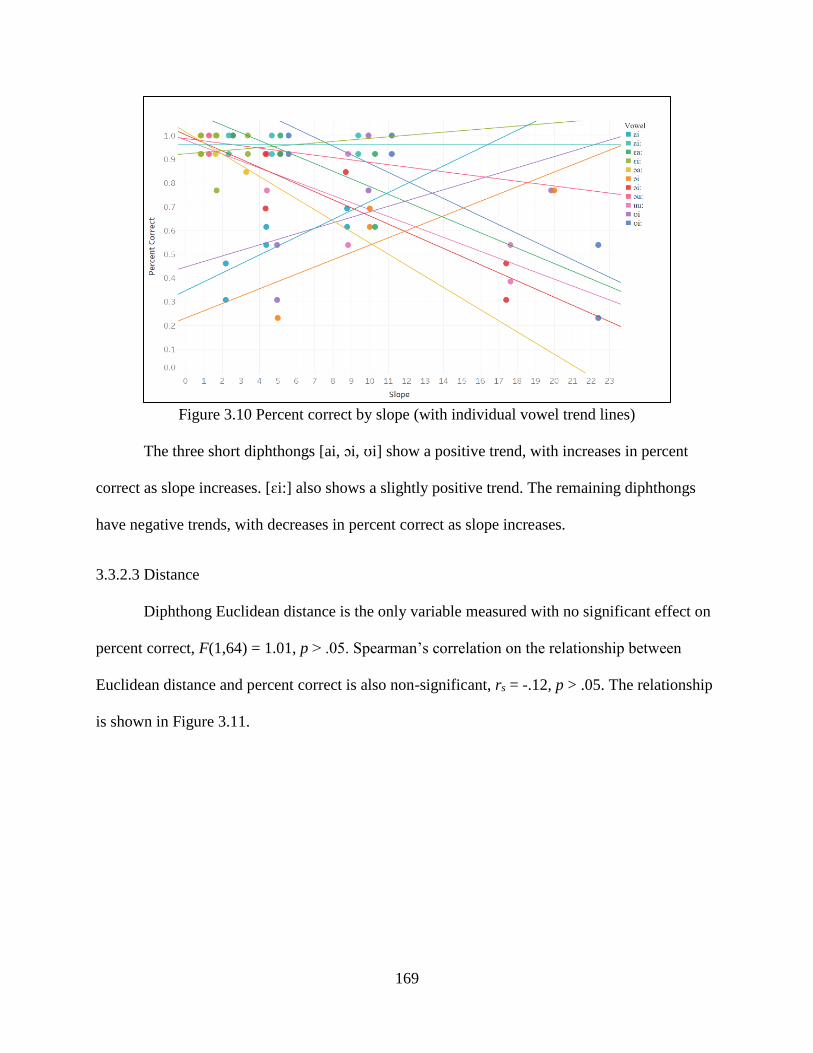
169
Figure 3.10 Percent correct by slope (with individual vowel trend lines)
The three short diphthongs [ai, ɔi, ʊi] show a positive trend, with increases in percent
correct as slope increases. [ɛi:] also shows a slightly positive trend. The remaining diphthongs
have negative trends, with decreases in percent correct as slope increases.
3.3.2.3 Distance
Diphthong Euclidean distance is the only variable measured with no significant effect on
percent correct, F(1,64) = 1.01, p > .05. Spearman’s correlation on the relationship between
Euclidean distance and percent correct is also non-significant, rs = -.12, p > .05. The relationship
is shown in Figure 3.11.

170
Figure 3.11 Average percent correct by average distance
3.3.3 Bias
Although the percent correct data provides an overall measure of performance for the
task, it is necessary to take a closer look at the results to see if there was a possible effect of bias.
By computing the accuracy and precision scores from the true positive, false negative, false
positive, and true negative data, it is possible to determine if speakers were biased to answering
(or not answering) for any particular vowel(s). Definitions for these terms are provided below:
For a vowel x,
true positive: when presented with vowel x, participant correctly classified it as vowel x
false positive: when presented with vowel y, participant incorrectly classified it as vowel x
true negative: when presented with vowel y, participant correctly classified it as vowel y
(when vowel x was also an option)
false negative: when presented with vowel x, participant incorrectly classified it as vowel y

171
Table 3.5 Perception experiment confusion matrices by vowel
Target vowel True Positive False Negative
False Positive True Negative
Target
Vowel Double Original Half
a 10 16 17 9 18 8
1 99 7 108 17 96
ai 10 16 15 11 17 9
1 10 2 17 1 18
ai: 25 1 25 1 25 1
16 35 7 38 5 42
ɛ 14 12 18 8 19 7
4 107 8 97 14 75
e: 26 0 21 5 13 13
8 65 4 66 2 64
ɛa: 26 0 25 1 20 6
12 36 5 38 6 31
ɛi: 25 1 23 3 25 1
6 101 10 103 8 89
ɪ 15 11 9 17 9 17
3 81 4 81 12 61
i: 26 0 24 2 14 12
6 128 3 144 10 120
ɔ 13 13 18 8 11 15
1 65 3 71 14 61
o: 26 0 25 1 17 9
1 50 0 51 1 46
ɔa: 25 1 25 1 22 4
13 49 6 60 11 46
œ 14 12 21 5 22 4
1 54 4 57 22 42
ɔi 6 20 17 9 20 6
7 60 9 61 17 32
ɔi: 21 5 22 4 10 16
18 6 9 17 4 20
ɔu: 25 1 26 0 24 2
0 26 0 25 0 17
ø: 26 0 21 5 11 15
15 41 2 60 3 52
ʊ 9 17 16 10 15 11
0 61 0 74 16 54
u: 25 1 25 1 10 16
12 81 9 86 8 61
ʊi 11 15 23 3 20 6
2 25 1 25 14 10
ʊi: 25 1 25 1 10 16
14 62 3 72 5 44
ʏ 19 7 20 6 16 10
8 46 19 44 22 36
ʉu: 22 4 19 7 12 14
5 44 3 45 6 26
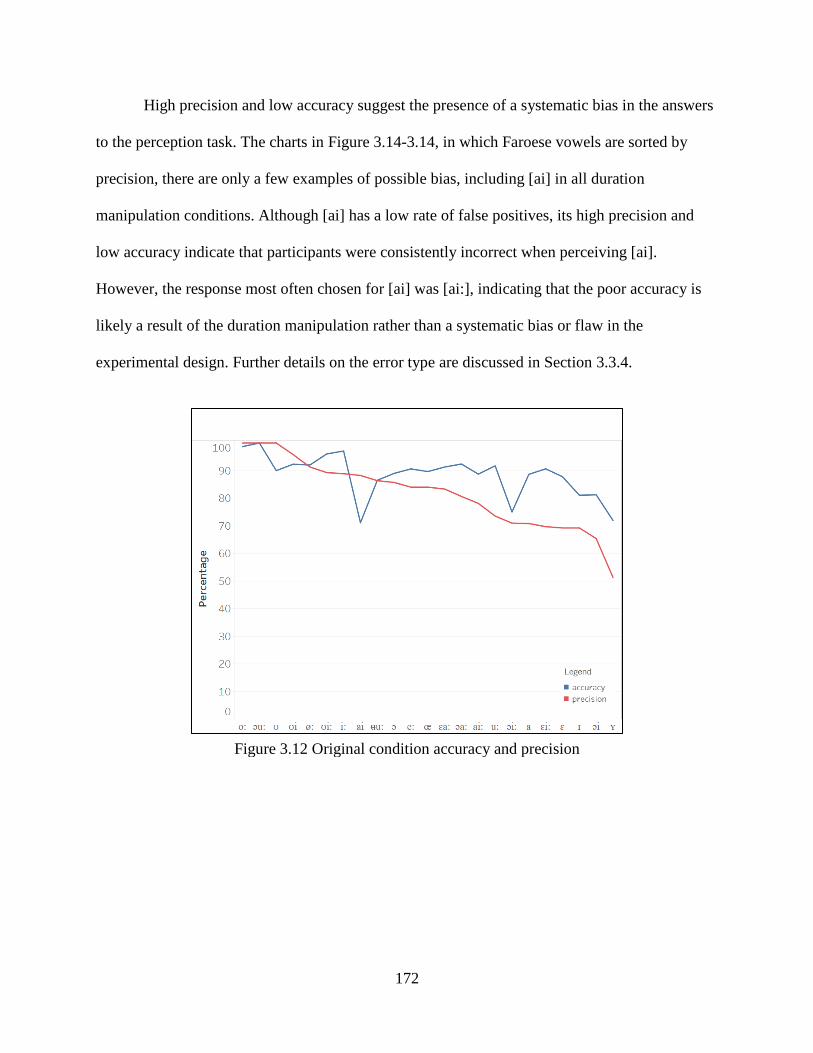
172
High precision and low accuracy suggest the presence of a systematic bias in the answers
to the perception task. The charts in Figure 3.14-3.14, in which Faroese vowels are sorted by
precision, there are only a few examples of possible bias, including [ai] in all duration
manipulation conditions. Although [ai] has a low rate of false positives, its high precision and
low accuracy indicate that participants were consistently incorrect when perceiving [ai].
However, the response most often chosen for [ai] was [ai:], indicating that the poor accuracy is
likely a result of the duration manipulation rather than a systematic bias or flaw in the
experimental design. Further details on the error type are discussed in Section 3.3.4.
Figure 3.12 Original condition accuracy and precision

173
One additional measure that can indicate a bias toward vowels is the false positive rate,
which measures how often a vowel is chosen incorrectly when the listener is presented with a
different vowel. Figure 3.15 shows that four vowels in particular have higher false positive rates
Figure 3.14 Double condition accuracy and precision
Figure 3.13 Half condition accuracy and precision

174
than the rest of the vowels at the double and half duration conditions: [ɔi:] and [ai:] in the double
condition, and [ʊi] and [œ] in the half condition. [ɔi:] and [ʏ] also have higher false positive rates
in the original condition, indicating that these vowels are more likely than others to be selected
when available to participants in the closed set of options.
Figure 3.15 False positive rate
A closer analysis of these vowels shows that the false positives in the manipulated
duration are caused by the selection of the corresponding long or short allophonic counterpart.
For example, [ɔi:] was very frequently selected for [ɔi] when the length of [ɔi] was doubled,
giving it a high false positive rate. One example for which this is not the case is [ʏ],
which was frequently chosen for [ɪ]. These vowels surface close to each other in the
vowel space. This indicates there may be a bias toward selecting [ʏ], or that [ɪ] and [ʏ]

175
are phonetically very similar and are more likely to be confused than other sets of vowels
in Faroese. Other errors of this type are discussed further in the following section.
3.3.4 Confusability
This section provides the results of types of errors made in the identification experiment.
By examining the data in confusability matrices, it is possible to see which vowels are more
mistaken for other vowels. These matrices provide count results of the correct vowel (the sound
stimuli played for the participant) and the response vowel (the selection made by the participant).
These data provide qualitative and quantitative results of the monophthong and diphthong
confusability in Faroese. The importance of these confusability data to the current work on
perception and phonological theory are discussed further in Chapter 1.
Figure 3.16 through Figure 3.19 provide the confusability results at the three
manipulation conditions (original, double, half) and a combined set of results. Note that for each
‘correct’ response, there are only four possible response vowels due to the ‘closed set’ design of
the experiment.
The original duration condition, Figure 3.16, can be considered a baseline of
confusability. These are errors participants made with no duration manipulation. The original
duration had the fewest length-related errors of all three conditions, at only n = 44 compared to
the halved duration at n = 111 and the doubled duration at n = 87. The vowel with the largest
error is [ɪ], which is most confused as another front, lax vowel, [ʏ]. Besides the diphthong [ɔi] at
60.3 ms, [ʏ] and [ɪ] have the shortest durations of the stimuli, at 57.2 ms and 69.2 ms,
respectively. Errors along all phonological length contrasts are present. Some additional notable
errors between monophthongs and diphthongs include selection of [ɛa:] for [a], [u:] for [ʉu:], [a]
for [ai], and [ɔa:] for [ɔ].

176
Figure 3.16 Confusability at original duration condition
In the manipulated conditions, the results further demonstrate how phonological vowel
length interacts with duration and perception. In the double duration condition, Figure 3.17, short
vowels in a length contrast are mistaken for their long counterparts 62% more than in the original
condition. Overall there are 49% more length-related errors in the double duration than the
original condition. [ɔi] is most often confused for [ɔi:], with 18/26 responses. Overall, in the
double duration condition there are fewer non-length errors (n = 67) than both the original
condition (n = 74) and the half duration (n = 104). Some notable errors include both [ɔa:] and
[ɛa:] for [a] and [ɔa:] for [ɔ].
a ai: ai e: ɛ i: ɪ o: ɔ u: ʊ ø: œ ɔi: ɔi ɔu: ɔa: ɛa: ɛi: ʉu: ʊi: ʊi ʏ
a 17 2 2 5
ai: 25 1
ai 4 5 15 2
e: 21 4 1
ɛ 4 18 4
i: 24 2
ɪ 2 2 9 13
o: 25 1
ɔ 2 18 2 4
u: 25 1
ʊ 5 16 1 4
ø: 21 4 1
œ 2 1 2 21
ɔi: 22 4
ɔi 9 17
ɔu: 26
ɔa: 1 25
ɛa: 1 25
ɛi: 2 1 23
ʉu: 1 4 19 2
ʊi: 25 1
ʊi 3 23
ʏ 3 1 2 20
Response VowelC
orr
ect
Vow
el
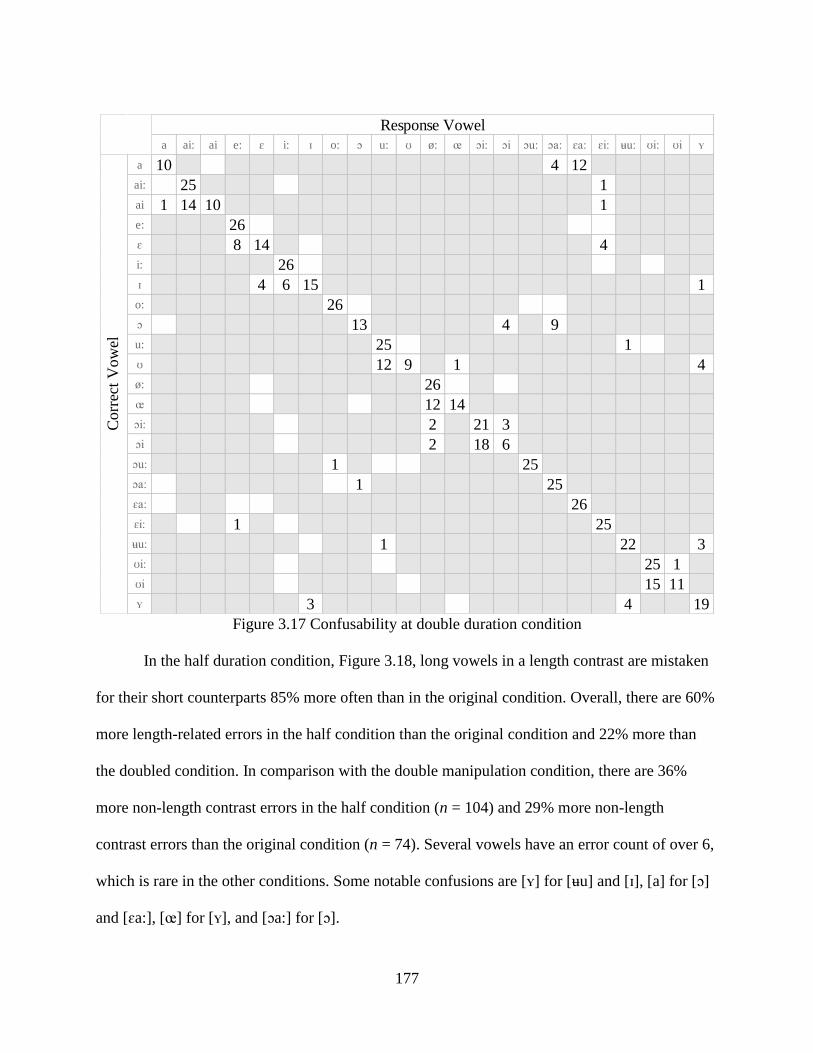
177
Figure 3.17 Confusability at double duration condition
In the half duration condition, Figure 3.18, long vowels in a length contrast are mistaken
for their short counterparts 85% more often than in the original condition. Overall, there are 60%
more length-related errors in the half condition than the original condition and 22% more than
the doubled condition. In comparison with the double manipulation condition, there are 36%
more non-length contrast errors in the half condition (n = 104) and 29% more non-length
contrast errors than the original condition (n = 74). Several vowels have an error count of over 6,
which is rare in the other conditions. Some notable confusions are [ʏ] for [ʉu] and [ɪ], [a] for [ɔ]
and [ɛa:], [œ] for [ʏ], and [ɔa:] for [ɔ].
a ai: ai e: ɛ i: ɪ o: ɔ u: ʊ ø: œ ɔi: ɔi ɔu: ɔa: ɛa: ɛi: ʉu: ʊi: ʊi ʏ
a 10 4 12
ai: 25 1
ai 1 14 10 1
e: 26
ɛ 8 14 4
i: 26
ɪ 4 6 15 1
o: 26
ɔ 13 4 9
u: 25 1
ʊ 12 9 1 4
ø: 26
œ 12 14
ɔi: 2 21 3
ɔi 2 18 6
ɔu: 1 25
ɔa: 1 25
ɛa: 26
ɛi: 1 25
ʉu: 1 22 3
ʊi: 25 1
ʊi 15 11
ʏ 3 4 19
Response VowelC
orr
ect
Vow
el

178
Figure 3.18 Confusability at half duration condition
The combined durations in Figure 3.19 provide an overview of the most confusable
vowels from the identification experiment. The most confusable vowels, including length
contrasts, are [ɔi:] for [ɔi] (n = 31), [ai:] for [ai] (n = 24), [ʊi:] for [ʊi] (n = 23), [ʏ] for [ɪ] (n =
22), [u:] for [ʊ] (n = 21), and [ɔa:] for [ɔ] (n = 19).
a ai: ai e: ɛ i: ɪ o: ɔ u: ʊ ø: œ ɔi: ɔi ɔu: ɔa: ɛa: ɛi: ʉu: ʊi: ʊi ʏ
a 18 1 3 4
ai: 26
ai 4 5 17
e: 13 11 2
ɛ 1 19 1 5
i: 14 9 3
ɪ 1 8 9 8
o: 17 7 2
ɔ 7 11 2 6
u: 10 14 2
ʊ 4 15 3 4
ø: 1 11 14
œ 1 3 22
ɔi: 1 10 15
ɔi 2 4 20
ɔu: 1 1 24
ɔa: 4 22
ɛa: 6 20
ɛi: 1 25
ʉu: 1 3 12 10
ʊi: 1 1 10 14
ʊi 1 5 20
ʏ 1 5 4 16
Response VowelC
orr
ect
Vow
el
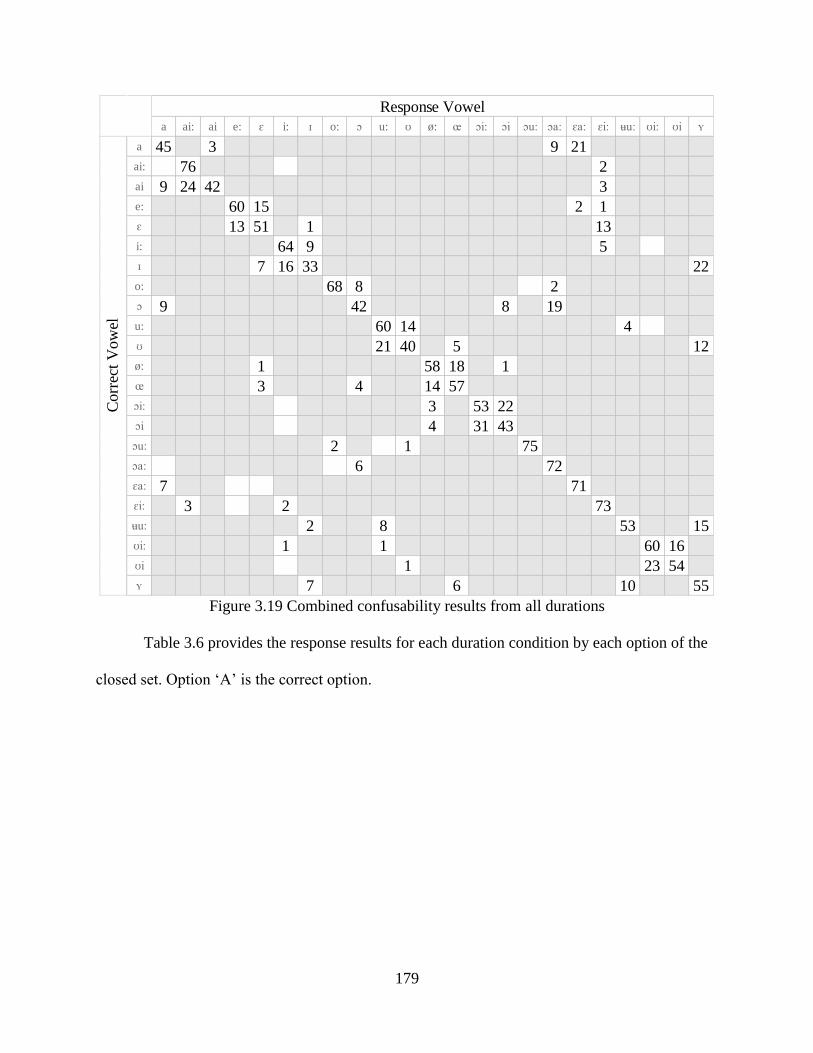
179
Figure 3.19 Combined confusability results from all durations
Table 3.6 provides the response results for each duration condition by each option of the
closed set. Option ‘A’ is the correct option.
a ai: ai e: ɛ i: ɪ o: ɔ u: ʊ ø: œ ɔi: ɔi ɔu: ɔa: ɛa: ɛi: ʉu: ʊi: ʊi ʏ
a 45 3 9 21
ai: 76 2
ai 9 24 42 3
e: 60 15 2 1
ɛ 13 51 1 13
i: 64 9 5
ɪ 7 16 33 22
o: 68 8 2
ɔ 9 42 8 19
u: 60 14 4
ʊ 21 40 5 12
ø: 1 58 18 1
œ 3 4 14 57
ɔi: 3 53 22
ɔi 4 31 43
ɔu: 2 1 75
ɔa: 6 72
ɛa: 7 71
ɛi: 3 2 73
ʉu: 2 8 53 15
ʊi: 1 1 60 16
ʊi 1 23 54
ʏ 7 6 10 55
Response VowelC
orr
ect
Vow
el
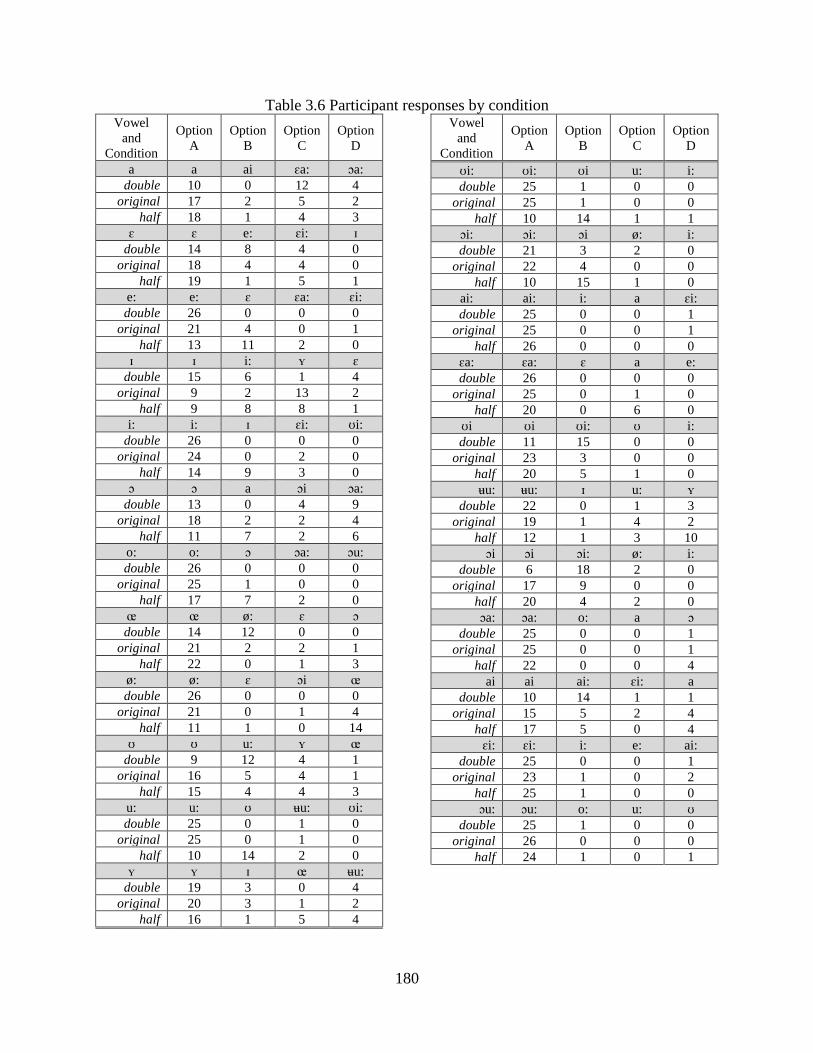
180
Table 3.6 Participant responses by condition Vowel
and
Condition
Option
A
Option
B
Option
C
Option
D
a a ai ɛa: ɔa:
double 10 0 12 4
original 17 2 5 2
half 18 1 4 3
ɛ ɛ e: ɛi: ɪ
double 14 8 4 0
original 18 4 4 0
half 19 1 5 1
e: e: ɛ ɛa: ɛi:
double 26 0 0 0
original 21 4 0 1
half 13 11 2 0
ɪ ɪ i: ʏ ɛ
double 15 6 1 4
original 9 2 13 2
half 9 8 8 1
i: i: ɪ ɛi: ʊi:
double 26 0 0 0
original 24 0 2 0
half 14 9 3 0
ɔ ɔ a ɔi ɔa:
double 13 0 4 9
original 18 2 2 4
half 11 7 2 6
o: o: ɔ ɔa: ɔu:
double 26 0 0 0
original 25 1 0 0
half 17 7 2 0
œ œ ø: ɛ ɔ
double 14 12 0 0
original 21 2 2 1
half 22 0 1 3
ø: ø: ɛ ɔi œ
double 26 0 0 0
original 21 0 1 4
half 11 1 0 14
ʊ ʊ u: ʏ œ
double 9 12 4 1
original 16 5 4 1
half 15 4 4 3
u: u: ʊ ʉu: ʊi:
double 25 0 1 0
original 25 0 1 0
half 10 14 2 0
ʏ ʏ ɪ œ ʉu:
double 19 3 0 4
original 20 3 1 2
half 16 1 5 4
Vowel
and
Condition
Option
A
Option
B
Option
C
Option
D
ʊi: ʊi: ʊi u: i:
double 25 1 0 0
original 25 1 0 0
half 10 14 1 1
ɔi: ɔi: ɔi ø: i:
double 21 3 2 0
original 22 4 0 0
half 10 15 1 0
ai: ai: i: a ɛi:
double 25 0 0 1
original 25 0 0 1
half 26 0 0 0
ɛa: ɛa: ɛ a e:
double 26 0 0 0
original 25 0 1 0
half 20 0 6 0
ʊi ʊi ʊi: ʊ i:
double 11 15 0 0
original 23 3 0 0
half 20 5 1 0
ʉu: ʉu: ɪ u: ʏ
double 22 0 1 3
original 19 1 4 2
half 12 1 3 10
ɔi ɔi ɔi: ø: i:
double 6 18 2 0
original 17 9 0 0
half 20 4 2 0
ɔa: ɔa: o: a ɔ
double 25 0 0 1
original 25 0 0 1
half 22 0 0 4
ai ai ai: ɛi: a
double 10 14 1 1
original 15 5 2 4
half 17 5 0 4
ɛi: ɛi: i: e: ai:
double 25 0 0 1
original 23 1 0 2
half 25 1 0 0
ɔu: ɔu: o: u: ʊ
double 25 1 0 0
original 26 0 0 0
half 24 1 0 1
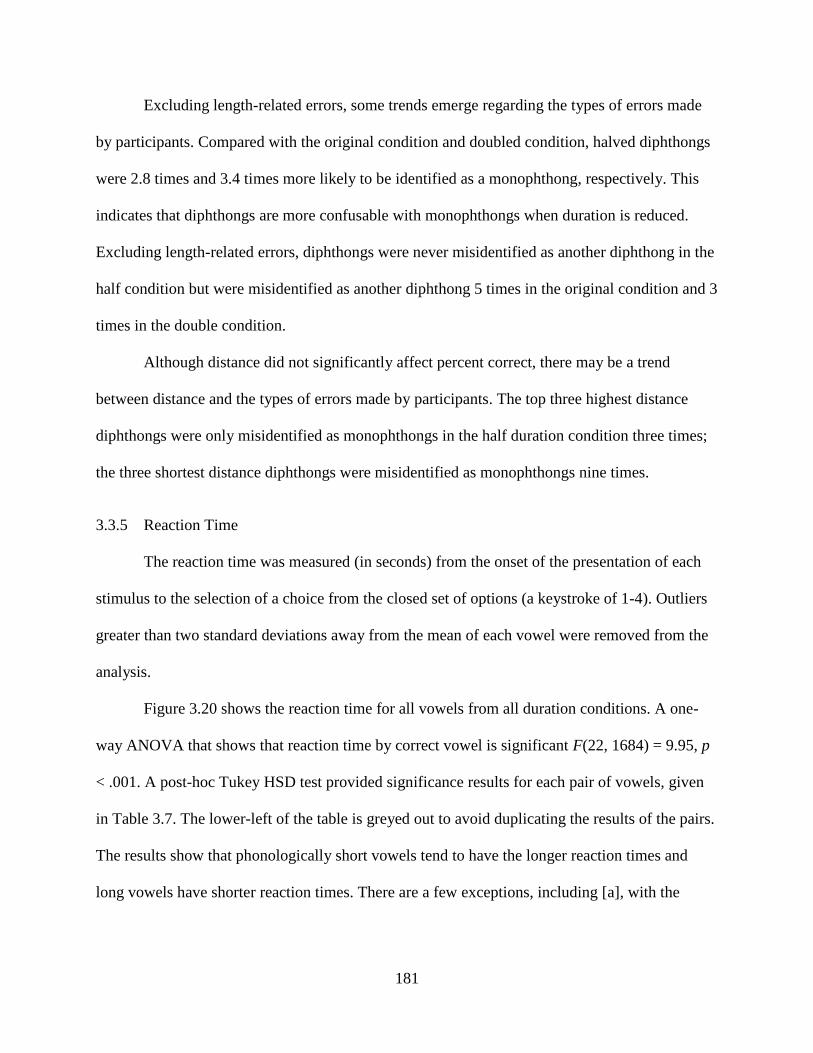
181
Excluding length-related errors, some trends emerge regarding the types of errors made
by participants. Compared with the original condition and doubled condition, halved diphthongs
were 2.8 times and 3.4 times more likely to be identified as a monophthong, respectively. This
indicates that diphthongs are more confusable with monophthongs when duration is reduced.
Excluding length-related errors, diphthongs were never misidentified as another diphthong in the
half condition but were misidentified as another diphthong 5 times in the original condition and 3
times in the double condition.
Although distance did not significantly affect percent correct, there may be a trend
between distance and the types of errors made by participants. The top three highest distance
diphthongs were only misidentified as monophthongs in the half duration condition three times;
the three shortest distance diphthongs were misidentified as monophthongs nine times.
3.3.5 Reaction Time
The reaction time was measured (in seconds) from the onset of the presentation of each
stimulus to the selection of a choice from the closed set of options (a keystroke of 1-4). Outliers
greater than two standard deviations away from the mean of each vowel were removed from the
analysis.
Figure 3.20 shows the reaction time for all vowels from all duration conditions. A one-
way ANOVA that shows that reaction time by correct vowel is significant F(22, 1684) = 9.95, p
< .001. A post-hoc Tukey HSD test provided significance results for each pair of vowels, given
in Table 3.7. The lower-left of the table is greyed out to avoid duplicating the results of the pairs.
The results show that phonologically short vowels tend to have the longer reaction times and
long vowels have shorter reaction times. There are a few exceptions, including [a], with the

182
second shortest reaction time, and [ɛa:], with the fourth longest reaction time. These results
suggest that vowel duration may have an effect on reaction time.
Figure 3.20 Reaction time by correct vowel (all conditions)
Table 3.7 Reaction time significance ɔu: a ø: ɔa: ai: ʊi ɛi: ʉu: ʊi: œ ɔi: u: o: e: ɔi i: ʏ ɔ ai ɛa: ɪ ʊ ɛ
ɔu:
* * *** *** *** *** ***
a
** ** *** *** ***
ø:
** ** ** *** ***
ɔa:
* ** ** ** ***
ai:
* ** ** ** ***
ʊi
* * *** ***
ɛi:
* * *** ***
ʉu:
* * *** ***
ʊi:
*** ***
œ
*** ***
ɔi: ** ***
u: ** ***
o:
** ***
e: ** ***
ɔi * ***
i:
***
ʏ
***
ɔ ***
ai ***
ɛa: **
ɪ **
ʊ ɛ
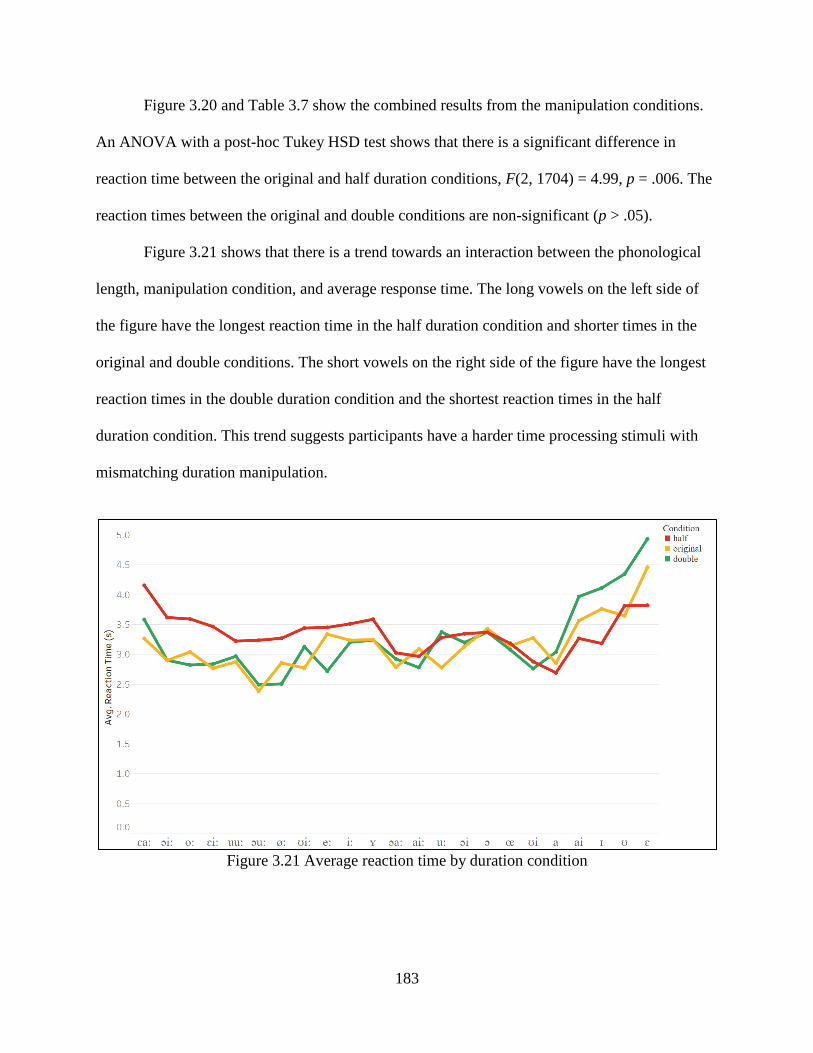
183
Figure 3.20 and Table 3.7 show the combined results from the manipulation conditions.
An ANOVA with a post-hoc Tukey HSD test shows that there is a significant difference in
reaction time between the original and half duration conditions, F(2, 1704) = 4.99, p = .006. The
reaction times between the original and double conditions are non-significant (p > .05).
Figure 3.21 shows that there is a trend towards an interaction between the phonological
length, manipulation condition, and average response time. The long vowels on the left side of
the figure have the longest reaction time in the half duration condition and shorter times in the
original and double conditions. The short vowels on the right side of the figure have the longest
reaction times in the double duration condition and the shortest reaction times in the half
duration condition. This trend suggests participants have a harder time processing stimuli with
mismatching duration manipulation.
Figure 3.21 Average reaction time by duration condition

184
An ANOVA shows that the relationship between vowel duration and response time is
significant, F(1, 1705) = 36.9, p < .001. Figure 3.22 shows that as vowel duration increases,
reaction time decreases. This indicates that the increased vowel duration is providing a
perceptual benefit, especially for phonologically long vowels.
Figure 3.22 Average reaction time by average duration
When the results in Figure 3.22 are shown separated by manipulation condition, seen in
Figure 3.23, it is clear that increased duration provides the most improvement to reaction time
for vowels in the double duration condition, whereas increasing vowel duration in the half
duration condition does not lead to improvement in reaction time.
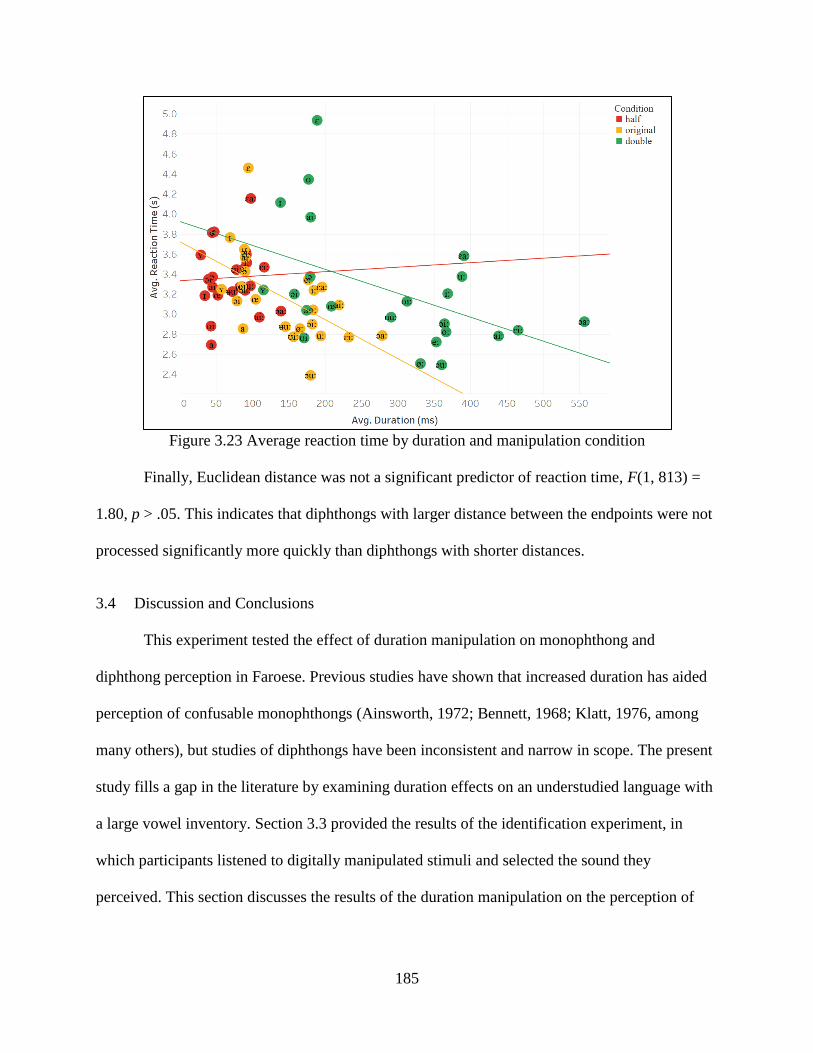
185
Figure 3.23 Average reaction time by duration and manipulation condition
Finally, Euclidean distance was not a significant predictor of reaction time, F(1, 813) =
1.80, p > .05. This indicates that diphthongs with larger distance between the endpoints were not
processed significantly more quickly than diphthongs with shorter distances.
3.4 Discussion and Conclusions
This experiment tested the effect of duration manipulation on monophthong and
diphthong perception in Faroese. Previous studies have shown that increased duration has aided
perception of confusable monophthongs (Ainsworth, 1972; Bennett, 1968; Klatt, 1976, among
many others), but studies of diphthongs have been inconsistent and narrow in scope. The present
study fills a gap in the literature by examining duration effects on an understudied language with
a large vowel inventory. Section 3.3 provided the results of the identification experiment, in
which participants listened to digitally manipulated stimuli and selected the sound they
perceived. This section discusses the results of the duration manipulation on the perception of
186
Faroese vowels and implications of the results for temporal properties in diphthong dispersion
and contrast.
Temporal features are very important to Faroese phonology; vowel length creates
contrast among and between Faroese monophthongs and diphthongs. This experiment has shown
that in all sections of the results, from the percent correct scores to the reaction time, duration
aids perception in monophthongs and diphthongs when it aligns with phonological duration.
Across all three manipulation contexts, participants were found to perform the best
overall in the original condition. Halving the duration led to the lowest overall percent correct
results. This suggests that the perception of all vowels is best when all vowels have normal
duration. This led to fewer length-based errors; the original duration had the fewest length-
related errors of all three conditions. However, the fewest non-length related errors occurred in
the doubled duration condition, indicating that outside of phonological length contrast, increased
duration improves perception. Conversely, it was shown in Table 3.4 that perception accuracy
decreases for the majority of vowels not in a length contrast when the duration is halved. These
results suggest that for a language without a phonological vowel length contrast, increased
duration would improve perception (and reduced duration would decrease perception
performance) for the entire vowel inventory. Further work is needed to test this prediction.
For vowels in a length contrast, duration has been shown to improve perception in the
direction of the length contrast: short vowels are aided in perception when the duration is halved
and long vowels are aided when the duration is doubled. This effect can be seen in the
confusability matrices, where fewer errors were made in the direction of the contrast. Opposing
directionality (where short vowels were doubled and long vowels were halved) led to the most
errors. Phonological vowel length was a significant predictor of percent correct.
187
Sections 3.3.2.1 and 3.3.2.2 show that duration and slope were also significant predictors
of percent correct and both had moderate significant correlations. Although the main correlation
indicated that increased duration leads to improved accuracy, this proves true only for
phonologically long vowels. Short diphthongs and short monophthongs decrease in accuracy as
duration increased. Short diphthongs also showed an opposing trend with regard to slope. As
slope increased, short diphthongs improved in accuracy while all other diphthongs decreased in
accuracy.
Reaction time is another cue that indicates how well participants perceive the stimuli.
Faster reaction time means that participants could more easily identify the vowel they heard;
slower reaction time indicates a delay in processing or difficulty in identifying the vowel. The
result in this experiment show that duration is a significant predictor of reaction time.
Participants respond more quickly to vowels that have a longer duration. This trend was
particularly strong in the double and original duration conditions, while duration had less of an
effect on all vowels in the halved condition. For vowels in a length contrast, long vowels had
faster reaction times in the original and doubled duration conditions while the short vowels had
faster reaction times in the halved duration condition.
With regard to the types of confusions participants made, diphthongs were found to be
more confusable with monophthongs when duration is reduced. In the half duration condition,
diphthongs were more often identified as monophthongs than in the original and double
conditions by 65% and 71%, respectively. There was no clear pattern regarding the
monophthong that was identified. Some diphthongs were more identified as a monophthong
closest to the onset or the offset, or as a nearby ‘middle ground’ monophthong. This may suggest
that the endpoints of the diphthong carry equal weight perceptually. This is a departure from

188
previous studies such as Jacewicz et al. (2003), whose production experiment concluded that
diphthong endpoints contain no essential characteristic information.
Distance may also affect confusability errors, as it was shown that the three shortest
distance diphthongs were perceived as monophthongs three times as much as the top three
longest distance diphthongs. These findings indicate that duration is being used to create contrast
in the vowel space between diphthongs and monophthongs. The results of the perception
experiment show that the effect of duration manipulation is dependent on phonological vowel
length, but otherwise increase duration improves perception. This is seen in through an increase
in percent correct, lower confusability, and increased reaction times. Increasing duration also
reduces confusability between diphthongs and monophthongs; it can be concluded that duration
is being used to create contrast in the vowel space.

189
Chapter 4
Analysis and Conclusions
4.1 Introduction
One goal of phonological theory is to explain how production and perception shape
vowel systems. Dispersion Theory (Lindblom 1986, Flemming, 2004) emphasizes that all vowels
in an inventory enter into a system of contrasts with each other; constraints on contrasts are
motivated by articulatory and perceptual principles that favor contrasts based on differences
between vowels rather than the vowels themselves. Constraints are based on goals of maximum
perceptual distinctiveness, minimum articulatory effort, and maximum number of contrasts. In
this way, the entire inventory interacts as a whole to satisfy these goals.
Currently, Dispersion Theory cannot account for vowel inventories that include
diphthong vowels, which is problematic for languages in which diphthongs equally enter into the
system of contrasts with monophthongs. This is the case for approximately one-third of the
world’s languages (Lindau et al., 1990). In current Dispersion Theory, contrast has only been
considered along two dimensions: F1 and F2. These dimensions may be sufficient to account for
(short) monophthongs but cannot account for diphthongs, which involve an interaction of quality
and quantity. The current theory empirically lacks the constraints necessary, but also does not
seek to answer theoretical questions concerning what ‘optimal’ vowel systems with diphthongs
are, how diphthongs contrast with monophthongs, or even what an ‘optimal’ diphthong might be.
Difficulties arise when including diphthongs due to their complex duality of being
composed of two vowels while acting as one unit. Previous literature has proposed hypotheses
regarding the fundamental properties of diphthongs along this duality continuum. Studies such as
Dolan and Mimori (1986) support the Frequency-Constant Hypothesis, wherein a diphthong’s
endpoints have fixed frequencies and slope may vary with speech rate. Additional research,

190
including a seminal paper by Gay (1968), supports the Slope-Constant Hypothesis, wherein a
diphthong’s slope is constant across changes in speech rate and the F2 frequencies are variable.
Previous literature has provided support for both hypotheses, but many studies have limited
scope in terms of the language(s) used and may have had flawed methodology. No previous
studies have a combined analysis of diphthong production and perception from more than one
language.
This study examined how the phonetic properties of diphthong production at different
speech rates and how speech rate manipulation affects diphthong perception; the results of these
studies, as well as previous literature on diphthong typology, form the basis for grounding the
production- and perception-based constraints proposed in the present analysis.
This chapter provides an overview of current Dispersion Theory mechanics and how a
monophthong inventory can be derived. After a review of the results of the production and
perception experiments and a discussion of the duration dimension, three constraints—in
addition to Minkova and Stockwell (2003)’s HEARCLEAR F1/F2 and *EFFORT—are proposed to
initiate the inclusion of diphthongs into Dispersion Theory: *DUR, MINDIST ONSET, and MINDIST
OFFSET. This chapter concludes with remarks on the theoretical implications of this analysis and
suggestions for future work.
4.2 Dispersion Theory Overview
In his Optimality Theoretic (OT) implementation of the Theory of Adaptive Dispersion
(Lindblom, 1986), Flemming (2004) formalized the theory that relationships between forms in a
language inventory are governed by constraints on contrasts. The goals of these constraints are
phonetically-driven and based on the principle of perceptual distinctiveness. This section gives a
brief review of the goals of Dispersion Theory, for more details see Section 1.2.

191
The first goal of Dispersion Theory (hereafter DT) is to maximize the distinctiveness of
contrasts. Maximizing distinctiveness between elements is a perception-based goal to reduce the
likelihood of confusion between those elements. Flemming formalizes this goal with MINDIST F1
and MINDIST F2 constraints that require a minimum distance between vowels along the height
and backness dimensions.
The second goal of DT is to minimize the effort on behalf of the speakers of a language.
Unlike the goal of maximizing distinctiveness, this goal is articulatory-based and prevents very
extreme productions that may result from maximizing distinctiveness in the vowel space.
Formalization of *EFFORT has generally been avoided by Flemming unless it is necessary for
specific examples in his work.
The third and final goal of DT is to maximize the number of contrasts. This positive
constraint, MAXIMIZE CONTRASTS, is based on the idea that having a large number of contrasts
prevents excessively long words by increasing the vocabulary with more sounds. By making this
a positive constraint, the largest viable inventory that satisfies the constraint ranking is selected,
dependent on its ranking within the MINDIST constraint hierarchy.
These goals and their corresponding constraints have language-specific rankings and
candidate vowel inventories are selected depending on the best fit of the constraint ranking. DT
differs from traditional OT in that its candidates are entire vowel inventories at one level (the
output) rather than between input-output forms. This departure emphasizes the importance of and
contrast between all members of the inventory. Current DT constraints are formulated to operate
over contrasts along the F1 and F2 dimensions. A quantized, multi-dimensional (F1 x F2) vowel
matrix is used to formulize constraints on distance between stimuli.

192
Flemming (2004) shows how DT can be used to model challenging inventories such as
those that are vertical (such as Marshallese) and those with fully neutralized vowel reduction.
Problems arise for the current DT models with vowels that are contrastive along dimensions
other than F1 and F2, notably phonation, nasalization, and duration. The following section
demonstrates how Dispersion Theory can be used to derive the Vietnamese monophthong
inventory. Sections 4.4.1 and 4.4.3 propose constraints needed to expand the existing theory to
account for diphthongs.
4.2.1 Vietnamese Monophthongs
In this section, the existing Dispersion Theory constraints are used to derive the
monophthong inventory of Vietnamese as an example of the current DT mechanics and their
abilities. An additional simple derivation example is provided in Section 1.2.2. The constraints
used here are those of Flemming (2004): MINDIST = D:n, MAXIMIZE CONTRASTS, and *EFFORT.
In his analyses, Flemming uses a multi-dimensional vowel space of F1 and F2, which
quantizes the vowel space, a conception he adapted from psychological work on identification
and categorization. From this 6×7 grid, vowels are specified by their coordinate values, e.g. [F1
1, F2 6] = [i]. Each space in the grid has a chosen representative IPA symbol for that vowel
quality, although note that not every location is filled (see [F1 2, F2 2] for the unrounded
counterpart to [ʊ]). By quantizing the vowel space in this way, Flemming is converting the
continuous dimension of frequency into a rigid, discrete dimension. There may be several issues
when imposing such a structure on a continuous dimension of this type, as mentioned in Petersen
(2016). One assumption that is made by this theory is that pronunciation matches the IPA symbol
being used to transcribe the vowels in any given language. However, actual production may vary
widely from these ‘idealized’ representations, especially in diphthongs. The differences between
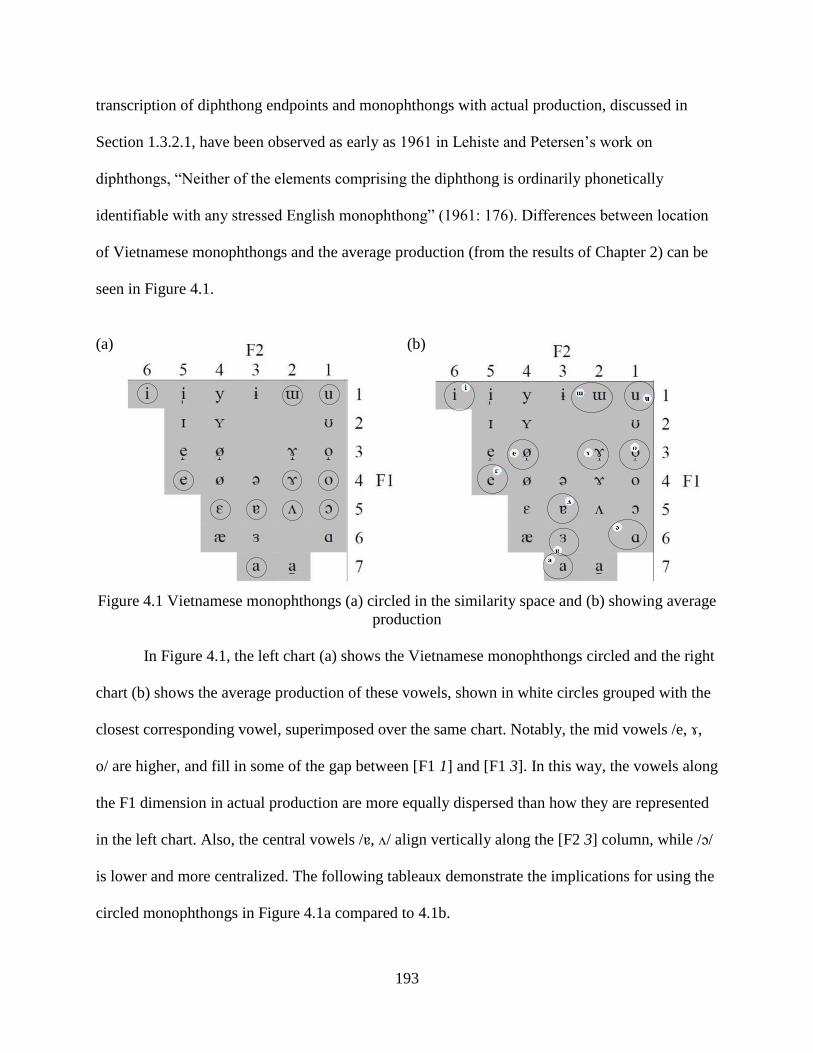
193
transcription of diphthong endpoints and monophthongs with actual production, discussed in
Section 1.3.2.1, have been observed as early as 1961 in Lehiste and Petersen’s work on
diphthongs, “Neither of the elements comprising the diphthong is ordinarily phonetically
identifiable with any stressed English monophthong” (1961: 176). Differences between location
of Vietnamese monophthongs and the average production (from the results of Chapter 2) can be
seen in Figure 4.1.
(a) (b)
Figure 4.1 Vietnamese monophthongs (a) circled in the similarity space and (b) showing average
production
In Figure 4.1, the left chart (a) shows the Vietnamese monophthongs circled and the right
chart (b) shows the average production of these vowels, shown in white circles grouped with the
closest corresponding vowel, superimposed over the same chart. Notably, the mid vowels /e, ɤ,
o/ are higher, and fill in some of the gap between [F1 1] and [F1 3]. In this way, the vowels along
the F1 dimension in actual production are more equally dispersed than how they are represented
in the left chart. Also, the central vowels /ɐ, ʌ/ align vertically along the [F2 3] column, while /ɔ/
is lower and more centralized. The following tableaux demonstrate the implications for using the
circled monophthongs in Figure 4.1a compared to 4.1b.
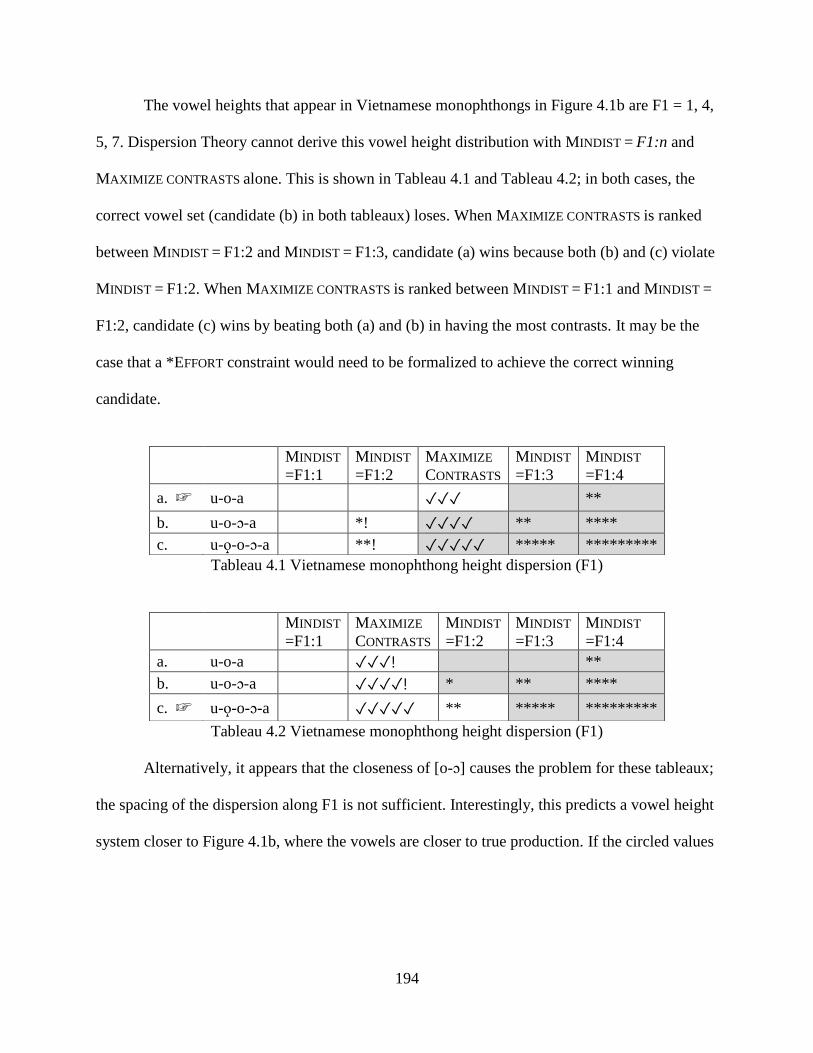
194
The vowel heights that appear in Vietnamese monophthongs in Figure 4.1b are F1 = 1, 4,
5, 7. Dispersion Theory cannot derive this vowel height distribution with MINDIST = F1:n and
MAXIMIZE CONTRASTS alone. This is shown in Tableau 4.1 and Tableau 4.2; in both cases, the
correct vowel set (candidate (b) in both tableaux) loses. When MAXIMIZE CONTRASTS is ranked
between MINDIST = F1:2 and MINDIST = F1:3, candidate (a) wins because both (b) and (c) violate
MINDIST = F1:2. When MAXIMIZE CONTRASTS is ranked between MINDIST = F1:1 and MINDIST =
F1:2, candidate (c) wins by beating both (a) and (b) in having the most contrasts. It may be the
case that a *EFFORT constraint would need to be formalized to achieve the correct winning
candidate.
Tableau 4.1 Vietnamese monophthong height dispersion (F1)
Tableau 4.2 Vietnamese monophthong height dispersion (F1)
Alternatively, it appears that the closeness of [o-ɔ] causes the problem for these tableaux;
the spacing of the dispersion along F1 is not sufficient. Interestingly, this predicts a vowel height
system closer to Figure 4.1b, where the vowels are closer to true production. If the circled values
MINDIST
=F1:1
MINDIST
=F1:2
MAXIMIZE
CONTRASTS
MINDIST
=F1:3
MINDIST
=F1:4
a. ☞ u-o-a ✓✓✓ **
b. u-o-ɔ-a *! ✓✓✓✓ ** ****
c. u-o̝-o-ɔ-a **! ✓✓✓✓✓ ***** *********
MINDIST
=F1:1
MAXIMIZE
CONTRASTS
MINDIST
=F1:2
MINDIST
=F1:3
MINDIST
=F1:4
a. u-o-a ✓✓✓! **
b. u-o-ɔ-a ✓✓✓✓! * ** ****
c. ☞ u-o̝-o-ɔ-a ✓✓✓✓✓ ** ***** *********
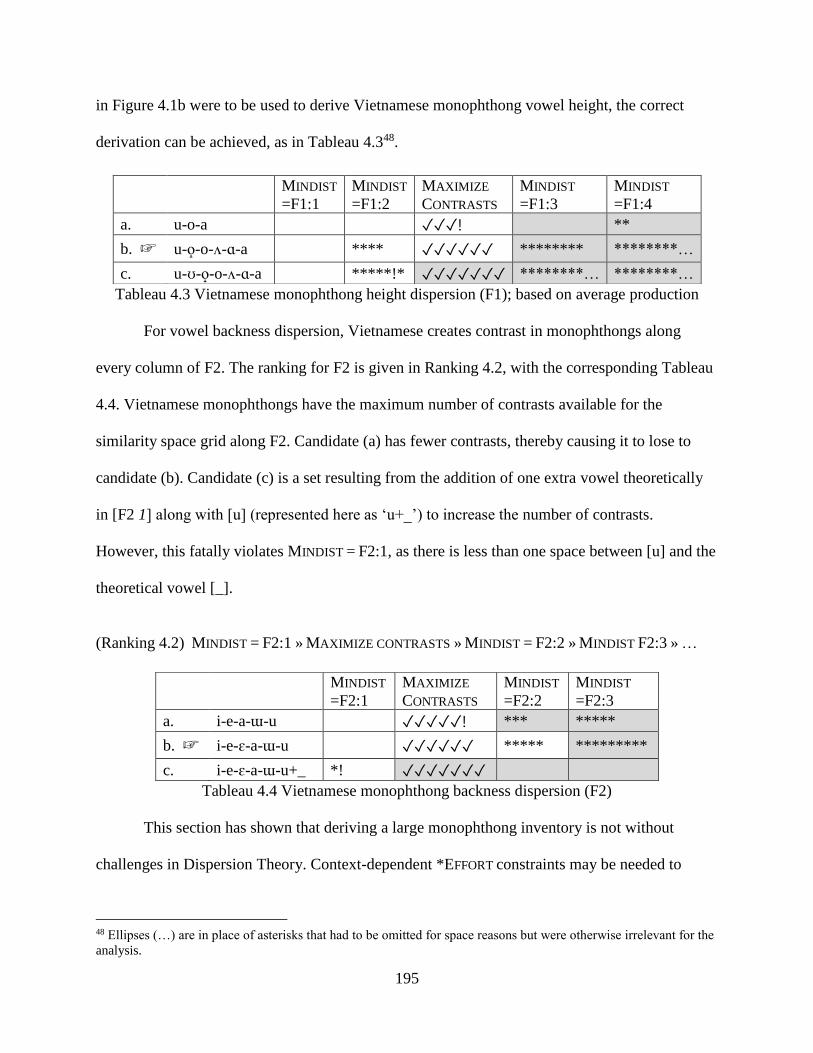
195
in Figure 4.1b were to be used to derive Vietnamese monophthong vowel height, the correct
derivation can be achieved, as in Tableau 4.348.
Tableau 4.3 Vietnamese monophthong height dispersion (F1); based on average production
For vowel backness dispersion, Vietnamese creates contrast in monophthongs along
every column of F2. The ranking for F2 is given in Ranking 4.2, with the corresponding Tableau
4.4. Vietnamese monophthongs have the maximum number of contrasts available for the
similarity space grid along F2. Candidate (a) has fewer contrasts, thereby causing it to lose to
candidate (b). Candidate (c) is a set resulting from the addition of one extra vowel theoretically
in [F2 1] along with [u] (represented here as ‘u+_’) to increase the number of contrasts.
However, this fatally violates MINDIST = F2:1, as there is less than one space between [u] and the
theoretical vowel [_].
(Ranking 4.2) MINDIST = F2:1 » MAXIMIZE CONTRASTS » MINDIST = F2:2 » MINDIST F2:3 » …
Tableau 4.4 Vietnamese monophthong backness dispersion (F2)
This section has shown that deriving a large monophthong inventory is not without
challenges in Dispersion Theory. Context-dependent *EFFORT constraints may be needed to
48 Ellipses (…) are in place of asterisks that had to be omitted for space reasons but were otherwise irrelevant for the
analysis.
MINDIST
=F1:1
MINDIST
=F1:2
MAXIMIZE
CONTRASTS
MINDIST
=F1:3
MINDIST
=F1:4
a. u-o-a ✓✓✓! **
b. ☞ u-o̝-o-ʌ-ɑ-a **** ✓✓✓✓✓✓ ******** ********…
c. u-ʊ-o̝-o-ʌ-ɑ-a *****!* ✓✓✓✓✓✓✓ ********… ********…
MINDIST
=F2:1
MAXIMIZE
CONTRASTS
MINDIST
=F2:2
MINDIST
=F2:3
a. i-e-a-ɯ-u ✓✓✓✓✓! *** *****
b. ☞ i-e-ɛ-a-ɯ-u ✓✓✓✓✓✓ ***** *********
c. i-e-ɛ-a-ɯ-u+_ *! ✓✓✓✓✓✓✓

196
predict the correct inventory if real production data is not used. This may also mean that there are
problems with dividing the vowel space into an equal 6×7 grid, giving equal weight to each
member of each row and column. It is not clear that these subdivisions correctly correspond to
how speakers produce vowels or how listeners categorize vowels. Another approach developed
in Flemming (1995) and used in Minkova and Stockwell (2003) is the division of F1 and F2 into
four levels of sonority (lowest F1/F2, low F1/F2, high F1/F2, highest F1/F2) instead of the seven
levels of F1 and six levels of F2 in Flemming (2004).
The problematic tableaux (Tableau 4.1 and 4.2) in this section may also have been the
result of the fact that in Vietnamese, these monophthongs do not occur as an isolated set of
vowels—they are contrastive with diphthongs. In this case, these examples further demonstrate
the necessity of incorporating diphthongs into analyses of vowel system dispersion.
The following sections discuss the results of the experiments in Chapters 2 and 3, discuss
the importance of the duration dimension, and propose additional constraints for diphthong
dispersion analysis.
4.3 Experimental Results
The experiments were conducted in this study to lead to a greater understanding of
diphthong production and perception properties. This section provides a brief summary of the
results of these experiments. The results of these experiments are used to inform the analysis of
incorporating diphthongs in Dispersion Theory in the following section.
4.3.1 Production Experiment
The first experiment of this study tested the effect of speech rate on diphthong acoustic
properties in production. Prior research has shown that diphthong properties may be sensitive to
changes in speech rate, and determining how those properties change (or do not change) provides

197
insight into the structure of diphthongs. The production experiment tested three languages with
large inventories from different languages to find cross-linguistic trends. From an analysis on
diphthong slope, distance, and endpoints, it was found that endpoints do not significantly vary
across speech rate along any individual dimension (such as onset F1, offset F1, etc.), slope varies
in two languages (Faroese and Cantonese) but not the third (Vietnamese), and distance
significantly varies in all three languages. Analysis of the diphthong endpoint and monophthong
target spectral overlap across speech rates showed that diphthong endpoint movement as a result
of reduction at the faster rate closely parallels the amount of movement in monophthong targets.
Speakers were therefore maintaining diphthong endpoint target positions within the vowel space,
while the vowel space as a whole was reduced at faster speech rates. Diphthong slope was not
constant in Cantonese across all speech rates and varied in two of three speech rate conditions in
Vietnamese. Slope is therefore not a defining feature of diphthongs cross-linguistically; the
transition between the endpoints appears to be a consequence of speakers maintaining endpoint
targets and slope may or may not significantly vary as a result.
With regard to production, diphthong Euclidean distance varies across changes in speech
rate, although it appears that speakers adhere to endpoint targets rather than using slope as an
identifying feature. Diphthong endpoints can therefore be treated comparably to monophthong
targets in Dispersion Theory. Because speakers are using endpoint targets comparably to
monophthongs, it can be inferred that speakers have access to this information; therefore, it
follows that dispersion constraints can operate over diphthong endpoints.
4.3.2 Perception Experiment
Dispersion Theory models vowel inventories as systems of perceptual contrast between
their members. The second experiment in this study tested the effect of duration manipulation on
198
diphthong perception in Faroese to understand how diphthongs interact contrastively with the
members of a vowel inventory. This identification experiment included Faroese stimuli that were
digitally manipulated by duration. Duration was chosen because the fact that diphthongs change
in quality over time is one of the main properties that distinguish diphthongs from
monophthongs. Manipulating the time variable would therefore provide insight into how
duration provides a dimension of contrast in the vowel space.
In Faroese, monophthongs and diphthongs have allophonic vowel length contrasts.
Manipulating the duration and testing vowel identification showed that accuracy improved with
manipulation in the direction of the contrastive length, i.e., short vowels were better perceived
with manipulation that decreased their duration and long vowels were better perceived with
increased duration. For vowels that had no length contrast, increasing the duration improved
perception and decreasing duration worsened perception. Overall, duration had a significant
main effect on accuracy. Reaction times were also significantly lower when the manipulated
duration aligned with phonological vowel length. Increased duration improved reaction time of
vowels overall.
With regard to the types of confusions made, long vowels and short vowels were most
often mistaken for their length counterpart when halved or doubled in duration, respectively.
Diphthongs were also found to be more confusable with monophthongs when duration was
reduced; diphthongs were either identified as the monophthong closest to the onset or offset
targets, or as another nearby monophthong (depending on the closed set of options for each
stimuli item). There was no clear pattern for the monophthong selected when a diphthong was
misidentified, suggesting that diphthong endpoints both carry essential perceptual information.
Diphthongs with a longer distance between the endpoints were less likely to be confusable with

199
monophthongs than diphthongs with very short distances, although distance was not an overall
significant predictor for accuracy or reaction time.
The fact that diphthong distance did not lead to greater perceptual accuracy contradicts
predictions in previous work on diphthong typology (Edström, 1971; Sánchez Miret, 1998;
Sands, 2004). These works state that diphthongs with greater F1 and F2 contrast (e.g., /ai/ and
/au/) are more frequent cross-linguistically because the larger distance between the endpoints
creates a greater contrast and therefore leads to better perception. Although the results from this
experiment do not support this prediction, it may be the case that the sample size used here (one
language, Faroese) was not large enough to confirm the maximum distance theory and that
languages overall do show this trend.
4.3.3 Duration
In order to incorporate diphthongs and vowels with length contrasts into DT, duration
must be included in DT as a dimension of contrast. Duration has long been considered an
important cue for monophthong identification in previous literature, especially with respect to
larger vowel inventories or inventories with highly confusable vowels, but prior studies have
excluded diphthongs.
The interaction of vowel length and vowel inventory is evident when one examines the
typology of vowel systems. Maddieson (1984)'s large-scale database UPSID shows that of the
languages surveyed, the probability of a language using contrastive length in the vowel system
increases with the number of vowel quality contrasts. Maddieson observes, "No language with 3
vowel qualities includes length [contrast], only 14.1% of the languages with 4-6 vowel qualities
have some inherent length differences, whereas 24.7% of languages with 7-9 vowel qualities
have length, and 53.8% of languages with 10 or more vowel qualities have length," (1984:129).
200
Simulations in Joanisse & Seidenberg (1998) suggest, however, that length differences are a
weaker cue than spectral differences, which is why length contrasts are often accompanied by a
small contrast in quality, such as with /i:/ ~ /ɪ/ in English.
The extra duration not only gives additional time to the listener to perceive the vowel, but
also is a cue itself for the identity of a vowel. Although his study was mainly focused on the
effect of tempo on vowel duration, Ainsworth (1972) showed that longer duration especially
aided identification of vowels at the center of the vowel space, which are more likely to be
confusable with neighboring vowels. To reduce confusability, it has been found more broadly
that for vowel inventories above nine vowels, languages will tend to make use of secondary
features, such as duration, nasalization, and/or phonation, to distinguish additional vowels
(Schwartz et al., 1997; Vallée, 1994). The results of the present study support previous findings
that listeners more correctly identify an auditory feature when the duration of that feature has a
longer duration (J. Cole & Kisseberth, 1994; Kaun, 1995).
As for duration in diphthongs, the experiments in this study have shown that increased
duration reduces confusability with monophthongs, improves reaction time, and leads to better
perceptual accuracy. Diphthongs may also enter into phonological length contrasts; in these
cases, increasing or decreasing duration should align with the length of the diphthong element to
improve perception.
Evidence from inventory typology in UPSID shows that as a language increases in the
number of contrasts in its inventory, it is also more likely there will be contrasts along the
duration dimension. This appears to be an implicational relation, where long vowels and
diphthongs are only found if an inventory also contains short vowels; however, it is not the case
that languages must have long vowels in order to have diphthongs. Lass (1984:97) categorizes
201
possible length relations in languages with the following four types, which are all included in the
present study (excepting Type I):
I. Languages with only short vowels and no diphthongs
II. Languages with short vowels and diphthongs only, where the diphthongs are
quantitatively indistinguishable from the short vowels (e.g., Vietnamese)
III. Languages with short vowels and diphthongs/long vowels, where there is a genuine
quantitative contrast, and diphthongs function as long (subcase: languages with short
and long vowels, with no diphthongs) (e.g., Cantonese)
IV. Languages with short and long vowels, and short and long diphthongs (e.g., Faroese)
In sum, these findings point to the ability of speakers to reduce confusability in the
frequency domain by expanding contrasts to the time domain, either with contrastive length (e.g.,
long vs. short monophthongs), quality (e.g., diphthongs), or both length and quality (e.g., long
vs. short diphthongs). It is necessary to include additional dimensions of contrast into theories of
vowel dispersion to create a more complete theory that account for larger vowel inventories and
different types of contrast.
4.4 Accounting for Diphthongs: Constraints
This section proposes constraints that will help introduce diphthongs into Dispersion
Theory using results of the production and perception experiments in this study and evidence
found in typological literature on diphthongs. The first section demonstrates how to introduce
duration as contrast into vowel inventories with the constraint *DUR by ranking *DUR with
MAXIMIZE CONSTRAINTS and MINDIST. This constraint is based in typological findings (UPSID)
that as languages increase their monophthong inventories, the probability they will use duration

202
contrasts increases. The next section takes a closer look at dispersion between diphthong
endpoints and the constraints proposed by Minkova and Stockwell (2003) to maximize
diphthong trajectory distance: HEARCLEAR F1 and HEARCLEAR F2. Finally, the next section
discusses distance between diphthongs and monophthongs. Minimum distance constraints
governing changes in distance over time are proposed as a way to incorporate the duration
dimension into Dispersion Theory and account for diphthongs.
4.4.1 MAXIMIZE CONTRASTS and *DUR
The first step to including diphthongs in Dispersion Theory is counting them in the
positive scalar constraint MAXIMIZE CONTRASTS. Diphthongs should be considered as full
members of vowel inventories that enter into contrast with all other members of the inventory,
including monophthongs and other diphthongs. This addition would create a more unified theory
that involves both ‘quality’ and ‘quantity’. In this way, MAXIMIZE CONTRASTS would function as
it does in Flemming (2004). Although Flemming does not specifically omit diphthongs, he also
does not address them, and it is therefore made explicit here. MAXIMIZE CONTRASTS is a positive
constraint for which a check mark (✓) is given for each contrasting sound category (including
monophthongs and diphthongs); more check marks indicate a better candidate. This is shown in
the incomplete Tableau 4.5.
Tableau 4.5 Scaling of the MAXIMIZE CONTRASTS constraint
MAXIMIZE
CONTRASTS
a. i-u-a ✓✓✓
b. i-u-a-ai ✓✓✓✓
c. i-u-a-ai-au ✓✓✓✓✓
d. i-u-a-e-o ✓✓✓✓✓
203
In this tableau, both candidate (c) and candidate (d) have the same number of contrasts;
there is no way to specify at what point an inventory allows for contrasts that include duration
(long vowels or diphthongs). I propose a constraint, *DUR, which prevents length contrasts.
However, as the monophthong inventory grows and candidates incur more violations of
MAXIMIZE CONTRASTS and MINDIST, duration contrasts will surface; this would derive the
typological trend for larger inventories to include duration as a dimension of contrast.
*DUR(ATION): Incur violation for contrast along the duration dimension
This is a negative constraint, meaning that the presence of duration contrast is a violation
(unlike the positive scalar constraint MAXIMIZE CONTRASTS). This reflects the fact that elements
with duration contrast are in an implicational relation with non-durational elements: an inventory
only has duration contrast if there are elements without it. There is no *F1 or *F2 constraint here,
but the presence of *DUR in the system will mean it’s the last of the three dimensions (discussed
here) used to differentiate vowels.
The ranking of *DUR with MAXIMIZE CONTRASTS and MINDIST constraints produces
vowel inventories with varying sets of monophthongs and diphthongs, as shown in Tableaux 4.6-
4.11. These examples use a simplified MINDIST constraint where one violation (*) is assigned for
every monophthong above 4. No additional violation is given to additional diphthongs, as they
create contrast along the duration dimension. A more detailed analysis of minimum distance
between monophthongs and diphthongs is given in Section 4.4.3.
In Tableau 4.6, ranking *DUR » MAXIMIZE CONTRASTS » MINDIST indicates a language
prefers maximum contrasts but no duration contrasts. The inventory with the most
monophthongs is the winner, candidate (a).

204
Tableau 4.6
In Tableau 4.7, ranking *DUR » MINDIST » MAXIMIZE CONTRASTS indicates a language prefers no
duration but also a greater minimum distance between elements. Candidate (b), the smallest
inventory with no duration contrasts, wins.
Tableau 4.7
Tableau 4.8 shows a ranking of MAXIMIZE CONTRASTS » *DUR » MINDIST for a language that
prefers to maximize contrasts, but again does not prefer duration contrast over more
monophthongs. As with Tableau 4.6, candidate (a) wins.
Tableau 4.8
*DUR MAXIMIZE
CONTRASTS MINDIST
a. ☞ i-a-u-o-e-ə ✓✓✓✓✓✓ **
b. i-a-u-o-e ✓✓✓✓✓! *
c. i-a-u-o-ai *! ✓✓✓✓✓
d. i-a-u-o-e-ai *! ✓✓✓✓✓✓ *
*DUR MINDIST MAXIMIZE
CONTRASTS
a. i-a-u-o-e-ə **! ✓✓✓✓✓✓
b. ☞ i-a-u-o-e * ✓✓✓✓✓
c. i-a-u-o-ai *! ✓✓✓✓✓
d. i-a-u-o-e-ai *! * ✓✓✓✓✓✓
MAXIMIZE
CONTRASTS *DUR MINDIST
a. ☞ i-a-u-o-e-ə ✓✓✓✓✓✓ **
b. i-a-u-o-e ✓✓✓✓✓! *
c. i-a-u-o-ai ✓✓✓✓✓! *
d. i-a-u-o-e-ai ✓✓✓✓✓✓ *! *

205
In Tableau 4.9, the ranking of MAXIMIZE CONTRASTS » MINDIST » *DUR results in a winner with
a larger monophthong inventory and also diphthongs, candidate (d).
Tableau 4.9
For both Tableaux 4.10 and 4.11, ranking MINDIST as the highest constraint favors candidate (c),
an inventory with fewer monophthongs and also diphthongs.
Tableau 4.10
Tableau 4.11
These tableaux have shown how the *DUR constraint can be incorporated with existing
Dispersion Theory constraints to include inventories with duration contrasts. Through the
different ranking of *DUR, MAXIMIZE CONTRASTS, and MINDIST, each of the possible candidates
was able to be derived. Overall, when *DUR is ranked below MINDIST, duration contrasts (long
MAXIMIZE
CONTRASTS MINDIST *DUR
a. i-a-u-o-e-ə ✓✓✓✓✓✓ **!
b. i-a-u-o-e ✓✓✓✓✓! *
c. i-a-u-o-ai ✓✓✓✓✓! *
d. ☞ i-a-u-o-e-ai ✓✓✓✓✓✓ * *
MINDIST MAXIMIZE
CONTRASTS *DUR
a. i-a-u-o-e-ə **! ✓✓✓✓✓✓
b. i-a-u-o-e *! ✓✓✓✓✓
c. ☞ i-a-u-o-ai ✓✓✓✓✓ *
d. i-a-u-o-e-ai *! ✓✓✓✓✓✓ *
MINDIST *DUR MAXIMIZE
CONTRASTS
a. i-a-u-o-e-ə **! ✓✓✓✓✓✓
b. i-a-u-o-e *! ✓✓✓✓✓
c. ☞ i-a-u-o-ai * ✓✓✓✓✓
d. i-a-u-o-e-ai *! * ✓✓✓✓✓✓
206
vowels not shown here) appear in the winning inventory. To predict whether long vowels or
diphthongs will surface, additional constraints are needed, such as the minimum distance
constraints on onset and offset points proposed in Section 4.4.3.
4.4.2 Maximizing Trajectory: HEARCLEAR F1 and F2
Central to Dispersion Theory is the goal of maximizing the recoverability of spoken
communication by enforcing constraints on minimum distance between contrasting elements. All
previous attempts to derive diphthongs are based on the theory that diphthong endpoints should
be maximally distinct along F1 and F2 (Amos, 2011; Bermúdez-Otero, 2003; Minkova &
Stockwell, 2003). For Bermúdez-Otero, the context-free constraint CLEARDIPH favored
diphthongs with maximum auditory distance between onset and offset targets; this is in
opposition to CLIPDIPH, which favors minimization between the two targets (a variation of
*EFFORT). Amos (2011) also enforces separation between onset and offset height through the
two constraints DIPHCONT2 and DIPHCONT1, which act similarly to MINDIST = F1:2 and MINDIST
= F1:1, respectively. Minkova and Stockwell’s minimum distance constraints, HEARCLEAR =
F1:n and HEARCLEAR = F2:n, are the most developed of the previous work. They function
similarly to Flemming (1995, 2004) in that onset and offset targets are evaluated like
monophthongs in a multi-dimensional similarity space.
An example showing the ranking of perceptual well-formedness (i.e., amount of distance)
in backness from [i-y] to [ɒ-y]49, from Minkova and Stockwell (2003: Tableau 2), is reproduced
here as Tableau 4.12. Note that Minkova and Stockwell use the non-standard sad, neutral, and
49 To show the shift in English dialects (including Cockney English, London, Australian, New Zealand, etc.) from
[iy] to [ɒy].

207
smiling face to the pointing finger to represent the gradual effect of HEARCLEAR on diphthong
well-formedness.
Tableau 4.12 Backness well-formedness for English dialects from Minkova & Stockwell (2003):
Tableau 2
Minkova and Stockwell also include a *EFFORT constraint which favors diphthongs with the
shortest possible trajectories (shorter trajectories require fewer gestures, save economy of time
and require less muscle energy).
Note that these constraints all use diphthong endpoints as the primary feature rather than
using a diphthong’s slope. The results of this study show that this is the correct assumption, as it
is possible for a diphthong’s slope to vary with speech rate. The production experiment showed
that movement found in the diphthong endpoints parallels that of monophthongs as a result of a
shrinking vowel space at faster speech rates.
These constraints are supported by frequency data in typological work, especially in
Edström (1971), Lindblom (1986), and Sands (2004), in which diphthongs with the greatest
height and backness differences (e.g., /ai/, /au/) are among the most common cross-linguistically.
However, recall that the results of this study have not shown that languages use maximum
distance between onsets and offsets to reduce confusability in diphthongs. Distance was not a
significant predictor of either accuracy or response time in the perception experiment, indicating
HEARCLEAR
F2 = 1
HEARCLEAR
F2 = 2
HEARCLEAR
F2 = 3
a. [i-y] *! * *
b. [ə-y] * *
c. [a-y] * *
d. [ɐ-y] * *
e. ☺ [ʌ-y]
f. ☺ [ɑ-y]
g. ☺ [ɒ-y]

208
that a larger distance between diphthong endpoints did not aid perception of the diphthongs. Still,
the three shortest distance diphthongs were more often confused with monophthongs than the
three longest distance diphthongs when the duration was halved, despite the overall trend not
being significant. Additionally, it appears that speakers maintain a minimum distance between
the onset and offset targets; a floor effect emerged in the production experiment, where
diphthongs with smaller distances did not reduce their trajectory distance as much as diphthongs
with longer trajectories. Finally, it was shown that speakers increase distance with increases in
duration, indicating that with time, speakers intend to maximize usage of the space and create
contrast between endpoints.
With this evidence and the strong support for maximum distance of diphthong endpoints
in typological literature, it is argued here that HEARCLEAR F1 and F2 (Minkova & Stockwell,
2003) should be included as part of the analysis of diphthongs in Dispersion Theory, along with
their implementation of *EFFORT.
These constraints reflect typological trends in diphthongs cross-linguistically. Future
work should include looking at the additional patterns in diphthong typology, such as those
found in Sands (2004). In addition to the goal of maximizing the formant trajectory, Sands also
finds that languages may prefer one member of adjacent vocalics to be high (High Prevalence)
and that adjacency of two back-round vocalics is dispreferred (Back-Round Dispreference).
Additional perceptual experimentation is needed to further investigate these observations and
propose the relevant constraints.
The maximum trajectory constraints HEARCLEAR F1 and F2 as used in Minkova and
Stockwell’s analysis can only evaluate one diphthong at a time, as shown in Tableau 4.12.
Although the HEARCLEAR constraints are necessary for deriving diphthongs with the maximum

209
trajectory, it does not evaluate diphthongs as part of the entire inventory, in contrast with other
diphthongs and monophthongs. However, it is necessary to adapt the HEARCLEAR constraints to
evaluate diphthongs as a part of the entire inventory; this is based on the Dispersion Theory
principle that markedness is based on contrasts between the set of vowels rather than as a
property of the sounds themselves.
It is possible to include HEARCLEAR constraints in the derivation of a vowel inventory
when the violations for each of the diphthongs are aggregated for each constraint. In Tableau
4.13, candidate (a) has the most well-formed diphthongs in terms of maximum trajectory
distance. Showing how the violations can add up, candidate (c) has two violations under
HEARCLEAR = F1:4, one for [ei] and one for [ou].
Tableau 4.13
4.4.3 MINIMUM DISTANCE: ONSET and OFFSET
In order to evaluate diphthongs alongside monophthongs and other diphthongs, the
quality differences between all inventory members must be evaluated across time. I propose that
minimum distance constraints can operate over the vowel space at points of time that correspond
to the onset and offset points of both monophthongs and diphthongs. In this analysis,
monophthongs are assumed to have steady quality throughout their duration50; thus, their onset
50 This is indeed a simplification, as it has been often cited that monophthongs do have some amount of movement
in frequency over time and this may aid in their perception (Hillenbrand, 2013; Morrison, 2013; Nearey & Assmann,
HEARCLEAR
= F1:4
HEARCLEAR
= F1:5
HEARCLEAR
= F1:6
HEARCLEAR
= F2:1
HEARCLEAR
= F2:2
HEARCLEAR
= F2:3
a. ☺ i-a-u-
ai-au *
b. i-a-u-
ai-ou * * * * * *
c. i-a-u-
ei-ou ** ** ** ** ** **
210
and offset points are equal. Diphthongs contrast by having different qualities at these points in
time. This is an extreme simplification of the time dimension to only two points in time, but it
could be developed into a more robust representation in future work.
By separating F1 and F2 (as in Flemming (2004) and Minkova & Stockwell (2003)) and
simplifying the time dimension to the onset and offset, distance between the onset and offset can
be represented in Figure 4.2 and Figure 4.3. The same separations and symbolic representations
of vowel height and backness from Flemming (2004)’s similarity space are used. The spaces in
these figures are not complete for space reasons, though each position in the matrix theoretically
includes every possible combination of that backness and height (for instance, in Figure 4.2, the
diphthongs in [ONSET 1, OFFSET 7] show [ia, ua], though it contains all permutations of [i, i̩, y, ɨ,
ɯ, u] as the onset and [a, a̠] as the offset); the diphthongs shown are representative of each
position in the space along F1 or F2.
Constraints can now specify minimal distance between contrasting elements (including
both monophthongs and diphthongs) along all three dimensions: F1, F2, and time. These
constraints a formulated as minimum distance constraints similar to those of Flemming (2004),
defined below.
MINDIST ONSET = D:n: Maintain a minimum distance n between onset elements along
dimension D, where D is F1 or F2
MINDIST OFFSET = D:n: Maintain a minimum distance n between offset elements along
dimension D, where D is F1 or F2
1986). Crucially, this movement in monophthongs is phonetic (i.e., it is not being used to create a phonemic
contrast).
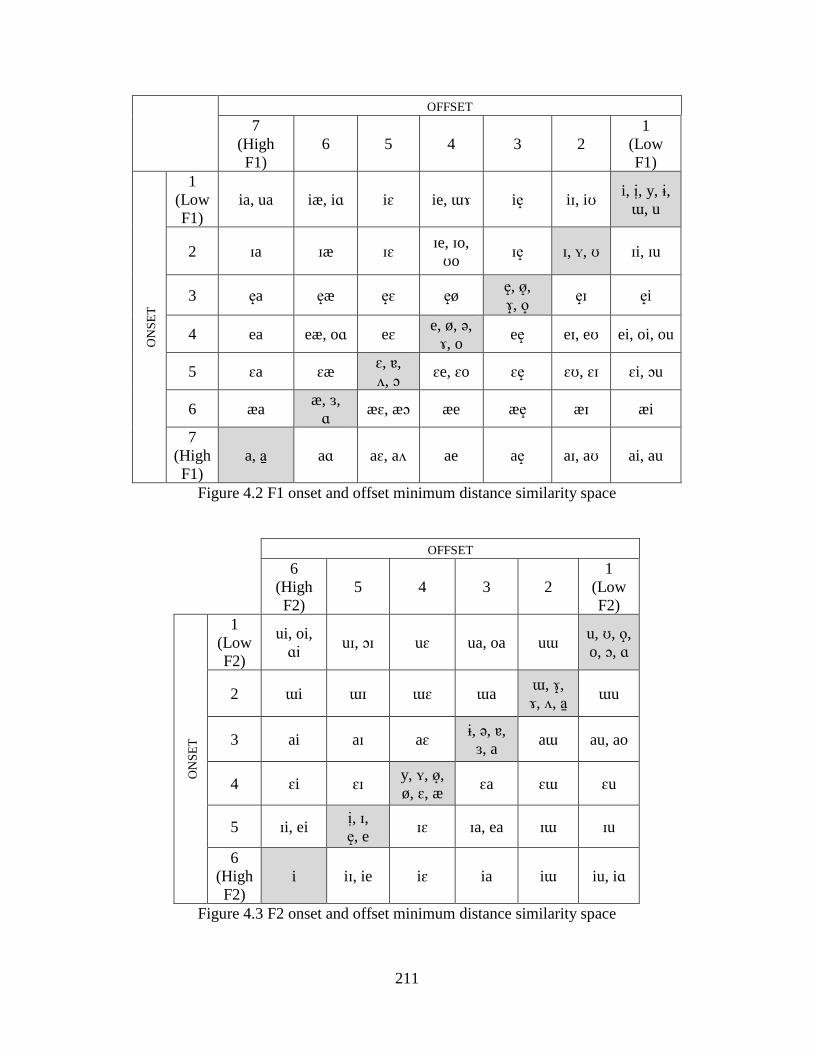
211
OFFSET
7
(High
F1)
6 5 4 3 2
1
(Low
F1) O
NS
ET
1
(Low
F1)
ia, ua iæ, iɑ iɛ ie, ɯɤ ie̝ iɪ, iʊ i, i̩, y, ɨ,
ɯ, u
2 ɪa ɪæ ɪɛ ɪe, ɪo,
ʊo ɪe̝ ɪ, ʏ, ʊ ɪi, ɪu
3 e̝a e̝æ e̝ɛ e̝ø e̝, ø̝,
ɤ̝, o̝ e̝ɪ e̝i
4 ea eæ, oɑ eɛ e, ø, ə,
ɤ, o ee̝ eɪ, eʊ ei, oi, ou
5 ɛa ɛæ ɛ, ɐ,
ʌ, ɔ ɛe, ɛo ɛe̝ ɛʊ, ɛɪ ɛi, ɔu
6 æa æ, ɜ,
ɑ æɛ, æɔ æe æe̝ æɪ æi
7
(High
F1)
a, a̠ aɑ aɛ, aʌ ae ae̝ aɪ, aʊ ai, au
Figure 4.2 F1 onset and offset minimum distance similarity space
OFFSET
6
(High
F2)
5 4 3 2
1
(Low
F2)
ON
SE
T
1
(Low
F2)
ui, oi,
ɑi uɪ, ɔɪ uɛ ua, oa uɯ
u, ʊ, o̝,
o, ɔ, ɑ
2 ɯi ɯɪ ɯɛ ɯa ɯ, ɤ̝,
ɤ, ʌ, a̠ ɯu
3 ai aɪ aɛ ɨ, ə, ɐ,
ɜ, a aɯ au, ao
4 ɛi ɛɪ y, ʏ, ø̝,
ø, ɛ, æ ɛa ɛɯ ɛu
5 ɪi, ei i̩, ɪ,
e̝, e ɪɛ ɪa, ea ɪɯ ɪu
6
(High
F2)
i iɪ, ie iɛ ia iɯ iu, iɑ
Figure 4.3 F2 onset and offset minimum distance similarity space
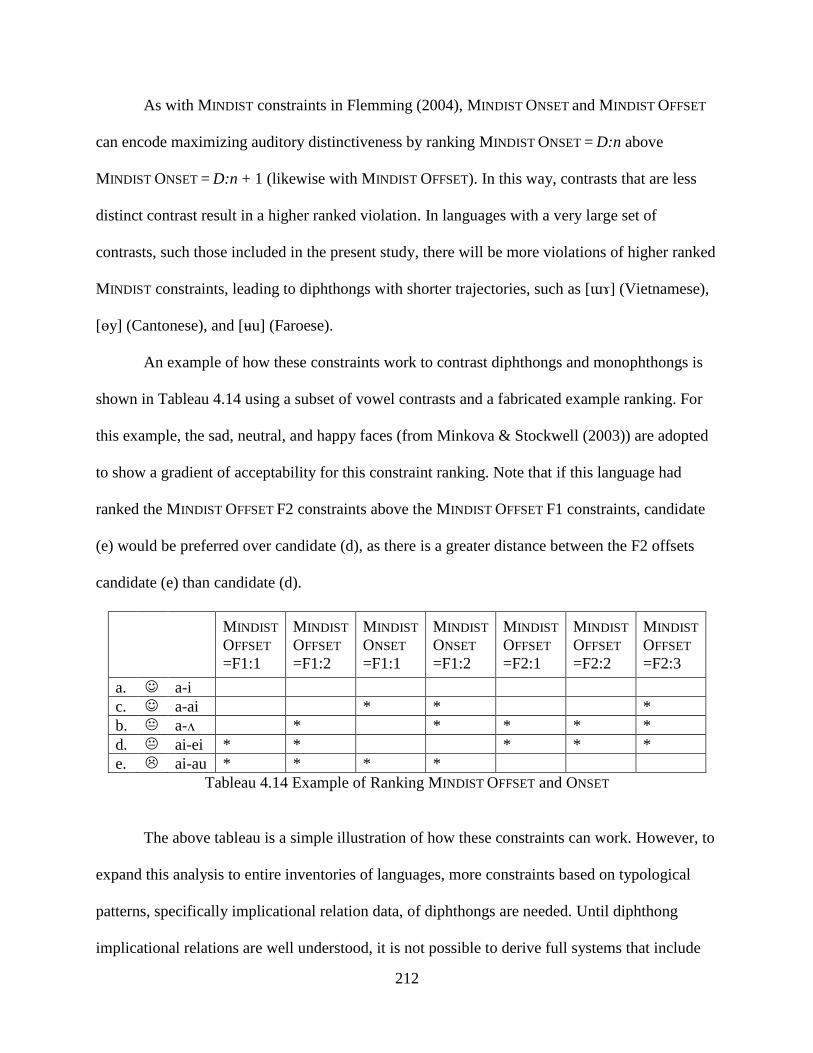
212
As with MINDIST constraints in Flemming (2004), MINDIST ONSET and MINDIST OFFSET
can encode maximizing auditory distinctiveness by ranking MINDIST ONSET = D:n above
MINDIST ONSET = D:n + 1 (likewise with MINDIST OFFSET). In this way, contrasts that are less
distinct contrast result in a higher ranked violation. In languages with a very large set of
contrasts, such those included in the present study, there will be more violations of higher ranked
MINDIST constraints, leading to diphthongs with shorter trajectories, such as [ɯɤ] (Vietnamese),
[ɵy] (Cantonese), and [ʉu] (Faroese).
An example of how these constraints work to contrast diphthongs and monophthongs is
shown in Tableau 4.14 using a subset of vowel contrasts and a fabricated example ranking. For
this example, the sad, neutral, and happy faces (from Minkova & Stockwell (2003)) are adopted
to show a gradient of acceptability for this constraint ranking. Note that if this language had
ranked the MINDIST OFFSET F2 constraints above the MINDIST OFFSET F1 constraints, candidate
(e) would be preferred over candidate (d), as there is a greater distance between the F2 offsets
candidate (e) than candidate (d).
Tableau 4.14 Example of Ranking MINDIST OFFSET and ONSET
The above tableau is a simple illustration of how these constraints can work. However, to
expand this analysis to entire inventories of languages, more constraints based on typological
patterns, specifically implicational relation data, of diphthongs are needed. Until diphthong
implicational relations are well understood, it is not possible to derive full systems that include
MINDIST
OFFSET
=F1:1
MINDIST
OFFSET
=F1:2
MINDIST
ONSET
=F1:1
MINDIST
ONSET
=F1:2
MINDIST
OFFSET
=F2:1
MINDIST
OFFSET
=F2:2
MINDIST
OFFSET
=F2:3
a. ☺ a-i
c. ☺ a-ai * * *
b. a-ʌ * * * * *
d. ai-ei * * * * *
e. ai-au * * * *

213
diphthongs. To predict ‘ideal’ systems, is necessary to know which diphthongs are preferred and
if any diphthongs imply the presence of others. Including the duration dimension is a first step
including diphthongs in Dispersion Theory.
4.5 Conclusions
This dissertation provides novel results to further the understanding of diphthong
production and perception properties and to incorporate diphthongs into phonological theory of
vowel dispersion. Importantly, this study provides insight into how people encode phonetic
knowledge of diphthongs and use duration to create contrast in the vowel space.
As a large-scale study of the vowel inventories of three languages using novel
methodology for speech rate control, the production experiment showed that by varying duration,
speakers use endpoint targets of diphthongs the same as monophthong targets. Slope was shown
to vary across speech rate in two of the three languages tested, meaning speakers do not encode
knowledge of the diphthong slope and that diphthongs can be categorized by their endpoint
targets.
Results from the perception experiment indicate that duration improves perception of
diphthongs and creates contrast in vowel inventories. It was found that dispersion principles
apply to not only the inventory as a whole, but within diphthongs themselves. Increased duration
led to better perception of diphthongs, indicating that speakers use duration as a dimension to
create contrast. Additionally, accuracy in perception is affected by changes in duration in relation
to contrastive vowel length, meaning that vowel perception is sensitive to not only duration, but
also the interaction of duration and vowel length.
This study has shown how diphthongs can be included in Dispersion Theory if minimum
distance is calculated not only over F1 and F2, but also through changes in frequency in time.

214
With additional future work on diphthong typology, it will be possible to model vowel
inventories that include diphthongs. This is an important step to creating a more unified theory of
vowel dispersion, which should no longer exclude diphthongs.
The results of the production and perception experiments in this study have important
implications not only for theoretical models of vowel dispersion, but also broader theory of
contour segments, acquisition, and typology. However, little is known about typological trends
of diphthongs in vowels systems as a whole outside of frequency data; future work is necessary
to confirm the present analysis. Additionally, including duration in theoretical models of vowel
dispersion is the first step in accounting for vocalic elements that contrast on multiple
dimensions. Future work on duration, phonation, and nasalization should be done to create a
more holistic theory of vowel dispersion.
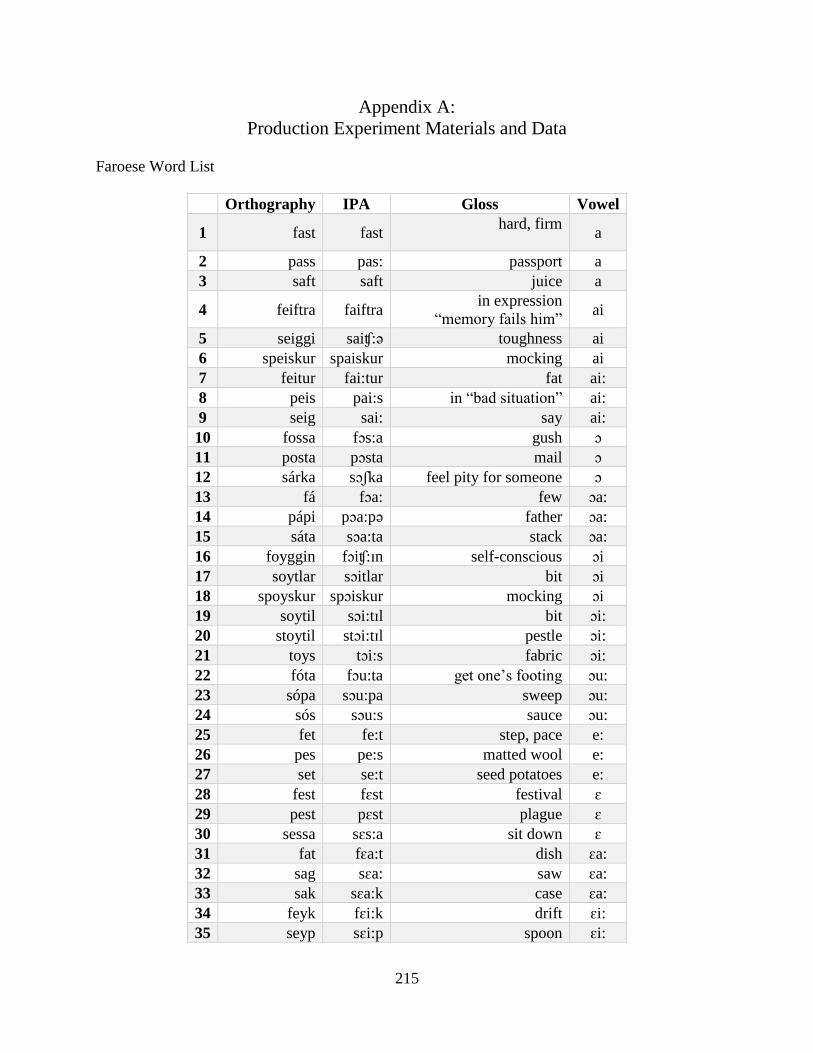
215
Appendix A:
Production Experiment Materials and Data
Faroese Word List
Orthography IPA Gloss Vowel
1 fast fast hard, firm
a
2 pass pas: passport a
3 saft saft juice a
4 feiftra faiftra in expression
“memory fails him” ai
5 seiggi saiʧ:ə toughness ai
6 speiskur spaiskur mocking ai
7 feitur fai:tur fat ai:
8 peis pai:s in “bad situation” ai:
9 seig sai: say ai:
10 fossa fɔs:a gush ɔ
11 posta pɔsta mail ɔ
12 sárka sɔʃka feel pity for someone ɔ
13 fá fɔa: few ɔa:
14 pápi pɔa:pə father ɔa:
15 sáta sɔa:ta stack ɔa:
16 foyggin fɔiʧ:ɪn self-conscious ɔi
17 soytlar sɔitlar bit ɔi
18 spoyskur spɔiskur mocking ɔi
19 soytil sɔi:tɪl bit ɔi:
20 stoytil stɔi:tɪl pestle ɔi:
21 toys tɔi:s fabric ɔi:
22 fóta fɔu:ta get one’s footing ɔu:
23 sópa sɔu:pa sweep ɔu:
24 sós sɔu:s sauce ɔu:
25 fet fe:t step, pace e:
26 pes pe:s matted wool e:
27 set se:t seed potatoes e:
28 fest fɛst festival ɛ
29 pest pɛst plague ɛ
30 sessa sɛs:a sit down ɛ
31 fat fɛa:t dish ɛa:
32 sag sɛa: saw ɛa:
33 sak sɛa:k case ɛa:
34 feyk fɛi:k drift ɛi:
35 seyp sɛi:p spoon ɛi:
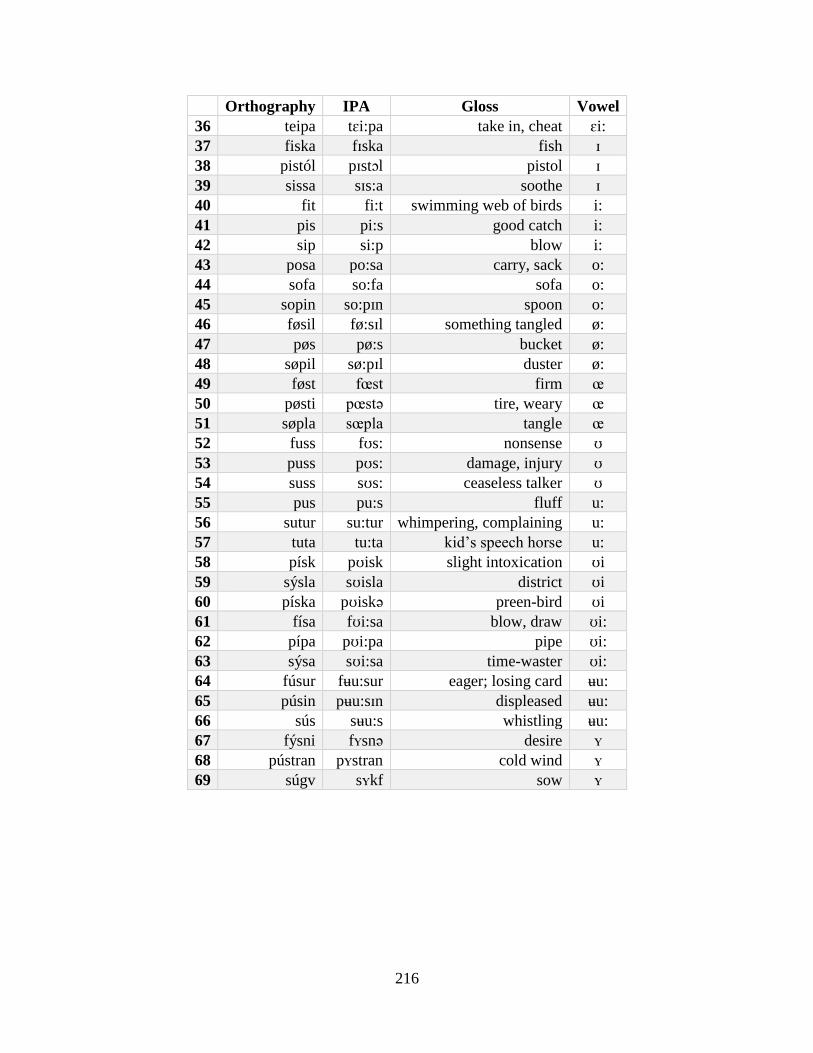
216
Orthography IPA Gloss Vowel
36 teipa tɛi:pa take in, cheat ɛi:
37 fiska fɪska fish ɪ
38 pistól pɪstɔl pistol ɪ
39 sissa sɪs:a soothe ɪ
40 fit fi:t swimming web of birds i:
41 pis pi:s good catch i:
42 sip si:p blow i:
43 posa po:sa carry, sack o:
44 sofa so:fa sofa o:
45 sopin so:pɪn spoon o:
46 føsil fø:sɪl something tangled ø:
47 pøs pø:s bucket ø:
48 søpil sø:pɪl duster ø:
49 føst fœst firm œ
50 pøsti pœstə tire, weary œ
51 søpla sœpla tangle œ
52 fuss fʊs: nonsense ʊ
53 puss pʊs: damage, injury ʊ
54 suss sʊs: ceaseless talker ʊ
55 pus pu:s fluff u:
56 sutur su:tur whimpering, complaining u:
57 tuta tu:ta kid’s speech horse u:
58 písk pʊisk slight intoxication ʊi
59 sýsla sʊisla district ʊi
60 píska pʊiskə preen-bird ʊi
61 físa fʊi:sa blow, draw ʊi:
62 pípa pʊi:pa pipe ʊi:
63 sýsa sʊi:sa time-waster ʊi:
64 fúsur fʉu:sur eager; losing card ʉu:
65 púsin pʉu:sɪn displeased ʉu:
66 sús sʉu:s whistling ʉu:
67 fýsni fʏsnə desire ʏ
68 pústran pʏstran cold wind ʏ
69 súgv sʏkf sow ʏ
217
Vietnamese Word List
Orthography IPA Gloss Vowel
1 ti /ti ˧/ chest i
2 tí /ti ˧˥/ small i
3 tít /tit ˧˥/ further i
4 tết /tet ˧˥/ new year e
5 tế /te ˧˥/ pray e
6 bê /ɓe ˧/ calf e
7 xe /sɛ ˧/ car ɛ
8 té /tɛ ˧˥/ fall down ɛ
9 tét /tɛt ˧˥/ split out ɛ
10 ta /ta ˧/ I, me a
11 tá /ta ˧˥/ dozen a
12 tát /tat ˧˥/ slap a
13 tắt /tɐt ˧˥/ turn off ɐ
14 cắt /kɐt ˧˥/ cut ɐ
15 căn /kɐn ˧/ root ɐ
16 cất /kʌt ˧˥/ put away ʌ
17 tất /tʌt ˧˥/ socks ʌ
18 cân /kʌn ˧/ weight ʌ
19 tơ /tɤ ˧/ silk ɤ
20 tớ /tɤ ˧˥/ I, me ɤ
21 tư /tɯ ˧/ private, the fourth ɯ
22 tứ /tɯ ˧˥/ four ɯ
23 tu /tu ˧/ abstinence
(go live as a monk) u
24 tú /tu ˧˥/ beautiful u
25 cút /kut ˧˥/ go away u
26 tô /to ˧/ big bowl o
27 tố /to ˧˥/ sue o
28 tốt /tot ˧˥/ good o
29 to /tɔ ˧/ large ɔ
30 có /kɔ ˧˥/ have ɔ
31 tót /tɔt ˧˥/ hurry ahead ɔ
32 tia /tie ˧/ ray ie
33 tía /tie ˧˥/ purple ie
34 tiết /tiet ˧˥/ secrete ie
35 cưa /kɯɤ ˧/ saw ɯɤ
36 tưa /tɯɤ ˧/ fray ɯɤ
37 tứa /tɯɤ ˧˥/ seep out ɯɤ
38 tua /tuo ˧/ rewind uo
39 túa /tuo ˧˥/ spill out uo
218
Orthography IPA Gloss Vowel
40 cua /kuo ˧/ crab uo
41 tuốt /tuot ˧˥/ peel uo
42 tiu /tiu ˧/ sad iu
43 thiu /tʰiu ˧/ soured iu
44 tíu /tiu ˧˥/ chirpy iu
45 kêu /keu ˧/ call eu
46 têu /teu ˧/ ridicule eu
47 tếu /teu ˧˥/ funny eu
48 keo /kɛu ˧/ glue ɛu
49 teo /tɛu ˧/ shrink ɛu
50 xéo /sɛu ˧˥/ tilted ɛu
51 cao /kau ˧/ tall au
52 tao /tau ˧/ I, me au
53 táo /tau ˧˥/ apple au
54 cáo /kau ˧˥/ fox au
55 sau /sɐu ˧/ after ɐu
56 cau /kɐu ˧/ betel ɐu
57 cáu /kɐu ˧˥/ upset ɐu
58 câu /kʌu ˧/ fishing ʌu
59 tâu /tʌu ˧/ report ʌu
60 tấu /tʌu ˧˥/ tell on ʌu
61 sưu /sɯu ˧/ collect ɯu
62 hưu /hɯu ˧/ retire ɯu
63 cưu /kɯu ˧/ protect ɯu
64 cứu /kɯu ˧˥/ rescue ɯu
65 tai /tai ˧/ ear ai
66 cai /kai ˧/ cut off ai
67 tái /tai ˧˥/ rare ai
68 tay /tɐi ˧/ hand ɐi
69 cay /kɐi ˧/ spicy ɐi
70 táy /tɐi ˧˥/ fidget ɐi
71 tây /tʌi ˧/ western ʌi
72 cây /kʌi ˧/ tree ʌi
73 tấy /tʌi ˧˥/ swollen ʌi
74 cơi /kɤi ˧/ stir ɤi
75 tơi /tɤi ˧/ separated ɤi
76 tới /tɤi ˧˥/ arrive ɤi
77 gửi /ɣɯi ˧˩˧/ send ɯi
78 chửi /cɯi ˧˩˧/ swear ɯi
79 cửi /kɯi ˧˩˧/ loom ɯi
80 tui /tɯi ˧/ I, me ɯi
81 cúi /kɯi ˧˥/ bend over ɯi

219
Orthography IPA Gloss Vowel
82 túi /tɯi ˧˥/ bag ɯi
83 tôi /toi ˧/ I, me oi
84 côi /koi ˧/ alone oi
85 tối /toi ˧˥/ dark oi
86 coi /kɔi ˧/ watch ɔi
87 toi /tɔi ˧/ to die, to waste ɔi
88 cói /kɔi ˧˥/ a grass ɔi
89 tiêu /tiew ˧/ digest iew
90 kiêu /kiew ˧/ arrogant, proud iew
91 tiếu /tiew ˧˥/ funny iew
92 tưới /tɯɤj ˧˥/ water (v.) ɯɤj
93 tươi /tɯɤj ˧/ fresh ɯɤj
94 cưới /kɯɤj ˧˥/ marry ɯɤj
95 bươu /ɓɯɤw ˧/ swelled ɯɤw
96 hươu /hɯɤw ˧/ deer ɯɤw
97 khướu /xɯɤw ˧˥/ a bird ɯɤw
98 xuôi /suoj ˧/ follow uoj
99 suối /suoj ˧˥/ stream uoj
100 cuối /kuoj ˧˥/ final uoj
220
Cantonese Word List
Orthography Gloss Jyupting Yale System IPA
1 詩 poem si1 i i
2 試 v. try si3 i i
3 知 v. know ji1 i i
4 升 v. go up sing1 i (before ng, k) ɪ
5 姓 surname sing3 i (before ng, k) ɪ
6 氫 hydrogen hing1 i (before ng, k) ɪ
7 書 book syu1 yu y
8 庶 numerous;
common
people
syu3 yu y
9 豬 pig jyu1 yu y
10 呼 breathe fu1 u u
11 褲 pants fu3 u u
12 孤 lonely gu1 u u
13 叔 uncle suk1 u (before ng, k) ʊ
14 腹 stomach, belly fuk1 u (before ng, k) ʊ
15 空 empty hung1 u (before ng, k) ʊ
16 控 control hung3 u (before ng, k) ʊ
17 寫 write se2 e ɛ
18 些 some se1 e ɛ
19 遮 umbrella je1 e ɛ
20 梳 comb so1 o ɔ
21 科 class; genus fo1 o ɔ
22 貨 goods;
products fo3 o ɔ
23 著 wear jeuk8 eu œ
24 香 perfume heung1 eu œ
25 槍 gun cheung1 eu œ
26 靴 boot hew1 ew œ
27 啫 merely jew1 ew œ
28 鋸 ripped off gew3 ew œ
29 恤 shirt seut1 eu (before n, t) ɵ
30 信 letter seun3 eu (before n, t) ɵ
31 出 publish cheut7 eu (before n, t) ɵ
32 彿 seemingly fat1 a (with final consonant) ɐ
33 塞 stop up sak1 a (with final consonant) ɐ
34 側 side; incline jak7 a (with final consonant) ɐ
35 沙 sand saa1 a (no final consonant) a:
36 灑 sprinkle saa2 a (no final consonant) a:
37 花 flower faa1 a (no final consonant) a:
38 殺 v. to kill saat3 aa a:

221
Orthography Gloss Jyupting Yale System IPA
39 髮 hair faat3 aa a:
40 山 hill saan1 aa a:
41 消 vanish siu1 iu iu
42 招 entertain jiu1 iu iu
43 照 light jiu3 iu iu
44 衰 ugly seui1 eui ɵy
45 稅 tax seui3 eui ɵy
46 虛 untrue heui1 eui ɵy
47 灰 ash; grey fui1 ui uy
48 晦 obscure; dark fui3 ui uy
49 皓 bright hui1 ui uy
50 飛 fly fei1 ei ei
51 四 num. four sei3 ei ei
52 嬉 v. play hei1 ei ei
53 腮 cheek soi1 oi ɔy
54 開 open hoi1 oi ɔy
55 災 disaster joi1 oi ɔy
56 再 again joi3 oi ɔy
57 穌 revive sou1 ou ou
58 租 rent jou1 ou ou
59 灶 kitchen range jou3 ou ou
60 西 west sai1 ai ɐi
61 輝 brightness fai1 ai ɐi
62 肺 lungs fai3 ai ɐi
63 收 receive; gather sau1 au ɐu
64 州 state jau1 au ɐu
65 睺 stare hau1 au ɐu
66 吼 roar hau3 au ɐu
67 嘥 v. fail to catch;
adj. waste saai1 aai a:i
68 曬 to show off saai3 aai a:i
69 塊 pieces faai3 aai a:i
70 筲 bucket saau1 aau a:u
71 哨 fall slantwise saau3 aau a:u
72 敲 v. knock haau1 aau a:u

222
Faroese Vowel Durations by Speech Rate
Speech
Rate
Mean
Vowel
Duration
(s)
Mean
Transition
Duration
(s)
[i:]
slow 0.216
normal 0.143
fast 0.126
[ɪ]
slow 0.060
normal 0.048
fast 0.046
[ʏ]
slow 0.077
normal 0.063
fast 0.059
[e:]
slow 0.249
normal 0.180
fast 0.141
[ɛ]
slow 0.113
normal 0.087
fast 0.076
[ø:]
slow 0.191
normal 0.152
fast 0.129
[œ]
slow 0.123
normal 0.097
fast 0.088
[u:]
slow 0.183
normal 0.131
fast 0.121
[ʊ]
slow 0.109
normal 0.085
fast 0.073
[o:]
slow 0.179
normal 0.140
fast 0.122
[ɔ]
slow 0.076
normal 0.071
fast 0.065
[a]
slow 0.131
normal 0.104
fast 0.090
Speech
Rate
Mean
Vowel
Duration
(s)
Mean
Transition
Duration
(s)
[ɛi:]
slow 0.243 0.185
normal 0.183 0.146
fast 0.151 0.113
[ɛa:]
slow 0.280 0.220
normal 0.204 0.168
fast 0.161 0.129
[ʊi]
slow 0.088 0.065
normal 0.067 0.048
fast 0.063 0.048
[ʊi:]
slow 0.187 0.135
normal 0.148 0.109
fast 0.120 0.091
[ʉu:]
slow 0.205 0.146
normal 0.155 0.119
fast 0.132 0.099
[ɔu:]
slow 0.219 0.170
normal 0.171 0.139
fast 0.140 0.114
[ɔi]
slow 0.099 0.069
normal 0.075 0.055
fast 0.070 0.051
[ɔi:]
slow 0.229 0.175
normal 0.179 0.141
fast 0.151 0.121
[ɔa:]
slow 0.229 0.175
normal 0.154 0.128
fast 0.133 0.106
[ai]
slow 0.093 0.068
normal 0.078 0.057
fast 0.076 0.056
[ai:]
slow 0.291 0.216
normal 0.211 0.167
fast 0.174 0.136

223
Vietnamese Vowel Durations by Speech Rate
Speech
Rate
Mean
Vowel
Duration
(s)
Mean
Transition
Duration
(s)
[i]
slow 0.283
normal 0.196
fast 0.171
[e]
slow 0.304
normal 0.226
fast 0.202
[ɛ]
slow 0.289
normal 0.218
fast 0.181
[a]
slow 0.319
normal 0.249
fast 0.204
[u]
slow 0.283
normal 0.2
fast 0.167
[ɯ]
slow 0.347
normal 0.265
fast 0.225
[o]
slow 0.323
normal 0.218
fast 0.189
[ɤ]
slow 0.356
normal 0.279
fast 0.217
[ɔ]
slow 0.316
normal 0.23
fast 0.21
[ʌ]
slow 0.139
normal 0.108
fast 0.098
[ɐ]
slow 0.145
normal 0.106
fast 0.101
Speech
Rate
Mean
Vowel
Duration
(s)
Mean
Transition
Duration
(s)
[iu]
slow 0.325 0.181
normal 0.244 0.129
fast 0.214 0.113
[ie]
slow 0.299 0.164
normal 0.218 0.119
fast 0.187 0.109
[eu]
slow 0.358 0.19
normal 0.258 0.143
fast 0.235 0.122
[ɛu]
slow 0.348 0.187
normal 0.247 0.138
fast 0.221 0.127
[ai]
slow 0.383 0.22
normal 0.283 0.166
fast 0.245 0.136
[au]
slow 0.375 0.19
normal 0.279 0.156
fast 0.249 0.127
[ui]
slow 0.357 0.186
normal 0.262 0.149
fast 0.22 0.124
[uo]
slow 0.328 0.166
normal 0.234 0.121
fast 0.21 0.107
[ɯi]
slow 0.374 0.182
normal 0.282 0.149
fast 0.237 0.12
[ɯu]
slow 0.34 0.175
normal 0.227 0.117
fast 0.204 0.096
[ɯɤ]
slow 0.359 0.209
normal 0.258 0.146
fast 0.23 0.132

224
Speech
Rate
Mean
Vowel
Duration
(s)
Mean
Transition
Duration
(s)
[oi]
slow 0.39 0.203
normal 0.269 0.138
fast 0.238 0.125
[ɤi]
slow 0.374 0.195
normal 0.273 0.152
fast 0.24 0.12
[ɔi]
slow 0.398 0.217
normal 0.291 0.16
fast 0.244 0.135
[ʌi]
slow 0.34 0.205
normal 0.253 0.156
fast 0.232 0.129
[ʌu]
slow 0.351 0.194
normal 0.254 0.143
fast 0.208 0.115
[ɐi]
slow 0.355 0.209
normal 0.263 0.165
fast 0.218 0.138
[ɐu]
slow 0.34 0.184
normal 0.246 0.136
fast 0.224 0.124
[iew]*
slow 0.334 0.215
normal 0.257 0.168
fast 0.236 0.158
[ɯɤj]*
slow 0.374 0.245
normal 0.259 0.174
fast 0.226 0.162
[ɯɤw]*
slow 0.322 0.202
normal 0.246 0.157
fast 0.213 0.146
[uoj]*
slow 0.355 0.218
normal 0.265 0.167
fast 0.22 0.158
*for triphthongs, ‘diphthong duration’ was
measured from V1 to V3

225
Cantonese Vowel Durations by Speech Rate
Speech
Rate
Mean
Vowel
Duration
(s)
Mean
Diphthong
Duration
(s)
[i]
slow 0.409
normal 0.245
fast 0.187
[ɪ]
slow 0.147
normal 0.110
fast 0.084
[y]
slow 0.427
normal 0.259
fast 0.193
[ɛ]
slow 0.458
normal 0.285
fast 0.211
[œ]
slow 0.389
normal 0.250
fast 0.196
[u]
slow 0.434
normal 0.261
fast 0.196
[ʊ]
slow 0.187
normal 0.118
fast 0.095
[ɔ]
slow 0.448
normal 0.278
fast 0.217
[ɵ]
slow 0.143
normal 0.104
fast 0.083
[ɐ]
slow 0.139
normal 0.088
fast 0.076
[a:]
slow 0.375
normal 0.257
fast 0.203
Speech
Rate
Mean
Vowel
Duration
(s)
Mean
Diphthong
Duration
(s)
[iu]
slow 0.444 0.230
normal 0.279 0.144
fast 0.221 0.110
[ei]
slow 0.457 0.279
normal 0.289 0.193
fast 0.221 0.143
[ɵy]
slow 0.444 0.292
normal 0.293 0.208
fast 0.219 0.147
[uy]
slow 0.456 0.229
normal 0.294 0.188
fast 0.210 0.137
[ou]
slow 0.463 0.231
normal 0.304 0.156
fast 0.228 0.118
[ɔy]
slow 0.478 0.230
normal 0.316 0.168
fast 0.244 0.140
[ɐi]
slow 0.457 0.265
normal 0.300 0.182
fast 0.234 0.147
[ɐu]
slow 0.450 0.234
normal 0.282 0.154
fast 0.232 0.128
[a:i]
slow 0.479 0.262
normal 0.326 0.196
fast 0.259 0.159
[a:u]
slow 0.466 0.251
normal 0.331 0.183
fast 0.245 0.138

226
Appendix B:
Perception Experiment Data
Percent Correct by Duration Condition
ORIGINAL
DOUBLED
HALVED
vowel number
correct
percent
correct
vowel number
correct
percent
correct
vowel number
correct
percent
correct
ɔu: 26 100.00% e: 26 100.00% ai: 25 96.15%
ai: 25 96.15% ɛa: 26 100.00% ɛi: 25 96.15%
ɛa: 25 96.15% i: 26 100.00% ɔu: 24 92.31%
o: 25 96.15% ø: 26 100.00% ɔa: 22 84.62%
ɔa: 25 96.15% ai: 25 96.15% œ 22 84.62%
u: 25 96.15% ɛi: 25 96.15% ɛa: 20 76.92%
ʊi: 25 96.15% ɔa: 25 96.15% ɔi 20 76.92%
i: 24 92.31% ɔu: 25 96.15% ʊi 20 76.92%
ɛi: 23 88.46% u: 25 96.15% ɛ 19 73.08%
ʊi 23 88.46% ʊi: 25 96.15% a 18 69.23%
ɔi: 22 84.62% ʉu: 22 84.62% ai 17 65.38%
e: 21 80.77% ɔi: 21 80.77% o: 17 65.38%
œ 21 80.77% ʏ 19 73.08% ʏ 16 61.54%
ø: 21 80.77% o: 16 61.54% ʊ 15 57.69%
ʏ 20 76.92% ɪ 15 57.69% i: 14 53.85%
ʉu: 19 73.08% ɛ 14 53.85% e: 13 50.00%
ɛ 18 69.23% œ 14 53.85% ʉu: 12 46.15%
ɔ 18 69.23% ɔ 13 50.00% ɔ 11 42.31%
a 17 65.38% ʊi 11 42.31% ø: 11 42.31%
ɔi 17 65.38% a 10 38.46% ɔi: 10 38.46%
ʊ 16 61.54% ai 10 38.46% u: 10 38.46%
ai 15 57.69% ʊ 9 34.62% ʊi: 10 38.46%
ɪ 9 34.62% ɔi 6 23.08% ɪ 9 34.62%
227
References
Abramson, A. S. (1978). The phonetic plausibility of the segmentation of tones in Thai
phonology. In Proceedings of 12th International Congr. Linguistics (pp. 760–763). Vienna.
Abramson, A. S. (1979). The Coarticulation of Tones: An Acoustic Study of Thai. In T. L.
Thongkum, V. Panupong, P. Kullavanijaya, & M. R. K. Tingsabadh (Eds.), Studies in Tai
and Mon-Khmer Phonetics and Phonology in honor of Eugénie J. A. Henderson (pp. 1–9).
Bankok: Chulalongkorn University Press.
Adams, S. G., & Weismer, G. (1993). Speaking rate and speech movement velocity profiles.
Journal of Speech and Hearing Research, 36(1), 41–54.
Adank, P., van Hout, R., & Smits, R. (2004). An acoustic description of the vowels of Northern
and Southern Standard Dutch. The Journal of the Acoustical Society of America, 116(3),
1729–1738. Retrieved from
http://scitation.aip.org/content/asa/journal/jasa/116/3/10.1121/1.1779271
Aguilar, L. (1999). Hiatus and diphthong: Acoustic cues and speech situation differences. Speech
Communication, 28(1), 57–74.
Ainsworth, W. A. (1972). Duration as a cue in the recognition of synthetic vowels. The Journal
of the Acoustical Society of America, 51(2B), 648–651.
Amos, J. (2011). A Sociophonological Analysis of Mersea Island English: An investigation of the
diphthongs [au], [ai], and [oi]. University of Essex.
Árnason, K. (2011). The Phonology of Icelandic and Faroese. (J. Durand, Ed.). Oxford: Oxford
University Press.
Bates, D., Maechler, M., Bolker, B., & Walker, S. (2015). Fitting Linear Mixed-Effects Models
Using lme4. Journal of Statistical Software, 67(1), 1–48.

228
Becker-Kristal, R. (2010). Acoustic typology of vowel inventories and Dispersion Theory:
Insights from a large cross-linguistic corpus. University of California, Los Angeles.
Bennett, D. C. (1968). Spectral Form and Duration as Cues in the Recognition of English and
German Vowels. Language and Speech.
Berg, T. (1986). The monophonematic status of diphthongs revisited. Phonetica, 43(4), 198–205.
Bermúdez-Otero, R. (2003). The acquisition of phonological opacity. Variation within
Optimality Theory: Proceedings of the Stockholm Workshop on Variation within Optimality
Theory, 25–36.
Bladon, A. (1985). Diphthongs: A case study of dynamic auditory processing. Speech
Communication, 4(1–3), 145–154.
Boersma, P., & Weenink, D. (2018). Praat: doing phonetics by computer [Computer program].
Bond, Z. S. (1978). The effects of varying glide durations on diphthong identification. Language
and Speech.
Borzone de Manrique, A. M. (1979). Acoustic analysis of Spanish diphthongs. Phonetica, 36(3),
194–206.
Broselow, E., Chen, S., & Huffman, M. (1997). Syllable weight: convergence of phonology and
phonetics. Phonology, 14(1), 47–82.
Brunelle, M. (2009). Tone perception in Northern and Southern Vietnamese. Journal of
Phonetics, 37, 79–96.
Casserly, E. D. (2012). Gestures in Optimality Theory and the laryngeal phonology of Faroese.
Lingua, 122(1), 41–65.
Catford, J. C. (1977). Fundamental problems in phonetics. Edinburgh: Edinburgh University
Press.
229
Cathey, J. (1997). Variation and reduction in Modern Faroese vowels. In T. Birkmann, H.
Klingenberg, D. Nübling, & E. Ronneberger-Sibold (Eds.), Vergleichende germanische
Philologie und Skandinavistik. Tübingen: Max Niemeyer Vorlag.
Chanethom, V. (2015). Language Interaction in Child Bilingual Speech : An Acoustic Study of
Diphthongs (Doctoral Dissertation). New York University.
Childers, D. G. (1978). Modern Spectrum Analysis. IEEE Press.
Chitoran, I. (2002). A perception-production study of Romanian diphthongs and glide-vowel
sequences. Journal of the International Phonetic Association, 32(2), 203–222.
Clermont, F. (1993). Spectro-temporal description of diphthongs in F1-F2-F3 space. Speech
Communication, 13, 377–390.
Cole, J., & Kisseberth, C. (1994). An optimal domains theory of harmony. Studies in the
Linguistic Sciences, 24(2), 101–114.
Collier, R., Bell-Berti, F., & Raphael, L. J. (1982). Some acoustic and physiological observations
on diphthongs. Language and Speech, 25(4), 305–323.
Corretge, R. (2012). Praat Vocal Toolkit [Computer Program]. Retrieved from
http://www.praatvocaltoolkit.com/
Crothers, J. (1978). Typology and universals of vowel systems. In J. H. Greenberg, C. A.
Ferguson, & E. A. Moravcsik (Eds.), Volume 2 of Universals of Human Language (pp. 95–
152). Stanford University Press.
Crothers, J., Lorentz, J. P., Sherman, D. A., & Vihman, M. M. (1979). Handbook of
phonological data from a sample of the World’s languages. Stanford: Department of
Linguistics, Stanford University.
Cutler, A., Weber, A., Smits, R., & Cooper, N. (2004). Patterns of English phoneme confusions

230
by native and non-native listeners. The Journal of the Acoustical Society of America,
116(6), 3668–3678.
De Boer, B. (2000). Self-organization in vowel systems. Journal of Phonetics, 28(4), 441–465.
de Groot, A. W. (1931). Phonologie und Phonetik als funktions wissenschaften [Phonetics and
Phonology as a functional science]. Travaux Du Cercle Linguistique de Prague, 4, 116–
147.
Dolan, W. B., & Mimori, Y. (1986). Rate-dependent variability in English and Japanese complex
vowel F2 transitions. UCLA Working Papers in Phonetics, 63, 125–153.
Donegan, P. J. (1979). On the natural phonology of vowels. Ohio State University.
Duanmu, S. (1994). Against Contour Tone Units. Linguistic Inquiry, 25(4), 555–608.
Edström, B. (1971). Diphthong Systems. Unpublished manuscript, Stockholm University.
Emerich, G. H. (2012). The Vietnamese Vowel System. University of Pennsylvania.
Ferrari-Disner, S. (1984). Insights on Vowel Spacing. In Patterns of Sounds (pp. 136–155).
Cambridge: Cambridge University Press.
Flemming, E. S. (1995). Auditory Representations in Phonology. University of California, Los
Angeles.
Flemming, E. S. (2004). Contrast and perceptual distinctiveness. In B. Hayes, R. Kirchner, & D.
Steriade (Eds.), Phonetically-Based Phonology (pp. 232–276). Cambridge: Cambridge
University Press.
Fourakis, M. (1991). Tempo, stress, and vowel reduction in American English. The Journal of
the Acoustical Society of America, 90(4), 1816–1827.
Gay, T. J. (1967). A Perceptual Study of American English Diphthongs (Doctoral Dissertation).
City University of New York.

231
Gay, T. J. (1968). Effect of speaking rate on diphthong formant movements. The Journal of the
Acoustical Society of America, 44(6), 1570–1573.
Gay, T. J. (1970). A Perceptual Study of American English Diphthongs. Language and Speech,
3(2), 65–88.
Gordon, M. J. (2002). A Phonetically Driven Account of Syllable Weight. Language, 78(1), 51–
80.
Gottfried, M., Miller, J. D., & Meyer, D. J. (1993). Three approaches to the classification of
American English diphthongs. Journal of Phonetics, 21(3), 205–229.
Hall-Lew, L. (2009). Ethnicity and phonetic variation in a San Francisco neighborhood.
Stanford University.
Han, M. S. (1968). Complex syllable nuclei in Vietnamese. Studies in the Phonology of Asian
Languages. University of Southern California.
Haudricourt, A. G. (1952). Les Voyelles brèves du vietnamien. Bulletin de La Société de
Linguistique de Paris, 48(1), 90–93.
Hay, J., Warren, P., & Drager, K. (2006). Factors influencing speech perception in the context of
a merger-in-progress. Journal of Phonetics, 34, 458–484.
Hayes, B. (1989). Compensatory Lengthening in Moraic Phonology. Linguistic Inquiry, 20, 253–
306.
Helgason, P. (2002). Preaspiration in the Nordic Languages: Synchronic and diachronic
aspects. Stockholm University.
Hillenbrand, J. M. (2013). Static and dynamic approaches to vowel perception. In Vowel
Inherent Spectral Change (pp. 9–30). Berlin Heidelberg: Springer.
Holbrook, A. (1958). An exploratory study of diphthong formants (Doctoral Dissertation).

232
University of Illinois.
Holbrook, A., & Fairbanks, G. (1962). Diphthong formants and their movements. Journal of
Speech and Hearing Research, 5(1), 38–58.
Hualde, J. I., & Prieto, M. (2002). On the diphthong / hiatus contrast in Spanish: some
experimental results. Linguistics, 40(2), 217–234.
Inkelas, S. (2013). Looking into segments. Invited talk. University of Southern California.
Inkelas, S., & Shih, S. (2016). Re-representing phonology: consequences of Q Theory. In
Proceedings of NELS, Vol. 46.
Jacewicz, E., Fujimura, O., & Fox, R. A. (2003). Dynamics in diphthong perception. In
Proceedings of the 15th International Congress of Phonetic Science (ICPhS) (pp. 993–996).
Jakobson, R. (1941). Kindersprache, aphasie und allgemeine lautgesetze. (U. University, Ed.).
Uppsala.
Jha, S. K. (1985). Acoustic analysis of the Maithili diphthongs. Journal of Phonetics, 13(1),
107–115.
Joanisse, M. F., & Seidenberg, M. S. (1998). Functional bases of phonological universals: A
connectionist approach. In Proceedings of the Twenty-Fourth Annual Meeting of the
Berkeley Linguistics Society (Vol. 24, pp. 335–345).
Kaun, A. (1995). The Typology of Rounding Harmony: An Optimality Theoretic Approach
(Doctoral Dissertation). University of California, Los Angeles.
Klatt, D. H. (1976). Linguistic uses of segmental duration in English: Acoustic and perceptual
evidence. The Journal of the Acoustical Society of America, 59(5), 1208–1221.
Klein, W., Plomp, R., & Pols, L. C. W. (1970). Vowel spectra, vowel spaces and vowel
identification. The Journal of the Acoustical Society of America, 48, 999–1009.
233
Ko, S. (2010). A contrastivist view on the evolution of the Korean vowel system. In H. Maezawa
& A. Yokogoshi (Eds.), MIT Working Papers in Linguistics 61: Proceedings of the 6th
Workshop on Altaic Formal Linguistics (WAFL 6) (pp. 181–196). Cambridge, MA:
MITWPL.
Koenig, W., Dunn, H. K., & Lacy, L. Y. (1946). The sound spectrograph. The Journal of the
Acoustical Society of America, 18(1), 19–49.
Kong, Q.-M. (1987). Influence of tones upon vowel duration in Cantonese. Language and
Speech, 30(4), 387–400.
Ladefoged, P. (2006). A Course in Phonetics. Boston: Thomson Wadsworth.
Ladefoged, P., & Maddieson, I. (1996). The sounds of the world’s languages. Oxford: Blackwell.
Lane, H., & Grosjean, F. (1973). Perception of reading rate by speakers and listeners. Journal of
Experimental Psychology, 97(2), 141–147.
Lass, R. (1984). Vowel System Universals and Typology: Prologue to Theory. Phonology
Yearbook, 1, 75–111.
Le-Van-Ly. (1960). Le Parler Vietnamien [Vietnamese Speech] (second edition). Saigon: Bo
Quoc Gia Giao Duc.
Leben, W. (1973). Suprasegmental phonology (Doctoral Dissertation). Massachusetts Institute of
Technology.
Lee, S., Potamianos, A., & Narayanan, S. (2014). Developmental acoustic study of American
English diphthongs. The Journal of the Acoustical Society of America, 136(4), 1880–1894.
Retrieved from http://www.ncbi.nlm.nih.gov/pubmed/25324088
Lee, Y. (1997). Syllable weight typology in Optimality Theory. Language Science, 4, 275–296.
Lehiste, I. (1964). Acoustical Characteristics of Selected English Consonants. Bloomington:

234
Indiana University.
Lehiste, I., & Peterson, G. E. (1961). Transitions, glides, and diphthongs. The Journal of the
Acoustical Society of America, 33(3), 268–277.
Lewis, M. P. (Ed.). (2009). Ethnologue: Languages of the world (Sixteenth). Dallas: SIL
International.
Liberman, A. M., & Pierrehumbert, J. B. (1984). Intonational invariance under changes in pitch
range and length. In M. Aronoff, R. Oerhle, F. Kelley, & B. W. Stephens (Eds.), Language
sound structure (pp. 157–233). Cambridge: MIT Press.
Liljencrants, J., & Lindblom, B. (1972). Numerical Simulation of Vowel Quality Systems: The
Role of Perceptual Contrast. Language, 48(4), 839–862.
Lindau, M., Norlin, K., & Svantesson, J.-O. (1990). Some cross-linguistic differences in
diphthongs. Journal of the International Phonetic Association.
Lindblom, B. (1986). Phonetic Universals in Vowel Systems. In J. J. Ohala & J. J. Jaeger (Eds.),
Experimental Phonology (pp. 13–44). Orlando: Academic Press.
Lobanov, B. M. (1971). Classification of Russian vowels spoken by different listeners. Journal
of the Acoustical Society of America, 49, 606–608.
Luce, R. D. (1963). Detection and Recognition. In R. D. Luce, R. R. Bush, & E. Galanter (Eds.),
Handbook of Mathematical Psychology, Volume I (pp. 103–189). New York, NY: John
Wiley and Sons, Inc.
Maddieson, I. (1981). UPSID: the UCLA Phonological Segment Inventory Database: Data and
Index. UCLA Working Papers in Phonetics, 53.
Maddieson, I. (1984). Patterns of Sounds. Cambridge: Cambridge University Press.
Man, C. Y. (2007). An acoustical analysis of the vowels , diphthongs and triphthongs in Hakka

235
Chinese. In ICPhS XVI (pp. 841–844).
Martinet, A. (1955). Economie des Changements Phonétiques [Economics of Phonetic
Changes]. Berne: Francke.
Matthews, S., & Yip, V. (2011). Cantonese: A Comprehensive Grammar. London: Routledge.
Mayr, R., & Davies, H. (2011). A cross-dialectal acoustic study of the monophthongs and
diphthongs of Welsh. Journal of the International Phonetic Association, 41(1), 1–25.
Miller, G. A., & Nicely, P. E. (1955). An analysis of perceptual confusions among some English
consonants. Journal of the Acoustical Society of America, 27, 338–352.
Minkova, D., & Stockwell, R. (2003). English Vowel Shifts and “Optimal” Diphthongs. In
Optimality Theory and language change (pp. 169–190). Netherlands: Springer.
Miyashita, M. (2011). Diphthongs in Tohono O’odham. Anthropological Linguistics, 53(4), 323–
342.
Morén, B., & Zsiga, E. (2006). The lexical and post-lexical phonology of Thai tones. Natural
Language & Linguistic Theory, 24, 113–178.
Morrison, G. S. (2013). Theories of vowel inherent spectral change. In G. S. Morrison & P. F.
Assmann (Eds.), Vowel Inherent Spectral Change (pp. 31–47). Berlin Heidelberg: Springer.
Moulines, E., & Charpentier, F. (1990). Pitch-synchronous waveform processing techniques for
text-to-speech synthesis using diphones. Speech Communication, 9, 453–467.
Murray, R. W., & Vennemann, T. (1983). Sound Change and Syllable Structure in Germanic
Phonology. Language, 59(3), 514–528.
Nearey, T. M. (1977). Phonetic Feature Systems for Vowels. University of Alberta.
Nearey, T. M., & Assmann, P. F. (1986). Modeling the role of inherent spectral change in vowel
identification. The Journal of the Acoustical Society of America, 80(5), 1297–1308.

236
Nguyễn, B. T. (1949). Chữ và Vần Việt Nam Khoa Học [Scientific study of Vietnamese letters
and syllables]. Sài Gòn: Ngôn Ngữ.
Nguyễn, B. T. (1959). Ngôn Ngữ học Việt Nam [Vietnamese linguistics]. Sài Gòn: Ngôn Ngữ.
Nguyễn, Đ.-H. (1966). Speak Vietnamese. Rutland & Tokyo: Charles E. Turtle Co. Publishers.
Nooteboom, S. G., & Slis, I. H. (1972). The phonetic feature of vowel length in Dutch.
Language and Speech, 15(4), 301–316.
Nycz, J., & Hall-Lew, L. (2014). Best practices in measuring vowel merger. In Proceedings of
Meetings on Acoustics (Vol. 20, pp. 1–20).
Peeters, W. J. M. (1991). Diphthong dynamics: a cross-linguistic perceptual analysis of
temporal patterns in Dutch, English, and German. Mondiss.
Peirce, J. (2007). PsychoPy - Psychophysics software in Python. Journal of Neuroscience
Methods, 162(1–2), 8–13.
Petersen, H. P. (1994). Føroysk ljóðlæra [Faroese Poetry] (unpublished manuscript).
Petersen, S. J. (2016). Vowel Dispersion in English Diphthongs: Evidence from Adult
Production. In Proceedings of the Annual Meetings on Phonology, Vol. 3.
Pierrehumbert, J. B. (1980). The Phonology and Phonetics of English Intonation (Doctoral
Dissertation). Massachusetts Institue of Technology.
Pike, K. L. (1947). On the phonemic status of English diphthongs. Language, 23(2), 151–159.
Pike, K. L. (1984). Tone Languages. Ann Arbor: University of Michigan Press.
Pitermann, M. (2000). Effect of speaking rate and contrastive stress on formant dynamics and
vowel perception. The Journal of the Acoustical Society of America, 107(6), 3425–3437.
Pols, L. C. W. (1977). Spectral analysis and identification of Dutch vowels (Unpublished
Doctoral Dissertation). University of Amsterdam, the Netherlands.
237
Potter, R. K., Kopp, G. A., & Green, H. C. (1947). Visible Speech. D. Van Nostrand Co.
Potter, R. K., & Peterson, G. E. (1948). The representation of vowels and their movements. The
Journal of the Acoustical Society of America, 20(4), 528–535.
Press, W. H., Teukolsky, S. A., Vetterling, W. T., & Flannery, B. P. (1992). Numerical recipes in
C: The art of scientific computing (2nd ed.). Cambridge University Press.
Prince, A. (1990). Quantitative Consequences of Rhythmic Organization. In CLS 26-II: Papers
from the Parasession on the Syllable in Phonetics and Phonology. Chicago: Chicago
Linguistic Society.
Prince, A., & Smolensky, P. (1993). Optimality Theory: Constraint Interaction in Generative
Grammar. Computer Science Technical Reports, 664.
Remijsen, B. (2013). Tonal alignment is contrastive in falling contours in Dinka. Language, 89,
297–327.
Rischel, J. (1968). Diphthongization in Faroese. International Journal of Linguistics, 11(1), 89–
118.
Sánchez Miret, F. (1998). Some reflections on the notion of diphthong. Papers and Studies in
Contrasive Linguistics, 34, 27–51.
Sands, K. L. (2004). Patternings of Vocalic Sequences in the World’s Languages (Doctoral
Dissertation). University of California, Santa Barbara.
Sapir, E. (1933). La realite psychologique des phonemes. Journal de Psychologie Normale et
Pathologique, 30, 247–265.
Schwartz, J.-L., Boë, L.-J., Vallée, N., & Abry, C. (1997). Major trends in vowel system
inventories. Journal of Phonetics, 25(3), 233–253.
Sedlak, P. (1969). Typological considerations of vowel quality systems (Stanford Working
238
Papers on Language Universals I).
Simons, G. F., & Fennig, C. D. (Eds.). (2018). Ethnologue: Languages of the World (21st ed.).
Dallas: SIL International.
Smalley, W. A., & Van-Van, N. (1957). Vietnamese for Missionaries: A Course in the Spoken
and Written Language of Central Viet Nam, I & II. Saigon.
Stampe, D. (1973). A Dissertation on Natural Phonology. University of Chicago.
Steriade, D. (1993). Closure, release and nasal contours. In M. Huffman & L. Trigo (Eds.),
Phonetics and Phonology 5: Nasals, nasalization and the velum (pp. 401–470).
Steriade, D. (1994). Complex onsets as single segments: the Mazateco pattern. In J. Cole & C.
Kisseberth (Eds.), Perspectives in phonology. Stanford: CSLI Publications.
Steriade, D. (1997). Phonetics in phonology: the case of laryngeal neutralization. University of
California, Los Angeles.
Steriade, D. (2001). The phonology of perceptibility effects: the P-map and its consequences for
constraint organization. University of California, Los Angeles.
Strange, W., Edman, T. R., & Jenkins, J. J. (1979). Acoustic and phonological factors in vowel
identification. Journal of Experimental Psychology: Human Perception and Performance,
5(4), 643–656.
Strik, H., & Konst, E. (1992). A duration model for phonetic units in isolated Dutch words. In
AFN-Proceedings (pp. 71–78). University of Nijmegen.
Team, R. C. (2017). R: A language and environment for statistical computing. Vienna, Austria.
Thomas, E. R. (2011). Sociophonetics: An Introduction. London: Palgrave Macmillan.
Thomas, E. R., & Kendall, T. (2007). NORM: The vowel normalization and plotting suite.
Thompson, L. C. (1965). A Vietnamese Reference Grammar. Honolulu: University of Hawai’i
239
Press.
Thuật, Đ. T. (1977). Ngữ âm tiếng Việt [Vietnamese phonetics]. Hà Nội: Nhà Xuất Bản Đại Học
Quốc Gia.
To, C. K. S., Cheung, P. S. P., & McLeod, S. (2013). A population study of children’s
acquisition of Hong Kong Cantonese consonants, vowels, and tones. Journal of Speech,
Language, and Hearing Research, 56(1), 103–123.
Trager, G. L., & Smith, H. L. J. (1951). An Outline of English Structure. Norman: Battenburg
Press.
Trubetskoy, N. (1939). Principles of phonology. University of California Press.
Turner, G. S., Tjaden, K., & Weismer, G. (1995). The Influence of Speaking Rate on Vowel
Space and Speech Intelligibility for Individuals With Amyotrophic Lateral Sclerosis.
Journal of Speech, Language, and Hearing Research, 38, 1001–1013.
Uchihara, H., & Pérez Báez, G. (n.d.). Vowel sequences in Quiaviní Zapotec. Under Submission,
1–24.
Vallée, N. (1994). Systèmes vocaliques: de la typologie aux prédictions [Vowel systems: from
typology to predictions] (Doctoral Dissertation). Grenoble 3.
Vorperian, H. K., & Kent, R. D. (2007). Vowel Acoustic Space Development in Children: A
Synthesis of Acoustic and Anatomic Data. Journal of Speech, Language, and Hearing
Research, 50, 1510–1545.
Wang, M. D., & Bilger, R. C. (2005). Consonant confusions in noise: a study of perceptual
features. Journal of the Acoustical Society of America, 54, 1248.
Wang, W. S.-Y. (1967). Phonological Features of Tone. International Journal of American
Linguistics, 33(2), 93–105.

240
Weeda, D. (1983). Perceptual and Articulatory Constraints on Diphthongs in Universal
Grammar. Texas Linguistic Forum Austin, Tex., 22, 147–162.
Wise, C. M. (1965). Acoustic structure of English diphthongs and semi-vowels vis-a-vis their
phonemic symbolization. In E. Zwirner & W. Bethge (Eds.), Proceedings of the fifth
international congress of phonetic sciences (pp. 589–593). Basel: S. Karger.
Wong, A. W., & Hall-Lew, L. (2014). Regional variabililty and ethnic identitity: Chinese
Americans in New York City and San Francisco. Language and Communication, 35, 27–42.
Woo, N. H. (1969). Prosody and Phonology (Doctoral Dissertation). Modern Languages and
Linguistics.
Xu, Y. (1998). Consistency of Tone-Syllable Alignment across Different Syllable Structures and
Speaking Rates. Phonetica, 55, 179–203.
Yang, J., & Fox, R. A. (2013). Acoustic development of vowel production in American English
children. In Proceedings of the 14th annual conference of the international speech
communication association (Interspeech 2013). Lyon, France.
Yuan, A. (1996). Acoustic Study of the Cantonese Diphthongs. University of Hong Kong.
Zahorian, S. A., & Jagharghi, A. J. (1993). Spectral-shape features versus formants as acoustic
correlates for vowels. The Journal of the Acoustical Society of America1, 94(4), 1966–1982.
Zhang, J. (2001a). The Contrast-Specificity of Positional Prominence —Evidence from
Diphthong Distribution. In Proceedings of the 75th LSA. Washington, DC.
Zhang, J. (2001b). The effects of duration and sonority on contour tone distribution—
Typological survey and formal analysis (Doctoral Dissertation). University of California,
Los Angeles.
Zhang, X. (1996). Vowel Systems of the Manchu-Tungus Languages of China. University of
241
Toronto.
Þráinsson, H. (2004). Faroese: An Overview and Reference Grammar. Føroya Fróđskaparfelag.