accounting chapter 21
TRANSCRIPT
Cost-Volume-Profit Analysis
Chapter 21
21-1Copyright © 2014 Pearson Education, Inc. Publishing as Prentice Hall

Learning Objectives
1. Determine how changes in volume affect costs
2. Calculate operating income using contribution margin and contribution margin ratio
3. Use cost-volume-profit (CVP) analysis for profit planning
4. Use CVP analysis to perform sensitivity analysis
21-2Copyright © 2014 Pearson Education, Inc. Publishing as Prentice Hall

Learning Objectives
5. Use CVP analysis to calculate margin of safety, operating leverage, and multiproduct breakeven points
6. Distinguish between variable costing and absorption costing (Appendix 21A)
7. Compute operating income using variable costing and absorption costing (Appendix 21A)
21-3Copyright © 2014 Pearson Education, Inc. Publishing as Prentice Hall

Learning Objective 1
Determine how Determine how changes in volume changes in volume
affect costsaffect costs
21-4Copyright © 2014 Pearson Education, Inc. Publishing as Prentice Hall

Types of costs
• Variable costs
• Fixed costs
• Mixed costs
Copyright © 2014 Pearson Education, Inc. Publishing as Prentice Hall 21-5

Variable Costs—Batteries in Tablets
Number of Tablets Produced
Variable Costper Tablet
Total Variable Cost
0 tablets $55 $ 0
25 tablets 55 1,375
50 tablets 55 2,750
75 tablets 55 4,125
100 tablets 55 5,500
Copyright © 2014 Pearson Education, Inc. Publishing as Prentice Hall 21-6
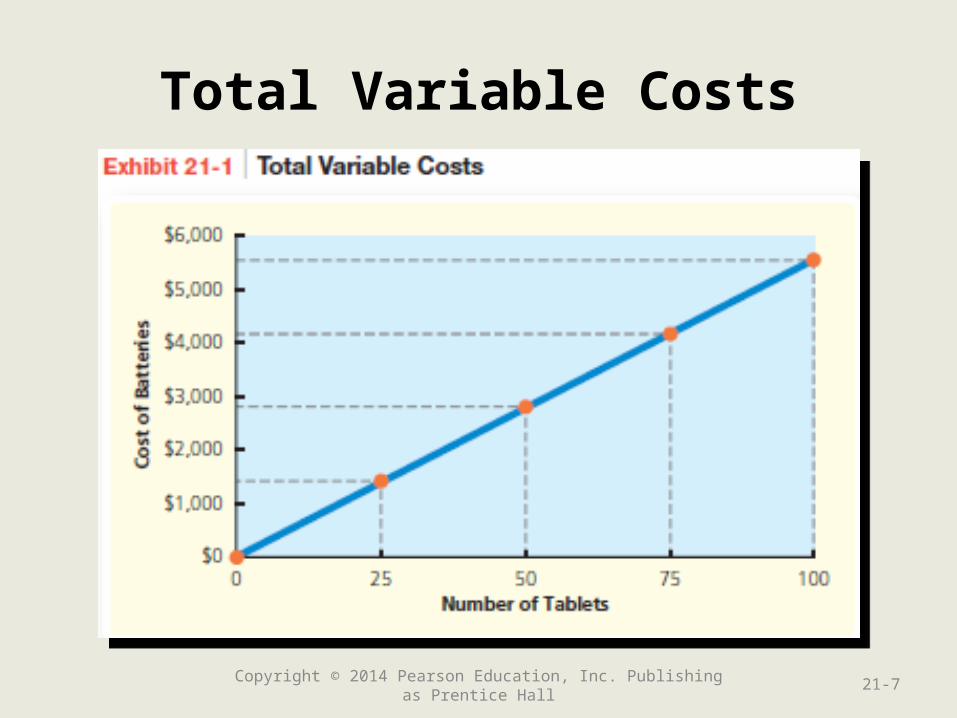
Total Variable Costs
Copyright © 2014 Pearson Education, Inc. Publishing as Prentice Hall 21-7

Total Fixed Costs
Copyright © 2014 Pearson Education, Inc. Publishing as Prentice Hall 21-8

Fixed Costs
TotalFixed Costs
Number of Tablets Produced
Fixed Costper Tablet
$12,000 25 tablets $480
12,000 50 tablets 240
12,000 75 tablets 160
12,000 100 tablets 120
Copyright © 2014 Pearson Education, Inc. Publishing as Prentice Hall 21-9

Characteristics ofVariable and Fixed Costs
Copyright © 2014 Pearson Education, Inc. Publishing as Prentice Hall 21-10

Mixed Costs—Cell Phone
$100 per month plus $0.10 for each minute of use
Number of Minutes Used
Total Fixed Cost
Total Variable Cost
Total Cost
100 minutes $100 $10 $110
200 minutes 100 20 120
300 minutes 100 30 130
400 minutes 100 40 140
500 minutes 100 50 150
Copyright © 2014 Pearson Education, Inc. Publishing as Prentice Hall 21-11

Mixed Costs
Copyright © 2014 Pearson Education, Inc. Publishing as Prentice Hall 21-12

Manufacturing Equipment Maintenance Costs
Number of Tablets Produced
Total Maintenance
Cost
1st Quarter 360 tablets $1,720
2nd Quarter 415 tablets 1,830
3rd Quarter 480 tablets 1,960
4th Quarter 240 tablets 1,480
Copyright © 2014 Pearson Education, Inc. Publishing as Prentice Hall 21-13
Highest Volume
Lowest Volume

High-Low MethodStep 1
Step 1: Identify the highest and lowest levels of activity, and calculate the variable cost per unit.
Variable cost per unit = Change in total cost / Change in volume of activity
= (Highest cost − Lowest cost) / (Highest volume − Lowest volume)
Copyright © 2014 Pearson Education, Inc. Publishing as Prentice Hall 21-14

High-Low MethodStep 1
Step 1: Identify the highest and lowest levels of activity, and calculate the variable cost per unit.
Variable cost per unit = Change in total cost / Change in volume of activity
= (Highest cost − Lowest cost) / (Highest volume − Lowest volume)
= ($1,960 − $1,480) / (480 tablets − 240 tablets)
= $480 / 240 tablets
= $2 per tablet
Copyright © 2014 Pearson Education, Inc. Publishing as Prentice Hall 21-15

High-Low MethodStep 2
Step 2: Calculate the total fixed cost.
Total fixed cost = Total mixed cost – Total variable cost
= Total mixed cost – (Variable cost per unit × Number of units)
Copyright © 2014 Pearson Education, Inc. Publishing as Prentice Hall 21-16

High-Low MethodStep 2
Step 2: Calculate the total fixed cost.
Total fixed cost = Total mixed cost – Total variable cost
= Total mixed cost – (Variable cost per unit × Number of units)
= $1,960 – ($2 per tablet × 480 tablets)
= $1,960 – $960
= $1,000
Copyright © 2014 Pearson Education, Inc. Publishing as Prentice Hall 21-17
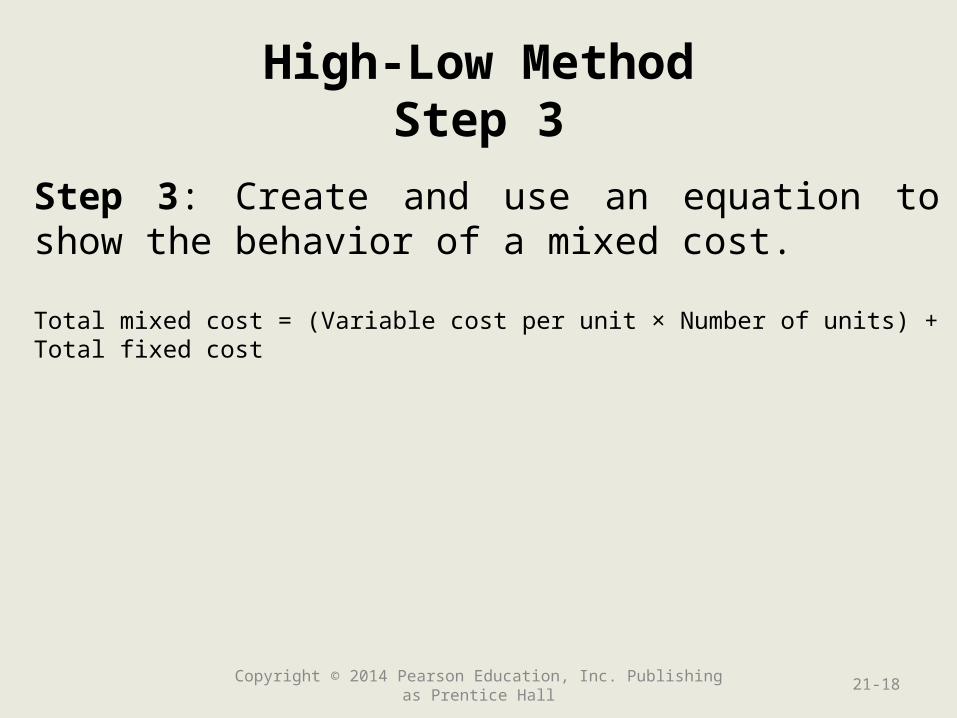
High-Low MethodStep 3
Step 3: Create and use an equation to show the behavior of a mixed cost.
Total mixed cost = (Variable cost per unit × Number of units) + Total fixed cost
Copyright © 2014 Pearson Education, Inc. Publishing as Prentice Hall 21-18
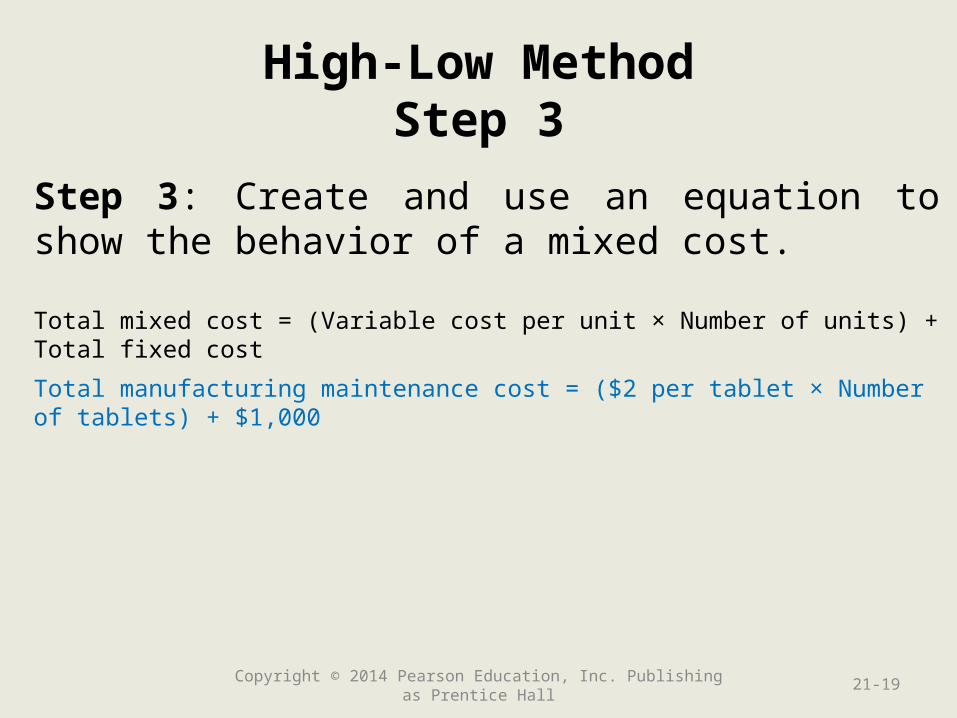
High-Low MethodStep 3
Step 3: Create and use an equation to show the behavior of a mixed cost.
Total mixed cost = (Variable cost per unit × Number of units) + Total fixed cost
Total manufacturing maintenance cost = ($2 per tablet × Number of tablets) + $1,000
Copyright © 2014 Pearson Education, Inc. Publishing as Prentice Hall 21-19
Estimated manufacturing equipment maintenance cost at 400 tablets
Total manufacturing maintenance cost= ($2 per tablet × Number of tablets) + $1,000
Copyright © 2014 Pearson Education, Inc. Publishing as Prentice Hall 21-20

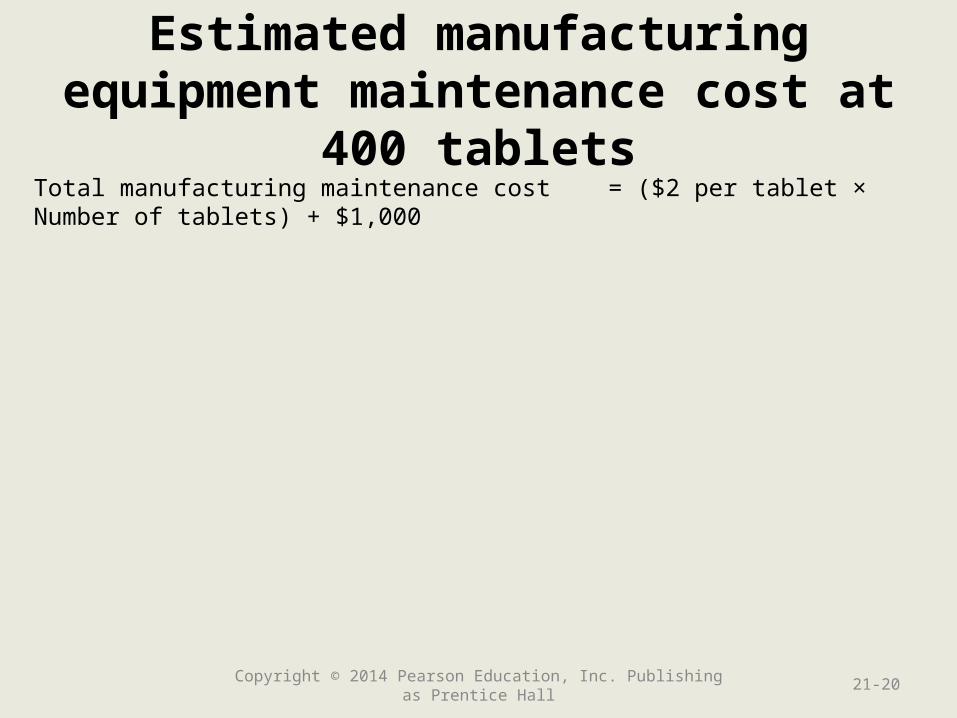
Estimated manufacturing equipment maintenance cost at 400 tablets
Total manufacturing maintenance cost= ($2 per tablet × Number of tablets) + $1,000
= ($2 per tablet × 400 tablets) + $1,000
= $1,800
Copyright © 2014 Pearson Education, Inc. Publishing as Prentice Hall 21-21

Relevant Range
Copyright © 2014 Pearson Education, Inc. Publishing as Prentice Hall 21-22

Following is a list of costs for a furniture manufacturer that specializes in wood tables. Classify each cost as variable, fixed, or mixed relative to tables produced and sold.
1.Wood used to build tables
Copyright © 2014 Pearson Education, Inc. Publishing as Prentice Hall 21-23

Following is a list of costs for a furniture manufacturer that specializes in wood tables. Classify each cost as variable, fixed, or mixed relative to tables produced and sold.
1.Wood used to build tables
Variable
Copyright © 2014 Pearson Education, Inc. Publishing as Prentice Hall 21-24
Following is a list of costs for a furniture manufacturer that specializes in wood tables. Classify each cost as variable, fixed, or mixed relative to tables produced and sold.
2. Depreciation on saws and other manufacturing equipment
Copyright © 2014 Pearson Education, Inc. Publishing as Prentice Hall 21-25
Following is a list of costs for a furniture manufacturer that specializes in wood tables. Classify each cost as variable, fixed, or mixed relative to tables produced and sold.
2. Depreciation on saws and other manufacturing equipment
Fixed
Copyright © 2014 Pearson Education, Inc. Publishing as Prentice Hall 21-26

Following is a list of costs for a furniture manufacturer that specializes in wood tables. Classify each cost as variable, fixed, or mixed relative to tables produced and sold.
3. Compensation for sales representatives paid on a salary plus commission basis
Copyright © 2014 Pearson Education, Inc. Publishing as Prentice Hall 21-27

Following is a list of costs for a furniture manufacturer that specializes in wood tables. Classify each cost as variable, fixed, or mixed relative to tables produced and sold.
3. Compensation for sales representatives paid on a salary plus commission basis
Mixed
Copyright © 2014 Pearson Education, Inc. Publishing as Prentice Hall 21-28

Following is a list of costs for a furniture manufacturer that specializes in wood tables. Classify each cost as variable, fixed, or mixed relative to tables produced and sold.
4. Supervisor’s salary
Copyright © 2014 Pearson Education, Inc. Publishing as Prentice Hall 21-29

Following is a list of costs for a furniture manufacturer that specializes in wood tables. Classify each cost as variable, fixed, or mixed relative to tables produced and sold.
4. Supervisor’s salary
Fixed
Copyright © 2014 Pearson Education, Inc. Publishing as Prentice Hall 21-30

Following is a list of costs for a furniture manufacturer that specializes in wood tables. Classify each cost as variable, fixed, or mixed relative to tables produced and sold.
5. Wages of production workers
Copyright © 2014 Pearson Education, Inc. Publishing as Prentice Hall 21-31
Following is a list of costs for a furniture manufacturer that specializes in wood tables. Classify each cost as variable, fixed, or mixed relative to tables produced and sold.
5. Wages of production workers
Variable
Copyright © 2014 Pearson Education, Inc. Publishing as Prentice Hall 21-32

Learning Objective 2
Calculate operating Calculate operating income using income using
contribution margin contribution margin and contribution and contribution
margin ratiomargin ratio
21-33Copyright © 2014 Pearson Education, Inc. Publishing as Prentice Hall

Contribution Margin
If Smart Touch Learning sells 200 tablets for $500 each that incur variable costs of $275 each, then the contribution margin is:
Contribution margin = Net sales revenue – Variable costs
Copyright © 2014 Pearson Education, Inc. Publishing as Prentice Hall 21-34

Contribution Margin
If Smart Touch Learning sells 200 tablets for $500 each that incur variable costs of $275 each, then the contribution margin is:
Contribution margin = Net sales revenue – Variable costs
= ($500 per tablet × 200 tablets) – ($275 per tablet × 200 tablets)
= $100,000 – $55,000
= $45,000
Copyright © 2014 Pearson Education, Inc. Publishing as Prentice Hall 21-35

Unit Contribution Margin
If Smart Touch Learning sells 200 tablets for $500 each that incur variable costs of $275 each, then the unit contribution margin is:
Unit contribution margin = Net sales revenue per unit – Variable costs per unit
Copyright © 2014 Pearson Education, Inc. Publishing as Prentice Hall 21-36

Unit Contribution Margin
If Smart Touch Learning sells 200 tablets for $500 each that incur variable costs of $275 each, then the unit contribution margin is:
Unit contribution margin = Net sales revenue per unit – Variable costs per unit
= $500 per tablet – $275 per tablet
= $225 per tablet
Copyright © 2014 Pearson Education, Inc. Publishing as Prentice Hall 21-37

Contribution Margin Ratio
If Smart Touch Learning sells 200 tablets for $500 each that incur variable costs of $275 each, then the contribution margin ratio is:
Contribution margin ratio = Contribution margin / Net sales revenue
Copyright © 2014 Pearson Education, Inc. Publishing as Prentice Hall 21-38

Contribution Margin Ratio
If Smart Touch Learning sells 200 tablets for $500 each that incur variable costs of $275 each, then the contribution margin ratio is:
Contribution margin ratio = Contribution margin / Net sales revenue
= $45,000 / $100,000
= 45%
= $225 per tablet / $500 per tablet
= 45%
Copyright © 2014 Pearson Education, Inc. Publishing as Prentice Hall 21-39

Traditional IncomeStatement Format
Net sales revenue
– Cost of goods sold
= Gross profit
– Selling and administrative expenses
= Operating income
Net sales revenue
– Cost of goods sold
= Gross profit
– Selling and administrative expenses
= Operating income
Copyright © 2014 Pearson Education, Inc. Publishing as Prentice Hall 21-40
Period costs (some variable, some fixed)
Product cost (some variable, some fixed)
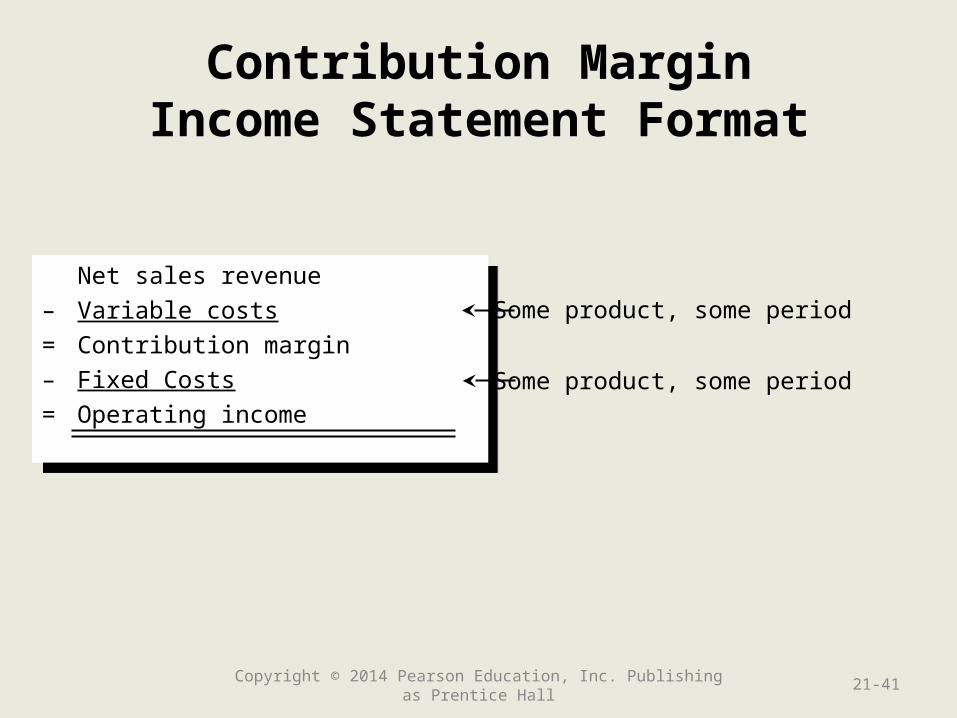
Contribution MarginIncome Statement Format
Net sales revenue
– Variable costs
= Contribution margin
– Fixed Costs
= Operating income
Net sales revenue
– Variable costs
= Contribution margin
– Fixed Costs
= Operating income
Copyright © 2014 Pearson Education, Inc. Publishing as Prentice Hall 21-41
Some product, some period
Some product, some period

A furniture manufacturer specializes in wood tables. The tables sell for $100 and incur $40 in variable costs. The company has $6,000 in fixed costs per month.
6.Prepare a contribution margin income statement for one month if the company sells 200 tables.
7.What is the total contribution margin for the month when the company sells 200 tables?
Copyright © 2014 Pearson Education, Inc. Publishing as Prentice Hall 21-42

6. Sales revenue (200 tables × $100 per table) $20,000
Variable costs (200 tables × $40 per table)8,000
Contribution margin (200 tables × $60 per table)12,000
Fixed costs6,000
Operating income $6,000
7. Contribution margin = $12,000
Copyright © 2014 Pearson Education, Inc. Publishing as Prentice Hall 21-43
A furniture manufacturer specializes in wood tables. The tables sell for $100 and incur $40 in variable costs. The company has $6,000 in fixed costs per month.
8.What is the unit contribution margin?
9.What is the contribution margin ratio?
Copyright © 2014 Pearson Education, Inc. Publishing as Prentice Hall 21-44

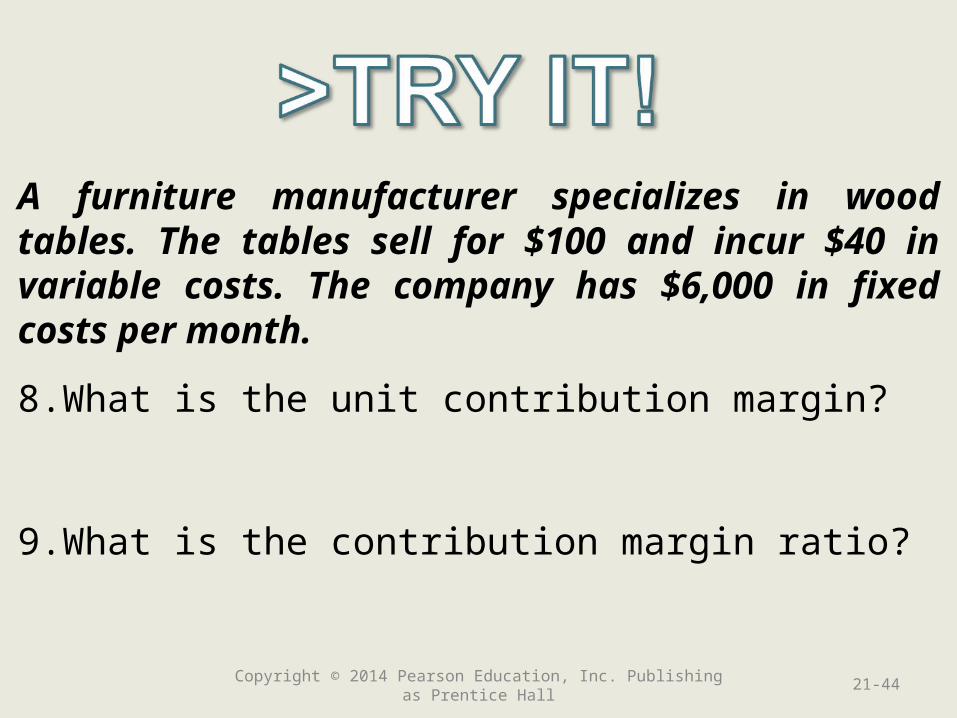
A furniture manufacturer specializes in wood tables. The tables sell for $100 and incur $40 in variable costs. The company has $6,000 in fixed costs per month.
8.What is the unit contribution margin?
Unit contribution margin = $100 per table – $40 per table = $60 per table
9.What is the contribution margin ratio?
Copyright © 2014 Pearson Education, Inc. Publishing as Prentice Hall 21-45

A furniture manufacturer specializes in wood tables. The tables sell for $100 and incur $40 in variable costs. The company has $6,000 in fixed costs per month.
8.What is the unit contribution margin?
Unit contribution margin = $100 per table – $40 per table = $60 per table
9.What is the contribution margin ratio?
Contribution margin ratio = $60 per table / $100 per table = 60%
Copyright © 2014 Pearson Education, Inc. Publishing as Prentice Hall 21-46

Learning Objective 3
Use cost-volume-profit Use cost-volume-profit (CVP) analysis for (CVP) analysis for
profit planningprofit planning
21-47Copyright © 2014 Pearson Education, Inc. Publishing as Prentice Hall

Cost-Volume-Profit Analysis Assumes the Following:
• The price per unit does not change as volume changes.
• Managers can classify each cost as variable, fixed, or mixed.
• The only factor that affects total costs is change in volume, which increases variable and mixed costs.
• Fixed costs do not change.
• There are no changes in inventory levels.
Copyright © 2014 Pearson Education, Inc. Publishing as Prentice Hall 21-48

Target Profit—Three Approaches
• Equation approach
• Contribution margin approach
• Contribution margin ratio approach
Copyright © 2014 Pearson Education, Inc. Publishing as Prentice Hall 21-49

Equation Approach
Net sales revenue – Total costs = Operating income
Copyright © 2014 Pearson Education, Inc. Publishing as Prentice Hall 21-50

Equation Approach
Net sales revenue – Total costs = Operating income
Net sales revenue – Variable costs – Fixed costs = Operating income
Copyright © 2014 Pearson Education, Inc. Publishing as Prentice Hall 21-51

Equation Approach
Smart Touch Learning sells tablets for $500 each, variable costs are $275 each, and fixed costs are $12,000 per month. If the company desires to earn $6,000 in profits each month, how many tablets must it sell?
Net sales revenue – Variable costs – Fixed costs =Target profit
Copyright © 2014 Pearson Education, Inc. Publishing as Prentice Hall 21-52

Equation Approach
Smart Touch Learning sells tablets for $500 each, variable costs are $275 each, and fixed costs are $12,000 per month. If the company desires to earn $6,000 in profits each month, how many tablets must it sell?
Net sales revenue – Variable costs – Fixed costs =Target profit
($500 per unit × Units sold) − ($275 per unit × Units sold) - $12,000 = $ 6,000
[($500 − $275 per unit) × Units sold] - $12,000 = $ 6,000
$225 per unit × Units sold = $12,000 + $6,000
$225 per unit × Units sold = $18,000
Units sold = $18,000 / $225 per unit
Units sold = 80 units
Copyright © 2014 Pearson Education, Inc. Publishing as Prentice Hall 21-53

Equation Approach—Check Your Calculation
Net sales revenue − Variable costs − Fixed costs = Operating income
Copyright © 2014 Pearson Education, Inc. Publishing as Prentice Hall 21-54
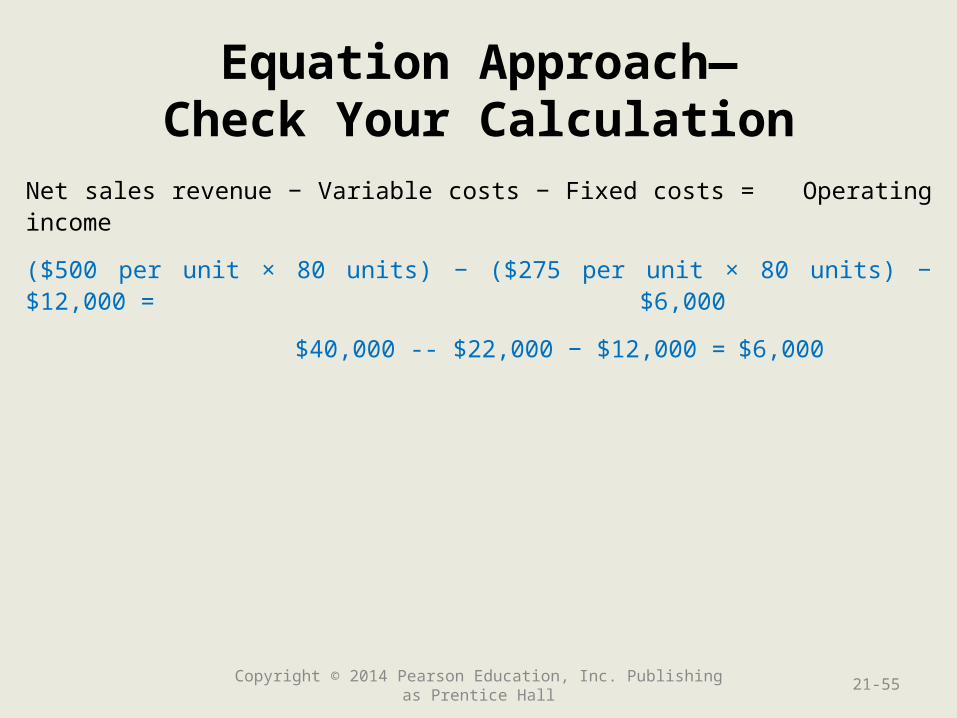
Equation Approach—Check Your Calculation
Net sales revenue − Variable costs − Fixed costs = Operating income
($500 per unit × 80 units) − ($275 per unit × 80 units) − $12,000 = $6,000
$40,000 -- $22,000 − $12,000 = $6,000
Copyright © 2014 Pearson Education, Inc. Publishing as Prentice Hall 21-55
Contribution Margin Approach
Smart Touch Learning sells tablets for $500 each, variable costs are $275 each, and fixed costs are $12,000 per month. If the company desires to earn $6,000 in profits each month, how many tablets must it sell?
Required sales in units = Fixed costs + Target profitContribution margin per unit
Copyright © 2014 Pearson Education, Inc. Publishing as Prentice Hall 21-56
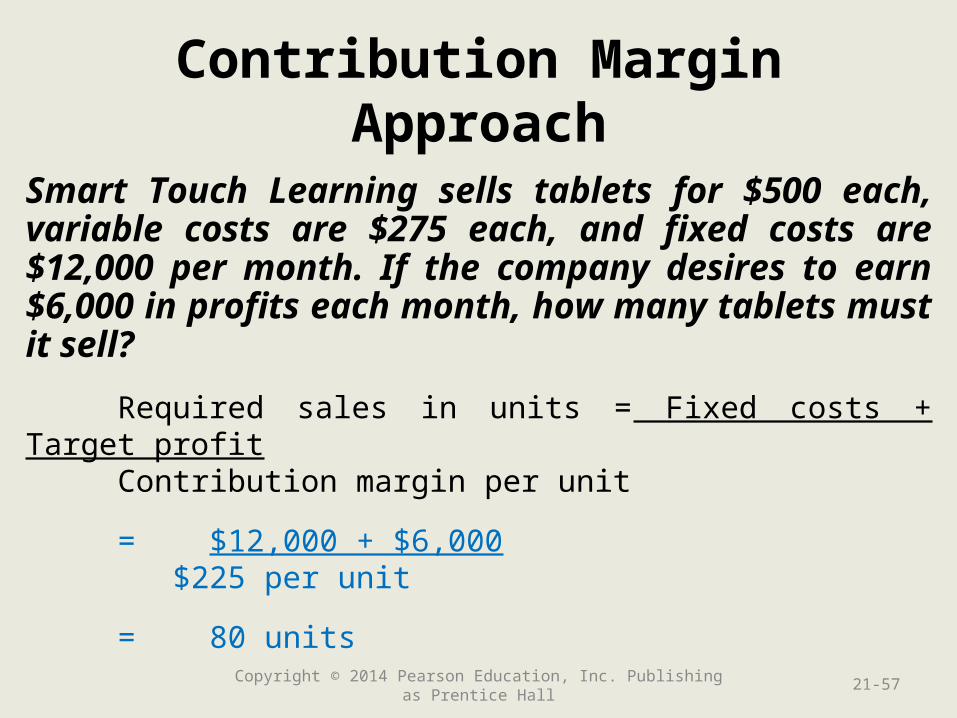
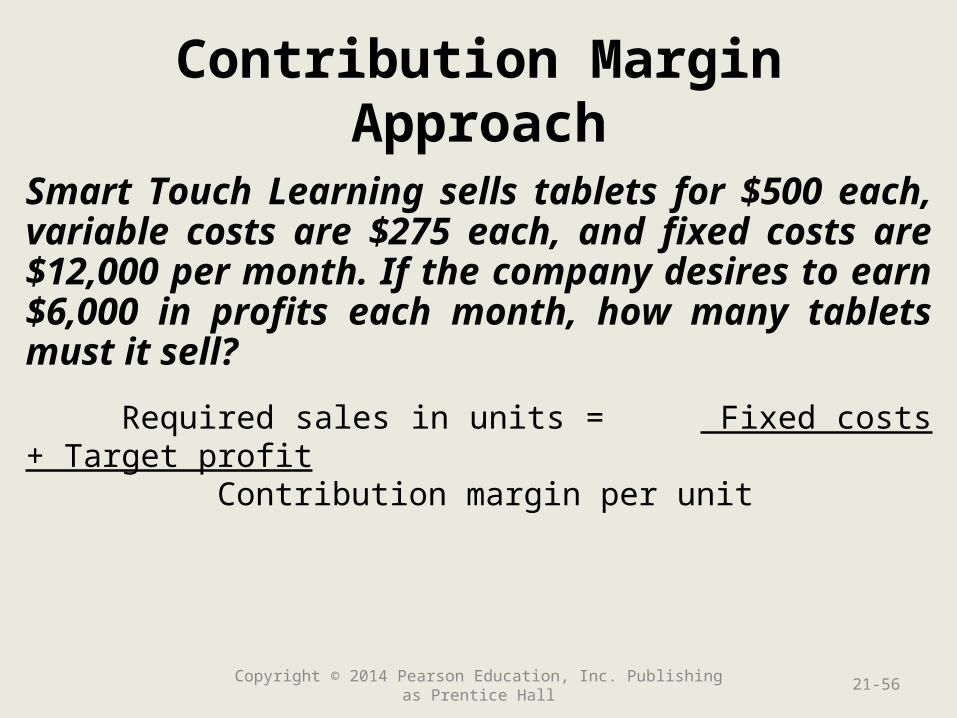
Contribution Margin Approach
Smart Touch Learning sells tablets for $500 each, variable costs are $275 each, and fixed costs are $12,000 per month. If the company desires to earn $6,000 in profits each month, how many tablets must it sell?
Required sales in units = Fixed costs + Target profitContribution margin per unit
= $12,000 + $6,000 $225 per unit
= 80 units
Copyright © 2014 Pearson Education, Inc. Publishing as Prentice Hall 21-57
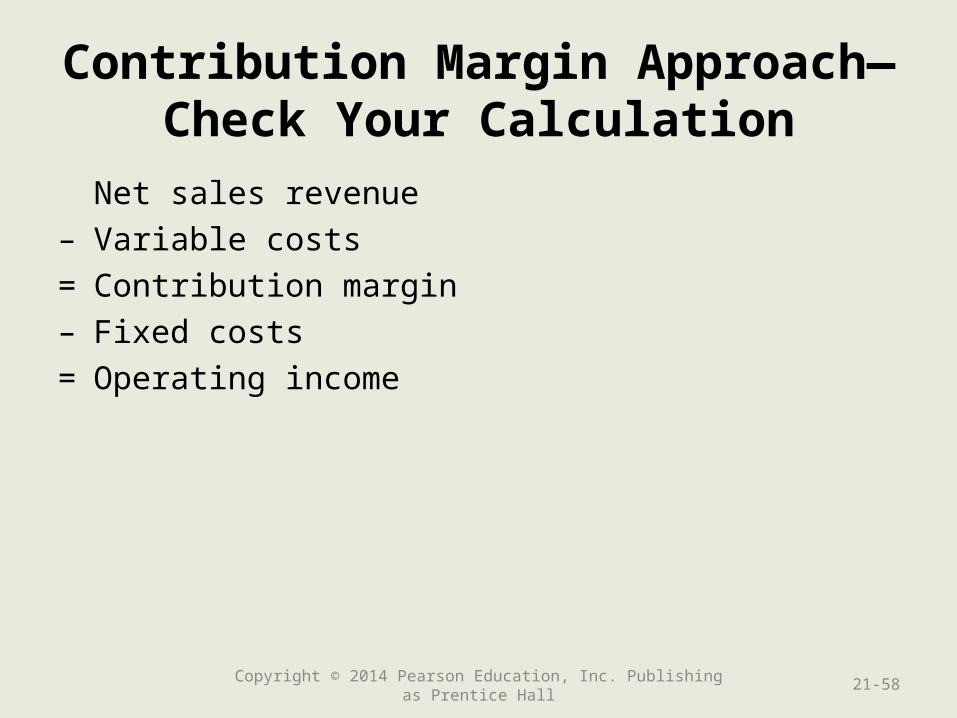
Contribution Margin Approach—Check Your Calculation
Net sales revenue
– Variable costs
= Contribution margin
– Fixed costs
= Operating income
Copyright © 2014 Pearson Education, Inc. Publishing as Prentice Hall 21-58

Contribution Margin Approach—Check Your Calculation
Net sales revenue ($500 per unit × 80 units) $40,000
– Variable costs ($275 per unit × 80 units)22,000
= Contribution margin ($225 per unit × 80 units)18,000
– Fixed costs12,000
= Operating income $6,000
Copyright © 2014 Pearson Education, Inc. Publishing as Prentice Hall 21-59

Contribution Margin Ratio Approach
Smart Touch Learning sells tablets for $500 each, variable costs are $275 each, and fixed costs are $12,000 per month. If the company desires to earn $6,000 in profits each month, how many tablets must it sell?
Required sales in dollars = Fixed costs + Target profit Contribution margin ratio
Copyright © 2014 Pearson Education, Inc. Publishing as Prentice Hall 21-60

Contribution Margin Ratio Approach
Smart Touch Learning sells tablets for $500 each, variable costs are $275 each, and fixed costs are $12,000 per month. If the company desires to earn $6,000 in profits each month, how many tablets must it sell?
Required sales in dollars = Fixed costs + Target profit Contribution margin ratio
= $12,000 + $6,000 45%
= $40,000
Copyright © 2014 Pearson Education, Inc. Publishing as Prentice Hall 21-61

Breakeven Point Calculationsfor Smart Touch Learning
Copyright © 2014 Pearson Education, Inc. Publishing as Prentice Hall 21-62

Breakeven Point Calculationsfor Smart Touch Learning
Copyright © 2014 Pearson Education, Inc. Publishing as Prentice Hall 21-63

Breakeven Point Calculationsfor Smart Touch Learning
Copyright © 2014 Pearson Education, Inc. Publishing as Prentice Hall 21-64

Breakeven Point Calculationsfor Smart Touch Learning
Copyright © 2014 Pearson Education, Inc. Publishing as Prentice Hall 21-65

Cost-Volume-Profit Graph
Copyright © 2014 Pearson Education, Inc. Publishing as Prentice Hall 21-66
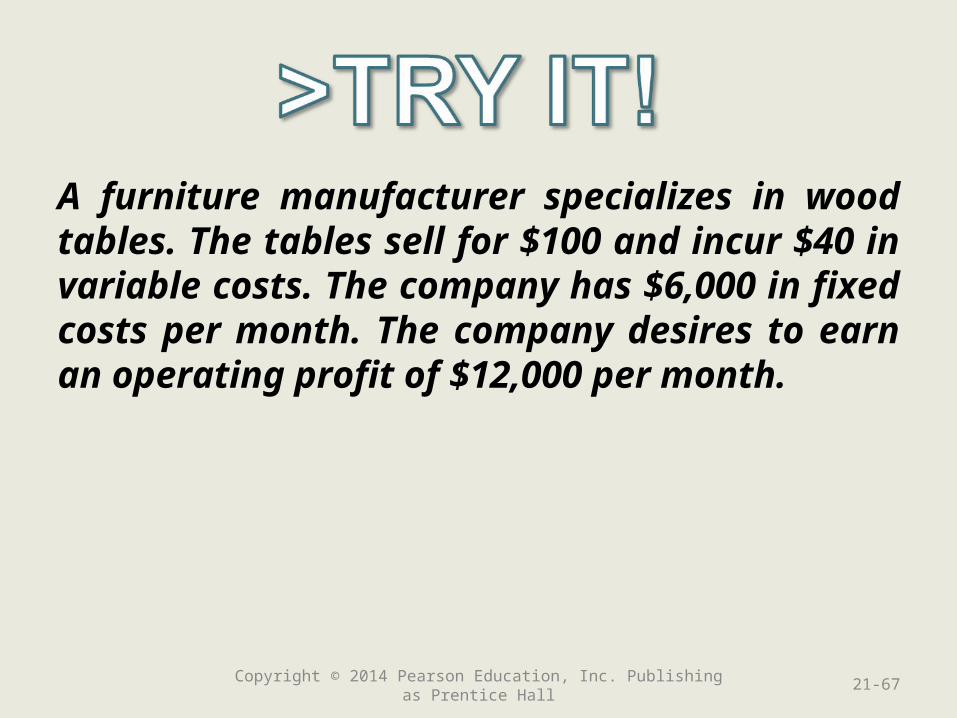
A furniture manufacturer specializes in wood tables. The tables sell for $100 and incur $40 in variable costs. The company has $6,000 in fixed costs per month. The company desires to earn an operating profit of $12,000 per month.
Copyright © 2014 Pearson Education, Inc. Publishing as Prentice Hall 21-67

10. Calculate the required sales in units to earn the target profit using the equation method.
Copyright © 2014 Pearson Education, Inc. Publishing as Prentice Hall 21-68

10. Calculate the required sales in units to earn the target profit using the equation method.
Net sales revenue – Variable costs – Fixed costs =Target profit
($100 per unit × Units sold) – ($40 per unit × Units sold) – $6,000 = $12,000
[($100 – $40 per unit) × Units sold] – $6,000 = $12,000
$60 per unit × Units sold = $ 6,000 + $12,000
$60 per unit × Units sold = $18,000
Units sold = $18,000 / $60 per unit
Units sold = 300 units
Copyright © 2014 Pearson Education, Inc. Publishing as Prentice Hall 21-69
11. Calculate the required sales in units to earn the target profit using the contribution margin method.
Copyright © 2014 Pearson Education, Inc. Publishing as Prentice Hall 21-70

11. Calculate the required sales in units to earn the target profit using the contribution margin method.
Required sales in units = Fixed costs + Target profit
Contribution margin per unit
= $6,000 + $12,000$100 per unit – $40 per unit
= 300 units
Copyright © 2014 Pearson Education, Inc. Publishing as Prentice Hall 21-71

12. Calculate the required sales in dollars to earn the target profit using the contribution margin ratio method.
Copyright © 2014 Pearson Education, Inc. Publishing as Prentice Hall 21-72

12. Calculate the required sales in dollars to earn the target profit using the contribution margin ratio method.
Contribution margin ratio = $60 per table / $100 per table = 60%
Required sales in dollars = Fixed costs + Target profit Contribution margin ratio
= $6,000 + $12,000 60%
= $30,000
Copyright © 2014 Pearson Education, Inc. Publishing as Prentice Hall 21-73

13. Calculate the required sales in units to breakeven using the contribution margin method.
Copyright © 2014 Pearson Education, Inc. Publishing as Prentice Hall 21-74

13. Calculate the required sales in units to breakeven using the contribution margin method.
Required sales in units = Fixed costs + Target profit
Contribution margin per unit
= $6,000 + $0$100 per unit – $40 per unit
= 100 units
Copyright © 2014 Pearson Education, Inc. Publishing as Prentice Hall 21-75

Learning Objective 4
Use CVP analysis to Use CVP analysis to perform sensitivity perform sensitivity
analysisanalysis
21-76Copyright © 2014 Pearson Education, Inc. Publishing as Prentice Hall

Change in the Selling Price—Contribution Margin Approach
Smart Touch Learning believes it must cut the selling price to $475 per tablet. Variable costs remain at $275 per tablet. Fixed costs stay at $12,000. How many tablets must be sold to break even?
Required sales in units = Fixed costs + Target profit
Contribution margin per unit
Copyright © 2014 Pearson Education, Inc. Publishing as Prentice Hall 21-77

Change in the Selling Price—Contribution Margin Approach
Smart Touch Learning believes it must cut the selling price to $475 per tablet. Variable costs remain at $275 per tablet. Fixed costs stay at $12,000. How many tablets must be sold to break even?
Required sales in units = Fixed costs + Target profit
Contribution margin per unit
= $12,000 + $0$475 per unit – $275 per unit
= 60 unitsCopyright © 2014 Pearson Education, Inc. Publishing as Prentice Hall 21-78

Change in the Variable Costs—Contribution Margin Approach
Smart Touch Learning’s selling price remains at $500 per tablet. Variable costs increase to $285 per tablet. Fixed costs stay at $12,000. How many tablets must be sold to break even?
Required sales in units = Fixed costs + Target profit
Contribution margin per unit
Copyright © 2014 Pearson Education, Inc. Publishing as Prentice Hall 21-79

Change in the Variable Costs—Contribution Margin Approach
Smart Touch Learning’s selling price remains at $500 per tablet. Variable costs increase to $285 per tablet. Fixed costs stay at $12,000. How many tablets must be sold to break even?
Required sales in units = Fixed costs + Target profit
Contribution margin per unit
= $12,000 + $0$500 per unit – $285 per unit
= 56 units*
* Rounded up to next full unitCopyright © 2014 Pearson Education, Inc. Publishing as Prentice Hall 21-80
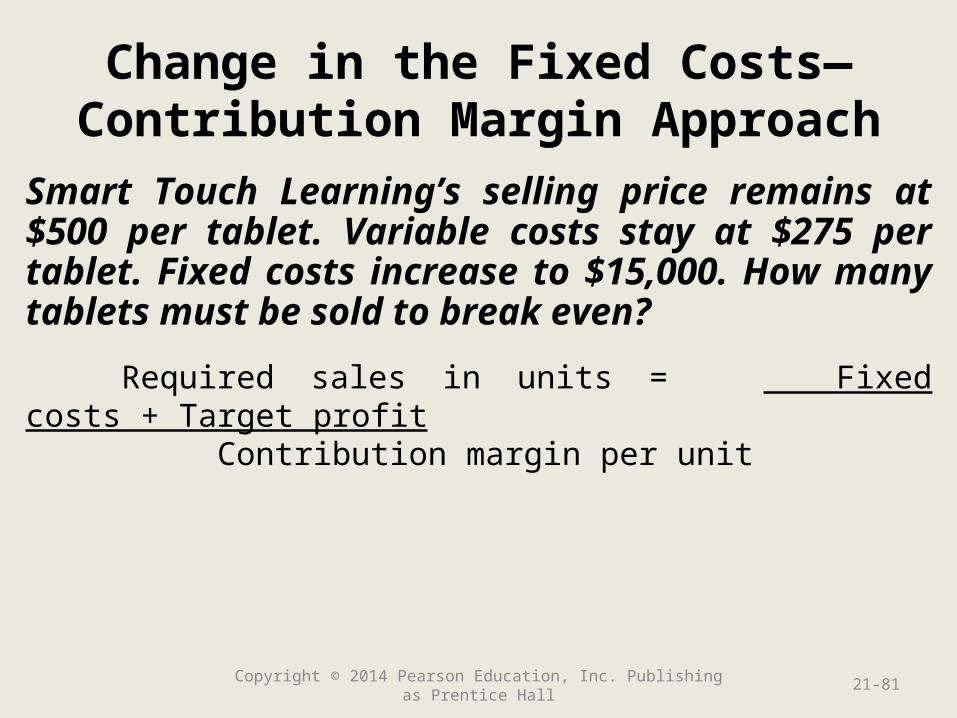
Change in the Fixed Costs—Contribution Margin Approach
Smart Touch Learning’s selling price remains at $500 per tablet. Variable costs stay at $275 per tablet. Fixed costs increase to $15,000. How many tablets must be sold to break even?
Required sales in units = Fixed costs + Target profit
Contribution margin per unit
Copyright © 2014 Pearson Education, Inc. Publishing as Prentice Hall 21-81

Change in the Fixed Costs—Contribution Margin Approach
Smart Touch Learning’s selling price remains at $500 per tablet. Variable costs stay at $275 per tablet. Fixed costs increase to $15,000. How many tablets must be sold to break even?
Required sales in units = Fixed costs + Target profit
Contribution margin per unit
= $15,000 + $0$500 per unit – $275 per unit
= 67 units*
* Rounded up to the next full unitCopyright © 2014 Pearson Education, Inc. Publishing as Prentice Hall 21-82

Effects of Changes in Selling Price, Variable Costs, and Fixed Costs
Exhibit 21-8 Effects of Changes in Selling Price, Variable Costs,and Fixed Costs
Cause Effect Result
Change Contribution Margin per Unit Breakeven point
Selling price per unit increases Increases Decreases
Selling price per unit decreases Decreases Increases
Variable cost per unit increases Decreases Increases
Variable cost per unit decreases Increases Decreases
Total fixed cost increases No effect Increases
Total fixed cost decreases No effect Decreases
Copyright © 2014 Pearson Education, Inc. Publishing as Prentice Hall 21-83

A furniture manufacturer specializes in wood tables. The tables sell for $100 and incur $40 in variable costs. The company has $6,000 in fixed costs per month. Calculate the breakeven point in units under each independent scenario.
Copyright © 2014 Pearson Education, Inc. Publishing as Prentice Hall 21-84

14. Variable costs increase by $10 per unit.
Copyright © 2014 Pearson Education, Inc. Publishing as Prentice Hall 21-85

14. Variable costs increase by $10 per unit.
Variable cost = $40 + $10 = $50
Contribution margin per unit = $100 − $50 = $50
Required sales in units = Fixed costs + Target profitContribution margin per unit
= $6,000 + $0$50 per unit
= 120 units
Copyright © 2014 Pearson Education, Inc. Publishing as Prentice Hall 21-86

15. Fixed costs decrease by $600.
Copyright © 2014 Pearson Education, Inc. Publishing as Prentice Hall 21-87

15. Fixed costs decrease by $600.
Fixed costs =$6,000 − $600 = $5,400
Contribution margin per unit = $100 − $40 = $60
Required sales in units = Fixed costs + Target profitContribution margin per unit
= $5,400 + $0$60 per unit
= 90 units
Copyright © 2014 Pearson Education, Inc. Publishing as Prentice Hall 21-88

16. Sales price increases by 10%.
Copyright © 2014 Pearson Education, Inc. Publishing as Prentice Hall 21-89

16. Sales price increases by 10%.
Sales price = $100 × 1.10 = $110
Contribution margin per unit = $110 − $40 = $70
Required sales in units = Fixed costs + Target profitContribution margin per unit
= $6,000 + $0$70 per unit
= 86 units*
* Rounded up to next whole unit
Copyright © 2014 Pearson Education, Inc. Publishing as Prentice Hall 21-90

Learning Objective 5
Use CVP analysis to Use CVP analysis to calculate margin of calculate margin of
safety, operating safety, operating leverage, and leverage, and multiproduct multiproduct
breakeven pointsbreakeven points
21-91Copyright © 2014 Pearson Education, Inc. Publishing as Prentice Hall

Margin of Safety
Smart Touch Learning’s original breakeven point was 54 tablets. The company expects to sell 100 tablets.
Expected sales – Breakeven sales = Margin of safety in units
Copyright © 2014 Pearson Education, Inc. Publishing as Prentice Hall 21-92
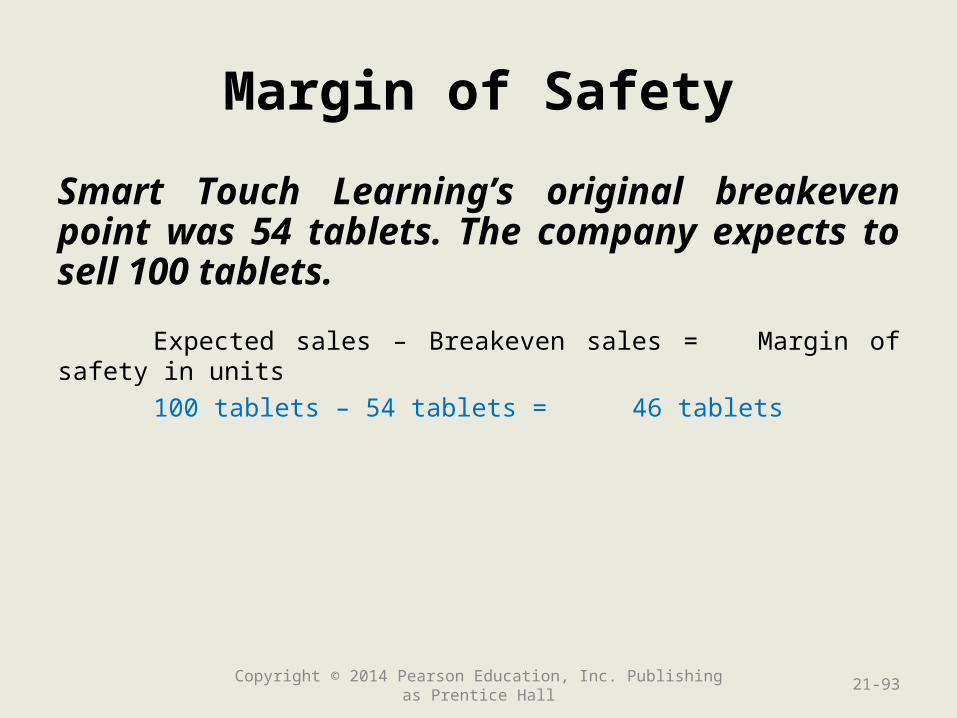
Margin of Safety
Smart Touch Learning’s original breakeven point was 54 tablets. The company expects to sell 100 tablets.
Expected sales – Breakeven sales = Margin of safety in units
100 tablets – 54 tablets = 46 tablets
Copyright © 2014 Pearson Education, Inc. Publishing as Prentice Hall 21-93

Margin of Safety
Smart Touch Learning’s original breakeven point was 54 tablets. The company expects to sell 100 tablets.
Expected sales – Breakeven sales = Margin of safety in units
100 tablets – 54 tablets = 46 tablets
Margin of safety in units × Sales price per unit = Margin of safety in dollars
Copyright © 2014 Pearson Education, Inc. Publishing as Prentice Hall 21-94
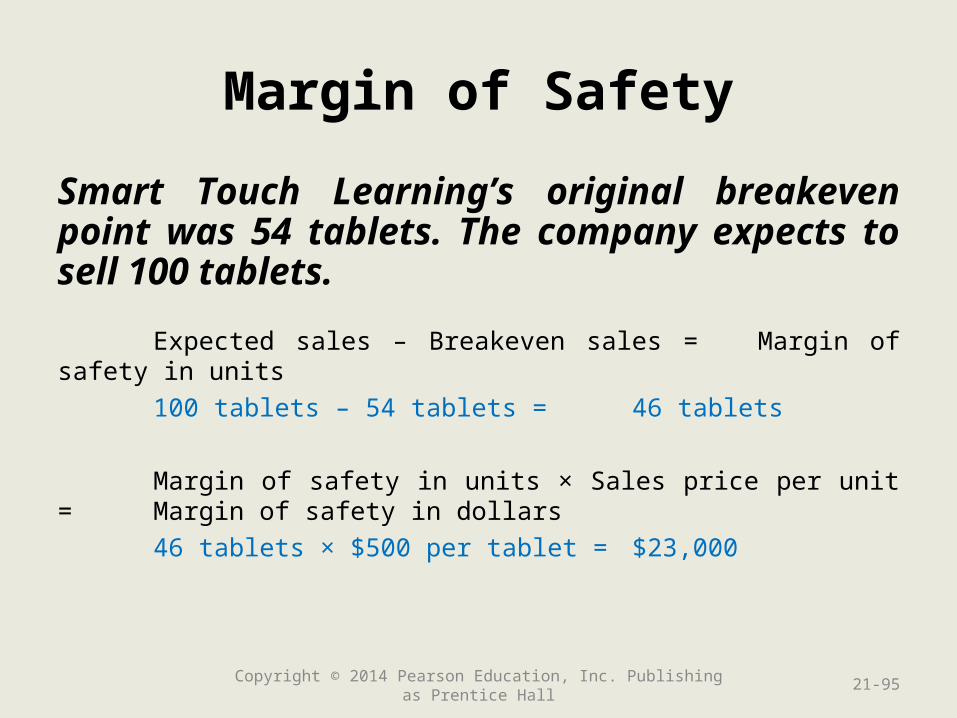
Margin of Safety
Smart Touch Learning’s original breakeven point was 54 tablets. The company expects to sell 100 tablets.
Expected sales – Breakeven sales = Margin of safety in units
100 tablets – 54 tablets = 46 tablets
Margin of safety in units × Sales price per unit = Margin of safety in dollars
46 tablets × $500 per tablet = $23,000
Copyright © 2014 Pearson Education, Inc. Publishing as Prentice Hall 21-95

Margin of Safety
Smart Touch Learning’s original breakeven point was 54 tablets. The company expects to sell 100 tablets.
Expected sales – Breakeven sales = Margin of safety in units
100 tablets – 54 tablets = 46 tablets
Margin of safety in units × Sales price per unit = Margin of safety in dollars
46 tablets × $500 per tablet = $23,000
Margin of safety in units / Expected sales in units = Margin of safety ratio
Copyright © 2014 Pearson Education, Inc. Publishing as Prentice Hall 21-96

Margin of Safety
Smart Touch Learning’s original breakeven point was 54 tablets. The company expects to sell 100 tablets.
Expected sales – Breakeven sales = Margin of safety in units
100 tablets – 54 tablets = 46 tablets
Margin of safety in units × Sales price per unit = Margin of safety in dollars
46 tablets × $500 per tablet = $23,000
Margin of safety in units / Expected sales in units = Margin of safety ratio
46 tablets / 100 tablets = 46%
Copyright © 2014 Pearson Education, Inc. Publishing as Prentice Hall 21-97

Expected ContributionMargin Income Statements
Copyright © 2014 Pearson Education, Inc. Publishing as Prentice Hall 21-98

Actual ContributionMargin Income Statements
Copyright © 2014 Pearson Education, Inc. Publishing as Prentice Hall 21-99

Degree of Operating Leverage
Degree of operating leverage = Contribution margin Operating income
Copyright © 2014 Pearson Education, Inc. Publishing as Prentice Hall 21-100
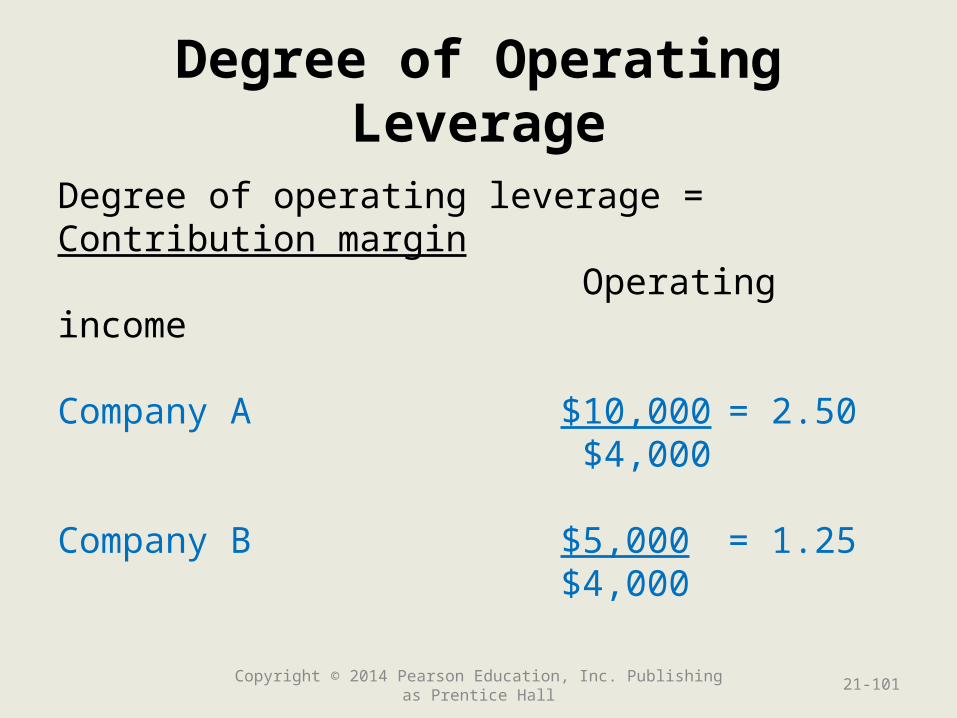
Degree of Operating Leverage
Degree of operating leverage = Contribution margin Operating income
Company A $10,000 = 2.50 $4,000
Company B $5,000 = 1.25$4,000
Copyright © 2014 Pearson Education, Inc. Publishing as Prentice Hall 21-101

Degree of Operating Leverage—Predicting Change in Operating Income
Copyright © 2014 Pearson Education, Inc. Publishing as Prentice Hall 21-102
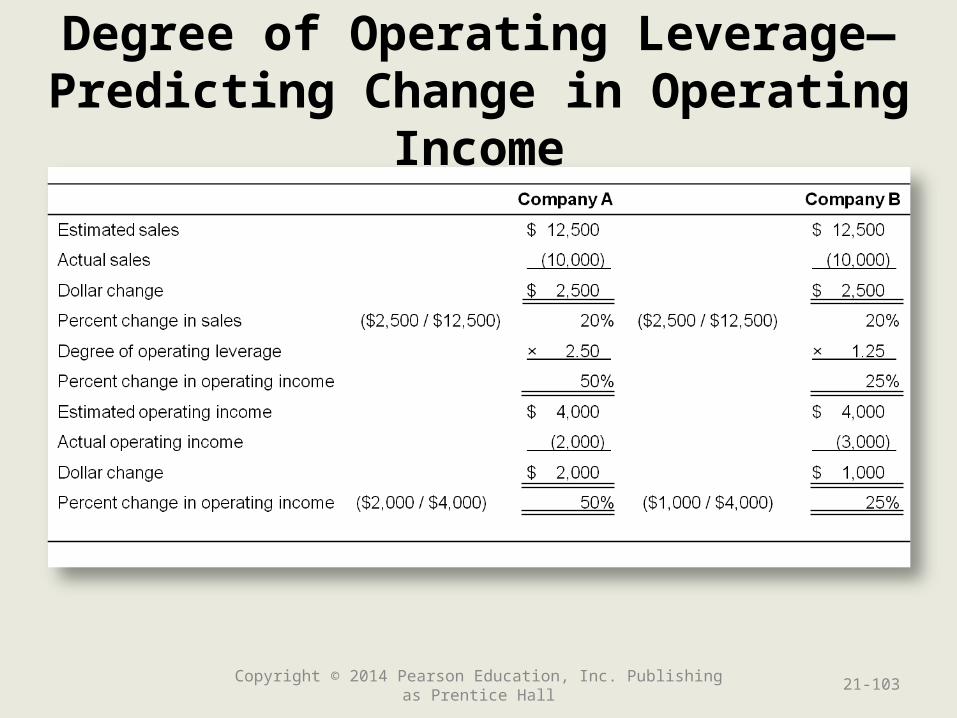
Degree of Operating Leverage—Predicting Change in Operating Income
Copyright © 2014 Pearson Education, Inc. Publishing as Prentice Hall 21-103

Sales Mix
Cool Cat Furniture sold 6,000 cat beds and 4,000 scratching posts. Total fixed costs are $40,000. The cat bed’s unit selling price is $44, and variable cost per bed is $24. The scratching post’s unit selling price is $100 and variable cost per post is $30. What is the breakeven point?
Copyright © 2014 Pearson Education, Inc. Publishing as Prentice Hall 21-104

Sales Mix
Cool Cat Furniture sold 6,000 cat beds and 4,000 scratching posts. Total fixed costs are $40,000. The cat bed’s unit selling price is $44, and variable cost per bed is $24. The scratching post’s unit selling price is $100 and variable cost per post is $30. What is the breakeven point?
Cat beds Scratching Posts Total6,0004,00010,00060% 40% 100%3 2 5
Copyright © 2014 Pearson Education, Inc. Publishing as Prentice Hall 21-105
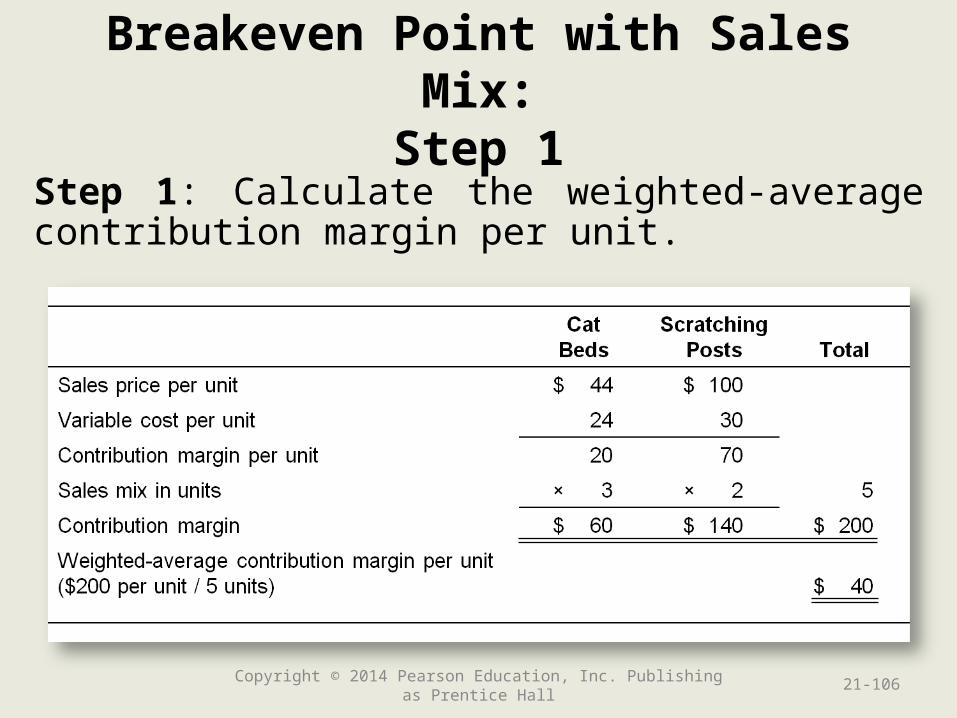
Breakeven Point with Sales Mix:Step 1
Copyright © 2014 Pearson Education, Inc. Publishing as Prentice Hall 21-106
Step 1: Calculate the weighted-average contribution margin per unit.
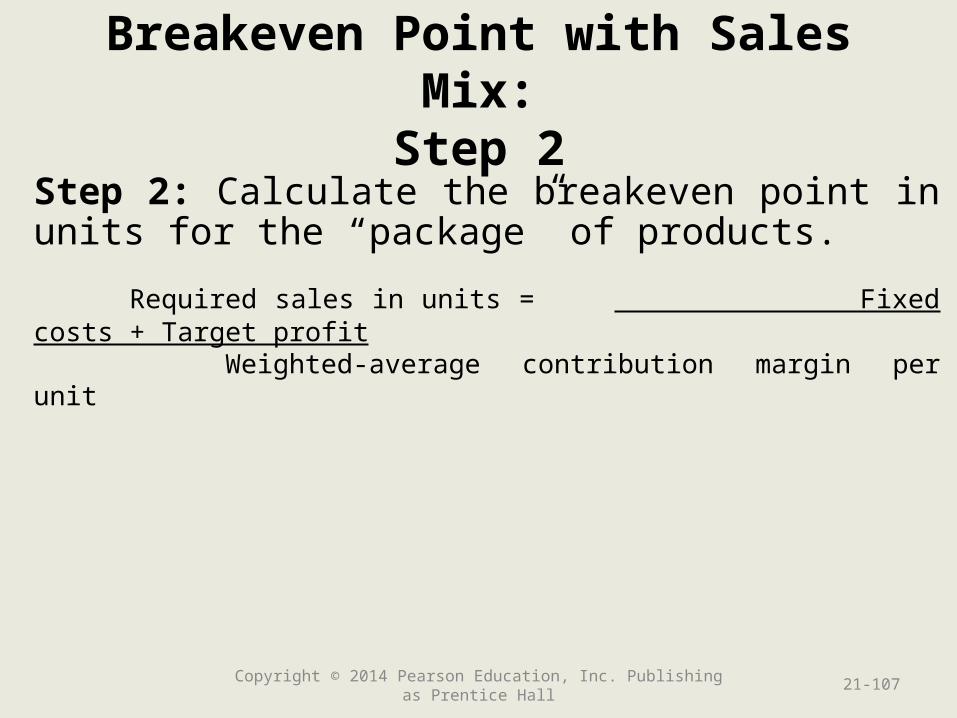
Breakeven Point with Sales Mix:Step 2
Step 2: Calculate the breakeven point in units for the “package” of products.
Required sales in units = Fixed costs + Target profit
Weighted-average contribution margin per unit
Copyright © 2014 Pearson Education, Inc. Publishing as Prentice Hall 21-107

Breakeven Point with Sales Mix:Step 2
Step 2: Calculate the breakeven point in units for the “package” of products.
Required sales in units = Fixed costs + Target profit
Weighted-average contribution margin per unit
= $40,000 + $0 $40 per item
= 1,000 items
Copyright © 2014 Pearson Education, Inc. Publishing as Prentice Hall 21-108

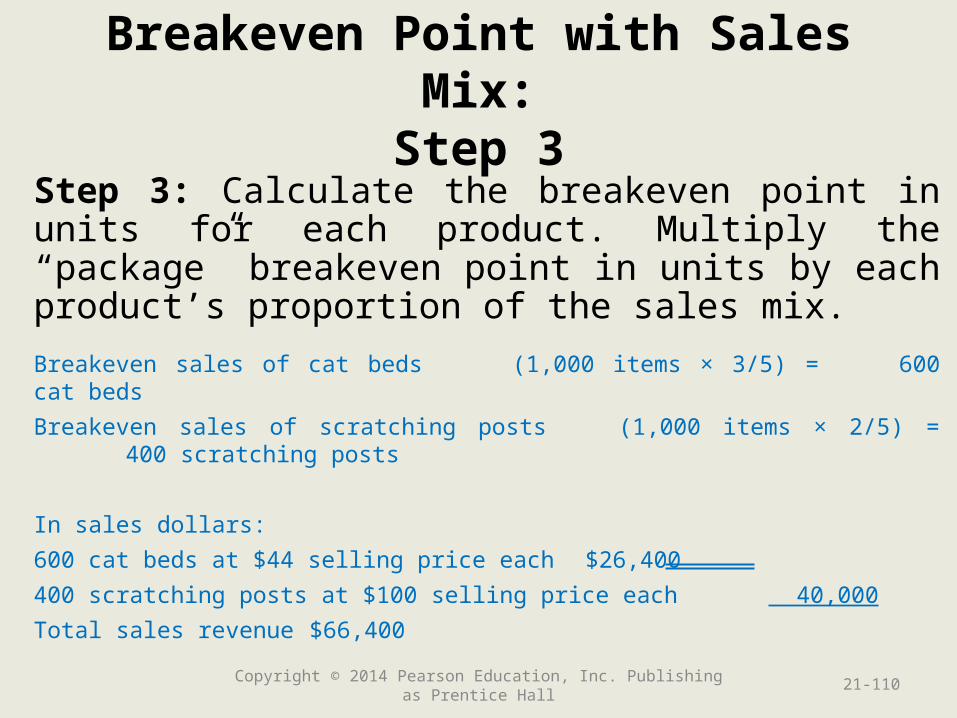
Breakeven Point with Sales Mix:Step 3
Step 3: Calculate the breakeven point in units for each product. Multiply the “package” breakeven point in units by each product’s proportion of the sales mix.
Copyright © 2014 Pearson Education, Inc. Publishing as Prentice Hall 21-109
Breakeven Point with Sales Mix:Step 3
Step 3: Calculate the breakeven point in units for each product. Multiply the “package” breakeven point in units by each product’s proportion of the sales mix.
Breakeven sales of cat beds (1,000 items × 3/5) = 600 cat beds
Breakeven sales of scratching posts(1,000 items × 2/5) = 400 scratching posts
In sales dollars:
600 cat beds at $44 selling price each $26,400
400 scratching posts at $100 selling price each 40,000
Total sales revenue $66,400
Copyright © 2014 Pearson Education, Inc. Publishing as Prentice Hall 21-110

Breakeven Point with Sales Mix:Contribution Income Statement
Copyright © 2014 Pearson Education, Inc. Publishing as Prentice Hall 21-111

Sales Mix with Target Profit
How many units of each product must Cool Cat sell to earn a target profit of $20,000?
Copyright © 2014 Pearson Education, Inc. Publishing as Prentice Hall 21-112

Sales Mix with Target Profit:Step 2
Step 2: Calculate the required sales in units for the “package” of products.
Required sales in units = Fixed costs + Target profit
Weighted-average contribution margin per unit
Copyright © 2014 Pearson Education, Inc. Publishing as Prentice Hall 21-113

Sales Mix with Target Profit:Step 2
Step 2: Calculate the required sales in units for the “package” of products.
Required sales in units = Fixed costs + Target profit
Weighted-average contribution margin per unit
= $40,000 + $20,000 $40 per item
= 1,500 items
Copyright © 2014 Pearson Education, Inc. Publishing as Prentice Hall 21-114

Target Profit with Sales Mix:Step 3
Step 3: Calculate the required sales in units for each product. Multiply the “package” required sales in units by each product’s proportion of the sales mix.
Copyright © 2014 Pearson Education, Inc. Publishing as Prentice Hall 21-115

Target Profit with Sales Mix:Step 3
Step 3: Calculate the required sales in units for each product. Multiply the “package” required sales in units by each product’s proportion of the sales mix.
Required sales of cat beds (1,500 items × 3/5) = 900 cat beds
Required sales of scratching posts (1,500 items × 2/5) = 600 scratching posts
Copyright © 2014 Pearson Education, Inc. Publishing as Prentice Hall 21-116

Target Profit with Sales Mix:Contribution Income Statement
Copyright © 2014 Pearson Education, Inc. Publishing as Prentice Hall 21-117
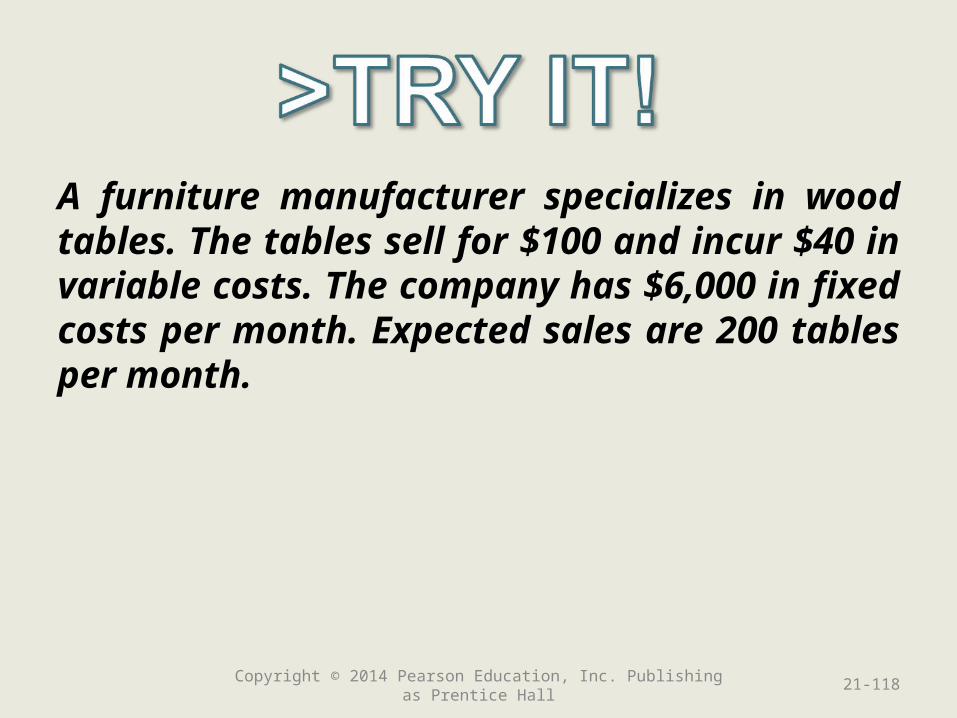
A furniture manufacturer specializes in wood tables. The tables sell for $100 and incur $40 in variable costs. The company has $6,000 in fixed costs per month. Expected sales are 200 tables per month.
Copyright © 2014 Pearson Education, Inc. Publishing as Prentice Hall 21-118

17. Calculate the margin of safety in units.
Copyright © 2014 Pearson Education, Inc. Publishing as Prentice Hall 21-119

17. Calculate the margin of safety in units.
Breakeven sales in units = Fixed costs + Target profitContribution margin per unit
= $6,000 + $ 0 $60 per unit
= 100 units
Margin of safety in units = Expected sales − Breakeven sales= 200 tables − 100 tables= 100 tables
Copyright © 2014 Pearson Education, Inc. Publishing as Prentice Hall 21-120

18. Determine the degree of operating leverage.
Copyright © 2014 Pearson Education, Inc. Publishing as Prentice Hall 21-121

18. Determine the degree of operating leverage.
Sales revenue (200 tables × $100 per table) $ 20,000– Variable costs (200 tables × $40 per table) 8,000
Contribution margin (200 tables × $60 per table) 12,000
– Fixed costs 6,000Operating income $ 6,000
Degree of operating leverage = Contribution margin Operating income
= $12,000 $6,000
= 2.00Copyright © 2014 Pearson Education, Inc. Publishing as Prentice Hall 21-122

19. The company begins manufacturing wood chairs to match the tables. Chairs sell for $50 each and have variable costs of $30. The new production process increases fixed costs to $7,000 per month. The expected sales mix is 1 table for every 4 chairs. Calculate the breakeven point.
Copyright © 2014 Pearson Education, Inc. Publishing as Prentice Hall 21-123

Copyright © 2014 Pearson Education, Inc. Publishing as Prentice Hall 21-124
Step 1: Calculate the weighted-average contribution margin per unit.

Step 2: Calculate the breakeven point in units for the “package” of products.
Required sales in units = Fixed costs + Target profit
Weighted-average contribution margin per unit
= $7,000 + $0$28 per item
= 250 items
Copyright © 2014 Pearson Education, Inc. Publishing as Prentice Hall 21-125

Step 3: Calculate the breakeven point in units for each product. Multiply the “package” breakeven point in units by each product’s proportion of the sales mix.
Breakeven sales of tables (250 items × 1/5) = 50 tables
Breakeven sales of chairs (250 items × 4/5) = 200 chairs
Copyright © 2014 Pearson Education, Inc. Publishing as Prentice Hall 21-126

Learning Objective 6
Distinguish between Distinguish between variable costing and variable costing and absorption costing absorption costing
(Appendix 21A)(Appendix 21A)
21-127Copyright © 2014 Pearson Education, Inc. Publishing as Prentice Hall

Difference between Absorption Costing and Variable Costing
Copyright © 2014 Pearson Education, Inc. Publishing as Prentice Hall 21-128
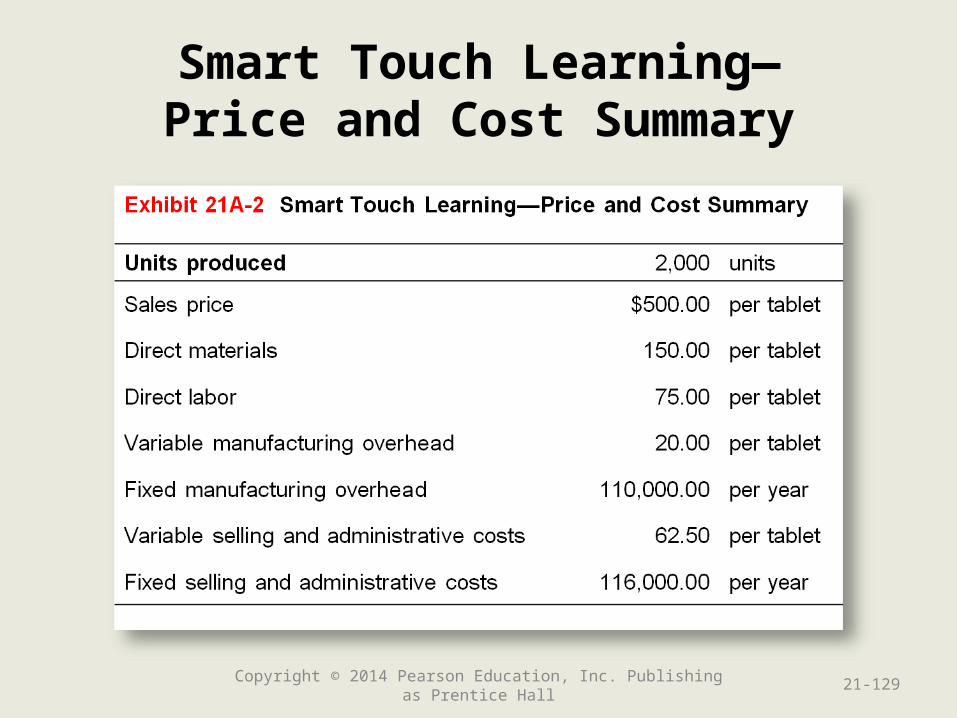
Smart Touch Learning—Price and Cost Summary
Copyright © 2014 Pearson Education, Inc. Publishing as Prentice Hall 21-129
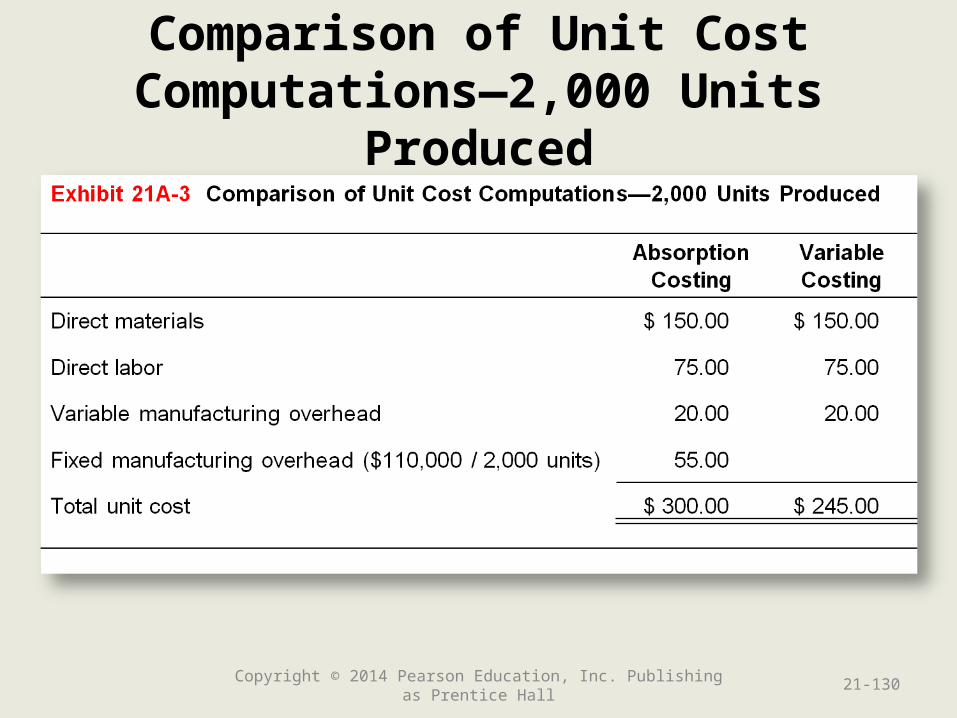
Comparison of Unit Cost Computations—2,000 Units Produced
Copyright © 2014 Pearson Education, Inc. Publishing as Prentice Hall 21-130

20. Pierce Company had the following costs:
Units produced 500 units
Direct materials 25 per unit
Direct labor 45 per unit
Variable manufacturing overhead 15 per unit
Fixed manufacturing overhead 5,000 per year
Variable selling and administrative costs
30 per unit
Fixed selling and administrative costs 3,200 per year
Calculate the unit production cost using absorption costing and variable costing.
Copyright © 2014 Pearson Education, Inc. Publishing as Prentice Hall 21-131

20.
Absorption Costing
Variable Costing
Direct materials $ 25 $ 25
Direct labor 45 45
Variable manufacturing overhead 15 15
Fixed manufacturing overhead ($5,000 / 500 units) 10
Total unit cost $ 95 $ 85
Copyright © 2014 Pearson Education, Inc. Publishing as Prentice Hall 21-132

Learning Objective 7
Compute operating Compute operating income using variable income using variable costing and absorption costing and absorption
costingcosting
(Appendix 21A)(Appendix 21A)
21-133Copyright © 2014 Pearson Education, Inc. Publishing as Prentice Hall

Absorption and Variable Costing:Three Scenarios
• Units produced equal units sold
• Units produced are more than units sold
• Units produced are less than units sold
Copyright © 2014 Pearson Education, Inc. Publishing as Prentice Hall 21-134

Absorption and Variable Costing:Year 1: Production Equals Sales
For Year 1, Smart Touch Learning has the following history:
•No beginning balance in Finished Goods Inventory
•Produced 2,000 tablet computers during the year
•Sold 2,000 tablet computers during the year
Copyright © 2014 Pearson Education, Inc. Publishing as Prentice Hall 21-135

Absorption and Variable Costing:Year 1: Production Equals Sales
Copyright © 2014 Pearson Education, Inc. Publishing as Prentice Hall 21-136

Absorption and Variable Costing:Year 2: Production Exceeds Sales
For Year 2, Smart Touch Learning has the following history:
•No beginning balance in Finished Goods Inventory (Year 1 ended with a zero balance; therefore, Year 2 will start with a zero balance)
•Produced 2,500 tablet computers during the year
•Sold 2,000 tablet computers during the year
Copyright © 2014 Pearson Education, Inc. Publishing as Prentice Hall 21-137
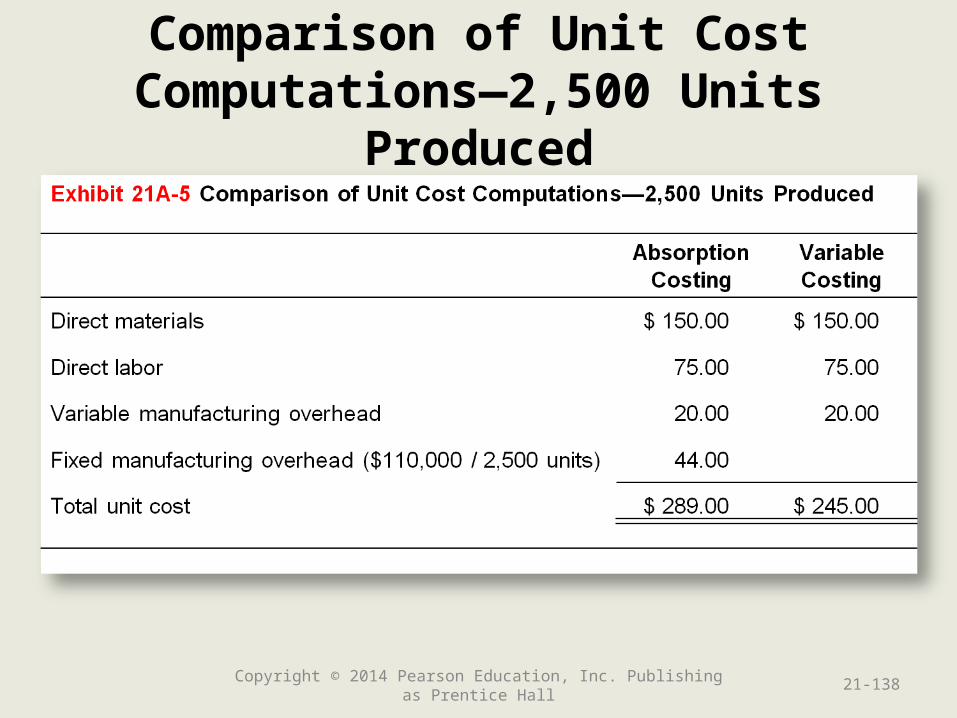
Comparison of Unit Cost Computations—2,500 Units Produced
Copyright © 2014 Pearson Education, Inc. Publishing as Prentice Hall 21-138

Absorption and Variable Costing:Year 2: Production Exceeds Sales
Copyright © 2014 Pearson Education, Inc. Publishing as Prentice Hall 21-139

Year 2: Production Costs in Absorption and Variable Costing—Production Exceeds Sales
Copyright © 2014 Pearson Education, Inc. Publishing as Prentice Hall 21-140

Absorption and Variable Costing:Year 3: Production is Less Than Sales
For Year 3, Smart Touch Learning has the following history:
•A beginning balance in Finished Goods Inventory of 500 units that cost $144,500 under absorption costing and $122,500 under variable costing (Year 2’s ending balances)
•Produced 1,500 tablet computers during the year
•Sold 2,000 tablet computers during the year
Copyright © 2014 Pearson Education, Inc. Publishing as Prentice Hall 21-141

Comparison of Unit Cost Computations—1,500 Units Produced
Copyright © 2014 Pearson Education, Inc. Publishing as Prentice Hall 21-142
*Rounded to nearest cent
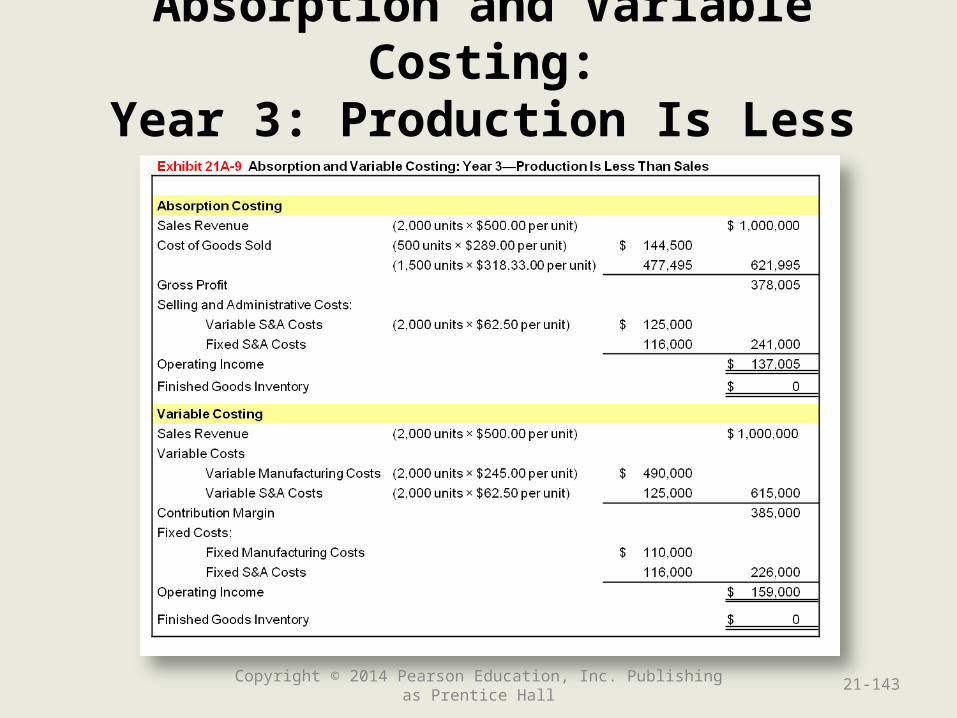
Absorption and Variable Costing:Year 3: Production Is Less Than Sales
Copyright © 2014 Pearson Education, Inc. Publishing as Prentice Hall 21-143

Year 3: Production Costs in Absorption and Variable Costing—Production Is Less Than Sales
Copyright © 2014 Pearson Education, Inc. Publishing as Prentice Hall 21-144

Absorption and Variable Costing:3-Year Summary
Copyright © 2014 Pearson Education, Inc. Publishing as Prentice Hall 21-145
*Absorption costing total figures adjusted for $5 rounding error created in Year 3when fixed cost per unit was rounded.

21. Hayden Company has 50 units in Finished Goods Inventory at the beginning of the accounting period. During the accounting period, Hayden produced 150 units and sold 200 units for $150 each. All units incurred $80 in variable manufacturing costs and $20 in fixed manufacturing costs. Hayden also incurred $7,500 in Selling and Administrative Expenses, all fixed. Calculate the operating income for the year using absorption costing and variable costing.
Copyright © 2014 Pearson Education, Inc. Publishing as Prentice Hall 21-146

Absorption Costing: Production cost per unit = $100
Sales Revenue (200 units × $150 per unit) $ 30,000
Cost of Goods Sold (200 units × $100 per unit) 20,000
Gross Profit 10,000
Selling and Administrative Expenses 7,500
Operating Income $ 2,500
Copyright © 2014 Pearson Education, Inc. Publishing as Prentice Hall 21-147

Variable Costing: Production cost per unit = $80
Sales Revenue (200 units × $150 per unit) $ 30,000
Variable Cost (200 units × $80 per unit) 16,000
Contribution Margin 14,000
Fixed Costs
Manufacturing (150 units × $20 per unit) 3,000
Selling and Administrative 7,500
Operating Income $ 3,500
Copyright © 2014 Pearson Education, Inc. Publishing as Prentice Hall 21-148

End of Chapter 21
21-149Copyright © 2014 Pearson Education, Inc. Publishing as Prentice Hall