accountability in early childhood ed in early childhood education ncsl 2007 annual meeting dr....
TRANSCRIPT
Accountability in Early Childhood Education
NCSL 2007 Annual Meeting
Dr. Sharon Lynn Kagan,Columbia University & Yale University
Dr. Thomas SchultzThe Pew Charitable Trusts
Overview
• Part I: Background
• Part II: Key Challenges
• Part III: Proposed System Design
• Part IV: Action Steps

Part I:
Background
Origins
• Conceived by The Pew Charitable Trusts as part of their Advancing Quality Pre-K For All initiative.
• Additional funding from the Foundation for Child Development and the Joyce Foundation.
• Task Force convened in fall, 2005, report release fall, 2007.
• Presentation reflects progress-to-date.
Impetus
• Increased attention to early learning• New state leadership efforts:
– Systems of early childhood services – Funding specific programs– Oversight and improvement of local agencies – Building P-21 and PK-3 continuum
• Accountability movement • New interest in child and program data

Task Force Members
• Dr. Sharon Lynn Kagan, Chair• Dr. Eugene Garcia, Vice-Chair
– Dr. W. Steven Barnett– Ms. Barbara Bowman– Dr. Mary Beth Bruder– Dr. Lindy Buch– Dr. Maryann Santos de
Barona– Ms. Harriet Dichter
– Mr. Mark Friedman– Dr. Jacqueline Jones– Dr. Joan Lombardi– Dr. Samuel Meisels– Ms. Marsha Moore– Dr. Robert Pianta– Dr. Donald Rock

Part II:
Key Challenges

Four Challenges
1. Structural Challenges
2. Conceptual Challenges
3. Technical Challenges
4. Resource Challenges
Challenges: Structural
• Fragmented non-system of programs for preschool-aged children
• Disjointed early childhood and public education policies

Multiple Standards and Assessments
YesYesYesYesResearch/Evaluations
States report % of children in 5
categories on 3 goals
PreK Assessments(13 states)
Kg. Assessments(17 states)
National Reporting
System
No current requirementsChild Assessments
3 functional goalsEarly Learning Guidelines(49 states)
Head Start Child Outcomes
Framework
Early Learning Guidelines(49 states)
Standards for
Children’s Learning
State Program Monitoring
Program Monitoring(30 states)
PRISM ReviewsLicensing VisitsQRS Assessments
(13 + 29)
Assessing Program Quality
IDEA regulationsState program
standards
State Program Standards(39 states)
Program Performance
Standards
State Licensing Standards(50 states)
Quality Rating Systems (QRS) (13 states + 29 pilots)
Program Quality
Standards
Special EducationState PreKHead StartChild Care
Kindergarten to Grade 3 Standards, Assessments, Data

Challenges: Structural
• Costs, burdens, confusion of multiple standards, assessments, and reports
• Multiple new initiatives all at once
• Pre-K – K-3 disconnects:
– Pre-K assessments are not transferred to schools.
– Standards, assessments, curricula are notaligned.

Challenges: Conceptual
• Reconciling early childhood’s focus on developing curriculum based on the child, not on standards
• Reconciling formal and informal approaches to assessment
• Discerning the wise and appropriate uses of data, so as not to track, label, punish or retain children

Challenges: Technical
• Need appropriate assessment tools and methods to report on:
– Progress/status of young children in all domains of learning and development
– Young ELLs and children with disabilities
– Program quality in diverse local agencies
Challenges: Resources
• Limitations and inequities in funding for:– Programs
– Infrastructure
• Risk that accountability efforts ignore and exacerbate inequities in resources
• Doing accountability and assessment right is costly; doing it wrong is deadly.

Part III:
Proposed System Design

Framing Beliefs
• Accountability is here to stay.
• Programs should be held to performance standards that are documented and verified.
• Assessments should inform policy decisions and be tied to program enhancement efforts.
• Current approaches to accountability and assessment must be reformed.

State Accountability & Improvement System Design
*Task Force members have differing views on the desirability and feasibility of this option.
Data Management & Reporting
Professional Development Program Rating & Improvement
Early Learning &Program Quality Standards
Infrastructure
Pre-K-Grade 3 Alignment and Linkages
- Technical assistance to individual agencies.- Awarding incentives and recognition to local agencies for program improvements - Decisions on funding local agencies
- Program-wide improvement efforts - Refining standards/policies- Appropriations decisions
- Oversight of state investments/initiatives - Planning new investments/initiatives - Baseline information for K-12 education planning
- Oversight of state investments/initiatives - Planning new investments/initiatives- Baseline information for K-12 education planning
HOW DATA IS USED
What is the quality in local agencies?
What is the quality and how well are children
progressing in specific state programs?
What is the quality of all early childhood
programs?
How well are all children progressing
in learning and development?
COREQUESTION
IV LOCAL AGENCY
QUALITY
III STATE PROGRAM
EVALUATION
IIPROGRAM
POPULATION
I CHILD POPULATION
OPTION
Assessment/Program Improvement Options
What is the quality and how well are children progressing in local
agencies?
- Technical assistance to individual agencies.- Awarding incentives and public recognition to local agencies for program improvements- Decisions on funding local agencies
LOCAL AGENCY QUALITY AND OUTCOMES*

System Design: Infrastructure
Data Management & Reporting
Professional Development
Program Rating &
Improvement
Early Learning &
Program Quality
Standards
System Infrastructure
Infrastructure
• Early Learning & Program Quality Standards– Alignment between:
Standards, assessment systems, and curriculaStandards between ages and gradesState and federal program structures and funding streamsChild and program standards
Infrastructure
• Program Rating & Improvement– Assesses and reports on the quality of all forms
of early education programs
– Provides technical assistance and professional development to improve quality
– May provide public recognition/incentives to reward higher levels of quality

Infrastructure
• Professional Development System– Links informal training with formal education,
provides career pathways, links education and compensation.
– Supports training on assessment administration, analysis and use.

Infrastructure
• Data Management & Reporting– All-in-one place data on:
ChildrenProgramsWorkforce
– Unified system of child identification numbers – Provides for quality assurance of data and
assessments

Assessment Options
• States vary in:– What they want to know
– How they plan to use data
– Available resources
• States may implement one or any combination of options
• Report includes cautions/safeguards for each option
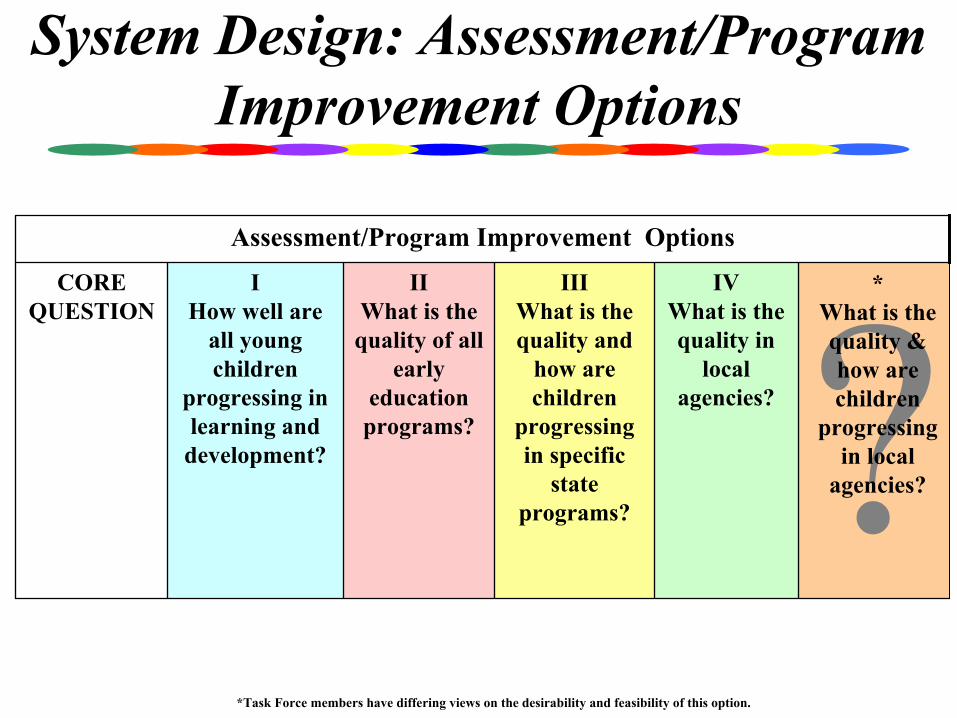
System Design: Assessment/Program Improvement Options
IV What is the quality in
local agencies?
III What is the quality and
how are children
progressing in specific
state programs?
II What is the quality of all
early education programs?
I How well are
all young children
progressing in learning and
development?
COREQUESTION
Assessment/Program Improvement Options
*Task Force members have differing views on the desirability and feasibility of this option.
*What is the quality & how are children
progressing in local
agencies?
Options I and II: Statewide Data on All Children & Programs
• How data is used:
– Planning interagency investments/initiatives
– Legislative oversight
– Baseline information for public education

Option I
• How well are all young children progressing in learning and development?– Data on learning status/progress for
representative sample of all young children in a state
– Demographic data
MD Kindergarten Readiness Assessment
• Kindergarten teachers administer modified Work Sampling System assessment to all kindergarten children in November.
• Report statewide and school district trends in overall “readiness” in specific domains for subgroups of children.
• Data used to target new state investments and in school district planning.

Option II
• What is the quality of services in all early childhood programs?– Quality in all forms of early education
services
– Early childhood workforce
– Levels of investment/program resources

PA Quality Rating System
• PA Keystone STARS documents and improves program quality through standards, professional development, incentives, and public recognition.
• 4,300 local agencies serving 153,000 children participate.
• ECERS-R assessment tool administered in 1/3 sample of classrooms as part of 4-tiered system of quality recognition.
• State invests $46 million to support STARS including $22 million in incentives to providers.

Option III: Data on Specific State Programs
• What is the quality and how well are children progressing in specific programs?– How data is used:
Program-wide improvement efforts
Refining standards/policies
Appropriations decisions
Michigan School Readiness Program
• Longitudinal evaluation of program quality and children’s learning through grade 4 using comparison group of similar children.
• 5-state program evaluation using a regression discontinuity design and different child assessment tools.
• Positive results helped sustain program funding in era of budget reductions statewide.

Options IV and V:Data From Local Agency Assessments
• How data is used:– Technical assistance to individual providers
– Awarding incentives and public recognition
– Funding decisions by state agencies
Options IV and V
• Option IV: What is the quality of services in local provider agencies?
• Option V: How is the quality and how well are children progressing in local provider agencies?– Task Force members had varied views on
merits and feasibility Option V.
Option IV: NJ Quality Assessments
• NJ administers ECERS-R and 2 state-developed tools assessing quality of teaching in literacy and mathematics in samples of 300 classrooms/year.
• Local agencies conduct self-assessments of tools based on state program quality standards. State validates self-assessments in 1/3 of agencies each year.
• Results are used for provider-specific program improvement and evaluating contracts with Head Start and child care providers.

Option V: NM Pre-K Program
• NM visits all local agencies twice per year to monitor and offer assistance on program quality standards.
• Teachers use state-developed observational assessment tool for instructional purposes; agencies report data to state 3 times per year.
• State aggregates results to report to legislature.• Local agency results are used for program
improvement but are not reported to the public.

System Design: Pre-K – Grade 3 Alignment and Linkages
Pre-K-Grade 3 Alignment and Linkages
Pre-K – Grade 3 Integration
• Align standards, assessments, and reporting on:– Children’s progress– Quality of teaching/learning opportunities
• “Vertical” teams of teachers/managers to:– Review assessment information – Enrich learning experiences and teaching strategies
• Joint professional development
Part IV:
Action Steps

Action Steps: Legislatures
• Provide adequate funding for programs and infrastructure to support ongoing assessments and program improvements
Action Steps: State Agencies
• Develop a strategic plan for early childhood accountability and program improvement system
• Create a robust, positive, and rigorous culture for early childhood accountability efforts
• Enable local Pre-K – 3 partnerships

Action Steps: Federal Government
• “Harmonize” information systems
• Fund research and development for better assessment tools
• Conduct ongoing longitudinal research on children and programs

Action Steps: Local Agencies
• Create opportunities for teachers and managers to review assessments and enhance children’s learning opportunities
• Initiate dialogue with local school districts

The Benefits• For Children: Enhanced learning opportunities and
improved outcomes
• For Legislators: Better data to guide state policies and investments
• For Teachers/Directors: Targeted and well-resourced professional development and program improvement efforts
• For the Early Childhood Profession: Enhanced public awareness and credibility