accountability and overview report 2005 06 · grade 9 257,789 264,033 257,032 grade 10 224,302...
TRANSCRIPT

New York State Public Schools Report Card
The New York State Report Card is an important part
of the Board of Regents effort to raise learning standards for
all students. It provides information to the public on the state’s
performance under the State and federal accountability systems,
on student performance, and on other measures of performance.
Knowledge gained from the report card on the state’s strengths
and weaknesses can be used to improve instruction and services
to students.
State assessments are designed to help ensure that all
students reach high learning standards. They show whether
students are getting the knowledge and skills they need
to succeed at the elementary, middle, and commencement
levels and beyond. The State requires that students who are not
making appropriate progress toward the standards receive
academic intervention services.
Use this report to:1 Get Statewide
Profile information. Thissectionshowscomprehensive
datarelevanttothestate’slearningenvironment.
2 Review State Accountability Status.
Thissectionindicateswhetherthestatemadeadequateyearlyprogress(AYP).
3 Review an Overview of Statewide Performance.
ThissectionhasinformationaboutstatewideperformanceonstateassessmentsinEnglish,mathematics,andscience,andonhighschoolgraduationrate.
Formoreinformation:OfficeofInformationandReportingServicesNewYorkStateEducationDepartmentRoom863EBAAlbany,NY12234Email:[email protected]
The New York State Report CardAccountability and Overview Report 2005 – 06

Statewide Profile
Thissectionshowscomprehensivedatarelevanttothestate’slearningenvironment,includinginformationaboutenrollment,averageclasssize,andteacherqualifications.
Enrollment 2003–04 2004–05 2005–06
Pre-K 77,501 78,152 40,515
Kindergarten 190,698 188,821 189,971
Grade1 203,886 203,317 199,685
Grade2 203,454 198,322 196,802
Grade3 207,625 202,140 195,960
Grade4 208,575 202,340 196,313
Grade5 212,229 208,244 202,364
Grade6 215,753 211,955 205,839
UngradedElementary 56,525 52,513 53,278
Grade7 221,950 219,564 213,908
Grade8 220,075 218,602 216,302
Grade9 257,789 264,033 257,032
Grade10 224,302 229,185 233,656
Grade11 175,606 184,008 186,124
Grade12 163,452 167,275 173,945
UngradedSecondary 56,491 51,940 51,490
Total K–12 2,818,410 2,802,259 2,772,669
Average Class Size2003–04 2004–05 2005–06
Common Branch 23 22 22
Grade 8
English 22 22 22
Mathematics 22 23 22
Science 22 23 23
SocialStudies 22 23 23
Grade 10
English 22 23 23
Mathematics 20 22 22
Science 21 23 23
SocialStudies 22 24 24
Statewide Profile1
Average Class Size InformationAverage Class Size isthetotalregistrationinspecifiedclassesdividedbythenumberofthoseclasseswithregistration.Common Branch referstoself-containedclassesinGrades1–6.
Enrollment InformationEnrollmentcountsareasofBasicEducationalDataSystem(BEDS)day,whichistypicallythefirstWednesdayofOctoberoftheschoolyear.Thestatepublicenrollmentinpublicschooldistricts,charterschools,NYSED-operatedprograms,andBOCESprograms.Studentsclassifiedbydistrictsas“pre-first”areincludedinfirstgradecounts.

Demographic Factors
2003–04 2004–05 2005–06
# % # % # %
EligibleforFreeLunch* N/A N/A 946,115 34% 1,027,545 37%
Reduced-PriceLunch* N/A N/A 209,231 7% 213,744 8%
StudentStability N/A N/A N/A N/A N/A N/A
LimitedEnglishProficient 191,992 7% 200,777 7% N/A N/A
Racial/Ethnic Origin
AmericanIndian
orAlaskaNative
13,097 ** 13,163 ** 13,659 **
BlackorAfricanAmerican 562,127 20% 557,262 20% 545,526 20%
HispanicorLatino 545,383 19% 553,296 20% 554,563 20%
AsianorNativeHawaiian/
OtherPacificIslander
183,988 7% 187,824 7% 192,414 7%
White 1,513,815 54% 1,490,669 53% 1,466,507 53%
* DoesnotincludeNYCdata. ** Percentageislessthan1.
Attendance and Suspensions
2002–03 2003–04 2004–05
# % # % # %
AnnualAttendanceRate N/A 93% N/A 93% N/A 93%
StudentSuspensions 124,850 4% 136,758 5% 127,780 5%
Statewide Profile1
Attendance and Suspensions InformationA district’s Annual Attendance Rate isdeterminedbydividingthedistrict’stotalactualattendancebythetotalpossibleattendanceforaschoolyear.Adistrict’sactualattendanceisthesumofthenumberofstudentsinattendanceoneachdaythedistrict’sschoolswereopenduringtheschoolyear.Possibleattendanceisthesumofthenumberofenrolledstudentswhoshouldhavebeeninattendanceoneachdayschoolswereopenduringtheschoolyear.Thestate’sAnnual Attendance Rateisaweightedaverageofalldistrict-levelattendancerates.Student Suspensionrateisdeterminedbydividingthenumberofstudentswhoweresuspendedfromschool(notincludingin-schoolsuspensions)foronefulldayorlongeranytimeduringtheschoolyearbytheBasicEducationalDataSystem(BEDS)dayenrollmentsforthatschoolyear.Astudentiscountedonlyonce,regardlessofwhetherthestudentwassuspendedoneormoretimesduringtheschoolyear.
Demographic Factors InformationEligible for Free LunchandReduced-Price Lunch percentagesaredeterminedbydividingthenumberofapprovedlunchapplicantsbytheBasicEducationalDataSystem(BEDS)enrollmentinfull-daykindergartenthroughGrade12.Eligible for Free Lunch andLimited English Proficient countsareusedtodetermineSimilar Schools groupingswithinaNeed/Resource Capacitycategory.
Statewide Profile1
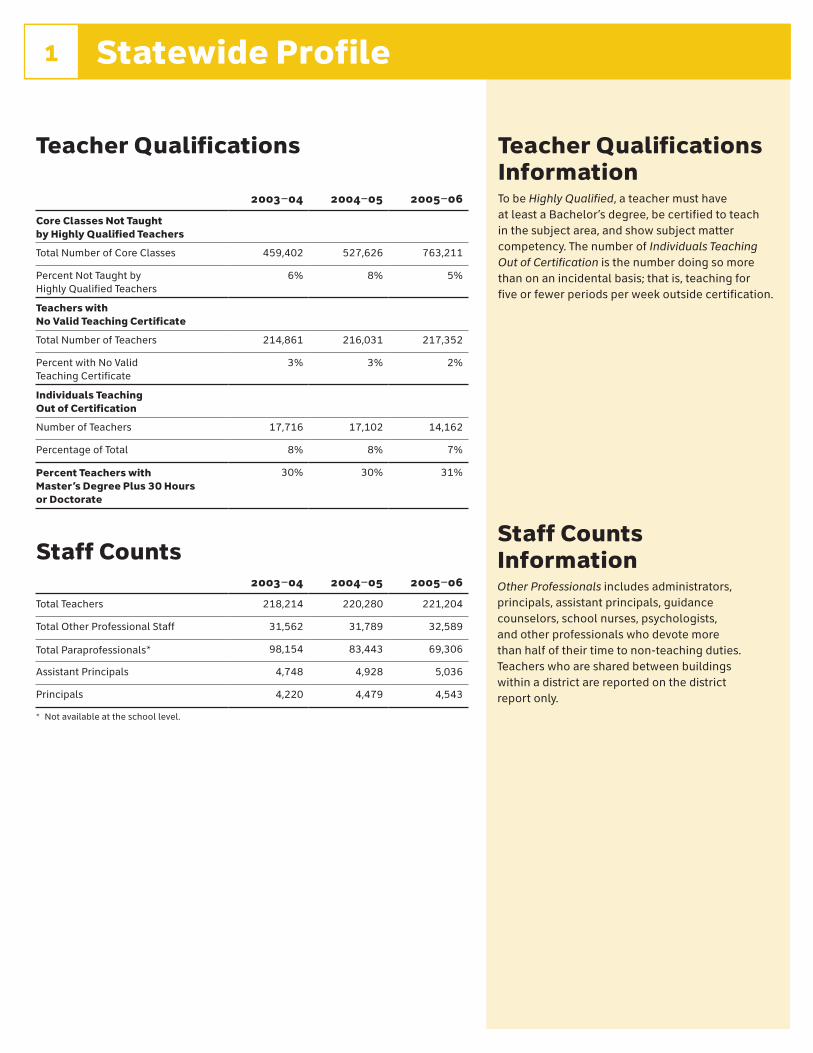
Teacher Qualifications
2003–04 2004–05 2005–06
Core Classes Not Taught by Highly Qualified Teachers
TotalNumberofCoreClasses 459,402 527,626 763,211
PercentNotTaughtbyHighlyQualifiedTeachers
6% 8% 5%
Teachers with No Valid Teaching Certificate
TotalNumberofTeachers 214,861 216,031 217,352
PercentwithNoValidTeachingCertificate
3% 3% 2%
Individuals Teaching Out of Certification
NumberofTeachers 17,716 17,102 14,162
PercentageofTotal 8% 8% 7%
Percent Teachers with Master’s Degree Plus 30 Hours or Doctorate
30% 30% 31%
Staff Counts2003–04 2004–05 2005–06
TotalTeachers 218,214 220,280 221,204
TotalOtherProfessionalStaff 31,562 31,789 32,589
TotalParaprofessionals* 98,154 83,443 69,306
AssistantPrincipals 4,748 4,928 5,036
Principals 4,220 4,479 4,543
* Notavailableattheschoollevel.
Staff Counts InformationOther Professionals includesadministrators,principals,assistantprincipals,guidancecounselors,schoolnurses,psychologists,andotherprofessionalswhodevotemorethanhalfoftheirtimetonon-teachingduties.Teacherswhoaresharedbetweenbuildingswithinadistrictarereportedonthedistrictreportonly.
Teacher Qualifications InformationTobeHighly Qualified,ateachermusthaveatleastaBachelor’sdegree,becertifiedtoteachinthesubjectarea,andshowsubjectmattercompetency.ThenumberofIndividuals Teaching Out of Certification isthenumberdoingsomorethanonanincidentalbasis;thatis,teachingforfiveorfewerperiodsperweekoutsidecertification.
Statewide Accountability2
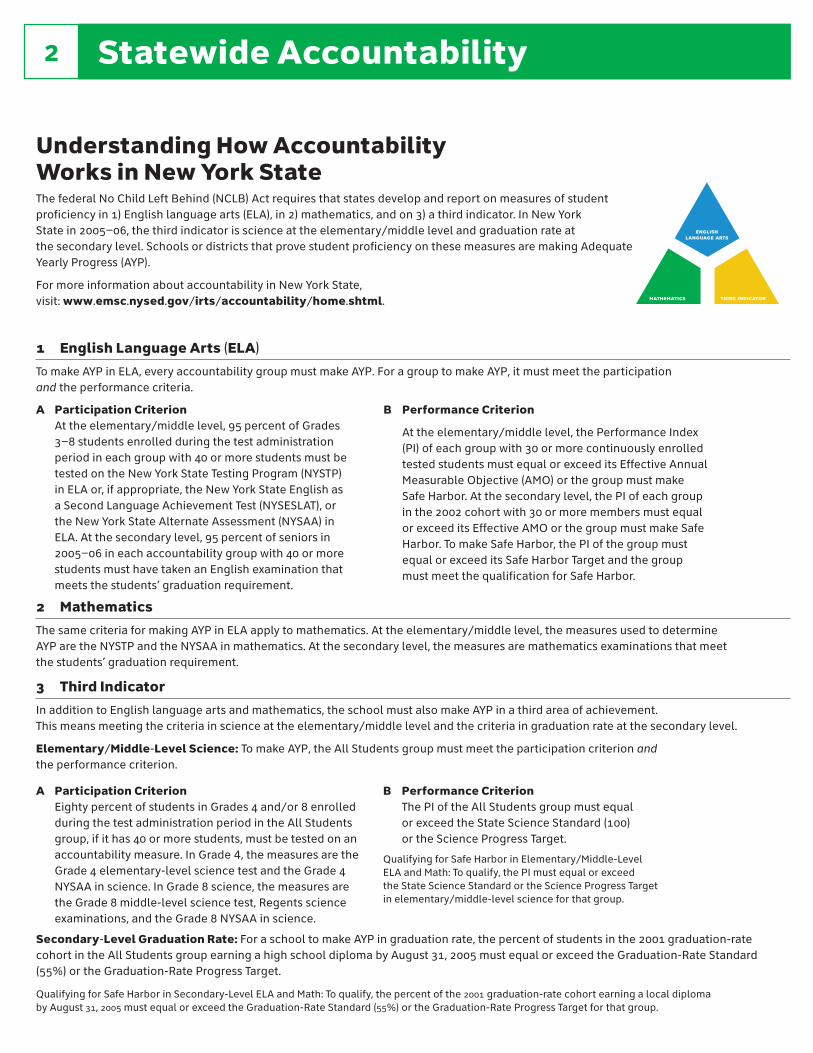
Understanding How Accountability Works in New York StateThefederalNoChildLeftBehind(NCLB)Actrequiresthatstatesdevelopandreportonmeasuresofstudentproficiencyin1)Englishlanguagearts(ELA),in2)mathematics,andon3)athirdindicator.InNewYorkStatein2005–06,thethirdindicatorisscienceattheelementary/middlelevelandgraduationrateatthesecondarylevel.SchoolsordistrictsthatprovestudentproficiencyonthesemeasuresaremakingAdequateYearlyProgress(AYP).
FormoreinformationaboutaccountabilityinNewYorkState,visit:www.emsc.nysed.gov/irts/accountability/home.shtml.
1 English Language Arts (ELA)
TomakeAYPinELA,everyaccountabilitygroupmustmakeAYP.ForagrouptomakeAYP,itmustmeettheparticipationandtheperformancecriteria.
englishlanguage arts
mathematics third indicator
Secondary-Level Graduation Rate: ForaschooltomakeAYPingraduationrate,thepercentofstudentsinthe2001 graduation-ratecohortintheAllStudentsgroupearningahighschooldiplomabyAugust31,2005mustequalorexceedtheGraduation-RateStandard(55%)ortheGraduation-RateProgressTarget.
QualifyingforSafeHarborinSecondary-LevelELAandMath:Toqualify,thepercentofthe2001 graduation-ratecohortearningalocaldiplomabyAugust31,2005mustequalorexceedtheGraduation-RateStandard(55%)ortheGraduation-RateProgressTargetforthatgroup.
A Participation CriterionAttheelementary/middlelevel,95 percentofGrades3–8studentsenrolledduringthetestadministrationperiodineachgroupwith40ormorestudentsmustbetestedontheNewYorkStateTestingProgram(NYSTP)inELAor,ifappropriate,theNewYorkStateEnglishasaSecondLanguageAchievementTest(NYSESLAT),ortheNewYorkStateAlternateAssessment(NYSAA)inELA.Atthesecondarylevel,95 percentofseniorsin2005–06ineachaccountabilitygroupwith40ormorestudentsmusthavetakenanEnglishexaminationthatmeetsthestudents’graduationrequirement.
B Performance Criterion
Attheelementary/middlelevel,thePerformanceIndex(PI)ofeachgroupwith30ormorecontinuouslyenrolledtestedstudentsmustequalorexceeditsEffectiveAnnualMeasurableObjective(AMO)orthegroupmustmakeSafeHarbor.Atthesecondarylevel,thePIofeachgroupinthe2002cohortwith30 ormoremembersmustequalorexceeditsEffectiveAMOorthegroupmustmakeSafeHarbor.TomakeSafeHarbor,thePIofthegroupmustequalorexceeditsSafeHarborTargetandthegroupmustmeetthequalificationforSafeHarbor.
2 Mathematics
ThesamecriteriaformakingAYPinELAapplytomathematics.Attheelementary/middlelevel,themeasuresusedtodetermineAYParetheNYSTPandtheNYSAAinmathematics.Atthesecondarylevel,themeasuresaremathematicsexaminationsthatmeetthestudents’graduationrequirement.
3 Third Indicator
InadditiontoEnglishlanguageartsandmathematics,theschoolmustalsomakeAYPinathirdareaofachievement.Thismeansmeetingthecriteriainscienceattheelementary/middlelevelandthecriteriaingraduationrateatthesecondarylevel.
Elementary/Middle-Level Science:TomakeAYP,theAllStudentsgroupmustmeettheparticipationcriterionandtheperformancecriterion.
A Participation Criterion EightypercentofstudentsinGrades4and/or8enrolledduringthetestadministrationperiodintheAllStudentsgroup,ifithas40ormorestudents,mustbetestedonanaccountabilitymeasure.InGrade4,themeasuresaretheGrade4elementary-levelsciencetestandtheGrade4NYSAAinscience.InGrade8science,themeasuresaretheGrade8middle-levelsciencetest,Regentsscienceexaminations,andtheGrade8NYSAAinscience.
B Performance CriterionThePIoftheAllStudentsgroupmustequalorexceedtheStateScienceStandard(100)ortheScienceProgressTarget.
QualifyingforSafeHarborinElementary/Middle-LevelELAandMath:Toqualify,thePImustequalorexceedtheStateScienceStandardortheScienceProgressTargetinelementary/middle-levelscienceforthatgroup.

Statewide Accountability2
Useful Terms for Understanding AccountabilityAccountability Cohort The2002schoolaccountabilitycohortconsistsofallstudentswhofirstenteredGrade9anywhereinthe2002–03schoolyear,andallungradedstudentswithdisabilitieswhoreachedtheirseventeenthbirthdayinthe2002–03schoolyear,whowereenrolledonOctober6,2005 anddidnottransfertoadiplomagrantingprogram.StudentswhoearnedahighschoolequivalencydiplomaorenrolledinanapprovedhighschoolequivalencypreparationprogrambyJune30,2006,arenotincludedinthe2002 schoolaccountabilitycohort.The2002
districtaccountabilitycohortconsistsofallstudentsineachschoolaccountabilitycohortplusstudentswhotransferredwithinthedistrictafterBEDSdayplusstudentswhowereplacedoutsidethedistrictbytheCommitteeonSpecialEducationordistrictadministratorsandwhomettheotherrequirementsforcohortmembership.CohortisdefinedinSection100.2(p)(16)oftheCommissioner’sRegulations.
Adequate Yearly Progress (AYP)AdequateYearlyProgress(AYP)indicatessatisfactoryprogressbyadistrictoraschooltowardthegoalofproficiencyforallstudents.
Annual Measurable Objective (AMO)TheAnnualMeasurableObjective(AMO)isthePerformanceIndex(PI)valuethatsignifiesthatanaccountabilitygroupismakingsatisfactoryprogresstowardthegoalthat100percentofstudentswillbeproficientintheState’slearningstandardsforEnglishlanguageartsandmathematicsby 2013–14.Thesecondary-levelAMOwillbeincreasedasspecifiedinCR100.2(p)(14)andwillreach200in2013–14.(SeeEffectiveAMOforfurtherinformation.)
Continuously Enrolled Students Attheelementary/middlelevel,continuouslyenrolledstudentsarethoseenrolledintheschoolordistrictonBEDSday(usuallythefirstWednesdayinOctober)oftheschoolyearuntilthetestadministrationperiod.Atthesecondarylevel,allstudentswhomeetthecriteriaforinclusionintheaccountabilitycohortareconsideredtobecontinuouslyenrolled.
Effective Annual Measurable Objective (Effective AMO)TheEffectiveAnnualMeasurableObjective(EffectiveAMO)isthePerformanceIndex(PI)valuethateachaccountabilitygroupwithinaschoolordistrictisexpectedtoachievetomakeAdequateYearlyProgress(AYP).TheEffectiveAMOisthelowestPIthatanaccountabilitygroupofagivensizecanachieveinasubjectforthegroup’sPInottobeconsideredsignificantlydifferentfromtheAMOforthatsubject.Ifanaccountabilitygroup’sPIequalsorexceedstheEffectiveAMO,itisconsideredtohavemadeAYP.AmorecompletedefinitionofEffectiveAMOandatableshowingthePIvaluesthateachgroupsizemustequalorexceedtomakeAYPareavailableatwww.emsc.nysed.gov/irts.
Performance Index (PI)PerformanceIndexisavaluefrom 0to200thatisassignedtoanaccountabilitygroup,indicatinghowthatgroupperformedonarequiredStatetest(orapprovedalternative)inEnglishlanguagearts,mathematics,orscience.Studentscoresonthetestsareconvertedtofourperformancelevels,fromLevel1(indicatingnoproficiency)toLevel4(indicatingadvancedproficiency).Attheelementary/middlelevel,thePIiscalculatedusingthefollowingequation: 100×[(CountofContinuouslyEnrolledTestedStudents PerformingatLevels2,3,and4+theCountatLevels3 and4)÷CountofAllContinuouslyEnrolledTestedStudents]
Atthesecondarylevel,thePIiscalculatedusingthefollowingequation: 100×[(CountofCohortMembersPerformingat Levels2,3,and4+theCountatLevels3and4)÷Countof AllCohortMembers]
Alistoftestsusedtomeasurestudentperformanceforaccountabilityisavailableatwww.emsc.nysed.gov/irts.
Progress Target ForaccountabilitygroupsbelowtheStateStandardinscienceorgraduationrate,theProgressTargetisanalternatemethodformakingAdequateYearlyProgress(AYP)orqualifyingforSafeHarborinEnglishlanguageartsandmathematicsbasedonimprovementoverthepreviousyear’sperformance.
Safe Harbor SafeHarborprovidesanalternatemeanstodemonstrateAdequateYearlyProgress(AYP)foraccountabilitygroupsthatdonotachievetheirEffectiveAnnualMeasurableObjectives(AMOs)inEnglishormathematics.
Safe Harbor Targets Theoriginal2005–06safeharbortargetswerecalculatedusingthefollowingequation: 2005–06PI+(200–the2005–06PI)×0.10
Theresultingtargetswereadjustedsothattheirproportionofthe2005–06AMOwasthesameastheoriginaltarget’sproportionofthe2004–05AMO.
Science Progress Target Theelementary/middle-level2005–06ScienceProgressTargetiscalculatedbyaddingonepointtothe2004–05PI.The2006–07ScienceProgressTargetiscalculatedbyaddingonepointtothe2005–06PI.The2006–07targetisprovidedforgroupswhosePIwasbelowtheStateScienceStandardin2005–06.
Science Standard Thecriterionvaluethatrepresentsaminimallysatisfactoryperformanceinscience.In2005–06,theStateScienceStandardattheelementary/middlelevelisaPerformanceIndex(PI)of100.TheCommissionermayraisetheStateScienceStandardathisdiscretioninfutureyears.

Statewide Accountability2
AYP Status
4 MadeAYP
✔SH MadeAYPUsingSafeHarborTarget
✘ DidNotMakeAYP
— InsufficientNumberofStudents toDetermineAYPStatus
Summary
On which accountability measures did the state make Adequate Yearly Progress (AYP) and which groups made AYP on each measure?
Elementary/Middle Level Secondary Level
Student GroupsEnglish
LanguageArts Mathematics Science
English
LanguageArts Mathematics GraduationRate
All Students 4 4 4 4 4 4
Ethnicity
AmericanIndianorAlaskaNative 4 4 4 4
BlackorAfricanAmerican 4 4 ✔SH ✔SH
HispanicorLatino 4 4 ✔SH ✔SH
AsianorNativeHawaiian/OtherPacificIslander
4 4 4 4
White 4 4 4 4
Other Groups
StudentswithDisabilities ✘ 4 ✘ ✘LimitedEnglishProficient ✘ 4 ✘ ✘
EconomicallyDisadvantaged 4 4 ✔SH 4
Student groups making AYP in each subject ✘7 of 9 49 of 9 41 of 1 ✘ 7 of 9 ✘ 7 of 9 41 of 1

Statewide Accountability2
How did students in each accountability group perform on elementary/middle-level English language arts accountability measures?
Student Group (Total:ContinuousEnrollment)1
AYP Participation Test Performance Performance Objectives
StatusMetCriterion
PercentageTested
MetCriterion
PerformanceIndex
EffectiveAMO
SafeHarborTarget2005–06 2006–07
All Students (1,287,034:1,240,189) 4 4 98% 4 153 122
Ethnicity
AmericanIndianorAlaskaNative(6,312:5,993)
4 4 98% 4 134 122
BlackorAfricanAmerican(255,868:242,884)
4 4 98% 4 129 122
HispanicorLatino(259,413:243,681) 4 4 97% 4 131 122
AsianorNativeHawaiian/OtherPacificIslander(86,550:83,312)
4 4 99% 4 172 122
White(678,830:664,292) 4 4 99% 4 167 122
Other Groups
StudentswithDisabilities2(198,410:184,493)
✘ 4 95% ✘ 91 122 104 102
LimitedEnglishProficient(82,841:73,338)
✘ 4 96% ✘ 105 122 114 115
EconomicallyDisadvantaged(551,632:526,988)
4 4 98% 4 140 122
Final AYP Determination ✘7 of 9
AYP Status
4 MadeAYP
✔SH MadeAYPUsingSafeHarborTarget
✘ DidNotMakeAYP
— InsufficientNumberofStudents toDetermineAYPStatus
notes1 Thesedatashowthecountofstudentsenrolledduringthetestadministrationperiod(usedforParticipation)
followedbythecountofcontinuouslyenrolledtestedstudents(usedforPerformance).Foraccountabilitycalculations,studentswhowereexcusedfromtestingformedicalreasonsarenotincludedintheenrollmentcount.
2 IfthestatefailedtomakeAYPsolelybecauseoftheperformanceofstudentswithdisabilities,metthe95%participationrequirementforthisgroup,andwouldmeetorexceedtheAMOforthissubjectif34pointswereaddedtothePI,thenthestateisconsideredtohavemadeAYPforstudentswithdisabilities.
‡ ThisstudentgroupdidnotmakeAYPinscience;therefore,itdidnotqualifyforSafeHarbor.
Elementary/Middle-Level English Language ArtsAccountability Measures 7of9 StudentgroupsmakingAYPinEnglishlanguagearts
✘ DidnotmakeAYP

Statewide Accountability2
notes1 Thesedatashowthecountofstudentsenrolledduringthetestadministrationperiod(usedforParticipation)
followedbythecountofcontinuouslyenrolledtestedstudents(usedforPerformance).Foraccountabilitycalculations,studentswhowereexcusedfromtestingformedicalreasonsarenotincludedintheenrollmentcount.
2 IfthestatefailedtomakeAYPsolelybecauseoftheperformanceofstudentswithdisabilities,metthe95%participationrequirementforthisgroup,andwouldmeetorexceedtheAMOforthissubjectif34pointswereaddedtothePI,thenthestateisconsideredtohavemadeAYPforstudentswithdisabilities.
‡ ThisstudentgroupdidnotmakeAYPinscience;therefore,itdidnotqualifyforSafeHarbor.
AYP Status
4 MadeAYP
✔SH MadeAYPUsingSafeHarborTarget
✘ DidNotMakeAYP
— InsufficientNumberofStudents toDetermineAYPStatus
How did students in each accountability group perform on elementary/middle-level mathematics accountability measures?
Student Group (Total:ContinuousEnrollment)1
AYP Participation Test Performance Performance Objectives
StatusMetCriterion
PercentageTested
MetCriterion
PerformanceIndex
EffectiveAMO
SafeHarborTarget2005–06 2006–07
All Students (1,286,390:1,232,659) 4 4 99% 4 156 86
Ethnicity
AmericanIndianorAlaskaNative(6,321:5,948)
4 4 98% 4 139 86
BlackorAfricanAmerican(255,384:239,524)
4 4 98% 4 126 86
HispanicorLatino(259,247:243,208) 4 4 99% 4 136 86
AsianorNativeHawaiian/OtherPacificIslander(86,880:83,215)
4 4 99% 4 182 86
White(678,500:660,740) 4 4 99% 4 171 86
Other Groups
StudentswithDisabilities2(198,074:183,411)
4 4 96% 4 100 86
LimitedEnglishProficient(82,395:75,380)
4 4 98% 4 113 86
EconomicallyDisadvantaged(551,276:522,860)
4 4 99% 4 143 86
Final AYP Determination 49 of 9
Elementary/Middle-Level MathematicsAccountability Measures 9of9 StudentgroupsmakingAYPinmathematics
4 MadeAYP

Statewide Accountability2
Elementary/Middle-Level ScienceAccountability Measures 1of1 StudentgroupsmakingAYPinScience
4 MadeAYP
How did students in each accountability group perform on elementary/middle-level science accountability measures?
Student Group (Total:ContinuousEnrollment)1
AYP Participation Test Performance Performance Objectives
StatusSafeHarborQualification
MetCriterion
PercentageTested
MetCriterion
PerformanceIndex
StateStandard
ProgressTarget
2005–06 2006–07
All Students (431,337:401,335) 4 Qualified 4 97% 4 172 100
Ethnicity
AmericanIndianorAlaskaNative(2,028:1,848)
Qualified 4 96% 4 164 100
BlackorAfricanAmerican(84,714:75,407)
Qualified 4 94% 4 145 100
HispanicorLatino(85,955:77,572) Qualified 4 96% 4 146 100
AsianorNativeHawaiian/OtherPacificIslander(29,063:27,123)
Qualified 4 98% 4 180 100
White(229,500:219,399) Qualified 4 98% 4 189 100
Other Groups
StudentswithDisabilities(66,435:58,661)
Qualified 4 92% 4 140 100
LimitedEnglishProficient(26,721:23,577)
Qualified 4 96% 4 117 100
EconomicallyDisadvantaged(181,633:166,121)
Qualified 4 96% 4 158 100
Final AYP Determination 41 of 1
AYP Status
4 MadeAYP
✔SH MadeAYPUsingSafeHarborTarget
✘ DidNotMakeAYP
— InsufficientNumberofStudents toDetermineAYPStatus
notes1 Thesedatashowthecountofstudentsenrolledduringthetestadministrationperiod(usedforParticipation)
followedbythecountofcontinuouslyenrolledtestedstudents(usedforPerformance).ForAccountabilitycalculations,studentswhowereexcusedfromtestingformedicalreasonsarenotincludedintheenrollmentcount.

Statewide Accountability2
notes1 Thesedatashowthecountof12thgradersin2005–06(usedforParticipation)followedbythecountofstudents
inthe2002cohort(usedforPerformance).
‡ ThisstudentgroupdidnotmakeAYPingraduationrate;therefore,itdidnotqualifyforSafeHarbor.
AYP Status
4 MadeAYP
✔SH MadeAYPUsingSafeHarborTarget
✘ DidNotMakeAYP
— InsufficientNumberofStudents toDetermineAYPStatus
Secondary-Level English Language ArtsAccountability Measures 7of9 StudentgroupsmakingAYPinEnglishlanguagearts
✘ DidNotMakeAYP
How did students in each accountability group perform on secondary-level English language arts accountability measures?
Student Group (12thGraders:2002Cohort)1
AYP Participation Test Performance Performance Objectives
StatusMetCriterion
PercentageTested
MetCriterion
PerformanceIndex
EffectiveAMO
SafeHarborTarget2005–06 2006–07
All Students (183,624:183,145) 4 4 98% 4 169 159
Ethnicity
AmericanIndianorAlaskaNative(643:678)
4 4 96% 4 156 155
BlackorAfricanAmerican(30,769:31,644)
✔SH 4 98% ✔SH 145 159 145 151
HispanicorLatino(27,080:28,021) ✔SH 4 98% ✔SH 143 159 142 149
AsianorNativeHawaiian/OtherPacificIslander(13,730:13,487)
4 4 99% 4 175 159
White(111,402:109,315) 4 4 98% 4 183 159
Other Groups
StudentswithDisabilities(17,321:19,079)✘ ✘ 90% ✘ 114 159 114‡ 123
LimitedEnglishProficient(6,046:7,563) ✘ 4 96% ✘ 88 159 102‡ 99
EconomicallyDisadvantaged(50,547:55,041)
✔SH 4 98% ✔SH 148 159 148 153
Final AYP Determination ✘ 7 of 9
Statewide Accountability2
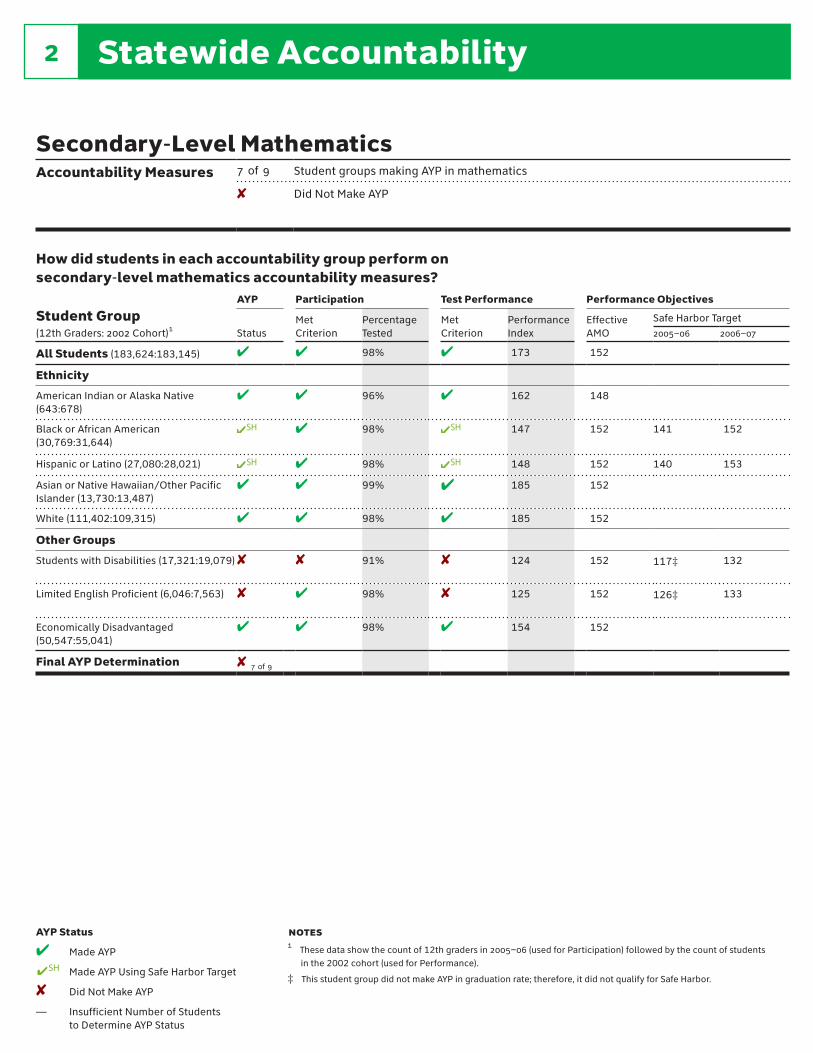
Secondary-Level MathematicsAccountability Measures 7of9 StudentgroupsmakingAYPinmathematics
✘ DidNotMakeAYP
How did students in each accountability group perform on secondary-level mathematics accountability measures?
Student Group (12thGraders:2002Cohort)1
AYP Participation Test Performance Performance Objectives
StatusMetCriterion
PercentageTested
MetCriterion
PerformanceIndex
EffectiveAMO
SafeHarborTarget2005–06 2006–07
All Students (183,624:183,145) 4 4 98% 4 173 152
Ethnicity
AmericanIndianorAlaskaNative(643:678)
4 4 96% 4 162 148
BlackorAfricanAmerican(30,769:31,644)
✔SH 4 98% ✔SH 147 152 141 152
HispanicorLatino(27,080:28,021) ✔SH 4 98% ✔SH 148 152 140 153
AsianorNativeHawaiian/OtherPacificIslander(13,730:13,487)
4 4 99% 4 185 152
White(111,402:109,315) 4 4 98% 4 185 152
Other Groups
StudentswithDisabilities(17,321:19,079)✘ ✘ 91% ✘ 124 152 117‡ 132
LimitedEnglishProficient(6,046:7,563) ✘ 4 98% ✘ 125 152 126‡ 133
EconomicallyDisadvantaged(50,547:55,041)
4 4 98% 4 154 152
Final AYP Determination ✘ 7 of 9
notes1 Thesedatashowthecountof12thgradersin2005–06(usedforParticipation)followedbythecountofstudents
inthe2002cohort(usedforPerformance).
‡ ThisstudentgroupdidnotmakeAYPingraduationrate;therefore,itdidnotqualifyforSafeHarbor.
AYP Status
4 MadeAYP
✔SH MadeAYPUsingSafeHarborTarget
✘ DidNotMakeAYP
— InsufficientNumberofStudents toDetermineAYPStatus

Graduation Rate InformationTomakeAYPingraduationrate,thepercentageof2001graduation-ratecohortmembersearningalocalorRegentsdiplomabyAugust31,2005forthe“AllStudents”groupmustequalorexceedtheGraduation-RateStandardortheGraduation-RateProgressTargetfor2005–06.
TheGraduationRateStandardisthecriterionvaluethatrepresentsaminimallysatisfactorypercentageofcohortmembersearningalocaldiploma.TheStateGraduation-RateStandardforthe2001cohortis55percent.TheCommissionermayraisetheGraduation-RateStandardathisdiscretioninfutureyears.
The2005–06Graduation-RateProgressTargetiscalculatedbyaddingonepointtothepercentageofthe2000cohortearningalocalorRegentsdiplomabyAugust31,2004.The2006–07Graduation-RateProgressTargetiscalculatedbyaddingonepointtothepercentageofthe2001 cohortearningalocalorRegentsdiplomabyAugust31,2005.ThistargetisprovidedforeachgroupwhosepercentageearningalocalorRegentsdiplomabyAugust31,2005 isbelowtheGraduation-RateStandardin2005–06(55%).Groupswithfewerthan30cohortmembersarenotsubjecttothiscriterion.
Statewide Accountability2
How did students in each accountability group perform on graduation rate accountability measures?
Student Group (CohortCount)1
Graduation Objectives
AYPMetCriterion
GraduationRate2
StateStandard
ProgressTarget
2005–06 2006-07
All Students (181,848)
4 4 77% 55%
Ethnicity
AmericanIndianorAlaskaNative(689)
4 65% 55%
BlackorAfricanAmerican(31,149)
4 60% 55%
HispanicorLatino(26,834)
4 57% 55%
AsianorNativeHawaiian/OtherPacificIslander(12,681)
4 80% 55%
White(110,495) 4 86% 55%
Other Groups
StudentswithDisabilities(19,504)
✘ 49% 55% 54 50
LimitedEnglishProficient(8,455)
✘ 44% 55% 46 45
EconomicallyDisadvantaged(49,723)
4 64% 55%
Final AYP Determination
41 of 1
notes1 Graduation-ratecohortforeachyearincludesallstudentsintheaccountabilitycohort
inthepreviousyearplusallstudentsexcludedfromthataccountabilitycohortsolelybecausetheytransferredtoahighschoolequivalencypreparationprogram,approvedunderCommissioner’sRegulations100.7.
2 Percentageofthe2001cohortthatearnedalocalorRegentsdiplomabyAugust31,2005.
Graduation RateAccountability Measures 1of1 StudentgroupsmakingAYPinGraduationRate
4 MadeAYP

About the Performance Level DescriptorsLevel 1:Not Meeting Learning Standards.Studentperformancedoesnotdemonstrateanunderstandingofthecontentexpectedinthesubjectandgradelevel.
Level 2:Partially Meeting Learning Standards.Studentperformancedemonstratesapartialunderstandingofthecontentexpectedinthesubjectandgradelevel.
Level 3:Meeting Learning Standards.Studentperformancedemonstratesanunderstandingofthecontentexpectedinthesubjectandgradelevel.
Level 4:Meeting Learning Standards with Distinction.Studentperformancedemonstratesathoroughunderstandingofthecontentexpectedinthesubjectandgradelevel.
Overview of Statewide Performance3
Summary of 2005–06 Statewide PerformancePerformanceontheStateassessmentsinEnglishlanguagearts,mathematics,andscienceattheelementaryandmiddlelevelsisreportedintermsofmeanscoresandthepercentageoftestedstudentsscoringatoraboveLevel2,Level3,andLevel4.PerformanceontheStateassessmentsinELAandmathematicsatthesecondarylevelisreportedintermsofthepercentageofstudentsinacohortscoringattheselevels.
PercentageofstudentsthatscoredatoraboveLevel3
TotalTested
English Language Arts
Grade3 69% 185,367
Grade4 69% 190,822
Grade5 67% 200,996
Grade6 60% 204,471
Grade7 56% 210,417
Grade8 49% 212,196
Mathematics
Grade3 81% 201,580
Grade4 78% 202,393
Grade5 68% 208,954
Grade6 60% 211,121
Grade7 56% 216,893
Grade8 54% 219,025
Science
Grade4 86% 200,712
Grade8 64% 194,611
PercentageofstudentsthatscoredatoraboveLevel3
2002Cohort
Secondary Level
English 69% 216,910
Mathematics 71% 216,910
Percentageofstudentswhograduated
2002Cohort
Graduation Rate
2002Cohort 67% 216,910
0% 50% 100%
0% 50% 100%
0% 50% 100%
Overview of Statewide Performance3
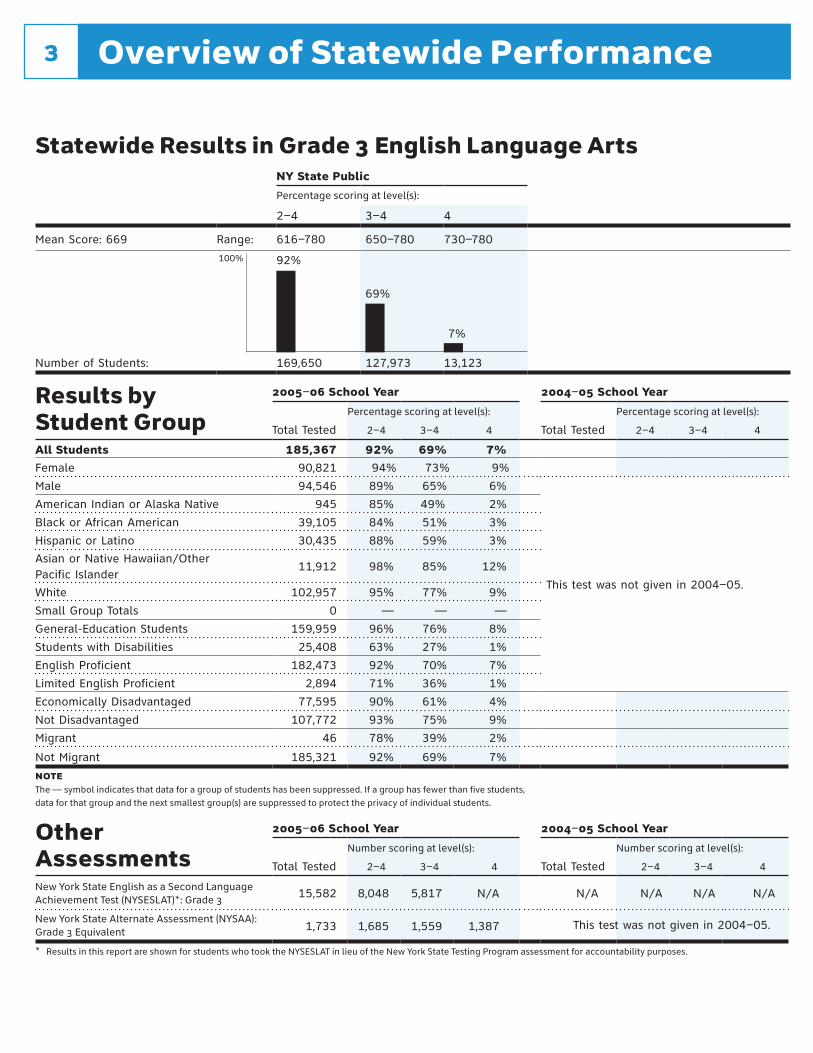
Statewide Results in Grade 3 English Language ArtsNY State Public
Percentagescoringatlevel(s):
2–4 3–4 4
MeanScore:669 Range: 616–780 650–780 730–780
NumberofStudents: 169,650 127,973 13,123
92%100%
Results by Student Group
2005–06 School Year 2004–05 School Year
TotalTested
Percentagescoringatlevel(s):
TotalTested
Percentagescoringatlevel(s):
2–4 3–4 4 2–4 3–4 4
All Students 185,367 92% 69% 7%Female 90,821 94% 73% 9%
Male 94,546 89% 65% 6%
Thistestwasnotgivenin2004–05.
AmericanIndianorAlaskaNative 945 85% 49% 2%
BlackorAfricanAmerican 39,105 84% 51% 3%
HispanicorLatino 30,435 88% 59% 3%
AsianorNativeHawaiian/OtherPacificIslander
11,912 98% 85% 12%
White 102,957 95% 77% 9%
SmallGroupTotals 0 — — —
General-EducationStudents 159,959 96% 76% 8%
StudentswithDisabilities 25,408 63% 27% 1%
EnglishProficient 182,473 92% 70% 7%
LimitedEnglishProficient 2,894 71% 36% 1%
EconomicallyDisadvantaged 77,595 90% 61% 4%
NotDisadvantaged 107,772 93% 75% 9%
Migrant 46 78% 39% 2%
NotMigrant 185,321 92% 69% 7%
noteThe—symbolindicatesthatdataforagroupofstudentshasbeensuppressed.Ifagrouphasfewerthanfivestudents,dataforthatgroupandthenextsmallestgroup(s)aresuppressedtoprotecttheprivacyofindividualstudents.
Other Assessments
2005–06 School Year 2004–05 School Year
TotalTested
Numberscoringatlevel(s):
TotalTested
Numberscoringatlevel(s):
2–4 3–4 4 2–4 3–4 4
NewYorkStateEnglishasaSecondLanguageAchievementTest(NYSESLAT)*:Grade3 15,582 8,048 5,817 N/A N/A N/A N/A N/A
NewYorkStateAlternateAssessment(NYSAA):Grade3Equivalent 1,733 1,685 1,559 1,387
* ResultsinthisreportareshownforstudentswhotooktheNYSESLATinlieuoftheNewYorkStateTestingProgramassessmentforaccountabilitypurposes.
69%
7%
Thistestwasnotgivenin2004–05.

Overview of Statewide Performance3
Statewide Results in Grade 3 MathematicsNY State Public
Percentagescoringatlevel(s):
2–4 3–4 4
MeanScore:678 Range: 624–770 650–770 703–770
NumberofStudents: 188,853 162,418 50,669
94%100%
Results by Student Group
2005–06 School Year 2004–05 School Year
TotalTested
Percentagescoringatlevel(s):
TotalTested
Percentagescoringatlevel(s):
2–4 3–4 4 2–4 3–4 4
All Students 201,580 94% 81% 25%Female 98,346 94% 81% 25%
Male 103,234 93% 80% 25%
Thistestwasnotgivenin2004–05.
AmericanIndianorAlaskaNative 970 90% 70% 13%
BlackorAfricanAmerican 39,903 88% 67% 14%
HispanicorLatino 42,069 90% 72% 17%
AsianorNativeHawaiian/OtherPacificIslander
14,459 98% 93% 49%
White 104,166 97% 88% 30%
SmallGroupTotals 0 — — —
General-EducationStudents 173,829 96% 85% 28%
StudentswithDisabilities 27,751 77% 50% 6%
EnglishProficient 182,995 95% 83% 27%
LimitedEnglishProficient 18,585 84% 59% 9%
EconomicallyDisadvantaged 89,714 92% 75% 19%
NotDisadvantaged 111,866 95% 85% 30%
Migrant 58 88% 59% 2%
NotMigrant 201,522 94% 81% 25%
noteThe—symbolindicatesthatdataforagroupofstudentshasbeensuppressed.Ifagrouphasfewerthanfivestudents,dataforthatgroupandthenextsmallestgroup(s)aresuppressedtoprotecttheprivacyofindividualstudents.
Other Assessments
2005–06 School Year 2004–05 School Year
TotalTested
Numberscoringatlevel(s):
TotalTested
Numberscoringatlevel(s):
2–4 3–4 4 2–4 3–4 4
NewYorkStateAlternateAssessment(NYSAA):Grade3Equivalent 1,738 1,664 1,495 1,287
81%
25%
Thistestwasnotgivenin2004–05.

Overview of Statewide Performance3
Statewide Results in Grade 4 English Language ArtsNY State Public
Percentagescoringatlevel(s):
2–4 3–4 4
MeanScore:666 Range: 612–775 650–775 716–775
NumberofStudents: 173,780 130,977 16,626
91%100%
Results by Student Group
2005–06 School Year 2004–05 School Year
TotalTested
Percentagescoringatlevel(s):
TotalTested
Percentagescoringatlevel(s):
2–4 3–4 4 2–4 3–4 4
All Students 190,822 91% 69% 9%Female 93,335 93% 72% 11%
Male 97,487 89% 65% 7%
Newassessmentsforelementary-andmiddle-levelEnglishlanguageartsandmathematicswereadministeredin2006.Resultsfromtheseassessmentscannotbedirectlycomparedtoresultsfrompreviouslyadministeredassessments.
AmericanIndianorAlaskaNative 894 84% 55% 4%
BlackorAfricanAmerican 37,758 84% 52% 4%
HispanicorLatino 33,495 87% 55% 4%
AsianorNativeHawaiian/OtherPacificIslander
12,710 97% 83% 16%
White 105,960 94% 77% 11%
SmallGroupTotals 0 — — —
General-EducationStudents 162,981 96% 76% 10%
StudentswithDisabilities 27,841 62% 26% 1%
EnglishProficient 187,225 92% 69% 9%
LimitedEnglishProficient 3,597 66% 27% 1%
EconomicallyDisadvantaged 79,465 90% 59% 4%
NotDisadvantaged 111,357 92% 75% 12%
Migrant 61 79% 41% 0%
NotMigrant 190,761 91% 69% 9%
noteThe—symbolindicatesthatdataforagroupofstudentshasbeensuppressed.Ifagrouphasfewerthanfivestudents,dataforthatgroupandthenextsmallestgroup(s)aresuppressedtoprotecttheprivacyofindividualstudents.
Other Assessments
2005–06 School Year 2004–05 School Year
TotalTested
Numberscoringatlevel(s):
TotalTested
Numberscoringatlevel(s):
2–4 3–4 4 2–4 3–4 4
NewYorkStateEnglishasaSecondLanguageAchievementTest(NYSESLAT)*:Grade4 10,499 7,177 5,873 N/A 11,103 6,975 5,132 N/A
NewYorkStateAlternateAssessment(NYSAA):Grade4Equivalent 1,858 1,847 1,710 1,393 1,803 1,780 1,604 1,253
* ResultsinthisreportareshownforstudentswhotooktheNYSESLATinlieuoftheNewYorkStateTestingProgramassessmentforaccountabilitypurposes.
69%
9%

Overview of Statewide Performance3
Statewide Results in Grade 4 MathematicsNY State Public
Percentagescoringatlevel(s):
2–4 3–4 4
MeanScore:677 Range: 622–800 650–800 702–800
NumberofStudents: 187,421 157,906 52,396
93%100%
Results by Student Group
2005–06 School Year 2004–05 School Year
TotalTested
Percentagescoringatlevel(s):
TotalTested
Percentagescoringatlevel(s):
2–4 3–4 4 2–4 3–4 4
All Students 202,393 93% 78% 26%Female 98,544 93% 78% 25%
Male 103,849 92% 78% 27%
Newassessmentsforelementary-andmiddle-levelEnglishlanguageartsandmathematicswereadministeredin2006.Resultsfromtheseassessmentscannotbedirectlycomparedtoresultsfrompreviouslyadministeredassessments.
AmericanIndianorAlaskaNative 913 88% 69% 14%
BlackorAfricanAmerican 38,472 86% 62% 12%
HispanicorLatino 41,536 88% 67% 15%
AsianorNativeHawaiian/OtherPacificIslander
14,585 97% 92% 49%
White 106,883 96% 86% 32%
SmallGroupTotals 0 — — —
General-EducationStudents 172,775 96% 84% 29%
StudentswithDisabilities 29,618 72% 45% 6%
EnglishProficient 187,814 94% 80% 27%
LimitedEnglishProficient 14,579 78% 50% 7%
EconomicallyDisadvantaged 87,726 91% 71% 18%
NotDisadvantaged 114,667 94% 83% 32%
Migrant 69 90% 57% 7%
NotMigrant 202,324 93% 78% 26%
noteThe—symbolindicatesthatdataforagroupofstudentshasbeensuppressed.Ifagrouphasfewerthanfivestudents,dataforthatgroupandthenextsmallestgroup(s)aresuppressedtoprotecttheprivacyofindividualstudents.
Other Assessments
2005–06 School Year 2004–05 School Year
TotalTested
Numberscoringatlevel(s):
TotalTested
Numberscoringatlevel(s):
2–4 3–4 4 2–4 3–4 4
NewYorkStateAlternateAssessment(NYSAA):Grade4Equivalent 1,854 1,811 1,659 1,374 1,753 1,704 1,520 1,181
78%
26%
Overview of Statewide Performance3
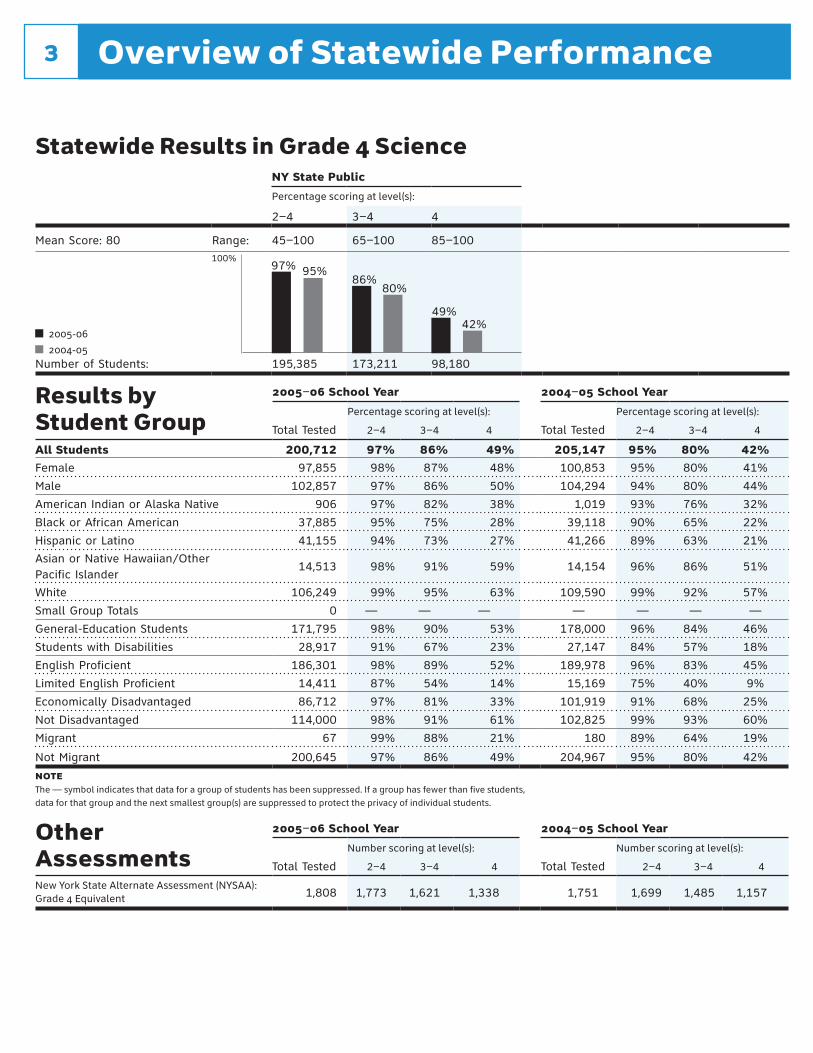
97%100%
Results by Student Group
2005–06 School Year 2004–05 School Year
TotalTested
Percentagescoringatlevel(s):
TotalTested
Percentagescoringatlevel(s):
2–4 3–4 4 2–4 3–4 4
All Students 200,712 97% 86% 49% 205,147 95% 80% 42%Female 97,855 98% 87% 48% 100,853 95% 80% 41%
Male 102,857 97% 86% 50% 104,294 94% 80% 44%
AmericanIndianorAlaskaNative 906 97% 82% 38% 1,019 93% 76% 32%
BlackorAfricanAmerican 37,885 95% 75% 28% 39,118 90% 65% 22%
HispanicorLatino 41,155 94% 73% 27% 41,266 89% 63% 21%
AsianorNativeHawaiian/OtherPacificIslander
14,513 98% 91% 59% 14,154 96% 86% 51%
White 106,249 99% 95% 63% 109,590 99% 92% 57%
SmallGroupTotals 0 — — — — — — —
General-EducationStudents 171,795 98% 90% 53% 178,000 96% 84% 46%
StudentswithDisabilities 28,917 91% 67% 23% 27,147 84% 57% 18%
EnglishProficient 186,301 98% 89% 52% 189,978 96% 83% 45%
LimitedEnglishProficient 14,411 87% 54% 14% 15,169 75% 40% 9%
EconomicallyDisadvantaged 86,712 97% 81% 33% 101,919 91% 68% 25%
NotDisadvantaged 114,000 98% 91% 61% 102,825 99% 93% 60%
Migrant 67 99% 88% 21% 180 89% 64% 19%
NotMigrant 200,645 97% 86% 49% 204,967 95% 80% 42%
noteThe—symbolindicatesthatdataforagroupofstudentshasbeensuppressed.Ifagrouphasfewerthanfivestudents,dataforthatgroupandthenextsmallestgroup(s)aresuppressedtoprotecttheprivacyofindividualstudents.
Other Assessments
2005–06 School Year 2004–05 School Year
TotalTested
Numberscoringatlevel(s):
TotalTested
Numberscoringatlevel(s):
2–4 3–4 4 2–4 3–4 4
NewYorkStateAlternateAssessment(NYSAA):Grade4Equivalent 1,808 1,773 1,621 1,338 1,751 1,699 1,485 1,157
86%
49%
Statewide Results in Grade 4 ScienceNY State Public
Percentagescoringatlevel(s):
2–4 3–4 4
MeanScore:80 Range: 45–100 65–100 85–100
2005-06
2004-05NumberofStudents: 195,385 173,211 98,180
86%
49%
95%80%
42%

Overview of Statewide Performance3
Statewide Results in Grade 5 English Language ArtsNY State Public
Percentagescoringatlevel(s):
2–4 3–4 4
MeanScore:663 Range: 608–795 650–795 711–795
NumberofStudents: 188,323 135,082 24,678
94%100%
Results by Student Group
2005–06 School Year 2004–05 School Year
TotalTested
Percentagescoringatlevel(s):
TotalTested
Percentagescoringatlevel(s):
2–4 3–4 4 2–4 3–4 4
All Students 200,996 94% 67% 12%Female 98,989 95% 70% 14%
Male 102,007 92% 65% 11%
Thistestwasnotgivenin2004–05.
AmericanIndianorAlaskaNative 1,027 90% 53% 7%
BlackorAfricanAmerican 40,065 89% 49% 5%
HispanicorLatino 37,464 90% 52% 5%
AsianorNativeHawaiian/OtherPacificIslander
13,280 97% 81% 20%
White 109,156 96% 77% 16%
SmallGroupTotals 0 — — —
General-EducationStudents 171,031 97% 74% 14%
StudentswithDisabilities 29,965 72% 27% 2%
EnglishProficient 195,163 94% 69% 13%
LimitedEnglishProficient 5,833 71% 21% 1%
EconomicallyDisadvantaged 84,975 93% 57% 6%
NotDisadvantaged 116,021 94% 75% 17%
Migrant 62 89% 42% 2%
NotMigrant 200,934 94% 67% 12%
noteThe—symbolindicatesthatdataforagroupofstudentshasbeensuppressed.Ifagrouphasfewerthanfivestudents,dataforthatgroupandthenextsmallestgroup(s)aresuppressedtoprotecttheprivacyofindividualstudents.
Other Assessments
2005–06 School Year 2004–05 School Year
TotalTested
Numberscoringatlevel(s):
TotalTested
Numberscoringatlevel(s):
2–4 3–4 4 2–4 3–4 4
NewYorkStateEnglishasaSecondLanguageAchievementTest(NYSESLAT)*:Grade5 6,598 4,708 3,895 N/A N/A N/A N/A N/A
NewYorkStateAlternateAssessment(NYSAA):Grade5Equivalent 1,958 1,913 1,742 1,490
* ResultsinthisreportareshownforstudentswhotooktheNYSESLATinlieuoftheNewYorkStateTestingProgramassessmentforaccountabilitypurposes.
67%
12%
Thistestwasnotgivenin2004–05.

Overview of Statewide Performance3
Statewide Results in Grade 5 MathematicsNY State Public
Percentagescoringatlevel(s):
2–4 3–4 4
MeanScore:666 Range: 619-780 650-780 669-780
NumberofStudents: 187,467 143,072 40,040
90%100%
Results by Student Group
2005–06 School Year 2004–05 School Year
TotalTested
Percentagescoringatlevel(s):
TotalTested
Percentagescoringatlevel(s):
2–4 3–4 4 2–4 3–4 4
All Students 208,954 90% 68% 19%Female 102,639 91% 68% 18%
Male 106,315 89% 69% 20%
Thistestwasnotgivenin2004–05.
AmericanIndianorAlaskaNative 1,036 85% 55% 11%
BlackorAfricanAmerican 40,768 80% 49% 8%
HispanicorLatino 42,614 85% 56% 10%
AsianorNativeHawaiian/OtherPacificIslander
14,617 96% 88% 42%
White 109,915 94% 78% 24%
SmallGroupTotals 0 — — —
General-EducationStudents 178,270 94% 75% 22%
StudentswithDisabilities 30,684 65% 32% 3%
EnglishProficient 195,885 91% 71% 20%
LimitedEnglishProficient 13,069 72% 38% 5%
EconomicallyDisadvantaged 90,961 87% 60% 13%
NotDisadvantaged 117,993 92% 75% 24%
Migrant 71 79% 52% 6%
NotMigrant 208,883 90% 68% 19%
noteThe—symbolindicatesthatdataforagroupofstudentshasbeensuppressed.Ifagrouphasfewerthanfivestudents,dataforthatgroupandthenextsmallestgroup(s)aresuppressedtoprotecttheprivacyofindividualstudents.
Other Assessments
2005–06 School Year 2004–05 School Year
TotalTested
Numberscoringatlevel(s):
TotalTested
Numberscoringatlevel(s):
2–4 3–4 4 2–4 3–4 4
NewYorkStateAlternateAssessment(NYSAA):Grade5Equivalent 1,968 1,881 1,678 1,429
68%
19%
Thistestwasnotgivenin2004–05.

Overview of Statewide Performance3
Statewide Results in Grade 6 English Language ArtsNY State Public
Percentagescoringatlevel(s):
2–4 3–4 4
MeanScore:656 Range: 598-785 650-785 705-785
NumberofStudents: 189,451 123,494 23,679
93%100%
Results by Student Group
2005–06 School Year 2004–05 School Year
TotalTested
Percentagescoringatlevel(s):
TotalTested
Percentagescoringatlevel(s):
2–4 3–4 4 2–4 3–4 4
All Students 204,471 93% 60% 12%Female 99,853 95% 64% 14%
Male 104,618 91% 57% 9%
Thistestwasnotgivenin2004–05.
AmericanIndianorAlaskaNative 1,081 87% 46% 5%
BlackorAfricanAmerican 41,200 87% 41% 4%
HispanicorLatino 37,871 88% 43% 4%
AsianorNativeHawaiian/OtherPacificIslander
12,940 97% 77% 21%
White 111,378 96% 72% 16%
SmallGroupTotals 0 — — —
General-EducationStudents 174,512 97% 68% 13%
StudentswithDisabilities 29,959 67% 17% 1%
EnglishProficient 199,699 93% 62% 12%
LimitedEnglishProficient 4,772 66% 11% 0%
EconomicallyDisadvantaged 86,432 92% 49% 5%
NotDisadvantaged 118,039 94% 69% 16%
Migrant 68 75% 25% 0%
NotMigrant 204,403 93% 60% 12%
noteThe—symbolindicatesthatdataforagroupofstudentshasbeensuppressed.Ifagrouphasfewerthanfivestudents,dataforthatgroupandthenextsmallestgroup(s)aresuppressedtoprotecttheprivacyofindividualstudents.
Other Assessments
2005–06 School Year 2004–05 School Year
TotalTested
Numberscoringatlevel(s):
TotalTested
Numberscoringatlevel(s):
2–4 3–4 4 2–4 3–4 4
NewYorkStateEnglishasaSecondLanguageAchievementTest(NYSESLAT)*:Grade6 5,849 4,032 3,313 N/A N/A N/A N/A N/A
.NewYorkStateAlternateAssessment(NYSAA):Grade6Equivalent 1,958 1,903 1,745 1,522
* ResultsinthisreportareshownforstudentswhotooktheNYSESLATinlieuoftheNewYorkStateTestingProgramassessmentforaccountabilitypurposes.
60%
12%
Thistestwasnotgivenin2004–05.

Overview of Statewide Performance3
Statewide Results in Grade 6 MathematicsNY State Public
Percentagescoringatlevel(s):
2–4 3–4 4
MeanScore:656 Range: 616-780 650-780 696-780
NumberofStudents: 183,019 127,649 27,863
87%100%
Results by Student Group
2005–06 School Year 2004–05 School Year
TotalTested
Percentagescoringatlevel(s):
TotalTested
Percentagescoringatlevel(s):
2–4 3–4 4 2–4 3–4 4
All Students 211,121 87% 60% 13%Female 102,869 88% 61% 13%
Male 108,252 86% 60% 14%
Thistestwasnotgivenin2004–05.
AmericanIndianorAlaskaNative 1,090 80% 48% 6%
BlackorAfricanAmerican 41,724 76% 41% 5%
HispanicorLatino 41,907 79% 45% 6%
AsianorNativeHawaiian/OtherPacificIslander
14,219 96% 83% 35%
White 112,180 93% 71% 17%
SmallGroupTotals 0 — — —
General-EducationStudents 180,583 92% 67% 15%
StudentswithDisabilities 30,538 56% 22% 1%
EnglishProficient 200,433 88% 62% 14%
LimitedEnglishProficient 10,688 61% 26% 3%
EconomicallyDisadvantaged 91,602 83% 50% 8%
NotDisadvantaged 119,519 90% 68% 17%
Migrant 79 53% 24% 3%
NotMigrant 211,042 87% 60% 13%
noteThe—symbolindicatesthatdataforagroupofstudentshasbeensuppressed.Ifagrouphasfewerthanfivestudents,dataforthatgroupandthenextsmallestgroup(s)aresuppressedtoprotecttheprivacyofindividualstudents.
Other Assessments
2005–06 School Year 2004–05 School Year
TotalTested
Numberscoringatlevel(s):
TotalTested
Numberscoringatlevel(s):
2–4 3–4 4 2–4 3–4 4
NewYorkStateAlternateAssessment(NYSAA):Grade6Equivalent 1,977 1,896 1,707 1,454
60%
13%
Thistestwasnotgivenin2004–05.

Overview of Statewide Performance3
Statewide Results in Grade 7 English Language ArtsNY State Public
Percentagescoringatlevel(s):
2–4 3–4 4
MeanScore:652 Range: 600-790 650-790 712-790
NumberofStudents: 193,542 118,721 16,324
92%100%
Results by Student Group
2005–06 School Year 2004–05 School Year
TotalTested
Percentagescoringatlevel(s):
TotalTested
Percentagescoringatlevel(s):
2–4 3–4 4 2–4 3–4 4
All Students 210,417 92% 56% 8%Female 101,982 94% 60% 9%
Male 108,435 90% 53% 7%
Thistestwasnotgivenin2004–05.
AmericanIndianorAlaskaNative 1,059 88% 43% 4%
BlackorAfricanAmerican 43,084 86% 36% 2%
HispanicorLatino 38,276 87% 39% 3%
AsianorNativeHawaiian/OtherPacificIslander
12,609 97% 72% 14%
White 115,388 96% 68% 11%
SmallGroupTotals 0 — — —
General-EducationStudents 180,361 96% 63% 9%
StudentswithDisabilities 30,056 68% 16% 1%
EnglishProficient 205,020 93% 58% 8%
LimitedEnglishProficient 5,397 65% 9% 0%
EconomicallyDisadvantaged 87,616 90% 43% 3%
NotDisadvantaged 122,801 93% 66% 11%
Migrant 63 81% 27% 0%
NotMigrant 210,354 92% 56% 8%
noteThe—symbolindicatesthatdataforagroupofstudentshasbeensuppressed.Ifagrouphasfewerthanfivestudents,dataforthatgroupandthenextsmallestgroup(s)aresuppressedtoprotecttheprivacyofindividualstudents.
Other Assessments
2005–06 School Year 2004–05 School Year
TotalTested
Numberscoringatlevel(s):
TotalTested
Numberscoringatlevel(s):
2–4 3–4 4 2–4 3–4 4
NewYorkStateEnglishasaSecondLanguageAchievementTest(NYSESLAT)*:Grade7 6,468 4,385 3,523 N/A N/A N/A N/A N/A
NewYorkStateAlternateAssessment(NYSAA):Grade7Equivalent 2,037 1,994 1,852 1,589
* ResultsinthisreportareshownforstudentswhotooktheNYSESLATinlieuoftheNewYorkStateTestingProgramassessmentforaccountabilitypurposes.
56%
8%
Thistestwasnotgivenin2004–05.

Overview of Statewide Performance3
Statewide Results in Grade 7 MathematicsNY State Public
Percentagescoringatlevel(s):
2–4 3–4 4
MeanScore:651 Range: 611-800 650-800 693-800
NumberofStudents: 188,316 120,833 26,413
87%100%
Results by Student Group
2005–06 School Year 2004–05 School Year
TotalTested
Percentagescoringatlevel(s):
TotalTested
Percentagescoringatlevel(s):
2–4 3–4 4 2–4 3–4 4
All Students 216,893 87% 56% 12%Female 105,055 88% 57% 12%
Male 111,838 86% 55% 12%
Thistestwasnotgivenin2004–05.
AmericanIndianorAlaskaNative 1,075 81% 43% 5%
BlackorAfricanAmerican 43,349 74% 31% 3%
HispanicorLatino 42,712 79% 37% 4%
AsianorNativeHawaiian/OtherPacificIslander
13,969 95% 79% 30%
White 115,787 94% 69% 17%
SmallGroupTotals 0 — — —
General-EducationStudents 186,681 91% 62% 14%
StudentswithDisabilities 30,212 58% 18% 1%
EnglishProficient 204,935 88% 58% 13%
LimitedEnglishProficient 11,958 62% 21% 2%
EconomicallyDisadvantaged 92,874 83% 42% 6%
NotDisadvantaged 124,019 90% 66% 17%
Migrant 76 66% 28% 3%
NotMigrant 216,817 87% 56% 12%
noteThe—symbolindicatesthatdataforagroupofstudentshasbeensuppressed.Ifagrouphasfewerthanfivestudents,dataforthatgroupandthenextsmallestgroup(s)aresuppressedtoprotecttheprivacyofindividualstudents.
Other Assessments
2005–06 School Year 2004–05 School Year
TotalTested
Numberscoringatlevel(s):
TotalTested
Numberscoringatlevel(s):
2–4 3–4 4 2–4 3–4 4
NewYorkStateAlternateAssessment(NYSAA):Grade7Equivalent 2,053 1,964 1,778 1,533
56%
12%
Thistestwasnotgivenin2004–05.

Overview of Statewide Performance3
Statewide Results in Grade 8 English Language ArtsNY State Public
Percentagescoringatlevel(s):
2–4 3–4 4
MeanScore:650 Range: 602-790 650-790 715-790
NumberofStudents: 192,071 104,662 10,270
91%100%
Results by Student Group
2005–06 School Year 2004–05 School Year
TotalTested
Percentagescoringatlevel(s):
TotalTested
Percentagescoringatlevel(s):
2–4 3–4 4 2–4 3–4 4
All Students 212,196 91% 49% 5%Female 103,717 93% 55% 6%
Male 108,479 88% 44% 4%
Newassessmentsforelementary-andmiddle-levelEnglishlanguageartsandmathematicswereadministeredin2006.Resultsfromtheseassessmentscannotbedirectlycomparedtoresultsfrompreviouslyadministeredassessments.
AmericanIndianorAlaskaNative 1,043 86% 34% 1%
BlackorAfricanAmerican 42,996 82% 28% 1%
HispanicorLatino 37,605 85% 31% 1%
AsianorNativeHawaiian/OtherPacificIslander
12,481 95% 67% 9%
White 118,069 95% 61% 7%
SmallGroupTotals 0 — — —
General-EducationStudents 182,130 95% 56% 6%
StudentswithDisabilities 30,066 62% 11% 0%
EnglishProficient 207,181 91% 50% 5%
LimitedEnglishProficient 5,015 56% 5% 0%
EconomicallyDisadvantaged 85,565 88% 36% 2%
NotDisadvantaged 126,631 92% 59% 7%
Migrant 62 76% 27% 0%
NotMigrant 212,134 91% 49% 5%
noteThe—symbolindicatesthatdataforagroupofstudentshasbeensuppressed.Ifagrouphasfewerthanfivestudents,dataforthatgroupandthenextsmallestgroup(s)aresuppressedtoprotecttheprivacyofindividualstudents.
Other Assessments
2005–06 School Year 2004–05 School Year
TotalTested
Numberscoringatlevel(s):
TotalTested
Numberscoringatlevel(s):
2–4 3–4 4 2–4 3–4 4
NewYorkStateEnglishasaSecondLanguageAchievementTest(NYSESLAT)*:Grade8 6,881 4,571 3,721 N/A 7,487 5,456 4,321 N/A
NewYorkStateAlternateAssessment(NYSAA):Grade8Equivalent 1,892 1,878 1,732 1,453 1,822 1,808 1,663 1,321
* ResultsinthisreportareshownforstudentswhotooktheNYSESLATinlieuoftheNewYorkStateTestingProgramassessmentforaccountabilitypurposes.
49%
5%

Overview of Statewide Performance3
Statewide Results in Grade 8 MathematicsNY State Public
Percentagescoringatlevel(s):
2–4 3–4 4
MeanScore:652 Range: 616-775 650-775 701-775
NumberofStudents: 186,286 118,161 22,319
85%100%
Results by Student Group
2005–06 School Year 2004–05 School Year
TotalTested
Percentagescoringatlevel(s):
TotalTested
Percentagescoringatlevel(s):
2–4 3–4 4 2–4 3–4 4
All Students 219,025 85% 54% 10%Female 107,013 86% 55% 10%
Male 112,012 84% 53% 10%
Newassessmentsforelementary-andmiddle-levelEnglishlanguageartsandmathematicswereadministeredin2006.Resultsfromtheseassessmentscannotbedirectlycomparedtoresultsfrompreviouslyadministeredassessments.
AmericanIndianorAlaskaNative 1,076 79% 41% 5%
BlackorAfricanAmerican 43,283 70% 28% 2%
HispanicorLatino 42,082 74% 33% 3%
AsianorNativeHawaiian/OtherPacificIslander
14,032 94% 77% 30%
White 118,550 93% 68% 13%
SmallGroupTotals 0 — — —
General-EducationStudents 188,992 90% 60% 12%
StudentswithDisabilities 30,033 56% 17% 1%
EnglishProficient 207,054 86% 56% 11%
LimitedEnglishProficient 11,971 61% 23% 2%
EconomicallyDisadvantaged 91,206 80% 39% 5%
NotDisadvantaged 127,819 89% 64% 14%
Migrant 78 78% 31% 1%
NotMigrant 218,947 85% 54% 10%
noteThe—symbolindicatesthatdataforagroupofstudentshasbeensuppressed.Ifagrouphasfewerthanfivestudents,dataforthatgroupandthenextsmallestgroup(s)aresuppressedtoprotecttheprivacyofindividualstudents.
Other Assessments
2005–06 School Year 2004–05 School Year
TotalTested
Numberscoringatlevel(s):
TotalTested
Numberscoringatlevel(s):
2–4 3–4 4 2–4 3–4 4
NewYorkStateAlternateAssessment(NYSAA):Grade8Equivalent 1,902 1,868 1,703 1,401 1,793 1,759 1,574 1,251
54%
10%
Overview of Statewide Performance3
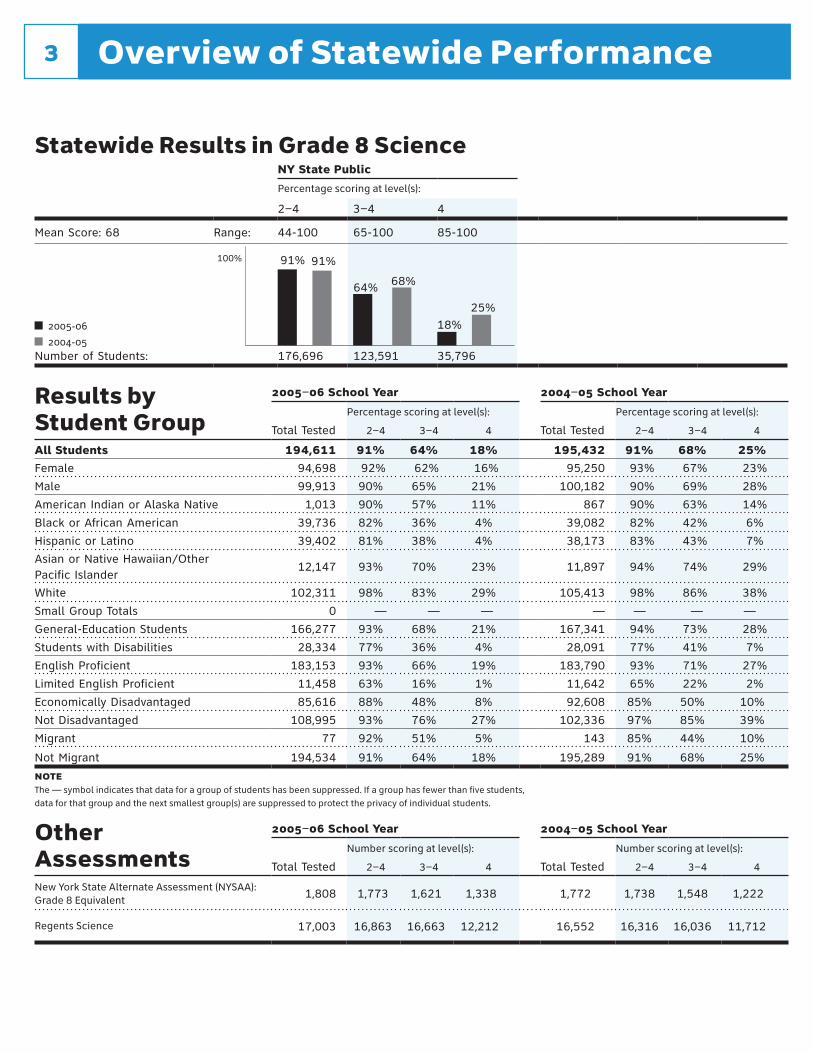
91%100%
64%
18%
Results by Student Group
2005–06 School Year 2004–05 School Year
TotalTested
Percentagescoringatlevel(s):
TotalTested
Percentagescoringatlevel(s):
2–4 3–4 4 2–4 3–4 4
All Students 194,611 91% 64% 18% 195,432 91% 68% 25%Female 94,698 92% 62% 16% 95,250 93% 67% 23%
Male 99,913 90% 65% 21% 100,182 90% 69% 28%
AmericanIndianorAlaskaNative 1,013 90% 57% 11% 867 90% 63% 14%
BlackorAfricanAmerican 39,736 82% 36% 4% 39,082 82% 42% 6%
HispanicorLatino 39,402 81% 38% 4% 38,173 83% 43% 7%
AsianorNativeHawaiian/OtherPacificIslander
12,147 93% 70% 23% 11,897 94% 74% 29%
White 102,311 98% 83% 29% 105,413 98% 86% 38%
SmallGroupTotals 0 — — — — — — —
General-EducationStudents 166,277 93% 68% 21% 167,341 94% 73% 28%
StudentswithDisabilities 28,334 77% 36% 4% 28,091 77% 41% 7%
EnglishProficient 183,153 93% 66% 19% 183,790 93% 71% 27%
LimitedEnglishProficient 11,458 63% 16% 1% 11,642 65% 22% 2%
EconomicallyDisadvantaged 85,616 88% 48% 8% 92,608 85% 50% 10%
NotDisadvantaged 108,995 93% 76% 27% 102,336 97% 85% 39%
Migrant 77 92% 51% 5% 143 85% 44% 10%
NotMigrant 194,534 91% 64% 18% 195,289 91% 68% 25%
noteThe—symbolindicatesthatdataforagroupofstudentshasbeensuppressed.Ifagrouphasfewerthanfivestudents,dataforthatgroupandthenextsmallestgroup(s)aresuppressedtoprotecttheprivacyofindividualstudents.
Other Assessments
2005–06 School Year 2004–05 School Year
TotalTested
Numberscoringatlevel(s):
TotalTested
Numberscoringatlevel(s):
2–4 3–4 4 2–4 3–4 4
NewYorkStateAlternateAssessment(NYSAA):Grade8Equivalent 1,808 1,773 1,621 1,338 1,772 1,738 1,548 1,222
RegentsScience 17,003 16,863 16,663 12,212 16,552 16,316 16,036 11,712
Statewide Results in Grade 8 ScienceNY State Public
Percentagescoringatlevel(s):
2–4 3–4 4
MeanScore:68 Range: 44-100 65-100 85-100
2005-06
2004-05NumberofStudents: 176,696 123,591 35,796
64%
18%
91%
68%
25%

Overview of Statewide Performance3
Previous Years’ Results for English Language ArtsStandardsforelementary-andmiddle-levelEnglishlanguageartsandmathematicsassessmentsadministeredin1999 through2005 aredifferentfromthoseforthe2006 assessments.Assuch,validcomparisonsbetween2006 dataanddatafrompreviousyearscannotbemade
Grade 4
NY State Public
Percentagescoringatlevel(s):
2–4 3–4 4
Range: 603–800 645–800 692–800
2004–052003–042002–03
Number of students scoring at each performance level:
TestDate Level1 Level2 Level3 Level4 TotalTested MeanScore
Feb2005 10,588 47,593 96,845 41,455 196,481 665
Feb2004 12,109 65,680 98,097 30,360 206,246 656
Feb2003 12,394 62,455 89,069 45,987 209,905 660
Grade 8
NY State Public
Percentagescoringatlevel(s):
2–4 3–4 4
Range: 658–830 697–830 737–830
2004–052003–042002–03
Number of students scoring at each performance level:
TestDate Level1 Level2 Level3 Level4 TotalTested MeanScore
Jan2005 14,182 97,860 84,352 19,755 216,149 698
Jan2004 15,994 98,949 79,256 23,893 218,092 699
Jan2003 20,130 96,533 79,747 16,296 212,706 694
95% 94% 94%
70%62% 64%
21%15%
22%
93% 93%91%
48% 47% 45%
9% 11%8%
100%
100%

Overview of Statewide Performance3
Previous Years’ Results for MathematicsStandardsforelementary-andmiddle-levelEnglishlanguageartsandmathematicsassessmentsadministeredin1999 through2005 aredifferentfromthoseforthe2006 assessments.Assuch,validcomparisonsbetween2006 dataanddatafrompreviousyearscannotbemade
Grade 4
NY State Public
Percentagescoringatlevel(s):
2–4 3–4 4
Range: 602-810 637-810 678-810
2004–052003–042002–03
Number of students scoring at each performance level:
TestDate Level1 Level2 Level3 Level4 TotalTested MeanScore
May2005 6,534 24,969 95,464 80,710 207,677 670
May2004 8,352 36,455 108,183 61,706 214,696 661
May2003 10,342 36,918 103,645 67,274 218,179 661
Grade 8
NY State Public
Percentagescoringatlevel(s):
2–4 3–4 4
Range: 681-882 716-882 760-882
2004–052003–042002–03
Number of students scoring at each performance level:
TestDate Level1 Level2 Level3 Level4 TotalTested MeanScore
May2005 28,873 69,975 102,061 21,085 221,994 718
May2004 30,937 63,654 100,371 28,322 223,284 718
May2003 36,209 70,196 91,864 20,733 219,002 713
97% 96% 95% 85%79% 78%
39%29% 31%
87% 86% 83%
55% 58%51%
9%13% 9%
100%
100%

Statewide Total Cohort Results in Secondary-Level English after Four Years of Instruction
NY State Public
Percentagescoringatlevel(s):
2–4 3–4 4
2002 Cohort2001 Cohort
Results by Student Group
2002 Cohort* 2001 Cohort*
NumberofStudents
Percentagescoringatlevel(s): NumberofStudents
Percentagescoringatlevel(s):
2–4 3–4 4 2–4 3–4 4
All Students 216,910 76% 69% 28% 212,135 74% 68% 33%Female 106,343 80% 73% 33% 104,217 79% 73% 38%
Male 110,567 71% 64% 24% 107,918 70% 64% 27%
AmericanIndianorAlaskaNative 943 60% 51% 17% 871 61% 54% 19%
BlackorAfricanAmerican 41,392 62% 50% 11% 40,239 60% 50% 13%
HispanicorLatino 36,847 60% 49% 10% 35,122 58% 48% 13%
AsianorNativeHawaiian/OtherPacificIslander
14,943 83% 77% 36% 14,230 81% 75% 39%
White 122,785 84% 80% 39% 121,673 83% 79% 44%
SmallGroupTotals N/A N/A N/A N/A N/A N/A N/A N/A
General-EducationStudents 189,457 81% 74% 32% 185,854 80% 74% 37%
StudentswithDisabilities 27,453 38% 28% 4% 26,281 36% 28% 4%
EnglishProficient 205,883 78% 71% 30% 200,833 76% 71% 34%
LimitedEnglishProficient 11,027 36% 24% 3% 11,302 39% 28% 4%
EconomicallyDisadvantaged 69,463 64% 53% 12% 62,435 63% 54% 16%
NotDisadvantaged 147,447 81% 76% 36% 149,700 79% 74% 40%
Migrant 108 43% 32% 6% 127 56% 46% 13%
NotMigrant 216,802 76% 69% 28% 212,008 74% 68% 33%
note The—symbolindicatesthatdataforagroupofstudentshasbeensuppressed.Ifagrouphasfewerthanfivestudents,dataforthatgroupandthenextsmallestgroup(s)aresuppressedtoprotecttheprivacyofindividualstudents.
Other Assessments
2002 Cohort* 2001 Cohort*
NumberofStudents
Numberscoringatlevel(s): NumberofStudents
Numberscoringatlevel(s):
2–4 3–4 4 2–4 3–4 4
NewYorkStateAlternateAssessment(NYSAA):HighSchoolEquivalent 1,287 1,252 1,157 947 535 523 469 346
* AtotalcohortconsistsofallstudentswhofirstenteredGrade9inaparticularyear,andallungradedstudentswithdisabilitieswhoreachedtheirseventeenthbirthdayinthatyear,andwereenrolledintheschool/districtforfivemonths.Studentsareexcludedfromthecohortiftheytransferredtoanotherschooldistrict,nonpublicschool,orcriminaljusticefacility,orlefttheU.S.anditsterritoriesordiedbeforethereportdate.Statewidetotalcohortalsoincludesstudentswhowereenrolledforfewerthanfivemonths.
76% 74% 69% 68%
28% 33%
Overview of Statewide Performance3
100%
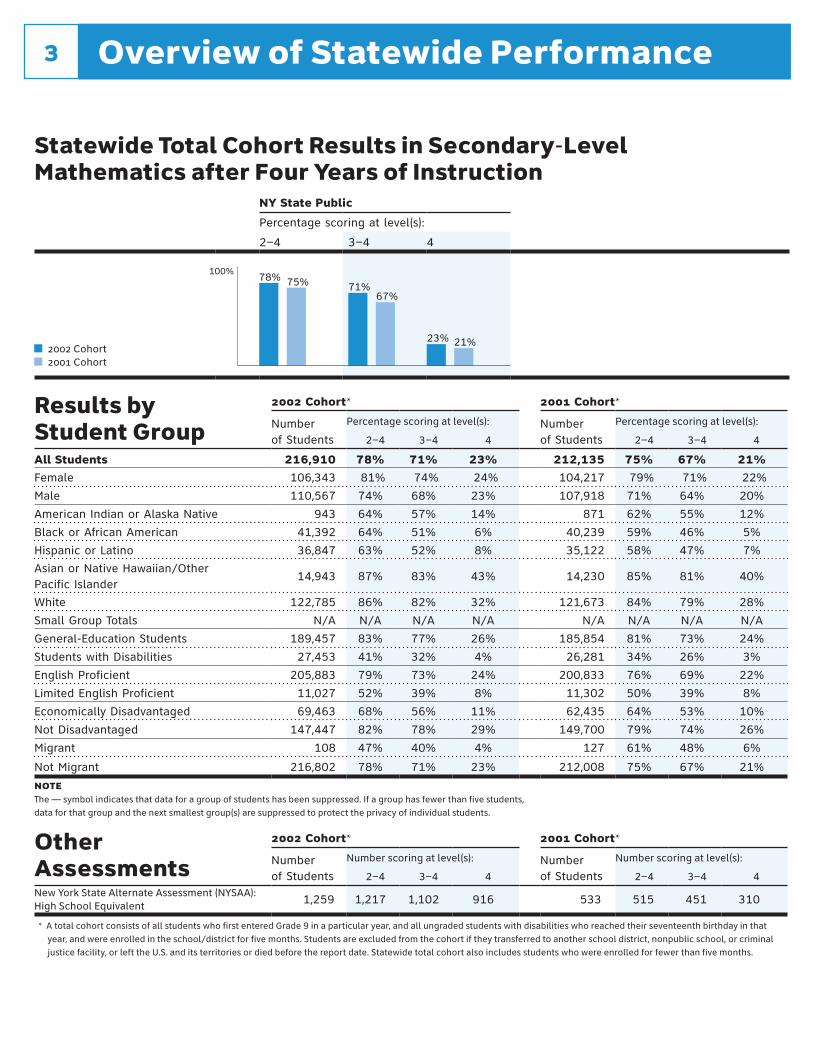
Statewide Total Cohort Results in Secondary-Level Mathematics after Four Years of Instruction
NY State Public
Percentagescoringatlevel(s):
2–4 3–4 4
2002 Cohort2001 Cohort
Results by Student Group
2002 Cohort* 2001 Cohort*
NumberofStudents
Percentagescoringatlevel(s): NumberofStudents
Percentagescoringatlevel(s):
2–4 3–4 4 2–4 3–4 4
All Students 216,910 78% 71% 23% 212,135 75% 67% 21%Female 106,343 81% 74% 24% 104,217 79% 71% 22%
Male 110,567 74% 68% 23% 107,918 71% 64% 20%
AmericanIndianorAlaskaNative 943 64% 57% 14% 871 62% 55% 12%
BlackorAfricanAmerican 41,392 64% 51% 6% 40,239 59% 46% 5%
HispanicorLatino 36,847 63% 52% 8% 35,122 58% 47% 7%
AsianorNativeHawaiian/OtherPacificIslander
14,943 87% 83% 43% 14,230 85% 81% 40%
White 122,785 86% 82% 32% 121,673 84% 79% 28%
SmallGroupTotals N/A N/A N/A N/A N/A N/A N/A N/A
General-EducationStudents 189,457 83% 77% 26% 185,854 81% 73% 24%
StudentswithDisabilities 27,453 41% 32% 4% 26,281 34% 26% 3%
EnglishProficient 205,883 79% 73% 24% 200,833 76% 69% 22%
LimitedEnglishProficient 11,027 52% 39% 8% 11,302 50% 39% 8%
EconomicallyDisadvantaged 69,463 68% 56% 11% 62,435 64% 53% 10%
NotDisadvantaged 147,447 82% 78% 29% 149,700 79% 74% 26%
Migrant 108 47% 40% 4% 127 61% 48% 6%
NotMigrant 216,802 78% 71% 23% 212,008 75% 67% 21%
note The—symbolindicatesthatdataforagroupofstudentshasbeensuppressed.Ifagrouphasfewerthanfivestudents,dataforthatgroupandthenextsmallestgroup(s)aresuppressedtoprotecttheprivacyofindividualstudents.
Other Assessments
2002 Cohort* 2001 Cohort*
NumberofStudents
Numberscoringatlevel(s): NumberofStudents
Numberscoringatlevel(s):
2–4 3–4 4 2–4 3–4 4
NewYorkStateAlternateAssessment(NYSAA):HighSchoolEquivalent 1,259 1,217 1,102 916 533 515 451 310
* AtotalcohortconsistsofallstudentswhofirstenteredGrade9inaparticularyear,andallungradedstudentswithdisabilitieswhoreachedtheirseventeenthbirthdayinthatyear,andwereenrolledintheschool/districtforfivemonths.Studentsareexcludedfromthecohortiftheytransferredtoanotherschooldistrict,nonpublicschool,orcriminaljusticefacility,orlefttheU.S.anditsterritoriesordiedbeforethereportdate.Statewidetotalcohortalsoincludesstudentswhowereenrolledforfewerthanfivemonths.
78% 75% 71%67%
23% 21%
Overview of Statewide Performance3
100%

Graduation Rate and Other Outcomes for Total CohortStudentsareincludedintheStatetotalcohortbasedontheyeartheyenteredGrade9or,ifungraded,theschoolyearinwhichtheyreachedtheirseventeenthbirthday.Studentsareincludedinthecohortoftheschoolwheretheywerelastenrollediftheywereenrolledforaminimumoffivemonths.StudentswerecountedasgraduatesiftheyearnedalocaloraRegentsdiploma.Statewidetotalcohortalsoincludesstudentswhowereenrolledforfewerthanfivemonths.
Total Cohort Outcomes after Four Years of SchoolPercentage of students who:
2002Cohort2001Cohort
67% 66%
2% 2% 2% 1%
16% 15% 14% 15%
Overview of Statewide Performance3
CohortNumber of Students Graduated
Earned an IEP Diploma
Transferred to GED
Were Still Enrolled
Dropped Out
All Students 2002 216,910 67% 2% 2% 16% 14%2001 212,135 66% 2% 1% 15% 15%
Female 2002 106,343 71% 2% 1% 14% 12%2001 104,217 71% 1% 1% 13% 13%
Male 2002 110,567 62% 2% 2% 18% 16%2001 107,918 61% 2% 1% 18% 18%
AmericanIndianorAlaskaNative
2002 943 50% 3% 4% 17% 26%2001 871 52% 3% 2% 18% 25%
BlackorAfricanAmerican
2002 41,392 47% 3% 2% 27% 21%2001 40,239 46% 3% 1% 27% 23%
HispanicorLatino 2002 36,847 45% 2% 1% 28% 23%2001 35,122 43% 2% 1% 28% 25%
AsianorNativeHawaiian/OtherPacificIslander
2002 14,943 74% 1% 1% 15% 10%2001 14,230 72% 1% 0% 16% 11%
White 2002 122,785 79% 2% 2% 8% 9%2001 121,673 79% 2% 1% 8% 11%
SmallGroupTotals 2002 N/A N/A N/A N/A N/A N/A2001 N/A N/A N/A N/A N/A N/A
General-EducationStudents 2002 189,457 71% 0% 1% 15% 13%2001 185,854 70% 0% 1% 15% 14%
StudentswithDisabilities 2002 27,453 37% 15% 2% 23% 22%2001 26,281 38% 14% 2% 20% 25%
EnglishProficient 2002 205,883 69% 2% 2% 15% 13%2001 200,833 68% 2% 1% 15% 15%
LimitedEnglishProficient 2002 11,027 27% 4% 2% 36% 31%2001 11,302 34% 4% 1% 30% 31%
EconomicallyDisadvantaged 2002 69,463 50% 3% 2% 26% 19%2001 62,435 52% 3% 1% 22% 22%
NotDisadvantaged 2002 147,447 75% 1% 1% 11% 12%2001 149,700 72% 1% 1% 13% 13%
Migrant 2002 108 37% 6% 2% 18% 37%2001 127 50% 2% 1% 19% 28%
NotMigrant 2002 216,802 67% 2% 2% 16% 14%2001 212,008 66% 2% 1% 15% 15%
notesThe—symbolindicatesthatdataforagroupofstudentshasbeensuppressed.Ifagrouphasfewerthanfivestudents,dataforthatgroupandthenextsmallestgroup(s)aresuppressedtoprotecttheprivacyofindividualstudents.
100%

Overview of Statewide Performance3
Total 2001 Cohort Outcomes after Five Years of SchoolPercentage of students who:
NYStatePublic
72%
2% 1% 5%
19%
100%
Number of Students Graduated
Earned an IEP Diploma
Transferred to GED
Were Still Enrolled
Dropped Out
All Students 212,135 72% 2% 1% 5% 19%Female 104,217 77% 2% 1% 4% 16%Male 107,918 68% 3% 2% 6% 21%AmericanIndianorAlaskaNative
871 58% 4% 2% 6% 29%
BlackorAfricanAmerican
40,239 56% 4% 1% 10% 29%
HispanicorLatino 35,122 53% 3% 1% 11% 32%AsianorNativeHawaiian/OtherPacificIslander
14,230 79% 1% 0% 5% 15%
White 121,673 82% 2% 2% 2% 12%SmallGroupTotals N/A N/A N/A N/A N/A N/AGeneral-EducationStudents 185,854 76% 0% 1% 5% 18%StudentswithDisabilities 26,281 43% 19% 2% 7% 29%EnglishProficient 200,833 74% 2% 1% 5% 18%LimitedEnglishProficient 11,302 42% 5% 1% 12% 39%EconomicallyDisadvantaged 62,435 60% 4% 2% 9% 26%NotDisadvantaged 149,700 78% 2% 1% 4% 16%Migrant 127 59% 4% 1% 4% 32%NotMigrant 212,008 72% 2% 1% 5% 19%
notesThe—symbolindicatesthatdataforagroupofstudentshasbeensuppressed.Ifagrouphasfewerthanfivestudents,dataforthatgroupandthenextsmallestgroup(s)aresuppressedtoprotecttheprivacyofindividualstudents.