accord trial_review
TRANSCRIPT
Highlights from presentations made at the ADA 68th
Scientific Sessions, June 10, 2008
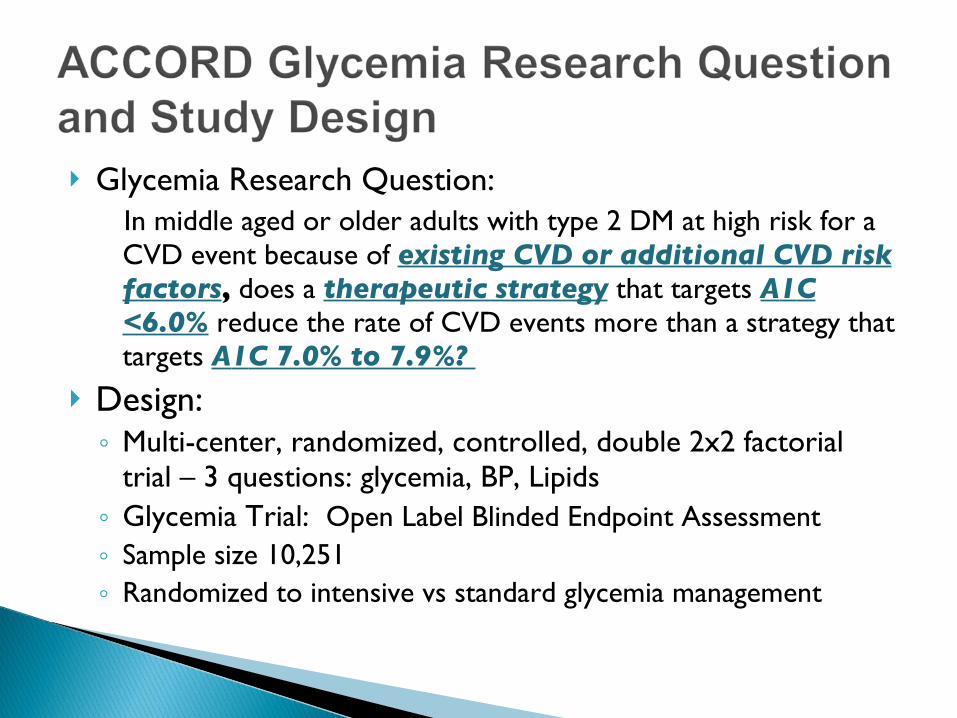
Glycemia Research Question: In middle aged or older adults with type 2 DM at high risk for a
CVD event because of existing CVD or additional CVD risk factors, does a therapeutic strategy that targets A1C <6.0% reduce the rate of CVD events more than a strategy that targets A1C 7.0% to 7.9%?
Design: ◦ Multi-center, randomized, controlled, double 2x2 factorial
trial – 3 questions: glycemia, BP, Lipids ◦ Glycemia Trial: Open Label Blinded Endpoint Assessment ◦ Sample size 10,251◦ Randomized to intensive vs standard glycemia management
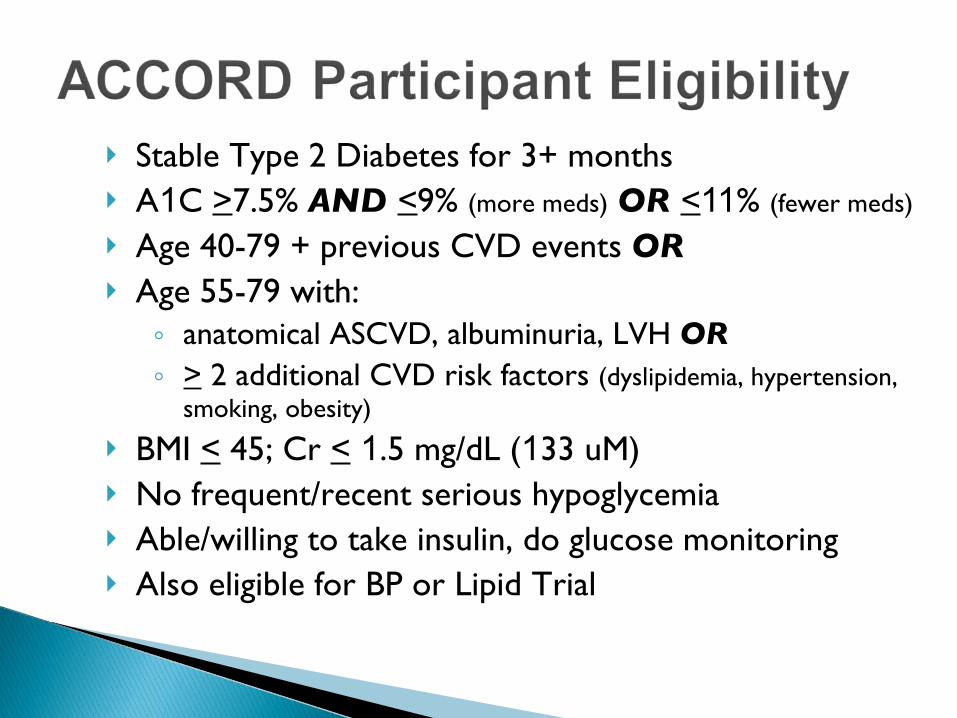
Stable Type 2 Diabetes for 3+ months A1C >7.5% AND <9% (more meds) OR <11% (fewer meds)
Age 40-79 + previous CVD events OR Age 55-79 with:◦ anatomical ASCVD, albuminuria, LVH OR ◦ > 2 additional CVD risk factors (dyslipidemia, hypertension,
smoking, obesity)
BMI < 45; Cr < 1.5 mg/dL (133 uM) No frequent/recent serious hypoglycemia Able/willing to take insulin, do glucose monitoring Also eligible for BP or Lipid Trial
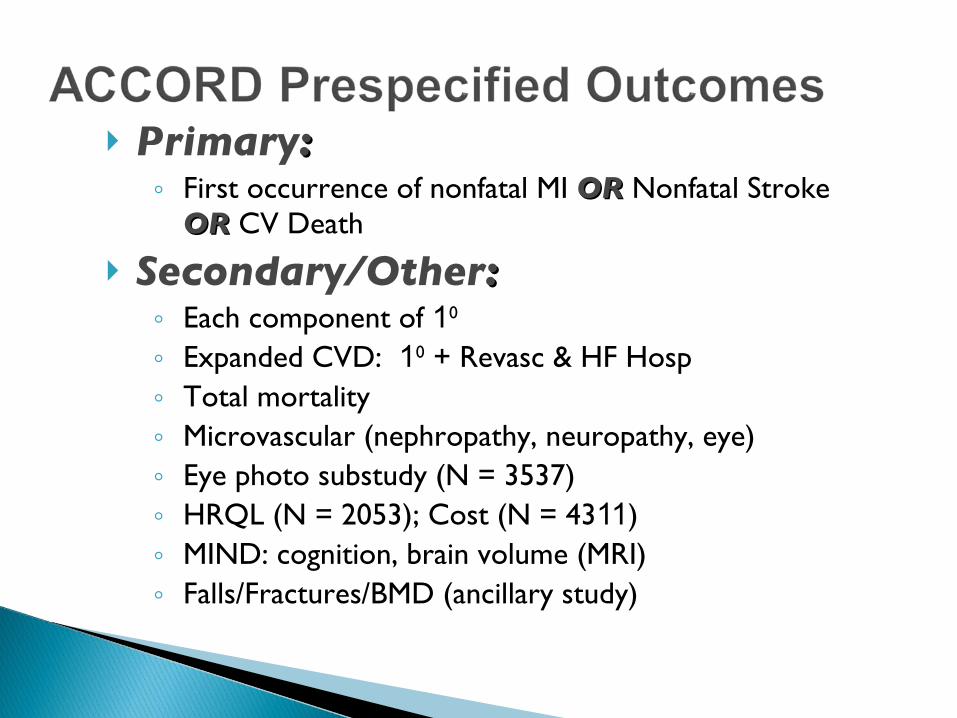
Primary: : ◦ First occurrence of nonfatal MI OR OR Nonfatal Stroke
OR OR CV Death
Secondary/Other::◦ Each component of 10 ◦ Expanded CVD: 10 + Revasc & HF Hosp◦ Total mortality◦ Microvascular (nephropathy, neuropathy, eye)◦ Eye photo substudy (N = 3537) ◦ HRQL (N = 2053); Cost (N = 4311)◦ MIND: cognition, brain volume (MRI)◦ Falls/Fractures/BMD (ancillary study)
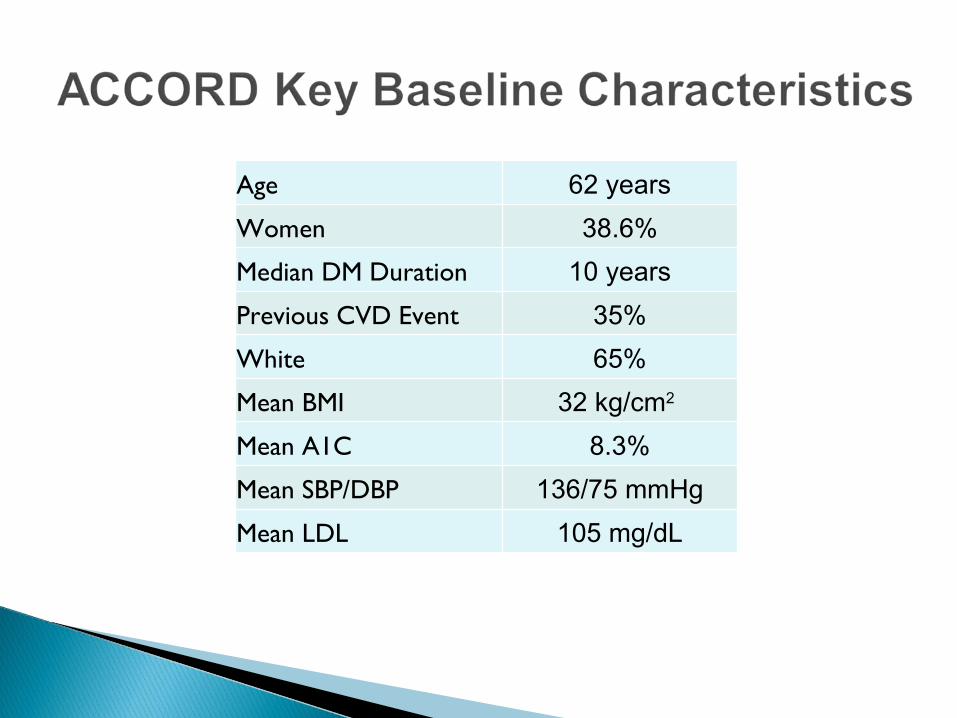
Age 62 years
Women 38.6%
Median DM Duration 10 years
Previous CVD Event 35%
White 65%
Mean BMI 32 kg/cm2
Mean A1C 8.3%
Mean SBP/DBP 136/75 mmHg
Mean LDL 105 mg/dL
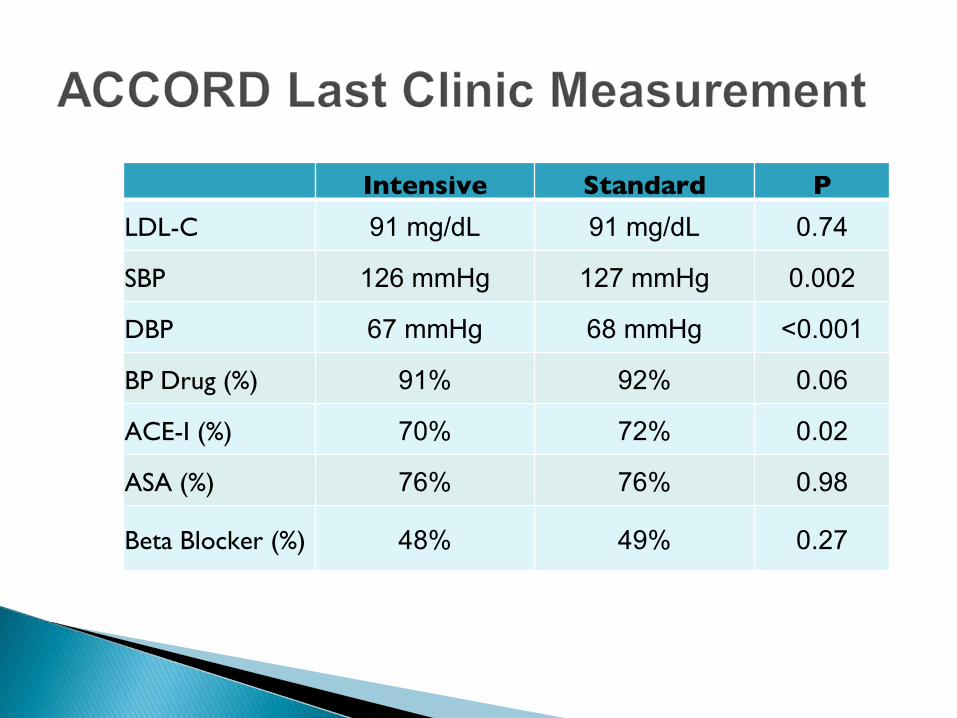
Intensive Standard P
LDL-C 91 mg/dL 91 mg/dL 0.74
SBP 126 mmHg 127 mmHg 0.002
DBP 67 mmHg 68 mmHg <0.001
BP Drug (%) 91% 92% 0.06
ACE-I (%) 70% 72% 0.02
ASA (%) 76% 76% 0.98
Beta Blocker (%) 48% 49% 0.27
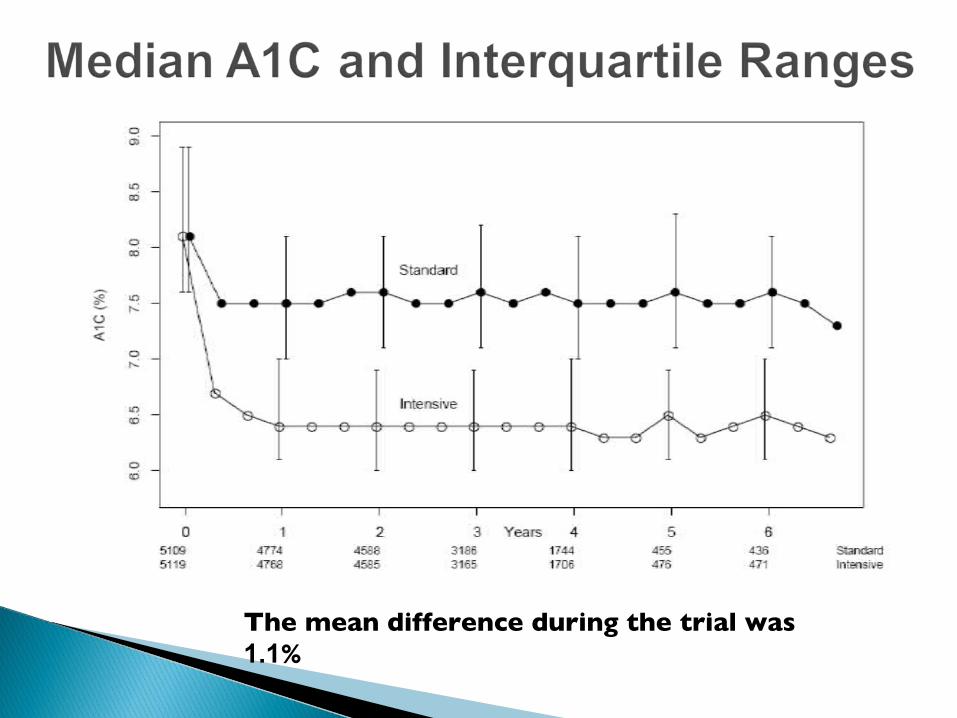
The mean difference during the trial was 1.1%
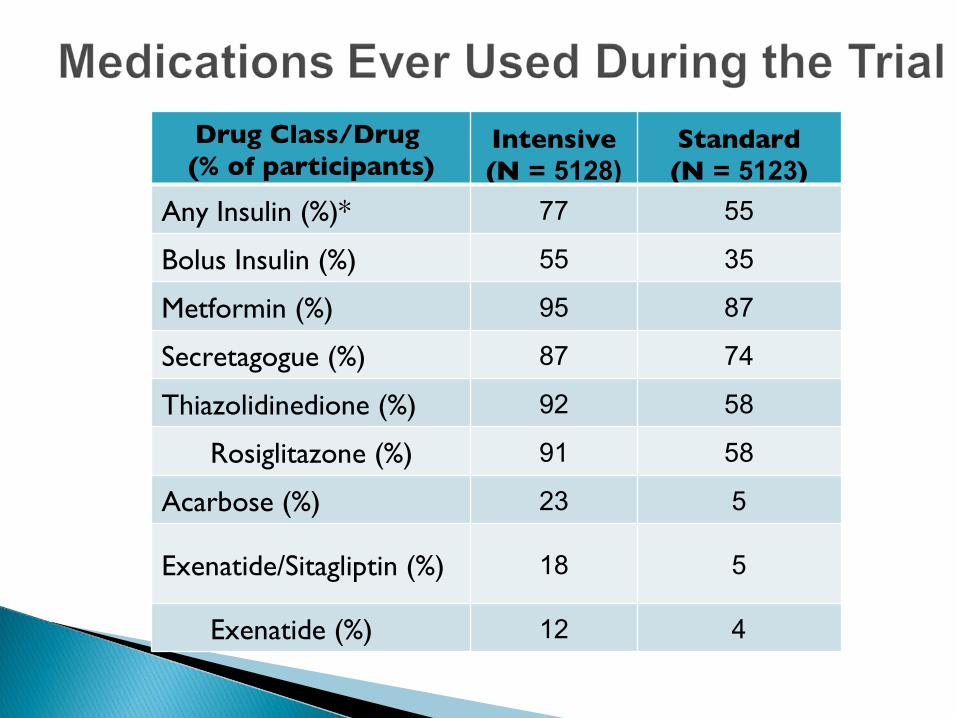
Drug Class/Drug (% of participants)
Intensive(N = 5128)
Standard(N = 5123)
Any Insulin (%)* 77 55
Bolus Insulin (%) 55 35
Metformin (%) 95 87
Secretagogue (%) 87 74
Thiazolidinedione (%) 92 58
Rosiglitazone (%) 91 58
Acarbose (%) 23 5
Exenatide/Sitagliptin (%) 18 5
Exenatide (%) 12 4
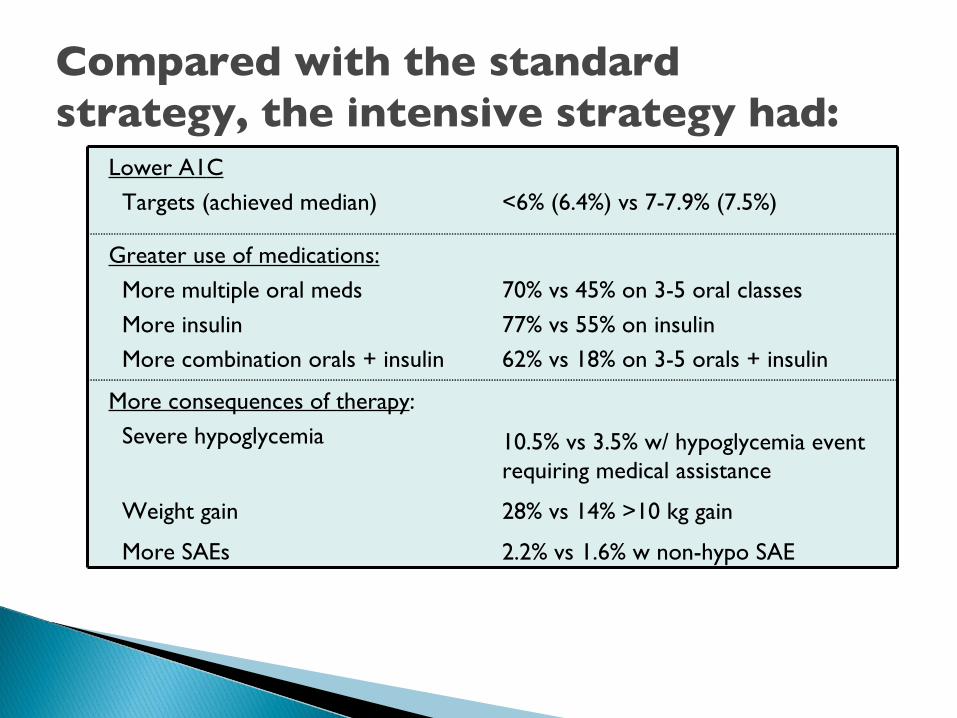
Lower A1C
Targets (achieved median) <6% (6.4%) vs 7-7.9% (7.5%)
Greater use of medications:
More multiple oral meds
More insulin
More combination orals + insulin
70% vs 45% on 3-5 oral classes
77% vs 55% on insulin
62% vs 18% on 3-5 orals + insulin
More consequences of therapy:
Severe hypoglycemia
Weight gain
More SAEs
10.5% vs 3.5% w/ hypoglycemia event requiring medical assistance
28% vs 14% >10 kg gain
2.2% vs 1.6% w non-hypo SAE
Compared with the standard strategy, the intensive strategy had:
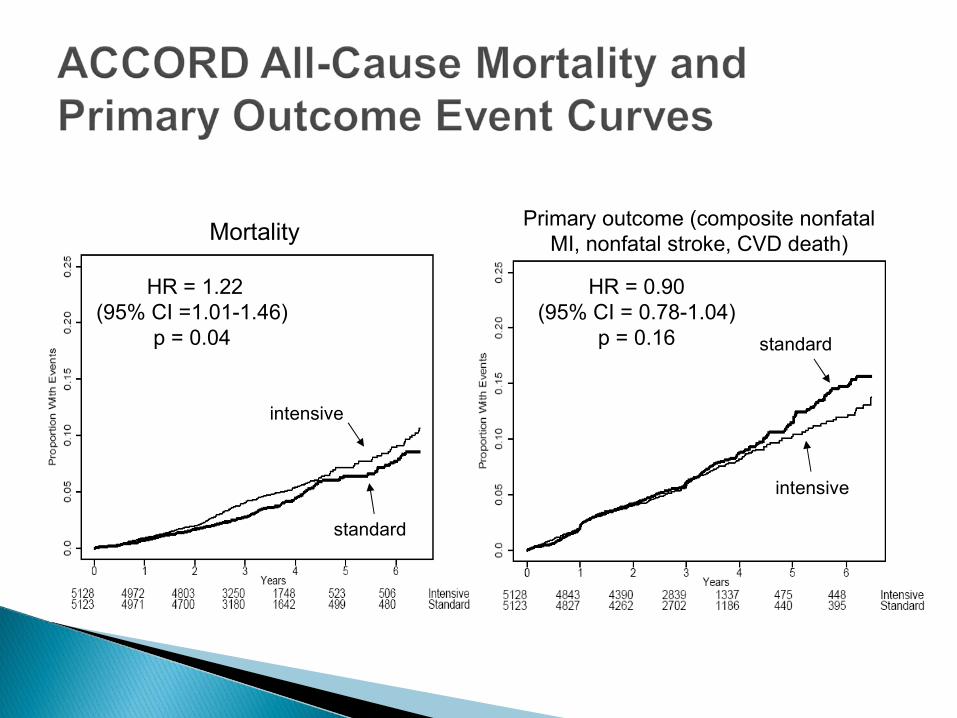
Mortality
intensive
standard
HR = 1.22(95% CI =1.01-1.46)
p = 0.04
Primary outcome (composite nonfatal MI, nonfatal stroke, CVD death)
intensive
standard
HR = 0.90(95% CI = 0.78-1.04)
p = 0.16
Mortality Primary outcome (composite nonfatal
MI, nonfatal stroke, CVD death)
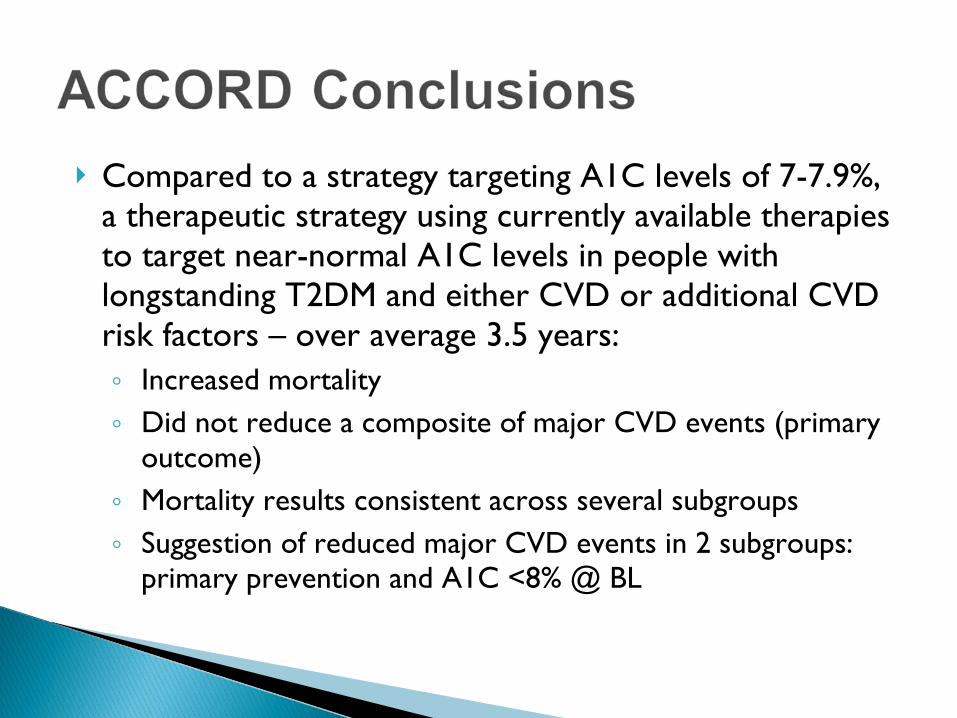
Compared to a strategy targeting A1C levels of 7-7.9%, a therapeutic strategy using currently available therapies to target near-normal A1C levels in people with longstanding T2DM and either CVD or additional CVD risk factors – over average 3.5 years:◦ Increased mortality
◦ Did not reduce a composite of major CVD events (primary outcome)
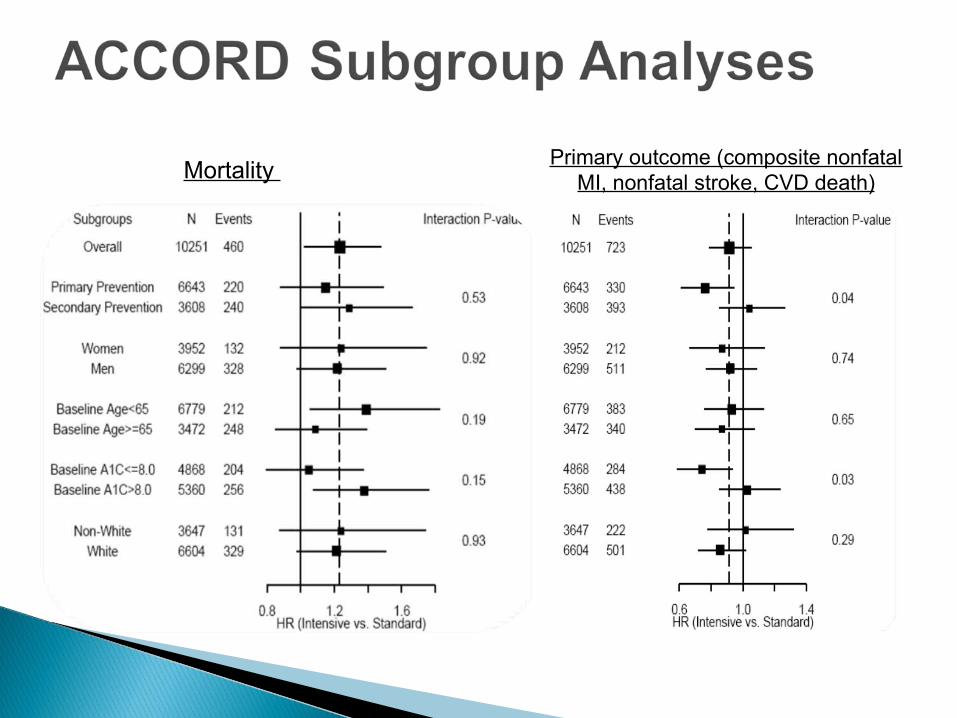
◦ Mortality results consistent across several subgroups
◦ Suggestion of reduced major CVD events in 2 subgroups: primary prevention and A1C <8% @ BL
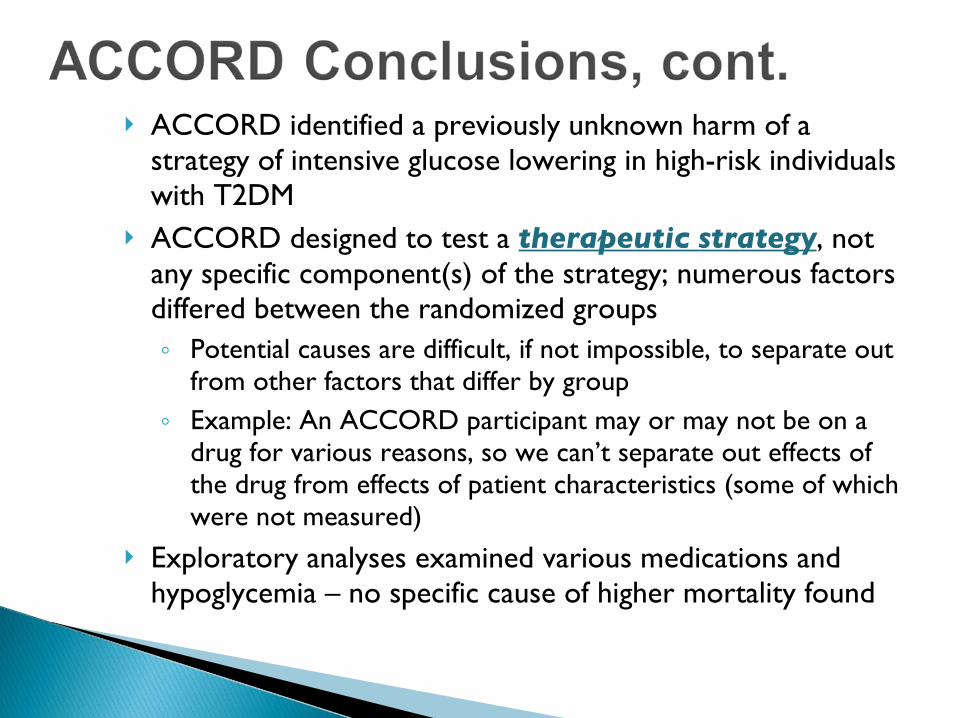
ACCORD identified a previously unknown harm of a strategy of intensive glucose lowering in high-risk individuals with T2DM
ACCORD designed to test a therapeutic strategy, not any specific component(s) of the strategy; numerous factors differed between the randomized groups◦ Potential causes are difficult, if not impossible, to separate out
from other factors that differ by group
◦ Example: An ACCORD participant may or may not be on a drug for various reasons, so we can’t separate out effects of the drug from effects of patient characteristics (some of which were not measured)
Exploratory analyses examined various medications and hypoglycemia – no specific cause of higher mortality found
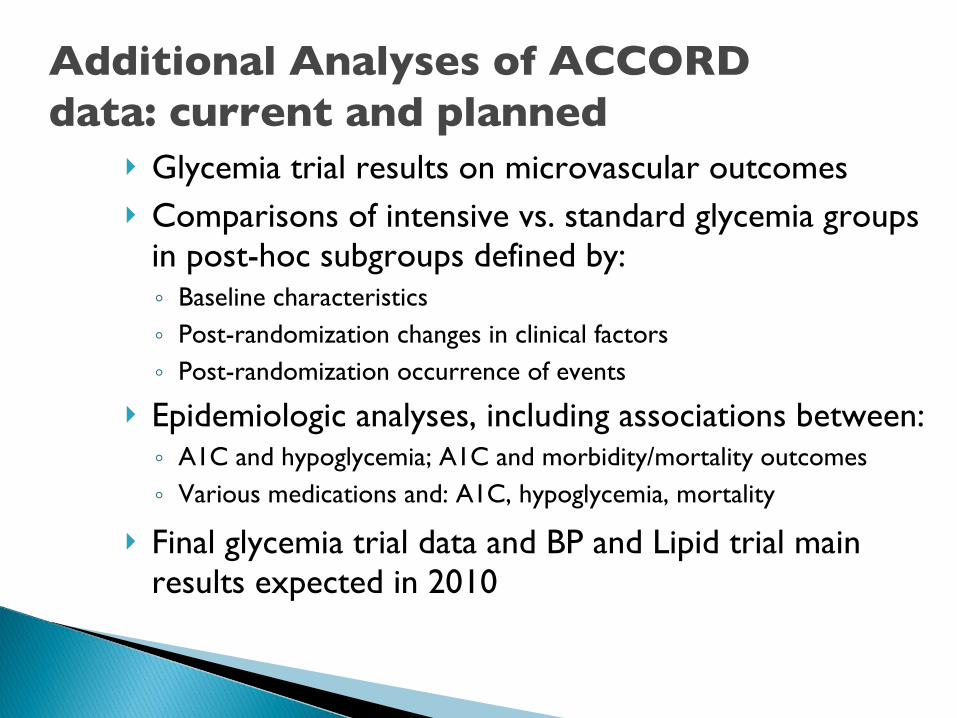
Glycemia trial results on microvascular outcomes Comparisons of intensive vs. standard glycemia groups
in post-hoc subgroups defined by:◦ Baseline characteristics
◦ Post-randomization changes in clinical factors
◦ Post-randomization occurrence of events
Epidemiologic analyses, including associations between:◦ A1C and hypoglycemia; A1C and morbidity/mortality outcomes
◦ Various medications and: A1C, hypoglycemia, mortality
Final glycemia trial data and BP and Lipid trial main results expected in 2010
Additional Analyses of ACCORD data: current and planned