accountabilityandtesting.brevardschools.orgaccountabilityandtesting.brevardschools.o… · web...
TRANSCRIPT

Brevard County Public Schools
School Improvement Plan2012-2013
Name of School: Area:
Principal: Area Superintendent:
SAC Chairperson:
Superintendent: Dr. Brian Binggeli
Mission Statement: Surfside Elementary School provides a safe and positive environment where high quality education occurs for all students.
Vision Statement: Surfside Elementary School will create a challenging, positive learning environment that promotes excellence and group achievement. Staff, students, and parents will work together to encourage children to realize their maximum potential for learning, problem solving, and responsible citizenship.
Brevard County Public SchoolsSchool Improvement Plan
2012-2013RATIONAL – Continuous Improvement Cycle Process
Data Analysis from multiple data sources: (Needs assessment that supports the need for improvement)
Surfside Elementary North
Susan B. Murray Dr. Ronald Bobay
Dianne Peterson
Page 1

Surfside Elementary School had exceptional FCAT results despite the changes in the state’s criteria with cut scores. Advance planning and sticking to our goals helped us receive even more points in the overall state assessment than we did the previous year. We are proud to be ranked number 36 in the entire state of Florida where there are close to 2,000 schools in the state’s accountability program. Areas to focus on for us over the next year will be to enrich our student’s among our high performing learning culture and encourage our instructors to strive for a higher number of students who score at Level’s 4 and 5 on these annual state assessments through utilizing research proven instructional methods and evidenced based instructional methods to take our students to the next level. Several charts are provided to demonstrate the successes we are celebrating at Surfside and the data we are reviewing to set personal and professional goals individually in our Professional Growth Plans for 2012-2013. We have looked closely at FCAT 2.0 results, state FAIR Testing Results, and Brevard Public School’s Parent and Student Surveys to generate a collection of resources for our staff to pull data when analyzing their performance and setting goals and instructional strategies in action for the upcoming school year.
FCAT 2.0 2012 Data Collection% 3 and up % 4 and up
Grade ReadingVariance from school avg. * Math
Variance from
school avg. *
Science Reading
Variance from school avg. *
Math
Variance
from school avg. *
Science
3rd 92% +3 91% +1 3rd 64% +3 49% -12
4th 92% +3 98% +8 4th 66% +5 85%+24
5th 86% -3 88% -2 89% 5th 55% -6 62% +1 51%
6th 86% -3 85% -5 6th 60% -1 62% +1
Surfside 89% 90% 61% 61%
* The green boxes above compare each grade level to the Surfside’s overall averages.
Annual Learning Gains using FCAT 2.0 Results
Reading Math
4th Grade 36/52 69% 4th 47/52 90%
5th Grade 38/61 63% 5th 41/61 67%
6th Grade 43/63 68% 6th 48/63 76%
Page 2

Below 70%
(When above grade level students drop an achievement level, the state does not give them a point for a learning gain (example: a child who had a 5 the previous year and earned a 4 the following year – even if only one question makes the difference in the score)
Below Grade Level Student Numbers/Percentages
Reading Math Science
Grade
# Tested
Level 1's
# of students
Level 1's
%
Level 2's
# of student
s
Level 2’s
%
Level 1's
# of student
s
Level 1's
%
Level 2's
# of students
Level 2's
%
Level 1's
# of students
Level 1's
%
Level 2's
# of student
s
Level 2's
%
3 53 00.00% 4 7.55% 0
0.00% 5
9.43%
4 53 00.00% 4 7.55% 0
0.00% 1
1.89%
5 65 11.54% 8
12.31% 2
3.08% 6
9.23% 1 1.54% 6 9.23%
6 65 23.08% 7
10.77% 1
1.54% 9
13.85%
Totals 236 31.27% 23 9.75% 3
1.27% 21
8.90% 1 1.54% 6 9.23%
Surfside did an exceptional job of decreasing the numbers and percentages of below grade level students overall, even with the severe state changes in cut scores. This will mean fewer students (14) will count for Surfside in this year’s calculation of their school grade when looking at the gains of the student’s that fall within the school’s Lowest 25% category. Unfortunately, for data reading purposes, now each child in this category will count as a higher percentage per child when calculating next year’s percentages of this group making learning gains.
As a school where students perform at top-notch standards, we must look deeper at our data to see how we can best help our students reach even higher achievement levels. Annually we take a deeper look at the FCAT results to analyze subcategory content within the reading, math, and science assessments. We look for mastery levels using a 70% correct rate as our gage of success for each child to have “mastered” each subcategory set of FCAT skills. The chart below compares our data from 2011 to our 2012 results and shows each grade level’s break down of categories color-coding our strongest and weakest areas. Our classroom teachers receive more personal information related to their previous and current classes annually at the start of each year to plan their instruction taking previous results into account. Progress is
Page 3

monitored throughout the year. Student Percentages of those “Mastering” each Category at 70% of questions correct or better in that area
Strongest
Area
Weakest
Area
Strongest
Area
Weakest
Area
Reading MathVocabulary Reading
Application
Literary
Analysis
Informational
Text
Number
Operations
Fractions Geometry &
Measurement
3rd
Grade
+13%
52/53
98%
+7%
42/53
79%
+3%
47/53
89%
+11%
46/53
87%
+2%
49/53
92%
-3%
42/53
79%
-11%
44/53
83%
4th
Grade
+4%
44/53
83%
+5%
48/53
91%
-10%
30/53
57%
-3%
50/53
94%
+16%
53/53
100%
+14%
53/53
100%
+4%
45/53
85%
5th
Grade
+13%
56/65
86%
+11%
53/65
82%
+9%
53/65
82%
+14%
47/65
72%
+8%
41/65
63%
-4%
50/65
77%
+38
49/65
75%
6th
Grade
-15%
50/65
77%
+5%
51/65
78%
+12%
55/65
85%
-13%
33/65
51%
-6%
33/65
51%
NC
50/65
77%
+2%
29/65
45%
School +1%
202/236
86%
+7%
194/236
82%
+4%
185/236
78%
+3%
176/236
75%
+5%
176/236
75%
+2%
197/236
83%
+10%
167/236
71%
Physical &
Chemical
Earth &
Space
Life &
Environmental
Scientific
Thinking
5th
Grade
+12%
58/65
89%
+13%
58/65
89%
-3%
51/65
78%
+10%
62/65
95%
Grade levels are able to compare their results among their peers allowing them to collaborate together for
Page 4

goal setting and for personal observation experiences to gain knowledge from colleagues in areas of their desire.
Percent-ages of
sub-catego-ries by grade level
Read-ing
Scale Score
Vocab-ulary
Rdg App
Lit. An.
Info. Text
Math
Scale Score
Oper./ Prob/Stat
Frac.Geom/Meas
*Blue shade shows below 80% areas
*Red shade shows below 70% areas
3rd 83 89 79 86 85 83 88 81 84
4th 84 84 86 77 89 88 93 96 82
5th 85 85 79 81 76 85 74 79 76
6th 85 80 79 83 74 85 67 80 65
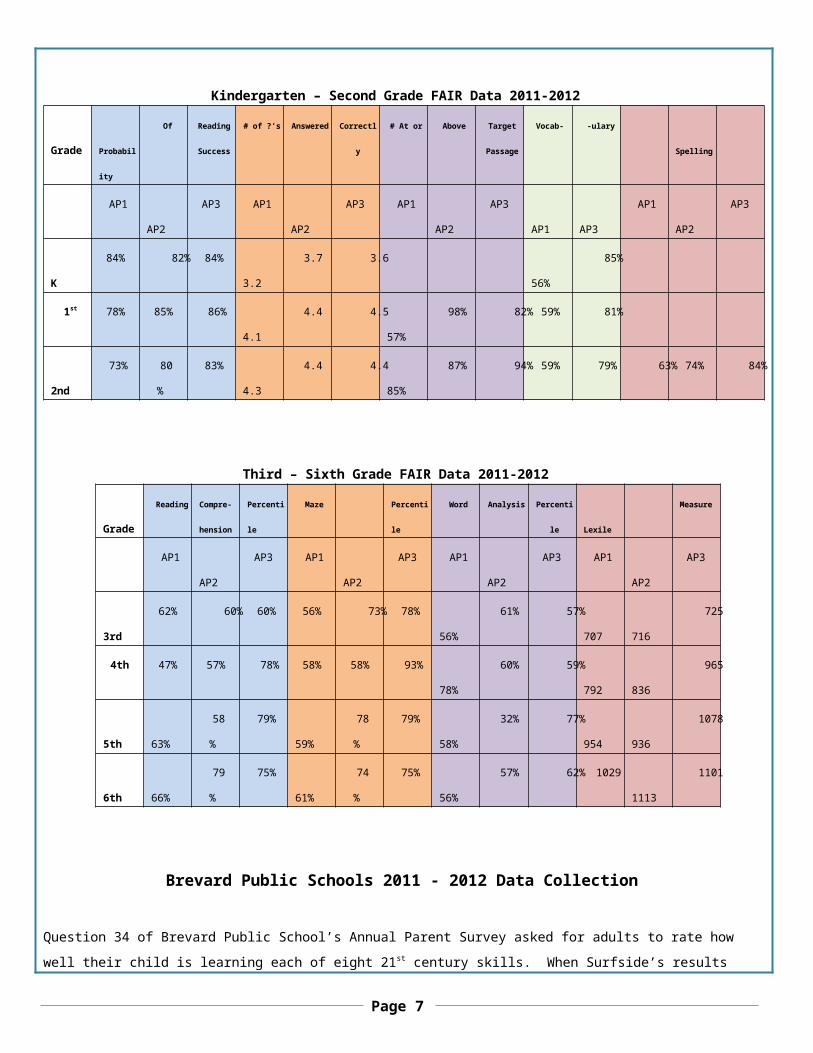
FAIR 2011 - 2012 Data Collection
Kindergarten – Second Grade FAIR Data 2011-2012
Grade Probability Of Reading
Success
# of ?’s Answered Correctly # At or Above Target
Passage
Vocab- -ulary Spelling
AP1 AP2 AP3 AP1 AP2 AP3 AP1 AP2 AP3 AP1 AP3 AP1 AP2 AP3
K 84% 82% 84% 3.2 3.7 3.6 56% 85%
1st 78% 85% 86% 4.1 4.4 4.5 57% 98% 82% 59% 81%
2nd 73% 80% 83% 4.3 4.4 4.4 85% 87% 94% 59% 79% 63% 74% 84%
Third – Sixth Grade FAIR Data 2011-2012
Grade Reading Compre-
hension
Percentile Maze Percentile Word Analysis Percentile Lexile Measure
AP1 AP2 AP3 AP1 AP2 AP3 AP1 AP2 AP3 AP1 AP2 AP3
3rd 62% 60% 60% 56% 73% 78% 56% 61% 57% 707 716 725
4th 47% 57% 78% 58% 58% 93% 78% 60% 59% 792 836 965
5th 63% 58% 79% 59% 78% 79% 58% 32% 77% 954 936 1078
Page 5

6th 66% 79% 75% 61% 74% 75% 56% 57% 62% 1029 1113 1101
Brevard Public Schools 2011 - 2012 Data Collection
Question 34 of Brevard Public School’s Annual Parent Survey asked for adults to rate how well their child is learning each of eight 21st century skills. When Surfside’s results were reviewed we combined the responses of the “excellent” and “good” scores and found three areas that were rated over 90% (Teamwork, Effective Communication, and Meaningful Projects) and Personal Character was rated 89%. The remaining four areas parents had responded “Not Applicable” between the range of 12 and 16% bringing the combined scores of excellent and good into the 70% range. As we are striving to implement higher level thinking skills to raise our students to the next level we will share this chart with our staff to encourage them to include these 21st century skills into their lessons this year.
2012 Brevard Public Schools Parent Survey Results
Parent Survey Results of Question 34
21st Century Skills
Excellent/Good
Combined
Fair Poor Not
Applicable
Practical Use of Technology (presentations, word processing, spreadsheets)
75.4 5.2 3.1 16.2
Real-world issues (financial, environmental, community, civic, healthy lifestyle)
72.1 10.5
3.2 14.2
How to do research (finding books, articles, reliable online information)
71.1 11.6
1.6 15.8
Organization skills (planning, prioritizing, budgeting)
74.6 10.6
2.6 12.2
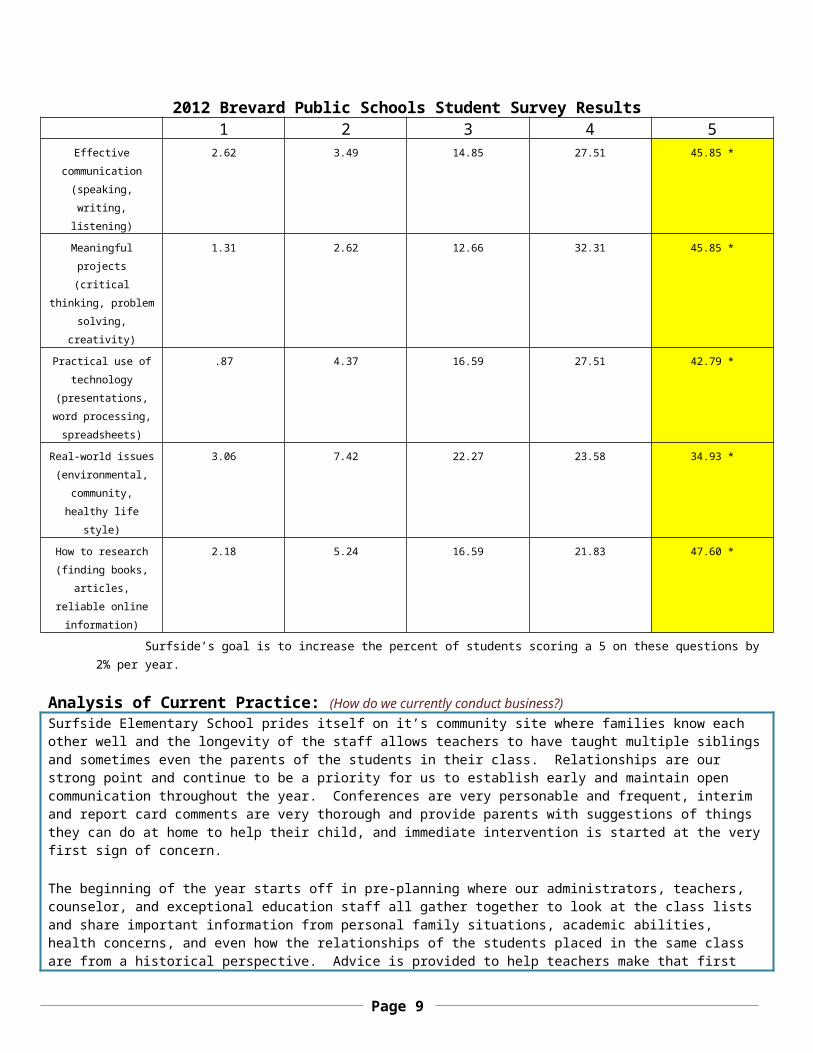
Brevard Public Schools issued a survey to our third through sixth graders in the Spring of 2012. When asked how well they are learning the following 21st Century skills at school they were to respond on a scale of 1 to 5 with 1 being “Never” and 5 being “Often.” Many of these skills correlate closely with the goals of our current School Improvement Plan. Select questions will be highlighted to monitor over the next few years looking for increases in the percentage of students that respond with a 5 as we develop our instructional strategies at Surfside. Each year we’d like to increase each score of a 5 by 2% or more.
Page 6
2012 Brevard Public Schools Student Survey Results1 2 3 4 5
Effective communication
(speaking, writing, listening)
2.62 3.49 14.85 27.51 45.85 *
Meaningful projects (critical thinking, problem solving,
creativity)
1.31 2.62 12.66 32.31 45.85 *
Practical use of technology
(presentations, word processing,
spreadsheets)
.87 4.37 16.59 27.51 42.79 *
Real-world issues (environmental,
community, healthy life style)
3.06 7.42 22.27 23.58 34.93 *
How to research (finding books, articles, reliable
online information)
2.18 5.24 16.59 21.83 47.60 *
Surfside’s goal is to increase the percent of students scoring a 5 on these questions by 2% per year.
Analysis of Current Practice: (How do we currently conduct business?) Surfside Elementary School prides itself on it’s community site where families know each other well and the longevity of the staff allows teachers to have taught multiple siblings and sometimes even the parents of the students in their class. Relationships are our strong point and continue to be a priority for us to establish early and maintain open communication throughout the year. Conferences are very personable and frequent, interim and report card comments are very thorough and provide parents with suggestions of things they can do at home to help their child, and immediate intervention is started at the very first sign of concern.
The beginning of the year starts off in pre-planning where our administrators, teachers, counselor, and exceptional education staff all gather together to look at the class lists and share important information from personal family situations, academic abilities, health concerns, and even how the relationships of the students placed in the same class are from a historical perspective. Advice is provided to help teachers make that first connection and impression with the child and their family when they first meet face to face. This is done in grade level teams and set in our calendar for one of the very first days we are together.
The academic results of the current classes have been analyzed and provided to each teacher in a color format allowing quick understanding of strengths and weaknesses of students in each teacher’s class. Data has been sorted by ability levels in rank order of both reading and math scores for teachers. Our grade levels that are departmentalized receive the rank orders of the entire grade level for their subject and also by homeroom of how the students will come to their classes. This data is broken down and itemized into subcategory information and each child may or may not have shaded areas based on whether or not they mastered “70%” of the content for that subcategory. Before these class lists were finalized for the year, the administration reviewed FCAT results to help place new children accordingly or move around students if and
Page 7

when necessary to better balance our classes allowing teachers similar challenges for their upcoming year.Non-classroom teachers are provided with similar data on our lowest 25% of our population during pre-planning week. This group of teachers looks out for these students all year long and builds their self-esteem, gets to know their hobbies and interests outside of school, and goes out of their way to make these students feel special when they come to their rooms/offices or when they are on supervisory duties across the campus.
As soon as district required assessments are taken and organized into A3, our Assistant Principal and Literacy Coach review our results looking for areas of misunderstanding and helping to find our teachers resources and support to assist them as they remediate any areas of concern. Test questions are reviewed and discussed in team meetings of any questions a large amount of students missed, even looking at what answers the students chose and trying to determine what led them to believe their answer was accurate. If one teacher’s class scored higher on a particular question than others, that instructor shares what instructional efforts they made to help their teammates with ideas when they return to their students to clarify misconceptions. Even though our school is not required to administer the Differentiated Accountability Tests (DA Tests) for Math and Science, we choose to do this anyway allowing us even more data to review to help us with our students. The Scholastic Inventory Computerized Assessments and FAIR results are monitored in a similar fashion.
Last year Surfside ran a heavily attended Academic Support Program that offered classes in reading, math, and science for our struggling students. A strong emphasis was placed on recruiting students with personal telephone calls and then attendance was closely monitored. Phone calls to the home were made when absences occurred so we could help families get in the habit of attending the program. Due to limited funds received from the district due to our high FCAT results this school year, we will only be able to afford half the number of classes we offered last year. Priority placements of students will be those students that scored level 1 and 2 on FCAT and new students that transferred into us that may not have taken the FCAT before, yet have academic concerns.
Grade level meetings are held with administration and support staff before each interim and report card to thoroughly discuss those students that are performing below grade level or that are having concerns in any area. Interventions are documented quickly, Progress Monitoring Plans are created with the parents, and involvement with our guidance department occurs as quickly as possible.
Technology use has been an emphasis at Surfside, along with expenditure purchases in this area increasing our hands-on learning of students with iPads. Teachers voluntarily attended after school sessions last year to share new apps they found for educational purposes and made decisions on which ones the school should purchase. The district technology integrator adopted our school and worked with our 4th grade to model lessons, discover new instructional methods utilizing the i-pads, and generating student and parent interest in this technology method. As our staff experience grew in this area and parents became excited to see their children utilizing these features the interest only sparked further. The school has over 70 iPads for student use. Sets of 10 iPads have been placed throughout the school for easy access. Teachers and students learn together and share educational apps and create projects to demonstrate what they have learned. Additionally, all fourth and fifth grade students created a Google Docs account to create projects on the Google Cloud allowing students to work “virtually” together on projects from home or in different areas of the campus. Students send works in progress and final documents to their teachers and even the principal. This year our third grade team will be joining our “Cloud” experience. Our School Advisory team chose to use some funding to continue to support our efforts in this arena as well as our district technology and curriculum departments. Surfside received the ATTAIN award in 2009 and again in 2012, one of two schools who received this honor for the second time.
Peer collaboration grew last year and teachers opened their doors allowing colleagues to observe their lessons and visited other professionals in our own building learning from some of the best teachers in Brevard. Our primary teachers took on the Literacy Café management style and implemented the Daily Five strategies. Our Literacy Coach modeled lessons, covered classrooms, provided feedback, and assisted with data collection efforts helping our teachers become more comfortable in their abilities to decipher student needs and weaknesses. Heavy phonics remediation efforts across our building and an emphasis on multi-syllabic words allowed our primary students more success as they developed their students reading abilities. Surfside staff has already begun collaborating about the Common Core standards and is making preparations to transition comfortably.
Page 8
Surfside reviews the results of the annual parent client survey each year and is pleased with the responses and comments provided. Some of our new ideas each year come from these surveys and we utilize the feedback to communicate with parents in the way they desire and to set meeting dates and events around the information gained from these results.
Best Practice: (What does research tell us we should be doing as it relates to data analysis above?)
Based on Surfside’s high academic standards, our research was spent looking for proven ways to take our students to an even higher level. From the booklet Moving Schools: Lessons from Exemplary Learners, we read that both research-based and evidence-based strategies contribute to exemplary practices. Dr. Robert Marzano’s research based exemplary strategies document five practices that contribute most to high performance. Surfside will make it a priority to increase the amount of time teachers spend instructing with these strategies in mind and planning their lessons around the idea of taking our students to an even higher level striving to earn results at the above average range in all subject areas on state required assessments. This will assist as we move into Common Core curriculum and standards.
Percentile Gain from Instructional Strategies Researched by Dr. Robert Marzano
Rank Strategy Effect Size Percentile Gain1 Extending Thinking Strategies 1.61 452 Summarizing 1.00 343 Vocabulary In Context .85 334 Advance Organizers .73 285Non- Verbal Representations .65 25
The instructional staff at Surfside is very talented and creative and has been observed utilizing several of these strategies across the curriculum. The uses of these strategies vary by teacher, across grade levels, and among subject areas. It is the goal of Surfside’s staff this year to learn from one another and build our individual expertise levels by sharing best practices in a safe, supportive environment. A quote from the attendance at the summer workshop will be kept in mind as we make it a priority to go forth with this notion: “Not having and resting, but growing and becoming, is the character of a high performing learning culture.” Professional Learning Community time will continue to be a part of our school’s regular routine as agreed upon early in the year with our faculty. As teachers self-assess their comfort levels with these high yield instructional strategies, they will choose a stretch goal for themselves to incorporate a strategy of their choice into their Professional Development Plan in an area their personal data shows a need for further development.
Four staff members of Surfside Elementary attended a summer workshop titled Creating a High-Performance Learning Culture. These faculty members created an action plan from information gained through their time together and intend to lead our staff through the stages of this plan throughout this school year during scheduled faculty meeting times and building professional development days. As our staff receives training we will also provide them with resources such as articles, exerts from books, videos, and other professional development materials both in hard copies but also stored electronically on our school server. Surveys from this program will be administered to our faculty both at the beginning of the year and again at the end of the
Page 9

year to see what growth has been made. It is our intent to combine this program along with surveys we create for our staff to self-assess each teacher’s comfort level of the above noted instructional strategies from Dr. Marzano’s research. Our overall goal as a school will be to increase our confidence and comfort implementing lessons and projects that incorporate these strategies. During this first year of staff training and monitoring our personal growth, it is our intent to increase our post survey results of our faculty survey by 28 points which would equate to each instructional staff member growing professionally by one point on their post survey. Our overall goal is for Surfside teachers to be implementing these five strategies with confidence by 2014-2015 to teach the Common Core standards.
Surfside Elementary Instructional Pre-Survey Results, September 2012
(# inside each box reports how many Surfside teachers selected bolded digit as their answer on the pre-survey)
28 Staff Responses
25 points possible per survey (28
responses x 25 pts./survey = 700 points possible)
5 - I feel very confident using
this strategy and am comfortable
sharing best practices and
modeling for my peers
4 – I understand and fully
implement this strategy in my
classroom
3 – I understand this strategy, but I need to practice
using it in my classroom
2 – I can explain this strategy, but
I am not fully confident that I
can use it
1 – I do not understand this
strategy. I do not currently use it
Extending Thinking
Strategies84 points
0 4 20 4 0
Summarizing Across the Lesson
73 points
0 1 17 8 2
Vocabulary in Context
84 points
1 1 23 3 0
Advance Organizers76 points
0 2 17 8 1
Non-Verbal Representations
79 points
0 4 17 5 2
Sum of all bolded
numbers is 396
1 response x 5 points = 5
points
12 response x 4 points each = 48
points
94 response x 3 points each = 282 points
28 response x 2 points each = 56
points
5 response x 1 point each = 5
points
If every teacher acquires more knowledge on one strategy this year and increases their self-assessment score
a full level by May 2013, we should earn 28 more points in our post survey results. 396 + 28 = 424 points = Goal for Post Survey Results
Page 10

Noticing Summarizing is the area our faculty rated themselves the lowest, we have scheduled a training session with our District Resource Teacher for Writing, Teresa Phelps, to help our staff develop a repertoire of strategies to incorporate more instructional plans in this arena. We have also scheduled Jennifer Cockrell, Brevard’s Language Arts Resource Teacher, to provide our staff with a training session on the six shifts toward Common Core language and instruction, which will keep our teachers on the cutting edge of awareness of state standards. Our primary teachers have already been in thorough training of Common Core standards and our intermediate teachers are provided advance information to help them understand what is coming their way. During faculty meetings we will have mini presentations by our own teachers who volunteer to share a strength area or lesson as well as view professional development video clips as we strive to increase our comfort with these high yield instructional strategies. While teachers create their Professional Growth Plan goal and strategies they will review their personal data from last year’s student academic results and/or Surfside Elementary’s overall scores and their self-assessment survey results. They will individually select a strategy they’d like to develop further and may create their own strategies based on their unique needs. The overall goal is for each teacher to strive for continuous improvement of their instructional techniques in order for our students to increase their skills to higher levels of understanding and mastery. As we continue to increase the time our students spend using technology we will encourage our teachers to look at our technology resources and how they can be utilized with the instruction of these exemplary strategies. Reference to our chart on our parent survey results on the 21st century skills will also be a resource we direct teachers to when choosing strategies for their PGP’s and their instructional goals for themselves.
CONTENT AREA: Reading Math Writing Science Parental
InvolvementDrop-out Programs
Language Arts
Social Studies
Arts/PE Other: 21st Century Skills
School Based Objective: (Action statement: What will we do to improve programmatic and/or instructional effectiveness?)Every teacher at Surfside Elementary will increase awareness and use of Dr. Max Thompson’s and Dr. Marzano’s research and evidenced based instructional strategies. Continuous improvement will be a priority through collaborating and connecting high yield instructional strategies and common core standards to the planning and delivery of more challenging lessons. Staff members will self-assess their knowledge, comfort level, and time instructing with these strategies throughout the year as we monitor our progress levels and assist one another through our regular Professional Learning Community efforts.
Strategies: (Small number of action oriented staff performance objectives)
Barrier Action Steps Person Responsible
Timetable Budget In-ProcessMeasure
1. Limited knowledge level of terminology, design, & outcome measures of exemplary
1a. Peer Coaching Team of attendees of summer institute will lead training sessions during faculty meeting
1a. Peer Coaching Team (PCT) members (Surfside’s staff that attended the summer High Performing Learning Culture
First Semester $0.00 Survey Response results will help training team plan future instructional opportunities
Page 11

instructional strategies
sessions
1b. Documents and reference items will be placed on Surfside’s server for immediate access to all employees
workshop)
1b. PCT members, Technology Specialist, and Administration
Administration and peer observations
PLC Group Memory sheets
Server Resources
2. Allocated Time for Professional Collaboration
2a. District and school items that can be communicated with staff through electronic mail will be removed from faculty meeting time
2b. A school-wide calendar will be created early in the year for teachers to reserve scheduled time for collaboration
2c. Substitute funds will be intentionally set aside to allow teachers to schedule observation time of peers during the instructional day in areas of personal growth needs and desires
2a. Administration
2b. School Leadership Team
2c. Bookkeeper and Administration
2a. Yearlong
2b. Yearlong
2c. Yearlong
$0.00
2b. $0.00
2c. Substitute funds of
approximately $600.00
2a. Faculty Meeting Agendas
Electronic Mail Communication
2b. Collaboration Team Calendar
Lowest 25% Team Rosters
PLC Team Feedback Sheets
2c. Substitute calendar
Teacher Sign-Up sheets for substitute coverage
EVALUATION – Outcome Measures and Reflection Qualitative and Quantitative Professional Practice Outcomes: (Measures the level of
Page 12

implementation of the professional practices throughout the school)
Professional Growth Plans of Surfside teachers will be directly related to personal goals and outcome measures documenting high yield instructional strategies they choose to incorporate into their lesson plans. Observations by peers and administrators will compliment the efforts noted and suggest further ideas to continuously improve instructional practices. Teachers will complete personal self – assessment surveys at the start, middle, and end of this school year to help us monitor growth in teacher’s comfort and ability with implementing these instructional strategy techniques. An overall increase of 28 points earned on our employee post survey will demonstrate our outcome measure goal for May, 2013.
Qualitative and Quantitative Student Achievement Expectations: (Measures of student achievement)
Students will be issued the Brevard Public Schools survey in May, 2013. We will specifically take note of the responses to the 21st Century Learning Skills components that relate most closely to Dr. Marzano’s exemplary instructional strategies (see chart in Data Analysis section of this plan). Comparing results with the 2012 BPS student survey, our outcome measure of intent is to increase each skill receiving a response of a “5” by 2%. Ultimate student performance results on future FCAT 2.0 assessments will demonstrate an increase in the total percentage of students earning levels 4 and 5 in each subject area assessed as well as increase our percentages of students that make annual learning gains.
APPENDIX A
(ALL SCHOOLS)
Reading Goal1.
2012 Current Level of
Performance(Enter percentage information and the number of students that percentage reflects ie.
28%=129 students)
2013 Expected Level of
Performance(Enter percentage
information and the number of students that percentage reflects ie. 31%=1134 students)
Anticipated Barrier(s):1.
Strategy(s):1.
FCAT 2.0Students scoring at Achievement Level 3
Barrier(s): State cut-score changes of FCAT 2.0
Strategy(s):1. Continue to share information related to scoring criteria, measured standards, and test item specifications to teachers as regular as they are shared from the state.
88% = 208/236 students
90% = 192/213 students
Page 13

Florida Alternate Assessment: Students scoring at levels 4, 5, and 6 in Reading
Barrier(s):
Strategy(s):1.
NA NA
FCAT 2.0Students scoring at or above Achievement Levels 4 and 5 in Reading
Barrier(s): Limited knowledge level of terminology, design, & outcome measures of exemplary instructional strategies
Strategy(s):1. Peer Coaching Team of attendees of summer institute will lead training sessions during faculty meeting sessions
61% = 144/236 students64% - 3rd
66% - 4th
55% - 5th
60% - 6th
63% = 135/213 students
Florida Alternate Assessment:Students scoring at or above Level 7 in Reading
Barrier(s):
Strategy(s):1.
NA NA
Florida Alternate Assessment:Percentage of students making learning Gains in Reading
Barrier(s):
Strategy(s):1.
NA NA
FCAT 2.0Percentage of students in lowest 25% making learning gains in Reading
Barrier(s): By only counting level 1’s and 2’s this coming year, it will leave a very small number of students in this category. Therefore, each child counts close to 10 percentage points. Seeing our history from last year, these students do make gains, yet not the amount of points required by our state. In many cases last year our students were only 1-2 points away from earning the Annual Learning Gain. Children at Surfside that typically fall in this category are our most transient students and those that have IEP’s documenting a learning disability.
Strategy(s):1. Intensive Remediation in small group or individual attention from
the classroom teacher is necessary on a consistent weekly schedule.
2. Early parent involvement with creation of PMP’s and/or development of documentation necessary to bring to Multi-Tiered System of Support Leadership Team (MTSS) for discussion and assistance.
3. Earlier start to Surfside’s Academic Support Program to remediate quickly before the year gets too far underway. Strongly encourage these children to participate in this program.
4. Implement high-yield instructional strategies.5. Work in collaborative teams to discuss strategies that appear to
work for individual students.
Florida Alternate Assessment:Percentage of students in Lowest 25% making learning gains in ReadingBarrier(s):
Strategy(s):1.
70% = 30/43 students
(counting Level’s 1, 2, and 3’s
from previous year)
NA
53% = 8/15 students
(state will only count our
Level 1’s and 2’s next year
leaving us fewer number of students to enter into this calculation)
NA
Ambitious but Achievable Annual Measurable Objectives (AMOs). In six years school will reduce their Achievement Gap by 50%:
88% of Surfside students scored Target AMO’s
Page 14

Baseline data 2010-11:
85% of Surfside students scored satisfactory in reading
Hispanic: 95% White: 84% Students with Disabilities: 61%Economically Disadvantaged: 72%
No other subgroups noted
satisfactory in reading in 2012
(3% increase and 1% above our Target AMO of
86%)
Our White and Economically
Disadvantaged subgroups surpassed their Target AMO’s
(White: Target was 85% - we earned 88%, ED: Target was 74% - we
earned 84%)
Our Hispanic and SWD subgroups did not meet Target AMO’s
(see below)
*Note: Our Hispanic subgroup had 87% at
satisfactory levels – only 1% below our entire school percentage,
however they decreased from the 95% they had
the previous year.
set for 2013:
Surfside: 88%
Hispanic: 96% White: 87%SWD: 68%ED: 77%
Student subgroups by ethnicity NOT making satisfactory progress in reading:
White:
Black:
Hispanic:
Asian:
American Indian:
Enter numerical data for current level of performance
NA NA
13%
NANA
Enter numerical data for expected level of
performance
NANA
4% (only 6 kids will count for us in this category this year. The only way to make this AMO is for all to earn a 3 or higher. Each child will count as 17%. If one child earns a
two we drop to 83%)NANA
English Language Learners (ELL) not making satisfactory progress in ReadingBarrier(s):
Strategy(s):1.
NA NA
Students with Disabilities (SWD) not making satisfactory progress in ReadingBarrier(s):
Strategy(s):1. Consistently follow each child’s IEP, regularly communicate with the family sharing successes and suggestions for home assistance, and have the entire faculty work to build their self-esteem and passion for learning
50% 32%Surfside has 11 students that will fall in this category this
year.
To meet this target 8 of the 11 must earn a 3 or higher which would equate to 73% meeting standards (our AMO
was set at 68%).
Each child in this category counts as 9%
Economically Disadvantaged Students not making satisfactory progress in ReadingBarrier(s):
Strategy(s):1. Intensive one on one help as frequent as possible, enrollment into Academic Support Program, self-esteem building by all members of our faculty, continuous praise and recognition of each small gain
16% 23%Surfside has 33 students that will fall in this category this
year.
To meet this target 26 of the 33 must earn a 3 or higher which would equate to 79% meeting standards (our AMO
was set at 77%).
Each child in this category
Page 15

counts as 3%
Reading Professional DevelopmentPD Content/Topic/Focus Target
Dates/ScheduleStrategy(s) for follow-up/monitoring
Unpacking the Common Core Standards
Ongoing for All Peer and administrative observation of classroom instruction,
collaboration with teammates and peers
High Performing Learning Culture and Exemplary Practices
Ongoing for All Peer and administrative observation of classroom instruction,
collaboration with teammates and peers
CELLA GOAL Anticipated Barrier
Strategy Person/Process/
Monitoring2012 Current Percent of Students Proficient in Listening/ Speaking:
Academic concerns
beyond ELL may be present with both students
Continual discussions and review of these two students at Individual
Problem Solving Team meetings and regular ELL review meetings
Classroom Teachers, IPST members, ELL
Team Members, monitoring of ELL
folders and IPST data2012 Current Percent of Students Proficient in Reading:
Academic concerns
beyond ELL may be present with both students
Continual discussions and review of these two students at Individual
Problem Solving Team meetings and regular ELL review meetings
Classroom Teachers, IPST members, ELL
Team Members, monitoring of ELL
folders and IPST data2012 Current Percent of Students Proficient in Writing:
Academic concerns
beyond ELL may be present with both students
Continual discussions and review of these two students at Individual
Problem Solving Team meetings and regular ELL review meetings
Classroom Teachers, IPST members, ELL
Team Members, monitoring of ELL
folders and IPST data
Mathematics Goal(s):1. According to Victoria Hickey, only the current and expected level of performance columns need to be completed in each appendix in order to meet the DOE requirements.
2012 Current Level of
Performance(Enter
percentage information and the number of students that percentage
reflects)
2013 Expected Level of
Performance(Enter percentage information and the number of students that percentage
reflects)
0% = 2/2 students
0% = 2/2 students
0% = 2/2 students
Page 16

Anticipated Barrier(s):1.
Strategy(s):1.
FCAT 2.0Students scoring at Achievement Level 3Barrier(s): State cut-score changes of FCAT 2.0
Strategy(s):1. Continue to share information related to scoring criteria, measured standards, and test item specifications to teachers as regular as they are shared from the state.
90% = 210/236 students
92% = 196/213 students
Florida Alternate Assessment: Students scoring at levels 4, 5, and 6 in MathematicsBarrier(s):
Strategy(s):1.
NA NA
FCAT 2.0Students scoring at or above Achievement Levels 4 and 5 in Mathematics
Barrier(s): Limited knowledge level of terminology, design, & outcome measures of exemplary instructional strategies
Strategy(s):1. Peer Coaching Team of attendees of summer institute will lead training sessions during faculty meeting sessions
61% = 144/236 students49% - 3rd
85% - 4th
62% - 5th
62% - 6th
63% = 135/213 students
Florida Alternate Assessment:Students scoring at or above Level 7 in MathematicsBarrier(s):
Strategy(s):1.
NA NA
Florida Alternate Assessment:Percentage of students making learning Gains in MathematicsBarrier(s):
Strategy(s):1.
NA NA
FCAT 2.0Percentage of students in lowest 25% making learning gains in Mathematics
Barrier(s): By only counting level 1’s and 2’s it leaves a very small number of students in this category therefore each child counts close to 10 percentage points. Seeing our history from last year, these students do make gains, yet not the amount of points required by our state. In many cases last year, our students were only 1-2 points away from earning the Annual Learning Gain.
Strategy(s):1. Intensive Remediation in small group or individual
attention from the classroom teacher is necessary on a consistent weekly schedule.
2. Early parent involvement with creation of Progress Monitoring Plan’s and/or development of documentation necessary to bring to Child Study Team for discussion and assistance.
3. Earlier start to Surfside’s Academic Support Program to remediate quickly before the year gets too far underway. Strongly encourage these children to participate in this program.
4. Implement high-yield instructional strategies.
81% = 35/43 students
(counting Level’s 1, 2, and 3’s from
previous year)
50% = 7/14 students
(state will only count
our Level 1’s and 2’s next year leaving
us fewer number of students to
enter into this calculation)
Page 17

5. Work in collaborative teams to discuss strategies that appear to work for individual students.
Florida Alternate Assessment:Percentage of students in Lowest 25% making learning gains in MathematicsBarrier(s):
Strategy(s):1.
NA NA
Ambitious but Achievable Annual Measurable Objectives (AMOs). In six years school will reduce their Achievement Gap by 50%:
Baseline Data 2010-11:
84% of Surfside students scored satisfactory in Mathematics
Hispanic: 90% White: 85% Students with Disabilities: 56%Economically Disadvantaged: 76%
No other subgroups noted
90% of Surfside students scored satisfactory in math in 2012
(6% increase and 5% above our
Target AMO of 85%)
Our White, SWD, and Economically Disadvantaged
subgroups met or surpassed their Target AMO’s
(White: Target was 86% - we earned
90%, SWD: Target was 60% - we
earned 70%, ED: Target was 78% - we earned 78%)
Our Hispanic subgroup did not meet their Target AMO’s (see below)
*Note: Our Hispanic subgroup had 87%
at satisfactory levels – only 3% below our entire
school percentage, however they
decreased from the 90% they had the
previous year.
Target AMO’s set for 2013:
Surfside: 87%
Hispanic: 92% White: 88%SWD: 63%ED: 80%
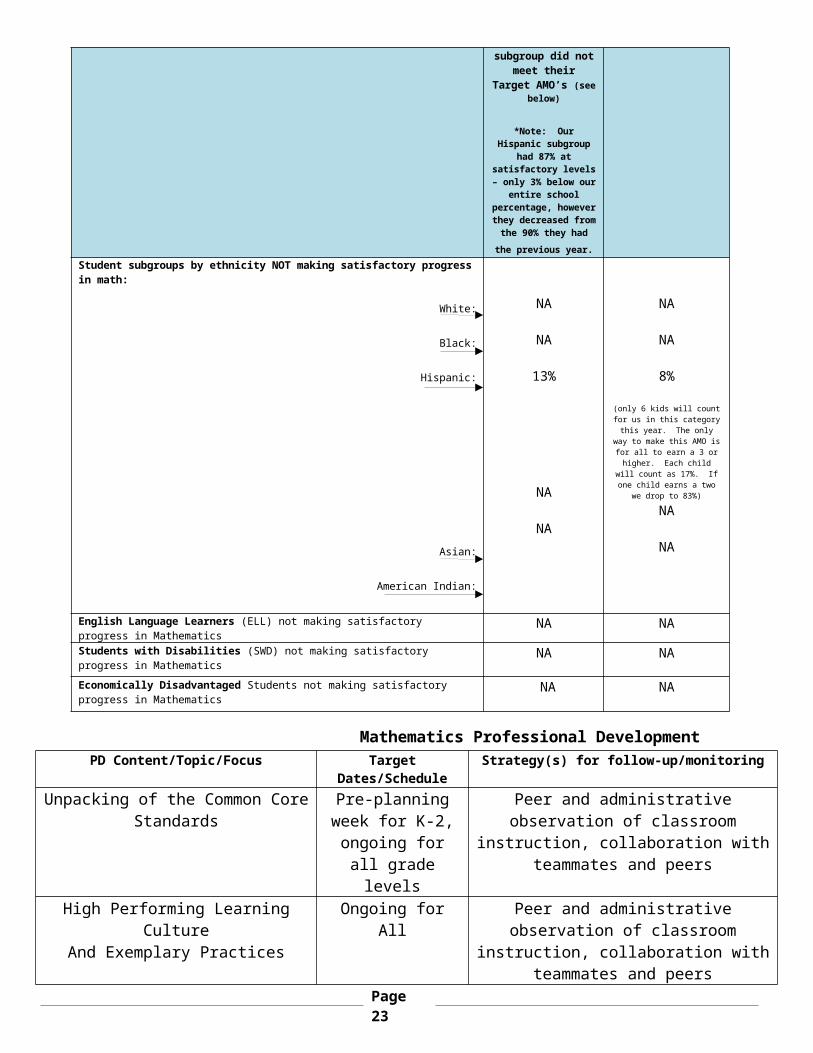
Student subgroups by ethnicity NOT making satisfactory progress in math:
White:
Black:
Hispanic:
Asian:
American Indian:
NA
NA
13%
NA
NA
NA
NA
8%(only 6 kids will count for us in this category this year. The only way to make this AMO is for all to earn a 3 or higher. Each child will count as 17%. If one child earns a
two we drop to 83%)NA
NA
English Language Learners (ELL) not making satisfactory progress in Mathematics
NA NAStudents with Disabilities (SWD) not making satisfactory progress in Mathematics
NA NA
Economically Disadvantaged Students not making satisfactory progress NA NA
Page 18

in Mathematics
Mathematics Professional DevelopmentPD Content/Topic/Focus Target
Dates/ScheduleStrategy(s) for follow-up/monitoring
Unpacking of the Common Core Standards
Pre-planning week for K-2, ongoing for all grade levels
Peer and administrative observation of classroom instruction,
collaboration with teammates and peers
High Performing Learning CultureAnd Exemplary Practices
Ongoing for All Peer and administrative observation of classroom instruction,
collaboration with teammates and peers
Writing 2012 Current Level of Performance
(Enter percentage information and the number of students
that percentage reflects)
2013 Expected Level of
Performance(Enter percentage information and the number of students that percentage
reflects)Barrier(s):
Strategy(s):1.
FCAT: Students scoring at Achievement level 3.0 and higher in writing 92% = 50/53
students94% = 48/51
studentsFlorida Alternate Assessment: Students scoring at 4 or higher in writing NA NA
Science Goal(s)(Elementary and Middle)
1.
2012 Current Level of Performance
(Enter percentage information and the number of students
that percentage reflects)
2013 Expected Level of
Performance(Enter percentage information and the number of students that percentage
reflects)Barrier(s):Strategy(s):1.FCAT 2.0 Students scoring at Achievement level 3 in Science: 92% = 60/65
students93% = 52/56
students Florida Alternate Assessment: Students scoring at levels 4, 5, and 6 in Science
NA NAFCAT 2.0 Students scoring at or above Achievement Levels 4 and 5 in Science: 51% = 33/65
students53% = 30/56
studentsFlorida Alternate Assessment:Students scoring at or above Level 7 in Reading
NA NA
Page 19

Science Goal(s)(High School)
1.
2012 Current Level of Performance
(Enter percentage information and the number of students
that percentage reflects)
2013 Expected Level of
Performance(Enter percentage information and the number of students that percentage
reflects)Barrier(s):
Strategy(s):1.
Florida Alternate Assessment: Students scoring at levels 4, 5, and 6 in ScienceFlorida Alternate Assessment:Students scoring at or above Level 7 in ScienceStudent subgroups by ethnicity (White, Black, Hispanic, Asian, American Indian) not making satisfactory progress in Algebra.
White:
Black:
Hispanic:
Asian:
American Indian:
English Language Learners (ELL) not making satisfactory progress in AlgebraStudents with Disabilities (SWD) not making satisfactory progress in AlgebraEconomically Disadvantaged Students not making satisfactory progress in Algebra
Page 20

APPENDIX B
(SECONDARY SCHOOLS ONLY)
Algebra 1 EOC Goal 2012 Current Level of Performance
(Enter percentage information and the number of students
that percentage reflects)
2013 Expected Level of Performance
(Enter percentage information and the number of students
that percentage reflects)
Barrier(s):
Strategy(s):1.
Students scoring at Achievement level 3 in Algebra:
Students scoring at or above Achievement Levels 4 and 5 in Algebra:
Ambitious but Achievable Annual Measurable Objectives (AMOs). In six years school will reduce their Achievement Gap by 50%: Baseline Data 2010-11
Student subgroups by ethnicity (White, Black, Hispanic, Asian, American Indian) not making satisfactory progress in Algebra.
White:
Black:
Hispanic:
English Language Learners (ELL) not making satisfactory progress in AlgebraStudents with Disabilities (SWD) not making satisfactory progress in AlgebraEconomically Disadvantaged Students not making satisfactory progress in Algebra
Geometry EOC Goal 2012 Current Level of Performance (Enter
2013 Expected Level of Performance
Page 21

percentage information and the number of students
that percentage reflects)
(Enter percentage information and the number of students
that percentage reflects)
Barrier(s):
Strategy(s):1.
Students scoring at Achievement level 3 in Geometry:
Students scoring at or above Achievement Levels 4 and 5 in Geometry:
Ambitious but Achievable Annual Measurable Objectives (AMOs). In six years school will reduce their Achievement Gap by 50%: Baseline Data 2010-11
Student subgroups by ethnicity (White, Black, Hispanic, Asian, American Indian) not making satisfactory progress in Geometry.
White:
Black:
Hispanic:
English Language Learners (ELL) not making satisfactory progress in GeometryStudents with Disabilities (SWD) not making satisfactory progress in GeometryEconomically Disadvantaged Students not making satisfactory progress in Geometry
Biology EOC Goal
2012 Current Level of
Performance(Enter
percentage information
and the number of
students that percentage
reflects)
2013 Expected Level of
Performance(Enter
percentage information
and the number of
students that percentage
reflects)Students scoring at Achievement level 3 in Biology:Students scoring at or above Achievement Levels 4 and 5 in Biology:
Civics EOC 2012 Current Level of
2013 Expected Level of
Page 22
Performance(Enter
percentage information
and the number of
students that percentage
reflects)
Performance(Enter
percentage information
and the number of
students that percentage
reflects)Students scoring at Achievement level 3 in Civics:Students scoring at or above Achievement Levels 4 and 5 in Civics:
U.S. History EOC
2012 Current Level of
Performance(Enter
percentage information
and the number of
students that percentage
reflects)
2013 Expected Level of
Performance(Enter
percentage information
and the number of
students that percentage
reflects)Students scoring at Achievement level 3 in U. S. History:Students scoring at or above Achievement Levels 4 and 5 in U. S. History:
Science, Technology, Engineering, and
Mathematics (STEM) Goal(s)
Anticipated Barrier
Strategy Person/Process/Monitoring
Based on the analysis of school data, identify and define areas in need of improvement:
Goal 1:
Goal 2:
Career and Technical Education (CTE) Goal(s)
Anticipated Barrier
Strategy Person/Process/Monitoring
Based on the analysis of school data, identify and define areas in need of improvement:
Page 23

Goal 1:
Goal 2:
Additional Goal(s) Anticipated Barrier
Strategy Person/Process/Monitoring
Based on the analysis of school data, identify and define areas in need of improvement:
Goal 1:
Goal 2:
APPENDIX C
(TITLE 1 SCHOOLS ONLY)
Highly Effective Teachers Describe the school based strategies that will be used to recruit and retain high quality, highly effective teachers to the school.
Descriptions of Strategy Person Responsible Projected Completion Date
1.2.3.
Non-Highly Effective Instructors Provide the number of instructional staff and paraprofessionals that are teaching out-of-field and/or who are not highly effective. *When using percentages, include the number of teachers the percentage represents (e.g., 70% [35]).
Number of staff and paraprofessionals that are teaching out-of-field/and who are not highly
effective
Provide the strategies that are being implemented to support the staff in becoming
highly effective
For the following areas, please write a brief narrative that includes the data for the year 2011-12 and a description of changes you intend to incorporate to improve the data for the year 2012-13.
MULTI-TIERED SYSTEM OF SUPPORTS (MTSS)/RtI (Identify the MTSS leadership team and it role in development and implementation of the SIP along with data sources, data management and how staff is trained in MTSS)
Surfside’s psychologist and staffing specialist from last year were not reassigned to us for this current year. Fortunately the team members that were assigned to us were at one point in their pasts a part of Surfside Elementary’s culture and are excited to once again be a part of our team. Other members of our MTSS leadership team are our administrators, Literacy Coach, and ESE teachers. Initial conversations with our new teammates were positive and productive sharing
Page 24

ideas and practices for the upcoming months. Chair of our MTSS team, Surfside’s Guidance Counselor regularly attends district meetings and shares information timely and thoroughly with our key leaders and entire faculty. She is critical in our beginning of the year planning stages with our ESE schedules of services and plans for working with our lowest 25% annually. She maintains a detailed spreadsheet tracking every student involved in the MTSS process. She provides reminders and new training as district changes occur. The MTSS leadership team ensures Surfside meets all requirements within the sixty- day timeline requirements and follows the MTSS process with fidelity. The members of this team are scheduled for a faculty meeting presentation to our staff within the first two months of school to help our staff start the year knowing the routines and processes for 2012-2013.
PARENT INVOLVEMENT: Surfside Elementary’s goal for parent involvement last year was to acquire 6,000 or more volunteer hours documenting how active our community support is annually. We were pleased to have surpassed this goal earning 6,883 volunteer hours during the 2011-2012 school year. Our newly elected PTO Board members have already increased the number of members in attendance at our PTO meetings through their publicity efforts of a thorough newsletter monthly and the creation of an electronic communication site for parents. Administration also recruited faculty members to assist with childcare efforts during PTO meetings allowing more parents to attend and for the efficiency of the meetings to increase.
ATTENDANCE: (Include current and expected attendance rates, excessive absences and tardies)Surfside Elementary’s attendance rate for the previous school year was 96,23%, which was the fifth highest elementary school percentage in Brevard County. Our attendance clerk with run a report before every interim and report card (every four weeks) of excessive absences and tardies and our guidance counselor will reach out to families and students to offer support and encouragement to improve their attendance and punctuality. If progress is not made with her efforts, administration will pursue further efforts and an Attendance Appeal meeting would be conducted to put an action plan in place for every family with severe concerns.
SUSPENSION:Surfside Elementary’s suspension rate was one of our highest last year due to only a few students causing enough disruption to warrant the process of pursuing enrollment into our Alternative School setting in Brevard County. We do not foresee any reason why this rate wouldn’t significantly decrease this year given our current student population. Early intervention in discipline matters and enlisting of parental support are priorities for all Surfside employees.
DROP-OUT (High Schools only):
POSTSECONDARY READINESS: (How does the school incorporate students’ academic and career planning, as well as promote student course selections, so that students’ course of study is personally meaningful? Describe strategies for improving student readiness for the public postsecondary level based on annual analysis of the High School Feedback Report.)
Page 25