accountabilityandtesting.brevardschools.orgaccountabilityandtesting.brevardschools.org/school... ·...
TRANSCRIPT

Brevard County Public SchoolsSchool Improvement Plan
2012-2013
Name of School: Area:
Principal: Area Superintendent:
SAC Chairperson:
Superintendent: Dr. Brian Binggeli
Mission Statement: To provide the highest quality of education for all students.
Vision Statement:
Creating a quality world one child at a time.
Indialantic Elementary South Area
Dr. Richard Dunkel Dr. Mark Mullins
Kathleen Register
Page 1

Brevard County Public SchoolsSchool Improvement Plan
2012-2013RATIONAL – Continuous Improvement Cycle Process
Data Analysis from multiple data sources: (Needs assessment that supports the need for improvement)
Over the past three years, there have been several shifts in the configuration of state testing in Florida. In 2011, the state adopted the use of FCAT 2.0, which increased the rigor and expectations for students. Likewise, we are now preparing for the implementation of Common Core State Standards, which will use The Partnership for Assessment of Readiness for College and Careers (PARCC) as an end of year assessment tool to monitor adequate yearly progress. This will be fully in place in the 2014-2015 school year. Furthermore, in 2012, scoring for FCAT Writes administered to fourth grade students increased its rigor. The analysis of the data over the past three years, indicates that our learning gains are not improving at the rate of our proficiency levels. For example, our level 5 students in both reading and math are our lowest performing subgroup in terms of learning gains. Additionally, the lowest 25% in reading perform at about the same level as all students making learning gains, however it appears that the gap in performance is more pronounced in the area of math. Furthermore, it has been noted during classroom walkthroughs that the instructional focus was geared toward support for the lowest 25% of students and not necessarily focused on strategies that target higher level students’ growth. Also, collaboration meetings focused on creating plans to scaffold and reinforce skills for our lowest performing students without a plan for increased rigor for the higher students. Reading
Learning gains for student at Level 5 All students scoring 3 and above in reading09-10 54% made learning gains in grades 4-6. 09-10 84% of students proficient or higher in grades 3-610-11 68% made learning gains in grades 4-6. 10-11 96% of students proficient or higher in grades 3-6 11-12 59% made learning gains in grades 4-6. 11-12 84% of students proficient or higher in grades 3-6 Lowest 25% making learning gains All students making annual learning gains in reading 09-10 71% made learning gains in grades 4-6. 09-10 70% of students in grades 4-610-11 81% made learning gains in grades 4-6. 10-11 81% of students in grades 4-611-12 66% made learning gains in grades 4-6. 11-12 68% of students in grades 4-6Math
Learning gains for student at level 5 All students scoring 3 and above in math
Page 2

09-10 62% made learning gains in grades 4-6. 09-10 86% of students proficient or higher in grades 3-6 10-11 55% made learning gains in grades 4-6. 10-11 95% of students proficient or higher in grades 3-6 11-12 52% made learning gains in grades 4-6. 11-12 83% of students proficient or higher in grades 3-6
Lowest 25% making learning gains All students making annual learning gains in09-10 55% made learning gains in grades 4-6. 09-10 68% of students in grades 4-610-11 86% made learning gains in grades 4-6. 10-11 77% of students in grades 4-611-12 62% made learning gains in grades 4-6. 11-12 71% of students in grades 4-6
Science
09-10: 76% at level 3 or above 10-11: 86% at level 3 or above11-12: 78% at level 3 or aboveWriting
09-10: 94% at level 4 or above 10-11: 100% at level 4 or above11-12: 95% at level 3 or above
FAIR Data
Kindergarten
09-10: 84% of Kindergarten students were proficient in listening comprehension10-11: 89% of Kindergarten students were proficient in listening comprehension11-12: 91% of Kindergarten students were proficient in listening comprehensionFirst Grade
09-10: 36% of first grade students reading on grade level according to FAIR 10-11: 61% of first grade students reading on grade level according to FAIR 11-12: 60% of first grade students reading on grade level according to FAIRSecond Grade
09-10: 49% of second grade students reading on grade level according to FAIR10-11: 74% of second grade students reading on grade level according to FAIR11-12: 79% of second grade students reading on grade level according to FAIR
Third Grade
Page 3
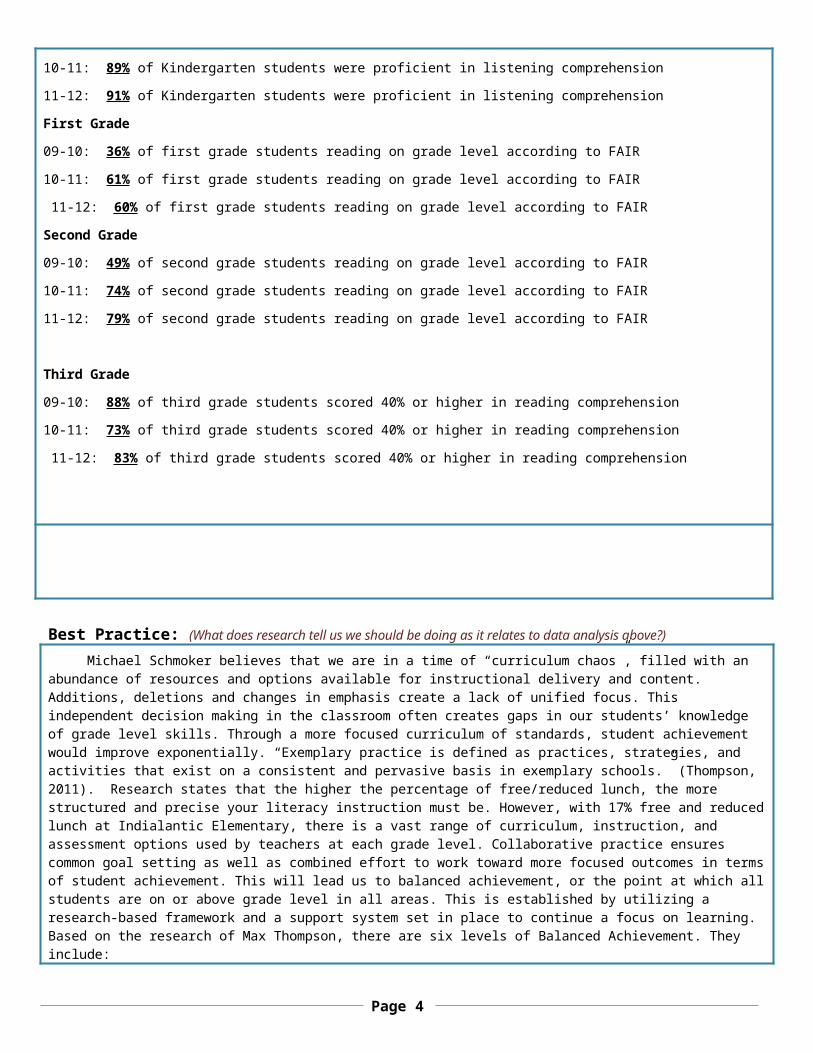
09-10: 88% of third grade students scored 40% or higher in reading comprehension10-11: 73% of third grade students scored 40% or higher in reading comprehension 11-12: 83% of third grade students scored 40% or higher in reading comprehension
Best Practice: (What does research tell us we should be doing as it relates to data analysis above?)
Michael Schmoker believes that we are in a time of “curriculum chaos”, filled with an abundance of resources and options available for instructional delivery and content. Additions, deletions and changes in emphasis create a lack of unified focus. This independent decision making in the classroom often creates gaps in our students’ knowledge of grade level skills. Through a more focused curriculum of standards, student achievement would improve exponentially. “Exemplary practice is defined as practices, strategies, and activities that exist on a consistent and pervasive basis in exemplary schools.” (Thompson, 2011). Research states that the higher the percentage of free/reduced lunch, the more structured and precise your literacy instruction must be. However, with 17% free and reduced lunch at Indialantic Elementary, there is a vast range of curriculum, instruction, and assessment options used by teachers at each grade level. Collaborative practice ensures common goal setting as well as combined effort to work toward more focused outcomes in terms of student achievement. This will lead us to balanced achievement, or the point at which all students are on or above grade level in all areas. This is established by utilizing a research-based framework and a support system set in place to continue a focus on learning. Based on the research of Max Thompson, there are six levels of Balanced Achievement. They include:
1. Leadership-Consistent and pervasive focus on learning and continuous improvement.2. Curriculum- Prioritized curriculum, mapping, standards driven.3. Research-based instruction- Connecting five or more of the most effective strategies, planning
and instruction is linked to professional development.4. Integrated literacy- Literacy and math blocks, writing in content everyday.5. Catching kids up- Multiple options for acceleration and scaffolding, and differentiation. 6. Assessments- Common assessments, continuous formative assessments, and rubrics.
Coupled with the research of Dr. Robert Marzano, over thirty strategies have been found that link to student achievement in some way. Of those strategies, extended thinking and summarizing prove to have the largest percentile gains in student learning of 45% and 34% respectively. Extended thinking allows for students to utilize the knowledge and skills they have acquired for a more advanced and deeper level of thinking. This involves writing to prompts and across the content areas. Likewise, summarizing is a learning strategy that allows learners to develop a schema of the information and knowledge to be stored and remembered for a longer period of time. These strategies also provide a formative assessment option to locate confusions, misconceptions, and misunderstandings. (Thompson, 2011).
Analysis of Current Practice: (How do we currently conduct business?)
In 2011-2012 Indialantic Elementary migrated from professional learning communities to a more collaborative approach to disaggregate and analyze student data. This was a necessary move based, in part, on the research of Dr. Rick DuFour. “Powerful collaboration is a systematic process in which teachers
Page 4

work together to analyze and improve their classroom practice. This process…leads to higher levels of student achievement.” Our collaborative teams/groups were based on grade levels. Within our groups we focused on our lowest performing students in the subject area of ELA (English Language Arts). As a grade level, we developed Response to Intervention (RtI)/small remediation groups that targeted the skills/concepts that needed to be reinforced and/or developed. Through this corrective teaching, our goal was to support a student’s strengths, while teaching and practicing skills and strategies the student needed. Instructional time (RtI) was scheduled to fulfill these priorities and to provide instructional balance. A majority of the teachers at Indialantic used the published materials and lesson planning information from the adopted textbooks as an instructional tool. Most supplemented as necessary. They followed a sequence of procedures and plans with a suggested course of action. Additionally, teachers at Indialantic made instructional decisions based on a particular methodology for teaching and a variety of options for completing each procedural step. Furthermore, teachers used a literacy based approach for instruction. A literacy based instructional method is founded upon an understanding of reading comprehension and response. The teacher is knowledgeable about a wide range of materials and methods. This knowledge helped to make decisions about what to teach and how to teach it. This approach allowed teachers to adapt lesson plans and activities within a set of materials (the adopted programs) and to select from several different methods to teach a lesson. Decisions were deliberate, reasoned, and consistent with the beliefs and needs of our current population. Most teachers used the instructional strategy proposed by the BEST Model, I do + We do + You do.
Page 5

CONTENT AREA: Reading Math Writing Science Parental
InvolvementDrop-out Programs
Language Arts
Social Studies
Arts/PE Other:
School Based Objective: (Action statement: What will we do to improve programmatic and/or instructional effectiveness?)Indialantic Elementary will adopt the Learning-Focused Strategies Model created by Dr. Max Thompson. As, we begin the 2012-2013 school year we will focus on developing Summarizing and Extended Thinking Strategies as well as implementing Common Core State Standards.
Strategies: (Small number of action oriented staff performance objectives)
Barrier Action Steps Person Responsible
Timetable Budget In-ProcessMeasure
1. Teacher Buy In. Reference to teacher comfort level, time to understand philosophy and collaboration time.
1. Set aside time weekly for grade level meetings to address Learning Focused Strategies (LFS)1 a. Monthly faculty meetings to model/ discuss Common Core State Standards 1.b. Opportunities to share/discuss implementation of learned CCSS and LFS skills
Administration
CCSS Launch Team Teachers
Administration
Weekly
8/21, 9/18, 10/16, 11/27, 1/22, 2/19, and 4/30
9/4, 10/2, 11/27, 12/11, 2/19, and 3/12
.00
.00
.00
Grade Level Meeting Forms
Meeting Handouts/PowerPoint
Team created Lesson Plan
2. Professional Development in the Learning-Focused Strategies Model
2. Six scheduled faculty meetings will be dedicated to Summarizing and Extended Thinking Strategies
2. a. Schedule selected teachers to attend Dr. Max
LFS in house trainers
Administration and selected teachers
9/11, 10/09, 11/13, 1/15, 2/12, and 3/19
November 2012
.00
$3, 000.00
Teacher Lesson Plans/Classroom Walk-Through Observations
Reflection of training by selected
Page 6

Thompson training in West Palm Beach
teachers. Hand-outs and agendas from share out to faculty.
3. 3.4. 4.5. 5.6. 6.7. 7.8. 8.
EVALUATION – Outcome Measures and Reflection
Qualitative and Quantitative Professional Practice Outcomes: (Measures the level of implementation of the professional practices throughout the school)
Teacher leaders and administration attended a two day summer training entitled “Creating a High Performing Learning Culture”. As a result of this training and additional research into the ideology of Dr. Max Thompson, we are focusing on extended thinking and summarizing. Our expectation, after training and implementation in these two strategies, is that 100% of our teachers will incorporate aspects of these two focus areas into every content subject. Evidence of this will be gathered from classroom demonstration of the targeted skills during administrative walk-throughs, teacher lesson plans, and participation in monthly faculty trainings. Qualitatively, teacher reflection and collaboration is evidence of the level of teacher comfort and understanding. Additionally, teachers will develop Professional Growth Plans (PGP) that incorporate Dr. Max Thompson’s strategies and furthermore connect teacher’s PGPs to the School Improvement Plan. The plans will be evaluated for development and implementation utilizing the district established rubrics.
Qualitative and Quantitative Student Achievement Expectations: (Measures of student achievement)
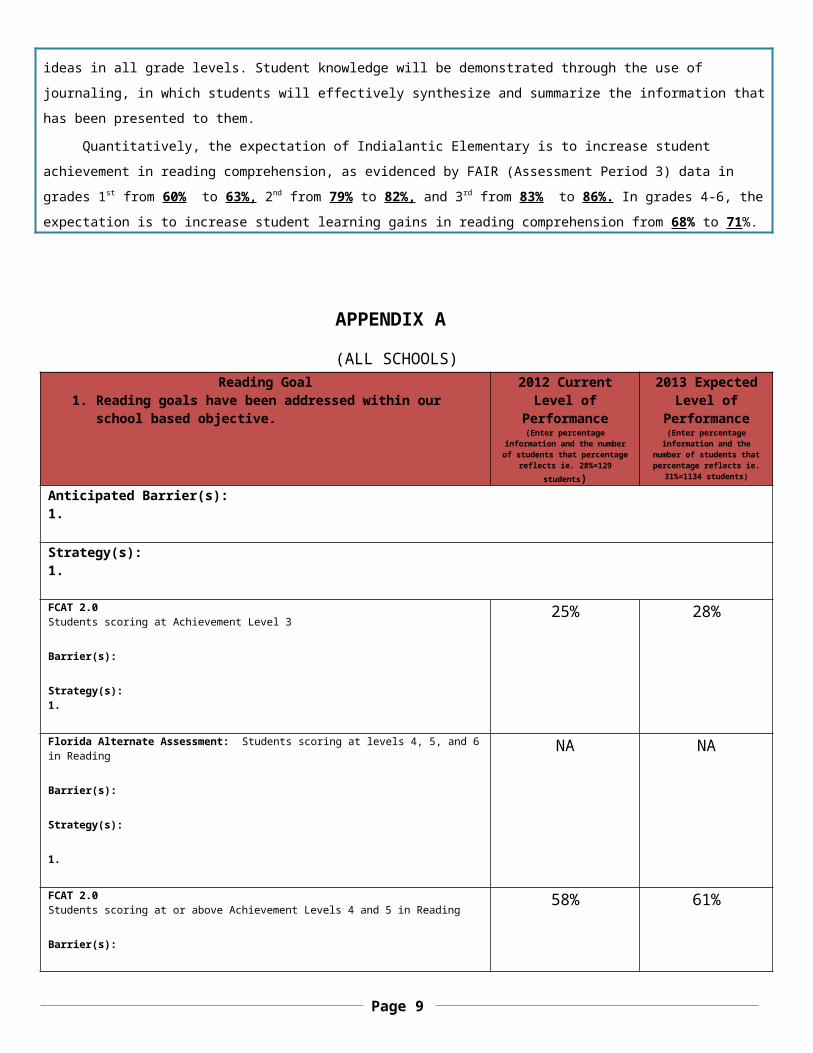
Qualitatively, our expectation is to observe writing across all content areas, justification of student thinking processes, and the ability to explain and defend their ideas in all grade levels. Student knowledge will be demonstrated through the use of journaling, in which students will effectively synthesize and summarize the information that has been presented to them. Quantitatively, the expectation of Indialantic Elementary is to increase student achievement in reading comprehension, as evidenced by FAIR (Assessment Period 3) data in grades 1st from 60% to 63%, 2nd from 79% to 82%, and 3rd from 83% to 86%. In grades 4-6, the expectation is to increase student learning gains in reading comprehension from 68% to 71%.
Page 7

APPENDIX A
(ALL SCHOOLS)Reading Goal
1. Reading goals have been addressed within our school based objective.
2012 Current Level of
Performance(Enter percentage information and the number of students that percentage reflects ie.
28%=129 students)
2013 Expected Level of
Performance(Enter percentage
information and the number of students that percentage reflects ie. 31%=1134 students)
Anticipated Barrier(s):1.
Strategy(s):1.
FCAT 2.0Students scoring at Achievement Level 3
Barrier(s):
Strategy(s):1.
25% 28%
Florida Alternate Assessment: Students scoring at levels 4, 5, and 6 in Reading
Barrier(s):
Strategy(s):
1.
NA NA
FCAT 2.0Students scoring at or above Achievement Levels 4 and 5 in Reading
Barrier(s):
Strategy(s):1.
58% 61%
Florida Alternate Assessment:Students scoring at or above Level 7 in Reading
Barrier(s):
Strategy(s):1.
NA NA
Florida Alternate Assessment:Percentage of students making learning Gains in Reading
Barrier(s):
Strategy(s):1.
NA NA
FCAT 2.0Percentage of students in lowest 25% making learning gains in Reading
Barrier(s):
Strategy(s):
69% 72%
Page 8
1.Florida Alternate Assessment:Percentage of students in Lowest 25% making learning gains in ReadingBarrier(s):
Strategy(s):1.
NA NA
Ambitious but Achievable Annual Measurable Objectives (AMOs). In six years school will reduce their Achievement Gap by 50%:
Baseline data 2010-11:
Student subgroups by ethnicity NOT making satisfactory progress in reading :
White:
Black:
Hispanic:
Asian:
Multi-racial:
American Indian:
Enter numerical data for current level of performance
16%
0%
21%
37%
21%
0%
Enter numerical data for expected level of performance
13%
0%18%34%
18%0%
English Language Learners (ELL) not making satisfactory progress in ReadingBarrier(s):
Strategy(s):1.
37% 34%
Students with Disabilities (SWD) not making satisfactory progress in ReadingBarrier(s):
Strategy(s):1.
65% 62%
Economically Disadvantaged Students not making satisfactory progress in ReadingBarrier(s):
Strategy(s):1.
30% 27%
Reading Professional DevelopmentPD Content/Topic/Focus Target
Dates/ScheduleStrategy(s) for follow-up/monitoring
Dr. Max Thompson Focused Based Learning Model Conference
November 2012 Reflection of training by selected teachers. Hand-outs and agendas from share out to faculty.
Teacher Leader monthly training of Summarizing and Extending Thinking
Strategies
9/11, 10/09, 11/13, 1/15, 2/12, and 3/19
Teacher Lesson Plans/Classroom Walk-Through Observations
Page 9

CELLA GOAL Anticipated Barrier
Strategy Person/Process/
Monitoring2012 Current Percent of Students Proficient in Listening/ Speaking:
Fluency Read Alouds with reading partner
Classroom Teachers/Running Records
2012 Current Percent of Students Proficient in Reading:
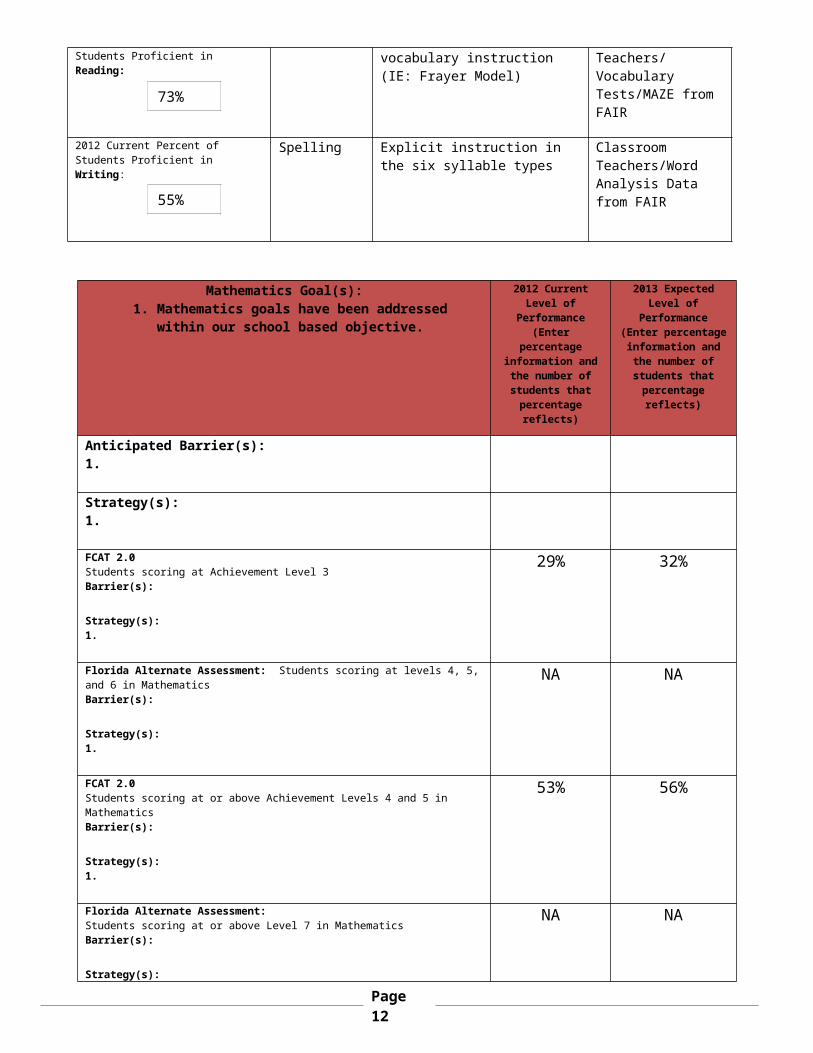
Vocabulary Small Group Intensive vocabulary instruction (IE: Frayer Model)
Classroom Teachers/ Vocabulary Tests/MAZE from FAIR
2012 Current Percent of Students Proficient in Writing:
Spelling Explicit instruction in the six syllable types
Classroom Teachers/Word Analysis Data from FAIR
Mathematics Goal(s):1. Mathematics goals have been addressed
within our school based objective.
2012 Current Level of
Performance(Enter
percentage information and the number of students that percentage
reflects)
2013 Expected Level of
Performance(Enter percentage information and the number of students that percentage
reflects)
Anticipated Barrier(s):1.
Strategy(s):1.
FCAT 2.0Students scoring at Achievement Level 3Barrier(s):
Strategy(s):1.
29% 32%
Florida Alternate Assessment: Students scoring at levels 4, 5, and 6 in MathematicsBarrier(s):
Strategy(s):1.
NA NA
FCAT 2.0Students scoring at or above Achievement Levels 4 and 5 in MathematicsBarrier(s):
Strategy(s):1.
53% 56%
Florida Alternate Assessment:Students scoring at or above Level 7 in MathematicsBarrier(s):
NA NA
73%
73%
55%
Page 10

Strategy(s):1.
Florida Alternate Assessment:Percentage of students making learning Gains in MathematicsBarrier(s):
Strategy(s):1.
NA NA
FCAT 2.0Percentage of students in lowest 25% making learning gains in MathematicsBarrier(s):
Strategy(s):1.
65% 68%
Florida Alternate Assessment:Percentage of students in Lowest 25% making learning gains in MathematicsBarrier(s):
Strategy(s):1.
NA NA
Ambitious but Achievable Annual Measurable Objectives (AMOs). In six years school will reduce their Achievement Gap by 50%:
Baseline Data 2010-11:
Student subgroups by ethnicity NOT making satisfactory progress in reading:
White:
Black:
Hispanic:
Asian:
Multi-Racial:
American Indian:
16%
0%
21%
37%
21%
0%
13%
0%
18%
34%
18%
0%
English Language Learners (ELL) not making satisfactory progress in Mathematics
37% 34%Students with Disabilities (SWD) not making satisfactory progress in Mathematics
65% 62%Economically Disadvantaged Students not making satisfactory progress in Mathematics
30% 27%
Mathematics Professional DevelopmentPD Content/Topic/Focus Target
Dates/ScheduleStrategy(s) for follow-up/monitoring
Training in Common Core State Standards in Mathematics
9/18, 11/27, and 2/19
Meeting Handouts/PowerPoint/Team created Lesson Plan
Page 11
Writing
Writing goals have been addressed within our school based objective.
2012 Current Level of Performance
(Enter percentage information and the number of students
that percentage reflects)
2013 Expected Level of
Performance(Enter percentage information and the number of students that percentage
reflects)Barrier(s):
Strategy(s):1.
FCAT: Students scoring at Achievement level 3.0 and higher in writing 95% 97%Florida Alternate Assessment: Students scoring at 4 or higher in writing NA NA
Science Goal(s)(Elementary and Middle)1. Science goals have
been addressed within our school based objective.
2012 Current Level of Performance
(Enter percentage information and the number of students
that percentage reflects)
2013 Expected Level of
Performance(Enter percentage information and the number of students that percentage
reflects)Barrier(s):
Strategy(s):1.
Students scoring at Achievement level 3 in Science: 42% 45%Florida Alternate Assessment: Students scoring at levels 4, 5, and 6 in Science
NA NAStudents scoring at or above Achievement Levels 4 and 5 in Science: 34% 37%Florida Alternate Assessment:Students scoring at or above Level 7 in Reading
NA NA
Page 12

Science Goal(s)(High School)
1.
2012 Current Level of Performance
(Enter percentage information and the number of students
that percentage reflects)
2013 Expected Level of
Performance(Enter percentage information and the number of students that percentage
reflects)Barrier(s):
Strategy(s):1.
Florida Alternate Assessment: Students scoring at levels 4, 5, and 6 in ScienceFlorida Alternate Assessment:Students scoring at or above Level 7 in ScienceStudent subgroups by ethnicity (White, Black, Hispanic, Asian, American Indian) not making satisfactory progress in Algebra.
White:
Black:
Hispanic:
Asian:
American Indian:
English Language Learners (ELL) not making satisfactory progress in AlgebraStudents with Disabilities (SWD) not making satisfactory progress in AlgebraEconomically Disadvantaged Students not making satisfactory progress in Algebra
Page 13

APPENDIX B
(SECONDARY SCHOOLS ONLY)
Algebra 1 EOC Goal 2012 Current Level of Performance
(Enter percentage information and the number of students
that percentage reflects)
2013 Expected Level of Performance
(Enter percentage information and the number of students
that percentage reflects)
Barrier(s):
Strategy(s):1.
Students scoring at Achievement level 3 in Algebra:
Students scoring at or above Achievement Levels 4 and 5 in Algebra:
Ambitious but Achievable Annual Measurable Objectives (AMOs). In six years school will reduce their Achievement Gap by 50%: Baseline Data 2010-11
Student subgroups by ethnicity (White, Black, Hispanic, Asian, American Indian) not making satisfactory progress in Algebra.
White:
Black:
Hispanic:
English Language Learners (ELL) not making satisfactory progress in AlgebraStudents with Disabilities (SWD) not making satisfactory progress in AlgebraEconomically Disadvantaged Students not making satisfactory progress in Algebra
Page 14

Geometry EOC Goal 2012 Current Level of Performance(Enter
percentage information and the number of students
that percentage reflects)
2013 Expected Level of Performance
(Enter percentage information and the number of students
that percentage reflects)
Barrier(s):
Strategy(s):1.
Students scoring at Achievement level 3 in Geometry:
Students scoring at or above Achievement Levels 4 and 5 in Geometry:
Ambitious but Achievable Annual Measurable Objectives (AMOs). In six years school will reduce their Achievement Gap by 50%: Baseline Data 2010-11
Student subgroups by ethnicity (White, Black, Hispanic, Asian, American Indian) not making satisfactory progress in Geometry.
White:
Black:
Hispanic:
English Language Learners (ELL) not making satisfactory progress in GeometryStudents with Disabilities (SWD) not making satisfactory progress in GeometryEconomically Disadvantaged Students not making satisfactory progress in Geometry
Page 15

Biology EOC Goal
2012 Current Level of
Performance(Enter
percentage information
and the number of
students that percentage
reflects)
2013 Expected Level of
Performance(Enter
percentage information
and the number of
students that percentage
reflects)Students scoring at Achievement level 3 in Biology:Students scoring at or above Achievement Levels 4 and 5 in Biology:
Civics EOC 2012 Current Level of
Performance(Enter
percentage information
and the number of
students that percentage
reflects)
2013 Expected Level of
Performance(Enter
percentage information
and the number of
students that percentage
reflects)Students scoring at Achievement level 3 in Civics:Students scoring at or above Achievement Levels 4 and 5 in Civics:
U.S. History EOC
2012 Current Level of
Performance(Enter
percentage information
and the number of
students that percentage
reflects)
2013 Expected Level of
Performance(Enter
percentage information
and the number of
students that percentage
reflects)Students scoring at Achievement level 3 in U. S. History:Students scoring at or above Achievement Levels 4 and 5 in U. S. History:
Page 16

Science, Technology, Engineering, and
Mathematics (STEM) Goal(s)
Anticipated Barrier
Strategy Person/Process/Monitoring
Based on the analysis of school data, identify and define areas in need of improvement:
Goal 1:
Goal 2:
Career and Technical Education (CTE) Goal(s)
Anticipated Barrier
Strategy Person/Process/Monitoring
Based on the analysis of school data, identify and define areas in need of improvement:
Goal 1:
Goal 2:
Additional Goal(s) Anticipated Barrier
Strategy Person/Process/Monitoring
Based on the analysis of school data, identify and define areas in need of improvement:
Goal 1:
Goal 2:
Page 17

APPENDIX C
(TITLE 1 SCHOOLS ONLY)
Highly Effective Teachers Describe the school based strategies that will be used to recruit and retain high quality, highly effective teachers to the school.
Descriptions of Strategy Person Responsible Projected Completion Date
1.2.3.
Non-Highly Effective Instructors Provide the number of instructional staff and paraprofessionals that are teaching out-of-field and/or who are not highly effective. *When using percentages, include the number of teachers the percentage represents (e.g., 70% [35]).
Number of staff and paraprofessionals that are teaching out-of-field/and who are not highly
effective
Provide the strategies that are being implemented to support the staff in becoming
highly effective
For the following areas, please write a brief narrative that includes the data for the year 2011-12 and
Page 18
a description of changes you intend to incorporate to improve the data for the year 2012-13.
MULTI-TIERED SYSTEM OF SUPPORTS (MTSS)/RtI (Identify the MTSS leadership team and it role in development and implementation of the SIP along with data sources, data management and how staff is trained in MTSS)
The MTSS leadership team consisted of the Assistant Principal, Reading Coach, Guidance Counselor and School Psychologist. The Reading Coach and Assistant Principal conducted a school wide training on the step by step process of analyzing data, determining need from that data, strategies to focus on needs, on going progress monitoring and documentation. The School Psychologist conducted follow up training during grade level meetings where she provided sample materials and a flow chart diagramming the process. In the process of preparing for Individual Problem Solving Team meetings, it was noted that accessing A3 showed a limited amount of intervention data was inputted by teachers. Furthermore, it was observed during meetings that this was a lack of understanding on the role of the teacher in providing and documenting interventions. The MTSS leadership team determined that additional training was needed and district personnel were contacted and scheduled to provide training. In addition, the MTSS resource teachers will attend grade level meetings for more personalized instruction and several teachers were scheduled to attend a MTSS training on the first district wide Professional Development Day. PARENT INVOLVEMENT: Indialantic Elementary enjoys a very active and positive parent involvement in many capacities. The Parent Teacher Organization supports the school in a multitude of ways with the greatest impact of providing funds for technology and a science lab. Various parents provide academic support in the area of reading, math and science. Indialantic has two parents that prepare, organize and conduct science experiments in the school science lab. A large number of parent volunteers assist in small group instruction in reading and math. The Brevard Parent Survey that is conducted each spring indicated an increase of positive response in all categories from communication to friendliness of faculty and staff from the previous year. Due to the overwhelming support of the Indialantic Elementary parents, there is not a necessity to create a plan for increased involvement.
ATTENDANCE: (Include current and expected attendance rates, excessive absences and tardies)Our school wide attendance rate in 2011-2012 was 95.35%, slightly lower than the district rate of 95.6%. 2011-2012 was the first year of the implementation of our School Wide Plan to improve attendance/tardy rates by the guidance department. 2.4% of identified students were chronically absent in 2011-2012. 10% of those students improved their attendance by at least 80%. In 2012-2013, guidance will continue with this comprehensive plan to raise attendance to 96%. Additionally, plans to recognize good attendance, as well as increasing individual attention to children (and parents) that are chronically absent will be implemented to support this goal.
SUSPENSION: Indialantic Elementary had a total of 36 suspensions for the 2011-2012 school year. By focusing on summarizing and extending thinking strategies, students will be engaged in higher order thinking activities, therefore less likely to exhibit poor behavior choices. In the event that an infraction occurs, teachers will utilize the school-wide discipline plan which incorporates discipline partners at different grade levels. Through implementation of the above listed strategies, our intent is to decrease suspensions during the current school year by 10%.
DROP-OUT (High Schools only): NA
POSTSECONDARY READINESS: (How does the school incorporate students’ academic and career planning, as well as promote student course selections, so that students’ course of study is personally meaningful? Describe strategies for improving student readiness for the public postsecondary level based on annual analysis of the High School Feedback Report.)
NA
Page 19

Page 20