accessible retail
TRANSCRIPT
ACCESSIBLE RETAIL
Out of Town Retail Sector Overview
2012
Economic Context ................................................................................... Pages 4 - 8
Retail Trends ................................................................................... Pages 9 - 18
The Out Of Town Sector ................................................................................... Pages 19 - 30
Contents
Page 2

Executive Summary
Economic Context
GDP flat in 2012, however, recovery forecast for 2013 and 2-3% annual growth by 2015.
Despite low interest rates (0.5% since Q1 2009), the number of mortgage approvals are still less than half that seen in 2007.
Inflation has dropped significantly during 2012 and is now in line with the Bank of England target rate.
UK unemployment (8%) has remained consistently lower than the Eurozone average.
The retail sector is the third largest employer by industry sector, behind that of business services and the health service.
Out of town retail sales growth has historically been, and continues to be, higher than the equivalent in town centres.
The proportion of retail spending on bulky goods will continue to grow year-on-year going forward.
Shopping centre completions continue to be centred around town centres as opposed to out of town locations.
Smaller units in town reduced between 2003 and 2009.
Out of town units between 2,000 and 50,000 sq ft grew between the same period.
Compared to in town retail, out of town sales densities are higher.
Vacancy rates are lower out of town versus in town location.
The retail pipeline is showing signs of recovery.
The value of retail warehousing grew by £4.7 billion between 2009 and 2011 – the highest amongst any asset class.
Retail Trends
Out Of Town Sector
Bluewater remains the top out of town mall in the UK, followed by both London based Westfield schemes. Fosse Park is the top retail park.
Out of town retail now accounts for 25% of total floorspace.
From a spend density perspective, new space requirements are highest in Greater London, East Anglia and the South West.
Out of town retail growth has been driven by grocery demand.
The sector must adapt to changing consumer demands such as the ability to ‘click and collect’ as well as coping with retail casualties such as Comet.
Page 3

ECONOMIC CONTEXT
GDP Growth and Household Expenditure
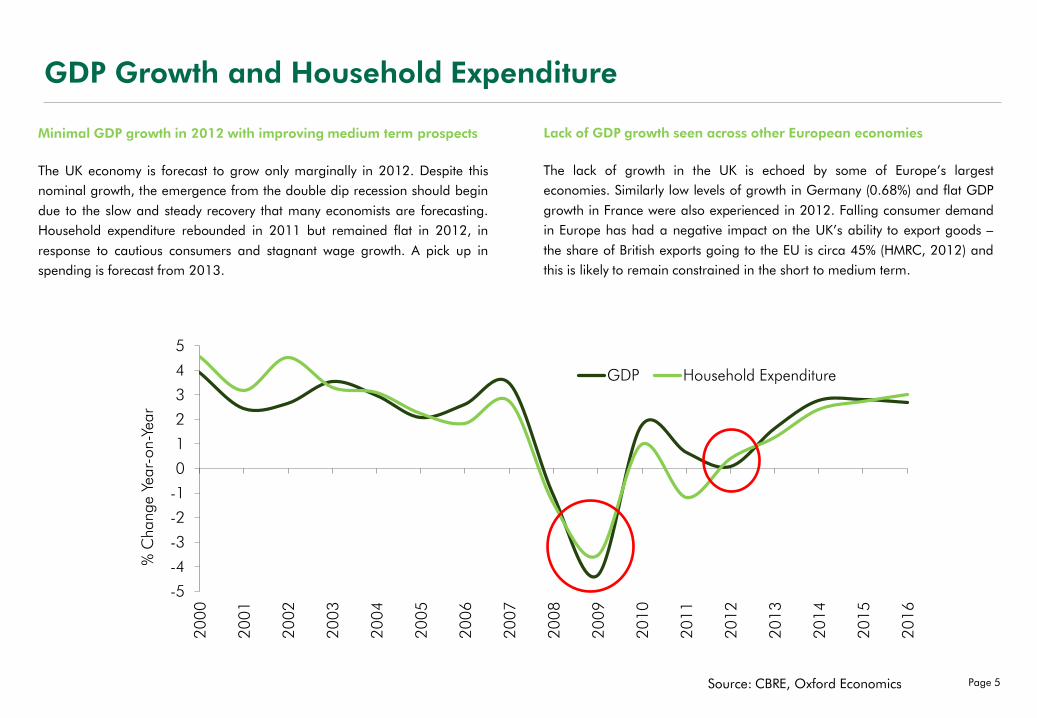
Minimal GDP growth in 2012 with improving medium term prospects
The UK economy is forecast to grow only marginally in 2012. Despite this
nominal growth, the emergence from the double dip recession should begin
due to the slow and steady recovery that many economists are forecasting.
Household expenditure rebounded in 2011 but remained flat in 2012, in
response to cautious consumers and stagnant wage growth. A pick up in
spending is forecast from 2013.
-5
-4
-3
-2
-1
0
1
2
3
4
5
20
00
20
01
20
02
20
03
20
04
20
05
20
06
20
07
20
08
20
09
20
10
20
11
20
12
20
13
20
14
20
15
20
16
% C
hange
Year-
on-Y
ear
GDP Household Expenditure
Source: CBRE, Oxford Economics
Lack of GDP growth seen across other European economies
The lack of growth in the UK is echoed by some of Europe’s largest
economies. Similarly low levels of growth in Germany (0.68%) and flat GDP
growth in France were also experienced in 2012. Falling consumer demand
in Europe has had a negative impact on the UK’s ability to export goods –
the share of British exports going to the EU is circa 45% (HMRC, 2012) and
this is likely to remain constrained in the short to medium term.
Page 5
0.0%
1.0%
2.0%
3.0%
4.0%
5.0%
6.0%
7.0%
0
20,000
40,000
60,000
80,000
100,000
120,000
140,000
Jan-0
7
May-
07
Sep-0
7
Jan-0
8
May-
08
Sep-0
8
Jan-0
9
May-
09
Sep-0
9
Jan-1
0
May-
10
Sep-1
0
Jan-1
1
May-
11
Sep-1
1
Jan-1
2
Mortgage Approvals
Interest Rate
Mortgages and Inflation
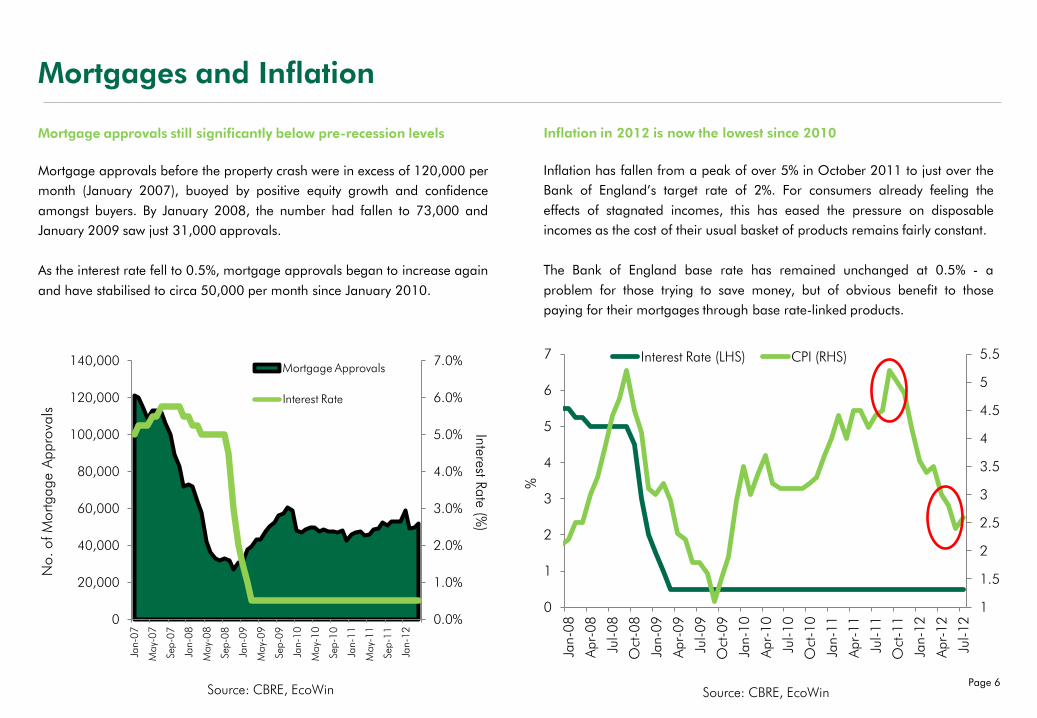
Mortgage approvals still significantly below pre-recession levels
Mortgage approvals before the property crash were in excess of 120,000 per
month (January 2007), buoyed by positive equity growth and confidence
amongst buyers. By January 2008, the number had fallen to 73,000 and
January 2009 saw just 31,000 approvals.
As the interest rate fell to 0.5%, mortgage approvals began to increase again
and have stabilised to circa 50,000 per month since January 2010.
Inflation in 2012 is now the lowest since 2010
Inflation has fallen from a peak of over 5% in October 2011 to just over the
Bank of England’s target rate of 2%. For consumers already feeling the
effects of stagnated incomes, this has eased the pressure on disposable
incomes as the cost of their usual basket of products remains fairly constant.
The Bank of England base rate has remained unchanged at 0.5% - a
problem for those trying to save money, but of obvious benefit to those
paying for their mortgages through base rate-linked products.
No. of M
ortgage A
ppro
vals
Interest R
ate (%
)
Source: CBRE, EcoWin
1
1.5
2
2.5
3
3.5
4
4.5
5
5.5
0
1
2
3
4
5
6
7
Jan-0
8
Apr-
08
Jul-08
Oct
-08
Jan-0
9
Apr-
09
Jul-09
Oct
-09
Jan-1
0
Apr-
10
Jul-10
Oct
-10
Jan-1
1
Apr-
11
Jul-11
Oct
-11
Jan-1
2
Apr-
12
Jul-12
Interest Rate (LHS) CPI (RHS)
Source: CBRE, EcoWin
%
Page 6
4
5
6
7
8
9
10
11
12
Jan-0
8
Apr-
08
Jul-08
Oct
-08
Jan-0
9
Apr-
09
Jul-09
Oct
-09
Jan-1
0
Apr-
10
Jul-10
Oct
-10
Jan-1
1
Apr-
11
Jul-11
Oct
-11
Jan-1
2
Apr-
12
Jul-12
UK Unemployment Rate
Eurozone Unemployment Rate
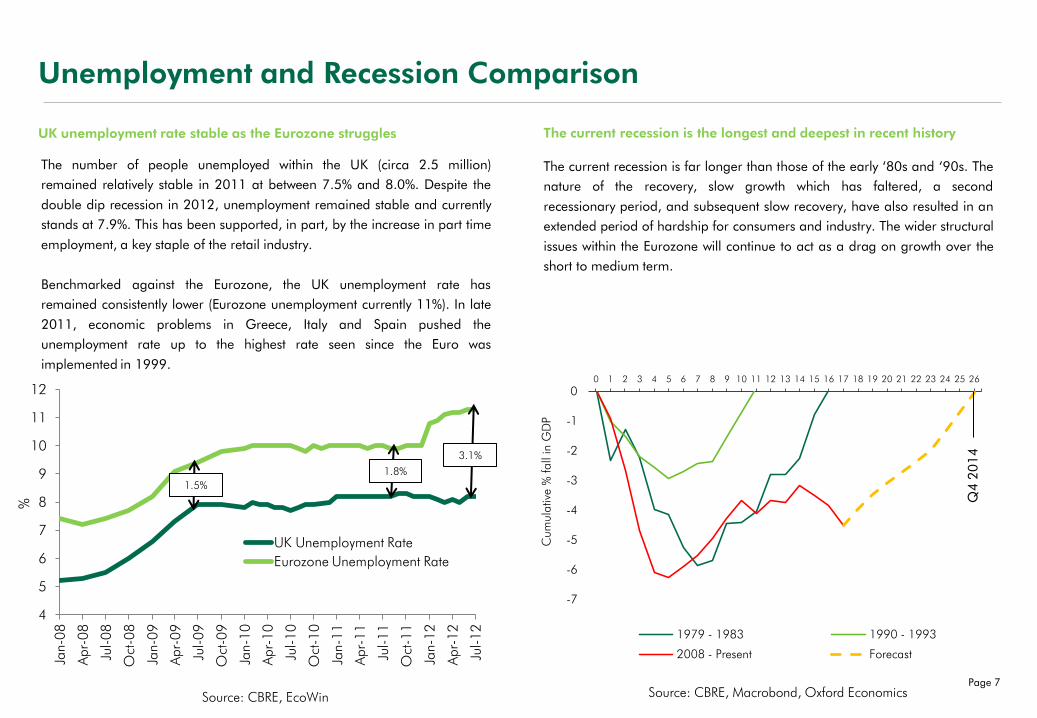
Unemployment and Recession Comparison
UK unemployment rate stable as the Eurozone struggles
The number of people unemployed within the UK (circa 2.5 million)
remained relatively stable in 2011 at between 7.5% and 8.0%. Despite the
double dip recession in 2012, unemployment remained stable and currently
stands at 7.9%. This has been supported, in part, by the increase in part time
employment, a key staple of the retail industry.
Benchmarked against the Eurozone, the UK unemployment rate has
remained consistently lower (Eurozone unemployment currently 11%). In late
2011, economic problems in Greece, Italy and Spain pushed the
unemployment rate up to the highest rate seen since the Euro was
implemented in 1999.
Source: CBRE, EcoWin
%
3.1%
1.8%
1.5%
-7
-6
-5
-4
-3
-2
-1
0 0 1 2 3 4 5 6 7 8 9 10 11 12 13 14 15 16 17 18 19 20 21 22 23 24 25 26
Cum
ula
tive
% fall
in G
DP
1979 - 1983 1990 - 1993
2008 - Present Forecast
Q4
20
14
The current recession is the longest and deepest in recent history
The current recession is far longer than those of the early ‘80s and ‘90s. The
nature of the recovery, slow growth which has faltered, a second
recessionary period, and subsequent slow recovery, have also resulted in an
extended period of hardship for consumers and industry. The wider structural
issues within the Eurozone will continue to act as a drag on growth over the
short to medium term.
Source: CBRE, Macrobond, Oxford Economics Page 7
0 1,000 2,000 3,000 4,000 5,000
Transport
Public Admin & Defence
Wholesale Distribution
Hotel & Catering
Construction
Education
Manufacturing
Retail
Health
Business Services
Number Employed (1,000s)
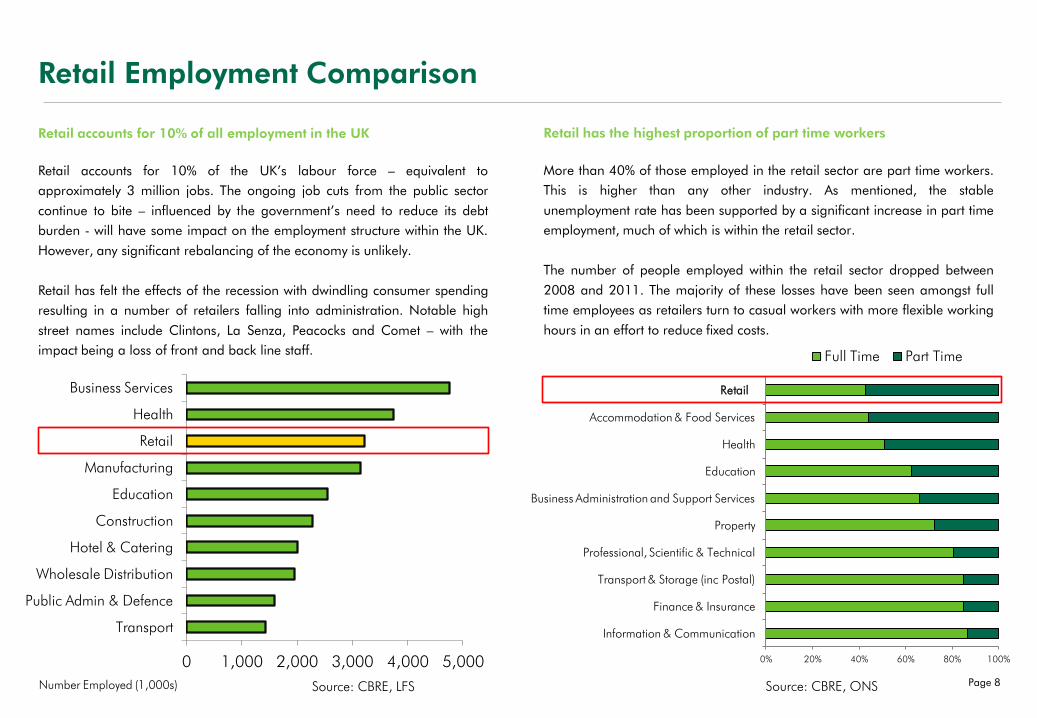
Retail accounts for 10% of all employment in the UK
Retail accounts for 10% of the UK’s labour force – equivalent to
approximately 3 million jobs. The ongoing job cuts from the public sector
continue to bite – influenced by the government’s need to reduce its debt
burden - will have some impact on the employment structure within the UK.
However, any significant rebalancing of the economy is unlikely.
Retail has felt the effects of the recession with dwindling consumer spending
resulting in a number of retailers falling into administration. Notable high
street names include Clintons, La Senza, Peacocks and Comet – with the
impact being a loss of front and back line staff.
Retail has the highest proportion of part time workers
More than 40% of those employed in the retail sector are part time workers.
This is higher than any other industry. As mentioned, the stable
unemployment rate has been supported by a significant increase in part time
employment, much of which is within the retail sector.
The number of people employed within the retail sector dropped between
2008 and 2011. The majority of these losses have been seen amongst full
time employees as retailers turn to casual workers with more flexible working
hours in an effort to reduce fixed costs.
Retail Employment Comparison
Source: CBRE, LFS Source: CBRE, ONS
0% 20% 40% 60% 80% 100%
Information & Communication
Finance & Insurance
Transport & Storage (inc Postal)
Professional, Scientific & Technical
Property
Business Administration and Support Services
Education
Health
Accommodation & Food Services
Retail
Full Time Part Time
Retail
Page 8

RETAIL TRENDS
-6
-4
-2
0
2
4
6
8
2002 2003 2004 2005 2006 2007 2008 2009 2010 2011 2012
Town Centre Out-of-Town
FORECAST
-4%
-2%
0%
2%
4%
6%
8%
10%
12%
14%
2000
2001
2002
2003
2004
2005
2006
2007
2008
2009
2010
2011
2012
2013
2014
2015
2016
Bulky Non-bulky
Yea
r on y
ear
gro
wth
(%
)
Source: ONS, CBRE Source: Verdict, CBRE
Retail Spending
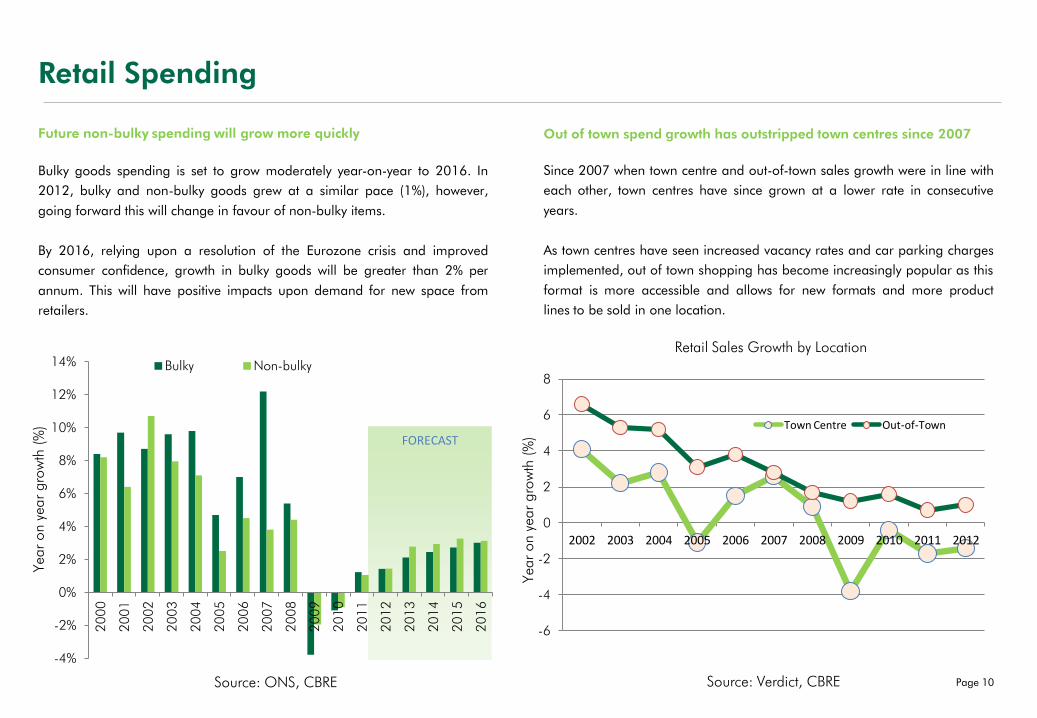
Future non-bulky spending will grow more quickly
Bulky goods spending is set to grow moderately year-on-year to 2016. In
2012, bulky and non-bulky goods grew at a similar pace (1%), however,
going forward this will change in favour of non-bulky items.
By 2016, relying upon a resolution of the Eurozone crisis and improved
consumer confidence, growth in bulky goods will be greater than 2% per
annum. This will have positive impacts upon demand for new space from
retailers.
Out of town spend growth has outstripped town centres since 2007
Since 2007 when town centre and out-of-town sales growth were in line with
each other, town centres have since grown at a lower rate in consecutive
years.
As town centres have seen increased vacancy rates and car parking charges
implemented, out of town shopping has become increasingly popular as this
format is more accessible and allows for new formats and more product
lines to be sold in one location.
Yea
r on y
ear
gro
wth
(%
)
Retail Sales Growth by Location
Page 10

FORECAST
0%
10%
20%
30%
40%
50%
60%
70%
80%
90%
100%
2005 2006 2007 2008 2009 2010 2011 2012 2013 2014 2015
Town Centre Out Of Town Online
FORECAST
18%
20%
22%
24%
0
20
40
60
80
100
£bn
spending on bulky goods (lhs)
spending on bulky goods as % of retail spend (rhs)
Source: ONS, CBRE
Spending on bulky goods (2003 prices)
Bulky and Non-Bulky Goods Spend
Proportions spent on bulky goods set to rise to 2016
Spending on bulky goods increased significantly in the pre-recession period,
however, this stagnated between 2009 and 2011 (£68 Billion). In 2012, full
year forecasts suggest that growth will return and will continue to do so until
at least 2016.
In terms of the proportion that bulky goods achieves of total retail spend, this
also remained relatively flat throughout the recession at a consistent 23%
and is forecast to remain relatively similar to 2016.
Proportio
n o
f O
vera
ll Sp
end (%
)
Online retailing forecast to further increase market share
The growth in online sales looks set to continue as retailers develop their
multi channel offer and easily ‘transferable goods’ such as books and
electronic items move to an online channel. As a proportion of total retail
sales, online is forecast to grow consistently to 2015.
The impact, however, will be very sector specific and in terms of the overall
change on branch network size, this is more likely to be influenced by the
consolidation of spend and development in dominant in town and out of
town locations.
Page 11 Source: Verdict
Shopping Centre & Retail Park Development
0.00
1.00
2.00
3.00
4.00
5.00
6.00
7.00
8.00
9.00
2003 2004 2005 2006 2007 2008 2009 2010 2011
Shopping Centre Completions
In Town Out of Town
Com
ple
tions
(Sq
Ft M
illio
ns)
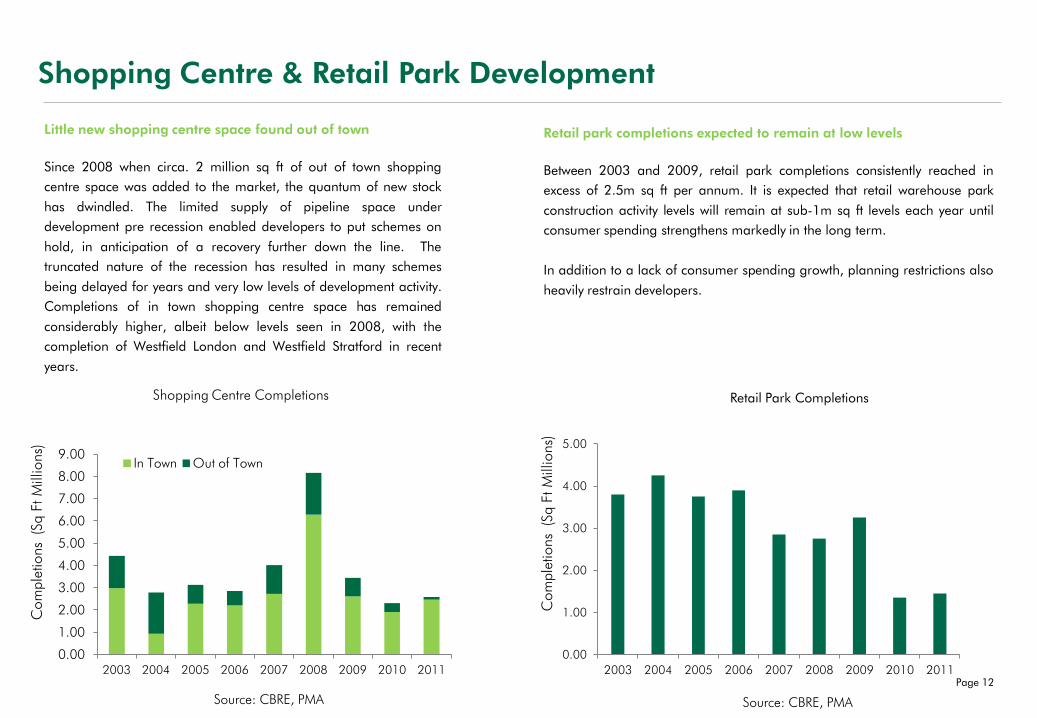
Little new shopping centre space found out of town
Since 2008 when circa. 2 million sq ft of out of town shopping
centre space was added to the market, the quantum of new stock
has dwindled. The limited supply of pipeline space under
development pre recession enabled developers to put schemes on
hold, in anticipation of a recovery further down the line. The
truncated nature of the recession has resulted in many schemes
being delayed for years and very low levels of development activity.
Completions of in town shopping centre space has remained
considerably higher, albeit below levels seen in 2008, with the
completion of Westfield London and Westfield Stratford in recent
years.
0.00
1.00
2.00
3.00
4.00
5.00
2003 2004 2005 2006 2007 2008 2009 2010 2011
Com
ple
tions
(Sq
Ft M
illio
ns)
Source: CBRE, PMA Source: CBRE, PMA
Retail park completions expected to remain at low levels
Between 2003 and 2009, retail park completions consistently reached in
excess of 2.5m sq ft per annum. It is expected that retail warehouse park
construction activity levels will remain at sub-1m sq ft levels each year until
consumer spending strengthens markedly in the long term.
In addition to a lack of consumer spending growth, planning restrictions also
heavily restrain developers.
Retail Park Completions
Page 12
20
26
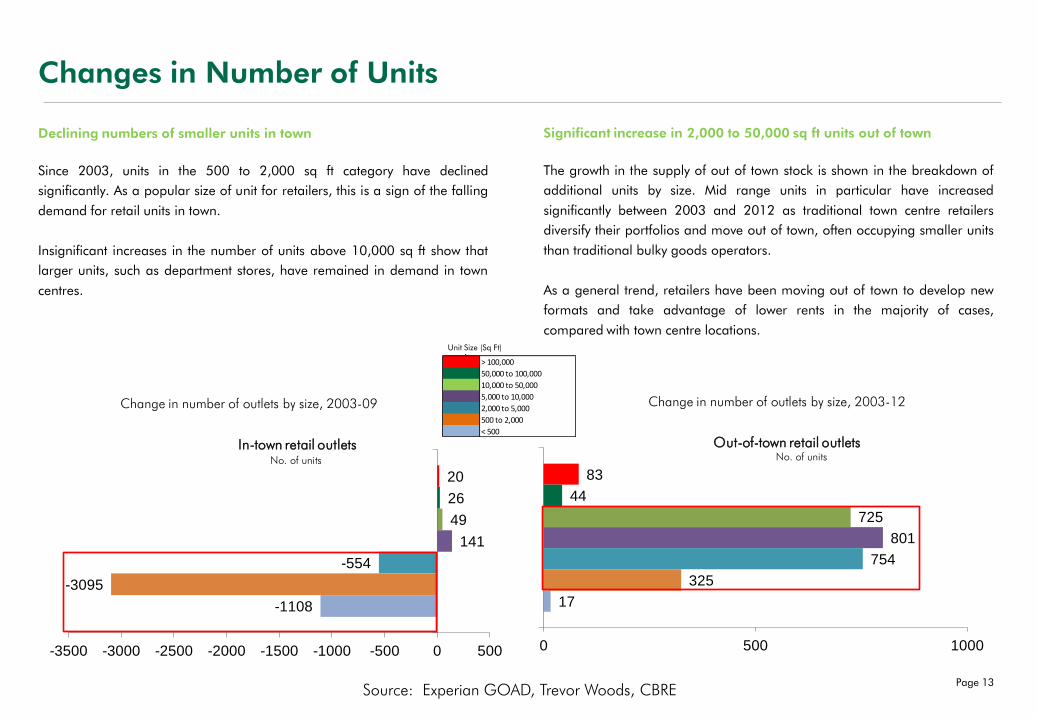
49
141
-554
-3095
-1108
-3500 -3000 -2500 -2000 -1500 -1000 -500 0 500
1
Source: Experian GOAD, Trevor Woods, CBRE
In-town retail outlets Out-of-town retail outlets
Change in number of outlets by size, 2003-09
No. of units
Changes in Number of Units
Declining numbers of smaller units in town
Since 2003, units in the 500 to 2,000 sq ft category have declined
significantly. As a popular size of unit for retailers, this is a sign of the falling
demand for retail units in town.
Insignificant increases in the number of units above 10,000 sq ft show that
larger units, such as department stores, have remained in demand in town
centres.
Significant increase in 2,000 to 50,000 sq ft units out of town
The growth in the supply of out of town stock is shown in the breakdown of
additional units by size. Mid range units in particular have increased
significantly between 2003 and 2012 as traditional town centre retailers
diversify their portfolios and move out of town, often occupying smaller units
than traditional bulky goods operators.
As a general trend, retailers have been moving out of town to develop new
formats and take advantage of lower rents in the majority of cases,
compared with town centre locations.
83
44
725
801
754
325
17
0 500 1000
1
Key Unit Size
> 100,000
50,000 to 100,000
10,000 to 50,000
5,000 to 10,000
2,000 to 5,000
500 to 2,000
< 500
Change in number of outlets by size, 2003-12
Page 13
No. of units
Unit Size (Sq Ft)
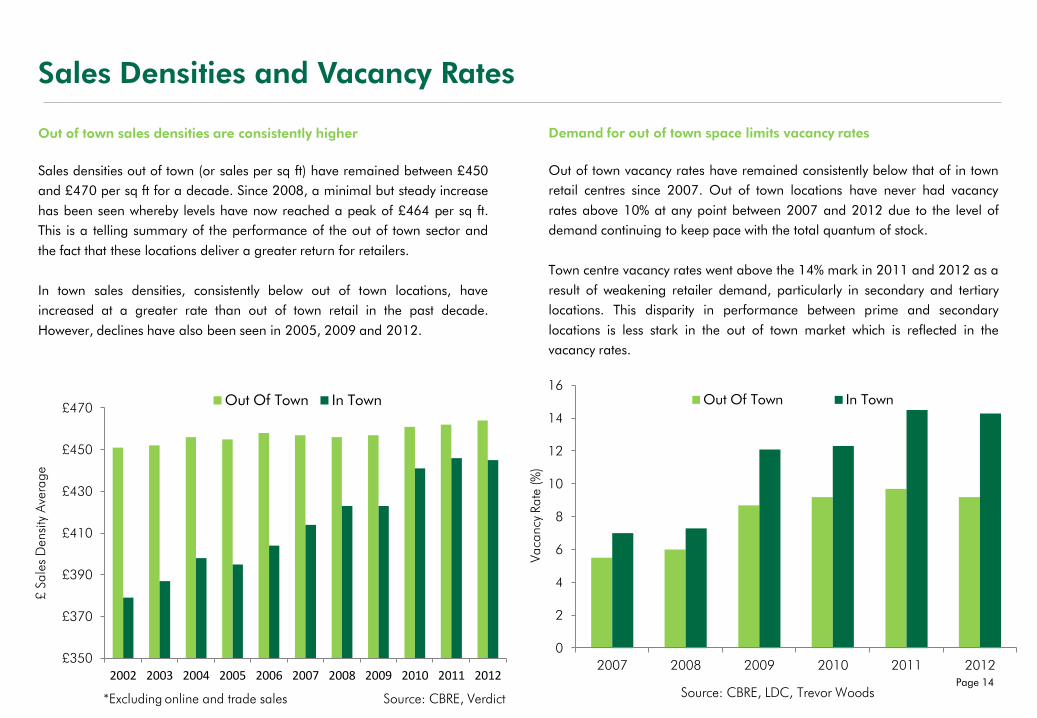
£350
£370
£390
£410
£430
£450
£470
2002 2003 2004 2005 2006 2007 2008 2009 2010 2011 2012
Out Of Town In Town
Out of town sales densities are consistently higher
Sales densities out of town (or sales per sq ft) have remained between £450
and £470 per sq ft for a decade. Since 2008, a minimal but steady increase
has been seen whereby levels have now reached a peak of £464 per sq ft.
This is a telling summary of the performance of the out of town sector and
the fact that these locations deliver a greater return for retailers.
In town sales densities, consistently below out of town locations, have
increased at a greater rate than out of town retail in the past decade.
However, declines have also been seen in 2005, 2009 and 2012.
Demand for out of town space limits vacancy rates
Out of town vacancy rates have remained consistently below that of in town
retail centres since 2007. Out of town locations have never had vacancy
rates above 10% at any point between 2007 and 2012 due to the level of
demand continuing to keep pace with the total quantum of stock.
Town centre vacancy rates went above the 14% mark in 2011 and 2012 as a
result of weakening retailer demand, particularly in secondary and tertiary
locations. This disparity in performance between prime and secondary
locations is less stark in the out of town market which is reflected in the
vacancy rates.
Sales Densities and Vacancy Rates
Source: CBRE, Verdict Source: CBRE, LDC, Trevor Woods
£ S
ale
s D
ensi
ty A
vera
ge
0
2
4
6
8
10
12
14
16
2007 2008 2009 2010 2011 2012
Out Of Town In Town
*Excluding online and trade sales
Page 14
Vaca
ncy
Rate
(%
)
FO
REC
AST
-30
-20
-10
0
10
20
30
40
1990 1995 2000 2005 2010 2015
High Street Shops
Shopping Centres
Retail Warehouses
FOR
ECA
ST
Source: IPD, CBRE
Rental Growth Total Return
Source: IPD, CBRE
Property Performance
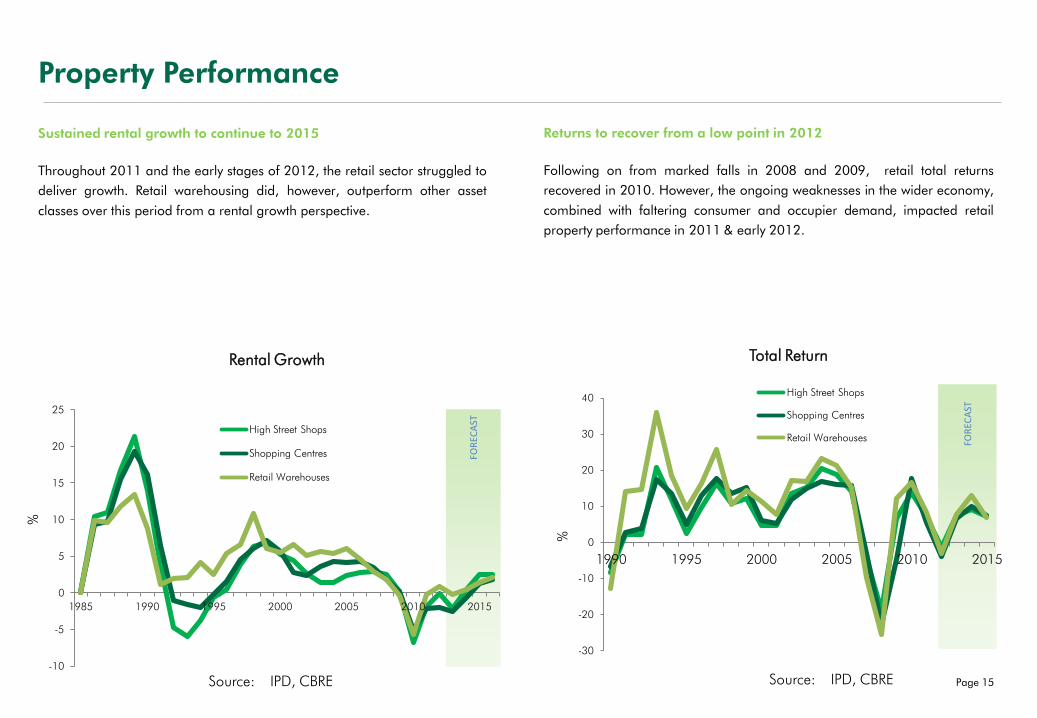
Sustained rental growth to continue to 2015
Throughout 2011 and the early stages of 2012, the retail sector struggled to
deliver growth. Retail warehousing did, however, outperform other asset
classes over this period from a rental growth perspective.
Returns to recover from a low point in 2012
Following on from marked falls in 2008 and 2009, retail total returns
recovered in 2010. However, the ongoing weaknesses in the wider economy,
combined with faltering consumer and occupier demand, impacted retail
property performance in 2011 & early 2012.
-10
-5
0
5
10
15
20
25
1985 1990 1995 2000 2005 2010 2015
High Street Shops
Shopping Centres
Retail Warehouses
%
%
Page 15
Investment Volumes
Source: Property Data, CBRE Source: Property Data, CBRE
Retail Warehouse Investment
Investment Volumes and Sources
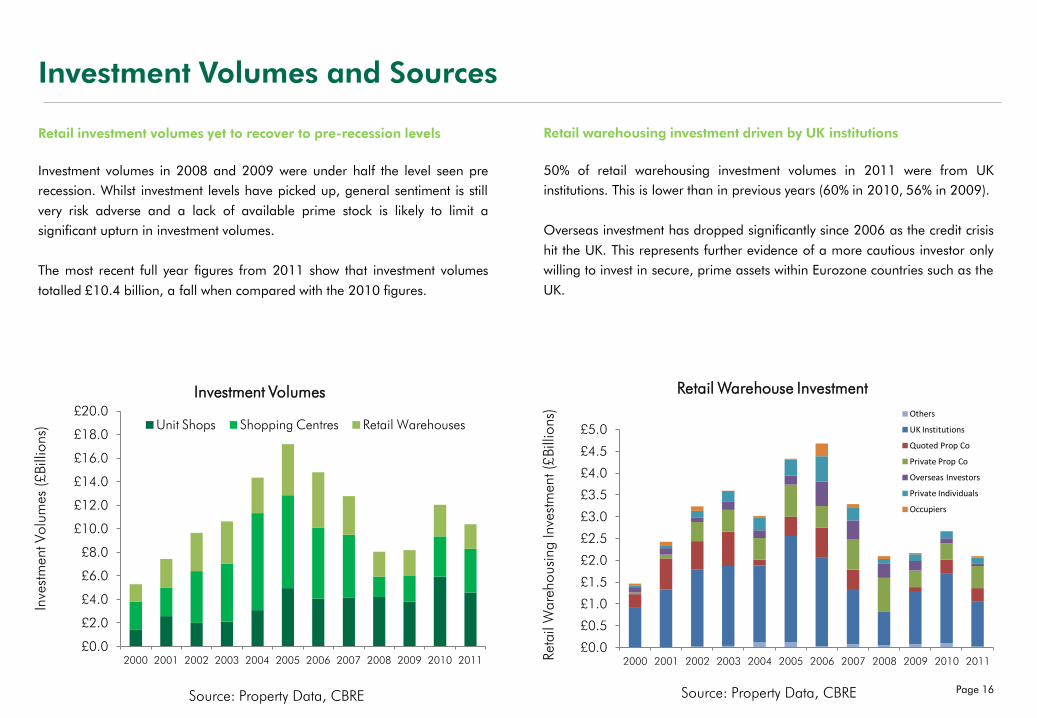
Retail investment volumes yet to recover to pre-recession levels
Investment volumes in 2008 and 2009 were under half the level seen pre
recession. Whilst investment levels have picked up, general sentiment is still
very risk adverse and a lack of available prime stock is likely to limit a
significant upturn in investment volumes.
The most recent full year figures from 2011 show that investment volumes
totalled £10.4 billion, a fall when compared with the 2010 figures.
Retail warehousing investment driven by UK institutions
50% of retail warehousing investment volumes in 2011 were from UK
institutions. This is lower than in previous years (60% in 2010, 56% in 2009).
Overseas investment has dropped significantly since 2006 as the credit crisis
hit the UK. This represents further evidence of a more cautious investor only
willing to invest in secure, prime assets within Eurozone countries such as the
UK.
£0.0
£2.0
£4.0
£6.0
£8.0
£10.0
£12.0
£14.0
£16.0
£18.0
£20.0
2000 2001 2002 2003 2004 2005 2006 2007 2008 2009 2010 2011
Unit Shops Shopping Centres Retail Warehouses
Inve
stm
ent V
olu
mes
(£
Bill
ions)
£0.0
£0.5
£1.0
£1.5
£2.0
£2.5
£3.0
£3.5
£4.0
£4.5
£5.0
2000 2001 2002 2003 2004 2005 2006 2007 2008 2009 2010 2011
Others
UK Institutions
Quoted Prop Co
Private Prop Co
Overseas Investors
Private Individuals
Occupiers
Ret
ail
Ware
housi
ng In
vest
men
t (£
Bill
ions)
Page 16

Retail Pipeline
Pipeline –Total Under Construction
Source: PMA, CBRE
Retail Warehousing –Total Under Construction
Sq F
t (M
illio
ns)
Source: PMA, CBRE
Sq F
t (M
illio
ns)
Total pipeline driven by supermarket space race
New space currently under construction (circa. 6.4m sq ft) is being driven by
the grocery operators looking to capture market share from competitors. A
lack of speculative development from other retail sectors has provided an
opportunity for growth.
The UK pipeline retracted significantly during the recession with construction
levels falling as low a 5m sq ft from a pre recession peak of nearly 18m sq
ft.
Retail warehousing showing signs of recovery
Retail warehousing space under construction fell from a peak of 2.8m sq ft in
Q3 2007, pre-recession, to a low of 0.54m sq ft in Q1 2010. This
represented a significant decline in speculative development as a result of the
economic uncertainty.
Since Q1 2010, however, data shows that development has begun to slowly
increase to more encouraging levels of 0.96m sq ft in Q1 2012, an
indication that developers and investors are more confident about the
outlook.
0
2
4
6
8
10
12
14
16
18
20
Q1
20
05
Q3
20
05
Q1
20
06
Q3
20
06
Q1
20
07
Q3
20
07
Q1
20
08
Q3
20
08
Q1
20
09
Q3
20
09
Q1
20
10
Q3
20
10
Q1
20
11
Q3
20
11
Q1
20
12
Shopping Centres Retail Warehouse Supermarkets
0
0.5
1
1.5
2
2.5
3
3.5
4 Under Construction
Page 17
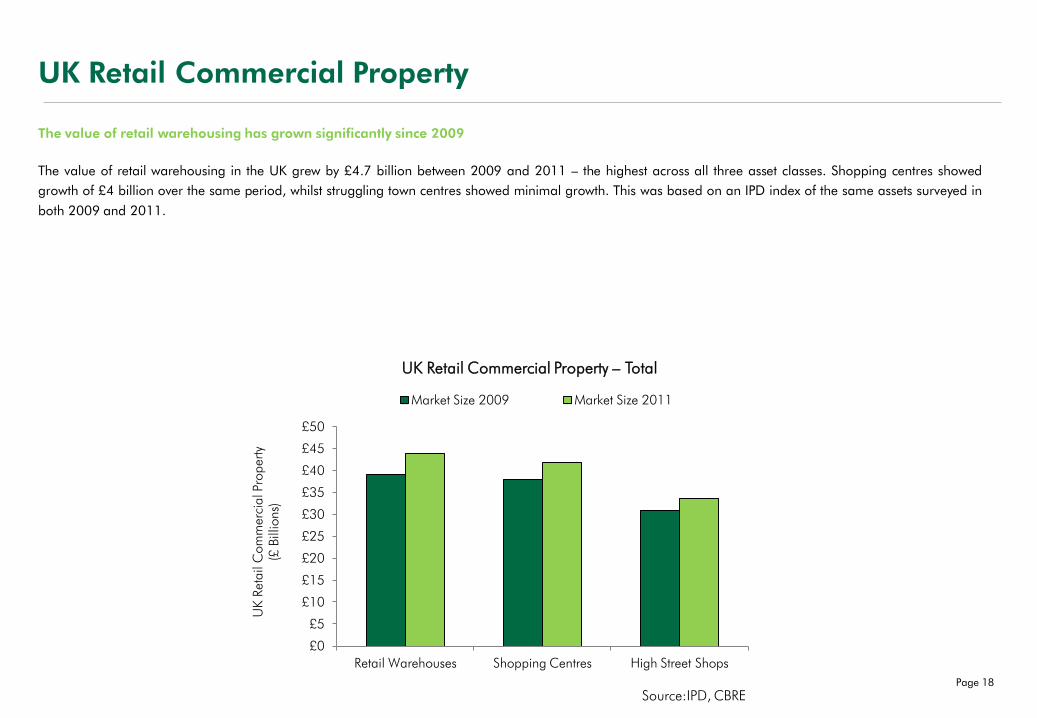
UK Retail Commercial Property
The value of retail warehousing has grown significantly since 2009
The value of retail warehousing in the UK grew by £4.7 billion between 2009 and 2011 – the highest across all three asset classes. Shopping centres showed
growth of £4 billion over the same period, whilst struggling town centres showed minimal growth. This was based on an IPD index of the same assets surveyed in
both 2009 and 2011.
£0
£5
£10
£15
£20
£25
£30
£35
£40
£45
£50
Retail Warehouses Shopping Centres High Street Shops
Market Size 2009 Market Size 2011
UK Retail Commercial Property – Total
UK R
etail
Com
mer
cial P
roper
ty
(£ B
illio
ns)
Page 18
Source:IPD, CBRE

OUT OF TOWN SECTOR
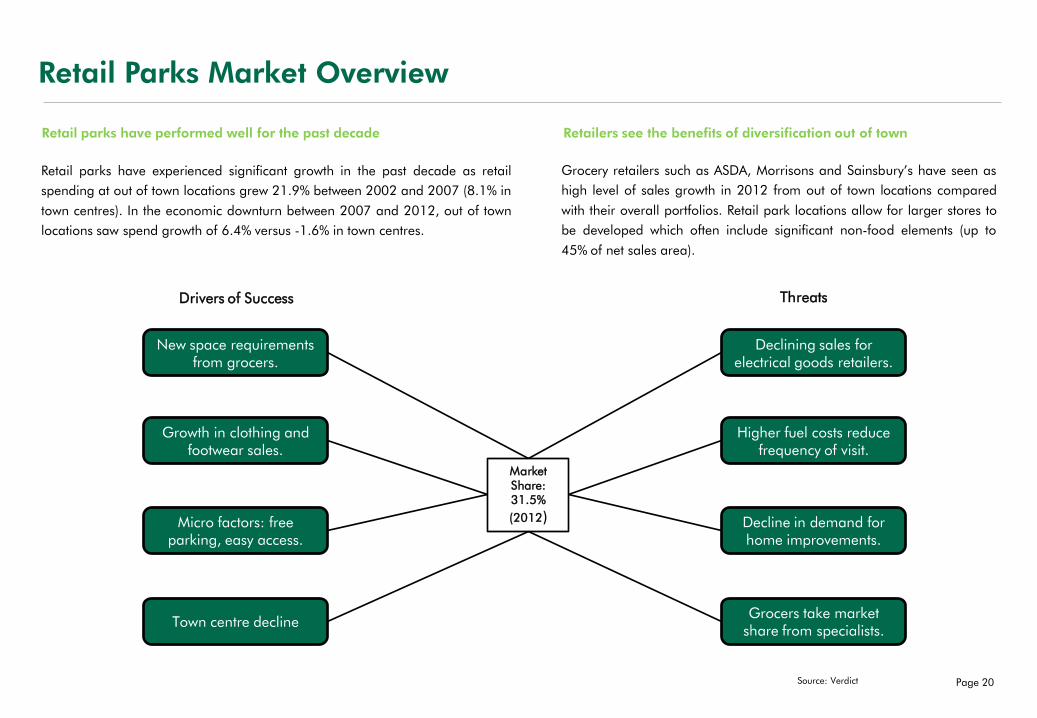
Retail Parks Market Overview
Retail parks have performed well for the past decade
Retail parks have experienced significant growth in the past decade as retail
spending at out of town locations grew 21.9% between 2002 and 2007 (8.1% in
town centres). In the economic downturn between 2007 and 2012, out of town
locations saw spend growth of 6.4% versus -1.6% in town centres.
Retailers see the benefits of diversification out of town
Grocery retailers such as ASDA, Morrisons and Sainsbury’s have seen as
high level of sales growth in 2012 from out of town locations compared
with their overall portfolios. Retail park locations allow for larger stores to
be developed which often include significant non-food elements (up to
45% of net sales area).
New space requirements from grocers.
Drivers of Success Threats
Growth in clothing and footwear sales.
Micro factors: free parking, easy access.
Town centre decline
Declining sales for electrical goods retailers.
Higher fuel costs reduce frequency of visit.
Decline in demand for home improvements.
Grocers take market share from specialists.
Source: Verdict
Market Share: 31.5%
(2012)
Page 20
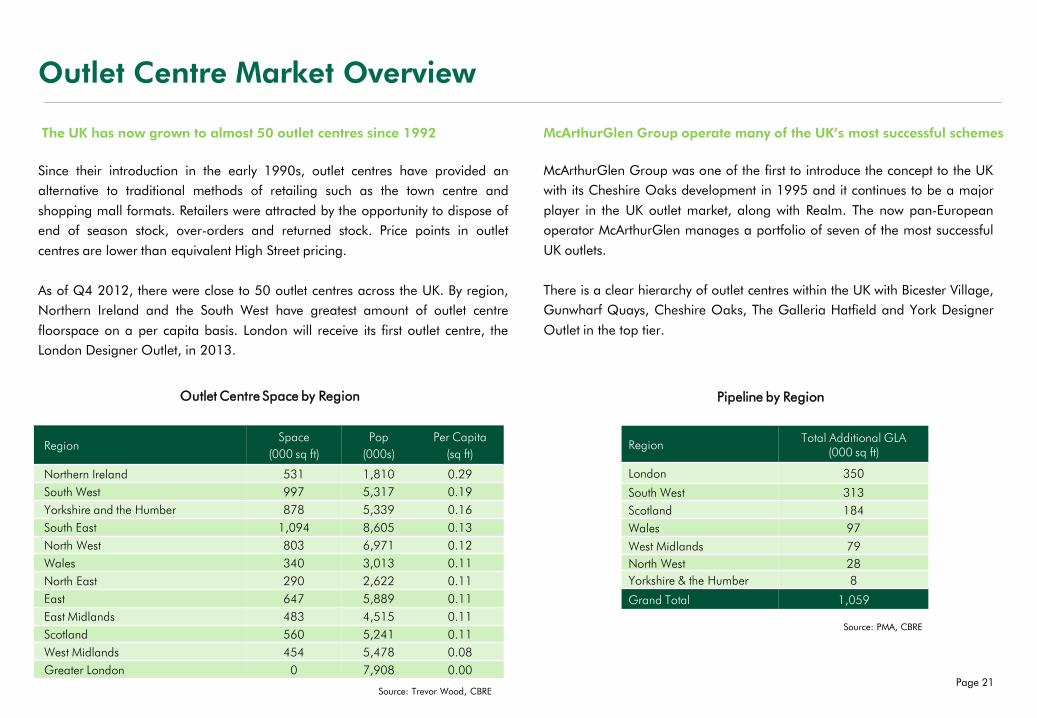
Outlet Centre Market Overview
The UK has now grown to almost 50 outlet centres since 1992
Since their introduction in the early 1990s, outlet centres have provided an
alternative to traditional methods of retailing such as the town centre and
shopping mall formats. Retailers were attracted by the opportunity to dispose of
end of season stock, over-orders and returned stock. Price points in outlet
centres are lower than equivalent High Street pricing.
As of Q4 2012, there were close to 50 outlet centres across the UK. By region,
Northern Ireland and the South West have greatest amount of outlet centre
floorspace on a per capita basis. London will receive its first outlet centre, the
London Designer Outlet, in 2013.
Region Space
(000 sq ft)
Pop
(000s)
Per Capita
(sq ft)
Northern Ireland 531 1,810 0.29
South West 997 5,317 0.19
Yorkshire and the Humber 878 5,339 0.16
South East 1,094 8,605 0.13
North West 803 6,971 0.12
Wales 340 3,013 0.11
North East 290 2,622 0.11
East 647 5,889 0.11
East Midlands 483 4,515 0.11
Scotland 560 5,241 0.11
West Midlands 454 5,478 0.08
Greater London 0 7,908 0.00
McArthurGlen Group operate many of the UK’s most successful schemes
McArthurGlen Group was one of the first to introduce the concept to the UK
with its Cheshire Oaks development in 1995 and it continues to be a major
player in the UK outlet market, along with Realm. The now pan-European
operator McArthurGlen manages a portfolio of seven of the most successful
UK outlets.
There is a clear hierarchy of outlet centres within the UK with Bicester Village,
Gunwharf Quays, Cheshire Oaks, The Galleria Hatfield and York Designer
Outlet in the top tier.
Source: Trevor Wood, CBRE
Region Total Additional GLA
(000 sq ft)
London 350
South West 313
Scotland 184
Wales 97
West Midlands 79
North West 28
Yorkshire & the Humber 8
Grand Total 1,059
Outlet Centre Space by Region Pipeline by Region
Source: PMA, CBRE
Page 21
Top 10 Out of Town Malls
Greater London Focus
Three of the top 10 out of town malls (as measured by the level of weighted /
shopper spend attracted) are located within London. As both a cause and
effect, the high weighted spend available ensures a demand for retail space
and also provides retailers with the platform to deliver strong sales.
Westfield London and Westfield Stratford have both performed extremely well
since opening. Their scale, retail offer, and lack of shopping centre provision
locally allows them to trade from large catchment areas from which they
attract high levels of shopper expenditure.
Regional malls continue to perform well as retail ‘destinations’
Bluewater retains its position as the best out of town mall in the UK,
attracting a weighted spend of £1,585m. Located close to the M25, strong
tenants and transport links ensure this position.
Meadowhall, the highest ranked centre outside the Greater London area,
trades from a large catchment area situated in a relatively uncompetitive
retail landscape, from an out of town mall perspective, which is reflected in
the high level of weighted spend attracted.
Centre NameWeighted Comparison Spend
(£m)
CBRE Gravity Model
Ranking - 2012Region
Bluewater £1,585 10 South East
Westfield London £1,222 16 Greater London
Westfield Stratford £1,202 19 Greater London
Meadowhall Centre £1,115 24 Yorkshire & Humberside
Trafford Centre £1,031 27 North West
Metro Centre £1,018 29 North East
Lakeside £1,013 30 South East
Brent Cross £983 32 Greater London
Merry Hill £922 33 West Midlands
Cribbs Causeway £594 73 South West
*CBRE Gravity Model Ranking -2012 relates to CBRE’s UK gravity model
Page 22
Retail Parks and Outlet Centres
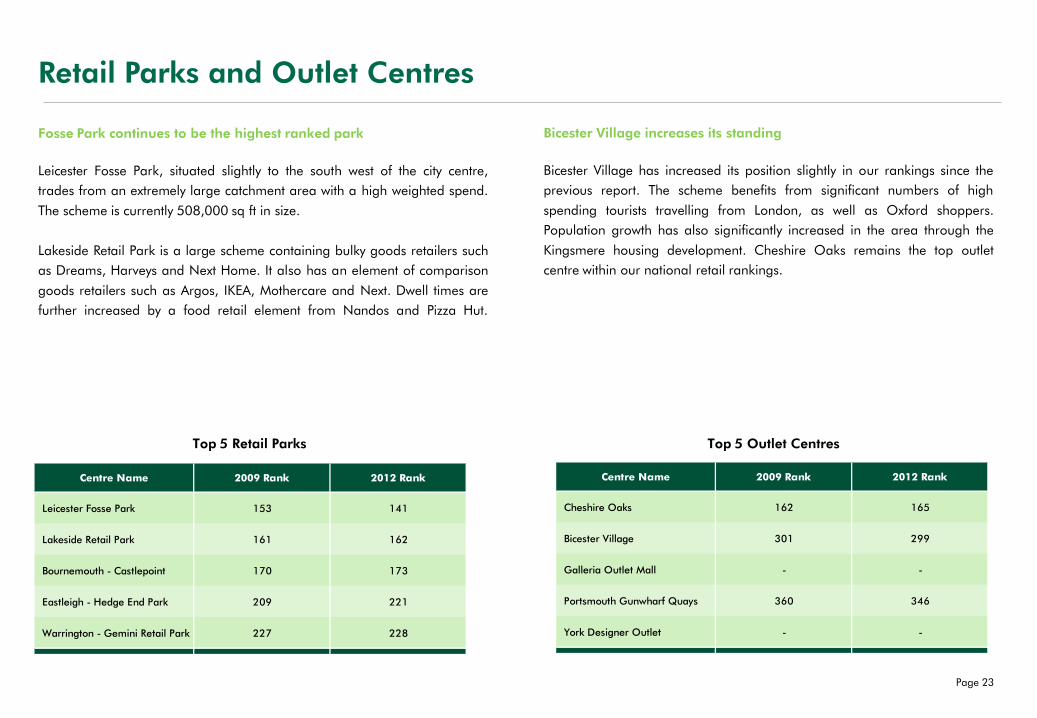
Fosse Park continues to be the highest ranked park
Leicester Fosse Park, situated slightly to the south west of the city centre,
trades from an extremely large catchment area with a high weighted spend.
The scheme is currently 508,000 sq ft in size.
Lakeside Retail Park is a large scheme containing bulky goods retailers such
as Dreams, Harveys and Next Home. It also has an element of comparison
goods retailers such as Argos, IKEA, Mothercare and Next. Dwell times are
further increased by a food retail element from Nandos and Pizza Hut.
Bicester Village increases its standing
Bicester Village has increased its position slightly in our rankings since the
previous report. The scheme benefits from significant numbers of high
spending tourists travelling from London, as well as Oxford shoppers.
Population growth has also significantly increased in the area through the
Kingsmere housing development. Cheshire Oaks remains the top outlet
centre within our national retail rankings.
Centre Name 2009 Rank 2012 Rank
Leicester Fosse Park 153 141
Lakeside Retail Park 161 162
Bournemouth - Castlepoint 170 173
Eastleigh - Hedge End Park 209 221
Warrington - Gemini Retail Park 227 228
Centre Name 2009 Rank 2012 Rank
Cheshire Oaks 162 165
Bicester Village 301 299
Galleria Outlet Mall - -
Portsmouth Gunwharf Quays 360 346
York Designer Outlet - -
Top 5 Retail Parks Top 5 Outlet Centres
Page 23

Distance Travelled and Catchment Population
Shoppers will travel further than the national average to retail parks
0 5 10 15 20 25 30
Town Centre
Leisure Park
GB Average
Retail Park
City Centre
Mall
Outlet Centre
Distance Travelled by Retail Type
Average Travel Time (Minutes)
A key reason for the development of successful retail parks is the ability to
provide shoppers with a level of convenience not offered in town centres. As
such, the distance that shoppers are required to travel to reach a retail park
is actually fairly small.
Due to their rarity, outlet centres attract the largest average drivetimes of 28
minutes. In the UK, there are just 48 outlet centres of which the largest is
Cheshire Oaks Designer Outlet. The national average distance travelled to a
retail location is just 6 minutes by comparison.
0
50,000
100,000
150,000
200,000
250,000
300,000
350,000
400,000
Average Catchment Population by Retail Type
Ave
rage C
atc
hm
ent Po
pula
tion
Retail Centre Type
Out of town malls attract the largest catchment populations
Out of town malls, on average, attract the largest catchment populations.
Aside from being able to develop a strong retail mix and be asset managed,
these schemes are often suitable for all weather types, easier to access and
have plentiful parking provision.
Town centres are shown to serve a smaller catchment area as they act as a
local destination. Shoppers are unlikely to travel very far to reach these, as
seen on the adjoining graph.
Page 24
In Town vs Out of Town by Region
Out of town now accounts for 25% of total UK retail floorspace
Out of town retail space now represents 25% of national retail floorspace.
This is due to the level of new floorspace added in the past 5 years.
Greater London has amongst the lowest amount of out of town floorspace
due to the scale of existing town centre provision, whilst the North East has
amongst the highest percentage of out of town floorspace (30.9%).
Retail parks account for the greatest proportion of retail space
Within the out of town sector itself, retail parks are by far the dominant type
of retail format, followed by out of town malls.
Greater London has the largest amount of mall floorspace out of town. This
is largely due to the presence of Westfield London and Westfield Stratford.
RegionTotal
In Town
Total
Out of TownMall Outlet Centre Retail Park Leisure Park
East Anglia 81.7% 18.3% 0.0% 0.0% 16.0% 2.4%
East Midlands 74.0% 26.0% 0.0% 6.7% 18.6% 0.7%
Greater London 80.1% 19.9% 11.6% 0.2% 8.1% 0.0%
North West 77.2% 22.8% 3.7% 3.2% 15.3% 0.6%
North East 69.1% 30.9% 10.9% 2.5% 17.5% 0.0%
Scotland 73.3% 26.7% 11.0% 1.2% 14.0% 0.6%
South East 75.0% 25.0% 4.9% 1.9% 17.6% 0.5%
South West 73.6% 26.4% 2.9% 2.1% 18.6% 2.8%
Wales 72.4% 27.6% 0.1% 4.8% 22.4% 0.3%
West Midlands 78.4% 21.6% 6.3% 1.2% 13.7% 0.5%
Yorkshire & Humberside 61.0% 39.0% 9.9% 6.8% 21.5% 0.8%
Grand Total 74.1% 25.9% 6.5% 2.7% 16.1% 0.6%
Out of Town
Page 25

Outlet Size
Out of town units are much larger in town locations
All three types of out of town retail allow retailers to trade from larger units, particularly in retail parks and malls. The average size of an in town unit (2,572 sq ft)
compares less than favourably with the size of retail parks (6,816 sq ft). This enables retailers to provide their customers with a better shopping experience overall.
At a regional level, units at retail parks are larger in the south of the country. Greater London (14,077 sq ft) has the highest average unit size whilst the South East
and South West also provide larger units to trade from.
Region In Town Mall Outlet Centre Retail Park
East Anglia 2,343 0 0 7,211
East Midlands 2,642 0 2,732 6,928
Greater London 2,824 5,688 0 14,077
North West 2,639 9,195 3,375 6,769
North East 2,668 5,197 3,451 4,569
Scotland 2,702 7,559 4,618 3,064
South East 2,608 5,357 3,132 8,317
South West 2,286 5,279 2,424 13,957
Wales 2,805 0 3,099 3,071
West Midlands 2,540 7,185 2,439 2,445
Yorkshire & Humberside 2,323 4,881 3,192 3,072
Grand Total 2,572 6,407 3,208 6,816
Out of Town*All figures are average unit sizes (Sq Ft)
Page 26
Spend Density and Future Floorspace Requirements
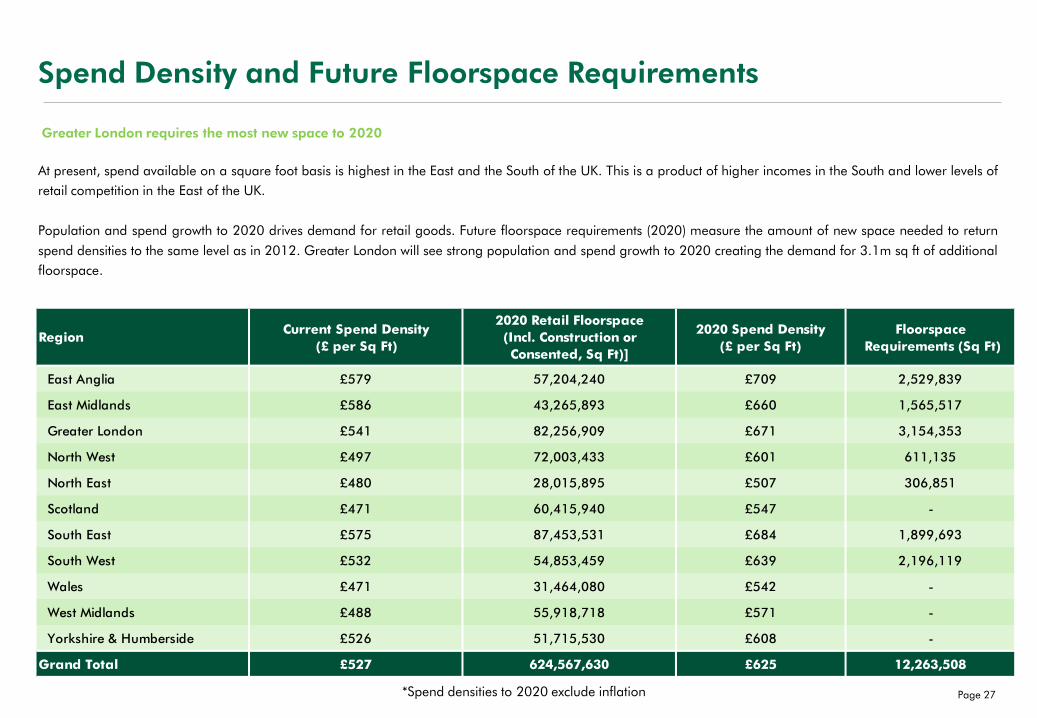
Greater London requires the most new space to 2020
At present, spend available on a square foot basis is highest in the East and the South of the UK. This is a product of higher incomes in the South and lower levels of
retail competition in the East of the UK.
Population and spend growth to 2020 drives demand for retail goods. Future floorspace requirements (2020) measure the amount of new space needed to return
spend densities to the same level as in 2012. Greater London will see strong population and spend growth to 2020 creating the demand for 3.1m sq ft of additional
floorspace.
RegionCurrent Spend Density
(£ per Sq Ft)
2020 Retail Floorspace
(Incl. Construction or
Consented, Sq Ft)]
2020 Spend Density
(£ per Sq Ft)
Floorspace
Requirements (Sq Ft)
East Anglia £579 57,204,240 £709 2,529,839
East Midlands £586 43,265,893 £660 1,565,517
Greater London £541 82,256,909 £671 3,154,353
North West £497 72,003,433 £601 611,135
North East £480 28,015,895 £507 306,851
Scotland £471 60,415,940 £547 -
South East £575 87,453,531 £684 1,899,693
South West £532 54,853,459 £639 2,196,119
Wales £471 31,464,080 £542 -
West Midlands £488 55,918,718 £571 -
Yorkshire & Humberside £526 51,715,530 £608 -
Grand Total £527 624,567,630 £625 12,263,508
*Spend densities to 2020 exclude inflation Page 27

Future Trends and the Out Of Town Market
Growth of online retailing
Current estimates suggest that online sales account for 8% of total retail sales in the UK (Javelin,
2011). However, the impact on bricks and mortar stores varies significantly by sector. Many retailers
are seeking to provide a fully integrated multi-channel offer to drive sales from online into stores.
Both landlords and retailers in the out of town sector must adapt to changing consumer demands by
embracing the item collection model introduced by Amazon and others, as well as allowing customers
to ‘click and collect’ items from physical stores. This provides the opportunity to target ‘active’
customers so that bricks and mortar becomes more than simply a collection point.
The charts displayed on the right illustrate that the shift of retail to online suppliers varies considerably
by category. Key out of town product categories such as food, furniture and DIY have seen minimal
impact ensuring that demand for retail space is sustained. Moreover, the number of ‘tangible retail’
units has still increased significantly since 1988 despite the growing presence of e-commerce.
Changing demand from grocery retailers
Grocery retailers have driven demand for new out of town space, particularly through larger
hypermarket formats with higher proportions of non-food space. However, Tesco has recently stated
its intentions to reduce its Tesco Extra format. Coupled with a focus on convenience town centre
supermarkets (Aldi, Co-Op, Tesco and Waitrose) this could potentially reduce out of town
requirements going forward.
Source: CBRE, Verdict
Retail casualties
Retail parks were impacted by a series of administrations in 2008 and 2009 as well as more recently
with the failure of Blacks, Comet and La Senza. Due to a shortage of A1 consent, fashion parks have
recovered well through strong demand. Moreover, when retailers fall into administration they still
want to remain in bigger, more dominant schemes. -20,000 -10,000 0 10,000 20,000 30,000 40,000
Tangible Retail
Leisure
Food
Bulky Deliverables
Niche Food
Old Service
Branded Electronics
Supermarket Impact
Electronically Transferable
Source: Retail Locations
Page 28
Internet Sales % - Penetration by Category
Chain branch change – 1988 to 2011

Future Trends and the Out Of Town Market
Strategies for success can be implemented by both landlords and retailers
LAN
DLO
RD
S
RETA
ILERS
Improve private car and public transport access to schemes.
Attract expanding retailers out of town to ensure a fresh tenant mix.
Encourage umbrella brands (e.g. Arcadia) to have multi-brand out of town units.
Embrace multi-channel retailing opportunities (inc. click and collect).
Refresh store layout and fit-out to retain customer loyalty.
Offer consumers a quality of mix of product ranges over a larger floorplate.
-------------------------------------------------------------------------------------------------------------------------------------------------------------------------------------------------------------------------
Page 29

Disclaimer & Contacts
For more information regarding this report, please contact:
Tom McDonough
Retail Consultancy
Associate Director
T: 0207 182 3326
Information herein has been obtained from sources believed to be reliable. While we do not doubt its accuracy, we have not verified it and make no guarantee,
warranty or representation about it. The material provided by us is intended for the sole use of the person or firm to whom it is provided. Any projections,
opinions, assumptions or estimates used are for example only and are our best estimate of the future performance of the market.
Adam Caplan
Retail Consultancy
Consultant
T: 0207 182 2650