accessible and affordable housing supply and demand in ... · accessible and affordable housing...
TRANSCRIPT

A partnership among Keystone College, King’s College, Luzerne County Community College, Marywood University, Misericordia University, Penn State Wilkes-Barre, The Commonwealth Medical College,
University of Scranton & Wilkes University
2015
ACCESSIBLE AND AFFORDABLE HOUSING SUPPLY AND DEMAND IN LACKAWANNA AND LUZERNE COUNTIES Lackawanna and Luzerne County have older housing stock, aging population and increasing individuals with disabilities. This combination leads to challenges in accessible housing. This brief also examines income of this cohort in an effort to understand the affordability of this specialized housing.

Table of Contents Introduction .................................................................................................................................................. 1
Research Methods & Limitations .................................................................................................................. 1
Supply Analysis .............................................................................................................................................. 2
Demand Analysis ........................................................................................................................................... 4
Analysis & Conclusions .................................................................................................................................. 8
Endnotes ..................................................................................................................................................... 10
The Institute for Public Policy & Economic Development (The Institute) is a partnership of nine colleges and universities in the Scranton/ Wilkes-Barre/ Hazleton Metropolitan Statistical Area. The Institute’s managing partner is Wilkes University.
The Institute works on proprietary research studies for public, non-profit, and private companies in several states. The Institute provides data, analysis, strategy, and implementation recommendations to provide solutions to clients. The Institute services include:
• Indicators – Indexes • Community Health Assessments • Market and Feasibility Analyses • Economic Development Strategies • Economic and Tax Impact Studies • Data and Data Analysis • Industry Studies • Housing Studies • Workforce Studies • Education Studies • Economic and Demographic Profiles
• Policy Analysis and Program Evaluation Support
• Research Validation and Peer Review • Site Selection Research • Arts & Culture Studies • Tourism Strategic Plans • Comprehensive Plans • Social Science Research and Survey Design • Strategy Development, Planning and
Collaborative Processes • Asset Maps
©The Institute. All Rights Reserved 2015

Community Based Research Sponsors
Signature Underwriters Andrew J. Sordoni Foundation
Luzerne County Sordoni Family Foundation
William B. Sordoni
Contributing Underwriters Borton Lawson
Commonwealth Health Systems Geisinger Health System
Greater Wilkes-Barre Chamber of Business & Industry
Mohegan Sun Pocono PPL Electric
Shoval Enterprises Wells Fargo Foundation
Supporting Underwriters Berkshire Asset Management
BlackOut Design Frontier Communications
Luzerne County Housing Partnership M&T Bank
Mohegan Sun Pocono OneSource Staffing Powell Shale Digest
Prudential Retirement Services Sanofi Pasteur
Study prepared by: The Institute for Public Policy & Economic Development Teri Ooms, Executive Director Andrew Chew, Research Analyst Nimita Patel, Research Assistant Research Interns – Robert Kehler and Robert Werner, both from King’s College
The Institute’s Housing Task Force Charles Kasko, Wyoming Valley Motors - Chair Athena Aardweg, Self Determination Housing Project Joe Boylan, Greater Wilkes-Barre Chamber of Business & Industry Jesse Ergott, NeighborWorks NEPA Steven Farrell, Classic Realty Patrick Fricchione, Simplex Homes Lyn Kirschenbaum, U.S. HUD Joe Terrana, Terrana Law Ellen Watkins, KNBT Bank
Page | 1
Introduction For individuals with disabilities, finding housing that is both affordable and accessible can be a challenge. While significant attention is given to issues of housing affordability in general, the purpose of this report is to explore housing affordability as it relates to those who need accessible housing. Generally, this includes older and disabled residents who have mobility, vision, hearing, or other impairments. This population also tends to be economically disadvantaged, exacerbating the need for housing that is both affordable and accessible.
The scope of the report will be to analyze the supply and demand for accessible and affordable housing. Ultimately, this report hopes to give insight about whether accessible and affordable housing is, and will be, a problem in Lackawanna and Luzerne counties.
Accessible housing can be defined as housing that accommodates a mobility, mental, vision, or hearing disability.1 Generally, these accommodations may include accessible light switches, outlets and thermostats, reinforced bathroom walls, entrance ramps, or enlarged common-use areas.2 Alternative and intense light sources, large print or braille labels on typical household objects, vocal communicators, and magnification devices are all examples of accommodations for the vision-impaired.3 Strobe-light activated carbon monoxide detectors, visual buzzers/timers for appliances, flashing smoke detectors, and a vibrating pager that corresponds with the doorbell are all hearing-impaired accommodations.4
Affordable housing, according to the United States Department of Housing and Urban Development (HUD), can be defined as any housing unit that does not cost burden its resident. The Department of Housing and Urban Development states: “Families who pay more than 30 percent of their income for housing are considered cost burdened.”5
Research Methods & Limitations The research was conducted as a two-step analysis: first, supply data was gathered and analyzed to provide an overview of the current stock of affordable and accessible housing. Then, demand for affordable and accessible housing was analyzed based on economic and demographic data. Information about affordable and accessible housing, including regulations and policies, was available from the HUD website.
The supply statistics are from subsidized housing programs. Affordable housing is constructed and maintained through several distinct programs, including the Low Income Housing Tax Credit (LIHTC), USDA-RD Multi-Family Housing, Project-Based Section 8, and through local programs and individual housing authorities.
Data on affordable, accessible housing supply is not uniformly collected and maintained, so several sources were used together for this study. Records of LIHTC and USDA-RD Multi-Family Housing were gathered, and supplemented with local data from housing authorities. The data was cleaned of duplicate properties to avoid double-counting of units.

Page | 2
There are many properties whose units were unable to be counted because their accessibility status was unknown. There are at least 30 properties for which the number or availability of accessible units was unavailable. The analysis therefore only includes properties where the number of accessible units is known. Due to these limitations, the analysis of supply will be a qualitative summary that attempts to provide a general overview of the state of affordable housing supply in the region, rather than an exhaustive account of all affordable and accessible units. Transitional and emergency shelters are not included in the data. Affordable housing that is not a part of a subsidized property is also not included. Particularly, housing secured through a Housing Choice Voucher (formerly the Section 8 program) is absent from the data because accessibility information is not available for those homes, which are secured by renters on their own.
The demand data was taken from 2010 through 2013 American Community Survey 1-Year Estimate data sets from the United States Census Bureau. All data is considered accurate as of late 2014. The economic and demographic data are used to understand the need for affordable and accessible housing.
Finally, the supply and demand data are synthesized in order to draw conclusions about the adequacy of the region’s supply of affordable accessible housing going forward.
Supply Analysis The supply of affordable housing in the region is represented by several distinct sources of housing, including LIHTC, USDA-RD Multi-Family Housing, and others. Only properties where the number of accessible units could be found were included in the dataset.
There are a total of 2,505 affordable housing units in 36 separate properties included in the analysis. Of those, at least 354 are accessible. This represents about 14 percent of the total units studied. Luzerne County has a larger number of total units, a larger number of accessible units, and a larger share of accessible units.
Most properties do not list their number of accessible units, as stated previously, so this data should be considered to be a sample of subsidized housing in the region. There is also little to
Page | 3
no information about the specific accommodations or modifications that make these units accessible, and the definition of accessibility may not be uniform from property to property.
Despite these limitations, the supply of accessible affordable housing is likely to rise in the future due to federal regulations on the minimum number of accessible units in new affordable housing complexes. The Department of Housing and Urban Development requires that newly constructed federally-assisted housing must have:
• A minimum of five percent of dwelling units, or one unit, whichever is greater, accessible to individuals with mobility disabilities
• An additional two percent of dwelling units, or one unit, whichever is greater, accessible to individuals with hearing and/or vision impairment.6
Currently, the subsidized housing stock in both Lackawanna and Luzerne counties appears to meet and exceed this standard.
One potential challenge is that individuals with disabilities who are younger than 55 or 62 years of age may have difficulty finding housing in some locations. Most affordable housing properties examined were age restricted, catering only to seniors. Some waive the age minimums for disabled renters, but only a few properties are open to families and/or the general public. Regionally, only about 20 percent of affordable, accessible units are in such properties. Though mobility, hearing, and vision impairments are more prevalent among the older adult population, younger individuals with these impairments may have greater difficulty finding subsidized housing.
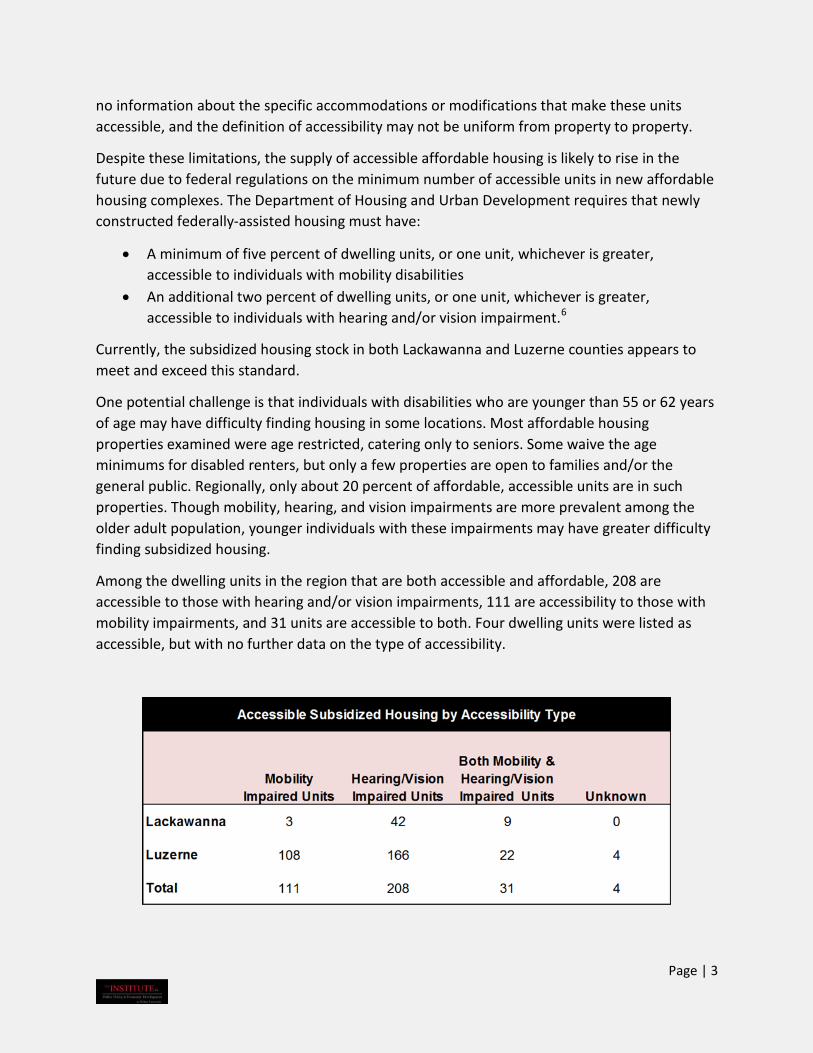
Among the dwelling units in the region that are both accessible and affordable, 208 are accessible to those with hearing and/or vision impairments, 111 are accessibility to those with mobility impairments, and 31 units are accessible to both. Four dwelling units were listed as accessible, but with no further data on the type of accessibility.

Page | 4
Based on the limited data available for analysis, the total number of accessible units in the region appears generally sufficient. Regionally and in both counties, the overall proportion of accessible affordable units exceeds the standards set by HUD for newly constructed housing. However, in Lackawanna County, the share of mobility impaired units falls short of the federal standard. Only 2.4 percent of units studied in Lackawanna County were accessible to those with mobility impairments, well short of the five percent minimum now required by HUD. Both counties are far ahead of the federal standard of two percent when it comes to units for those with hearing and/or vision impairments.
Demand Analysis The chart below displays the number of disabled residents in both counties. Between 2010 and 2012, the number of disabled residents in both counties trended downwards. From 2012 to 2013, the downward trend in Luzerne County continued, while Lackawanna County experienced a 16 percent increase.
Source: U.S. Census Bureau ACS 1-year Estimates
Over the four years analyzed, Lackawanna County’s disabled population has increased two out of three times—comparatively, Luzerne County’s has decreased two out of three times. As of 2013, the total number of disabled residents in both counties was 79,636, two percent lower than in 2010.
The Census Bureau also keeps statistics on the number of disabled residents by disability type. It provides more insight and depth because accessible housing is often categorized by accessibility, e.g. vision & hearing or mobility. The US Census’s data recognized six classifications of difficulty: (1) hearing, (2) vision, (3) cognitive, (4) ambulatory, (5) self-care, and (6) independent living.
Page | 5
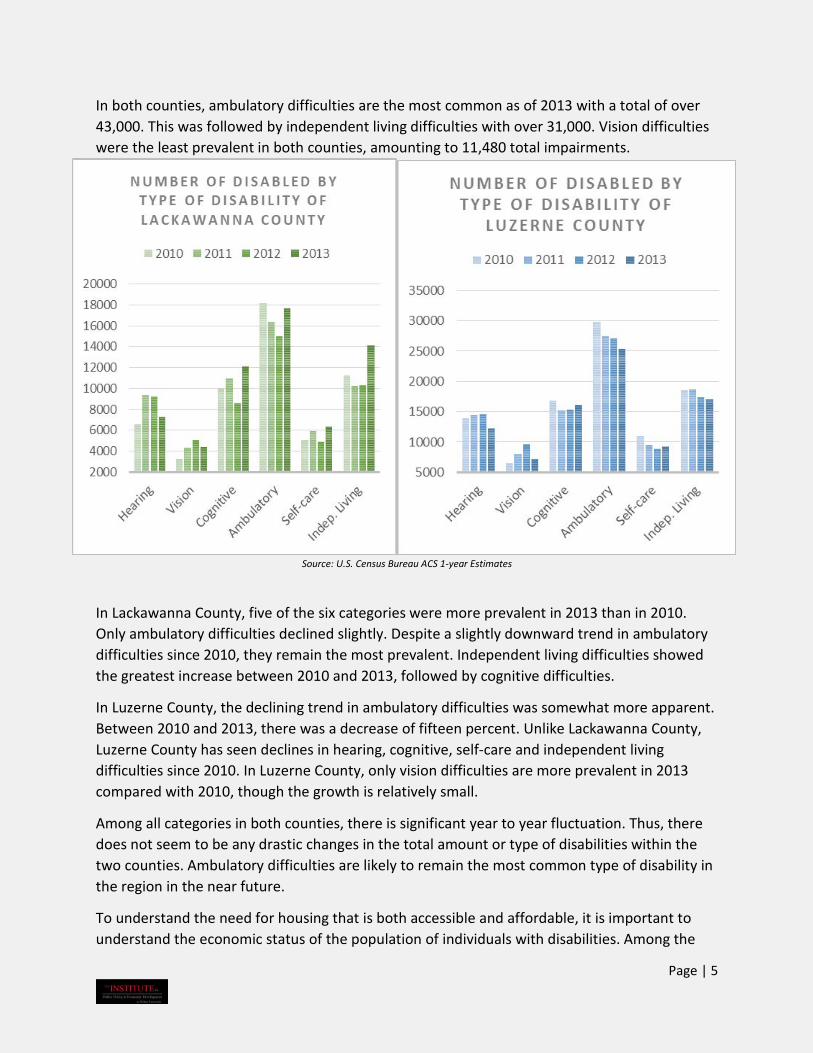
In both counties, ambulatory difficulties are the most common as of 2013 with a total of over 43,000. This was followed by independent living difficulties with over 31,000. Vision difficulties were the least prevalent in both counties, amounting to 11,480 total impairments.
Source: U.S. Census Bureau ACS 1-year Estimates
In Lackawanna County, five of the six categories were more prevalent in 2013 than in 2010. Only ambulatory difficulties declined slightly. Despite a slightly downward trend in ambulatory difficulties since 2010, they remain the most prevalent. Independent living difficulties showed the greatest increase between 2010 and 2013, followed by cognitive difficulties.
In Luzerne County, the declining trend in ambulatory difficulties was somewhat more apparent. Between 2010 and 2013, there was a decrease of fifteen percent. Unlike Lackawanna County, Luzerne County has seen declines in hearing, cognitive, self-care and independent living difficulties since 2010. In Luzerne County, only vision difficulties are more prevalent in 2013 compared with 2010, though the growth is relatively small.
Among all categories in both counties, there is significant year to year fluctuation. Thus, there does not seem to be any drastic changes in the total amount or type of disabilities within the two counties. Ambulatory difficulties are likely to remain the most common type of disability in the region in the near future.
To understand the need for housing that is both accessible and affordable, it is important to understand the economic status of the population of individuals with disabilities. Among the
Page | 6
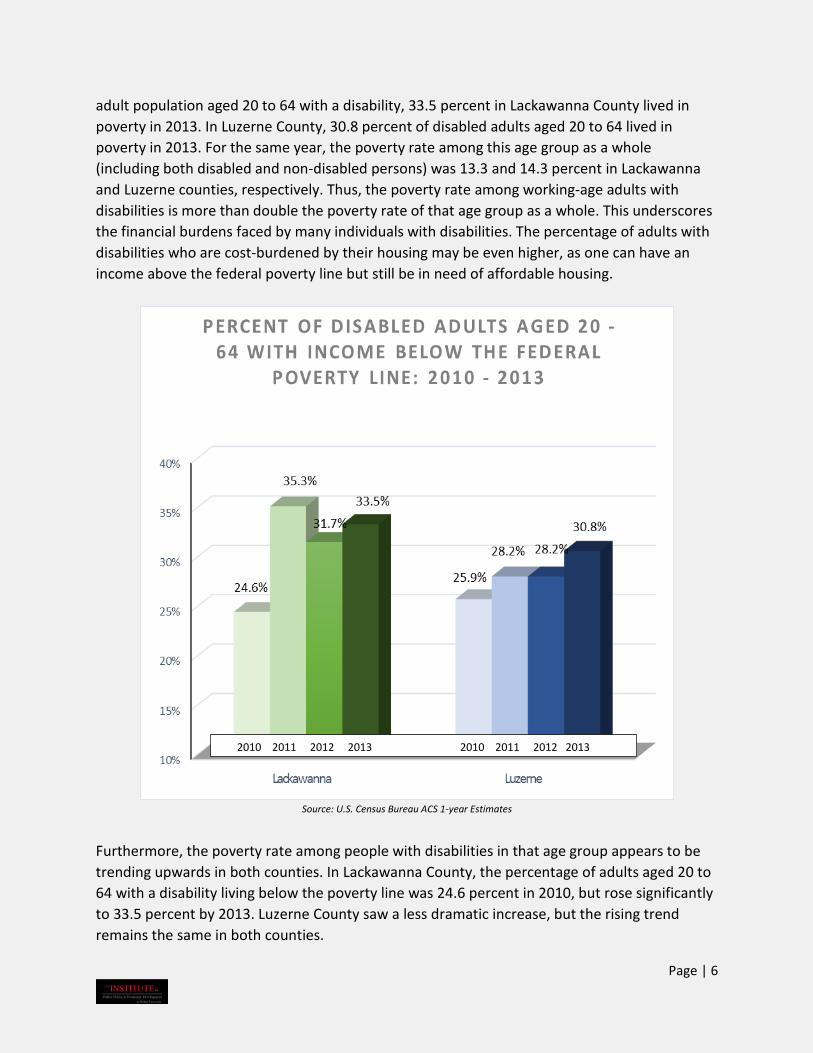
adult population aged 20 to 64 with a disability, 33.5 percent in Lackawanna County lived in poverty in 2013. In Luzerne County, 30.8 percent of disabled adults aged 20 to 64 lived in poverty in 2013. For the same year, the poverty rate among this age group as a whole (including both disabled and non-disabled persons) was 13.3 and 14.3 percent in Lackawanna and Luzerne counties, respectively. Thus, the poverty rate among working-age adults with disabilities is more than double the poverty rate of that age group as a whole. This underscores the financial burdens faced by many individuals with disabilities. The percentage of adults with disabilities who are cost-burdened by their housing may be even higher, as one can have an income above the federal poverty line but still be in need of affordable housing.
Source: U.S. Census Bureau ACS 1-year Estimates
Furthermore, the poverty rate among people with disabilities in that age group appears to be trending upwards in both counties. In Lackawanna County, the percentage of adults aged 20 to 64 with a disability living below the poverty line was 24.6 percent in 2010, but rose significantly to 33.5 percent by 2013. Luzerne County saw a less dramatic increase, but the rising trend remains the same in both counties.
2010 2011 2012 2013 2010 2011 2012 2013

Page | 7
Based on the data shown here, the total size of the disabled adult population younger than 65 is not likely to change substantially in the foreseeable future, though the percentage of those individuals living in poverty has been on the rise. That means that the number of disabled individuals with a need for affordable and accessible housing could also rise as economic hardships continue to disproportionately impact the disabled population. Among individuals with disabilities aged 65 or older, the poverty rate was lower compared with individuals with disabilities aged 20 to 64. In 2013, 16.4 percent and 10.9 percent of individuals with disabilities aged 65 or older lived below the poverty line in Lackawanna and Luzerne counties, respectively. Though these ratios are lower than the working age disabled population, they are still consistently higher than the rates of poverty of the population older than 65 that have no disabilities.
Source: U.S. Census Bureau ACS 1-year Estimates
It is apparent that individuals with disabilities of all ages face disproportionate levels of poverty in Lackawanna and Luzerne counties. This underscores the need for affordable housing that is
2010 2011 2012 2013 2010 2011 2012 2013
Page | 8
accessible to people with differing impairments or difficulties. Based on these demand factors, there will be a continued need for accessible and affordable housing, and this demand may even grow, particularly for disabled adults younger than age 65.
Analysis & Conclusions On the surface, the number and proportion of accessible units in the properties analyzed appear sufficient. Regionally, the proportion of accessible units exceeds HUD’s current minimums for newly constructed subsidized housing.
There may, however, be a mismatch in the type of accessibility offered compared with the need of the population. While both counties have a significant share of dwellings suitable for those with hearing/vision impairments, there are fewer units accessible to those with mobility impairments. This presents a challenge, particularly considering that ambulatory disabilities are the most prevalent type of disability within the two counties. Thus, newly constructed affordable housing in Lackawanna and Luzerne counties should attempt to provide a greater number of units suitable for those with mobility impairments.
Many disabled residents are older than 65. As people age, they tend to be more likely to have one or more disabilities. In Lackawanna and Luzerne counties, there were nearly 100,000 residents older than 65 as of 2013. Though this is fewer than in 2000, the two counties have a higher proportion of older residents than Pennsylvania or the United States as a whole. As this age cohort ages, and the Baby Boomer generation enters retirement age, the need for housing for seniors with disabilities will continue. According to a recent report from the Harvard Joint Center for Housing Studies, “The population aged 65 and older is projected to soar to 73 million by 2030, an increase of 33 million in just two decades. Assuming the current income distribution remains the same, we can expect to see an increase in lower income older adults. Those earning less than $15,000 annually will increase by 37 percent to 6.5 million. Couple that with the need for increasing accessibility for seniors, there is and will continue to be a gap in affordable and accessible housing.”
However, there is also a distinct need for affordable and accessible housing for individuals younger than age 65. Many subsidized housing properties examined cater primarily to older adults, often 55, 62, or 65 years and older. It is important to consider that many people with a need for accessible and affordable housing, particularly those living with their family, may have difficulty finding housing within existing properties.
Many of the income-based properties examined also have waiting lists. For at least some properties, waiting lists have been closed due to the overwhelming demand. Data was not available on the length of time people typically wait for affordable housing, or whether waitlist times are longer or shorter for affordable accessible units compared with affordable units in general, but a continued high demand for affordable housing in our region has resulted in waiting lists at a number of properties.
Page | 9
The rate of incidence of disabilities is not showing a strong trend either upward or downward. Furthermore, the disproportionately high rate of poverty among individuals with disabilities may be growing, particularly among those with disabilities aged 20 to 64. Given the likelihood that demand for accessible and affordable housing units will persist and perhaps grow, efforts must be made to ensure that new affordable housing is constructed with as many units as possible accessible to individuals with various impairments or difficulties and that existing housing be retrofitted, where possible, to better accommodate residents with differing abilities or difficulties.
Page | 10
Endnotes 1 HUD (2014). Disability Rights in Housing. People with Disabilities. Retrieved September 12, 2014, from http://portal.hud.gov/hudportal/HUD?src=/program_offices/fair_housing_equal_opp/disabilities/inhousing. 2 HUD (2014). Disability Rights in Housing. People with Disabilities. Retrieved September 12, 2014, from http://portal.hud.gov/hudportal/HUD?src=/program_offices/fair_housing_equal_opp/disabilities/inhousing. 3 American Foundation for the Blind (2014). Types of Accommodations. Living with Vision Loss. Retrieved October 6, 2014, from http://www.afb.org/info/living-with-vision-loss/for-job-seekers/for-employers/accommodations-for-workers-with-vision-loss/types-of-accommodations/12345. 4 Minnesota Department of Human Services (2014). Solutions. Hearing Loss – Home Modification Checklist. Retrieved October 6, 2014, from http://www.dhs.state.mn.us/main/groups/disabilities/documents/pub/dhs_id_018476.pdf. 5 HUD (2014). Affordable Housing. Affordable Housing. Retrieved September 24, 2014, from http://portal.hud.gov/hudportal/HUD?src=/program_offices/comm_planning/affordablehousing. 6 HUD (2014). Accessibility Requirements for Buildings. Accessibility Requirements for Buildings – HUD. Retrieved September 15, 2014, from http://portal.hud.gov/hudportal/HUD?src=/program_offices/fair_housing_equal_opp/disabilities/accessibilityR.