access to justice and legal needs - law and … to justice and legal needs ... 3. legal aid - new...
TRANSCRIPT
ACCESS TO JUSTICE ANDLEGAL NEEDS
A project to identify legal needs, pathways and barriers fordisadvantaged people in NSW
A Compendium of Service Usage Data from NSW Legal Assistance andDispute Resolution Services, 1999–2002
STAGE 1: DATA DIGEST
LAW AND JUSTICEFOUNDATION OF NEW
SOUTH WALES
Far WestNorth Western
Northern
Murray
SouthEastern
Illawarra
Sydney
Hunter
Murrumbidgee
Central West
Mid-NorthCoast
Richmond–Tweed

ACCESS TO JUSTICE ANDLEGAL NEEDS
A project to identify legal needs, pathways and barriers fordisadvantaged people in NSW
STAGE 1: DATA DIGEST
A Compendium of Service Usage Data from NSW Legal Assistance andDispute Resolution Services, 1999–2002
Sue Scott, Ann Eyland, Abigail Gray, Albert Z. Zhou, Christine Coumarelos
February 2004
LAW AND JUSTICE FOUNDATION OF NEW SOUTH WALES

© Law and Justice Foundation of New South Wales February 2004
This publication is part of a scholarly, refereed monograph series. Monographs are refereed by at least two appropriate
external referees who are independent of the Foundation and any other organisations/authors involved in the publication.
Any opinions expressed in this publication are those of the authors and do not necessarily reflect the views of the Law and
Justice Foundation Board of Governors.
This publication is copyright. It may be reproduced in part or in whole for educational purposes as long as proper credit is
given to the Law and Justice Foundation of New South Wales.
National Library of Australia Cataloguing-in-Publication data:
Access to justice and legal needs : a project to identify
legal needs, pathways and barriers for disadvantaged people
in NSW. Stage 1, Data digest : a compendium of service
usage data from NSW Legal Assistance and Dispute Resolution
Services, 1999-2002.
New ed.
ISBN 0 909136 86 6.
1. Justice, Administration of - New South Wales. 2. Legal
assistance to the poor - New South Wales - Digests.
3. Legal aid - New South Wales - Digests. 4. Equality before
the law - New South Wales. 5. Law - Economic aspects - New
South Wales. I. Scott, Sue, 1956- .
347.944
Law and Justice Foundation of New South Wales
L14, 130 Pitt Street
Sydney NSW 2000
GPO Box 4264, Sydney NSW 2001
Phone: (02) 9221 3900
Fax: (02) 9221 6280
Email: [email protected]
<http://www.lawfoundation.net.au>
Privacy disclaimer. No data which would allow identification of individual survey participants has been used.

Contents
Preface ......................................................................................................................................................................................... v
Acknowledgements .............................................................................................................................................................. vi
Executive Summary ............................................................................................................................................................. vii
Access to Justice and Legal Needs Research Program: Terms of Reference .................................... xiii
Introduction .......................................................................................................................................................... 1
Structure and scope .................................................................................................................................................................. 2
Limitations of the data .............................................................................................................................................................. 4
SECTION 1: LEGAL ASSISTANCE SERVICES ........................................................................................................... 5
Introduction ................................................................................................................................................................................. 7
Methodology ................................................................................................................................................................................ 8
Chapter 1: The Type of Legal Matter ......................................................................................................................... 11
Overview .................................................................................................................................................................................... 13
Legal Aid NSW Information/Advice Service ....................................................................................................................... 16
Legal Aid NSW Duty Solicitor Service ................................................................................................................................. 18
LawAccess NSW ..................................................................................................................................................................... 20
NSW Community Legal Centres (Generalist) ................................................................................................................. 22
Chamber Magistrate Service ................................................................................................................................................ 24
Chapter 2: Demographic Characteristics of Service Users ............................................................................ 25
Gender ....................................................................................................................................................................................... 26Overview .................................................................................................................................................................................. 27Proportion of inquiries, Legal Aid NSW Information/Advice Service ..................................................................................... 28Proportion of inquiries, Legal Aid NSW Duty Solicitor Service .............................................................................................. 29Proportion of inquiries, NSW Community Legal Centres ........................................................................................................ 30Legal matter, Legal Aid NSW Information/Advice Service ..................................................................................................... 31Legal matter, NSW Community Legal Centres ......................................................................................................................... 32
Age .............................................................................................................................................................................................. 33Overview .................................................................................................................................................................................. 34Proportion of inquiries, Legal Aid NSW Advice Service ......................................................................................................... 35Proportion of inquiries, Legal Aid NSW Duty Solicitor Service .............................................................................................. 36Proportion of inquiries, LawAccess NSW .............................................................................................................................. 37Proportion of inquiries, NSW Community Legal Centres ........................................................................................................ 38Legal matter, Legal Aid NSW Advice Service ......................................................................................................................... 39Legal matter, LawAccess NSW .............................................................................................................................................. 40Legal matter, NSW Community Legal Centres ......................................................................................................................... 41
Country of birth ......................................................................................................................................................................... 42Overview .................................................................................................................................................................................. 43Proportion of inquiries, Legal Aid NSW Advice Service ......................................................................................................... 45Proportion of inquiries, Legal Aid NSW Duty Solicitor Service .............................................................................................. 46Proportion of inquiries, NSW Community Legal Centres ........................................................................................................ 47Legal matter, Legal Aid NSW Advice Service ......................................................................................................................... 48Legal matter, NSW Community Legal Centres ......................................................................................................................... 49

iv Access to Justice and Legal Needs — Data Digest
Indigenous Australians .......................................................................................................................................................... 50Overview .................................................................................................................................................................................. 51Proportion of inquiries, Legal Aid NSW Advice Service ......................................................................................................... 52Proportion of inquiries, Legal Aid NSW Duty Solicitor Service .............................................................................................. 53Proportion of inquiries, NSW Community Legal Centres ........................................................................................................ 54Legal matter, Legal Aid NSW Advice Service ......................................................................................................................... 55Legal matter, NSW Community Legal Centres ......................................................................................................................... 56
Source of income .................................................................................................................................................................... 57Overview .................................................................................................................................................................................. 58Proportion of inquiries, Legal Aid NSW Advice Service ......................................................................................................... 59Proportion of inquiries, Legal Aid NSW Duty Solicitor Service .............................................................................................. 60Proportion of inquiries, NSW Community Legal Centres ........................................................................................................ 61Legal matter, Legal Aid NSW Advice Service ......................................................................................................................... 62Legal matter, NSW Community Legal Centres ......................................................................................................................... 63
Region of residence ............................................................................................................................................................... 64Overview .................................................................................................................................................................................. 65Proportion of inquiries, Legal Aid NSW Information/Advice Service ..................................................................................... 67Proportion of inquiries, Legal Aid NSW Duty Solicitor Service .............................................................................................. 70Proportion of inquiries, LawAccess NSW .............................................................................................................................. 72Proportion of inquiries, NSW Community Legal Centres ........................................................................................................ 74Proportion of inquiries, Chamber Magistrate Service ............................................................................................................. 76Legal matter, Legal Aid NSW Information/Advice Service ..................................................................................................... 78Legal matter, LawAccess NSW .............................................................................................................................................. 81Legal matter, NSW Community Legal Centres ......................................................................................................................... 84
Chapter 3: Pathways of Service Users ...................................................................................................................... 87
Source of Inquiry: Overview .................................................................................................................................................. 88Legal Aid NSW Advice Service ................................................................................................................................................ 88Legal matter, Legal Aid NSW Advice Service ......................................................................................................................... 89
Referral destination: Overview ............................................................................................................................................ 90Legal Aid NSW Information Service ......................................................................................................................................... 91LawAccess NSW ..................................................................................................................................................................... 92NSW Community Legal Centres ............................................................................................................................................... 93Legal matter, Legal Aid NSW Information Service .................................................................................................................. 94Legal matter, LawAccess NSW .............................................................................................................................................. 95Legal matter, NSW Community Legal Centres ......................................................................................................................... 96
SECTION 2: DISPUTE RESOLUTION AGENCIES ................................................................................................... 99
Introduction ............................................................................................................................................................................. 101
Role of dispute resolution agencies ................................................................................................................................ 101
Description of agencies ...................................................................................................................................................... 103
Methodology ............................................................................................................................................................................ 107
Demographic characteristics of service users .............................................................................................................. 109
Pathways ................................................................................................................................................................................. 116
Appendix 1: Data Sources, Legal Assistance Services ................................................................................. 119
Appendix 2: Additional Services ............................................................................................................................... 125
Appendix 3: Region of Residence Classification Scheme ........................................................................... 135
Appendix 4: Data Analysis Methods ........................................................................................................................ 139
Appendix 5: Tables — Legal Assistance Services ........................................................................................... 141
Appendix 6: Tables — Dispute Resolution Agencies ...................................................................................... 151
Law and Justice Foundation Publications ............................................................................................................ 161

Preface
The objects of the Law and Justice Foundation are to contribute to the development of a fair and equitable justice
system which addresses the legal needs of the community, and to improve access to justice by the community (in
particular, by economically and socially disadvantaged people).1
To meet these objects, the Foundation has established the Access to Justice and Legal Needs Research Program.The purpose of this program is to identify the particular legal needs of economically and socially disadvantaged
people in New South Wales. Using a thorough and credible process, the Foundation intends to develop a statement
of these needs, which we hope will inform government, non-government and community agencies as they seek toimprove access to justice for disadvantaged people in New South Wales.
Stage 1 of the Program aims to obtain an overall picture of the legal and access to justice needs of the community,with a view to laying the foundation for subsequent research in Stage 2.
An important component of this first stage involved the collection, mapping and analysis of data from key legalassistance services on the nature of queries received, the demographic characteristics of inquirers and the paths
they take to resolve their legal issues. The results are presented here in the Data Digest.
Preparation of the Digest has also highlighted the potential value of developing common data collection protocols.
While each agency must collect data to meet their own needs, a standardised approach to data collection andmanagement would assist in establishing a sound knowledge base for policy makers and service providers.
This is the first attempt in NSW to present such information in a single volume, and the Foundation hopes that theDigest will be a valuable reference tool for those concerned with identifying and addressing access to justice and
legal needs.
Louis Schetzer
Senior Project Manager
Access to Justice and Legal Needs Research Program
Law and Justice Foundation of NSW
February 2004
1 Law and Justice Foundation Act 2000 (NSW), s. 5(1).

Acknowledgements
The Law and Justice Foundation of NSW would like to thank the agencies which have so generously provided data
for this project. This report would not have been possible without their cooperation. These agencies are:
Commonwealth Attorney-General’s Department
LawAccess NSW
Legal Aid NSW
NSW Local Courts
NSW Community Legal Centres
NSW Department for Women
Legal Information Access Centre, State Library of NSW.
We would also like to thank:
The Epidemiology and Surveillance Branch, NSW Department of Health, and especially Jill Kaldor, for
generously sharing their experiences in presenting statistical data
The NSW Bureau of Crime Statistics and Research for technical advice about regional analysis
Associate Professor Terry Beed, School of Business, University of Sydney, for comments on the text.
The Foundation is also grateful to AJ Brown and Ivan Potas for reviewing this report pre-publication.
The authors would like to acknowledge the Access to Justice and Legal Needs Research Program Manager, LouisSchetzer, for his contribution to the project design and data analysis.
The authors would also like to acknowledge the staff of the Law and Justice Foundation who assisted in theformatting and analysis of the data and the editing of this report.

Executive Summary
The Data Digest forms part of Stage 1 of the Access to Justice and Legal Needs Research Program, the goal of
which is to identify the particular legal and access to justice needs of economically and socially disadvantaged
people in New South Wales. The Digest contributes to Stage 1 of the broader program by providing a snapshot ofexpressed legal need in the community. In particular, the Digest describes the type of legal matter, the demographic
characteristics of those who seek assistance from services and the pathways they take to resolve their problems,
over the period 1999 to 2002.
The Digest has two sections. The first section presents data from the following legal assistance services in NSW:Legal Aid NSW Information/Advice Service,2 Legal Aid NSW Duty Solicitor Service, LawAccess NSW, NSW
Community Legal Centres and the Chamber Magistrate Service. The second section presents an overview of
published demographic data on the service users of dispute resolution agencies in NSW.
Legal Assistance Services
Data are presented on the type of legal matter, and the demographics and pathways of service users. The ‘inquiry’
was the unit of measure for all data analyses. Chi-squared tests were used to examine whether the type of legalmatter and the profile of service users changed over time, whether the demographic characteristics of service users
were related to the type of legal matter, and whether the legal matter was related to how the user found out about the
service or where they were subsequently referred.
2 Where data is only collected for either information or advice inquiries, Legal Aid NSW Information Service or Legal Aid NSWAdvice Service is used

viii Access to Justice and Legal Needs — Data Digest
The type of legal matter
Figure 1: Percentage of inquiries in Family, Civil and Criminallaw, by service
Inquiries about Family and Civil Law accounted for over three quarters of all inquiries to the Legal Aid NSW
Information/Advice Service, LawAccess NSW, and NSW Community Legal Centres (generalist).
In contrast, 87 per cent of inquiries to the Legal Aid NSW Duty Solicitor Service related to Criminal Law. Thisdifference reflects the different service environments. The Duty Solicitor Service deals with users of Local
Courts whereas the other services deal with inquiries from across the community.
Housing, credit/debt, and employment were among the five most frequent types of Civil Law inquiry for theLegal Aid NSW Information/Advice Service, LawAccess NSW and NSW Community Legal Centres
(Generalist). Government/legal system, consumers and wills/estates were in the five most frequent areas of
Civil Law inquiry in two of these three services (see Table 1).
Table 1: Top five categories of Civil Law inquiries, by service
Legal Aid NSW Info/Advice % of LawAccess NSW % of NSW Community Legal % oftotal total Centres (Generalist) total
2000–2002 2002 1999–2002
Government/Legal system 7.4 Housing 7.8 Housing 11.0
Credit/Debt 5.0 Wills/Estates 6.4 Government/Legal system 10.3
Housing 3.2 Credit/Debt 7.1 Credit/Debt 6.7
Employment 2.7 Employment 5.8 Employment 6.4
Wills/Estates 2.7 Consumers 5.6 Consumers 4.1
Note: The Legal Aid NSW Duty Solicitor Service was not included as the proportion of Civil Law inquiries was too small for analysis.

ixExecutive Summary
Demographics of service users
GENDER
The overall proportion of inquiries from women to NSW Community Legal Centres (64%) and the Legal Aid
NSW Information/Advice Service (54%) was higher than the proportion of women in the NSW population(51%). This is in contrast to the Legal Aid NSW Duty Solicitor Service, which had a high proportion of
inquiries from men (78%).
Changes in the use of services over time by men and women varied between services. The proportion ofinquiries from women to the Legal Aid NSW Information/Advice Service declined; the proportion of
inquiries from women to the Legal Aid NSW Duty Solicitor Service increased; and the proportion of inquiries
from women to Community Legal Centres did not change significantly.
Table 2 shows for men and women separately the top 5 specific areas of law (ranked in order of frequency) for the
Legal Aid NSW Information/Advice Service and NSW Community Legal Centres, with areas in common shaded.
Although both men and women had a high proportion of family law inquiries, women were significantly more likelythan men to inquire about family law.
Table 2: Top 5 specific areas of law by gender and service
Gender Legal Aid NSW Information/Advice % NSW Community Legal Centres %
Male General crime 27.9 Government/Legal system 28.9
Family 24.8 Family 16.1
Government/Legal system 10.1 Housing 10.2
Traffic offences 5.4 Credit/Debt 6.9
Credit/Debt 5.0 General crime 6.6
Female Family 50.6 Family 34.5
General crime 9.1 Government/Legal system 17.9
Government/Legal system 5.3 Housing 9.1
Credit/Debt 5.0 Domestic violence 7.5
Housing 3.6 Credit/Debt 5.0
Note: Specific areas of law in common for both services are shaded.
AGE
A consistent pattern of inquiries from different
age groups emerged across services, with 25 to44 year olds having a high proportion of
inquiries in comparison to their share of the
NSW population in all services. The proportionof inquiries tapered off for the younger and
older age groups.
The type of legal matter and age of clients wererelated in all services, with similar patterns
across services. Compared with the sample as a
whole, inquiries from the younger age groupswere more likely to be about Criminal Law,
inquiries from the middle age groups were more
likely to be about Family Law and inquiries fromthe older age groups were more likely to be
about Civil Law (see Table 3).
Table 3: Broad area of law about which eachage group was more likely to inquire,by servicea
Age Legal Aid LawAccess NSW(years) NSW NSW Community
Advice Legal Centresb
2000–2002 2002 1999–2002
0 to 14 Crime Crime Crime
15 to 17 Crime Crime
18 to 24 Crime Crime Crime
25 to 34 Family Crime
35 to 44 Family Family Family
45 to 54 Family Family
55 to 64 Civil Civil Civil
65 to 74 Civil Civil Civil
75 and over Civil Civil
a The Legal Aid NSW Duty Solicitor Service was not included in the analysis ofage by legal matter due to the high proportion of inquiries about CriminalLaw (87%).
b CLC age groups are slightly different to the other services. See Table 22 formore details.

x Access to Justice and Legal Needs — Data Digest
COUNTRY OF BIRTH
The proportion of inquiries from service users who were born in non-English speaking countries variedacross services. Relative to their proportion of the NSW population (18%), there was a greater use of
Community Legal Centres (28%) and the Legal Aid NSW Advice Service (27%) by people born in non-
English speaking countries. The Legal Aid NSW Duty Solicitor Service had a slightly lower than expectedproportion of inquiries from service users born in non-English speaking countries (16%), given their share of
the NSW population.
For service users born in non-English speaking countries, those born in North Africa/Middle East, South/Central America and the Pacific Islands made the greatest number of inquiries relative to their proportion of the
NSW population to all three services (see Table 4). Of the English speaking countries, service users born in New
Zealand made more inquiries than would be expected given their share of the population in all three services.
Table 4: Highest 3 proportion of inquiries from service users born in non-Englishspeaking countries relative to share of the population, by service
Legal Aid NSW Advice Legal Aid NSW Duty Solicitor NSW Community Legal Centres
North Africa/Middle East Pacific Islands South/Central America
South/Central America North Africa/Middle East North Africa/Middle East
Pacific Islands South/Central America Pacific Islands
The relationship between country of birth and area of law was analysed for two services—the Legal Aid NSWAdvice Service and NSW Community Legal Centres. People born in non-English speaking countries were more
likely to inquire about Civil Law than people born in English speaking countries for both services. Inquiries
about the government/legal system area of Civil Law were particularly high across all non-English speakingcountries of birth. A large proportion of these were about immigration/refugee matters for both services.
Service users born in English speaking countries were more likely to inquire about Criminal Law than service
users born in non-English speaking countries in both services.
With regard to Family Law, compared with service users born in English speaking countries, service users
born in non-English speaking countries were more likely to make inquiries about Family Law to the Legal Aid
NSW Advice Service and less likely to make inquiries about Family Law to NSW Community Legal Centres.
INDIGENOUS AUSTRALIAN STATUS
The proportion of inquiries from Indigenous Australians to the Legal Aid NSW Duty Solicitor Service (4%)and NSW Community Legal Centres (5%) was about twice as high as expected, given their share of the NSW
population (1.9%). The proportion of inquiries from Indigenous Australians to the Legal Aid NSW Advice
Service (2%) was only slightly higher than expected on a population basis (1.9%).
The proportion of inquiries to NSW Community Legal Centres by Indigenous Australians increased steadily
between 1999 and 2002, but inquiries to the Legal Aid NSW Advice and Duty Solicitor Services did not
change significantly.
For both the Legal Aid NSW Advice Service and NSW Community Legal Centres, the following specific areas
of law were among the five most frequently inquired about by Indigenous Australians: family, general crime,
government/legal system and credit/debt (see Table 5).

xiExecutive Summary
Table 5: Five most frequent specific areas of law inquired about byIndigenous Australians, by service
Legal Aid NSW Advice % NSW Community Legal Centres %2000–2002 1999–2002
General crime 36.1 Family 36.7
Family 30.9 General crime 11.8
Government/Legal system 8.4 Domestic violence 11.4
Credit/Debt 2.7 Government/Legal system 9.6
Personal injury 2.6 Credit/Debt 6.2
There were significant differences in the specific areas of law that Indigenous Australians inquired about compared
with non-Indigenous Australians:
A greater proportion of inquiries from Indigenous Australians to the Legal Aid NSW Advice Serviceconcerned general crime, consumers, health/human rights and personal injury.
A greater proportion of inquiries from Indigenous Australians to NSW Community Legal Centres concerned
family law, general crime, domestic violence, health/human rights and personal injury.
SOURCE OF INCOME
The majority of inquiries to the Legal Aid NSW Advice Service (67%), the Legal Aid NSW Duty SolicitorService (92%) and NSW Community Legal Centres (68%) were from service users on no income or on
government benefits.
REGION OF RESIDENCE
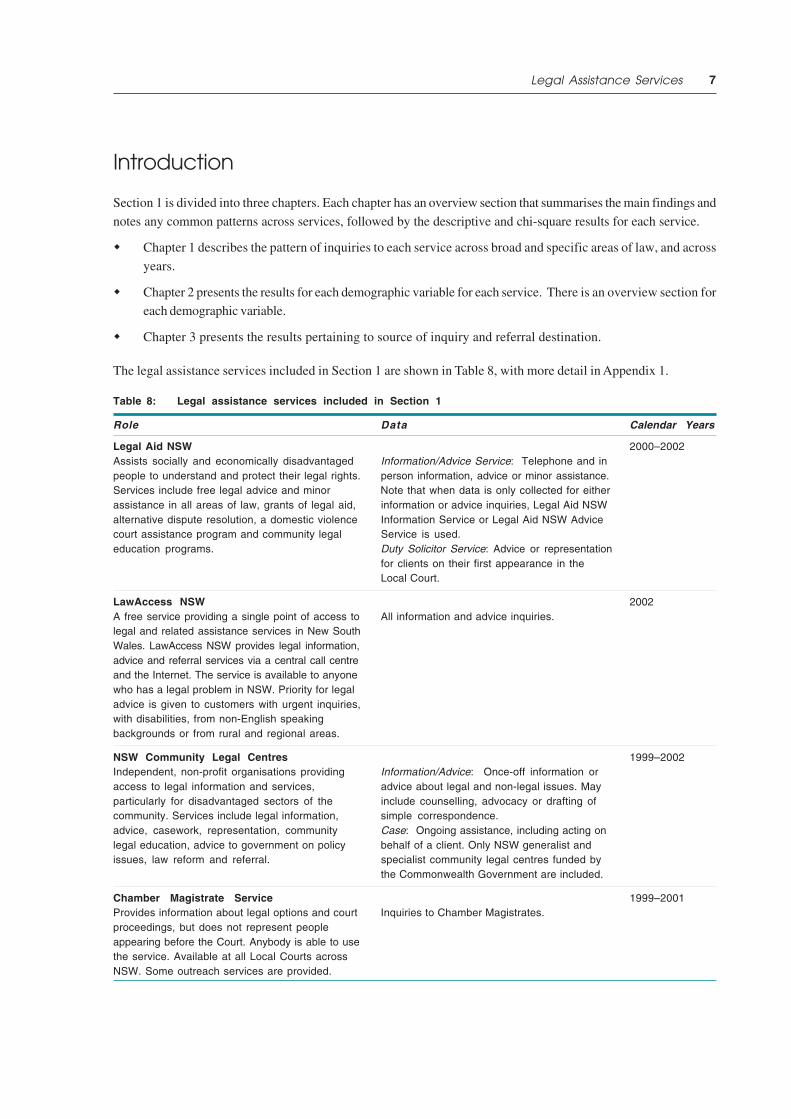
Postcodes were mapped to Australian Bureau of Statistics regions. See Appendix 3 for more details.
Five Sydney regions (Inner Sydney, Central Western, Blacktown, Fairfield-Liverpool, Outer South Western),and 5 non-Sydney regions (Richmond-Tweed, Illawarra, Mid-North Coast, Northern, Far West) had higher
proportions of inquiries than would be expected on a population basis for three of the five services.
The proportion of inquiries to services from Sydney and from rural/regional service users differed betweenservices (see Table 6).
Table 6: Rates of inquiries per 1000 population, byregion of residence of inquirer and service
Service Annual rate per 1000Sydney Non-Sydney
Legal Aid NSW Information/Advice 16.8 16.6
Legal Aid NSW Duty Solicitor 14.4 9.4
LawAccess NSW 7.8 8.7
NSW Community Legal Centres 14.5 9.6
Chamber Magistrate 14.9 37.4
The percentage of inquiries about Family Law from rural/regional areas of NSW tended to be higher than the
average percentage of Family Law inquiries across all regions in NSW. The regions of Sydney that had a
higher than average percentage of inquiries about Family Law were in the outer suburbs.
Civil Law inquiries predominated in metropolitan Sydney.
Inquiries about Criminal Law were more widely dispersed, with rural/regional NSW being slightly more likely
to experience a higher than average percentage of inquiries. Inquiries to LawAccess NSW about Criminal Law
related matters were particularly high for rural/regional NSW.

xii Access to Justice and Legal Needs — Data Digest
Pathways
SOURCE OF INQUIRY
Data for how service users found out about services were only available for the Legal Aid NSW Advice
Service. Service users found out about the Service in a range of ways, with the top four sources being friend/family (35%), police (17%), telephone book (12%) and government (10%).
REFERRAL DESTINATION
Data on referral destination were available for the Legal Aid NSW Information Service, LawAccess NSW and NSW
Community Legal Centres.
A high proportion of inquiries was not referred in all three services—70 per cent for the Legal Aid NSWInformation Service; 40 per cent for LawAccess NSW and 65 per cent for NSW Community Legal Centres.
These percentages include referrals to other sections of the same agency, for example to other sections of
Legal Aid.
Of those inquiries that were referred, there was a high proportion of referrals to legal organisations
(Community Legal Centres, courts, Legal Aid and private solicitors) across the three services, although the
comparative ranking varied (see Table 7).
Table 7: Top four referral destinations, by service
Legal Aid NSW % of LawAccess NSW % of NSW Community Legal % ofInformation total total Centres total
Community legal centre 25.7 Legal Aid NSW 26.5 Private solicitor 23.4
Private solicitor 19.5 Court 16.2 Court 15.9
Court 18.4 Private solicitor 15.6 Community organisation 14.6
Government 11.7 Dispute resolution 12.5 Community legal centre 13.8
Referral destination varied according to the type of legal matter, with some patterns emerging across
services—Family Law inquiries were more likely to be referred to private solicitors; Criminal Law inquiries
were more likely to be referred to courts, and Civil Law inquiries were more likely to be referred to governmentand dispute resolution services.
Dispute resolution agencies
The examination of Annual Reports of dispute resolution agencies in NSW revealed many gaps in the availabilityof relevant data. As a result, a reliable demographic profile of the service users of these agencies could not be
compiled. Nonetheless, the compilation of these data in the Digest provides a useful starting point for a more
detailed analysis of this nature.

Access to Justice and Legal NeedsResearch Program: Terms of Reference
The research presented in this report forms part of Stage 1 of the Access to Justice and Legal Needs Research
Program. The aim, objectives and components of this Program are outlined below.
Program Aim
To identify the particular legal and access to justice needs of economically and socially disadvantaged people inNew South Wales.
Objectives
The program will examine the ability of disadvantaged people to:
obtain legal assistance (including legal information, basic legal advice, initial legal assistance and legal
representation)
participate effectively in the legal system (including access to courts, tribunals, and formal alternativedispute resolution mechanisms)
obtain assistance from non-legal advocacy and support (including non-legal early intervention and
preventative mechanisms, non-legal forms of redress, and community based justice)
participate effectively in law reform processes.
This will involve both qualitative and quantitative investigations into:
legal issues encountered by disadvantaged people
services and processes to deal with these problems
barriers that obstruct access
useful services and processes not provided by the legal system.

xiv Access to Justice and Legal Needs — Data Digest
Program Components
Figure 2: Access to Justice and Legal Needs Research Program

Introduction
The Data Digest contributes to Stage 1 of the Access to Justice and Legal Needs Research Program by providing
a snapshot of expressed legal need in the community. In particular the Digest, using data collected by a range of
NSW services that provide assistance with legal problems, describes:
the type of legal matter about which inquiries are made
the demographic characteristics of those who seek assistance
the pathways that service users take to resolve their problems.
These data will contribute to Stage 2 of the Program which will examine the access to justice and legal needs of
particular disadvantaged groups and regions in NSW.
The Digest is based on data from key not-for-profit legal assistance agencies in NSW. The Digest also includes an
overview of published demographic and service usage data of dispute resolution agencies in NSW.
While providing a snapshot of expressed legal need in the general community, the research particularly focused on
the expressed needs of socially and economically disadvantaged groups in New South Wales. These includepeople from culturally and linguistically diverse backgrounds, Indigenous people, young people, elderly people,
people on low incomes, and people in rural, regional and remote areas. Where possible, data have been presentedwhich illuminate the use of the services by members of these groups.
While the Digest cannot claim to represent a definitive or comprehensive picture of legal need in NSW, the Foundationbelieves that compiling these data is a valuable exercise. Information about service users who present with legal
problems is a useful tool for assessing expressed legal need. By bringing together data from a range of services, it is
possible to identify similarities and differences in the pattern of inquiries across services. This assists in building apicture of who is accessing the legal system, what their expressed needs are and the pathways they follow.
To facilitate comparison across a range of key indicators, raw data from the agencies were transformed, classifiedand mapped to common sets of categories. The compilation of data presented in the Digest is the first attempt in
NSW to capture such information in the one volume.3 This report, by making use of readily available data, should
provide a valuable reference for those concerned with identifying and addressing access to justice and legal needin the community.
The Digest also highlights the potential value of developing common data collection protocols. While acknowledgingthat each agency needs to collect data to meet their own needs, moving towards a collaborative and common
approach to data collection and management would assist with providing a sound knowledge base for policy
makers and service providers.
3 Cunningham, Mary and Ted Wright 1996, The Prototype Access to Justice Monitor, Justice Research Centre, Law Foundation ofNSW. This prototype is a collection of quantitative measures for Queensland legal services in areas such as court delays, legalcosts and available services.

2 Access to Justice and Legal Needs — Data Digest
Structure and scope
The Digest is divided into two sections, the first reporting on legal assistance services and the second on dispute
resolution agencies.
Section 1: Legal assistance services
This section presents data from the following not-for-profit legal assistance services in NSW: Legal Aid NSWInformation/Advice Service, Legal Aid NSW Duty Solicitor Service, LawAccess NSW, NSW Community Legal
Centres and the Chamber Magistrate Service. These services were chosen on the basis that they are high volume
providers of information, advice and minor assistance to a wide range of users about diverse legal issues.
There are a range of services that provide legal assistance which are not covered by the Digest, such as Indigenous
legal services and services specialising in particular areas of law. These were not included due to resource limitationsor lack of availability of data. Future editions will endeavour to include additional services.
Data from two additional services—the Legal Information Access Centre (LIAC) and the Women’s Information andReferral Service (NSW Department for Women)—are, however, included in Appendix 2. LIAC plays an important
role in providing legal information across New South Wales through the public library network. As their data were
based on surveys for the State Library LIAC only, and also included a high proportion of student inquiries(approximately 50%), LIAC data are included in an appendix rather than in the main body of the report. Data on
legally related inquiries to the Women’s Information and Referral Service have been included to illustrate the
potential use of data from specialist services to examine the legal needs of particular disadvantaged groups.
Section 1 is divided into three chapters. A description of the services and data analysis methods is provided at thebeginning of this section.
Section 2: Dispute resolution agencies
This section provides an overview of the role of, and the demographic data published by, key dispute resolutionagencies providing services to people in New South Wales. These include government agencies such as the Anti-
Discrimination Board, tribunals such as the Administrative Appeals Tribunal and self-regulated industry bodies
such as the Credit Union Dispute Resolution Centre. A list and description of the agencies included in the Digest
is provided at the beginning of Section 2.
Dispute resolution agencies have been included in the Digest because they provide an important access point foridentifying and resolving legal disputes, especially for those in the community who may not be able to afford
private legal assistance or traditional court-based litigation.
The focus is on data that assist with identifying service users. Due to time and resource constraints, only data
published in the Annual Reports of these agencies have been reported.

3Introduction
Scope of the analysis
The ‘inquiry’ was the unit of measure for all data analyses. The nature of an inquiry can vary significantly, ranging
from the provision of brief information over the telephone to providing ongoing assistance to a client with court-
related matters.
The Digest looks particularly at patterns of use rather than volume. Information for the previous three to four
calendar years has been included where available to ascertain trends over time.
The Digest focuses on the people who use the services rather than how the services respond to these people. Forthis reason, information about service delivery characteristics covering, for example, the quality of services, the
level of satisfaction of service users, or the length of time taken to answer inquiries, has not been included. These
are important issues but they are not within the scope of this report.
This is a picture of expressed need, rather than of underlying demand (i.e. the data are gathered from people who
actually contact a service to seek help with their problem). It does not measure unexpressed need (i.e. people whohave a problem but do not contact a service). For example, a relatively small proportion of inquiries from Indigenous
Australians about credit and debt issues may reflect a low incidence of inquiries to services from Indigenous
Australians about those issues, rather than a low incidence of credit and debt issues among the broader Indigenouscommunity.
The Digest is intended as a reference tool, providing in one volume, usage and trend data from a number of services.Explanation of data trends is beyond the scope of the Digest. The Foundation will be drawing on the data in this report
to carry out further analysis in Stage 2 of the Access to Justice and Legal Need Research Program. It is the hope of the
Foundation that others may also find the Digest a useful starting point for critical analysis of this kind.

4 Access to Justice and Legal Needs — Data Digest
Limitations of the data
The following limitations apply to the data in this report.
Gaps in data collection
The data have been collected by the agencies for their internal administrative purposes, and not with research of
this nature in mind. It is not surprising, therefore, that for the purposes of this research, there are a number of gapsin the data collected. Most notably, the collection of demographic data varied across services. There were also
imperfections in collection procedures and inconsistencies in the application of protocols leading to a high percentage
of missing data in a number of cases.
Format of data
Data were received in a variety of forms, ranging from relatively raw data to heavily pre-processed cross-tabulationsto published data. This limited both the extent to which the quality of the data could be checked and the level of
analysis that could be undertaken.
Consistency across services
In the interests of standardising data from all sources, we have attempted to map variables to common sets of
categories. The integrity of our process rests on the integrity of the collection and classification processes of eachservice. There are, however, wide variations in how the services collected and classified data. At the most obvious
level, some inquiries were described as ‘civil’ or ‘criminal’ or ‘family’ with no further detail. Thus, even at the major
law classification level, we are dependent on what a service regards as belonging to each broad category of law.
Double counting
Even if all services used the same definitions for data collection, and made no mistakes in collection procedures, itis not possible to aggregate the data meaningfully to provide accurate indicators of total expressed legal need in
the community. This is due to the effect of an unknown incidence of ‘double counting’. One person may approach
a service a number of times or contact a range of services to seek help. Without a major redesign of collectionprotocols, there is no way of tagging the inquiries of any one person seeking assistance so as to distinguish him
or her from other once-off inquirers.

SECTION 1
LegalAssistance
Services
7Legal Assistance Services
Introduction
Section 1 is divided into three chapters. Each chapter has an overview section that summarises the main findings and
notes any common patterns across services, followed by the descriptive and chi-square results for each service.
Chapter 1 describes the pattern of inquiries to each service across broad and specific areas of law, and across
years.
Chapter 2 presents the results for each demographic variable for each service. There is an overview section foreach demographic variable.
Chapter 3 presents the results pertaining to source of inquiry and referral destination.
The legal assistance services included in Section 1 are shown in Table 8, with more detail in Appendix 1.
Table 8: Legal assistance services included in Section 1
Role Data Calendar Years
Legal Aid NSW 2000–2002Assists socially and economically disadvantaged Information/Advice Service: Telephone and inpeople to understand and protect their legal rights. person information, advice or minor assistance.Services include free legal advice and minor Note that when data is only collected for eitherassistance in all areas of law, grants of legal aid, information or advice inquiries, Legal Aid NSWalternative dispute resolution, a domestic violence Information Service or Legal Aid NSW Advicecourt assistance program and community legal Service is used.education programs. Duty Solicitor Service: Advice or representation
for clients on their first appearance in theLocal Court.
LawAccess NSW 2002A free service providing a single point of access to All information and advice inquiries.legal and related assistance services in New SouthWales. LawAccess NSW provides legal information,advice and referral services via a central call centreand the Internet. The service is available to anyonewho has a legal problem in NSW. Priority for legaladvice is given to customers with urgent inquiries,with disabilities, from non-English speakingbackgrounds or from rural and regional areas.
NSW Community Legal Centres 1999–2002Independent, non-profit organisations providing Information/Advice: Once-off information oraccess to legal information and services, advice about legal and non-legal issues. Mayparticularly for disadvantaged sectors of the include counselling, advocacy or drafting ofcommunity. Services include legal information, simple correspondence.advice, casework, representation, community Case: Ongoing assistance, including acting onlegal education, advice to government on policy behalf of a client. Only NSW generalist andissues, law reform and referral. specialist community legal centres funded by
the Commonwealth Government are included.
Chamber Magistrate Service 1999–2001Provides information about legal options and court Inquiries to Chamber Magistrates.proceedings, but does not represent peopleappearing before the Court. Anybody is able to usethe service. Available at all Local Courts acrossNSW. Some outreach services are provided.

8 Access to Justice and Legal Needs — Data Digest
Methodology: Legal Assistance Services
This section outlines the analysis of data from legal assistance services.
For each service, data were collected on all inquiries for the following calendar years:
Legal Aid NSW Information/Advice Service 2000–2002
Legal Aid NSW Duty Solicitor Service 2000–2002
LawAccess NSW 2002
NSW Community Legal Centres 1999–2002
Chamber Magistrate Service 1999–2001.
The inquiry was the unit of measure for all data analyses. For each inquiry, available information was collected on
the type of legal matter, the source of referral to the service, the destination of any referral resulting from the inquiry
and the demographic characteristics of the person making the inquiry.
The demographic data collected comprised gender, age, country of birth, Indigenous Australian status, source ofincome and region of residence. The data available for each service are detailed in Appendix 1.
To allow comparison across services, data for each variable were mapped to common categories wherever possible.The type of legal matter was categorised according to the broad areas of Family, Criminal and Civil Law, and
according to more specific areas of law within these broad categories.
Given that the focus of the Digest is on the type of legal matter and service user, there was no analysis of the type
of assistance provided by each service (e.g. provision of information, advice, minor assistance or representation).4
The data analyses involved both descriptive and inferential statistics.
Percentages
Percentages are used to describe the inquiries to each service in terms of broad and specific areas of law, trends
over time, and the demographic characteristics of the service users. The use of percentages rather than frequencies
allows easy comparison across services of the type of legal matter and the profile of service users. The total numberof inquiries to each service over the period of interest is provided in Appendix 1.
4 There is also considerable variation in how agencies define the type of assistance provided. For a discussion of variations inservice definitions, see Scott, S. and C. Sage, Gateways to the Law: an Exploratory Study of how Non-profit Agencies AssistClients with Legal Problems, Law and Justice Foundation of NSW, Sydney, 2000, pp. 24–27.

9Legal Assistance Services
Indices of concentration
To examine whether the demographic profile of service users was similar to the demographic profile of the NSW
population, indices of concentration (ICs) were calculated for each demographic variable for each service.5 The IC
indicates the concentration of inquiry activity for a particular demographic group (e.g. females) relative to theirproportion of the NSW population.6 An IC of 100 indicates that the proportion of inquiries by a particular group is
identical to the proportion of this group in the population. An IC over 100 indicates that the proportion of inquiries
from this group is higher than would be expected given their proportion in the population, and an IC under 100indicates a lower proportion of inquiries than would be expected. The method for calculating the IC is provided in
Appendix 4.
Rate of inquiries per 1000 population
To provide an indication of the relative number of inquiries from different regions of residence, the rate of inquiries
per 1000 population was also calculated for each region. The regions of residence were categorised according tothe Australian Standard Geographical Classification (ASGC)7 where Statistical Divisions were used to define regions
outside Sydney and Statistical Subdivisions were used to define regions within Sydney.
Chi-square tests
Chi-square tests were performed to highlight changes over time and differences in the nature of inquiries between
demographic groups. The chi-square test is a non-parametric test that examines whether there is a significant
relationship between two or more categorical variables with data in terms of frequencies. A brief description of thechi-square test is provided in Appendix 4. Results based on the chi-square test are indicated in the text.
For each service, wherever data were available, two-way chi-square tests were performed between the following
variables:
broad area of law and year
specific area of law and year
each demographic variable (i.e. gender, age, country of birth, Indigenous Australian status, source of income,
and region of residence) and year8
each demographic variable and broad area of law
each demographic variable and specific area of law
source of inquiry and year
source of inquiry and broad area of law
5 Indices of concentration were calculated for all demographic variables except for source of income.
6 Australian Bureau of Statistics, 2001 Census Basic Community Profile and Snapshot: New South Wales, 2001, <http://www.abs.gov.au/ausstats/>.
7 Australian Bureau of Statistics, National Localities Index, Australia: Localities & Streets Indexes and Explanatory Notes for
ASGC 2002, Catalogue No. 1252.0, <http://www.ausstats.abs.gov.au/>.
8 That is a separate chi-square test was performed between gender and year; age and year; country of birth and year; etc.

10 Access to Justice and Legal Needs — Data Digest
referral destination9 and year
referral destination9 and broad area of law
referral destination9 and specific area of law.
It is important to note that given that the broad area of Family Law could not be meaningfully broken down intomore specific areas of law, in the chi-square tests ‘Family Law’ was included as both a category of broad area of law
and as a category of specific area of law.
All of the significant chi-square tests reported in the text are statistically significant at the 0.01 level.10 Where a chi-
square test found no statistically significant relationship between two variables, this is noted in the text.
Missing values
As already noted, the total number of inquiries to each service is presented in Appendix 1. Some of the inquiries
to each service had missing information on one or more of the variables of interest. For example, information about
demographic characteristics of inquirers is not available for information inquiries to the NSW Legal Aid Information/Advice Service and NSW Community Legal Centres. Each table/figure of results presents the number of inquiries
that had valid data for the variables. The number and percentage of inquiries with missing values are presented in
the note to each table/figure.
Where a variable had missing values in under 10 per cent of inquiries, the chi-square test was based on all inquirieswith valid data for that variable. The treatment of variables that had a higher proportion of missing values is
described in Appendix 4.
Organisation of the results
The results are presented separately for each service. It is not possible to aggregate the data from different services
meaningfully due to the effect of an unknown incidence of ‘double counting’. That is, one person may approach a
service a number of times or contact a range of services to seek help.
9 ‘Not referred’ was included as a category of referral destination in the chi-square test.
10 Given the Digest is written for a lay audience, the chi-square scores, associated degrees of freedom and significance levels are notreported in the text.

Chapter 1: The Type of Legal Matter
This chapter examines the types of legal matters for
which users contacted services. Trends over time are
noted where data availability permitted.
Services include the Legal Aid NSW Information/Advice Service, Legal Aid NSW Duty Solicitor Service,
LawAccess NSW, NSW Community Legal Centres
(Generalist)11 and Chamber Magistrates.
It should be noted that the proportion of inquiries in
particular areas of the law may be influenced by a numberof factors. These include whether a service places a
priority on providing assistance in particular areas of
law or to a particular service group, differences in theawareness of the service, or differences in the needs of
service users. For example, a high level of inquiries about
domestic violence may be connected to any or all of thefollowing factors: a focus on domestic violence by the
service, targeting of a group which has a higher than
average rate of domestic violence, a high level ofawareness of the service by victims of domestic violence
or a high level of domestic violence in the community.
Differences in classification schemes will also affectthe results. For example, seeking help about how to file
an apprehended violence order may be classified as a
court process or domestic violence.
Most services collect some form of data about the type of legal matter experienced by service users. There is,
however, a wide variation in how services categorise legal matters. Some services, for example, only collect at thebroad level of crime, family and civil, while others break down inquiries to a high level of detail, with more than 1000
possible headings.
11 Specialist Community Legal Centres have not been included in this chapter as they do not cover a wide range of areas of law.
FOR MORE INFORMATION
Australian Bureau of Statistics, Usage of Legal
Services, New South Wales, October 1990,
Catalogue No. 4510.1, ABS, Sydney, 1990.
Australian Institute of Criminology, <http://
www.aic.gov.au>.
Family Law Council, The Statistical Snapshot
of Family Law 2000–01, 2003, <http://law.gov.au/flc>.
NSW Bureau of Crime Statistics and Research,<http://www.lawlink.nsw.gov.au/bocsar1.nsf/
pages/index>.
Rush Social Research and John Walker
Consulting Services, Legal Assistance Needs
Phase II: Summary Report, Family Law and
Legal Assistance Division, Legal Aid Branch,
Commonwealth Attorney-General’s Department,Barton ACT, 1999.

12 Access to Justice and Legal Needs — Data Digest
LE
GA
L M
AT
TE
R
Classification of Legal Matters
Legal matters were classified into two tiers using a classification system developed by the Law and Justice Foundation
of NSW.12 The major areas of law—Family, Crime and Civil—have been divided into 14 specific categories: 1 for
Family,13 3 for Crime and 10 for Civil, as illustrated in Figure 3.
Figure 3: Tiered system for describing legal matters
The matters that make up the specific area of law are presented in Table 9. Housing inquiries, for example, include
the following categories: animals, conveyancing, fences, housing, property law, neighbours, noise, nuisance,
retirement village, strata title, and tenancy.
Table 9: Law and Justice Foundation classification for legal matter14
Area of law Types of legal matters included in specific area of lawBroad Specific
Family Family Adoption De facto relationships PropertyChild protection Divorce Residence/ContactChild support Family law
Crime General crime Arrest Crime PrisonersAssault Drugs SentencingBail Firearms Sexual assaultChild abuse Fraud TheftCoronial inquests Police Victims
Domestic violence Apprehended violence orders Domestic violence
Traffic offences Traffic offences
Civil Business/Media Business Intellectual property Media LawContracts Defamation Slander
Credit/Debt Bankruptcy Credit/Debt
Consumers Complaints about lawyers Consumer protection InsuranceSuperannuation ConsumersBanking Contracts
Employment Contracts Unfair termination Workers compensationEmployment
Government/Legal system Administrative law Freedom of information Pensions/AllowancesCourts Government RefugeesEducation Immigration TaxationEnvironment Legal services VeteransFines Local government
Health/Human rights Discrimination Health Mental healthGuardianship/Incapacity Human rights
Housing Animals Neighbours Retirement villageConveyancing Noise Strata titleFences Nuisance TenancyHousing Property law
Motor vehicles Traffic accident – personal injury Traffic accident – property damage
Personal injury Accidents Negligence/Liability Personal injury
Wills/Estates Family provision Probate WillsPower of attorney
12 These are based on a modified version of the Legal Information Access Centre Subject Headings, <http://info.lawaccess.nsw.gov.au/lawaccess/lawaccess.nsf/pages/jsms_liacsubject>.
13 Family Law inquiries were not divided further due to the likelihood that family law inquiries will involve multiple issues, e.g.divorce and property.
14 A modified form of the Australian Standard Offence Classification was used to categorise the Legal Aid NSW Duty SolicitorService data because of the high proportion of criminal matters.

13Legal Assistance Services
LE
GA
L M
AT
TE
R
Overview
The pattern of inquiries across the broad areas of law—Family, Criminal and Civil—differed across services,
although some similarities did emerge. Figure 4 shows the breakdown for each service.
More than half of the inquiries to NSW Community Legal Centres (Generalist) (51%) and Law Access NSW
(56%) were in the area of Civil Law. For those services, Family Law inquiries were the next most frequent,being almost twice as frequent as inquiries about Criminal Law.
More than three quarters of inquiries to the Legal Aid NSW Information /Advice Service were evenly divided
between Civil and Family Law, with the remaining quarter relating to Criminal Law.
The majority of inquiries to the Legal Aid NSW Duty Solicitor Service related to Criminal Law (87%). The
difference between the two Legal Aid services reflects the different service environments. The Duty Solicitor
Service deals with users of the Local Courts whereas the Information/Advice Service deals with inquiriesfrom across the community.
Data for inquiries to the Chamber Magistrate Service were in pre-defined categories—family, domestic
violence and other. It is therefore difficult to compare the data with other services. Family Law accounted for19 per cent of inquiries.
As shown in Table 10, a pattern emerged for Civil Law inquiries to the Legal Aid NSW Information/Advice
Service, LawAccess NSW and NSW Community Legal Centres (Generalist). Housing, credit/debt, and
employment were among the five most frequent types of Civil Law inquiry in all three services, andgovernment/legal system, consumers and wills/estates were in the five most frequent areas in two of the three
services analysed.
Table 10: Top five categories of Civil Law inquiries, by service
Legal Aid NSW Info/Advice % of LawAccess NSW % of NSW Community Legal % oftotal total Centres (Generalist) total
2000–2002 2002 1999–2002
Government/Legal system 7.4 Housing 7.8 Housing 11.0
Credit/Debt 5.0 Wills/Estates 6.4 Government/Legal system 10.3
Housing 3.2 Credit/Debt 7.1 Credit/Debt 6.7
Employment 2.7 Employment 5.8 Employment 6.4
Wills/Estates 2.7 Consumers 5.6 Consumers 4.1
Note: The Legal Aid NSW Duty Solicitor Service was not included as the proportion of Civil Law inquiries was too small for analysis.
Criminal Law inquiries were classified as general, domestic violence and traffic offences.15 Table 11 shows the
percentage of total inquiries for these three areas of law for each service with available data.
Table 11: Criminal Law inquiries, by service
Legal Aid NSW % of Legal Aid NSW % of LawAccess NSW % of NSW Community Legal % ofInfo/Advice total Duty Solicitor total total Centres (Generalist) total2000–2002 2000–2002 2002 1999–2002
General crime 17.6 General crime 68.3 General crime 9.8 General crime 7.2
Domestic violence 2.4 Domestic violence 6.3 Domestic violence 3.1 Domestic violence 7.6
Traffic offences 3.5 Traffic offences 12.3 Traffic offences 3.9 Traffic offences 2.4
15 Because of the high proportion of Criminal Law inquiries to the Legal Aid Duty Solicitor Service, general crime has been furtherbroken down using a different coding system. See the analysis for the Duty Solicitor Service for more details.

14 Access to Justice and Legal Needs — Data Digest
LE
GA
L M
AT
TE
R
Figure 4: Percentage of inquiries in Family, Civil and Criminal Law, by service16
16 Data provided for the Chamber Magistrate Service were divided into three categories—family, domestic/personal violence,other—and could not be further broken down.

15Legal Assistance Services
LE
GA
L M
AT
TE
R
Trends in legal matters: Overview
Figure 5 provides an overview of changes in the type of legal matter inquired about by service users of the four
services over the years of measurement.17 Trends in the legal matter inquired about depended on the service.
The percentage of Family Law inquiries to the Legal Aid NSW Information/Advice Service and to NSWCommunity Legal Centres (Generalist) decreased. There was no significant change for the Duty Solicitor
Service. The percentage of Family Law inquiries to Chamber Magistrates increased.
The percentage of inquiries about Criminal Law decreased for the NSW Duty Solicitor Service and NSWCommunity Legal Centres (Generalist), and increased for the Legal Aid NSW Information/Advice Service.
The percentage of domestic violence inquiries to Chamber Magistrates increased.
The percentage of Civil Law inquiries to the Legal Aid NSW Duty Solicitor Service and NSW Community
Legal Centres (Generalist) increased, and decreased for the Legal Aid NSW Information/Advice Service.
Figure 5: Percentage of inquiries in Family, Civil and Criminal Law by year and service
17 LawAccess NSW data were only available for the year 2002

16 Access to Justice and Legal Needs — Data Digest
LE
GA
L M
AT
TE
R
Legal Aid NSW Information/Advice Service
Table 12: Percentage of inquiries by area of law and yearLegal Aid NSW Information/Advice Service, 2000–2002
Area of law 2000 2001 2002 AllBroad Specific % % % %
Family Total Family 41.8 38.2 35.9 38.9
Crime General crime 13.6 17.1 23.7 17.6
Domestic violence 2.4 2.4 2.2 2.4
Traffic offences 2.7 3.7 4.5 3.5
Total Crime 18.7 23.2 30.4 23.5
Civil Business/Media 1.0 0.8 0.7 0.9
Consumers 2.0 2.1 1.6 1.9
Credit/Debt 5.6 5.8 3.2 5.0
Employment 3.1 2.8 2.2 2.7
Government/Legal system 5.8 8.2 8.8 7.4
Health/Human rights 1.3 1.7 1.9 1.6
Housing 3.6 3.4 2.5 3.2
Motor vehicles 2.7 2.1 1.3 2.1
Personal injury 1.6 1.5 1.2 1.5
Wills/Estates 3.2 2.7 1.9 2.7
Other 9.6 7.4 8.4 8.5
Total Civil 39.5 38.6 33.7 37.6
Total (%) 100 100 100 100
Total (No.) 83 777 77 468 60 713 221 958
Figure 6: Percentage of inquiries by area of lawLegal Aid NSW Information/Advice Service, 2000–2002
Notes: LawAccess NSW replaced the Legal Aid Helpline in October 2001.Phone counter inquiries excluded. See Appendix 1 for more details.
Source: Legal Aid NSW (unpublished data).

17Legal Assistance Services
LE
GA
L M
AT
TE
R
Comment
Family Law accounted for the highest proportion of inquiries (39%), closely followed by Civil Law (38%).Approximately one quarter of inquiries related to Criminal Law (24%).
In terms of types of Criminal Law, general crime accounted for the highest proportion of all inquiries (18%),
followed by traffic offences (4%) and domestic violence (2%).
In terms of types of Civil Law, government/legal system matters accounted for the highest proportion of allinquiries (7%), followed by credit/debt (5%), housing (3%), employment (3%) and wills/estates (3%).
Based on the chi-square examining broad area of law by year, the proportion of Criminal Law inquiries
increased from 19 per cent in 2000 to 30 per cent in 2002, whereas the proportion of Civil and Family inquiriesdecreased.
Based on the chi-square examining specific area of law by year, the proportion of inquiries increased in
general crime, traffic offences, government/legal system, and health/human rights. The proportion ofinquiries decreased in business/media, consumers, employment, housing, motor vehicles, personal injury,
and wills/estates. In the remaining 3 categories—domestic violence, credit/debt and other (civil)—the
proportion in 2002 was less than the proportion in 2000.

18 Access to Justice and Legal Needs — Data Digest
LE
GA
L M
AT
TE
R
Legal Aid NSW Duty Solicitor Service
Table 13: Percentage of inquiries by area of lawa and yearLegal Aid NSW Duty Solicitor Service, 2000–2002
Area of law 2000 2001 2002 AllBroad Specific % % % %
Family Total Family 1.2 1.2 1.6 1.3
Crime Theft 26.2 24.8 18.8 24.1
Assault 13.1 13.9 12.6 13.3
Drugs 6.3 6.0 4.7 5.9
Against justice procedures 10.5 10.8 9.8 10.4
Offensive behaviour and 4.2 4.3 4.2 4.2malicious damage to property
Robbery 2.9 2.5 2.4 2.7
Other offences 4.0 4.1 5.6 4.4
Domestic violence 6.1 6.2 6.8 6.3
Traffic offences 12.1 12.5 12.3 12.3
Crime – other 4.1 2.9 2.5 3.3
Total Crime 89.5 88.2 79.7 86.9
Civil Government/Legal system 8.0 9.2 16.6 10.3
Civil – other 1.3 1.4 2.1 1.5
Total Civil 9.3 10.6 18.7 11.8
Total (%) 100 100 100 100
Total (No.) 103 620 88 888 51 814 244 182
Figure 7: Percentage of inquiries by area of lawLegal Aid NSW Duty Solicitor Service, 2000–2002
a Due to the high percentage of crime related inquiries the Australian National Classification of Offences Code(ABS, 1985, Catalogue No. 1234.0) has been used to classify the types of legal inquiries.
Note: Phone counter inquiries excluded. See Appendix 1 for more details.
Source: Legal Aid NSW (unpublished data).

19Legal Assistance Services
LE
GA
L M
AT
TE
R
Comment
The vast majority of matters dealt with related to Criminal Law (87%). This reflects the fact that the DutySolicitor Service operates in Local Courts in NSW. The top five categories, in decreasing order of volume,
were theft, assault, traffic offences, against justice procedures and government/legal system. Ninety-seven
per cent of inquiries about government/legal system were about the legal system rather than government (e.g.going to court, legal procedure).
Based on the chi-square examining broad area of law by year, the proportion of Criminal Law matters handled
by the Duty Solicitor Service decreased from 90 per cent in 2000 to 80 per cent in 2002. This was compensated
for by an increase in Civil Law matters from 9 per cent in 2000 to 19 per cent in 2002. The proportion of FamilyLaw inquiries was higher in 2002 than in 2000.
Based on the chi-square examining specific area of law by year, the proportion of inquiries dealing with
domestic violence, other offences and government/legal system increased each year. The proportion ofinquiries dealing with drugs, robbery and theft decreased each year. The proportion of inquiries concerning
assault and against justice procedures was lower in 2002 than in 2000. There was little difference in offensive
behaviour and malicious damage to property and traffic offences over the 3 years.

20 Access to Justice and Legal Needs — Data Digest
LE
GA
L M
AT
TE
R
LawAccess NSW
Table 14: Percentage of inquiries by area of lawLawAccess NSW, 2002
Area of lawBroad Specific %
Family Total Family 26.7
Crime General crime 9.8
Domestic violence 3.1
Traffic offences 3.9
Total Crime 16.8
Civil Business/Media 1.8
Consumers 5.6
Credit/Debt 7.1
Employment 5.8
Government/Legal system 3.1
Health/Human rights 1.1
Housing 7.8
Motor vehicles 2.4
Personal injury 3.8
Wills/Estates 6.4
Other 11.6
Total Civil 56.5
Total (%) 100
Total (No.) 61 046
Figure 8: Percentage of inquiries by area of lawLawAccess NSW, 2002
Source: LawAccess NSW (unpublished data).

21Legal Assistance Services
LE
GA
L M
AT
TE
R
Comment
Civil Law accounted for the highest proportion of inquiries (56%), followed by Family Law (27%) and CriminalLaw (17%).
In terms of types of Criminal Law, approximately 1 in 5 inquiries related to domestic violence and 1 in 4 related
to traffic offences.
In terms of types of Civil Law, housing accounted for the highest proportion of all inquiries (8%), followed bycredit/debt (7%), wills/estates (6%), consumers (6%) and employment (6%).

22 Access to Justice and Legal Needs — Data Digest
LE
GA
L M
AT
TE
R
NSW Community Legal Centres (Generalist)
Note: Only inquiries from NSW Community Legal Centres (Generalist) were analysed as these are more indicative
of the range of legal matters experienced by the community than specialist community legal centres that specialisein particular areas of the law such as credit/debt.
Table 15: Percentage of inquiries by area of law and yearNSW Community Legal Centres (Generalist), 1999–2000
Area of law 1999 2000 2001 2002 AllBroad Specific % % % % %
Family Total Family 31.7 32.8 33.1 30.4 32.0
General crime 8.0 7.4 6.5 6.8 7.2
Domestic violence 8.7 7.9 6.6 7.4 7.6
Traffic offences 2.5 2.2 2.4 2.5 2.4
Crime Total Crime 19.2 17.6 15.5 16.8 17.2
Business/Media 1.0 0.9 0.9 0.9 0.9
Consumers 4.2 4.2 3.8 4.4 4.1
Credit/Debt 7.6 6.1 6.4 7.0 6.7
Employment 4.9 5.8 7.1 7.5 6.4
Government/Legal system 8.7 10.0 11.3 10.9 10.3
Health/Human rights 2.5 2.6 2.5 2.7 2.6
Housing 10.8 11.7 11.0 10.6 11.0
Motor vehicles 3.3 3.0 2.7 2.6 2.9
Personal injury 0.9 0.8 0.8 0.9 0.8
Wills/Estates 2.6 2.8 2.8 2.9 2.8
Civil-other 2.6 1.8 1.9 2.5 2.2
Civil Total Civil 49.1 49.6 51.3 52.8 50.8
Total (%) 100 100 100 100 100
Total (No.) 53 161 57 647 61 785 62 452 235 045
Figure 9: Percentage of inquiries by area of lawNSW Community Legal Centres (Generalist), 1999–2002
Source: Commonwealth Attorney-General’s Department National Information Scheme (unpublished data).

23Legal Assistance Services
LE
GA
L M
AT
TE
R
Comment
The most frequent type of inquiry was Civil Law (51%), followed by Family Law (32%) and Criminal Law(17%).
Domestic violence accounted for about 45 per cent of the Criminal Law inquiries.
The most frequent of the inquiries concerning Civil Law were about housing (11% of all inquiries),
government/legal system (10%), credit/debt (7%), employment (6%) and consumers (4%). At a more detailedlevel, inquiries about Civil Law concerned the following:
– 74 per cent of housing inquiries were related to tenancy, and 21 per cent to neighbours and fencing.
– 62 per cent of government/legal system inquiries were about the legal system, 15 per cent aboutgovernment, and 10 per cent about pensions and allowances.
– 51 per cent of employment inquiries were about employment (general) and 32 per cent about unfair
termination.
Based on the chi-square examining broad area of law by year:
The proportion of all inquiries concerning Family Law decreased overall, from 32 per cent in 1999 to 30 per
cent in 2002.
The proportion of all inquiries about Criminal Law also decreased overall, from 19 per cent in 1999 to 17 percent in 2002.
The proportion of all inquiries about Civil Law increased steadily over the four-year period from 49 to 53 per
cent.
Based on the chi-square examining specific area of law by year:
The largest consistent percentage increases within Civil Law were employment and government/legal
system. The only area of Civil Law to undergo a consistent decline in the proportion of inquiries was motor
vehicles. The remaining categories showed a mixture of increases and decreases over the four-year period.

24 Access to Justice and Legal Needs — Data Digest
LE
GA
L M
AT
TE
R
Chamber Magistrate Service
Table 16: Percentage of inquiries by broad area of law and yearChamber Magistrate Service, NSW, 1999–2001
Area of law 1999 2000 2001 All% % % %
Family 18.9 19.6 19.6 19.4
Domestic/personal violence 24.1 24.6 25.1 24.6
Other 57.1 55.8 55.3 56.1
Total (%) 100 100 100 100
Total (No.) 148 974 146 851 151 255 447 080
Figure 10: Percentage of inquiries by broad area of lawChamber Magistrate Service, NSW, 1999–2001
Note: Data were provided already categorised into these areas of law.
Source: Chamber Magistrates (unpublished data).
Comment
Twenty-five per cent of inquiries to the Chamber Magistrate Service were about domestic or personalviolence.
A further 19 per cent were about issues regarding Family Law.
The majority of inquiries were classified as other (56%).
Based on the chi-square examining broad area of law by year, the proportion of inquiries concerning domesticor personal violence and family law increased between 1999 and 2001, with a corresponding decrease in the
proportion of inquiries classified as other.
Chapter 2: Demographic Characteristicsof Service Users
This chapter describes demographic characteristics of those who make inquiries (service users). The characteristics
include gender, age, Indigenous Australian status, country of birth, source of income and region of residence.
It should be noted that the demographic data collected by each service varied considerably. A matrix of theavailability of demographic variables for each service is included in Appendix 1. There is also a high rate of missing
data for a number of the variables. In some cases these missing values have been adjusted for, as discussed in
Appendix 4.
Where possible, the demographic profile of service users was compared with that of the NSW population using the
index of concentration (IC). More information about the index of concentration is provided in the introduction toSection 1 under ‘Methodology’ and in Appendix 4.
It needs to be noted that variations in the use of services by different demographic groups could be influenced bya number of factors:
whether the service targets a particular group
awareness and knowledge of the service by the group
the accessibility of the service to the group, for example, appropriate geographic location, availability of
interpreting services
the type and number of legal matters experienced by a particular group
the quality of the information recorded about the demographic characteristics of a particular group.
Thus, a relatively low proportion of inquiries to a service from young people may be due to a low incidence of legal
problems among young people, or a low rate of usage of the service by young people. In turn, low use of a servicemay reflect lack of awareness of the service, lack of accessibility, or the fact that young people are not a priority
group for the service.
26 Access to Justice and Legal Needs — Data Digest
GE
ND
ER
Gender
This section compares the proportion of inquiries from
men and women and the distribution of inquiries by
area of law for men and women.
Services with relevant data are the Legal Aid NSWInformation/Advice Service, the Legal Aid NSW Duty
Solicitor Service and the NSW Community Legal
Centres (Generalist and Specialist). See also data fromthe Women’s Information and Referral Service in
Appendix 2.
FOR MORE INFORMATION
Commonwealth Office of the Status of Women,Department of the Prime Minister and Cabinet,
Window on Women: Women’s Data Warehouse,
2003, <http://www.windowonwomen.gov.au/>.
NSW Bureau of Crime Statistics and Research,Publications and Statistics by Subject—
Women, 1995–1999, <http://www.lawlink.
nsw.gov.au/bocsar1.nsf/pages/pub_utoz#women>.
NSW Bureau of Crime Statistics and Research,Apprehended Violence Orders Statistics for
NSW, 1996–2002, <http://www.lawlink.nsw.
gov.au/bocsar1.nsf/pages/pub_atoc#avo>.

27Demographic Characteristics of Service Users
GE
ND
ER
Overview
Use of services
Table 17: Percentage of inquiries by gender and service
Gender Legal Aid NSW Legal Aid NSW NSW Community NSWInformation/Advice Duty Solicitor Legal Centres Population
2000–2002 2000–2002 1999–2002 2001
% IC % IC % IC %
Male 45.6 92 78.3 158 35.6 72 49.4
Female 54.4 107 21.7 42 64.4 127 50.6
Total (%) 100 100 100 100
Total (No.) 366 633 244 299 362 435 6 371 745
Note: Shaded areas indicate that the IC is greater than 100.
For NSW Community Legal Centres and the Legal Aid NSW Information/Advice Service, the ICs for femaleswere higher than 100, indicating that the proportion of inquiries from women was higher than the proportion of
women in the NSW population. This is in contrast to the Legal Aid NSW Duty Solicitor Service, which had a
disproportionately high proportion of inquiries from men as indicated by the IC of 158 for males (see Table 17).
Based on the chi-square examining the percentage of inquiries from men and women by year, the trends over
time varied between services. The proportion of inquiries from women to the Legal Aid NSW Information/
Advice Service declined; the proportion of inquiries from women to the Legal Aid NSW Duty SolicitorService increased; and the proportion of inquiries to Community Legal Centres did not change significantly.
Legal matter
Note: The Legal Aid NSW Duty Solicitor Service was not included in the analysis of legal matter due to the high
proportion of inquiries about Criminal Law (87%).
Table 18: Top 5 specific areas of law by gender and service
Gender Legal Aid NSW Information/Advice % NSW Community Legal Centres %
Male General crime 27.9 Government/Legal system 28.9
Family 24.8 Family 16.1
Government/Legal system 10.1 Housing 10.2
Traffic offences 5.4 Credit/Debt 6.9
Credit/Debt 5.0 General crime 6.6
Female Family 50.6 Family 34.5
General crime 9.1 Government/Legal system 17.9
Government/Legal system 5.3 Housing 9.1
Credit/Debt 5.0 Domestic violence 7.5
Housing 3.6 Credit/Debt 5.0
Note: Specific areas of law in common for both services are shaded.
Source: Legal Aid NSW, Community Legal Centres (unpublished data).
Table 18 shows for men and women separately the top 5 specific areas of law (ranked in order of frequency)
for the Legal Aid NSW Information/Advice Service and NSW Community Legal Centres, with areas in
common shaded. Although both men and women had a high proportion of family law inquiries for bothservices, women were significantly more likely than men to inquire about family law.

28 Access to Justice and Legal Needs — Data Digest
GE
ND
ER
Proportion of inquiries, Legal Aid NSW Information/Advice Service
Table 19: Percentage of inquiries by gender and yearLegal Aid NSW Information/Advice Service, 2000–2002
Gender 2000 2001 2002 All NSW Pop’n% % % % IC %
Male 42.7 45.7 48.2 45.6 92 49.4
Female 57.3 54.3 51.8 54.4 107 50.6
Total (%) 100 100 100 100 100
Total (No.) 111 543 136 708 118 382 366 633 6 371 745
Notes: Shaded areas indicate that the IC is greater than 100.Information about gender was missing for an additional 393 (0.1%) inquiries.
Source: Legal Aid NSW (unpublished data).
Figure 11: Percentage of inquiries by gender and yearLegal Aid NSW Information/Advice Service, 2000–2002
Source: Legal Aid NSW (unpublished data).
Comment
The overall IC for women was 107, indicating that women had a slightly higher proportion of inquiries in
comparison to their share of the population. Men, with an index of 92, had a slightly lower proportion than
their share of the population.
Based on the chi-square examining gender by year, the overall proportion of inquiries from women using the
Information/Advice Service declined each year, reaching an index of concentration of 102 in 2002. In other
words, the proportion of inquiries from men and women almost matched their respective proportions in thepopulation in 2002.

29Demographic Characteristics of Service Users
GE
ND
ER
Proportion of inquiries, Legal Aid NSW Duty Solicitor Service
Table 20: Percentage of inquiries by gender and yearLegal Aid NSW Duty Solicitor Service, 2000–2002
Gender 2000 2001 2002 All NSW Pop’n% % % % IC %
Male 78.5 79.1 76.4 78.3 158 49.4
Female 21.5 20.9 23.6 21.7 42 50.6
Total (%) 100 100 100 100 100
Total (No.) 103 608 88 882 51 809 244 299 6 371 745
Notes: Shaded areas indicate that the IC is greater than 100.Information about gender was missing for an additional 23 (< 0.01%) inquiries.
Source: Legal Aid NSW (unpublished data).
Figure 12: Percentage of inquiries by gender and yearLegal Aid NSW Duty Solicitor Service, 2000–2002
Source: Legal Aid NSW (unpublished data).
Comment
The majority of inquiries to the Duty Solicitor Service were from men (78%). The IC was 158, indicating thatmen were much more likely to use the Duty Solicitor Service than would be expected from their proportion of
the population. This is in keeping with the higher proportions of men using the courts.18 By contrast, women,
with an index of 42, had a relatively low use of the Service.
Based on the chi-square examining gender by year, there was an overall increase in the proportion of
inquiries from women to the Duty Solicitor Service, from 22 per cent to 24 per cent between 2000 and 2002.
18 See, for example, New South Wales Bureau of Crime Statistics and Research, New South Wales Criminal Courts Statistics 2002,<http://www.lawlink.nsw.gov.au/bocsar1.nsf/files/CCS02.pdf/$FILE/CCS02.pdf>
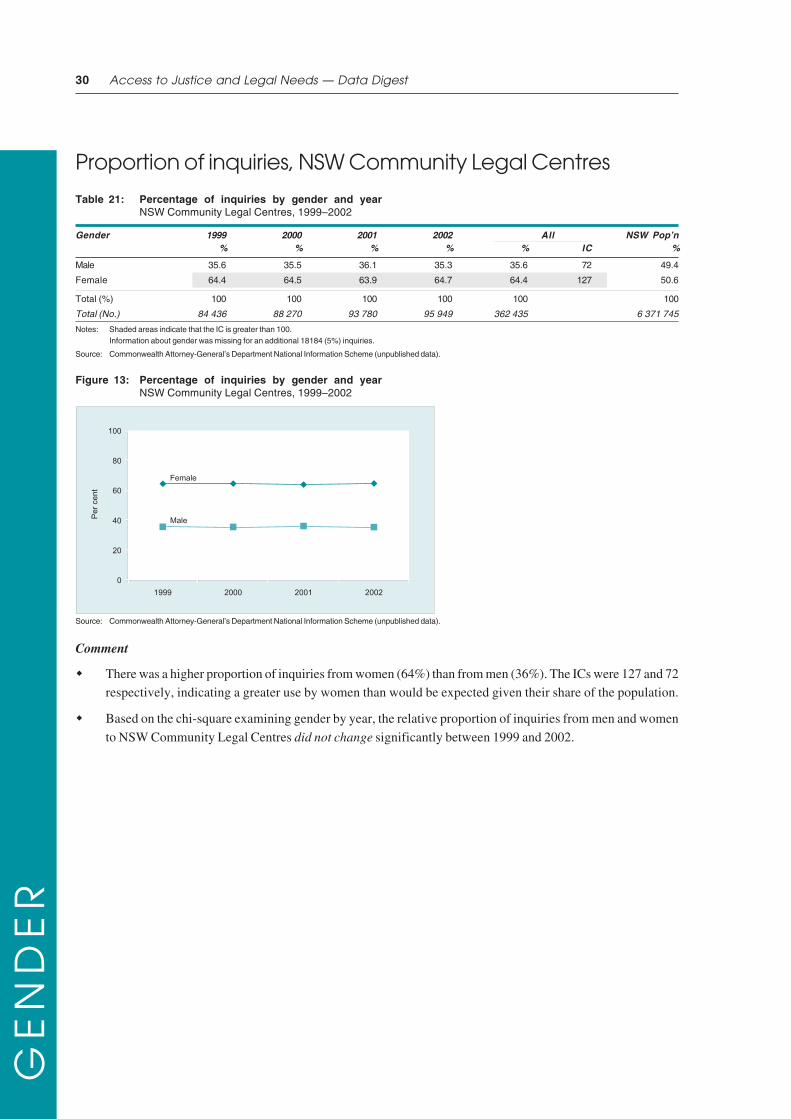
30 Access to Justice and Legal Needs — Data Digest
GE
ND
ER
Proportion of inquiries, NSW Community Legal Centres
Table 21: Percentage of inquiries by gender and yearNSW Community Legal Centres, 1999–2002
Gender 1999 2000 2001 2002 All NSW Pop’n% % % % % IC %
Male 35.6 35.5 36.1 35.3 35.6 72 49.4
Female 64.4 64.5 63.9 64.7 64.4 127 50.6
Total (%) 100 100 100 100 100 100
Total (No.) 84 436 88 270 93 780 95 949 362 435 6 371 745
Notes: Shaded areas indicate that the IC is greater than 100.Information about gender was missing for an additional 18184 (5%) inquiries.
Source: Commonwealth Attorney-General’s Department National Information Scheme (unpublished data).
Figure 13: Percentage of inquiries by gender and yearNSW Community Legal Centres, 1999–2002
Source: Commonwealth Attorney-General’s Department National Information Scheme (unpublished data).
Comment
There was a higher proportion of inquiries from women (64%) than from men (36%). The ICs were 127 and 72respectively, indicating a greater use by women than would be expected given their share of the population.
Based on the chi-square examining gender by year, the relative proportion of inquiries from men and women
to NSW Community Legal Centres did not change significantly between 1999 and 2002.

31Demographic Characteristics of Service Users
GE
ND
ER
Legal matter, Legal Aid NSW Information/Advice Service
Figure 14: Percentage of inquiries by gender and specific area of lawLegal Aid NSW Information/Advice Service, 2000–2002
Note: N = 221671. Information about gender was missing for an additional 393 (0.1 %) inquiries.See Table 5-1 in Appendix 5 for more details.
Source: Legal Aid NSW (unpublished data).
Comment
Figure 14 shows the percentages of specific area of law of inquiries from men together with the corresponding
percentage of inquiries from women.
The highest proportion of inquiries from men were about general crime (almost 3 in 10 inquiries), followed by
family, government/legal system, traffic offences and credit/debt (excluding civil–other). Overall, these top
five areas accounted for 73 per cent of inquiries from men.
The highest proportion of inquiries from women were about family (half the inquiries), followed by generalcrime, credit/debt, government/legal system and housing (excluding civil–other). Overall, these accounted
for 74 per cent of inquiries from women.
Based on the chi-square examining specific areas of law for men and women:
Women were more likely than men to inquire about family law, housing, personal injury and wills/estates.
Men, on the other hand, were more likely to inquire about general crime, traffic offences, business/media,employment, government/legal system and motor vehicles.
There was no significant gender difference in the proportion of inquiries about domestic violence. Legal Aid
NSW receives inquiries from both alleged perpetrators and victims of domestic violence.

32 Access to Justice and Legal Needs — Data Digest
GE
ND
ER
Legal matter, NSW Community Legal Centres
Figure 15: Percentage of inquiries by gender and specific area of lawNSW Community Legal Centres, 1999–2002
Notes: N = 361396. Information about gender was missing for an additional 19422 (5%) inquiries.See Table 5-2 in Appendix 5 for more details.
Source: Commonwealth Attorney-General’s Department National Information Scheme (unpublished data).
Comment
The highest proportion of inquiries from men related to government/legal system matters (almost 3 in 10),followed by family, housing, credit/debt, and general crime. Overall, these top five areas accounted for almost
two thirds of inquiries from men.
The highest proportion of inquiries from women related to family (1 in 3), followed by government/legal
system, housing, domestic violence and credit/debt (civil–other not included). Overall, these top five areas oflaw accounted for almost three quarters of inquiries from women.
Based on the chi-square test examining specific areas of law for men and women:
Inquiries about family and domestic violence were more likely to come from women than from men. Many
Community Legal Centres adopt a policy of not providing assistance to an alleged perpetrator in domestic
violence matters.
Inquiries about general crime, traffic offences and all areas of Civil Law, except for personal injury and wills/
estates were significantly more likely to come from men than from women. More detailed classification of
crime showed that for all areas except sexual assault and victims, inquiries from men outnumbered inquiriesfrom women.

33Demographic Characteristics of Service Users
AG
E
Age
This section includes an analysis of the age of service
users and the nature of their legal inquiries.
Services with relevant data are the Legal Aid NSW
Advice Service, the Legal Aid NSW Duty SolicitorService, Law Access NSW and NSW Community Legal
Centres.
For Legal Aid NSW and LawAccess NSW, age was
mapped to the Law and Justice Foundation categories.
NSW Community Legal Centre age data were providedin a slightly different grouping. (See Table 22).
FOR MORE INFORMATION
Australian Bureau of Statistics, New South
Wales’ Young People, Catalogue No. 4123.1,
ABS, Canberra, 1998.
Australian Bureau of Statistics, Older People,
New South Wales, Catalogue No. 4108.1, ABS,Canberra, 2000.
Australian Institute of Health and Welfare,Older Australians at a Glance, Australian
Institute of Health and Welfare, Canberra, 1999.
O’Connor, Ian and Clare Tilbury, Legal Aid
Needs of Youth, Legal Aid Branch,
Commonwealth Attorney-General’s Department,Canberra, 1986.
Bareja, Michael and Kate Charlton, Statistics
on Juvenile Detention in Australia: 1981-
2002, Australian Institute of CriminologyTechnical and Background Paper Series No. 5,
2003, <http://www.aic.gov.au/publications/
tbp/tbp005.pdf>.
Table 22: Law and Justice Foundationand NSW Community LegalCentre categories for age
Law and Justice NSW CommunityFoundation Legal Centrecategories categories
0 to 14
15 to 17 0 to 17
18 to 24 18 to 20
25 to 34 21 to 30
35 to 44 31 to 40
45 to 54 41 to 50
55 to 64 51 to 65
65 to 74 66 and over
75 and over

34 Access to Justice and Legal Needs — Data Digest
AG
E
Overview
Use of servicesTable 23: Percentage of inquiries by age group and service
Age (years) Legal Aid Legal Aid LawAccess NSW Community NSWAdvice Duty NSW Legal Centresa Pop’n
2000–2002 2000–2002 2002 1999–2002 2001
% IC % IC % IC % IC %
0 to 14 1.6 8 2.0 10 0.4 1 1.5 6 20.6
15 to 17 4.5 107 4.0 95 4.2
18 to 24 13.6 148 27.5 219 9.0 97 2.3 56 9.2
25 to 44b 52.7 177 55.1 185 57.0 191 46.6 161 29.8
45 to 54 14.1 104 7.5 56 16.8 124 24.7 172 13.5
55 to 64 6.8 72 2.6 28 11.6 123 16.5 107 9.4
65 and over 6.7 51 1.3 10 5.2 39 8.4 68 13.2
Total (%) 100 100 100 100 100
Total (No.) 138 258 244 087 11 105 380 619 6 371 745
a CLC age groups were defined slightly differently as outlined in Table 22.b The age groups 25 to 34 and 35 to 44 have been combined as they showed a similar pattern across all services.
Note: Shaded areas indicate that that IC is greater than 100.
A consistent pattern of inquiries from different age groups emerged across services, with 25 to 44 year olds
having a high proportion of inquiries in all services. The proportion of inquiries tapered off for the younger
and older age groups (see Table 23).
It is worth noting the high level of use of the Legal Aid NSW Advice Service by 15 to 17 year olds incomparison to their use of the other services. This could be linked to the existence of the Legal Aid NSW
Hotline for Under 18s, which targets this group.
No clear patterns were discernable in relation to changes in the use of services by different age groups over
the years for which data are available.
Legal matter
Note: The Legal Aid NSW Duty Solicitor Service was not included in the analysis of age by legal matter due to the
high proportion of inquiries about Criminal Law (87%).
Table 24: Broad area of law about which each age groupwas more likely to inquire, by service
Age Legal Aid NSW LawAccess NSW Community(years) Advice NSW Legal Centresa
2000–2002 2002 1999–2002
0 to 14 Crime Crime Crime
15 to 17 Crime Crime
18 to 24 Crime Crime Crime
25 to 34 Family Crime
35 to 44 Family Family Family
45 to 54 Family Family
55 to 64 Civil Civil Civil
65 to 74 Civil Civil Civil
75 and over Civil Civil
a CLC age groups are slightly different to the other services. See Table 22 for more details.
The type of legal matter and age of clients were related in all services, with similar patterns emerging across
services. Compared with the sample as a whole, inquiries from the younger age groups were more likely to be
about Criminal Law, inquiries from the middle age groups were more likely to be about Family Law andinquiries from the older age groups were more likely to be about Civil Law.

35Demographic Characteristics of Service Users
AG
E
Proportion of inquiries, Legal Aid NSW Advice Service
Table 25: Percentage of inquiries by age group and yearLegal Aid NSW Advice Service, 2000–2002
Age 2000 2001 2002 All NSW Pop’n(years) % % % % IC %
0 to 14 1.0 1.5 2.3 1.6 8 20.6
15 to 17 1.6 3.9 7.7 4.5 107 4.2
18 to 24 11.5 13.8 15.1 13.6 148 9.2
25 to 34 26.7 25.8 25.6 26.0 179 14.5
35 to 44 28.9 27.1 24.4 26.7 175 15.3
45 to 54 15.8 14.2 12.6 14.1 104 13.5
55 to 64 7.4 6.9 6.3 6.8 72 9.4
65 to 74 4.1 3.7 3.2 3.7 52 7.1
75 and over 3.0 3.2 2.8 3.0 49 6.1
Total (%) 100 100 100 100 100
Total (No.) 42 977 46 302 48 979 138 258
Notes: Shaded areas indicate that the IC is greater than 100.Information about age was missing for an additional 975 (0.7%) inquiries for the Advice Service. Age was not collected for227793 inquiries to the Information Service.
Source: Legal Aid NSW (unpublished data).
Figure 16: Percentage of inquiries by age group and yearLegal Aid NSW Advice Service, 2000–2002
Source: Legal Aid NSW (unpublished data).
Comment
15 to 54 year olds generated more inquiries than would be expected given their share of the population. Thisis reflected in the ICs for these groups, which peak at 179 for 25 to 34 year olds and then gradually decline.
The proportion of inquiries made by 15 to 17 year olds was slightly higher than would be expected given this
group’s share of the population (IC of 107). These inquiries included data from the Legal Aid NSW Hotline forUnder 18s, which was set up in 1998 to provide free Criminal Law advice to children and young people
throughout New South Wales.
Over 54 year olds had a lower proportion of inquiries than would be expected given their share of thepopulation, with the share of inquiries declining for the older age groups.
There was also a low proportion of inquiries for under 15 year olds. This result is not surprising, given that
practitioners report that few people under 12 seek legal assistance.
Based on the chi-square examining age by year, there was a steady increase in the proportion of inquiriesmade by 15 to 24 year olds between 2000 and 2002, and a decrease in the proportion of inquiries from all other
age groups.
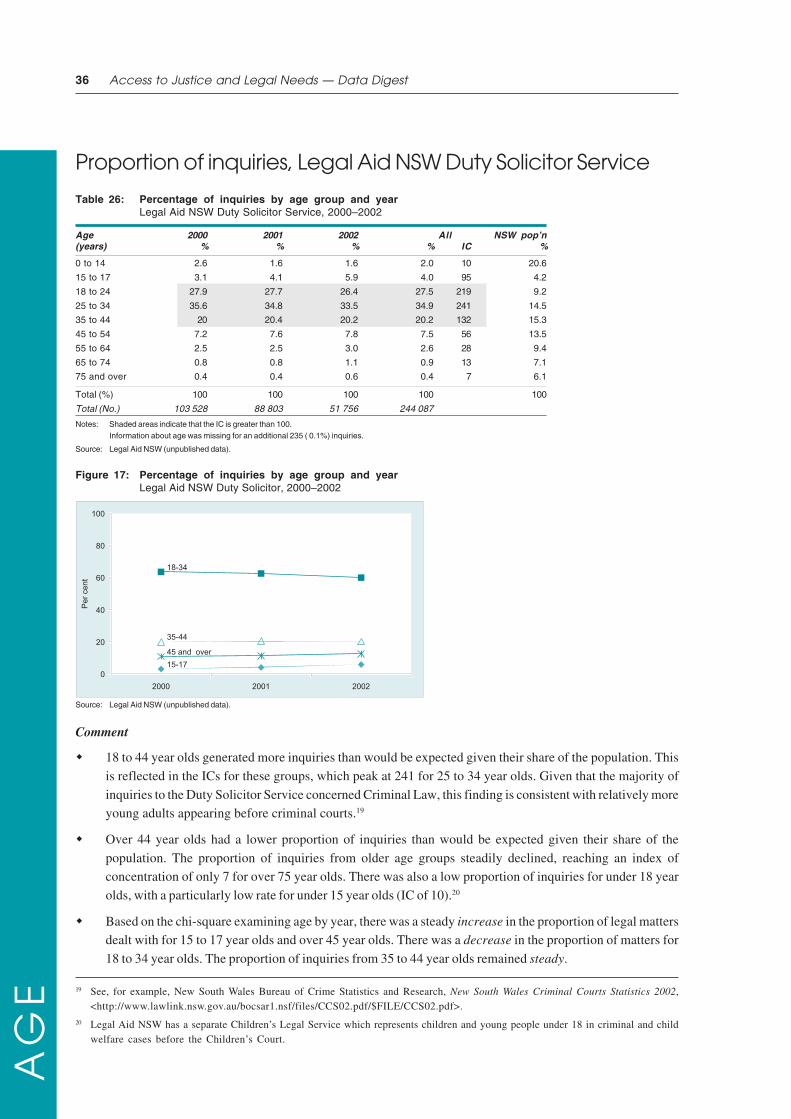
36 Access to Justice and Legal Needs — Data Digest
AG
E
Proportion of inquiries, Legal Aid NSW Duty Solicitor Service
Table 26: Percentage of inquiries by age group and yearLegal Aid NSW Duty Solicitor Service, 2000–2002
Age 2000 2001 2002 All NSW pop’n(years) % % % % IC %
0 to 14 2.6 1.6 1.6 2.0 10 20.6
15 to 17 3.1 4.1 5.9 4.0 95 4.2
18 to 24 27.9 27.7 26.4 27.5 219 9.2
25 to 34 35.6 34.8 33.5 34.9 241 14.5
35 to 44 20 20.4 20.2 20.2 132 15.3
45 to 54 7.2 7.6 7.8 7.5 56 13.5
55 to 64 2.5 2.5 3.0 2.6 28 9.4
65 to 74 0.8 0.8 1.1 0.9 13 7.1
75 and over 0.4 0.4 0.6 0.4 7 6.1
Total (%) 100 100 100 100 100
Total (No.) 103 528 88 803 51 756 244 087
Notes: Shaded areas indicate that the IC is greater than 100.Information about age was missing for an additional 235 ( 0.1%) inquiries.
Source: Legal Aid NSW (unpublished data).
Figure 17: Percentage of inquiries by age group and yearLegal Aid NSW Duty Solicitor, 2000–2002
Source: Legal Aid NSW (unpublished data).
Comment
18 to 44 year olds generated more inquiries than would be expected given their share of the population. This
is reflected in the ICs for these groups, which peak at 241 for 25 to 34 year olds. Given that the majority of
inquiries to the Duty Solicitor Service concerned Criminal Law, this finding is consistent with relatively moreyoung adults appearing before criminal courts.19
Over 44 year olds had a lower proportion of inquiries than would be expected given their share of the
population. The proportion of inquiries from older age groups steadily declined, reaching an index ofconcentration of only 7 for over 75 year olds. There was also a low proportion of inquiries for under 18 year
olds, with a particularly low rate for under 15 year olds (IC of 10).20
Based on the chi-square examining age by year, there was a steady increase in the proportion of legal mattersdealt with for 15 to 17 year olds and over 45 year olds. There was a decrease in the proportion of matters for
18 to 34 year olds. The proportion of inquiries from 35 to 44 year olds remained steady.
19 See, for example, New South Wales Bureau of Crime Statistics and Research, New South Wales Criminal Courts Statistics 2002,<http://www.lawlink.nsw.gov.au/bocsar1.nsf/files/CCS02.pdf/$FILE/CCS02.pdf>.
20 Legal Aid NSW has a separate Children’s Legal Service which represents children and young people under 18 in criminal and childwelfare cases before the Children’s Court.

37Demographic Characteristics of Service Users
AG
E
Proportion of inquiries, LawAccess NSW
Table 27: Percentage of inquiries by age groupLawAccess NSW, 2002
Age a % IC NSW(years) pop’n
%
Under 17 0.4 1 25.0
18 to 24 9.0 97 9.2
25 to 34 32.8 226 14.5
35 to 44 24.2 158 15.3
45 to 54 16.8 124 13.5
55 to 64 11.6 123 9.4
65 and over 5.2 39 13.2
Total (%) 100 100
Total (No.) 11 105
a The age groups 0 to 14 and 15 to 17 have been combined due to the smallproportion of inquiries for these groups. Similarly for 65-74 and 75 and over.
Note: Shaded areas indicate that the IC is greater than 100.Information about age was missing for an additional 49995 (82% ) inquiries.
Source: LawAccess NSW (unpublished data).
Comment
Birth date information was only available for 18 per cent of all inquiries. Despite possible problems with thevalidity of the results, these data have been included as the results are similar to the patterns found in the
other services for which age is available.
25 to 64 year olds had a higher proportion of inquiries than would be expected given their share of thepopulation. This is reflected in the high ICs for these groups, peaking at 226 for 25 to 34 year olds.
In contrast, over 64 year olds, with an IC of 39, had a lower proportion of inquiries than would be expected.
Young people (under 17 year olds) had a very low use of the service, with an IC of 1.

38 Access to Justice and Legal Needs — Data Digest
AG
E
Proportion of inquiries, NSW Community Legal Centres
Table 28: Percentage of inquiries by age group and yearNSW Community Legal Centres, 1999–2002
Age 1999 2000 2001 2002 All NSW Pop’n(years) % % % % % IC %
0 to 17 1.0 1.4 1.4 2.1 1.5 6 25.0
18 to 20 1.7 2.3 2.4 2.8 2.3 56 4.1
21 to 30 15.4 16.6 18.5 18.9 17.4 126 13.8
31 to 40 29.1 28.8 29.2 29.4 29.2 193 15.1
41 to 50 26.0 25.0 24.5 23.4 24.7 172 14.3
51 to 65 18.1 16.7 16.3 15.1 16.5 107 15.4
66 & over 8.6 9.2 7.7 8.4 8.4 68 12.3
Total (%) 100 100 100 100 100 100
Total (No.) 89 934 91 923 96 912 101 853 380 619
Notes: Shaded areas indicate that the IC is greater than 100.Age groups are those provided by the National Information Scheme. They do not correspond to the groupings used for other services.Information about age was missing for 209340 (55%) inquiries (age was not collected for information and some telephone advice inquiries).The data have been adjusted to take this into account as outlined in Appendix 4.
Source: Commonwealth Attorney-General’s Department National Information Scheme (unpublished data).
Figure 18: Percentage of inquiries by age group and yearNSW Community Legal Centres, 1999–2002
Source: Commonwealth Attorney-General’s Department National Information Scheme (unpublished data).
Comment
The high proportion of inquiries without information about age (55%) should be noted.
The proportion of inquiries from 21 to 65 year olds was high relative to this group’s share of the NSWpopulation. Of these inquirers, approximately two out of three were between 31 and 50 years old. This is
reflected in the high ICs for these groups, peaking at 193 for 31 to 40 year olds.
The proportion of inquiries for under 18 (IC of 6), 18 to 20 (IC of 56) and over 65 year olds (IC of 68) was lowrelative to their proportion of the NSW population. The low rate of inquiries for under 18 year olds is not
surprising given that practitioners report that few people under 12 seek legal assistance on their own. It was
not possible to further break down inquiries from under 18 year olds.
Based on the chi-square examining age by year, the proportion of inquiries for under 31 year olds increased
slightly; for 31 to 40 year olds decreased in 2000, and then increased in 2001 and 2002; for 41 to 65 year olds
decreased from 1999 to 2002; and for over 65 year olds fluctuated over time.

39Demographic Characteristics of Service Users
AG
E
Legal matter, Legal Aid NSW Advice Service
Figure 19: Percentage of inquiries by age group and broadarea of lawLegal Aid NSW Advice Service, 2000–2002
Notes: N = 122651. Information about age was missing for an additional 865 (0.7%) inquiries for theAdvice Service.Age was not collected for 227793 inquiries to the Information Service.See Table 5-3 in Appendix 5 for more details.
Source: Legal Aid NSW (unpublished data).
Comment
Based on the chi-square examining broad area of law by age:
Under 25 year olds were significantly more likely to inquire about Criminal Law. Inquiries about Criminal Law
were particularly high for 15 to 17 year olds. More than 9 in 10 inquiries from this particular group were in thearea of Criminal Law. As noted earlier, these inquiries include data from the Legal Aid NSW Hotline for Under
18s, which provides free Criminal Law advice to children and young people throughout New South Wales.
25 to 54 year olds were significantly more likely to inquire about Family Law and less likely to inquire aboutCriminal Law. These age groups accounted for 84 per cent of inquiries about Family Law.
Service users over 55 years old were significantly more likely to inquire about Civil Law, with inquiry rates for
Civil Law increasing in the older age groups.
Based on the chi-square, Table 29 shows the specific legal matters that each age group inquired about at a ratehigher than sample rate.
Table 29: Specific area of law about which each age groupwas more likely to inquireLegal Aid NSW Advice Service, 2000–2002
Age (years) Specific area of law
0 to 14 General crime, Wills/Estates15 to 17 General crime18 to 24 General crime, Traffic offences25 to 34 Family, Traffic offences35 to 44 Family, Business/Media45 to 54 Family, all Civil except for Government/Legal system55 to 64 All Civil65 to 74 All Civil except Employment75 and over Consumers, Government/Legal system,a Health/Human
rights, Housing, Personal injury, Wills/Estates.
a 60 per cent of inquiries about government/legal system were about veterans’ matters.We note that Legal Aid NSW has a Veterans’ Advocacy Service.
Source: Legal Aid NSW (unpublished data).

40 Access to Justice and Legal Needs — Data Digest
AG
E
Legal matter, LawAccess NSW
Figure 20: Percentage of inquiries by age group and broad area of lawLawAccess NSW, 2002
Notes: N = 11093. Information about age was missing for an additional 50007 (81.8%) inquiries.The age groups 0 to 14, 15 to 17 and 18 to 24 were combined due to the small proportion of inquiries.Similarly for 65 to 74 and over 74 year olds.See Table 5-4 in Appendix 5 for more details.
Source: LawAccess NSW (unpublished data).
Comment
Birth date information was only available for 18 per cent of all inquiries. Despite possible problems with the
validity of the results, these data have been included as the results are similar to the patterns found in the
other services.
For all age groups, the majority of inquiries were about Civil Law. However, based on the chi-square examining
broad area of law by age, some age groups were even more likely than other age groups to inquire about Civil Law.Specifically, compared with all inquiries:
Inquiries from the 55 and over age groups were more likely to be about Civil Law and less likely to be about
Criminal or Family Law.
Inquiries from under 25 year olds were less likely to be about Civil Law and more likely to be about Criminal Law.
Inquiries from 35 to 44 year olds were less likely to be about Civil Law and more likely to be about Family Law.
Based on the chi-square, Table 30 shows the specific legal matters that each age group inquired about at a rate
higher than the sample rate.
Table 30: Specific area of law about which each age groupwas more likely to inquireLawAccess NSW, 2002
Age (years) Specific area of law
Under 25 General crime, Traffic offences, Motor vehicles
25 to 34 Traffic offences, Credit/Debt, Motor vehicles
35 to 44 Family law
45 to 54 Personal injury, Wills/Estates
55 to 64 Government/Legal system, Health, Housing, Wills/Estates
65 and over Government/Legal system, Housing, Wills/Estates
Note: N = 11093. Information about age was missing for an additional 50007 (82%) inquiries.
Source: LawAccess NSW (unpublished data).

41Demographic Characteristics of Service Users
AG
E
Legal matter, NSW Community Legal Centres
Figure 21: Percentage of inquiries by age group and broad area of lawNSW Community Legal Centres, 1999–2002
Notes: N = 379481. Information about age was missing for 208715 (55%) inquiries (age was not collected forinformation and some telephone advice inquiries). The data have been adjusted to take this into accountas outlined in Appendix 4.See Table 5-5 in Appendix 5 for more details.
Source: Commonwealth Attorney-General’s Department National Information Scheme (unpublished data).
Comment
The high proportion of inquiries without information about age (55%) should be noted.
For all age groups, the majority of inquiries were about Civil Law. However, based on the chi-square examining
broad area of law by age, some age groups were even more likely than other age groups to inquire about Civil Law.Specifically, compared with all inquiries:
Inquiries from the over 50 year old agegroups were more likely to be about Civil
Law and less likely to be about Criminal
or Family Law.
Inquiries from the under 20 year old age
groups were more likely to be about
Criminal Law and less likely to be aboutFamily Law.
Inquiries from 21 to 30 year olds were less
likely to be about Civil Law and more
likely to be about Criminal Law.
Inquiries from the 31 to 50 year old age
groups were less likely to be about Civil
and Criminal Law and more likely to beabout Family Law.
Based on the chi-square, Table 31 shows the specific legal mattersthat each age group inquired about at a rate higher than the
sample rate.
Table 31: Specific area of law about which each agegroup was more likely to inquireNSW Community Legal Centres, 1999–2002
Age (years) Specific area of law
0 to 17 General crime, Consumers, Credit/Debt, Government/Legal system, Health/Human rights
18 to 20 General crime, Traffic offences, Government/Legalsystem, Health/Human rights
21 to 30 General crime, Domestic violence, Traffic offences,Employment, Government/Legal system, Housing,a
Motor vehicles
31 to 40 Family, Domestic violence
41 to 50 Family, Domestic violence, Consumers, Credit/Debt
51 to 65 Business/Media, Consumers, Credit/Debt, Employment,Government/Legal system, Health/Human rights,Housing,a Personal injury, Wills/Estates
66 and over Consumers, Housing,a Personal injury, Wills/Estates
a In the younger age groups, housing inquiries related predominantly to tenancy(93%), but in the older age groups, only 10 per cent were about tenancy, with theremainder concerning neighbours, noise, strata and fences.
Source: Commonwealth Attorney-General’s Department National Information Scheme(unpublished data).

42 Access to Justice and Legal Needs — Data Digest
CO
UN
TR
Y O
F B
IRT
H
Country of birth
This section covers the country of birth of service
users and the nature of the legal matters about which
they inquire.
Services with available data are the Legal Aid NSWAdvice Service, Legal Aid NSW Duty Solicitor Service,
and NSW Community Legal Centres.
Country of birth was mapped to Law and Justice
Foundation categories (see Table 32). These categories
are based on geographic regions used by theAustralian Bureau of Statistics,21 modified so that
English-speaking countries (Australia, New Zealand,
United Kingdom/Ireland and North America) arepresented separately to non-English speaking
countries. Some of the Australian Bureau of Statistics
categories have been conflated, e.g. North-west,Southern and Eastern Europe are combined into
Europe; and some have been further divided, e.g.
Oceania has been divided into Australia, New Zealandand the Pacific Islands.
Table 32: Law and Justice Foundation groupingsfor country of birth of inquirers
English speaking AustraliaNew ZealandUnited Kingdom/IrelandNorth America
Non-English speaking Pacific IslandsAsiaMiddle East/North AfricaAfrica (excluding North Africa)South/Central AmericaEurope
FOR MORE INFORMATION
Duignan, Jonathon and Staden, Frances, Free
and Independent Immigration Advice: an
Analysis of Data Collected by the Immigration
Advice and Rights Centre July 1990–November
1992, Australian Government Publishing
Service, Canberra, 1995.
Law and Justice Foundation of NSW,
Immigration Advice and Rights Centre
Website Evaluation and Needs Analysis, 2002,
<http://www.lawfoundation.net.au/resources/
iarc/report_final.html>.
NSW Bureau of Crime Statistics and Research,
Publications and Statistics by Subject—
Ethnicity, <http://www.lawlink.nsw.gov.au/
bocsar1.nsf/pages/pub_dtoh#ethnicity>.
21 Australian Bureau of Statistics, Australian Standard Classification Of Cultural and Ethnic Groups, Catalogue No. 1249.0,<http://www.ausstats.abs.gov.au/>.

43Demographic Characteristics of Service Users
CO
UN
TR
Y O
F B
IRT
H
Overview
Use of services
Table 33: Percentage of inquiries by country of birth and service
Country of birth Legal Aid Legal Aid NSW Community NSWAdvice Duty Solicitor Legal Centres pop’n
2000–2002 2000–2002 1999–2002 2001
Inquiries IC Inquiries IC Inquiries IC %% % %
English Australia 67.0 89 78.4 104 63.8 84 75.2speaking New Zealand 2.6 173 3.5 233 2.3 153 1.5
United Kingdom/Ireland 3.3 67 2.2 44 5.0 102 4.9
North America 0.5 100 0.3 60 0.8 160 0.5
Total English speaking 73.4 89 84.4 103 71.9 87 82.1
Non-English Pacific Islands 2.2 200 2.2 200 2.0 181 1.1speakinga
Asia 10.1 134 5.7 76 10.6 141 7.5
Sub-Saharan Africa 1.0 125 0.5 62 1.3 162 0.8
North Africa/Middle East 5.2 247 2.9 138 4.2 200 2.1
South/Central America 1.7 242 0.8 114 2.7 385 0.7
Europe 6.4 112 3.5 61 7.3 128 5.7
Total non-English speaking 26.6 149 15.6 87 28.1 156 17.9
Total (%) 100 100 100 100
Total (No.) 85 921 230 542 379 471
a Includes South Africa
Note: Shaded areas indicate that the IC is greater than 100.
The proportion of inquiries from service users who were born in non-English speaking countries varied
across services. Relative to their proportion of the population, there was a greater use of Community LegalCentres and the Legal Aid NSW Advice Service by people born in non-English speaking countries (IC of 156
and 149 respectively). The proportion of inquiries to the Legal Aid NSW Duty Solicitor Service from service
users born in non-English speaking countries was lower than expected, given their share of the NSWpopulation (IC of 87).
Table 34: Top 3 ICs for inquiries from service users born in non-English speaking countries, by service
Legal Aid NSW Advice IC Legal Aid NSW Duty Solicitor IC NSW Community Legal Centres IC
North Africa/Middle East 247 Pacific Islands 200 South/Central America 385
South/Central America 242 North Africa/Middle East 138 North Africa/Middle East 200
Pacific Islands 200 South/Central America 114 Pacific Islands 181
For service users born in non-English speaking countries, those born in North Africa/Middle East, South/Central America and the Pacific Islands made the greatest number of inquiries relative to their proportion of
the NSW population to all three services (see Table 34).
Of the English speaking countries, service users born in New Zealand made more inquiries to all threeservices than would be expected given their share of the population. The proportion of inquiries from service
users born in the other English speaking countries varied for each service.

44 Access to Justice and Legal Needs — Data Digest
CO
UN
TR
Y O
F B
IRT
H
Legal matter
Data from two services—the Legal Aid NSW Information/Advice Service and NSW Community Legal Centres—were
analysed in terms of the types of legal matters about which different groups made inquiries. Data from the Legal Aid
NSW Duty Solicitor Service were not included due to the high proportion of inquiries about Criminal Law (87%).
The chi-square examining broad area of law by country of birth revealed that, in comparison to their total proportion
of inquiries:
Service users born in non-English speaking countries were more likely to inquire about Civil Law.
Service users born in English speaking countries were more likely to inquire about Criminal Law than service
users born in non-English speaking countries.
Inquiries about Family Law from service users born in non-English speaking countries varied between the
two services. Compared with service users born in English speaking countries, those born in non-English
speaking countries were more likely to make inquiries about Family Law to the Legal Aid NSW Advice Serviceand less likely to make inquiries about Family Law to NSW Community Legal Centres.
The chi-square examining specific area of law by country of birth revealed that, in comparison to their totalproportion of inquiries:
Inquiries about the government/legal system area of Civil Law were consistently higher than expected for
service users born in non-English speaking countries of birth. A large proportion of these were aboutimmigration/refugee matters for both services (62% and 79% respectively).

45Demographic Characteristics of Service Users
CO
UN
TR
Y O
F B
IRT
H
Proportion of inquiries, Legal Aid NSW Advice Service
Table 35: Percentage of inquiries by country of birth and yearLegal Aid NSW Advice Service, 2000–2002
Country of birth 2000 2001 2002 All NSW Pop’n% % % % IC %
English Australia 67.3 66.5 67.1 67.0 89 75.2speaking New Zealand 2.6 2.6 2.6 2.6 173 1.5
United Kingdom/Ireland 3.4 3.3 3.1 3.3 67 4.9
North America 0.5 0.4 0.5 0.5 100 0.5
Total English speaking 73.8 72.9 73.3 73.3 89 82.1
Non-English Pacific Islands 1.9 2.2 2.5 2.2 200 1.1speakinga
Asia 9.7 10.2 10.3 10.1 134 7.5
Sub-Saharan Africa 1.0 1.1 1.0 1.0 125 0.8
North Africa/Middle East 5.1 5.4 5.0 5.2 247 2.1
South/Central America 1.7 1.7 1.8 1.7 242 0.7
Europe 6.8 6.5 6.1 6.4 112 5.7
Total non-English speaking 26.2 27.1 26.7 26.7 149 17.9
Total (%) 100 100 100 100 100
Total (No.) 27 191 28 532 30 198 85 921
a Includes South Africa.
Notes: Shaded areas indicate that the IC is greater than 100.Information about country of birth was missing for an additional 53335 (38.3%) inquiries for the Advice Service. The data have been adjusted to takethis into account as outlined in Appendix 4. Country of birth was not collected for 227770 inquiries to the Information Service.
Source: Legal Aid NSW (unpublished data).
Figure 22: Percentage of inquiries by country of birth and yearLegal Aid NSW Advice Service, 2000–2002
Source: Legal Aid NSW (unpublished data).
Comment
There was a high proportion of inquiries without information about country of birth (38%).
There was a greater number of inquiries from people born in non-English speaking countries than would be
expected given their share of the population (IC of 149).
In terms of inquiries from those born in non-English speaking regions, North Africa/Middle East had the
highest IC (247), followed by South/Central America (242) and the Pacific Islands (200).
Among service users born in English speaking countries, only those born in New Zealand generated a greaterproportion of inquiries than would be expected given their share of the population (IC of 173).
Based on the chi-square examining country of birth by year, there was no significant change in the overallproportion of inquiries from service users born in English speaking and non-English speaking countries from
2000 to 2002.

46 Access to Justice and Legal Needs — Data Digest
CO
UN
TR
Y O
F B
IRT
H
Proportion of inquiries, Legal Aid NSW Duty Solicitor Service
Table 36: Percentage of inquiries by country of birth and yearLegal Aid NSW Duty Solicitor Service, 2000–2002
Country of birth 2000 2001 2002 All NSW pop’n% % % % IC %
English Australia 78.4 78.6 78.3 78.4 104 75.2speaking New Zealand 3.5 3.5 3.6 3.5 233 1.5
United Kingdom/Ireland 2.1 2.2 2.2 2.2 44 4.9
North America 0.3 0.3 0.3 0.3 60 0.5
Total English speaking 84.2 84.5 84.4 84.4 103 82.1
Non-English Pacific Islands 2.3 2.1 2.1 2.2 200 1.1speakinga
Asia 6.1 5.6 5.3 5.7 76 7.5
Sub-Saharan Africa 0.5 0.5 0.7 0.5 62 0.8
North Africa/Middle East 2.8 2.9 3.0 2.9 138 2.1
South/Central America 0.8 0.7 0.8 0.8 114 0.7
Europe 3.4 3.6 3.8 3.5 61 5.7
Total non-English speaking 15.8 15.5 15.6 15.6 87 17.9
Total (%) 100 100 100 100 100
Total (No.) 98 765 84 024 47 753 230 542
a Includes South Africa.
Notes: Shaded areas indicate that the IC is greater than 100.Information about country of birth was missing for an additional 12903 (5.3%) inquiries.
Source: Legal Aid NSW (unpublished data).
Figure 23: Percentage of inquiries by country ofbirth and yearLegal Aid NSW Duty Solicitor, 2000–2002
Source: Legal Aid NSW (unpublished data).
Comment
Overall, there were fewer inquiries from people born in non-English speaking countries than would be
expected given their share of the population (IC of 87).
This was not the case for all service users born in non-English speaking countries—inquiries from serviceusers born in the Pacific Islands had an IC of 200, followed by North Africa/Middle East (138) and South/
Central America (114).
Of those born in English speaking countries, service users born in New Zealand, with an IC of 233, were twiceas likely to make inquiries as would be expected given their share of the population. Australian born service
users made about the number of inquiries that would be expected given their share of the population (104).
Based on the chi-square examining country of birth by year, there was no significant variation in the
proportion of inquiries made by service users born in a non-English speaking country between 2000 and 2002.

47Demographic Characteristics of Service Users
CO
UN
TR
Y O
F B
IRT
H
Proportion of inquiries, NSW Community Legal Centres
Table 37: Percentage of inquiries by country of birth and yearNSW Community Legal Centres, 1999–2002
Country of birth 1999 2000 2001 2002 All NSW Pop’n% % % % % IC %
English Australia 65.0 63.9 63.2 63.0 63.8 84 75.2speaking New Zealand 2.2 2.3 2.3 2.4 23 153 1.5
United Kingdom/Ireland 4.8 6.0 5.1 4.7 5.0 102 4.9
North America 0.7 0.8 0.8 0.9 0.8 160 0.5
Total English speaking 72.7 73 71.4 71.0 71.9 87 82.1
Non-English Pacific Islands 2.1 1.9 2.0 2.0 2.0 181 1.1speakinga
Asia 10.0 10.2 11.0 11.1 10.6 141 7.5
Africa (excl. North Africa) 1.2 1.2 1.3 1.4 1.3 162 0.8
North Africa/Middle East 4.0 4.4 4.2 4.4 4.2 200 2.1
South/Central America 2.7 2.6 2.7 2.8 2.7 385 0.7
Europe 7.1 7.4 7.3 7.3 7.3 128 5.7
Total non-English speaking 27.3 27.0 28.6 29.0 28.1 156 17.9
Total (%) 100 100 100 100 100 100
Total (No.) 89 809 91 666 96 541 101 455 379 471
a Includes South Africa.
Notes: Shaded areas indicate that the IC is greater than 100.Information about country of birth was missing for 163173 (43%) inquiries (country of birth was not collected for information and some telephone advice inquiries). The datahave been adjusted to take this into account as outlined in Appendix 4.
Source: Commonwealth Attorney-General’s Department National Information Scheme (unpublished data).
Figure 24: Percentage of inquiries by country of birth and yearNSW Community Legal Centres, 1999–2002
Source: Commonwealth Attorney-General’s Department National Information Scheme (unpublished data).
Comment
There was a high proportion of inquiries without information about country of birth (43%).
Overall, service users born in a non-English speaking country, with an IC of 156, made more inquiries to NSWCommunity Legal Centres than would be expected given their share of the population. This was the case for
all non-English speaking countries, with service users born in South/Central America having the highest IC
(385), followed by North Africa/Middle East (200) and the Pacific Islands (181).
Among service users who were born in an English speaking country, only those born in Australia made fewer
inquiries than would be expected given their share of the population (IC of 84).
Based on the chi-square examining country of birth by year:
There was an overall increase in the proportion of inquiries from service users born in non-English speakingcountries from 27 per cent to 29 per cent. However, this increase was not evident for all non-English speaking
countries—there was a decrease in inquiries from those born in the Pacific Islands.
There was a corresponding decrease from 73 per cent to 71 per cent in the proportion of inquiries from service
users born in English speaking countries between 1999 and 2002.

48 Access to Justice and Legal Needs — Data Digest
CO
UN
TR
Y O
F B
IRT
H
Legal matter, Legal Aid NSW Advice Service
Figure 25: Percentage of inquiries by country of birth and broad area of lawLegal Aid NSW Advice Service, 2000–2002
Notes: N = 77043. Information about country of birth was missing for an additional 46519 (38%) inquiries for theAdvice Service. The data have been adjusted to take this into account as outlined in Appendix 4.Country of birth was not collected for 227770 inquiries to the Information Service.See Table 5-6 in Appendix 5 for more details.
Source: Legal Aid NSW (unpublished data).
Comment
There was a high proportion of inquiries without information about country of birth (38%).
Based on the chi-square examining country of birth by broad area of law:
Service users born in a non-English speaking country were more likely than their counterparts to inquire
about Civil Law than. In contrast, service users born in an English speaking country were more likely thantheir counterparts to inquire about Criminal and Family Law.
Based on the chi-square, Table 38 shows the specific legal matters that each country group inquired about at a rate
higher than the sample rate.
Table 38: Specific area of lawa about which each birth country group was morelikely to inquireLegal Aid NSW Advice Service, 2000–2002
Country of birth Specific area of law
Australia Family, General crime, Health/Human rights, Wills/Estates
New Zealand General crime, Traffic offences
United Kingdom/Ireland Family, Housing, Personal injury
North America Family
Pacific Islands Traffic offences
Asia Consumers, Employment, Government/Legal system,b Motor vehicles
Sub-Saharan Africa Government/Legal systemb
North Africa/Middle East Consumers, Government/Legal system,b Motor vehicles, Personal injury
South/Central America Consumers, Employment, Government/Legal system,b Motor vehicles
Europe Business/Media, Consumers, Credit/Debt, Employment, Government/Legal system,b Housing, Motor vehicles, Personal injury
a Civil-other not included.
b 62 per cent of government/legal system inquiries from non-English speaking service users related to immigration orrefugee matters; 20 per cent to administrative law and 14 per cent to pensions and allowances.
Source: Legal Aid NSW (unpublished data).

49Demographic Characteristics of Service Users
CO
UN
TR
Y O
F B
IRT
H
Legal matter, NSW Community Legal Centres
Figure 26: Percentage of inquiries by country of birth and broad area of lawNSW Community Legal Centres, 1999–2002
Notes: N = 380619. Information about country of birth was missing for 162112 (43%) inquiries (country of birth wasnot collected for information and some telephone advice inquiries). The data have been adjusted to take this intoaccount as outlined in Appendix 4.See Table 5-7 in Appendix 5 for more details.
Source: Commonwealth Attorney-General’s Department National Information Scheme (unpublished data).
Comment
There was a high proportion of inquiries without information about country of birth (43%).
For all country groups, the majority of inquiries were about Civil Law. However, based on the chi-square
examining broad area of law by country of birth, people born in a non-English speaking country were even
more likely than their counterparts to inquire about Civil Law. Conversely, people born in an English speakingcountry were more likely than their counterparts to inquire about Criminal and Family Law.
Based on the chi-square, Table 39 shows the specific legal matters that each country group inquired about at
a rate higher than the sample rate.
Table 39: Specific area of law about which each birth country group was morelikely to inquireNSW Community Legal Centres, 1999–2002
Country of birth Specific area of law
Australia Family, General crime, Domestic violence, Business/Media, Consumers,Credit/Debt, Health/Human rights, Wills/Estates
New Zealand General crime, Employment, Housing
United Kingdom/Ireland Government/Legal system,a Housing, Wills/Estates
North America Government/Legal system,a Housing
Pacific Islands Government/Legal systema
Asia Government/Legal system,a Motor vehicles
Sub-Saharan Africa Government/Legal systema
North Africa/Middle East Government/Legal system,a Motor vehicles
South/Central America Government/Legal system,a Motor vehicles
Europe Consumers, Government/Legal system,a Motor vehicles,Personal injury,Wills/Estates
a 79 per cent of government/legal system inquiries from non-English speaking service users related to immigration orrefugee matters and 17 per cent related to pensions and allowances.
Source: Commonwealth Attorney-General’s Department National Information Scheme (unpublished data).
50 Access to Justice and Legal Needs — Data Digest
IND
IGE
NO
US
AU
ST
RA
LIA
NS
Indigenous Australians
This section presents information about the proportion
of inquiries to the different legal assistance services
from Indigenous Australians, and the nature of theirlegal problems.
Services with available data are Legal Aid NSW Advice
Service, Legal Aid NSW Duty Solicitor Service and
NSW Community Legal Centres.
The report does not include data from the Aboriginal
and Torres Strait Islander Legal Service or WirringaBaiya Women’s Legal Centre.
FOR MORE INFORMATION
Aboriginal Justice Advisory Council, <http://www.lawlink.nsw.gov.au/ajac.nsf/pages/
index>.
Aboriginal Justice Advisory Council, Driving
Offences and Aboriginal People: Stage 1:
Offence Targeting Project, 2003, <http://www.
lawl ink.nsw.gov.au/a jac .nsf /51bf77d
7793e43184a2565e800280584/5456562c82f0e90aca256d190012c3ed /$FILE/
Aboriginal+people+%26+driving+Licence+
offences.PDF>.
Aboriginal and Torres Strait Islander
Commission, Annual Report, <http://www.atsic.gov.au/About_ATSIC/annual_report/>.
Australian Bureau of Statistics, Indigenous
Social Survey, ABS, Canberra, [expected
release date April 2004].
Australian Institute of Criminology, Trends in
the Imprisonment of Indigenous People in
Australia, AIC, Canberra, 2000.
Goodstone, Alexis and Dr. Patricia Ranald,Discrimination ..... Have You Got All Day?
Public Interest Advocacy Centre, Sydney, 2001.
Human Rights and Equal Opportunity
Commission, A Statistical Overview of
Aboriginal and Torres Strait Islander People
in Australia, 2004, <http://www.humanrights.
gov.au/social_justice/statistics/>.
NSW Bureau of Crime Statistics and Research,
Publications and Statistics by Subject—
Aboriginality, <http://www.lawlink.nsw.gov.au/bocsar1.nsf/pages/pub_atoc#aboriginality>.

51Demographic Characteristics of Service Users
IND
IGE
NO
US
AU
ST
RA
LIA
NS
Overview
Use of services
Table 40: Percentage of inquiries by Indigenous Australian status and service
Indigenous Legal Aid NSW Legal Aid NSW Community NSWAustralian Advice Duty Solicitor Legal Centres Pop’n
2000–2002 2000–2002 1999–2002 2001
% IC % IC % IC %
Yes 2.0 105 4.0 210 4.8 252 1.9
No 98.0 99 96.0 97 95.2 97 98.1
Total (%) 100 100 100 100
Total (No.) 139 245 244 322 380 587
Notes: Shaded areas indicate that the IC is greater than 100.
The proportion of inquiries from Indigenous Australians to the Legal Aid NSW Duty Solicitor Service (IC210) and NSW Community Legal Centres (IC 252) was about twice as high as expected, given their share of the
NSW population. The proportion of inquiries from Indigenous Australians to the Legal Aid NSW Advice
Service (IC 105) was only slightly higher than expected on a population basis.
Based on the chi-square examining Indigenous status by year, inquiries to NSW Community Legal Centres
by Indigenous Australians increased steadily between 1999 and 2002, but inquiries to the Legal Aid NSW
Advice and Duty Solicitor Services did not change significantly.
Legal matter
Services include the Legal Aid NSW Advice Service and NSW Community Legal Centres. The Legal Aid NSW Duty
Solicitor Service was not included due to the high proportion of inquiries about Criminal Law (87%).
Table 41: Five most frequent specific areas of law inquired aboutby Indigenous Australians, by service
Legal Aid NSW Advice NSW Community Legal Centres2000–2002 1999–2002
Specific area of law % Specific area of law %
General crime 36.1 Family 36.7
Family 30.9 General crime 11.8
Government/Legal system 8.4 Domestic violence 11.4
Credit/Debt 2.7 Government/Legal system 9.6
Personal injury 2.6 Credit/Debt 6.2
For both services, the following specific areas of law were among the five most frequently inquired about:
family, general crime, government/legal system and credit/debt (see Table 41). The fifth most frequent type ofinquiry was domestic violence for NSW Community Legal Centres and personal injury for the Legal Aid NSW
Information/Advice Service.
Based on the chi-square, there were significant differences in the specific area of law that Indigenous Australiansinquired about compared with non-Indigenous Australians in both services:
A greater proportion of inquiries from Indigenous Australians to the Legal Aid NSW Advice Service
concerned general crime, consumers, health/human rights and personal injury.
A greater proportion of inquiries from Indigenous Australians to NSW Community Legal Centres concernedfamily law, general crime, domestic violence, health/human rights and personal injury.

52 Access to Justice and Legal Needs — Data Digest
IND
IGE
NO
US
AU
ST
RA
LIA
NS
Proportion of inquiries, Legal Aid NSW Advice Service
Table 42: Percentage of inquiries by Indigenous Australian status and yearLegal Aid NSW Advice Service, 2000–2002
Indigenous 2000 2001 2002 All NSW Pop’nAustralian % % % % IC %
Yes 2.1 1.9 2.1 2.0 105 1.9
No 97.9 98.1 97.9 98.0 99 98.1
Total (%) 100 100 100 100 100
Total (No.) 43 324 46 602 49 319 139 245
Note: Shaded areas indicate that the IC is greater than 100.
Source: Legal Aid NSW (unpublished data).
Figure 27: Percentage of inquiries by Indigenous Australianstatus and yearLegal Aid NSW Advice Service, 2000–2002
Source: Legal Aid NSW (unpublished data).
Comment
For the period 2000 to 2002, Indigenous Australians generated slightly more inquiries than would be expectedgiven their share of the population (IC of 105).
Based on the chi-square examining Indigenous status by year, the proportion of inquiries from Indigenous and
non-Indigenous Australians did not vary significantly over this period (see Figure 27).

53Demographic Characteristics of Service Users
IND
IGE
NO
US
AU
ST
RA
LIA
NS
Proportion of inquiries, Legal Aid NSW Duty Solicitor Service
Table 43: Percentage of inquiries by Indigenous Australian status and yearLegal Aid NSW Duty Solicitor Service, 2000–2002
Indigenous 2000 2001 2002 All NSW Pop’nAustralian % % % % IC %
Yes 4.1 3.7 4.1 4.0 211 1.9
No 95.9 96.3 95.9 96.0 97 98.1
Total (%) 100 100 100 100 100
Total (No.) 103 620 88 888 51 814 244 322
Note: Shaded areas indicate that the IC is greater than 100.
Source: Legal Aid NSW (unpublished data).
Figure 28: Percentage of inquiries by Indigenous Australianstatus and yearLegal Aid Duty Solicitor Service, 2000–2002
Source: Legal Aid NSW (unpublished data).
Comment
Indigenous Australians generated over 2 times the number of inquiries to the Duty Solicitor Service thanwould be expected given their share of the population (IC of 211).
Based on the chi-square examining Indigenous status by year, the proportion of inquiries from Indigenous
Australians did not change overall between 2000 and 2002. The proportion of inquiries declined in 2001, andthen increased in 2002 to the same level as in 2000.

54 Access to Justice and Legal Needs — Data Digest
IND
IGE
NO
US
AU
ST
RA
LIA
NS
Proportion of inquiries, NSW Community Legal Centres
Table 44: Percentage of inquiries by Indigenous Australian status and yearNSW Community Legal Centres, 1999–2002
Indigenous 1999 2000 2001 2002 All NSW Pop’nAustralian % % % % % IC %
Yes 4.0 4.6 5.1 5.5 4.8 252 1.9
No 96.0 95.4 94.9 94.5 95.2 97 98.1
Total (%) 100 100 100 100 100 100
Total (No.) 89 901 91 923 96 911 101 852 380 587
Notes: Shaded areas indicate that the IC is greater than 100.Information about Indigenous Australian status was missing for 178876 (47%) inquiries (Indigenous status was not collected for informationand some telephone advice inquiries). The data have been adjusted to take this into account as outlined in Appendix 4.
Source: Commonwealth Attorney-General’s Department National Information Scheme (unpublished data).
Figure 29: Percentage of inquiries by Indigenous Australianstatus and yearNSW Community Legal Centres, 1999–2002
Source: Commonwealth Attorney-General’s Department National Information Scheme(unpublished data).
Comment
Information about Indigenous Australian status was missing for a large proportion of the data (47%).
The IC of 252 indicates that Indigenous Australian users of Community Legal Centres generated two and ahalf times more inquiries than would be expected given their share of the population.
Based on the chi-square examining Indigenous status by year, there was a significant increase in the
proportion of inquiries to Community Legal Centres from Indigenous Australians between 1999 and 2002,from 4 per cent to 6 per cent.
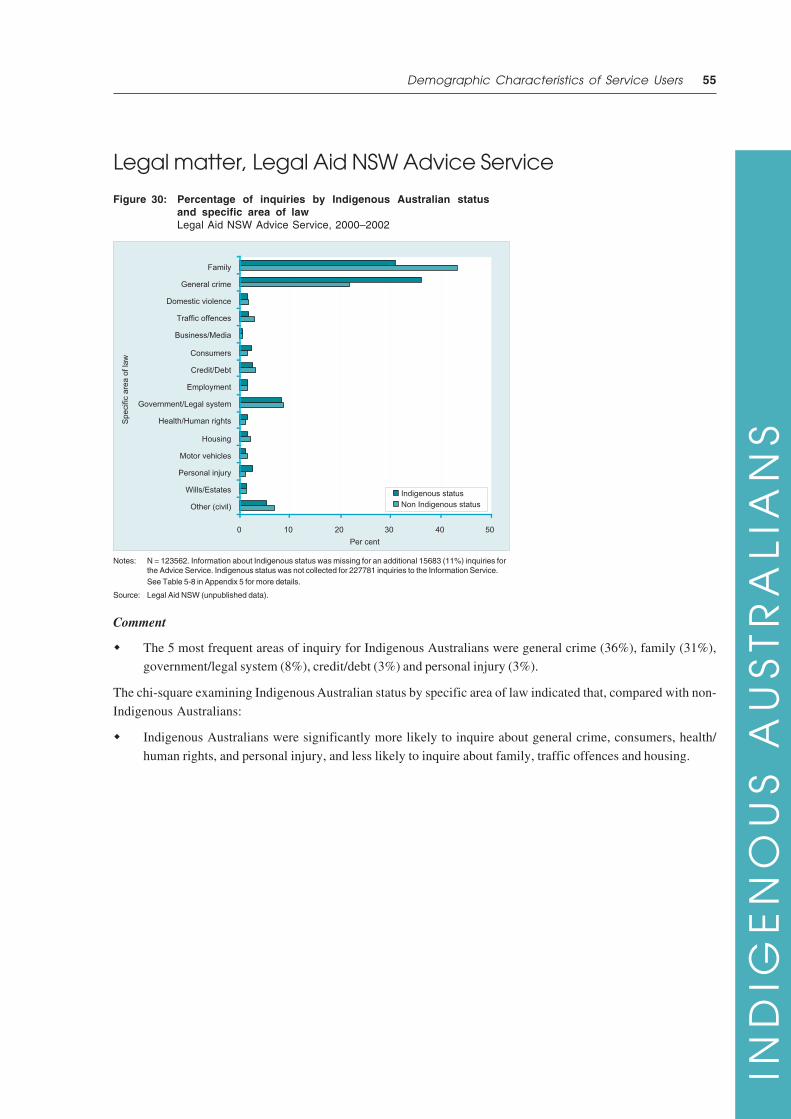
55Demographic Characteristics of Service Users
IND
IGE
NO
US
AU
ST
RA
LIA
NS
Legal matter, Legal Aid NSW Advice Service
Figure 30: Percentage of inquiries by Indigenous Australian statusand specific area of lawLegal Aid NSW Advice Service, 2000–2002
Notes: N = 123562. Information about Indigenous status was missing for an additional 15683 (11%) inquiries forthe Advice Service. Indigenous status was not collected for 227781 inquiries to the Information Service.See Table 5-8 in Appendix 5 for more details.
Source: Legal Aid NSW (unpublished data).
Comment
The 5 most frequent areas of inquiry for Indigenous Australians were general crime (36%), family (31%),government/legal system (8%), credit/debt (3%) and personal injury (3%).
The chi-square examining Indigenous Australian status by specific area of law indicated that, compared with non-
Indigenous Australians:
Indigenous Australians were significantly more likely to inquire about general crime, consumers, health/
human rights, and personal injury, and less likely to inquire about family, traffic offences and housing.

56 Access to Justice and Legal Needs — Data Digest
IND
IGE
NO
US
AU
ST
RA
LIA
NS
Legal matter, NSW Community Legal Centres
Figure 31: Percentage of inquiries by Indigenous Australian status andspecific area of lawNSW Community Legal Centres, 1999–2002
Notes: N = 201385. Information about Indigenous status was missing for 179234 (47%) inquiries (Indigenous status was notcollected for information and some telephone advice inquiries). The data have been adjusted to take this into accountas outlined in Appendix 4.See Table 5-9 in Appendix 5 for more details.
Source: Commonwealth Attorney-General’s Department National Information Scheme (unpublished data).
Comment
There was a high proportion of inquiries with no information about Indigenous status (47%).
The first 5 most common areas of inquiry for Indigenous Australian service users were family (37%), generalcrime (12%), domestic violence (11%), government/legal system (10%) and credit/debt (6%).
The chi-square for NSW Community Legal Centres examining Indigenous Australian status by specific area of law
indicated that, compared with non-Indigenous Australians:
Indigenous Australians were significantly more likely to inquire about family law, general crime, domestic
violence, health/human rights (includes discrimination) and personal injury, and less likely to inquire about
traffic offences and a number of areas of Civil Law: consumers, government/legal system, housing,22 motorvehicles and wills/estates.
22 One possible reason for the lower percentage of housing enquiries from Indigenous Australians, as compared to housing enquiriesfrom non-Indigenous Australians, could be that specialist Indigenous Tenants Advice Services exist outside of the communitylegal centre sector. The data from these services are therefore not included in the National Information Scheme data. Bycomparison, many of the 14 general (non-Indigenous) tenancy services are auspiced by local community legal centres and theirdata are included in the National Information Scheme data.

57Demographic Characteristics of Service Users
SO
UR
CE
OF
IN
CO
ME
Source of income
This section provides data on the source of income of
service users, including whether they receive an
income, whether they are on government benefits andwhether they are in paid employment.
Services with available data are the Legal Aid NSW
Advice Service, Legal Aid NSW Duty Solicitor Service
and NSW Community Legal Centres.
The categories used by these organisations were
mapped to Law and Justice Foundation categories asoutlined in Table 45.
Table 45: Source of income categories
Law and Justice Foundation Legal Aid NSW NSW Community Legal Centres
No income No income No income
Government benefits Allowances Community DevelopmentEmployment Program
Pensions Other government benefits
Veterans Student allowance
Social Security –
Paid employment Earned income Employed full time
Full time – Employed part time
Part time – Self-employed
Self-employed/Temporary – Employed temporarily
As noted in the method section, it was not possible to calculate ICs for source of income due to differencesbetween the categories used by the services and the NSW Census.
FOR MORE INFORMATION
Harding, Ann, Rachel Lloyd and HarryGreenwell, Financial Disadvantage in
Australia 1999–2000, The Smith Family/
NATSEM, Sydney, 2001.

58 Access to Justice and Legal Needs — Data Digest
SO
UR
CE
OF
IN
CO
ME
Overview
Use of services
Table 46: Percentage of inquiries by source of income and service
Source of income Legal Aid NSW Legal Aid NSW NSW CommunityAdvice Duty Solicitor Legal Centres
2000–2002 2000–2002 1999–2002% % %
No income/government benefits
No income 1.0 31.8 9.3
Government benefits 65.8 60.0 57.7
Total no income/government benefits 66.8 91.8 67.7
Paid employment a 33.2 8.2 33.0
Total (%) 100 100 100
Total (No.) 123 562 242 431 380 620
a Paid employment can be broken down into part time, self-employed/temporary and full time for Community Legal Centres.Differences in the proportion of inquiries for these categories are discussed in the Community Legal Centres analysis.
The majority of inquiries to all three services were from people on no income or on government benefits (see
Table 46).
Legal matter
Data were available for the Legal Aid NSW Advice Service and NSW Community Legal Centres. The Legal AidNSW Duty Solicitor Service was not included due to the high proportion of inquiries about Criminal Law (87%).
Table 47: Specific area of law about which each income group was more likely to inquire
Source of income Legal Aid NSW Advice NSW Community Legal Centres2000–2002 1999–2002
No income Government/Legal system General crime, Employment, Government/Legal system, Health/Human rights
Government benefits General crime, Traffic offences, Family, General crime, Domestic violence,Employment, Government/Legal system Credit/Debt, Personal injury, Wills/Estates
Paid employmenta Family, Health/Human rights, Housing, Family, Traffic offences, Business/Personal injury, Wills/Estates Media, Consumers, Credit/Debt,
Employment, Housing, Motor vehicles
a Paid employment can be broken down into part time, self-employed/temporary and full time for Community Legal Centres.
Note: Areas of law in common for both services are shaded.
Based on the chi-square examining source of income by specific area of law, Table 47 shows the areas of law
that each income group inquired about at a rate higher than the rate for the sample. Areas of law that particularincome groups inquired about at relatively higher rates for both services are shaded.

59Demographic Characteristics of Service Users
SO
UR
CE
OF
IN
CO
ME
Proportion of inquiries, Legal Aid NSW Advice Service
Table 48: Percentage of inquiries by source of income and yearLegal Aid NSW Advice Service, 2000–2002
Source of income 2000 2001 2002 All% % % %
No income/government benefits
No income 1.0 1.2 0.9 1.0
Government benefitsa 64.7 65.7 67.1 65.8
Total no. income/gov. benefits 65.7 66.9 68.0 66.8
Paid employmentb 34.3 33.1 32.0 33.2
Total (%) 100 100 100 100
Total (No.) 42 104 40 959 40 499 123 562
a Those on government benefits can earn a small amount of income.
b It was not possible to divide paid employment into types of employment such as part time or full time.
Note: Information about source of income was missing for 39046 (32%) inquiries. The data have beenadjusted to take this into account as outlined in Appendix 4.
Source: Legal Aid NSW (unpublished data).
Figure 32: Percentage of inquiries by source of income and yearLegal Aid NSW Advice Service, 2000–2002
Source: Legal Aid NSW (unpublished data).
Comment
There was a high proportion of inquiries without information about income (32%).
Almost two thirds of inquiries were from service users who were receiving some form of government benefit.
Based on the chi-square examining source of income by year, there was an increase in the proportion ofinquiries from service users who were on government benefits from 2000 to 2002, and a decrease in the
proportion of inquiries from those in paid employment. The proportion of inquiries from service users on no
income fluctuated over the period in question (see Figure 32).

60 Access to Justice and Legal Needs — Data Digest
SO
UR
CE
OF
IN
CO
ME
Proportion of inquiries, Legal Aid NSW Duty Solicitor Service
Table 49: Percentage of inquiries by source of income and yearLegal Aid NSW Duty Solicitor Service, 2000–2002
Source of income 2000 2001 2002 All% % % %
No income/Government benefits
No income 32.4 32.1 30.0 31.8
Government benefitsa 59.2 60.1 61.4 60.0
Total no income/gov. benefits 91.6 92.2 91.4 91.8
Paid employmentb 8.4 7.8 8.6 8.2
Total (%) 100 100 100 100
Total (No.) 102 931 88 198 51 302 242 431
a Those on government benefits can earn a small amount of income.
b Paid employment could not be further broken down into types of employment such as part time or full time.
Note: Information about source of income was mising for an additional 1955 (0.8%) inquiries.
Source: Legal Aid NSW (unpublished data).
Figure 33: Percentage of inquiries by source of income and yearLegal Aid NSW Duty Solicitor Service, 2000–2002
Source: Legal Aid NSW (unpublished data).
Comment
The vast majority of inquiries (9 in 10) were from service users who either received no income or were on some
form of government benefit. Only 8 per cent of inquiries were from service users in paid employment,compared with 58 per cent of the NSW population.23
The chi-square examining source of income by year indicates that there was an increase in the proportion of
inquiries from service users who were on government benefits from 2000 to 2002, and a decrease in theproportion of inquiries from service users on no income. The proportion of inquiries from service users who
were in paid employment fluctuated over the period in question (see Figure 33).
23 These two figures are not directly comparable, due to differences in definitions.

61Demographic Characteristics of Service Users
SO
UR
CE
OF
IN
CO
ME
Proportion of inquiries, NSW Community Legal Centres
Table 50: Percentage of inquiries by source of income and yearNSW Community Legal Centres 1999–2002
Source of income 1999 2000 2001 2002 All% % % % %
No income/government benefitsNo income 8.9 8.3 9.9 10.1 9.3Government benefitsa 57.2 58.1 57.1 58.3 57.7
Total no income/government benefits 66.1 66.4 67.0 68.4 67.7
Paid employmentPart time 11.2 11.0 11.4 11.3 11.2Self-employed/ Temporary 3.5 3.2 3.3 2.9 3.2Full time 19.2 19.4 18.4 17.5 18.6
Total paid employment 33.9 33.6 33.1 31.7 33.0
Total (%) 100 100 100 100 100Total (No.) 89 933 91 924 96 911 101 852 380 620
a Those on government benefits can earn a small amount of income.
Note: Information about source of income was missing for 186504 (49%) inquiries (source of income was not collected for informationand some telephone advice inquiries). The data have been adjusted to take this into account as outlined in Appendix 4.
Source: Commonwealth Attorney-General’s Department National Information Scheme (unpublished data).
Figure 34: Percentage of inquiries by source of income and yearNSW Community Legal Centres, 1999–2002
Source: Commonwealth Attorney-General’s Department National Information Scheme (unpublished data).
Comment
The high proportion of inquiries without information about income (49%) should be noted.
68 per cent of inquiries were from service users who either had no income or received some form of
government benefit.
33 per cent of inquiries were from people who were in some form of paid employment. This percentage is lower
than the percentage of the NSW population in employment (58%).24
Almost two thirds of inquiries from persons in paid employment were from persons in full time employment.
Based on the chi-square between source of income and year:
The proportion of inquiries from service users on no income increased overall, comprising a decrease in 2000,
followed by increases in 2001 and 2002.
For those in full time employment, the opposite trend occurred. Their proportion of inquiries decreased
overall, with a rise in 2000 followed by decreases in 2001 and 2002.
The proportion of inquiries from service users who were in part time employment, self-employed, or receivedsome form of government benefit fluctuated between 1999 and 2002.
24 These two figures are not directly comparable, due to differences in definitions.

62 Access to Justice and Legal Needs — Data Digest
SO
UR
CE
OF
IN
CO
ME
Legal matter, Legal Aid NSW Advice Service
Figure 35: Percentage of inquiries by source of income and specific area of lawLegal Aid NSW Advice Service, 2000–2002
Notes: N = 123561. Information about source of income was missing for 38304 (31%) inquiries. The data have been adjusted totake this into account as outlined in Appendix 4.See Table 5-10 in Appendix 5 for more details.
Source: Legal Aid NSW (unpublished data).
Comment
There was a high proportion of inquiries without information about income (31%).
A high proportion of inquiries for all income groups related to family, general crime and government benefits.
There were, however, differences in the specific legal issues about which different income groups inquired.
Based on the chi-square examining specific area of law by source of income, when compared with the sample as a
whole:
Service users classified as having no income were more likely to inquire about government/legal system andwills/estates. The government/legal system category includes inquiries about immigration, pensions and
allowances and legal process.
Service users on government benefits were more likely to inquire about general crime, traffic offences,
employment and government/legal system.
Service users who were employed were more likely to make inquiries about family matters and a range of Civil
Law issues—health/human rights, housing, personal injury and wills/estates.

63Demographic Characteristics of Service Users
SO
UR
CE
OF
IN
CO
ME
Legal matter, NSW Community Legal Centres
Figure 36: Percentage of inquiries by source of income and specific area of lawNSW Community Legal Centres, 1999–2002
Notes: N = 194645. Information about source of income was missing for an additional 187012 (49%) inquiries (source ofncome was not collected for information and some telephone advice inquiries). The data have been adjusted to take thisinto account as outlined in Appendix 4.See Table 5-11 in Appendix 5 for more details.
Source: Commonwealth Attorney-General’s Department National Information Scheme (unpublished data).
Comment
There was a high proportion of inquiries without information about income (49%).
Family law and government/legal system were common areas of inquiry for all groups.
Based on the chi-square examining specific area of law by source of income, when compared with the sample as a whole:
Service users on no income were more likely to inquire about general crime, employment, government/legalsystem and health/human rights.
Service users on government benefits were more likely to inquire about family, general crime, domestic
violence, credit/debt, personal injury and wills/estates.
Service users in employment were more likely to inquire about family, traffic offences, and a range of Civil Lawissues—business/media, consumers, credit/debt, employment, housing and motor vehicles. In particular:
– Service users in part-time employment were more likely to inquire about family, traffic offences,employment and motor vehicles.
– Service users who were self-employed were more likely to inquire about traffic offences, business/media,consumers, credit/debt and housing.
– Service users who were employed full-time were more likely to inquire about traffic offences, consumers,
credit/debt, employment, housing and motor vehicles.
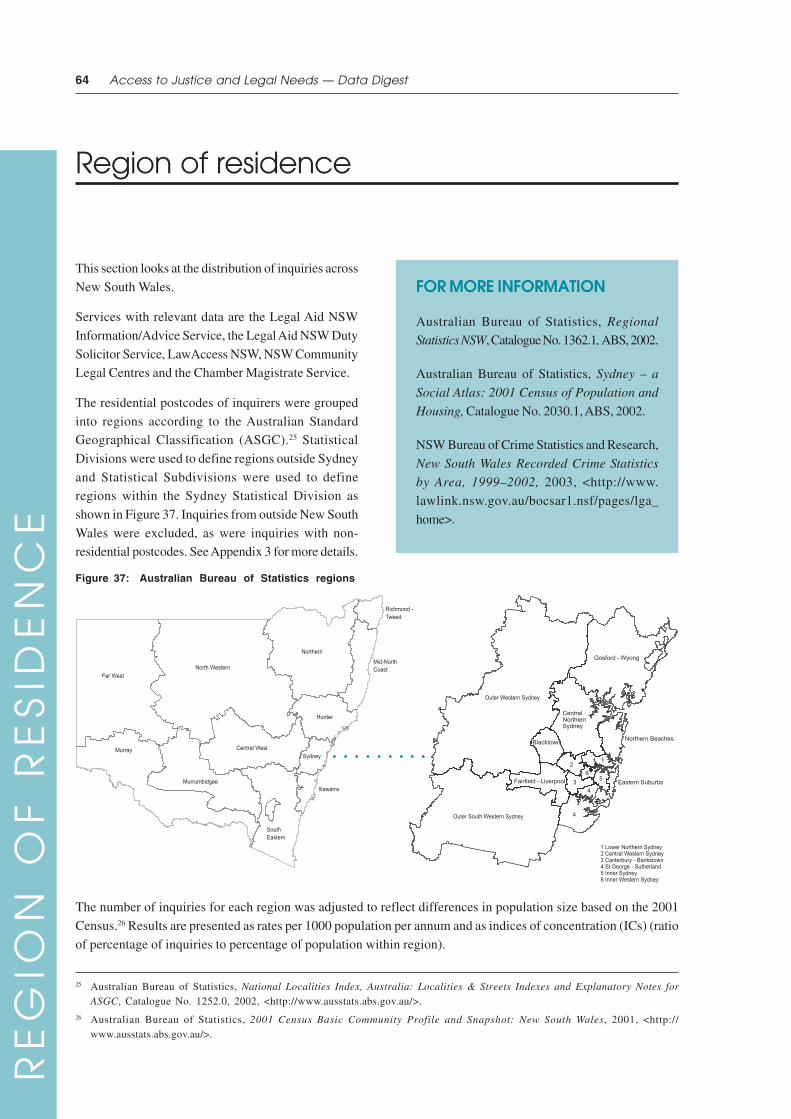
64 Access to Justice and Legal Needs — Data Digest
RE
GIO
N O
F R
ES
IDE
NC
E
Region of residence
This section looks at the distribution of inquiries across
New South Wales.
Services with relevant data are the Legal Aid NSW
Information/Advice Service, the Legal Aid NSW Duty
Solicitor Service, LawAccess NSW, NSW CommunityLegal Centres and the Chamber Magistrate Service.
The residential postcodes of inquirers were grouped
into regions according to the Australian StandardGeographical Classification (ASGC).25 Statistical
Divisions were used to define regions outside Sydney
and Statistical Subdivisions were used to defineregions within the Sydney Statistical Division as
shown in Figure 37. Inquiries from outside New South
Wales were excluded, as were inquiries with non-residential postcodes. See Appendix 3 for more details.
Figure 37: Australian Bureau of Statistics regions
The number of inquiries for each region was adjusted to reflect differences in population size based on the 2001
Census.26 Results are presented as rates per 1000 population per annum and as indices of concentration (ICs) (ratio
of percentage of inquiries to percentage of population within region).
FOR MORE INFORMATION
Australian Bureau of Statistics, Regional
Statistics NSW, Catalogue No. 1362.1, ABS, 2002.
Australian Bureau of Statistics, Sydney – a
Social Atlas: 2001 Census of Population and
Housing, Catalogue No. 2030.1, ABS, 2002.
NSW Bureau of Crime Statistics and Research,
New South Wales Recorded Crime Statistics
by Area, 1999–2002, 2003, <http://www.
lawlink.nsw.gov.au/bocsar1.nsf/pages/lga_
home>.
25 Australian Bureau of Statistics, National Localities Index, Australia: Localities & Streets Indexes and Explanatory Notes for
ASGC, Catalogue No. 1252.0, 2002, <http://www.ausstats.abs.gov.au/>.
26 Australian Bureau of Statistics, 2001 Census Basic Community Profile and Snapshot: New South Wales, 2001, <http://www.ausstats.abs.gov.au/>.
○ ○ ○ ○ ○ ○ ○ ○ ○

65Demographic Characteristics of Service Users
RE
GIO
N O
F R
ES
IDE
NC
E
Overview
Use of services
Variations in regional use patterns may be susceptible to a number of factors including the availability of services,
knowledge of services or socioeconomic indicators. Further research into the use of services examining the linksbetween regional use, availability of services and other factors would be a valuable exercise.27
Table 51: Regions with a higha index of concentration of inquiries for at least 3 services
Statistical Division Legal Aid Legal Aid Law NSW ChamberNSW NSW Access Community Magistrate
Information/ Duty NSW LegalAdvice Solicitor Centres
2000–2002 2000–2002 2002 1999–2002 1999–2001IC IC IC IC IC
Sydney Inner Sydney 103 180 116 260 118
Central Western 134 225 118 130
Blacktown 206 102 134 102
Fairfield-Liverpool 185 148 103
Outer South Western 172 140 145
Richmond-Tweed 117 136 119 146
Illawarra 128 118 128
Mid-North Coast 136 120 156
Northern 141 139 220
Far West 104 335 138
a ‘High’ is defined as ‘greater than 100’
As shown in Table 51, 5 Sydney regions and 5 non-Sydney regions had ICs greater than 100 for at least 3 of
the 5 services, indicating higher proportions of inquiries than would be expected given their share of the
population. Except for Inner Sydney, the Sydney regions were in the western area of Sydney.
Table 52: IC of inquiries for Sydney and non-Sydneyregions, by service
Service Sydney Non-SydneyIC IC
Legal Aid NSW Information/Advice 100 99
Legal Aid NSW Duty Solicitor 115 75
LawAccess NSW 96 107
Community Legal Centres 114 76
Chamber Magistrate 64 161
The proportion of inquiries to services from Sydney and from rural/regional service users differed betweenservices. Table 52 shows the indices of concentration for each service for Sydney and non-Sydney regions.
27 See, for example, Stimson, R., S. Baum and K. O’Connor, ‘The social and economic performance of Australia’s large regionalcities and towns: implications for rural and regional policy’, Australian Geographical Studies, July 41 (2), 2003, pp. 131–147.This article provides a framework for analysing regional cities and towns in Australia in terms of opportunity and vulnerabilitybased on a range of socioeconomic factors.

66 Access to Justice and Legal Needs — Data Digest
RE
GIO
N O
F R
ES
IDE
NC
E
Legal matter
Services with available data include the Legal Aid NSW Information/Advice Service, LawAccess NSW and NSW
Community Legal Centres. The Legal Aid NSW Duty Solicitor Service was not included due to the high proportion
of inquiries about Criminal Law (87%) and the Chamber Magistrate Service was not included due to insufficientdetail about legal matter.
Table 53 presents, by broad area of law and service, regions with percentages of inquiries that were higher than thecorresponding percentage for NSW overall.
Table 53: Regions with above average percentages of inquiries by broad area of law and servicea
Statistical Division Family Crime Civil
Legal Law CLC Legal Law CLC Legal Law CLCAid Access Aid Access Aid Access
Sydney Inner Sydney
Eastern Suburbs
St George-Sutherland
Canterbury-Bankstown
Fairfield-Liverpool
Outer South Western Sydney
Inner Western Sydney
Central Western Sydney
Outer Western Sydney
Blacktown
Lower Northern Sydney
Central Northern Sydney
Northern Beaches
Gosford-Wyong
Hunter
Illawarra
Richmond-Tweed
Mid-North Coast
Northern
North Western
Central West
South Eastern
Murrumbidgee
Murray
Far West
a Legal Aid NSW Information/Advice Service 2000–2002, LawAccess NSW 2002, Community Legal Centres 1999–2002.
Note: Shaded areas indicate higher than the NSW average for the given service and broad area of law.
In terms of the types of legal matters inquired about by service users, patterns can be discerned across the 3services for which data were available.
Family Law inquiries were generally higher than the average for NSW in rural/regional areas for each service.
Outer regions of Sydney also tended to have higher percentages of Family Law inquiries than NSW overall.
Civil Law inquiries predominated in metropolitan Sydney.
Inquiries about Criminal Law were more widely dispersed, with rural/regional NSW being slightly more likely
to experience a higher than average percentage of inquiries. Inquiries to LawAccess NSW about Criminal Law
related matters were particularly high for rural/regional NSW.
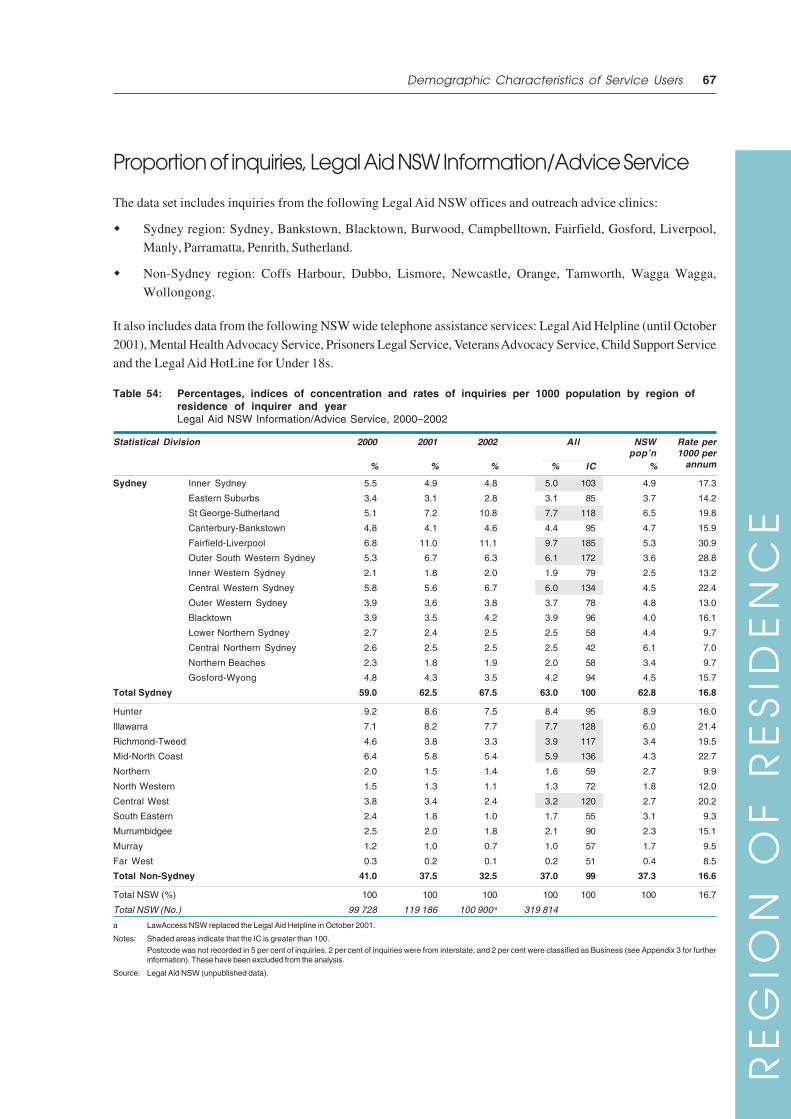
67Demographic Characteristics of Service Users
RE
GIO
N O
F R
ES
IDE
NC
E
Proportion of inquiries, Legal Aid NSW Information/Advice Service
The data set includes inquiries from the following Legal Aid NSW offices and outreach advice clinics:
Sydney region: Sydney, Bankstown, Blacktown, Burwood, Campbelltown, Fairfield, Gosford, Liverpool,Manly, Parramatta, Penrith, Sutherland.
Non-Sydney region: Coffs Harbour, Dubbo, Lismore, Newcastle, Orange, Tamworth, Wagga Wagga,
Wollongong.
It also includes data from the following NSW wide telephone assistance services: Legal Aid Helpline (until October
2001), Mental Health Advocacy Service, Prisoners Legal Service, Veterans Advocacy Service, Child Support Serviceand the Legal Aid HotLine for Under 18s.
Table 54: Percentages, indices of concentration and rates of inquiries per 1000 population by region ofresidence of inquirer and yearLegal Aid NSW Information/Advice Service, 2000–2002
Statistical Division 2000 2001 2002 All NSW Rate perpop’n 1000 per
% % % % IC % annum
Sydney Inner Sydney 5.5 4.9 4.8 5.0 103 4.9 17.3
Eastern Suburbs 3.4 3.1 2.8 3.1 85 3.7 14.2
St George-Sutherland 5.1 7.2 10.8 7.7 118 6.5 19.8
Canterbury-Bankstown 4.8 4.1 4.6 4.4 95 4.7 15.9
Fairfield-Liverpool 6.8 11.0 11.1 9.7 185 5.3 30.9
Outer South Western Sydney 5.3 6.7 6.3 6.1 172 3.6 28.8
Inner Western Sydney 2.1 1.8 2.0 1.9 79 2.5 13.2
Central Western Sydney 5.8 5.6 6.7 6.0 134 4.5 22.4
Outer Western Sydney 3.9 3.6 3.8 3.7 78 4.8 13.0
Blacktown 3.9 3.5 4.2 3.9 96 4.0 16.1
Lower Northern Sydney 2.7 2.4 2.5 2.5 58 4.4 9.7
Central Northern Sydney 2.6 2.5 2.5 2.5 42 6.1 7.0
Northern Beaches 2.3 1.8 1.9 2.0 58 3.4 9.7
Gosford-Wyong 4.8 4.3 3.5 4.2 94 4.5 15.7
Total Sydney 59.0 62.5 67.5 63.0 100 62.8 16.8
Hunter 9.2 8.6 7.5 8.4 95 8.9 16.0
Illawarra 7.1 8.2 7.7 7.7 128 6.0 21.4
Richmond-Tweed 4.6 3.8 3.3 3.9 117 3.4 19.5
Mid-North Coast 6.4 5.8 5.4 5.9 136 4.3 22.7
Northern 2.0 1.5 1.4 1.6 59 2.7 9.9
North Western 1.5 1.3 1.1 1.3 72 1.8 12.0
Central West 3.8 3.4 2.4 3.2 120 2.7 20.2
South Eastern 2.4 1.8 1.0 1.7 55 3.1 9.3
Murrumbidgee 2.5 2.0 1.8 2.1 90 2.3 15.1
Murray 1.2 1.0 0.7 1.0 57 1.7 9.5
Far West 0.3 0.2 0.1 0.2 51 0.4 8.5
Total Non-Sydney 41.0 37.5 32.5 37.0 99 37.3 16.6
Total NSW (%) 100 100 100 100 100 100 16.7
Total NSW (No.) 99 728 119 186 100 900 a 319 814
a LawAccess NSW replaced the Legal Aid Helpline in October 2001.
Notes: Shaded areas indicate that the IC is greater than 100.Postcode was not recorded in 5 per cent of inquiries. 2 per cent of inquiries were from interstate, and 2 per cent were classified as Business (see Appendix 3 for furtherinformation). These have been excluded from the analysis.
Source: Legal Aid NSW (unpublished data).

68 Access to Justice and Legal Needs — Data Digest
RE
GIO
N O
F R
ES
IDE
NC
E
Figure 38: Rate of inquiries per 1000 population by region of residenceLegal Aid NSW Information/Advice Service, 2000–2002
Note: Figure 38 graphically presents all 25 regions in terms of whether they had ‘high’, ‘medium’ or ‘low’ rates of inquiries per 1000 population to the Legal Aid Information/AdviceService. The six regions with the top 25 per cent of inquiries (that is, those in the upper quartile) were defined as having high rates, the six regions with the lowest 25 percent of inquiries (that is, those in the lower quartile) were defined as having low rates, and the remaining thirteen regions (those in the middle two quartiles) were definedas having medium rates.
Comment
Three of the regions in the upper quartile were in the western suburbs of Sydney—Fairfield-Liverpool,Central Western Sydney and Outer South Western Sydney. The remaining regions were rural/regional—
Illawarra, Mid-North Coast and Central West.
In the lower quartile, three of the regions were in the northern area of the Sydney Statistical Division—Central
Northern Sydney, Lower Northern Sydney and Northern Beaches—and three were in rural/regional areas—
Murray, South Eastern and Far West.
There was no difference between Sydney and non-Sydney regions in usage of the Information/AdviceService. The inquiry rate per 1000 population per annum was essentially the same: 16.8 in Sydney and 16.6 in
the rest of NSW.
High = upper quartile
Medium = middle 2 quartiles
Low = lower quartile

69Demographic Characteristics of Service Users
RE
GIO
N O
F R
ES
IDE
NC
E
Figure 39: Proportion of inquiries from Sydney andnon-Sydney regions by yearLegal Aid NSW Information/Advice Service, 2000–2002
Source: Legal Aid NSW (unpublished data)
Based on the chi-square examining region of residence of inquirers by year:
The overall percentage of inquiries in the Sydney region increased annually from 2000 to 2002, with acorresponding annual decrease in the percentage of inquiries in non-Sydney regions.

70 Access to Justice and Legal Needs — Data Digest
RE
GIO
N O
F R
ES
IDE
NC
E
Proportion of inquiries, Legal Aid NSW Duty Solicitor Service
Duty Solicitor Services are located in over 160 local courts across NSW.28
Table 55: Percentages, indices of concentration and rates of inquiries per 1000 population by region ofresidence of inquirer and yearLegal Aid NSW Duty Solicitor Service, 2000–2002
Statistical Division 2000 2001 2002 All NSW Rate perPop’n 1000 per
% % % % IC % annum
Sydney Inner Sydney 8.7 8.7 9.1 8.8 180 4.9 22.6
Eastern Suburbs 3.2 3.2 3.5 3.2 89 3.7 11.1
St George-Sutherland 3.6 4.4 5.9 4.4 67 6.5 8.5
Canterbury-Bankstown 6.1 5.9 5.9 6.0 129 4.7 16.2
Fairfield-Liverpool 8.2 8.3 6.3 7.8 148 5.3 18.6
Outer South Western Sydney 5.5 4.9 4.2 5.0 140 3.6 17.6
Inner Western Sydney 1.7 1.7 1.9 1.7 70 2.5 8.7
Central Western Sydney 10.0 10.1 10.2 10.1 225 4.5 28.2
Outer Western Sydney 6.3 5.8 4.7 5.8 120 4.8 15.0
Blacktown 9.4 8.1 6.4 8.3 206 4.0 25.9
Lower Northern Sydney 1.9 1.9 2.2 2.0 45 4.4 5.6
Central Northern Sydney 2.0 2.2 2.5 2.2 36 6.1 4.5
Northern Beaches 1.8 1.9 2.0 1.8 54 3.4 6.7
Gosford-Wyong 4.8 4.9 4.8 4.8 108 4.5 13.6
Total Sydney 73.0 72.1 69.6 72.0 115 62.8 14.4
Hunter 7.6 8.6 9.4 8.3 94 8.9 11.8
Illawarra 5.6 6.2 6.1 5.9 99 6.0 12.4
Richmond-Tweed 3.3 3.3 3.6 3.3 99 3.4 12.5
Mid-North Coast 2.9 2.7 3.2 2.9 67 4.3 8.4
Northern 1.5 1.4 1.5 1.5 54 2.7 6.8
North Western 0.3 0.4 1.4 0.6 33 1.8 4.2
Central West 2.7 2.6 1.7 2.4 91 2.7 11.5
South Eastern 0.8 0.7 0.9 0.8 26 3.1 3.3
Murrumbidgee 1.6 1.5 1.7 1.6 68 2.3 8.5
Murray 0.6 0.5 0.8 0.6 36 1.7 4.5
Far West 0.0 0.0 0.1 0.1 12 0.4 1.5
Total non-Sydney 27.0 27.9 30.4 28.0 75 37.3 9.4
Total NSW (%) 100 100 100 100 100 100 12.5
Total NSW (No.) 101 614 87 164 50 835 239 613
Notes: Shaded areas indicate that the IC is greater than 100.In 0.2 per cent of inquiries, postcode was not recorded. 0.7 per cent were classified as Business (see Appendix 3 for further details) and 1 per cent were from outside NSW.These have been excluded from the analysis.
Source: Legal Aid NSW (unpublished data).
28 Lawlink NSW, Location of NSW Local Courts, <http://www.lawlink.nsw.gov.au/locations/locnsw.nsf/pages/nswmap>.

71Demographic Characteristics of Service Users
RE
GIO
N O
F R
ES
IDE
NC
E
Figure 40: Rate of inquiries per 1000 population by regionLegal Aid NSW Duty Solicitor, 2000–2002
Note: Figure 40 graphically presents all 25 regions in terms of whether they had ‘high’, ‘medium’ or ‘low’ rates of inquiries per 1000 population.
Comment
On average, the Sydney Statistical Division had a higher proportion of inquiries to the Duty Solicitor Service
per 1000 population (14.4) than the rest of NSW (9.4).
All regions in the top quarter were in the Sydney Statistical Division—Inner Sydney, Central WesternSydney, Fairfield-Liverpool, Blacktown, Outer South Western Sydney and Canterbury-Bankstown.
Four of the six regions in the lower quarter were regional/rural—Far West, South Eastern, North Western and
Murray. The remaining two were Sydney regions—Central Northern Sydney and Lower Northern Sydney.
Figure 41: Proportion of inquiries from Sydney and non-Sydney regions by yearLegal Aid NSW Duty Solicitor Service, 2000–2002
Source: Legal Aid NSW (unpublished data).
Based on the chi-square examining region of residence of inquirers by year:
The percentage of inquiries in the Sydney region declined annually from 2000 to 2002, with a corresponding
annual increase in the percentage of inquiries in non-Sydney regions.
High = upper quartile
Medium = middle 2 quartiles
Low = lower quartile

72 Access to Justice and Legal Needs — Data Digest
RE
GIO
N O
F R
ES
IDE
NC
E
Proportion of inquiries, LawAccess NSW
The data set covers information and advice inquiries from across NSW.
Table 56: Percentages, indices of concentration and rates of inquiriesper 1000 population by region of residence of inquirerLawAccess NSW, 2002
Statistical Division Inquiries Rate per 1000% IC per annum
Sydney Inner Sydney 5.7 116 9.4
Eastern Suburbs 3.7 100 8.3
St George-Sutherland 6.0 93 7.5
Canterbury-Bankstown 3.7 80 6.5
Fairfield-Liverpool 4.8 90 7.3
Outer South Western Sydney 2.7 76 6.2
Inner Western Sydney 2.4 96 7.8
Central Western Sydney 5.3 118 9.6
Outer Western Sydney 4.8 100 8.0
Blacktown 4.1 102 8.3
Lower Northern Sydney 4.5 102 8.3
Central Northern Sydney 4.3 70 5.7
Northern Beaches 2.8 83 6.7
Gosford-Wyong 5.4 122 9.9
Total Sydney 60.2 96 7.8
Hunter 10.7 121 9.8
Illawarra 5.6 94 7.6
Richmond-Tweed 4.5 136 11.0
Mid-North Coast 5.2 120 9.7
Northern 2.4 88 7.1
North Western 2.6 141 11.4
Central West 2.2 82 6.6
South Eastern 3.4 107 8.7
Murrumbidgee 1.7 75 6.1
Murray 1.1 63 5.1
Far West 0.4 104 8.5
Total non-Sydney 39.8 107 8.7
Total NSW (%) 100 8.1
Total NSW (No.) 51 638
Notes: Shaded areas indicate that the IC is greater than 100.Postcode was not recorded in 5 per cent of inquiries. 7 per cent of inquiries were classified as Business(see Appendix 3 for details), and 4 per cent were from interstate. These have been excluded from the analysis.
Source: Law Access NSW (unpublished data).
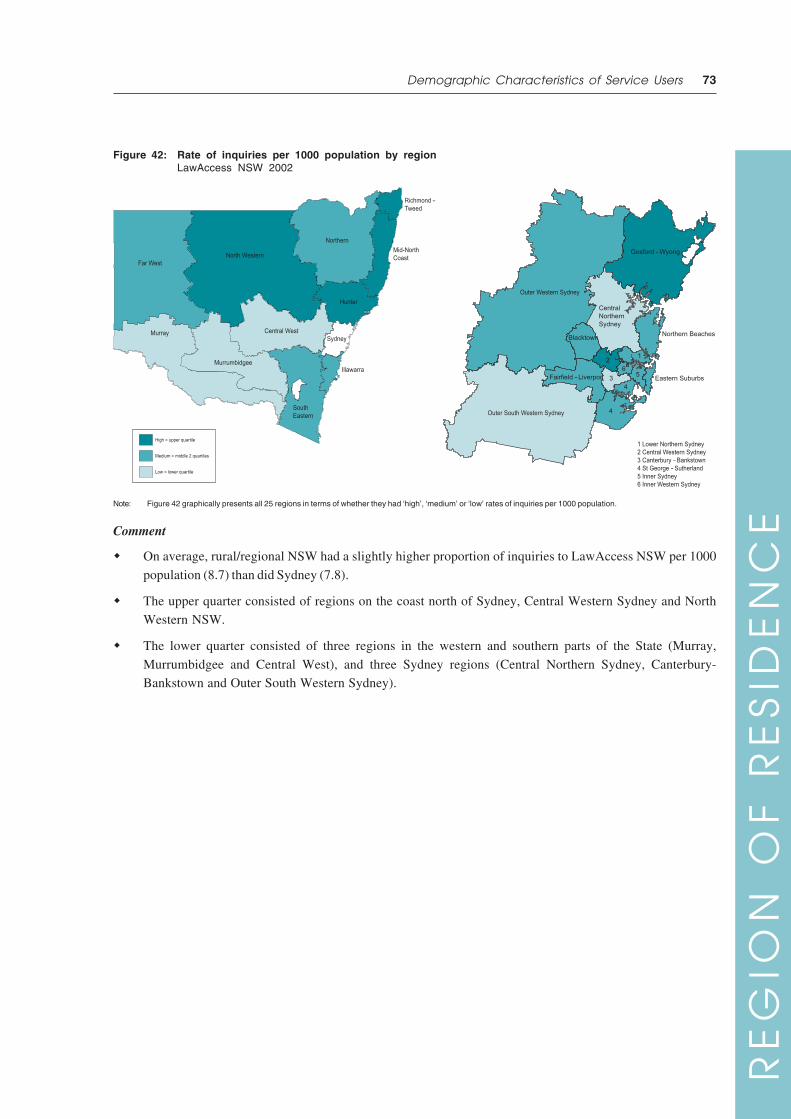
73Demographic Characteristics of Service Users
RE
GIO
N O
F R
ES
IDE
NC
E
Figure 42: Rate of inquiries per 1000 population by regionLawAccess NSW 2002
Note: Figure 42 graphically presents all 25 regions in terms of whether they had ‘high’, ‘medium’ or ‘low’ rates of inquiries per 1000 population.
Comment
On average, rural/regional NSW had a slightly higher proportion of inquiries to LawAccess NSW per 1000
population (8.7) than did Sydney (7.8).
The upper quarter consisted of regions on the coast north of Sydney, Central Western Sydney and NorthWestern NSW.
The lower quarter consisted of three regions in the western and southern parts of the State (Murray,
Murrumbidgee and Central West), and three Sydney regions (Central Northern Sydney, Canterbury-Bankstown and Outer South Western Sydney).
High = upper quartile
Medium = middle 2 quartiles
Low = lower quartile

74 Access to Justice and Legal Needs — Data Digest
RE
GIO
N O
F R
ES
IDE
NC
E
Proportion of inquiries, NSW Community Legal Centres
The data set covers the following generalist NSW Community Legal Centres in NSW: 29
Sydney: Blue Mountains, Central Coast, Kingsford, Hawkesbury/Nepean, Inner City, Macarthur,
Macquarie, Marrickville, Mt Druitt, Redfern, South West Sydney.
Non-Sydney: Albury Wodonga, Far West, Hunter, Illawarra, North and North West, Northern Rivers,
Shoalcoast, Western NSW.
It also covers the following specialist Community Legal Centres providing services across NSW: Aged-Care RightsService, Consumer Credit Legal Centre, Environmental Defenders Office, Disability Rights Service, HIV/Aids Legal
Centre, Immigration Advice and Rights Centre, Public Interest Advocacy Centre, National Children’s and Youth
Law Centre, Tenants’ Union of NSW, Welfare Rights Centre, Women’s Legal Resources Centre.
Table 57: Percentages, indices of concentration and rates of inquiries per 1000 population by region ofresidence of inquirer and yearNSW Community Legal Centres, 1999–2002
Statistical Division 1999 2000 2001 2002 All NSW Annualpop’n rate per
% % % % % IC % 1000
Sydney Inner Sydney 12.9 12.7 12.4 12.8 12.7 260 4.9 32.9
Eastern Suburbs 6.5 6.0 5.5 5.2 5.8 159 3.7 20.1
St George-Sutherland 3.6 3.8 3.7 4.1 3.8 59 6.5 7.4
Canterbury-Bankstown 3.5 4.0 4.0 4.3 4.0 85 4.7 10.8
Fairfield-Liverpool 4.7 5.7 5.5 5.8 5.4 103 5.3 13.0
Outer South Western Sydney 3.7 4.6 5.8 6.4 5.2 145 3.6 18.4
Inner Western Sydney 2.8 3.0 3.0 3.3 3.0 122 2.5 15.4
Central Western Sydney 5.5 5.5 5.8 6.6 5.8 130 4.5 16.4
Outer Western Sydney 11.1 10.0 9.4 8.5 9.7 201 4.8 25.4
Blacktown 5.6 5.1 5.3 5.5 5.4 134 4.0 16.9
Lower Northern Sydney 3.1 3.3 3.2 3.3 3.3 74 4.4 9.3
Central Northern Sydney 3.0 2.9 3.3 3.5 3.2 53 6.1 6.7
Northern Beaches 1.5 1.4 1.4 1.5 1.4 41 3.4 5.2
Gosford-Wyong 3.6 2.9 2.9 2.9 3.1 69 4.5 8.7
Total Sydney 71.1 70.8 71.1 73.8 71.8 114 62.8 14.5
Hunter 5.8 4.7 4.2 4.4 4.7 53 8.8 6.8
Illawarra 6.3 7.6 7.4 6.9 7.1 118 6.0 14.9
Richmond-Tweed 4.9 4.7 4.4 2.2 4.0 119 3.3 15.1
Mid-North Coast 2.3 2.0 1.8 1.5 1.9 44 4.3 5.5
Northern 2.8 2.4 2.3 2.3 2.4 90 2.7 11.4
North Western 2.6 2.3 2.8 2.4 2.5 139 1.8 17.6
Central West 1.4 1.6 1.5 1.5 1.5 56 2.7 7.1
South Eastern 1.0 0.8 0.8 1.1 0.9 29 3.1 3.7
Murrumbidgee 0.8 0.8 0.7 1.3 0.9 39 2.3 4.9
Murraya 0.8 1.0 0.9 1.2 1.0 58 1.7 7.4
Far West 0.3 1.2 1.9 1.6 1.3 335 0.4 42.4
Total non-Sydney 28.9 29.2 28.9 26.2 28.2 76 37.2 9.6
Total NSW (%) 100 100 100 100 100 100 100 12.7
Total NSW (No.) 75 241 79 625 82 799 84 574 322 239
a Murray is also covered by the Murray Mallee Community Legal Service based in Victoria.
Notes: Shaded areas indicate that the IC is greater than 100.Postcode was not recorded in 0.1 per cent of inquiries. 3 per cent of inquiries were from interstate and 2 per cent were classified as Business (see Appendix 3 for furtherinformation). These have been excluded from the analysis.
Source: Commonwealth Attorney-General’s Department National Information Scheme (unpublished data).
29 See Combined Community Legal Centres Group, Directory of New South Wales Community Legal Centres, Surry Hills, 2002, fordetails of generalist and specialist community legal centres.

75Demographic Characteristics of Service Users
RE
GIO
N O
F R
ES
IDE
NC
E
Figure 43: Rate of inquiries per 1000 population by regionNSW Community Legal Centres, 1999–2002
Note: Figure 43 graphically presents all 25 regions in terms of whether they had ‘high’, ‘medium’ or ‘low’ rates of inquiries per 1000 population.
Comment
On average, the Sydney region had a higher rate of inquiries to NSW Community Legal Centres per 1000
population per annum (14.5) than did the rest of NSW (9.6).
Figure 44: Proportion of inquiries from Sydney and non-Sydney regions by yearNSW Community Legal Centres, 1999–2002
Source: Commonwealth Attorney-General’s Department National Information Scheme (unpublished data).
Based on the chi-square examining region of residence of inquirers by year:
The percentage of inquiries in Sydney increased overall. This comprised a decrease in 2000 followed by
increases through 2001 and 2002.
The opposite trend occurred in the non-Sydney regions, with an overall decrease in the proportion ofinquiries. This consisted of an increase in 2000 followed by decreases through 2001 and 2002. It is worth
noting that the Far West region had the highest rate of inquiries per 1000 population for 2000 to 2002 even
though it did not rank in the top 5 for 1999. The Broken Hill Community Legal Centre was established in theFar West region in June 2000.
High = upper quartile
Medium = middle 2 quartiles
Low = lower quartile

76 Access to Justice and Legal Needs — Data Digest
RE
GIO
N O
F R
ES
IDE
NC
E
Proportion of inquiries, Chamber Magistrate Service
Chamber Magistrates are located in over 160 Local Courts across New South Wales.30
Table 58: Percentages, ICs and rates of inquiries per 1000 population by region of residence of inquirerand yearChamber Magistrate Service, 1999–2001
Statistical Division 1999 2000 2001 All NSW Rate perPop’n 1000 per
% % % % IC % annum
Sydney Inner Sydney 6.2 5.7 5.4 5.8 118 4.9 27.5
Eastern Suburbs 1.3 1.4 1.9 1.5 42 3.7 9.8
St George-Sutherland 3.1 3.4 3.9 3.4 53 6.5 12.4
Canterbury-Bankstown 1.7 2.4 2.2 2.1 45 4.7 10.5
Fairfield-Liverpool 3.8 4.0 3.9 3.9 74 5.3 17.3
Outer South Western Sydney 3.5 2.6 2.5 2.9 81 3.6 18.8
Inner Western Sydney 1.8 1.4 1.8 1.7 68 2.5 15.8
Central Western Sydney 3.6 3.2 2.4 3.1 68 4.5 15.8
Outer Western Sydney 4.1 3.6 3.3 3.6 75 4.8 17.5
Blacktown 3.3 4.4 4.6 4.1 102 4.0 23.8
Lower Northern Sydney 0.3 0.5 0.7 0.5 12 4.4 2.7
Central Northern Sydney 1.5 1.7 1.8 1.6 27 6.1 6.3
Northern Beaches 1.6 1.5 1.5 1.5 45 3.4 10.4
Gosford-Wyong 3.5 4.5 5.1 4.4 98 4.5 22.7
Total Sydney 39.3 40.1 41.1 40.2 64 62.8 14.9
Hunter 13.2 13.0 13.1 13.1 148 8.8 34.5
Illawarra 8.1 7.6 7.3 7.7 128 6.0 29.8
Richmond-Tweed 5.0 5.1 4.6 4.9 146 3.3 34.0
Mid-North Coast 6.8 7.2 6.3 6.8 156 4.3 36.4
Northern 4.3 3.9 3.7 3.9 145 2.7 33.9
North Western 4.0 3.6 4.4 4.0 220 1.8 51.2
Central West 5.5 5.9 5.6 5.7 213 2.7 49.6
South Eastern 5.2 5.3 5.1 5.2 166 3.1 38.7
Murrumbidgee 5.3 5.3 5.4 5.3 231 2.3 53.7
Murray 2.8 2.7 2.6 2.7 159 1.7 36.9
Far West 0.5 0.5 0.6 0.5 138 0.4 32.2
Total non-Sydney 60.7 59.9 58.9 59.8 161 37.2 37.4
Total NSW (%) 100 100 100 100 100 23.3
Total (No.) 147 412 146 557 151 212 445 181
a Chamber Magistrate regions were converted into ABS statistical subdivisions and divisions. This could only be done approximately. See Appendix 1 for more details.
Notes: Shaded areas indicate that the IC is greater than 100.0.1 per cent of inquiries were from Children’s Courts. These have been excluded from the analysis.
Source: NSW Local Courts (unpublished data).
30 LawLink NSW, Location of NSW Local Courts, <http://www.lawlink.nsw.gov.au/locations/locnsw.nsf/pages/nswmap/>

77Demographic Characteristics of Service Users
RE
GIO
N O
F R
ES
IDE
NC
E
Figure 45: Rate of inquiries per 1000 population by regionChamber Magistrate Service, 1999–2001
Note: Figure 45 graphically presents all 25 regions in terms of whether they had ‘high’, ‘medium’ or ‘low’ rates of inquiries per 1000 population to the Chamber Magistrate Service.
Comment
Rural/regional NSW had a higher average rate of inquiries to the Chamber Magistrate Service per 1000
population per annum (37.4) than did the Sydney region (14.9).
The regions with the highest usage of Chamber Magistrate services were all rural/regional areas—and thosewith the lowest usage rates were all Sydney metropolitan regions.
Figure 46: Proportion of inquiries from Sydney and non-Sydney regions by yearChamber Magistrate Service, 1999–2001
Source: NSW Local Courts (unpublished data).
Based on the chi-square examining region of residence of inquirers by year:
The proportion of inquiries in Sydney regions increased overall from 1999 to 2001, with a corresponding
decline in the overall proportion of inquiries in non-Sydney regions.
High = upper quartile
Medium = middle 2 quartiles
Low = lower quartile

78 Access to Justice and Legal Needs — Data Digest
RE
GIO
N O
F R
ES
IDE
NC
E
Legal matter, Legal Aid NSW Information/Advice Service
Table 59: Percentage of inquiries by region of residence and broad area of lawLegal Aid NSW Information/Advice Service, 2000–2002
Statistical Division Family Crime Civil Total% % % %
Sydney Inner Sydney 28.5 26.8 44.7 100
Eastern Suburbs 31.2 26.1 42.7 100
St George-Sutherland 39.2 22.2 38.6 100
Canterbury-Bankstown 36.1 20.4 43.4 100
Fairfield-Liverpool 38.2 23.7 38.1 100
Outer South Western Sydney 41.9 30.1 28.0 100
Inner Western Sydney 33.0 19.2 47.8 100
Central Western Sydney 27.6 34.5 37.9 100
Outer Western Sydney 43.9 28.5 27.6 100
Blacktown 41.9 33.6 24.5 100
Lower Northern Sydney 35.0 18.4 46.6 100
Central Northern Sydney 41.9 19.2 38.9 100
Northern Beaches 51.8 18.0 30.1 100
Gosford-Wyong 44.5 22.2 33.2 100
Hunter 50.0 18.0 32.0 100
Illawarra 40.4 20.5 39.1 100
Richmond-Tweed 42.7 20.2 37.2 100
Mid-North Coast 43.1 13.3 43.6 100
Northern 42.6 22.0 35.5 100
North Western 42.2 23.3 34.5 100
Central West 39.2 27.7 33.1 100
South Eastern 39.7 20.7 39.6 100
Murrumbidgee 36.9 34.7 28.3 100
Murray 48.1 23.8 28.0 100
Far West 38.9 21.3 39.8 100
NSW average 40.1 23.5 36.4 100
Notes: Shaded areas indicate higher than the NSW average for the given broad area of law.N = 201707. Postcode was not recorded in 5 per cent of inquiries. Of the remainder, 2 per cent were from interstate and2 per cent were classified as Business (see Appendix 3 for further information). These have all been excluded from the analysis.Phone/counter inquiries excluded. See Appendix 1 for more details.
Source: Legal Aid NSW (unpublished data).
Comment
Based on the chi-square examining region of residence of inquirers by broad area of law:
The percentage of inquiries concerning Family Law was significantly higher than the corresponding
percentage for NSW in 7 of the 11 non-Sydney regions. In comparison, only 6 of the 14 Sydney regions hada higher than average percentage of Family Law inquiries—Outer South Western Sydney, Outer Western
Sydney, Blacktown, Central Northern Sydney, the Northern Beaches and Gosford-Wyong. These Sydney
regions were mostly in outer Sydney.
For Civil Law, almost the opposite occurred—9 of the 14 Sydney regions had higher than average
percentages of inquiries compared with only 5 of the 11 non-Sydney regions.
The distribution of inquiries about Criminal Law across Sydney regions was more even—6 regions had
percentages that were significantly above average, 7 had percentages that were below average and 1recorded a percentage that was almost equal to the NSW average (Fairfield-Liverpool). Rural/regional areas
had lower than average percentages of Criminal Law inquiries in 7 regions and above average percentages in
3 regions. One region (North Western) recorded a percentage that was almost equal to the NSW average.

79Demographic Characteristics of Service Users
RE
GIO
N O
F R
ES
IDE
NC
E
Figure 47 shows, for each broad area of law, the regions with an above average percentage of inquiries (i.e. higher
than the corresponding percentage for NSW overall).
Figure 47: Regions with an above average percentage of inquiries for each broad area of lawNSW Legal Aid Information/Advice Service, 2000–2002
FAMILY
CRIME
CIVIL

80 Access to Justice and Legal Needs — Data Digest
RE
GIO
N O
F R
ES
IDE
NC
E
Based on the chi-square, Table 60 shows the specific legal matters that inquirers from each region of residence
inquired about at a rate higher than the rate for the sample.
Table 60: Specific area of law about which residents of different regions were more likely to inquireLegal Aid NSW Information/Advice Service, 2000–2002
Statistical Division Specific area of law
Sydney Inner Sydney General crime, Business/Media, Employment, Government/Legal system, Health/Humanrights, Housing, Motor vehicles, Personal injury
Eastern Suburbs General crime, Employment, Government/Legal system, Health/Human rights,Housing, Motor vehicles, Personal injury
St George-Sutherland Domestic violence, Consumers, Employment, Government/Legal system, Housing,Wills/Estates
Canterbury-Bankstown Consumers, Government/Legal system, Motor vehicles, Personal injury
Fairfield-Liverpool General crime, Government/Legal system, Motor vehicles
Outer South Western Sydney Family, General crime, Traffic offences
Inner Western Sydney Consumers, Credit/Debt, Employment, Government/Legal system, Health/Humanrights, Housing, Motor vehicles
Central Western Sydney General crime, Government/Legal system
Outer Western Sydney General crime, Family, Traffic offences
Blacktown General crime, Family, Domestic Violence, Traffic offences
Lower Northern Sydney Traffic offences, Consumers, Credit/Debt, Employment, Government/Legal system,Health/Human rights, Housing
Central Northern Sydney Family, Consumers, Government/Legal system
Northern Beaches Family, Employment, Traffic offences
Gosford-Wyong Family, Domestic violence, Credit/Debt, Housing, Wills/Estates
Hunter Family, Health/Human rights, Wills/Estates
Illawarra Housing
Richmond-Tweed Family, Domestic violence, Traffic offences, Credit/Debt, Housing, Motor Vehicles,Wills/Estates
Mid-North Coast Family, Business/Media, Consumers, Credit/Debt, Employment, Health/Human rights,Housing, Personal injury, Wills/Estates
Northern Family, Domestic violence, Business/Media, Credit/Debt
North Western Domestic violence, Credit/Debt, Wills/Estates
Central West General crime, Domestic violence, Credit/Debt, Employment, Wills/Estates
South Eastern Business/Media, Credit/Debt, Employment, Housing, Wills/Estates
Murrumbidgee General crime, Domestic violence
Murray Family, Domestic violence
Far West Business/Media, Personal injury
Note: Phone counter inquiries excluded. See Appendix 1 for more details.
Source: Legal Aid NSW (unpublished data).
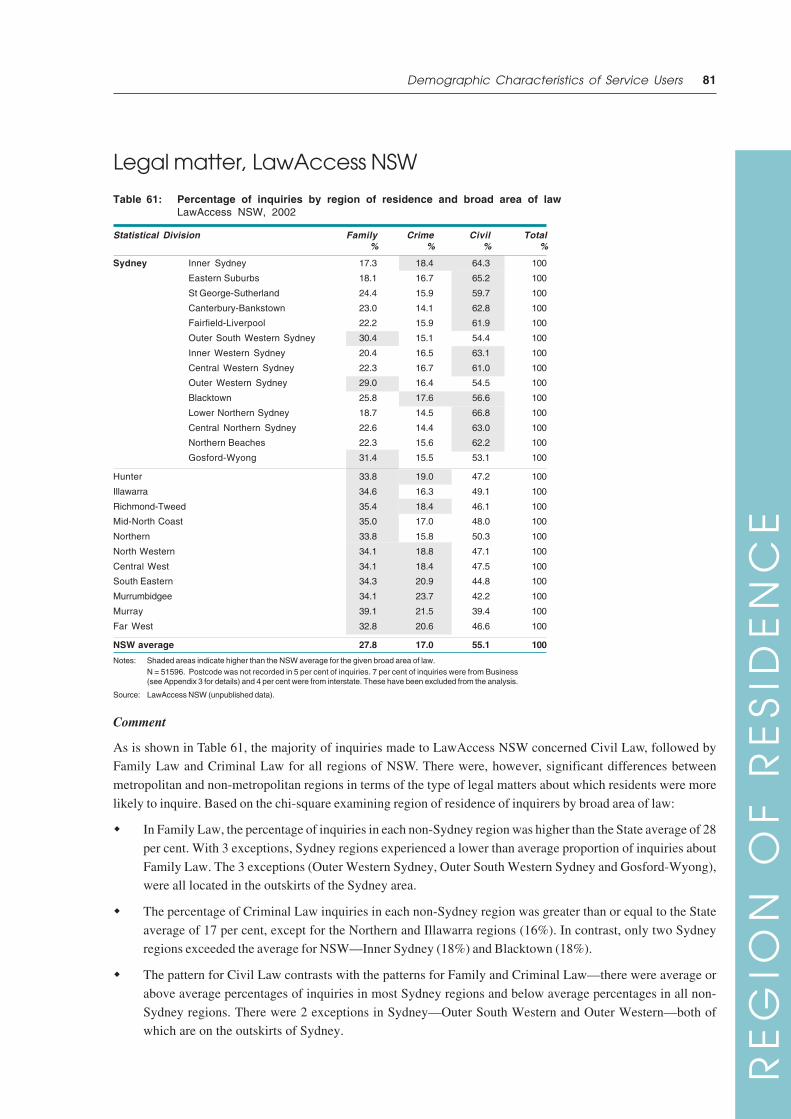
81Demographic Characteristics of Service Users
RE
GIO
N O
F R
ES
IDE
NC
E
Legal matter, LawAccess NSW
Table 61: Percentage of inquiries by region of residence and broad area of lawLawAccess NSW, 2002
Statistical Division Family Crime Civil Total% % % %
Sydney Inner Sydney 17.3 18.4 64.3 100
Eastern Suburbs 18.1 16.7 65.2 100
St George-Sutherland 24.4 15.9 59.7 100
Canterbury-Bankstown 23.0 14.1 62.8 100
Fairfield-Liverpool 22.2 15.9 61.9 100
Outer South Western Sydney 30.4 15.1 54.4 100
Inner Western Sydney 20.4 16.5 63.1 100
Central Western Sydney 22.3 16.7 61.0 100
Outer Western Sydney 29.0 16.4 54.5 100
Blacktown 25.8 17.6 56.6 100
Lower Northern Sydney 18.7 14.5 66.8 100
Central Northern Sydney 22.6 14.4 63.0 100
Northern Beaches 22.3 15.6 62.2 100
Gosford-Wyong 31.4 15.5 53.1 100
Hunter 33.8 19.0 47.2 100
Illawarra 34.6 16.3 49.1 100
Richmond-Tweed 35.4 18.4 46.1 100
Mid-North Coast 35.0 17.0 48.0 100
Northern 33.8 15.8 50.3 100
North Western 34.1 18.8 47.1 100
Central West 34.1 18.4 47.5 100
South Eastern 34.3 20.9 44.8 100
Murrumbidgee 34.1 23.7 42.2 100
Murray 39.1 21.5 39.4 100
Far West 32.8 20.6 46.6 100
NSW average 27.8 17.0 55.1 100
Notes: Shaded areas indicate higher than the NSW average for the given broad area of law.N = 51596. Postcode was not recorded in 5 per cent of inquiries. 7 per cent of inquiries were from Business(see Appendix 3 for details) and 4 per cent were from interstate. These have been excluded from the analysis.
Source: LawAccess NSW (unpublished data).
Comment
As is shown in Table 61, the majority of inquiries made to LawAccess NSW concerned Civil Law, followed byFamily Law and Criminal Law for all regions of NSW. There were, however, significant differences between
metropolitan and non-metropolitan regions in terms of the type of legal matters about which residents were more
likely to inquire. Based on the chi-square examining region of residence of inquirers by broad area of law:
In Family Law, the percentage of inquiries in each non-Sydney region was higher than the State average of 28
per cent. With 3 exceptions, Sydney regions experienced a lower than average proportion of inquiries about
Family Law. The 3 exceptions (Outer Western Sydney, Outer South Western Sydney and Gosford-Wyong),were all located in the outskirts of the Sydney area.
The percentage of Criminal Law inquiries in each non-Sydney region was greater than or equal to the State
average of 17 per cent, except for the Northern and Illawarra regions (16%). In contrast, only two Sydneyregions exceeded the average for NSW—Inner Sydney (18%) and Blacktown (18%).
The pattern for Civil Law contrasts with the patterns for Family and Criminal Law—there were average or
above average percentages of inquiries in most Sydney regions and below average percentages in all non-
Sydney regions. There were 2 exceptions in Sydney—Outer South Western and Outer Western—both ofwhich are on the outskirts of Sydney.
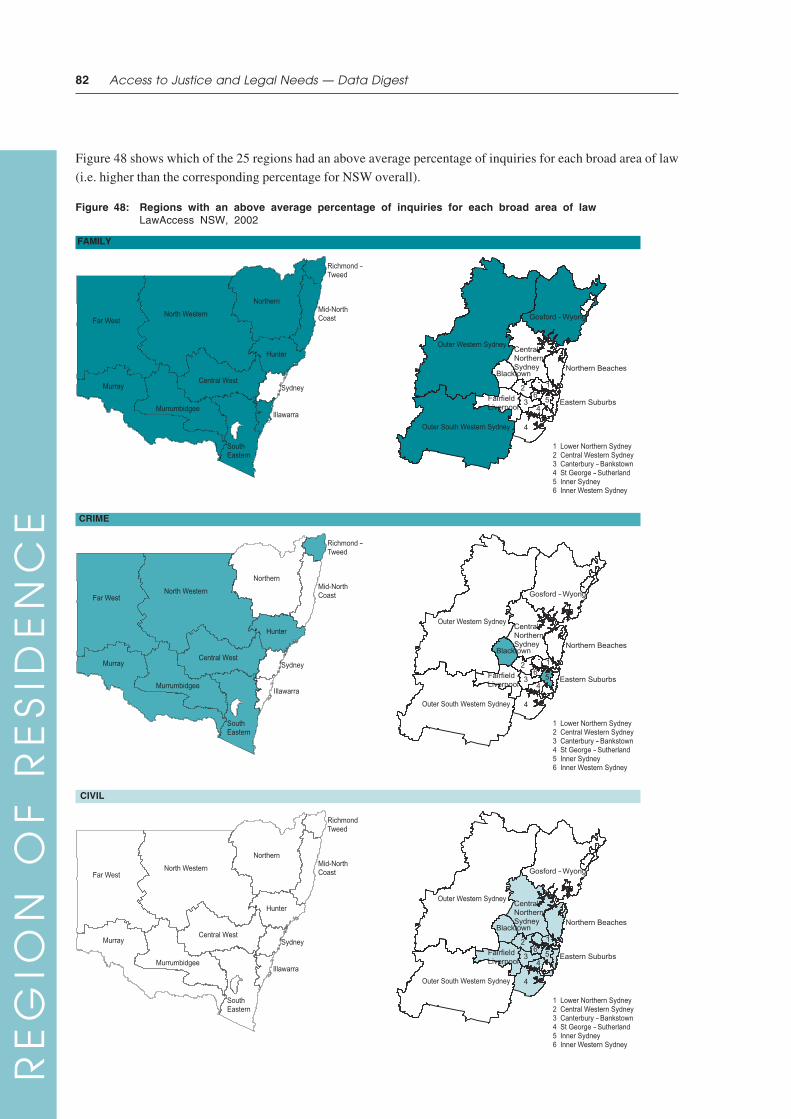
82 Access to Justice and Legal Needs — Data Digest
RE
GIO
N O
F R
ES
IDE
NC
E
Figure 48 shows which of the 25 regions had an above average percentage of inquiries for each broad area of law
(i.e. higher than the corresponding percentage for NSW overall).
Figure 48: Regions with an above average percentage of inquiries for each broad area of lawLawAccess NSW, 2002
FAMILY
CRIME
CIVIL
Far WestNorth Western
Northern
Central WestMurray
SouthEastern
Illawarra
Sydney
Mid-NorthCoast
Richmond Tweed
Murrumbidgee
Hunter

83Demographic Characteristics of Service Users
RE
GIO
N O
F R
ES
IDE
NC
E
Based on the chi-square examining specific area of law by region of residence, Table 62 shows the specific legal
matters that inquirers from each region of residence inquired about at a rate higher than the rate for the sample.
Table 62: Specific area of law about which residents of different regions were more likely to inquireLawAccess NSW, 2002
Region of residence Specific area of law
Sydney Inner Sydney General crime, Government/Legal system, Business, Employment, Housing
Eastern Suburbs Traffic offences, Employment, Housing, Business, Consumers
St George-Sutherland Wills/Estates, Housing, Consumers
Canterbury-Bankstown Wills/Estates, Employment, Government/Legal system, Business
Fairfield-Liverpool Employment, Personal injury, Motor vehicles, Consumers
Outer South Western Sydney Motor vehicles
Inner Western Sydney Housing, Consumers
Central Western Sydney Health, Personal injury, Motor vehicles
Outer Western Sydney Consumers, Credit/Debt
Blacktown General crime, Credit/Debt
Lower Northern Sydney Housing, Wills/Estates, Media, Business
Central Northern Sydney Housing, Wills/Estates, Consumers, Traffic offences
Northern Beaches Government/Legal system, Housing, Wills/Estates
Gosford-Wyong Family
Hunter Family, Domestic violence, Human rights, Traffic offences
Illawarra Family
Richmond-Tweed Family, Domestic violence
Mid-North Coast Family, Domestic violence
Northern Family, Credit/Debt, Government/Legal system, Business/Media
North Western Family, Domestic violence, Credit/Debt
Central West Family
South Eastern Family, General crime, Traffic offences
Murrumbidgee Family, General crime
Murray Family
Far West General crime
Source: LawAccess NSW (unpublished data).

84 Access to Justice and Legal Needs — Data Digest
RE
GIO
N O
F R
ES
IDE
NC
E
Legal matter, NSW Community Legal Centres
Table 63: Percentage of inquiries by broad area of law and region of residenceNSW Community Legal Centres, 1999–2002
Statistical Division Family Crime Civil Total% % % %
Sydney Inner Sydney 13.4 15.8 70.9 100
Eastern Suburbs 16.5 11.9 71.6 100
St George-Sutherland 24.1 7.7 68.2 100
Canterbury-Bankstown 24.9 9.1 66.0 100
Fairfield-Liverpool 34.5 9.4 56.1 100
Outer South Western Sydney 41.3 13.6 45.1 100
Inner Western Sydney 14.9 7.1 78.0 100
Central Western Sydney 27.0 10.8 62.2 100
Outer Western Sydney 39.9 18.8 41.3 100
Blacktown 37.2 10.9 51.9 100
Lower Northern Sydney 19.5 7.3 73.2 100
Central Northern Sydney 27.7 7.3 65.0 100
Northern Beaches 14.9 5.5 79.5 100
Gosford-Wyong 36.2 10.4 53.4 100
Hunter 30.0 22.0 48.1 100
Illawarra 39.9 11.4 48.7 100
Richmond-Tweed 24.2 9.8 66.0 100
Mid-North Coast 29.5 14.7 55.8 100
Northern 36.9 12.3 50.8 100
North Western 42.9 17.1 40.0 100
Central West 38.5 25.0 36.6 100
South Eastern 32.8 10.1 57.1 100
Murrumbidgee 47.8 11.7 40.5 100
Murraya 47.1 15.3 37.6 100
Far West 31.4 21.6 47.0 100
NSW average 29.2 12.9 57.8 100
a Murray is also covered by the Murray Mallee Community Legal Service based in Victoria.
Notes: Shaded areas indicate higher than the NSW average for the given broad area of law.N = 321362. Postcode was not recorded in 0.1 per cent of inquiries. 3 per cent of inquiries were from interstate and2 per cent were classified as Business (see Appendix 3 for further information). These have been excluded from the analysis.
Source: Commonwealth Attorney-General’s Department National Information Scheme (unpublished data).
Comment
As is shown in Table 63, the majority of inquiries made to NSW Community Legal Centres concerned Civil Law
(58%), followed by Family Law (29%) and Criminal Law (13%). There were, however, differences between regions in
the broad area of law about which inquiries were more likely to be made. Based on the chi-square examining regionof residence of inquirers by broad area of law:
In 10 of the 11 non-Sydney regions, the percentage of inquiries concerning Family Law was significantly
higher than the corresponding average percentage for NSW (29%). This compares with only 5 of the 14
Sydney regions. The Sydney areas with higher than average percentages of Family Law inquiries were alllocated in Sydney’s outer western regions—Outer South Western Sydney, Outer Western Sydney,
Blacktown, Fairfield-Liverpool and Gosford-Wyong.
For Civil Law, the opposite pattern was observed. Nine of the 14 Sydney regions had higher than average
percentages of Civil Law inquiries compared with 1 of the 11 non-Sydney regions.
More non-Sydney than Sydney regions had percentages of Criminal Law inquiries that were higher than the
NSW average. Six rural/regional areas had higher than average percentages of Criminal Law inquiries—Hunter, Mid-North Coast, North Western, Central West, Murray and Far West. In contrast, only 3 Sydney
regions—Inner Sydney, Outer South Western Sydney and Outer Western Sydney—had significantly higher
percentages of inquiries about Criminal Law than the average percentage for NSW.

85Demographic Characteristics of Service Users
RE
GIO
N O
F R
ES
IDE
NC
E
Figure 49 shows, for each broad area of law, which of the 25 regions had an above average percentage of inquiries
(i.e. higher than the corresponding percentage for NSW overall).
Figure 49: Regions with an above average percentage of inquiries for each broad area of lawNSW Community Legal Centres, 1999–2002
FAMILY
CRIME
CIVIL

86 Access to Justice and Legal Needs — Data Digest
RE
GIO
N O
F R
ES
IDE
NC
E
Based on the chi-square, Table 64 shows the specific legal matters that inquirers from each region of residence
inquired about at a rate higher than the rate for the sample.
Table 64: Specific area of law about which residents of different regions were more likely to inquireNSW Community Legal Centres, 2000–2002
Statistical Division Specific area of law
Sydney Inner Sydney General crime, Domestic violence, Traffic offences, Business/Media, Consumers,Government/Legal system, Health/Human rights, Motor vehicles, Wills/Estates
Eastern Suburbs General crime, Traffic offences, Business/Media, Consumers, Employment,Government/Legal system, Health/Human rights, Motor vehicles, Personal injury,Wills/Estates
St George-Sutherland Consumers, Employment, Government/Legal system
Canterbury-Bankstown Employment, Government/Legal system, Motor vehicles
Fairfield-Liverpool Family, Traffic offences, Employment, Government/Legal system, Motor vehicles
Outer South Western Sydney Family, Domestic violence, Traffic offences, Credit/Debt, Employment
Inner Western Sydney Government/Legal system
Central Western Sydney Employment, Government/Legal system, Motor vehicles
Outer Western Sydney Family, General crime, Domestic violence, Traffic offences, Credit/Debt
Blacktown Family, Consumers, Employment, Motor vehicles, Wills/Estates
Lower Northern Sydney Employment, Government/Legal system, Health/Human rights
Central Northern Sydney Employment
Northern Beaches Employment, Government/Legal system, Health/Human rights
Gosford-Wyong Family, Consumers, Health/Human rights, Personal injury
Hunter General crime, Domestic violence, Business/Media, Consumers, Health/Human rights,Wills/Estates
Illawarra Family, Traffic offences, Consumers, Credit/Debt, Health/Human rights, Wills/Estates
Richmond-Tweed Government/Legal system
Mid-North Coast Domestic violence, Business/Media, Government/Legal system, Health/Human rights
Northern Family, General crime, Business/Media, Consumers, Credit/Debt, Health/Human rights,Personal injury, Wills/Estates
North Western Family, General crime, Domestic violence, Credit/Debt, Employment, Wills/Estates
Central West Family, Domestic violence
South Eastern Family, Consumers, Government/Legal system
Murrumbidgee Family, Health/Human rights
Murray Family, General crime, Traffic offences, Business/Media, Credit/Debt
Far West Family, General crime, Traffic offences, Business/Media, Consumers, Credit/Debt,Health/Human rights, Wills/Estates
Source: Commonwealth Attorney-General’s Department National Information Scheme (unpublished data).

Chapter 3: Pathways of Service Users
This section includes analyses of the source of inquiry
and referral destination.
Services with relevant data are the Legal Aid NSW
Information/Advice Service, Law Access NSW andNSW Community Legal Centres.
For both source of inquiry and referral destination,service categories were mapped to Law and Justice
Foundation categories, as described in Table 65.
Table 65: Law and Justice Foundationcategories for source of inquiryand referral destination
Level 1 Level 2
Self help Already knew aboutFriend/Family
Published MediaTelephone bookPublicationInternet
Government MP/Local counsellorGovernment-localGovernment
Other non-legal Health professionalCommunity organisationLibraryUnion / AssociationEmployerSchoolPrivate organisation
Complaint handling/ Dispute resolution serviceLaw enforcement Complaint handling body
Police
Legal LawAccess NSWLegal Aid NSW HelplineCommunity Legal CentreLegal Aid NSWSolicitor/BarristerCourt
Other Not referred
FOR MORE INFORMATION
Australian Bureau of Statistics, 2001 Census
Basic Community Profile and Snapshot: New
South Wales, B16 Internet Use by Sex, 2001,
<http://www.abs.gov.au>.
Law and Justice Foundation of NSW,Immigration Advice and Rights Centre
Website Evaluation and Needs Analysis, 2002,
<http://www.lawfoundation.net.au/resources/iarc/report_final.html>.
Marzio, W. D. and Cultural Partners Australia,Access To Information About Government
Services Among Culturally And Linguistically
Diverse Audiences, Study No. 00/10/2817,Victorian Department of Premier and Cabinet,
Melbourne, 2001, <http://www.voma.vic.gov.
au/domino/web_notes/voma/vomasite.nsf/Frameset/VOMA?OpenDocument>.
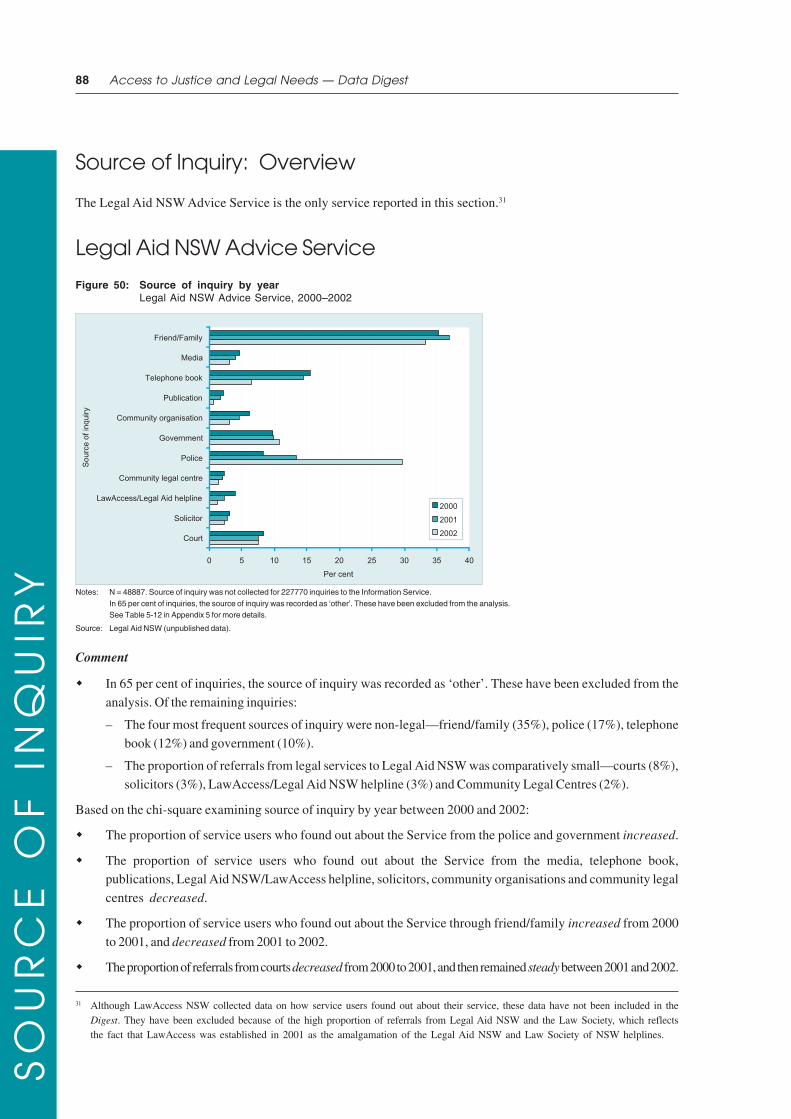
88 Access to Justice and Legal Needs — Data Digest
SO
UR
CE
OF
IN
QU
IRY
Source of Inquiry: Overview
The Legal Aid NSW Advice Service is the only service reported in this section.31
Legal Aid NSW Advice Service
Figure 50: Source of inquiry by yearLegal Aid NSW Advice Service, 2000–2002
Notes: N = 48887. Source of inquiry was not collected for 227770 inquiries to the Information Service.In 65 per cent of inquiries, the source of inquiry was recorded as ‘other’. These have been excluded from the analysis.See Table 5-12 in Appendix 5 for more details.
Source: Legal Aid NSW (unpublished data).
Comment
In 65 per cent of inquiries, the source of inquiry was recorded as ‘other’. These have been excluded from the
analysis. Of the remaining inquiries:
– The four most frequent sources of inquiry were non-legal—friend/family (35%), police (17%), telephone
book (12%) and government (10%).
– The proportion of referrals from legal services to Legal Aid NSW was comparatively small—courts (8%),
solicitors (3%), LawAccess/Legal Aid NSW helpline (3%) and Community Legal Centres (2%).
Based on the chi-square examining source of inquiry by year between 2000 and 2002:
The proportion of service users who found out about the Service from the police and government increased.
The proportion of service users who found out about the Service from the media, telephone book,publications, Legal Aid NSW/LawAccess helpline, solicitors, community organisations and community legal
centres decreased.
The proportion of service users who found out about the Service through friend/family increased from 2000
to 2001, and decreased from 2001 to 2002.
The proportion of referrals from courts decreased from 2000 to 2001, and then remained steady between 2001 and 2002.
31 Although LawAccess NSW collected data on how service users found out about their service, these data have not been included in theDigest. They have been excluded because of the high proportion of referrals from Legal Aid NSW and the Law Society, which reflectsthe fact that LawAccess was established in 2001 as the amalgamation of the Legal Aid NSW and Law Society of NSW helplines.

89Pathways of Service Users
SO
UR
CE
OF
IN
QU
IRY
Legal matter, Legal Aid NSW Advice Service
Figure 51: Source of inquiry by broad area of lawLegal Aid NSW Advice Service, 2000–2002
Notes: N = 48886. Source of inquiry was not collected for 227770 inquiries to the Information Service.In 65% of inquiries, the source of inquiry was recorded as ‘other’. These have been excluded from the analysis.See Table 5-13 in Appendix 5 for more details.
Source: Legal Aid NSW (unpublished data).
Comment
In 65 per cent of inquiries, the source of inquiry was recorded as ‘other’. These have been excluded from the
analysis.
How service users found out about the Legal Aid NSW Advice Service depended on the type of legal matter. Based
on the chi-square examining broad area of law by source of inquiry, when compared with service users overall:
Service users inquiring about Family Law were more likely to find out about the Service through governmentdepartments, courts, solicitors, media and friend/family.
Service users inquiring about Criminal Law were more likely to find out about the Service from police.
Service users inquiring about Civil Law were more likely to find out about the Service through the telephonebook, media, community legal centres, friend/family and the LawAccess/Legal Aid helpline.

90 Access to Justice and Legal Needs — Data Digest
RE
FE
RR
AL
DE
ST
INA
TIO
N
Referral Destination: Overview
Data on referral destination were available for the Legal Aid NSW Information Service, LawAccess NSW and NSW
Community Legal Centres.
Referral destination
A high proportion of inquiries was not referred in all three services—70% for the Legal Aid NSW Information
Service; 40% for LawAccess NSW and 65% for NSW Community Legal Centres. These percentages include
referrals to other sections of the same agency, for example to other sections of Legal Aid.
Of those inquiries that were referred, there was a high proportion of referrals to legal organisations
(community legal centres, courts, Legal Aid NSW and private solicitors) across the three services, although
the comparative ranking varied, as demonstrated by Table 66.
Table 66: Top four referral destinations by service
Legal Aid NSW Information % LawAccess NSW % NSW Community Legal Centres %
Community legal centre 25.7 Legal Aid NSW 26.5 Private solicitor 23.4
Private solicitor 19.5 Court 16.2 Court 15.9
Court 18.4 Private solicitor 15.6 Community organisation 14.6
Government 11.7 Dispute resolution 12.5 Community legal centre 13.8
Legal matter
Referral destination varied according to the type of legal matter, with some patterns emerging across services.
Family Law inquiries were least likely to be referred for all three services. Based on the chi-square examiningbroad area of law by referral destination, Table 67 shows the referral destinations that were more likely for
each broad area of law. Although there were differences between services, the following patterns did
emerge—Family Law inquiries were more likely to be referred to private solicitors; Criminal Law inquiries weremore likely to be referred to courts, and Civil Law inquiries were more likely to be referred to government and
dispute resolution services.
Table 67: Referral destination to which service users were more likely to be referred,by broad area of law and service
Service Family Crime Civil
Legal Aid NSW Private solicitors Courts, Police Government, CommunityInformation legal centres, Dispute
resolution
LawAccess NSW Legal Aid NSW, Private Courts, Police, Legal Aid Private solicitors, Disputesolicitors, Courts, NSW, Private solicitors resolution, Government,Government Legal Aid NSW, Courts
NSW Community Legal Aid NSW, Private Courts, Legal Aid NSW, Community Legal CentresLegal Centres solicitors, Courts, Dispute Private solicitors, Government, Dispute
resolution Community legal centres resolution, Communityorganisations
Note: Referral destinations in common for all three services are shaded.

91Pathways of Service Users
RE
FE
RR
AL
DE
ST
INA
TIO
N
Legal Aid NSW Information Service
Figure 52: Referral destination by yearLegal Aid NSW Information Service, 2000–2002
Notes: N = 65667. Information about referral destination was missing for an additional 2382 (4%)inquiries.This figure ONLY shows those inquiries that were referred. For all inquiries, see Table 5-14in Appendix 5.
Source: Legal Aid NSW (unpublished data).
Comment
The majority of inquiries were not referred (70%). This percentage includes the 58 per cent of inquiries which
were referred to other sections of Legal Aid NSW.
Figure 52 shows referral destinations for inquiries that were referred. The most common referral destinations
were to other legal services—community legal centres (26%), private solicitors (20%) and courts (18%)—
followed by referrals to government services (12%).
Based on the chi-square examining referral destination by year (see Table 5-14 in Appendix 5 for more details):
There was an increase in the proportion of inquiries that were not referred or were referred to other sectionsof Legal Aid NSW from 2000 to 2002. We note that LawAccess NSW replaced the Legal Aid NSW Helpline in
October 2001.
There was a decrease in the proportion of referrals to community legal centres, courts, and solicitors, from
2000 to 2002.
The proportion of referrals to government decreased from 2000 to 2001, and increased from 2001 to 2002,
while the opposite occurred to the proportion of referrals to police.
The proportion of referrals to dispute resolution services remained relatively steady.

92 Access to Justice and Legal Needs — Data Digest
RE
FE
RR
AL
DE
ST
INA
TIO
N
LawAccess NSW
Figure 53: Referral destinationLawAccess NSW, 2002
Notes: N = 36371. Information about referral destination was missing for an additional 73 (0.2%) inquiries.This figure ONLY shows those inquiries that were referred. For all inquiries, see Table 5-15 inAppendix 5.
Source: LawAccess NSW (unpublished data).
Comment
Forty per cent of inquiries were not referred or were referred ‘in-house’ to a LawAccess NSW legal officer.
Figure 53 shows that, of those inquiries that were referred, the most frequent referral destinations were: Legal
Aid NSW (27%), courts (16%), solicitors (16%), dispute resolution services (13%), and governmentorganisations (12%). Sixty per cent of referrals to dispute resolution services were to the Office of the Legal
Services Commissioner.

93Pathways of Service Users
RE
FE
RR
AL
DE
ST
INA
TIO
N
NSW Community Legal Centres
Figure 54: Referral destination by yearNSW Community Legal Centres, 1999–2001
Notes: N = 114046. This figure ONLY shows those inquiries that were referred. For all inquiries, seeTable 5-16 in Appendix 5.
Source: Commonwealth Attorney-General’s Department National Information Scheme (unpublished data).
Comment
The majority of inquiries were not referred (65%).
Figure 54 shows that, of the inquiries that were referred, the most common referral destinations were a mixtureof legal and non-legal organisations: private solicitors (23%), courts (16%), community organisations (15%),
other community legal centres (14%), Legal Aid NSW (13%) and government departments (7%).
Based on the chi-square examining referral destination by year (see Table 5-16 in Appendix 5 for more details):
The proportion of inquiries that were referred increased from 1999 to 2001.
The proportion of referrals to government, solicitors and courts increased from 1999 to 2001.
The proportion of referrals to dispute resolution services, Legal Aid NSW and Community Legal Centres
decreased in 2000 and increased in 2001.
The proportion of referrals to community organisations increased in 2000 and decreased in 2001.
The proportion of referrals to police increased in 2000 and remained steady in 2001.
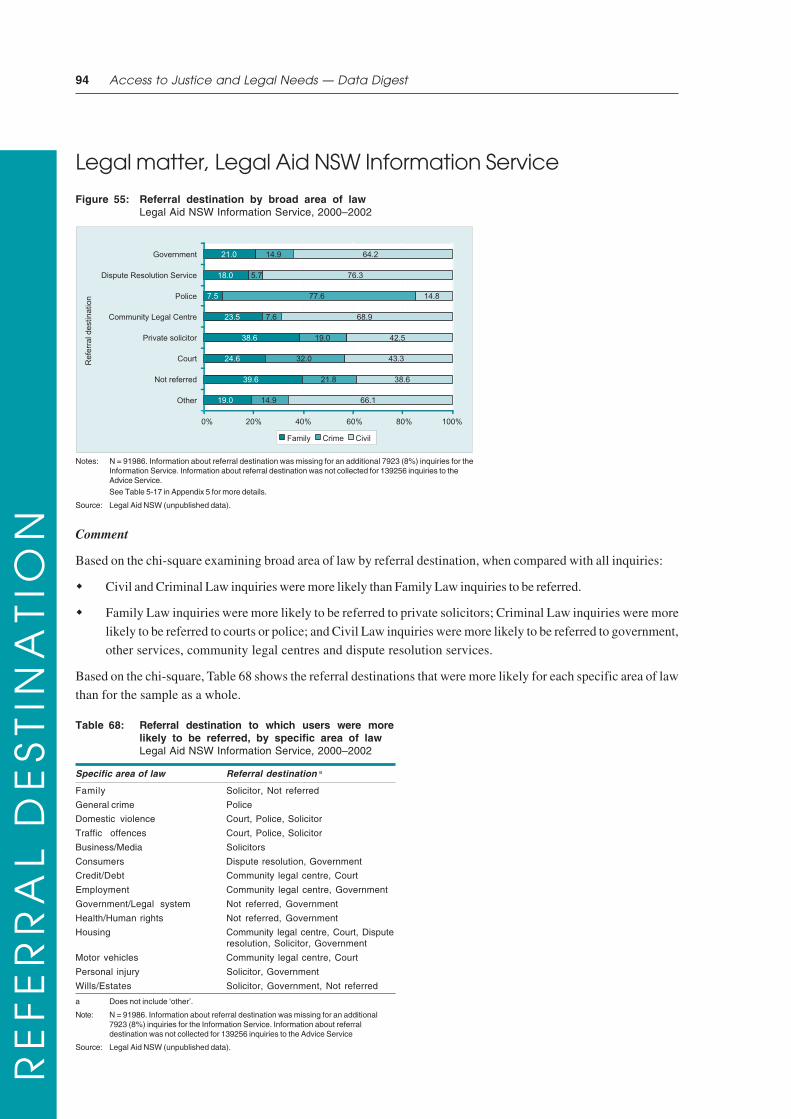
94 Access to Justice and Legal Needs — Data Digest
RE
FE
RR
AL
DE
ST
INA
TIO
N
Legal matter, Legal Aid NSW Information Service
Figure 55: Referral destination by broad area of lawLegal Aid NSW Information Service, 2000–2002
Notes: N = 91986. Information about referral destination was missing for an additional 7923 (8%) inquiries for theInformation Service. Information about referral destination was not collected for 139256 inquiries to theAdvice Service.See Table 5-17 in Appendix 5 for more details.
Source: Legal Aid NSW (unpublished data).
Comment
Based on the chi-square examining broad area of law by referral destination, when compared with all inquiries:
Civil and Criminal Law inquiries were more likely than Family Law inquiries to be referred.
Family Law inquiries were more likely to be referred to private solicitors; Criminal Law inquiries were more
likely to be referred to courts or police; and Civil Law inquiries were more likely to be referred to government,
other services, community legal centres and dispute resolution services.
Based on the chi-square, Table 68 shows the referral destinations that were more likely for each specific area of lawthan for the sample as a whole.
Table 68: Referral destination to which users were morelikely to be referred, by specific area of lawLegal Aid NSW Information Service, 2000–2002
Specific area of law Referral destination a
Family Solicitor, Not referred
General crime Police
Domestic violence Court, Police, Solicitor
Traffic offences Court, Police, Solicitor
Business/Media Solicitors
Consumers Dispute resolution, Government
Credit/Debt Community legal centre, Court
Employment Community legal centre, Government
Government/Legal system Not referred, Government
Health/Human rights Not referred, Government
Housing Community legal centre, Court, Disputeresolution, Solicitor, Government
Motor vehicles Community legal centre, Court
Personal injury Solicitor, Government
Wills/Estates Solicitor, Government, Not referred
a Does not include ‘other’.
Note: N = 91986. Information about referral destination was missing for an additional7923 (8%) inquiries for the Information Service. Information about referraldestination was not collected for 139256 inquiries to the Advice Service
Source: Legal Aid NSW (unpublished data).

95Pathways of Service Users
RE
FE
RR
AL
DE
ST
INA
TIO
N
Legal matter, LawAccess NSW
Figure 56: Referral destination by broad area of lawLawAccess NSW, 2002
Notes: N = 60894. Information about referral destination was missing for an additional 183 (0.3%) inquiries.See Table 5-18 in Appendix 5 for more detail.
Source: LawAccess NSW (unpublished data).
Comment
Based on the chi-square examining broad area of law by referral destination, when compared with all inquiries:
Civil and Criminal Law inquiries were more likely than Family Law inquiries to be referred.
Family Law matters were more likely to be referred to Legal Aid NSW and courts, and Criminal Law inquiries
were more likely to be referred to police, Legal Aid NSW and courts. Referrals about Civil Law matters were
more widely dispersed—with a higher than expected proportion of referrals to community organisations,libraries, government, unions, dispute resolution services, community legal centres and private solicitors.
Based on the chi-square, Table 69 shows the referral destinations that were more likely for each specific area of law
than for the sample as a whole.
Table 69: Referral destination to which users were more likely to bereferred by specific area of lawLawAccess NSW, 2002
Specific area of law Referral destination
Family Legal Aid, Court, Not referred
General crime Police, Legal Aid
Domestic violence Police, Community legal centre, Court
Traffic offences Library, Police, Legal Aid, Court
Business/Media Government, Solicitor, Not referred, Community legal centre
Consumers Government, Complaint handling bodies,
Credit/Debt Community organisation, Community legal centre
Employment Community organisation, Union/Association, Government,Complaint handling, Community legal centre, Solicitor
Government/Legal system Government, NSW Community Legal Centre, Not referred
Health/Human rights Legal Aid NSW, Court, Government, Community legal centre
Housing Community organisation, Union/Association, Disputeresolution, Government
Motor vehicles Union/Association, Court, Not referred
Personal injury Solicitor, Complaint handling
Wills/Estates Library, Union/Association, Solicitor, Court, Not referred
Source: LawAccess NSW (unpublished data).

96 Access to Justice and Legal Needs — Data Digest
RE
FE
RR
AL
DE
ST
INA
TIO
N
Legal matter, NSW Community Legal Centres
Figure 57: Referral destination by broad area of lawNSW Community Legal Centres, 1999–2001
Notes: N = 325526. Information about referral destination was missing for an additional 980 (0.3%) inquiries.See Table 5-19 in Appendix 5 for more detail.
Source: Commonwealth Attorney-General’s Department National Information Scheme (unpublished data).
Comment
Referral destination differed according to the legal matter. Based on the chi-square examining broad area of law by
referral destination, when compared with all inquiries:
Civil and Criminal Law inquiries were more likely than Family Law inquiries to be referred.
Family Law inquiries were more likely to be referred to solicitors, Legal Aid NSW, courts and disputeresolution services; Criminal Law inquiries were more likely to be referred to the police and Legal Aid NSW;
and Civil Law inquiries were more likely to be referred to community legal centres and non-legal
organisations, for example government and community organisations. Legal Aid NSW received acomparatively low proportion of referrals for Civil Law inquiries.

97Pathways of Service Users
RE
FE
RR
AL
DE
ST
INA
TIO
N
Based on the chi-square, Table 70 shows the referral destinations that were more likely for each specific area of law
than for the sample as a whole.
Table 70: Referral destination to which users were more likely to bereferred, by specific area of lawNSW Community Legal Centres, 1999–2001
Specific area of law Referral destination
Family Dispute resolution, Legal Aid, Solicitor, Court
General crime Police, Community legal centre, Legal Aid
Domestic violence Dispute resolution, Police, Court
Traffic offences Community legal centre, Legal Aid
Business/Media Government, Solicitor, Community legal centre
Consumers Government, Dispute resolution, Non-legal (other)a,Community legal centre
Credit/Debt Community organisation, Community legal centre, Notreferred
Employment Government, Non-legal (other), Community legal centre,Not referred
Government/Legal system Government, Not referred
Health/Human rights Government, Dispute resolution, Non-legal (other),Community legal centre, Not referred
Housing Community organisation, Government, Dispute resolution
Legal system Police, Community legal centre, Legal Aid NSW, Courts
Motor vehicles Non-legal (other), Community legal centre, Not referred
Personal injury Solicitor
Wills/Estates Solicitor
a Includes private organisations such as insurance companies.
Source: Commonwealth Attorney-General’s Department National Information Scheme (unpublished data).

SECTION 2
DisputeResolutionAgencies

101Dispute Resolution Agencies
Introduction
This section provides an overview of the role of dispute resolution agencies within the legal system. It describes
24 of these agencies operating in New South Wales and reports on their published collection of demographic andusage data, as well as the purpose, scope, methodology and limitations of the statistical analysis undertaken in this
study. More detail on usage statistics of agencies is available in Appendix 6.
Role of dispute resolution agencies
A diverse range of organisations can be described under the broad heading dispute resolution agencies. They can
include public and private organisations, and organisations which cover either State or Commonwealth jurisdictions.
They include government departments, industry bodies, Ombudsman’s organisations, Commissions and Tribunals.
The diversity in the structures, jurisdictions, and processes of these agencies, together with the various areas of
law over which they have coverage, is significant, and indicates their potential use in a wide variety of legaldisputes. For instance, government departments can receive complaints in relation to alleged breaches of legislation
under their jurisdiction; for example, under the Industrial Relations Act 1996, the NSW Office of Industrial Relations
can take action for a breach of an award or enterprise agreement and recover unpaid entitlements. CommunityJustice Centres have a different role in that they provide mediation and conflict resolution services. Ombudsman’s
bodies deal with complaints concerning government services or authorities. The powers of Tribunals are set out intheir defining legislation and may include the power to make decisions and review decisions made by others, as well
as having a role in education and policy or legal reform. Industry bodies deal with complaints regarding the
provision of services within a particular industry, for example, the Telecommunications Industry Ombudsman is afree and independent alternative dispute resolution scheme for small business and residential consumers who have
a complaint about their telephone or Internet service.
Despite the differences in their relevant jurisdictions, and the diversity of their structures, these agencies have
many similar functions and features, including the capacity to answer inquiries and to receive, investigate and
resolve complaints. They usually have distinct procedures for resolving disputes and complaints. In most cases,their processes are accessible by telephone (at least in the first phase).
One of the key roles of these bodies is to provide an alternative to the dispute resolution process provided by thecourt system. They provide a way for people to take their dispute or complaint forward without the substantial
costs associated with going to court. In addition, they provide a relatively streamlined and straightforward process
for the resolution of disputes, which often allows for negotiation between the parties, within an agreed frameworkand usually mediated by a third party. The importance of these organisations is therefore not only in the accessible
low cost framework they provide for conflict resolution, but also in the support they provide to individuals against
larger, more powerful disputants.
Because these processes for complaint handling and dispute resolution are generally more accessible than court-
based procedures, and cover a wide variety of legal issues, dispute resolution agencies are an important mechanismfor improving access to justice for socially and economically disadvantaged people. Indeed, some of these agencies
have established specific programs to address the needs of particular groups to further enhance their accessibility.

102 Access to Justice and Legal Needs — Data Digest
In his address to the Law and Justice Foundation of NSW Access to Justice and Legal Needs Workshop in July
2002, Justice Ronald Sackville stated:
Since 1990, a number of important industry-based consumer dispute resolution schemes have been established.These deal each year with many thousands of consumer complaints, for the most part expeditiously, withoutcomplainants being at risk of adverse costs orders……These schemes help bridge the divide between the publicand private spheres and, if properly monitored and administered, offer the prospect of genuinely effective meansof resolving disputes outside the court system.32
One way of determining the extent to which dispute resolution agencies provide an accessible and effective
alternative to court-based dispute resolution for disadvantaged groups is by examining the profile of personsaccessing these services. Currently there is little research in NSW on the profile of users of dispute resolution
agencies. The National Alternative Dispute Resolution Service has carried out research into the collection of data
by alternative dispute resolution agencies. However, this research does not appear to cover data on the demographicsof service users.33
The purpose of the present study, therefore, is to assess the availability of demographic data on the users ofdispute resolution agencies, as a first step in understanding how accessible these bodies are to disadvantaged
groups. More specifically, the aim of this study is to examine the demographic data published by these agencies in
annual reports and reviews, and if possible, to use these data to begin to build a demographic profile of the serviceusers of these agencies.
32 Sackville, R, ‘Access to Justice: Assumptions and Reality Checks’, in Access to Justice Roundtable - Proceedings of a Workshop
July 2002, Law and Justice Foundation of NSW, Sydney, 2003, p. 30.33 National Alternative Dispute Resolution Advisory Council, ADR Statistics: Published Statistics on Alternative Dispute Resolution
in Australia, 2002, <http://www.nadrac.gov.au/www/disputeresolutionHome.nsf/>.

103Dispute Resolution Agencies
Description of agencies
The agencies are organised into three categories—government, tribunals and self-regulated industry. Within these
categories they are divided into State and Commonwealth agencies. While it is possible to classify dispute resolutionagencies in a number of different ways, we divided them according to the way in which they were established, and
by their processes for dispute resolution.
Organisations listed under government were established by the government through legislation and, in most cases,
adopt processes which are essentially inquisitorial, or have a strong emphasis on mediation and conciliation. Those
classified as tribunals were established by the government and adopt a primarily quasi-judicial process in resolvingcomplaints and disputes. Those listed under self-regulated industry were established by organisations within that
particular industry and are not generally governed by legislation.
Government — Commonwealth
Australian Consumer and Competition Commission
http://www.accc.gov.au/
Established: 1995 (merger of the Trade Practices
Commission and the Prices Surveillance Authority)
Legislation: Trade Practices Act 1974, Prices
Surveillance Act 1983 (plus additional responsibilities
under other legislation)
Jurisdiction: National. Covers anti-competitive and
unfair market practices, mergers or acquisitions ofcompanies, product safety/liability, and third party
access to facilities of national significance.
Commonwealth Ombudsman
http://www.comb.gov.au/
Established: 1977
Legislation: Ombudsman Act 1976, Freedom of
Information Act 1982, Complaints (Australian
Federal Police) Act 1981, the Telecommunications
(Interception) Act 1979, Ombudsman Act 1989 (ACT)
and Freedom of Information Act 1989 (ACT)
Jurisdiction: Commonwealth and ACT. Considers andinvestigates complaints from people who believe they
have been treated unfairly or unreasonably by a
Commonwealth Government department or agency,including the Australian Taxation Office, the Australian
Federal Police and the Australian Defence Force. The
Commonwealth Ombudsman is also the ACTOmbudsman.
Human Rights and Equal Opportunity Commission
http://www.hreoc.gov.au/
Established: 1986
Legislation: Human Rights and Equal Opportunity
Commission Act 1986, Race Discrimination Act 1975,
Sex Discrimination Act 1984, Disability
Discrimination Act 1992
Jurisdiction: National. Matters which can be
investigated by the Commission include discriminationon the grounds of race, colour or ethnic origin, racial
vilification, sex, sexual harassment, marital status,
pregnancy, or disability.
Private Health Insurance Ombudsman
http://www.phio.org.au/home.php
Established: 1995
Legislation: National Health Act 1953
Jurisdiction: National. Resolves problems about
private health insurance and acts as the umpire in
dispute resolution at all levels within the private healthindustry. Complaints can be made by fund members,
doctors, some dentists, hospitals, day hospital
facilities, and health funds.

104 Access to Justice and Legal Needs — Data Digest
Telecommunications Industry Ombudsman
http://www.tio.com.au/
Established: 1993
Legislation: Telecommunications (Consumer
Protection and Service Standards) Act 1999
Jurisdiction: National. Provides a dispute resolution
service for residential and small business consumers
who have been unable to resolve a complaint withtheir telephone or Internet service provider.
Government — State
Anti-Discrimination Board
http://www.lawlink.nsw.gov.au/adb.nsf/pages/index
Established: 1977
Legislation: Anti-Discrimination Act 1977
Jurisdiction: NSW. Promotes anti-discrimination and
equal opportunity principles in NSW, handlescomplaints about discrimination, conducts education
regarding rights and responsibilities and puts forward
recommendations for changes to policies and the law.
Community Justice Centres
http://www.lawlink.nsw.gov.au/cjc.nsf/pages/index
Established: 1980
Legislation: Community Justice Centres Act 1983
Jurisdiction: NSW. Provide mediation and conflict
management services to help people resolve their own
disputes.
Health Care Complaints Commission
http://www.hccc.nsw.gov.au
Established: 1994
Legislation: Health Care Complaints Act 1993
Jurisdiction: NSW. Resolves, reviews and investigatescomplaints about health care.
NSW Ombudsman
http://www.nswombudsman.nsw.gov.au/
Established: 1975
Legislation: Ombudsman Act 1974
Jurisdiction: NSW. Investigates and reports oncomplaints about the conduct of a NSW agency or
their employee. NSW agencies include government
departments and statutory authorities, for example,police, local councils, schools and universities and
some non-government agencies, for example, area
health services, non-government schools, child carecentres and agencies providing community services.
Office of Industrial Relations
http://www.dir.nsw.gov.au/
Established: 2003 (formerly Department of Industrial
Relations)
Legislation: Industrial Relations Act 1996
Jurisdiction: NSW. The Act enables awards andenterprise agreements to be made and sets out the
obligations of employers including the requirements
to keep time and wage records, issue pay slips anddisplay awards and enterprise agreements. The Act
also allows the Office to take action for a breach of an
award or enterprise agreement and recover unpaidentitlements.
Office of the Legal Services Commissioner
http://www.lawlink.nsw.gov.au/olsc1.nsf/pages/index
Established: 1994
Legislation: Legal Profession Act 1987
Jurisdiction: NSW. The Office oversees the
investigation of complaints and resolves disputes in
relation to the conduct of solicitors, barristers andlicensed conveyancers.

105Dispute Resolution Agencies
Tribunals — Commonwealth
Administrative Appeals Tribunal
http://www.aat.gov.au/
Established: 1976
Legislation: Administrative Appeals Tribunal Act
1975
Jurisdiction: National. Provides independent reviewof a wide range of administrative decisions made by
the Commonwealth Government and some non-
government bodies. It covers areas such as taxation,customs, freedom of information, social security,
veteran’s entitlements and Commonwealth employees’
compensation and superannuation.
Migration Review Tribunal
http://www.mrt.gov.au/
Established: 1999 (formerly the Immigration ReviewTribunal est. 1989)
Legislation: Migration Act 1958
Jurisdiction: National. Reviews visa criteria, sponsor
arrangements, the points system and decisions madeby the Minister for Immigration regarding the refusal
of visas and business nomination decisions.
Refugee Review Tribunal
http://www.rrt.gov.au
Established: 1993
Legislation: Migration Act 1958
Jurisdiction: National. Reviews decisions made bythe Department of Immigration and Multicultural and
Indigenous Affairs (DIMIA) to refuse or cancel
protection visas to non-citizens in Australia.
Social Security Appeals Tribunal
http://www.ssat.gov.au/
Established: 1975
Legislation: Social Security (Administration) Act
1999
Jurisdiction: National. Hears appeals against
decisions made by the Department of Family and
Community Services, Centrelink, Department ofVeterans Affairs and the Department of Education,
Training and Youth Affairs.
Superannuation Complaints Tribunal
http://203.147.241.209/main.htm
Established: 1994
Legislation: Superannuation Act 1993
Jurisdiction: National. Deals with superannuationrelated complaints.
Tribunals — State
Administrative Decisions Tribunal
http://www.lawlink.nsw.gov.au/adt.nsf/pages/index
Established: 1998
Legislation: Administrative Decisions Tribunal Act
1997
Jurisdiction: NSW. Makes original decisions andreviews decisions made by other bodies. It is made up
of five divisions: General, Community Services, Retail
Leases, Legal Services and the Revenue.
Consumer Trader and Tenancy Tribunal
http://www.fairtrading.nsw.gov.au/secondarymenus/
cttt.html
Established: 2002 (formerly the Residential Tribunal
and the Fair Trading Tribunal)
Legislation: Consumer, Trader and Tenancy Tribunal
Act 2001
Jurisdiction: NSW. Specialist dispute resolution forum
for consumer trader and tenancy matters. The Tribunal
consists of nine divisions: Tenancy, General, HomeBuilding, Building Conciliation Service, Motor
Vehicles, Residential Parks, Strata and Community
Schemes, Commercial and Retirement Villages.
Self-regulated industry —Commonwealth
Banking and Financial Services Ombudsman
http://www.abio.org.au/ABIOWeb/abiowebsite.nsf
Established: 2003 (formerly Australian Banking
Industry Ombudsman, est. 1989)
Jurisdiction: National. An independent dispute
resolution service which considers disputes between
individuals or small businesses and financial servicesproviders.

106 Access to Justice and Legal Needs — Data Digest
Credit Union Dispute Resolution Centre
http://www.cudrc.com.au
Established: 1996
Jurisdiction: National. Assists participating credit
unions and their members resolve complaints in a fair,
timely and cost-effective manner.
Financial Industry Complaints Service Ltd
http://www.fics.asn.au/
Established: 1999 (formerly the Life InsuranceComplaints Service est. 1991)
Jurisdiction: National inquiry and complaint resolutionservice in relation to life insurance, financial planning,
stockbroking and managed investment issues.
Insurance Brokers Disputes Ltd
http://www.ibdltd.com.au/
Established: 2002 (formerly the Insurance Brokers
Dispute Facility est. 1996)
Jurisdiction: National. Handles complaints and helps
resolve problems between insurance brokers andfinancial services providers (other than insurance
companies) and their clients.
Insurance Enquiries and Complaints Ltd
http://www.iecltd.com.au
Established: 1993
Jurisdiction: National. Resolves disputes between
insurers and their insurance companies or claimants
who have a dispute with another person’s insurancecompany in relation to motor vehicle property damage
(i.e. third party claim).
Self-regulated industry — State
Energy & Water Ombudsman NSW
http://www.ewon.com.au
Established: 1998
Jurisdiction: NSW. Provides an independent way of
resolving complaints for customers of electricity and
gas providers, and member water providers.

107Dispute Resolution Agencies
Methodology
The study reviewed publicly available statistical information presented in the annual reports and reviews of the 24
dispute resolution agencies examined.34 These particular agencies were chosen for three reasons: they cover NSWresidents, they are listed in the National Alternative Dispute Resolution Advisory Council paper on alternative
dispute resolution statistics,35 and they collect some form of usage or demographic data.
Agencies with State and/or Commonwealth jurisdictions were included and have been categorised into three
types: government, tribunals and self-regulated industry.
Published data on all complaints and inquiries were collected over a three-year period. Some agencies report on
calendar years and others on financial years. The three calendar years of interest were 2000, 2001 and 2002. Thethree corresponding financial years of interest were 1999/2000, 2000/2001 and 2001/2002. Because many agencies
did not have the relevant data over all three years of interest, frequencies and percentages are presented as yearly
averages based on the available years.
For each agency, we attempted to collect publicly available information on the following demographic characteristics
of the person making the inquiry or lodging the complaint:
gender
age
country of origin
preferred language
Indigenous Australian status
disability
employment status
occupation
region of residence.
Available information on the source of the inquiry to the agency and the destination of any referral resulting fromthe complaint were also collected.
For each agency, we also collected the available data on the volume of complaints and/or inquiries lodged eachyear. This information is reported in Appendix 6.
34 Some dispute resolution agencies collect demographic data via surveys. See, for example, Elix, J and T Sourden, Review of theFinancial Industry Complaints Service 2002 — What are the issues? Community Solutions, La Trobe University, University ofWestern Sydney, 2002. The results of such surveys have only been included if they were published in an Annual Report.
35 National Alternative Dispute Resolution Advisory Council, ADR Statistics, 2002. Note that we have not included Commonwealthfunded family mediation services due to the high proportion of matters that they deal with that relate to court processes.

108 Access to Justice and Legal Needs — Data Digest
Limitations of the data
A number of issues were identified regarding the quality of the usage and demographic data published by theagencies including:
the definitions of the services provided varied
the agencies had a diverse range of collection and reporting styles
the data were not reported in a consistent form (sometimes in numbers, sometimes in percentages)
the data were not consistently reported over the three years (e.g. the same information was not always
published each year)
because the data often depended on voluntary reporting of personal information by service users, there wasa high proportion of missing data in many instances.
Given the issues with data quality, particularly the large numbers of missing data, it was not possible to provide areliable profile of the service users of dispute resolution agencies. Thus, the present study is best conceived of as
a preliminary, exploratory study providing suggestive rather than conclusive information on the demographic
characteristics of service users of dispute resolution agencies. Nonetheless, we consolidated the publicly availabledata as a starting point for developing such a profile.
Consistent and collaborative collection of demographic data by dispute resolution agencies would provide avaluable basis for measuring the use of services by disadvantaged users.

109Dispute Resolution Agencies
Demographic characteristics of service users
The following tables present a summary of the publicly available demographic data of the 24 agencies examined.
For each demographic variable, the percentages presented are based on all complaints with ‘valid’ or ‘specified’information for that variable. These are listed in each table. Given the high proportion of missing values, the total
number of complaints (per year) and the percentage of all complaints that had ‘specified’ information for each
demographic variable are also listed. NSW population figures are based on the 2001 census.36
Although the tables consolidate publicly available data, due to the large proportion of missing data, they present
only indicative rather than conclusive information about the demographic characteristics of service users. Whilemost agencies published information on volume and performance indicators, only approximately one third published
some form of demographic information about their service users in their annual report. Of the 24 agencies, 7
published information on gender, making gender the most commonly published piece of demographic information,followed by source of inquiry (5 agencies), age (4 agencies) and region (4 agencies) (see Table 72).
36 Australian Bureau of Statistics, 2001 Census Basic Community Profile and Snapshot: New South Wales, 2001 <http://www.abs.gov.au/ausstats/>
Gender
Table 71: Percentage of complaints by gender and service
Agency Years Gender specified Gender missing Total Complaints
Men Women Annual Annual % of total Annual No.% % No. No. annual
complaints
Health Care Complaints 2001/2002 42.1 57.9 2 402 260 9.8 2 662Commissiona
Energy & Water 1999/2000 51 49 4 300 0 - 4 300Ombudsman NSW to 2001/2002
Human Rights and Equal 2000/2001 49.4 50.6 1 229 38 3.0 1 267Opportunity Commissionb to 2001/2002
Anti-Discrimination Boardc 1999/2000 47.5 52.5 1 491 40 2.6 1 531to 2001/2002
Community Justice 1999/2000 45.4 54.6 5 570 18 910 77.2 24 480Centresd to 2001/2002
Insurance Brokers 2000 to 2002 64.4 35.6 95 75 e 44.1 170Dispute Facility
Superannuation 1999/2000 64.7 35.3 1 826 0 - 1 826Complaints Tribunal to 2001/2002
a The other 1.3% consist of ‘joint complainants’.
b The other 3% include couple or familiy, on others behalf, organisations and community/other group.
c The other 2% consist of the category ‘other’. Numbers include both complaints and inquiries.
d Information is collected in relation to the first point of contact. 16.8% of annual complaints are recorded as either couple or organisation/community.
e A large proportion of complaints with gender missing were categorised as small business.
Sources: HCCC, EWON, HREOC, ADB, CJC, IBDF and SCT Annual Reports.
Comment
There was a wide variation in the proportion of complaints by men and women to individual agencies, in some
cases being greater and in some cases being less than their share of the NSW population (men 49%; women 51%).

110 Access to Justice and Legal Needs — Data DigestT
able
72:
Su
mm
ary
of
dem
og
rap
hic
dat
a p
ub
lish
ed b
y d
isp
ute
res
olu
tio
n a
gen
cies
in
An
nu
al R
epo
rts
2000
–200
2
Ag
ency
Ag
eD
isab
ilit
yG
end
erE
thn
icit
yL
ang
uag
eIn
dig
eno
us
Em
plo
ymen
tR
egio
nS
ou
rce
Ref
erre
d t
oO
ccu
pat
ion
of
inq
uir
y
Adm
inis
trat
ive
App
eals
Tri
buna
l
Adm
inis
trat
ive
Dec
isio
ns T
ribu
nal
Ant
i-D
iscr
imin
atio
n B
oard
Aus
tral
ian
Con
sum
er a
nd C
ompe
titio
n C
omm
issi
on
Ban
king
and
Fin
anci
al S
ervi
ces
Om
buds
man
a
Com
mon
wea
lth O
mbu
dsm
an
Com
mun
ity J
ustic
e C
entr
esb
cd
Con
sum
er, T
rade
r an
d T
enan
cy T
ribu
nal
Cre
dit
Uni
on D
ispu
te R
esol
utio
n C
entr
e
Ene
rgy
& W
ater
Om
buds
man
NS
We
Fin
anci
al I
ndus
try
Com
plai
nts
Ser
vice
Hea
lth C
are
Com
plai
nts
Com
mis
sion
Hum
an R
ight
s an
d E
qual
Opp
ortu
nity
Com
mis
sion
Insu
ranc
e B
roke
rs D
ispu
tes
Ltd
gh
i
Insu
ranc
e E
nqui
ries
and
Com
plai
nts
Ltd
Mig
ratio
n R
evie
w T
ribun
al
NS
W O
mbu
dsm
an
Off
ice
of I
ndus
tria
l R
elat
ions
Off
ice
of t
he L
egal
Ser
vice
s C
omm
issi
oner
Pri
vate
Hea
lth I
nsur
ance
Om
buds
man
Ref
ugee
Rev
iew
Tri
buna
l
Soc
ial S
ecur
ity A
ppea
ls T
ribu
nal
Sup
eran
nuat
ion
Com
plai
nts
Trib
unal
Tel
ecom
mun
icat
ions
Ind
ustr
y O
mbu
dsm
an
To
tal
41
73
13
14
52
1
aT
his
info
rmat
ion
is re
port
ed in
gra
phic
al fo
rm w
ith n
o nu
mbe
rs o
r per
cent
ages
list
ed, i
t is
ther
efor
e no
t inc
lude
d in
the
dem
ogra
phic
sec
tion
of th
e re
port
.
bIn
form
atio
n is
col
lect
ed in
rela
tion
to “p
arty
A” w
ho is
the
first
poi
nt o
f con
tact
.
cC
ount
ry o
f birt
h.
dLo
cal c
ourt
are
a (N
ot re
port
ed in
the
dem
ogra
phic
sec
tion
of re
port
).
eU
rban
/rur
al.
fLi
sted
by
com
plai
nt o
r bod
y re
ferr
ed to
but
not
bot
h.
gIn
cons
iste
nt re
port
ing
over
the
thre
e ye
ars.
The
re a
re o
nly
3 ca
tego
ries:
0–2
0, 3
0–50
and
70+
.
hM
etro
polit
an/c
ount
ry.
iIn
dust
ry b
odie
s on
ly.

111Dispute Resolution Agencies
Age
Table 73: Percentage of complaints by ageHealth Care Complaints Commission, 2001/2002
Age Age Annual % of total(years) specified No. annual
% complaints
0–15 0.3 1
16–24 3.3 13
25–34 14.3 57
35–44 24.8 99
45–59 30.5 122
60+ 27.0 108
Total age specified 100 400 15.0
Age missing 2 262 85.0
Total complaints 2 662 100
Source: HCCC Annual Report, 2001/2002.
Table 74: Percentage of complaints by ageInsurance Brokers Dispute Facility, 2001 to 2002
Age Age Annual % of total(years) specified No. annual
% complaints
0–20 0.3 0.5
20–30 9.7 17
30–50 62.0 108.5
50–70 26.6 46.5
70+ 1.4 2.5
Total age specified 100 175 100
Age missing - -
Total complaints 175 100
Source: IBDF Annual Reports, 2001, 2002.
Table 75: Mean age of complainantsSuperannuation Complaints Tribunal,1999/2000 to 2001/2002
Mean age Annual % of totalNo. annual
complaints
47.7
Total age specified 1 217 66.6
Age missing 609 33.4
Total complaints 1 826 100
Note: 29.7% of the complainants were 55+. No other informationwas provided in the Annual Reports.
Source: SCT Annual Reports, 1999/2000 to 2001/2002.
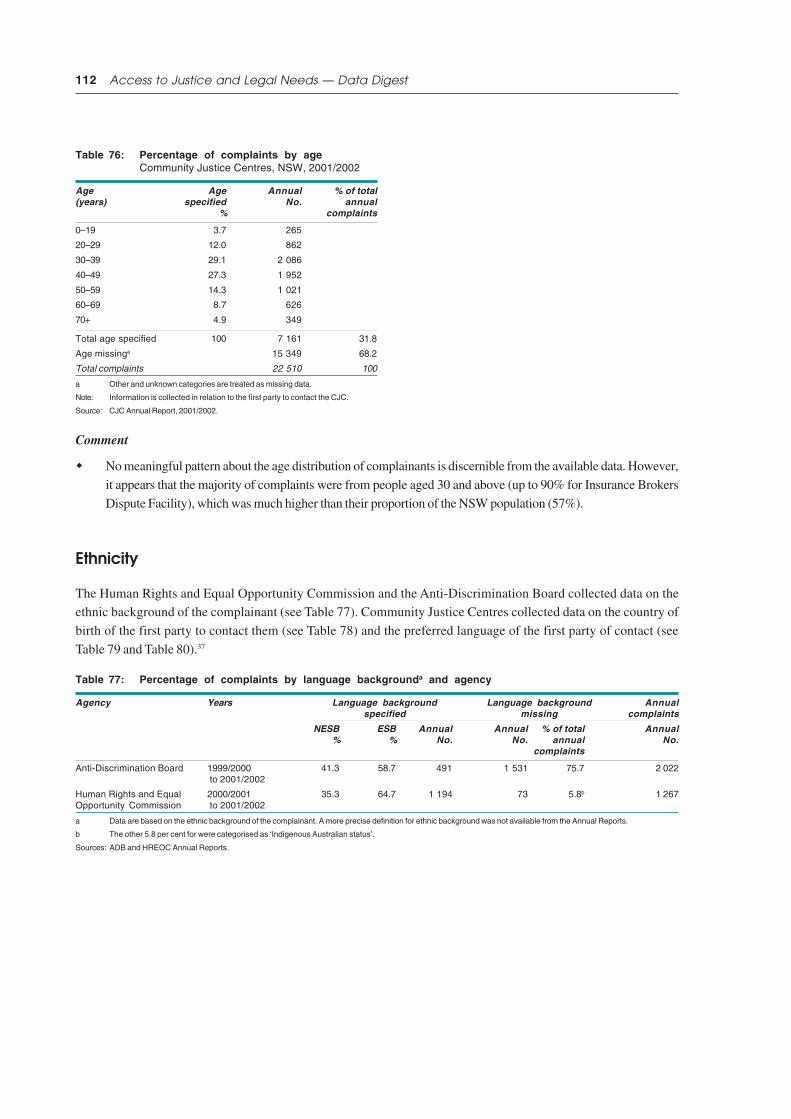
112 Access to Justice and Legal Needs — Data Digest
Table 76: Percentage of complaints by ageCommunity Justice Centres, NSW, 2001/2002
Age Age Annual % of total(years) specified No. annual
% complaints
0–19 3.7 265
20–29 12.0 862
30–39 29.1 2 086
40–49 27.3 1 952
50–59 14.3 1 021
60–69 8.7 626
70+ 4.9 349
Total age specified 100 7 161 31.8
Age missinga 15 349 68.2
Total complaints 22 510 100
a Other and unknown categories are treated as missing data.
Note: Information is collected in relation to the first party to contact the CJC.
Source: CJC Annual Report, 2001/2002.
Comment
No meaningful pattern about the age distribution of complainants is discernible from the available data. However,
it appears that the majority of complaints were from people aged 30 and above (up to 90% for Insurance Brokers
Dispute Facility), which was much higher than their proportion of the NSW population (57%).
Ethnicity
The Human Rights and Equal Opportunity Commission and the Anti-Discrimination Board collected data on theethnic background of the complainant (see Table 77). Community Justice Centres collected data on the country of
birth of the first party to contact them (see Table 78) and the preferred language of the first party of contact (see
Table 79 and Table 80).37
Table 77: Percentage of complaints by language backgrounda and agency
Agency Years Language background Language background Annualspecified missing complaints
NESB ESB Annual Annual % of total Annual% % No. No. annual No.
complaints
Anti-Discrimination Board 1999/2000 41.3 58.7 491 1 531 75.7 2 022 to 2001/2002
Human Rights and Equal 2000/2001 35.3 64.7 1 194 73 5.8b 1 267Opportunity Commission to 2001/2002
a Data are based on the ethnic background of the complainant. A more precise definition for ethnic background was not available from the Annual Reports.
b The other 5.8 per cent for were categorised as ‘Indigenous Australian status’.
Sources: ADB and HREOC Annual Reports.

113Dispute Resolution Agencies
Table 78: Percentage of complaints by country of birthCommunity Justice Centres, NSW, 1999/2000 to 2001/2002
Country Country Annual % of totalof birth of birth No. annual
specified % complaints
Englisha 91.1
Non-Englishb 8.9
Total country of birth specified 100 5 788 23.6
Country of birth missing 18 692 76.4
Total complaints 24 480 100
a English country of birth includes Australia, England and New Zealand.
b Non-English country of birth includes Italy, Greece, Philippines, Lebanon, China, Germany,Macedonia, Vietnam and Fiji.
Note: Data are based on the country of birth of the first party to contact the CJC.
Source: CJC Annual Reports, 1999/2000 to 2001/2002.
Table 79: Percentage of complaints by preferred languageCommunity Justice Centres, NSW, 1999/2000 to 2001/2002
Preferred Language Annual % of totallanguage specified No. annual
% complaints
English 94.5 6 363
Other 5.5 369
Total language specified 100 6 732 27.5
Language missing 17 748 72.5
Total complaints 24 480 100
a Data are based on the preferred language of the first party to contact the CJC.
Source: CJC Annual Reports, 1999/2000 to 2001/2002.
Table 80: Language spoken by service users whosepreferred language is not EnglishCommunity Justice Centres, NSW, 1999/2000 to2001/2002
Language % Language %
Arabic 10.0 Cantonese 4.7
Greek 9.6 Croatian 4.4
Spanish 6.9 Mandarin 4.1
Italian 8.3 Serbian 3.9
Polish 6.0 Maltese 3.0
Macedonian 6.2 Other 27.6
Vietnamese 5.3
Total (%) 100
Total (No) 369
Note: Language specified for 6732 (27.5%) of approaches. (See also Table 79).
Source: CJC Annual Reports, 1999/2000 to 2001/2002.
Comment
The 2001 census provides data on language spoken at home. Although this category is not directly
comparable with the definitions of preferred language used by Community Justice Centres, it is worth notingthat 75 per cent of the NSW population recorded English as the language spoken at home, in comparison to
the 95 per cent of Community Justice Centre service users whose preferred language was English.
37 The Consumer, Trader and Tenancy Tribunal and the Health Care Complaints Commission publish numbers on the use ofinterpreter services. These have not been reported here as they shed no light on the country of origin or preferred language ofthe service user.

114 Access to Justice and Legal Needs — Data Digest
Indigenous Australian status
Table 81: Percentage of complaints by Indigenous Australian status and agency
Agency Years Indigenous status Indigenous status Totalspecified missing complaints
Indigenous Non- Annual Annual % of total AnnualIndigenous No. No. annual No.
% % complaints
Anti-Discrimination 1999/2000 16.3a 83.7 586 945 61.7 1 531Board to 2001/2002
Health Care 2001/2002 2.1 97.9 663 2 010 75.2 2 673Complaints Commission
Human Rights and 2000/2001 5.8 94.2 1 267 - - 1 267Equal Opportunity to 2001/2002Commission
a In 2001/2002, 59 (49.6%) complaints were from Indigenous women, 57 (47.9%) complaints from Indigenous men and 3 (2.5%) complaints from Indigenous organisations.In the previous year Indigenous women made 47 (61%) complaints.
Sources: ADB, HCCC and HREOC Annual Reports, 1999/2000 to 2001/2002.
Comment
Based on the available data, each of the services received a higher proportion of inquiries from Indigenous
Australians than expected given their proportion of the NSW population (1.9%).
Disability
Table 82: Percentage of complaints by disability statusa
Health Care Complaints Commission, NSW, 2001/2002
Disability Disability Annual % of totalstatus specified No. annual
% complaints
Disability 23 156
Non-Disability 77 522
Total disability specified 100 678 25.5
Disability missing 1 984 74.5
Total complaints 2 662 100
a No definition of disability was provided in the Annual Report
Source: HCCC Annual Report, 2001/2002.
Employment Status
Table 83: Percentage of complaints by employment statusCommunity Justice Centres, NSW, 1999/2000 to 2001/2002
Employment Employment Annual % of totalstatus status specified No. annual
% complaints
Full-time 43.3 2 886
Benefits 16.7 1 097
Home duties 13.7 911
Part-time 11.0 734
Retired 11.7 789
Student 3.7 245
Total employment specified 100 6 662 27.2
Employment status missinga 17 818 72.8
Total complaints 24 480 100
a ‘Other’ and ‘unknown’ categories are treated as missing data.
Note: Information is collected in relation to the first point of contact.
Source: CJC Annual Reports, 1999/2000 to 2001/2002.

115Dispute Resolution Agencies
Comment
Fifty-four per cent of complaints were from inquirers in full or part-time employment. This compares with 58per cent of the NSW population in employment.38
Occupation
Table 84: Percentage of complaints by occupationCommunity Justice Centres, NSW, 1999/2000 to 2001/2002
Occupation Occupation Annual % of totalstatus specified No. annual
% complaints
Clerical/sales/service 38.3 2 560
Machine operator/labourer 21.0 1 403
Managerial/professional 17.0 1 134
Never worked 8.1 543
Skilled tradesperson 6.5 434
Para-professional 5.2 346
Student 3.8 256
Total occupation specified 100 6 843 28.0
Occupation missing 17 637 72.0
Total 24 480 100
Note: Information is collected in relation to the first point of contact. ‘Other’ and ‘unknown’categories are treated as missing data.
Source: CJC Annual Reports, 1999/2000 to 2001/2002.
Region of residence
Table 85: Percentage of complaints by region and agency
Agency Years Region specified complaints Region missing Total complaints
Metro/ Rural/ Annual Annual % of total AnnualUrban Regional/ No. No. annual No.
% Remote complaints%
Insurance Brokers 2000 to 2002 63.0 37.0 54 0 - 54Dispute Facility (NSW)
Energy & Water 2001/2002 64 36 4 908 0 - 4 908Ombudsman NSW
Sources: IBDF, EWO Annual Reports.
Comment
Around 64 per cent of complainants were living in metropolitan/urban areas. This is slightly higher than theproportion of the NSW metropolitan/urban population (63%).39
38 These two figures are not directly comparable, due to differences in definitions.

116 Access to Justice and Legal Needs — Data Digest
Pathways
Very few of the 24 dispute resolution agencies examined published information on how service users found out about
them (source of inquiry), or where users were referred if their problem could not be resolved (referral destination).Thus, as was the case with demographic characteristics of service users, it is difficult to build a reliable picture of
source of inquiry and referral destination for these users. Nonetheless, the publicly available information on source of
inquiry and referral destination are consolidated below.
Five agencies published information on source of inquiry and two agencies published information on referral
destination. Table 86 provides a summary of the major sources of inquiry and referral destinations for each agency.
Table 86: Top three sources of inquiry and referral destinations by agency
Agency Years Top 3 sources of inquiry % Top 3 referral destinations %
NSW Health Care 1999/2000 to Consumer 52.3 Registration board 40.8Complaints Commission 2001/2002 Registration board 19.9 Area Health Services 38.2
Family/friend 12.2 Director General 6.1
Financial Industry 2000 to 2001 Media (incl. telephone book) 32.8ComplaintsService Professional bodies 26.7
Insurance company 24.9
Insurance Brokers 2000 to 2002 Broker 65.7 Insurance EnquiriesDispute Facility & Complaints Limited
Telephone book 14.5 Australian Securities& Investment Commission
Consumer advice 11.0 Financial IndustryComplaints Servicea
Community Justice 1999/2000 to Magistrates 20.6Centres 2001/2002 Chamber Magistrates 20.1
Self 13.9
Office of the Legal 1999/2000 to Client 35.7Services Commissioner 2001/2002 Previous client 18.6
Opposing client 13.2
a The percentages referring to each destination were not provided.
Sources: HCCC, FICS, IBDF, CJC and OLSC Annual Reports.
Comment
Most sources of inquiry were specific to the agency. There were, however, several sources which werecommon for more than one organisation. These were consumer bodies, the telephone book and industry
members.
Referral destinations for the two agencies that reported this information were specific to the area of complaintcovered by the agency.
39 These two figures are not directly comparable, due to differences in definitions.
APPENDICES

Appendix 1: Data Sources, Legal AssistanceServices
This section gives a brief description of the legal assistance services covered in Section 1 and data they provided.
Table 1-1: Matrix of data collected by each service
Organisation Area of Age Region Gender Indigenous Country Source of Disability Source of Referrallaw Australian of birth income inquiry destination
Legal Aid NSW xInformation/Advice Advice only Advice only Advice only Information
Serviceonly
Legal Aid NSW Duty x x xSolicitor Service
LawAccess NSW a x x x x b
NSW Community x xLegal Centres Advice only Advice only Advice only
Chamber Magistrate x x x x x x x xService
a LawAccess NSW gender data were not used due to an error in the data collection process for the period covered. This has been rectified for data collected after 2002.
b LawAccess NSW source of inquiry data were not used due to the high proportion of service users who found out about the service through the parent bodies of LawAccess—Legal Aid NSW and the NSW Law Society.

120 Access to Justice and Legal Needs — Data Digest
Legal Aid NSW
http://www.legalaid.nsw.gov.au/lac.nsf/pages/aboutus
Data
Period covered: 2000 to 2002.
Total number of inquiries: 611348.
Data were provided for information, advice and DutySolicitor inquiries. Due to the overlap of services and
clients, and variations in how the terms are defined,
information and advice inquiries were grouped togetheras the Information/Advice Service. Where data is only
collected for information or advice inquiries, Legal Aid
NSW Information Service or Legal Aid NSW Advice
Service is used. The Duty Solicitor Service was
analysed separately, as it represents a different set of
service users and legal problems. Duty SolicitorService data were not analysed in relation to the types
of legal matters of particular demographic groups, due
to the high proportion of inquiries about Criminal Law.
Information/Advice Service (367026 inquiries): Free telephone or in person information, advice or minor assistance.May include assistance with correspondence or making a phone call on behalf of a service user. The service is
provided from the following locations: Legal Aid NSW Head Office, 19 regional offices, and outreach advice clinics
in metropolitan and country centres. Information/Advice data also include telephone assistance from the Legal Aidhelpline (until Oct 2001) and 5 specialist services—Mental Health Advocacy Service, Prisoners Legal Service,
Veteran’s Advocacy Service, Child Support Service and the Legal Aid HotLine for Under 18s. Information/Advice
does not include advice provided to a client on a Legal Aid grant. LawAccess NSW data were excluded as thisservice is reported separately.
Duty Solicitor Service (244322 inquiries): Advice or representation for clients on their first appearance in one of theLocal Courts distributed throughout NSW. Advice which does not relate to a court appearance that day is recorded
as Advice and would be counted as part of the Information/Advice Service.
Legal Aid NSW data relating to Cases (case grants and client representation) were not analysed as these were not
regarded as an initial point of contact.
ROLE
To assist socially and economicallydisadvantaged people understand and protect
their legal rights. Services include free legal
information, advice and minor assistance in allareas of law, grants of legal aid, a Duty
Solicitor Service at Local Courts, alternative
dispute resolution, a domestic violence courtassistance program and community legal
education programs.

121Data Sources, Legal Assistance Services
The data were received as cross-tabulations of legal matter by a number of requested variables for each calendar
year. Table 1-2 shows the variables for which data were provided in each service type.
Table 1-2: Data received from Legal Aid NSW,by sevice type
Variable Information Advice Duty
Gender
Age (grouped) x
Indigenous Australians x
Source of income x
Country of birth x
Postcode
Source of referral x x
Referral destination x x
Phone/counter inquiries
Many of the Information/Advice Service inquiries were simply classified as phone/counter inquiries within the
major law categories of Family, Criminal and Civil (there were only 140 phone/counter inquiries over the 3 years in
the Duty Solicitor Service). These have been excluded from the analysis of legal matter because of the lack of detailand the potential lack of reliability about the classification of legal matter. The overall effect on the distribution of
inquiries to the Information/Advice Service across each broad area of law that resulted from the removal of phone/
counter inquiries is seen in Table 1-3.
Table 1-3: Distribution of inquiries including andexcluding phone/counter inquiries by,broad area of lawLegal Aid NSW Information/Advice Service,2000–2002
Phone/counter Family Crime Civilinquiries % % %
With 39.6 26.1 34.2
Without 38.9 23.5 37.6

122 Access to Justice and Legal Needs — Data Digest
LawAccess NSW
http://www.lawaccess.nsw.gov.au
Data
Period covered: 2002.
Total number of inquiries: 61100.
Data include information and advice inquiries provided
via the telephone service. Data were provided as unitrecords (with personal information excluded) in an Excel
spreadsheet. The variables provided were: type of
legal matter, gender,40 age, postcode, source ofinquiry41 and referral destination.
Some calls led to more than one problem. The analysis isof problems rather than calls. There were 60413 calls which
resulted in 61100 problems. Because 98.95 per cent of
calls (59779) resulted in only one problem, the problemscan be assumed to be statistically independent.
ROLE
A free service providing a single point ofaccess to legal and related assistance services
in New South Wales. LawAccess NSW
provides legal information, advice and referralservices via a central call centre and the
Internet. The service is available to anyone
who has a legal problem in NSW. Priority forlegal advice is given to customers with urgent
inquiries, with disabilities, from non-English
speaking backgrounds and/or from rural andregional areas.
LawAccess NSW was established inSeptember 2001 as a result of the
amalgamation of the Legal Aid Commission of
NSW ‘Legal HelpLine’ and Law Society ofNSW ‘Community Assistance Department’.
LawAccess NSW is funded by the New SouthWales government and the Public Purpose
Fund of New South Wales.
40 It was not possible to carry out analysis of gender due to an error in the data collection process for the period covered. This hasbeen rectified for data collected after 2002.
41 LawAccess NSW source of inquiry data were not used due to the high proportion of service users who found out about the servicethrough the parent bodies of LawAccess—Legal Aid NSW and the NSW Law Society.

123Data Sources, Legal Assistance Services
NSW Community Legal Centres
http://www.naclc.org.au
Data
Period covered: 1999 to 2002.
Total number of inquiries: 380619.
Data include activity in the following areas:
Information, Advice, and Case. These were notprovided as separate variables and are reported
together.
Only NSW Generalist and Specialist Community Legal
Centres funded by the Commonwealth Government
were included, as listed in Table 1-4.42
Table 1-4: Specialist and Generalist Community Legal Centres in NSW for which data were provided
Generalist Albury Wodonga Hawkesbury/Nepean Macquarie Redfern
Blue Mountains Hunter Marrickville Shoalcoast
Central Coast Illawarra Mt Druitt South West Sydney
Far West Inner City North and North West Western NSW
Kingsford Macarthur Northern Rivers
Specialist Aged-Care Rights Service Public Interest Advocacy Centre
Consumer Credit Legal Centre National Children’s and Youth Law Centre
Environmental Defenders Office Tenants’ Union of NSW
Disability Rights Service Welfare Rights Centre
HIV/Aids Legal Centre Women’s Legal Resources Centre
Immigration Advice and Rights Centre
Data were provided as Excel spreadsheets for the following variables cross-tabulated with legal matter for each
calendar year: gender, age,43 country of birth, Indigenous Australian status, source of income, postcode, source ofinquiry and referral destination.
A number of the demographic variables had a large proportion of missing values. Information about age, countryof birth or Indigenous status is not collected for information inquiries and for some telephone advice inquiries.
Collection of information about source of income is optional. As missing values were not randomly distributed
across year and broad area of law, a weighting process was used to adjust the missing values to reflect thisdistribution. See Appendix 4 for details on how this was done.
Data for referral and problem types count each problem type within each service user matter. Thus, the numbersrepresent the count of all problem types (up to 4, minimum of 1) within all matters which had some activity within the
nominated period.
ROLE
Community Legal Centres are independent,non-profit organisations that provide access to
services for disadvantaged members of the
community. Services include legal information,advice, casework, representation, community
legal education, advice to government on
policy issues, law reform and referral.
Community Legal Centres are funded by the
State and Commonwealth governments.
42 See Combined Community Legal Centres Group, Directory of New South Wales Community Legal Centres, Surry Hills, 2002, fordetails of all community legal centres in NSW.
43 Age was provided in pre-defined categories and could not be mapped to Law and Justice Foundation categories.

124 Access to Justice and Legal Needs — Data Digest
ROLE
The Chamber Magistrate Service provides
information to members of the public on basiclegal problems and the options available to assist
them. The Chamber Magistrate Service is
available to provide guidance on Court processesand procedures, and to assist the public in the
drafting of legal documents used in cases before
the Local Court. The Chamber Magistrate doesnot represent clients in court and cannot
determine cases. Anybody is able to use the
service.
Chamber Magistrate Services are provided at
over 160 Local Courts across NSW on a face-to-face basis or via the telephone. In addition, a
number of Chamber Magistrates offer an
outreach service within the community in orderto provide assistance to those who may not be
able to attend the court. In smaller Courts, the
Chamber Magistrate Service is often providedby the Clerk of the Court.
The Chamber Magistrate Service is funded by
the NSW Attorney-General’s Department.
Chamber Magistrate Service
http://www.lawlink.nsw.gov.au/locations/locnsw.nsf/pages/nswmap/
Data
Period covered: 1999 to 2001.
Total number of inquiries: 447080.
The data were provided as a cross-tabulated Excel
spreadsheet and included the variables area of law,Local Court and year.
The type of legal matter was only provided at the broadlevel of family, domestic violence and other. Hence
further analysis could not be carried out on the nature
of legal matters.
Chamber Magistrate regions were converted into
Australian Bureau of Statistics statistical divisions andsubdivisions. The process for determining statistical
division was to find the postcode of the courthouse,
then to determine the statistical division. This couldonly be done approximately. It was assumed that an
inquirer resided in the same statistical division as the
location of the courthouse where they made theirinquiry. This assumption is likely to be false for a
number of inquiries in the Sydney region and for some
inquiries to country courthouses located close tostatistical division boundaries.

Appendix 2: Additional Services
Legal Information Access Centre (LIAC)http://liac.sl.nsw.gov.au
Data
Data were collected via a survey of State Library LIAC
clients for the period 1996 to 2002. Over that period,methodologies, including questionnaire content, have
been reviewed and changed. Due to sample sizes and
response rates, caution must be exercised in analysingtrends in the data.
The aim of the survey is to build profiles of currentLIAC clients, including their usage of LIAC, as well as
to measure client satisfaction with the service provided.The client survey is conducted at different times over
the year, to ensure representation of different client
groups. During the survey period, a self-completingquestionnaire is distributed to all visitors to the Centre,
as well as those who contact LIAC by telephone, letter,
fax or email.
The sample sizes are: 301 (1996); 206 (1998); 238 (2002).
The total number of service users of the State LibraryLIAC during the period 1996/97 to 2002/03 was 122167.
Data were provided for the following variables: legalmatter, gender, age, Indigenous Australian status and
language.
Data were provided as tables in a Word document. As
a result, data could not be mapped to Law and Justice
Foundation categories, nor could variables be cross-tabulated.
Approximately 50 per cent of those answering the
survey were using LIAC for study.
ROLE
Trained staff of the Legal Information Access
Centre (LIAC) at the State Library of NSW andin public libraries across New South Wales
assist the public to access authoritative, up-to-
date information and sources of legal assistancerelevant to their needs. The State Library LIAC
has a comprehensive range of legal information
resources and specialist staff. All public librariesin NSW have plain language legal information.

126 Access to Justice and Legal Needs — Data Digest
Legal matter
Table 2-1: Percentage of inquiries by area of lawa
Legal Information Access Centre, NSW, 2002b
Area of law InquiriesBroad Specific %
Family Total Family 13
Crime Total Crime 23
Civil Housing 5
Workplace/Employment law 10
Environmental/Planning law 6
Court/Parliamentary procedure 5
Business/Commercial 10
Immigration 4
Other 33
Total Civil 73
Total (%) 109 c
Total (No.) 238
a The area of law has not been mapped to Law and Justice Foundation categories.
b Data were only available for 2002.
c This question allows for multiple responses. A client inquiry may involve morethan one subject category, leading to a total of more than 100 per cent.
Source: Legal Information Access Centre (unpublished data).
Gender
Table 2-2: Percentage of inquiries by genderLegal Information Access Centre, NSW, 1996–2002
Gender 1996 1998 2002 All NSW pop’n% % % % IC %
Male 49 44 48 47 96 49
Female 51 56 51 53 104 51
Total (%) 100 100 99a 100 100
Total (No.) 301 206 238 745
a Information about gender was missing for 1 per cent of the data.
Note: Shaded areas indicate that the IC is greater than 100.
Source: Legal Information Access Centre (unpublished data).
Comment
There was a slightly higher proportion of women using LIAC, relative to their proportion of the NSW
population. The proportion of inquiries from men and women varied between 1996 and 2002.

127Additional Services
Age
Table 2-3: Age group by yearLegal Information Access Centre, NSW, 1996–2002
Age 1996 1998 2002 All NSW pop’n(years) % % % % IC %
Under 18 17 3 15 12 48 25
18–24 23 35 24 27 300 9
25–34 19 17 16 17 113 15
35–44 13 17 10 13 87 15
45–54 11 11 16 13 93 14
55 & over 17 17 18 17 77 22
Total (%) 100 100 99a 99a
Total (No.) 301 206 238 745
a Information about age was missing for 1 per cent of the data.
Note: Shaded areas indicate that the IC is greater than 100.
Source: Legal Information Access Centre (unpublished data).
Comment
The proportion of 18 to 34 year olds using LIAC was greater than would be expected given their share of the
NSW population. Inquiries were particularly high for 18 to 24 year olds (IC 300). This may be linked to the high
proportion of those using LIAC for study purposes (approximately 50%).
The proportion of service users who were 35 years old or over was lower than would be expected given theirshare of the NSW population.
Language spoken at home
Table 2-4: Language spoken at home by year Legal Information Access Centre, NSW, 1996–2002
Language spoken 1996 1998 2002 All NSW pop’nat home % % % % %
English 85 70 80 78 75a
Other 15 30 20 22 25
Total (%) 100 100 100 100 100
Total (No.) 301 206 238 745 6 371 745
a Speaks English only.
Source: Legal Information Access Centre (unpublished data).
Comment
The proportion of service users who spoke a language other than English at home was slightly lower thanwould be expected given their share of the NSW population. This varied between 1996 and 2002, with a higher
proportion of service users than would be expected in 1998.

128 Access to Justice and Legal Needs — Data Digest
Indigenous Australian status
Table 2-5: Indigenous Australian status by yearLegal Information Access Centre, NSW, 1996–2002
Indigenous 1996 1998 2002 All % of NSWAustralian % % % % pop’n
Yes 1 0 2 1 1.9
No 99 100 98 99 98.1
Total (%) 100 100 100 100
Total (No.) 301 206 238 745 6 371 745
Source: Legal Information Access Centre (unpublished data).
Comment
The proportion of Indigenous Australian service users was lower than would be expected given their share
of the NSW population. This varied between 1996 and 2002, with a slightly higher than expected proportion
in 2002.

129Additional Services
Women’s Information and Referral Service (WIRS)
http://www.women.nsw.gov.au/referral/refhome2.html
Data
The data include inquiries about legal matters from
4/12/00 to 28/6/02. Approximately 25 per cent of callsto WIRS were classified as legal during this period.
The total number of records was 1908.
The variables collected include age, culture, how found,
and description of the call. These were provided in anExcel spreadsheet and were mapped to Law and Justice
Foundation categories.
Data on the gender of the caller were not collected. It
could be assumed that a large proportion of the
inquirers were either women or calling on behalf ofwomen.
ROLE
The Women’s Information and Referral Service
is a service of the NSW Department for Women.It provides a first stop telephone contact point
for women seeking up-to-date and accurate
referral information about organisations andservices for women in New South Wales. The
focus is on women with limited access to social
and economic resources. Information andreferral are provided on a range of issues,
including legal issues. Specialist services
include an Indigenous Australian informationofficer and Mandarin, Cantonese and Malay
speaking information officers. Anyone may use
the service.

130 Access to Justice and Legal Needs — Data Digest
Legal matter
Table 2-6: Percentage of inquiries by area of lawWomen’s Information and Referral Service,4/12/00 to 28/6/02
Area of law %Broad Specific
Family Family law 68.7
Crime Crime 3.3Domestic violence 10.5
Civil Business/Media 0.2Consumers 1.4Credit/Debt 3.2Employment 2.0Government/ Legal system 4.0Health/Human rights 1.3Housing 3.2Motor vehicles 0.8Personal injury 0.3Wills/Estates 1.1
Total (%) 100
Total (No.) 1 476
Note: Information about area of law was missing for an additional 432 (23%) of inquiries.
Source: Womens Information and Referral Service (unpublished data).
Comment
Family law accounted for 69 per cent of inquiries.
Family law and domestic violence combined accounted for over three-quarters of inquiries (79.2%).
Age
Table 2-7: Percentage of inquiries by age groupWomen’s Information and Referral Service,NSW 4/12/00 to 28/6/02
Age (years) NSW women% IC pop’n %
Under 15 0.1 0.4 20.6
15 to 17 0.5 11 4.2
18 to 24 5.4 58 9.2
25 to 34 30.8 212 14.5
35 to 44 35.3 230 15.3
45 to 54 18.4 136 13.5
55 to 64 7.5 82 9.1
65 and over 2.0 15 13.2
Total (%) 100 100
Total (No.) 1 524
Notes: Shaded areas indicate that the IC is greater than 100.Information about age was missing for an additional 384 (20%) of inquiries.
Source: Women’s Information and Referral Service (unpublished data).
Comment
There was a low proportion of inquiries from
under 25 year olds, relative to their share of theNSW population. The IC for under 15 year olds
was 0.4, rising to 58 for 18 to 24 year olds. The
low rate of inquiries from under 15 year olds isnot surprising, given that lawyers working with
young people anecdotally report that few
people under 12 will seek legal assistance ontheir own.
There was a high proportion of inquiries from 25
to 54 year olds, given their share of the NSW
population, with the IC peaking at 230 for 35 to44 year olds.
There was a decreasing proportion of inquiries
from over 55 year olds, with the IC falling from 82for 55 to 64 year olds to 15 for those 65 or over.

131Additional Services
Age: Legal matter
Table 2-8: Percentage of inquiries by age group and broad area of lawWomen’s Information and Referral Service, NSW, 4/12/00 to 28/6/02
Age Family Crime Domestic Civil Total(years) violence
% % % % %
Under 25 63.8 5.8 7.2 23.2 100
25 to 34 74.1 3.8 10.5 11.6 100
35 to 44 69.6 4.7 12.5 13.2 100
45 to 54 70.2 4.1 9.2 16.5 100
55 to 64 53.1 3.1 20.8 22.9 100
65 and over 37.0 - 7.4 55.6 100
a Numbers were not sufficient to break down Civil Law inquiries to a greater level of detail.
Note: N = 1205. Information about age or area of law was missing for an additional 703 (37%) inquiries.
Source: Women’s Information and Referral Service (unpublished data).
Comment
Family Law matters accounted for the majority of inquiries for all age groups except for over 65 year olds, who
made a higher proportion of inquiries about Civil Law (55%).
Based on the chi-square examining broad area of law by age, 55 to 64 year olds were more likely to generateinquiries about domestic violence.
Country of birth
Table 2-9: Percentage of inquiries by country of birthWomen’s Information and Referral Service, NSW, 4/12/00 to 28/6/02
Country of birth Inquiries NSW female% IC pop’n %
Born in Australia Total born in Australia 77.5 102 75.4
Born outside Australiaa New Zealand/Pacific Islands 2.0 76 2.6
North America 0.8 160 0.5
Asia 5.8 74 7.8
Europe (includes UK) 10.2 99 10.3
Middle East 2.0 117 1.7
Africa 0.6 54 1.1
South/Central America 1.1 157 0.7
Total born outside Australia 22.5 91 24.6
Total (%) 100
Total (No.) 1 877
a It was not possible to separate the countries into English speaking and non-English speaking, as Europe and theUnited Kingdom were grouped together.
Notes: Shaded areas indicate that the IC is greater than 100.Information about country of birth was missing for an additional 31 (1.6%) inquiries.
Source: Women’s Information and Referral Service (unpublished data).
Comment
Overall, there were fewer inquiries from service users born outside Australia than would be expected giventheir share of the population. This was not the case for all country groups—of those born outside Australia,
North America (IC of 160), South/Central America (IC of 157) and the Middle East (IC of 117) had a higher
proportion of inquiries than would be expected given their share of the population.

132 Access to Justice and Legal Needs — Data Digest
Country of birth: Legal matter
Table 2-10: Percentage of inquiries by country of birth and broad area of lawWomen’s Information and Referral Service, NSW, 4/12/00 to 28/6/02
Country of birth Family Crime Domestic Civil Totalviolence
% % % % %
Born in Australia 70.6 4.1 9.3 16.0 100
Born outside Australia 63.9 2.8 14.5 18.8 100
All 69.0 3.8 10.5 16.6 100
Note: N = 1461. Information about country of birth and area of law was missing for an additional 447 (23%) inquiries.
Source: Women’s Information and Referral Service (unpublished data).
Comment
There was a high proportion of inquiries with no information about country of birth (23%).
Both Australian born and non-Australian born service users had a high proportion of inquiries about Family
Law issues. However, based on the chi-square examining broad area of law by country of birth, service userswho were born outside Australia were more likely than Australian born service users to inquire about
domestic violence.
Source of inquiry
Table 2-11: Source of inquiryWomen’s Information andReferral Service, NSW,4/12/00 to 28/6/02
How found Inquiries%
Already knew about 10.1
Friend/Family 6.6
Health professional .1
Media .5
Telephone book 68.5
Publication 4.0
Internet .7
Community organisation 3.3
Local council .4
Government 4.5
Other 1.3
Total (%) 100
Total (No.) 1 874
Note: Information about source of inquiry was missingfor an additional 34 (2%) inquiries.
Source: Women’s Information and Referral Service NSW(unpublished data).
Comment
The telephone book was cited as the most frequently used
method of finding the Women’s Information and ReferralService (69%). It is unclear, however, whether this indicates
prior knowledge of the service.

133Additional Services
Country of birth: Source of inquiry
Table 2-12: Country of birth by source of inquiryWomen’s Information and Referral Service,NSW, 4/12/00 to 28/6/02
Source of inquiry Australia Overseas All% % %
Already knew about 9.4 11.2 9.8
Friend / family 6.2 7.9 6.6
Media .4 .7 .5
Telephone book 72.0 58.1 68.9
Publication 3.5 5.7 4.0
Internet .6 1.2 .8
Health professional .1 0.0 .1
Community organisation 2.5 5.7 3.2
Local council .3 .7 .4
Government 4.0 6.2 4.5
Other .9 2.6 1.3
Total (%) 99.9 100 100.0
Total (No.) 1 441 420 1 861
Note: Information about how inquirers found out about the service was missingfor an additional 47 (3%) inquiries.
Source: Women’s Information and Referral Service (unpublished data).
Comment
Based on the chi-square examining country of
birth by source of inquiry, service users who
were born outside Australia were more likelythan Australian born service users to find out
about the service through community
organisations, and less likely to find out aboutthe service via the telephone book.

Appendix 3: Region of ResidenceClassification Scheme
Where postcode data were available, postcodes were mapped to Australian Bureau of Statistics regions. These are
based on the Australian Standard Geographical Classification (ASGC).44 The ASGC has four hierarchical levels:
State/Territory (S/T)
Statistical Division (SD)
Statistical Subdivision (SSD)
Statistical Local Area (SLA)
We have reported at the level of Statistical Divisions (SD) for non-Sydney regions and Statistical Subdivisions(SSD) for metropolitan Sydney as shown in Figure 3-1 and Figure 3-2. This is in accordance with the practice of the
NSW Bureau of Crime Statistics and Research.
As one postcode may belong in more than one subdivision inquiries have been randomly allocated based on the
weighting accorded to the postcodes. This information about postcode distribution comes from the Postal Area To
Statistical Local Area 2001 Concordance.45
Population percentages were calculated using 2001 Census data.46
A number of postcodes could be identified as those for ‘large volume recipients’. These, together with the CBD
postcodes (1003, 1010, 1172, 1208, 1300, 2000, 2001, 2004, 2005, 2006, 2013, 2020), were formed into a group called‘Business’. This group has been excluded from analysis. This affected the Inner Sydney Statistical Subdivision in
particular. The rest of Inner Sydney was mapped to the Inner Sydney Statistical Subdivision.
Inquiries from outside NSW (including the ACT) have been excluded from the analysis.
44 Australian Bureau of Statistics, National Localities Index, Australia: Localities & Streets Indices and Explanatory Notes for
ASGC 2002, Catalogue No. 1252.0, <http://www.ausstats.abs.gov.au/>.45 Australian Bureau of Statistics, Postal Area to Statistical Local Area Concordance, Australia, Catalogue No. 1253.0, ABS, 2001
46 Australian Bureau of Statistics, 2001 Census Basic Community Profile and Snapshot: New South Wales, ABS, <http://www.abs.gov.au/>.

136 Access to Justice and Legal Needs
Figure 3-1: New South Wales Statistical Division boundaries
Figure 3-2: Sydney Statistical Subdivision boundaries

137Region of Residence Classification Scheme
Table 3-1: New South Wales Statistical Divisions
Hunter Illawarra Richmond–Tweed Mid-North CoastCessnock Kiama Ballina BellingenDungog Shellharbour Byron Coffs HarbourGloucester Shoalhaven Kyogle CopmanhurstGreat Lakes Wingecarribee Lismore GraftonLake Macquarie Wollongong Richmond Valley Greater TareeMaitland Tweed HastingsMerriwa KempseyMurrurundi Lord Howe IslandMuswellbrook MacleanNewcastle NambuccaPort Stephens Pristine WatersSconeSingleton
Northern North Western Central West South EasternArmidale Dumaresq Bogan Bathurst Bega ValleyBarraba Bourke Bland BombalaBingara Brewarrina Blayney BoorowaGlen Innes Cobar Cabonne Cooma-MonaroGunnedah Coolah Cowra CrookwellGuyra Coonabarabran Evans EurobodallaInverell Coonamble Forbes GoulburnManilla Dubbo Greater Lithgow GunningMoree Plains Gilgandra Lachlan HardenNarrabri Mudgee Oberon MulwareeNundle Narromine Orange QueanbeyanParry Walgett Parkes Snowy RiverQuirindi Warren Rylstone TallagandaSevern Wellington Weddin YarrowlumlaTamworth YassTenterfield YoungUrallaWalchaYallaroi
Murrumbidgee Murray Far WestCarrathool Albury Broken HillCoolamon Balranald Central DarlingCootamundra Berrigan Unincorporated Far WestGriffith ConargoGundagai CorowaHay CulcairnJunee DeniliquinLeeton HolbrookLockhart HumeMurrumbidgee JerilderieNarrandera MurrayTemora TumbarumbaTumut UranaWagga Wagga Wakool
WentworthWindouran

138 Access to Justice and Legal Needs
Table 3-2: Sydney Statistical Subdivisions
Inner Sydney Outer South Western Sydney Lower Northern SydneyBotany Bay Camden Hunters HillLeichhardt Campbelltown Lane CoveMarrickville Wollondilly MosmanSouth Sydney North SydneySydney Ryde
Willoughby
Eastern Suburbs Inner Western Sydney Central Northern SydneyRandwick Ashfield Baulkham HillsWaverley Burwood HornsbyWoollahra Concord Ku-ring-gai
DrummoyneStrathfield
St George–Sutherland Central Western Sydney Northern BeachesHurstville Auburn ManlyKogarah Holroyd PittwaterRockdale Parramatta WarringahSutherland
Canterbury–Bankstown Outer Western Sydney Gosford–WyongBankstown Blue Mountains GosfordCanterbury Hawkesbury Wyong
Penrith
Fairfield–Liverpool BlacktownFairfield BlacktownLiverpool

Appendix 4: Data Analysis Methods
Index of concentration (IC)
For each demographic variable (e.g. gender), an IC was calculated for each demographic group within that variable
(e.g. men and women).47 For each demographic group, the IC was calculated by dividing the proportion of inquiries
from that demographic group by the proportion of that group in the NSW population according to the 2001census,48 and multiplying the result by 100. The following example illustrates the calculation process.
Chi-square test
The chi-square test is a non-parametric test that examines whether there is a significant relationship between two
or more categorical variables with data in terms of frequencies. The chi-square test is based on a cross-tabulation
of the relevant variables and compares the observed frequencies in each cell of the cross-tabulation with thefrequencies expected on the basis of the null hypothesis.49 All of the chi-square tests in the present report were
two-way, that is, conducted between two variables.
The chi-square test determines whether the relationship between the variables is significant. To determine which
cells in the cross-tabulation had higher than expected frequencies, the standard residual for each cell was examined.The standard residual is the difference between the observed and expected frequency, adjusted for the scale effect
of the frequencies. Cells with a standard residual greater than or equal to two were deemed to be significantly
‘higher than expected’, and are reported in the text.
IC for men and IC for women for inquiries to the NSW Legal Aid Information/Advice Service
Proportion of inquiries from men ÷ Proportion of men in NSW * 100 = Index of concentration for men
45.6 / 49.4 * 100 = 92
Proportion of inquiries from women ÷ Proportion of women in NSW * 100 = Index of concentration for women
54.4 / 50.6 * 100 = 107
The IC for women (107), which is greater than 100, indicates that women accounted for a higher proportion of inquiriesthan would be expected given their proportion in the NSW population. The corresponding IC for men (92), which isunder 100, indicates that men made fewer inquiries than would be expected based on their proportion of the NSWpopulation.
47 ICs were not calculated for source of income.
48 Population rates are calculated using data from the 2001 census. (Australian Bureau of Statistics, 2001 Census Basic CommunityProfile and Snapshot: New South Wales, ABS, <http://www.abs.gov.au/>).
49 For a description of the chi-square function and its test procedure, see Siegel, S. and Castellan, N.J., Nonparametric Statistics forthe Behavioral Sciences, 2nd Ed., McGraw-Hill, NY, 1998.

140 Access to Justice and Legal Needs — Data Digest
Adjusting for missing values
For any variable (for a given service) with missing values for more than 10 per cent of inquiries, the following
process was undertaken to decide whether to use a weighting process before presenting descriptive statistics (e.g.
percentages) and conducting the chi-square tests involving that variable.
The distribution of missing values for the variable in question was compared to the distribution of valid values for
the variable across both years and broad areas of law. If the distribution of missing values was similar to thedistribution of valid values across both years and broad areas of law,50 the original frequencies for the variable were
used in all analyses. If, however, these distributions differed,51 adjusted frequencies for the variable were used in all
relevant analyses (e.g. percentages and chi-square tests).
The adjusted frequency in each case (e.g. in each cell of the chi-square cross-tabulation) was calculated as follows:
Adjusted frequency = original frequency * total no. of inquiries / no. of inquiries with valid values
Adjusted frequencies were used in the analyses for NSW Community Legal Centres involving age, income, country
of birth or Indigenous Australian status, and for Legal Aid NSW involving source of income. In all other cases,
original frequencies were used in the analyses. Note that, even in the cases where adjusted frequencies were used,the number of inquiries with valid values is still shown at the bottom of the relevant tables/figures.
50 To test whether the distribution of missing values for the variable was similar to the distribution of valid values for the variableacross years and broad area of law, a preliminary three-way chi-square test was conducted between the variable, year and broadarea of law, including inquiries with missing values as one of the categories for the variable. If the chi-square statistic was notsignificant, it was assumed that the distribution of missing values was similar to the distribution of valid values across years andbroad areas of law.
51 That is, if the preliminary chi-square test was significant.

Appendix 5: Tables — Legal AssistanceServices
Table 5-1: Percentage of inquiries by gender and area of lawLegal Aid NSW Information/Advice Service, 2000–2002
Area of law Male FemaleBroad Specific % %
Family Total Family 24.8 50.6
Crime General crime 27.9 9.1
Domestic violence 2.4 2.3
Traffic offences 5.4 2.0
Total Crime 35.7 13.4
Civil Business/Media 0.9 0.8
Consumers 2.0 1.9
Credit/Debt 5.0 5.0
Employment 3.0 2.5
Government/Legal system 10.1 5.3
Health/Human rights 1.6 1.6
Housing 2.8 3.6
Motor vehicles 2.3 2.0
Personal injury 1.2 1.7
Wills/Estates 1.8 3.4
Other (civil) 8.6 8.3
Total Civil 39.5 36
Total (%) 100 100Total (No.) 100 308 121 363
Notes: N = 221671. Information about gender was missing for an additional 393 (0.1%) inquiries.Phone/counter inquiries excluded. See Appendix 1 for more details.
Source: Legal Aid NSW (unpublished data).
Table 5-2: Percentage of inquiries by gender and area of lawNSW Community Legal Centres, 1999–2002
Area of law Male FemaleBroad Specific % %
Family All Family 16.1 34.5
Crime General crime 6.6 4.7
Domestic violence 2.0 7.5
Traffic offences 2.9 0.9
All Crime 11.5 13.1
Civil Business/Media 0.9 0.6
Consumers 5.6 4.0
Credit/Debt 6.9 5.0
Employment 6.2 3.4
Government/Legal system 28.9 17.9
Health/Human rights 3.4 2.7
Housing 10.2 9.1
Motor vehicles 2.7 1.4
Personal Injury 0.5 0.6
Wills/Estates 1.8 2.1
Civil-other 5.1 5.6
All Civil 72.3 52.4
Total (%) 100 100Total (No.) 128 712 232 684
Notes: N = 361396. Information about gender was missing for an additional 19422 (5.1%) inquiries.
Source: Commonwealth Attorney-General’s Department National information Scheme (unpublished data).

142 Access to Justice and Legal Needs — Data Digest
Table 5-3: Percentage of inquiries by age group andbroad area of lawLegal Aid NSW Advice Service, 2000–2002
Age (years) Family Crime Civil Total% % % %
0 to 14 14.3 54.7 31.0 100
15 to 17 2.2 94.2 3.6 100
18 to 24 25.6 56.7 17.7 100
25 to 34 54.6 23.6 21.8 100
35 to 44 57.5 17.0 25.5 100
45 to 54 46.6 14.3 39.1 100
55 to 64 30.7 12.1 57.2 100
65 to 74 22.2 9.9 67.9 100
75 and over 7.5 7.6 84.9 100
All 43.1 26.8 30.1 100
Notes: N = 122651. Information about age was missing for an additional 865 (0.7%)inquiries for the Advice Service.Age was not collected for 227770 inquiries to the Information Service.Phone/counter inquiries excluded. See Appendix 1 for more details.
Source: Legal Aid NSW (unpublished data).
Table 5-4: Percentage of inquiries by age group andbroad area of lawLawAccess NSW 2002
Age (years) Family Crime Civil Total% % % %
Under 25 26.2 26.9 47.0 100
25 to 34 22.9 17.3 59.8 100
35 to 44 32.0 14.8 53.1 100
45 to 54 22.2 14.8 63.0 100
55 to 64 17.5 12.8 69.8 100
65 and over 11.9 8.5 79.6 100
Notes: N = 11093. Information about age was missing for an additional 50007 (81.8%)inquiries.
Source: LawAccess NSW (unpublished data).
Table 5-5: Percentage of inquiries by age group andbroad area of lawNSW Community Legal Centres, 1999–2002
Age (years) Family Crime Civil Total% % % %
0 to 17 10.5 19.7 69.8 100
18 to 20 11.5 31.4 57.1 100
21 to 30 25.7 16.8 57.4 100
31 to 40 36.0 12.7 51.4 100
41 to 50 33.2 11.9 54.9 100
51 to 65 20.0 10.0 70.1 100
66 & over 7.1 4.8 88.1 100
Notes: N = 379481. Information about age was missing for 208715 (55%) inquiries(age was not collected for information and some telephone advice inquiries).The data have been adjusted to take this into account as outlined in Appendix 4.Age groups are those provided by the National Information Service. They donot correspond to the groupings used for other services.
Source: Commonwealth Attorney-General’s Department National Information Scheme(unpublished data).

143Tables — Legal Assistance Services
Table 5-6: Percentage of inquiries by country of birth and broad area of lawLegal Aid NSW Advice Service, 2000–2002
Country of birth Family Crime Civil Total% % % %
English Australia 45.0 30.7 24.4 100speaking New Zealand 44.8 36.8 18.4 100
United Kingdom/Ireland 49.0 19.8 31.2 100
North America 52.8 20.8 26.4 100
Total English speaking 45.2 30.4 24.5 100
Non-English Pacific Islands 40.2 32.6 27.2 100speakinga
Asia 40.7 17.6 41.7 100
Sub-Saharan Africa 36.8 18.9 44.2 100
North Africa/Middle East 37.4 18.1 44.5 100
South/Central America 45.6 15.4 38.9 100
Europe 36.7 17.1 46.1 100
Total non-English speaking 39.2 18.8 42.0 100
All 43.6 27.4 29.0 100
a Includes South Africa.
Notes: N = 77043. Infomration about country of birth was missing for an additional 46519 (38%) inquiries for the Advice Service.The data have been adjusted to take this into account as outlined in Appendix 4. Country of birth was not collected for the227770 inquiries to the Information Service.Phone/counter inquiries excluded. See Appendix 1 for more details.
Source: Legal Aid NSW (unpublished data).
Table 5-7: Percentage of inquiries by country of birth and broad area of lawNSW Community Legal Centres, 1999–2002
Country of birth Family Crime Civil Total% % % %
English Australia 31.9 14.8 53.3 100speaking New Zealand 26.9 14.1 59.0 100
United Kingdom/Ireland 26.8 9.2 64.1 100
North America 18.9 7.4 73.6 100
Total English speaking 31.2 14.3 54.4 100
Non-English Pacific Islands 19.8 9.5 70.7 100speakinga
East Asia 18.9 8.6 72.5 100
South/Central Asia 12.1 4.6 83.3 100
Sub-Saharan Africa 15.8 7.5 76.7 100
North Africa/Middle East 17.1 8.0 74.9 100
South/Central America 20.2 7.7 72.1 100
Europe 18.4 9.7 71.9 100
Total non-English speaking 17.9 8.3 73.8 100
All 27.5 12.7 59.9 100
a Includes South Africa
Notes: N = 380619. Information about country of birth was missing for 162112 (43%) inquiries (country of birth was not collectedfor information and some telephone advice inquiries). The data have been adjusted to take this into account as outlined inAppendix 4.
Source: Commonwealth Attorney-General’s Department National Information Scheme (unpublished data).

144 Access to Justice and Legal Needs — Data Digest
Table 5-8: Percentage of inquiries by Indigenous status and area of lawLegal Aid NSW Advice Service, 2000–2002
Area of law Indigenous Non Indigenous AllBroad Specific Australians Australians
% % %
Family Total Family 30.9 43.2 42.9
Crime General crime 36.1 21.8 22.1
Domestic violence 1.6 1.7 1.7
Traffic offences 1.8 3.0 3.0
Total Crime 39.6 26.5 26.8
Civil Business/Media 0.6 0.6 0.6
Consumers 2.4 1.6 1.6
Credit/Debt 2.7 3.1 3.1
Employment 1.6 1.6 1.6
Government/Legal system 8.4 8.8 8.8
Health/Human rights 1.6 1.1 1.2
Housing 1.6 2.2 2.2
Motor vehicles 1.2 1.7 1.7
Personal injury 2.6 1.1 1.2
Wills/Estates 1.4 1.4 1.4
Civil-other 5.3 7.0 6.9
Total Civil 29.5 30.3 30.3
Total (%) 100 100 100
Notes: N = 123562. Information about Indigenous status was missing for an additional 15683 (11%) inquiries for theAdvice Service. Indigenous status was not collected for 227770 inquiries to the Information Service.
Source: Legal Aid NSW (unpublished data).
Table 5-9: Percentage of inquiries by Indigenous status and area of lawNSW Community Legal Centres, 1999–2002
Area of law Indigenous Non Indigenous AllBroad Specific Australians Australians
% % %
Family Total Family 36.7 34.4 34.5
Crime General crime 11.8 5.7 6.0
Domestic violence 11.4 7.2 7.4
Traffic offences 1.4 1.8 1.7
Total Crime 24.6 14.6 15.1
Civil Business/Media 0.6 0.5 0.5
Consumers 3.3 4.7 4.6
Credit/Debt 6.2 6.5 6.5
Employment 4.0 4.2 4.2
Government/Legal system 9.6 18.2 17.8
Health/Human rights 4.7 2.6 2.8
Housing 4.8 7.8 7.6
Motor vehicles 1.3 2.1 2.1
Personal injury 0.9 0.7 0.7
Wills/Estates 1.4 2.1 2.0
Civil-other 1.8 1.5 1.6
Total Civil 38.7 51 50.4
Total (%) 100 100 100Total (No.) 10 061 191 324 201 385
Note: Information about Indigenous status was missing for 179234 (47%) inquiries (Indigenous status was notcollected for information and some telephone advice inquiries). The data have been adjusted to take this intoaccount as outlined in Appendix 4.
Source: Commonwealth Attorney-General’s Department National Information Scheme (unpublished data).

145Tables — Legal Assistance Services
Table 5-10: Percentage of inquiries by source of income and area of lawLegal Aid NSW Advice Service, 2000–2002
Area of law Source of incomeBroad Specific No Government Paid
income benefits employment% % %
Family Total Family 7.6 33.6 62.4
Crime General crime 7.8 29.1 8.5
Domestic violence 0.6 1.7 1.7
Traffic offences 0.5 3.8 1.6
Total Crime 8.9 34.7 11.8
Civil Business/Media 0.6 0.7 0.5
Consumers 1.5 1.6 1.6
Credit/Debt 3.9 3.0 3.3
Employment 0.6 2.1 0.7
Government/Legal system 61.9 10.5 3.6
Health/Human rights 0.3 0.9 1.8
Housing 2.6 2.0 2.7
Motor vehicles 0.8 1.7 1.5
Personal injury 1.2 1.1 1.4
Wills/Estates 3.6 1.2 1.7
Other (Civil) 6.6 6.9 6.9
Total Civil 83.5 31.7 25.8
Total (%) 100 100 100
Total (No.) 1 264 81 332 40 965
Notes: N = 123561. Information about source of income was missing for an additional 38304 (31%) inquiries.The data have been adjusted to take this into account as outlined in Appendix 4.Phone/counter inquiries excluded. See Appendix 1 for more details.
Source: Legal Aid NSW (unpublished data).
Table 5-11: Percentage of inquiries by source of income and area of lawNSW Community Legal Centres, 1999–2002
Area of law Source of incomeBroad Specific No Government Employed Employed Employed All
income benefits (PT) (Self / temp) (Full time)% % % % % %
Family Total Family 24.5 35.7 42.2 26.6 32.4 34.6
Crime General crime 7.3 6.6 4.8 4.1 4.0 5.9
Domestic violence 4.7 8.2 7.0 3.7 5.3 7.1
Traffic offences 1.6 1.6 2.0 2.2 2.1 1.7
Total Crime 13.6 16.3 13.9 10.0 11.4 14.7
Civil Business/media 0.4 0.5 0.6 1.5 0.4 0.5
Consumers 2.7 4.4 4.9 14.5 7.4 5.2
Credit/Debt 3.6 7.7 6.4 13.4 7.8 7.4
Employment 8.1 2.1 5.3 4.5 6.9 4.0
Government/Legal system 36.7 14.0 13.0 12.3 15.3 16.1
Health/Human rights 3.3 3.0 2.5 2.1 3.0 2.9
Housing 2.7 4.4 5.2 8.4 9.7 5.5
Motor vehicles 1.5 2.0 2.6 2.2 2.5 2.1
Personal Injury 0.6 0.8 0.6 0.3 0.5 0.7
Wills/Estates 1.1 2.5 1.7 1.8 1.5 2.1
Civil-other 1.2 6.5 1.3 2.3 1.3 4.4
Total Civil 61.9 47.9 43.9 63.4 56.2 50.7
Total (%) 100 100 100 100 100 100
Total (No.) 17 361 113 380 22 463 6 022 35 419 194 645
Note: Information about source of income was missing for 185974 (49%) inquiries (source of income was not collected for information and some telephone advice inquiries). Thedata have been adjusted to take this into account as outlined in Appendix 4.
Source: Commonwealth Attorney-General’s Department National Information Scheme (unpublished data).
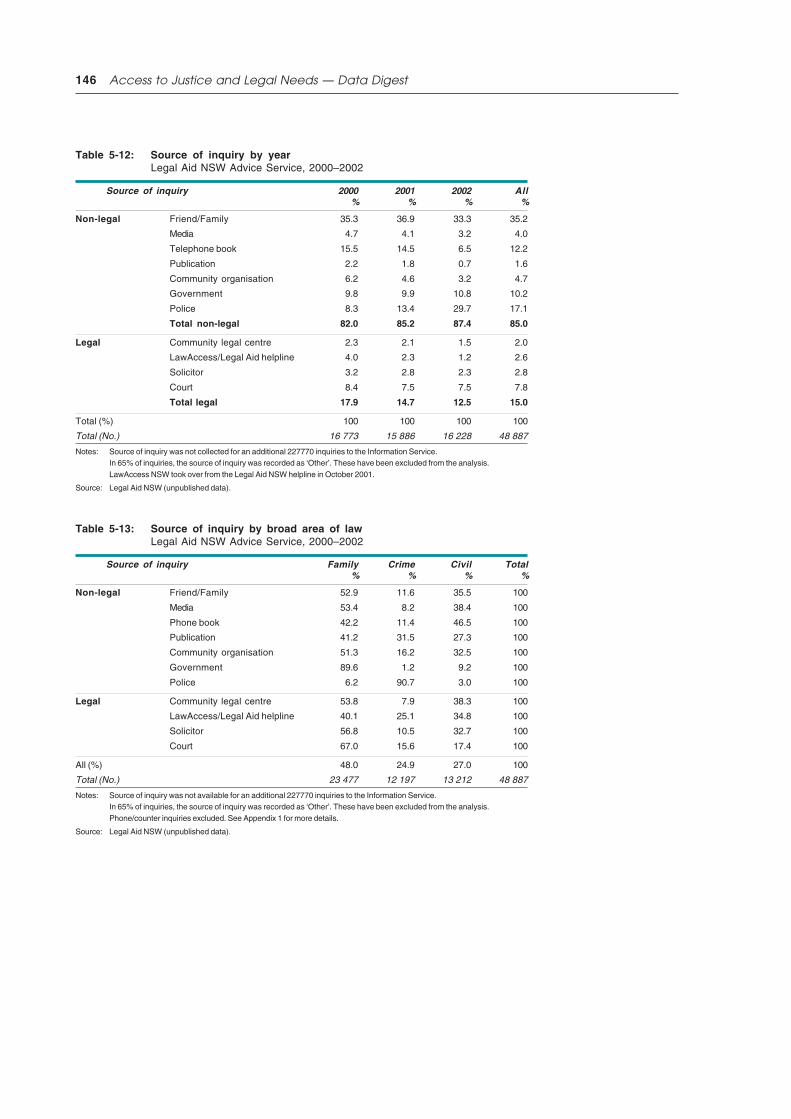
146 Access to Justice and Legal Needs — Data Digest
Table 5-12: Source of inquiry by yearLegal Aid NSW Advice Service, 2000–2002
Source of inquiry 2000 2001 2002 All% % % %
Non-legal Friend/Family 35.3 36.9 33.3 35.2
Media 4.7 4.1 3.2 4.0
Telephone book 15.5 14.5 6.5 12.2
Publication 2.2 1.8 0.7 1.6
Community organisation 6.2 4.6 3.2 4.7
Government 9.8 9.9 10.8 10.2
Police 8.3 13.4 29.7 17.1
Total non-legal 82.0 85.2 87.4 85.0
Legal Community legal centre 2.3 2.1 1.5 2.0
LawAccess/Legal Aid helpline 4.0 2.3 1.2 2.6
Solicitor 3.2 2.8 2.3 2.8
Court 8.4 7.5 7.5 7.8
Total legal 17.9 14.7 12.5 15.0
Total (%) 100 100 100 100
Total (No.) 16 773 15 886 16 228 48 887
Notes: Source of inquiry was not collected for an additional 227770 inquiries to the Information Service.In 65% of inquiries, the source of inquiry was recorded as ‘Other’. These have been excluded from the analysis.LawAccess NSW took over from the Legal Aid NSW helpline in October 2001.
Source: Legal Aid NSW (unpublished data).
Table 5-13: Source of inquiry by broad area of lawLegal Aid NSW Advice Service, 2000–2002
Source of inquiry Family Crime Civil Total% % % %
Non-legal Friend/Family 52.9 11.6 35.5 100
Media 53.4 8.2 38.4 100
Phone book 42.2 11.4 46.5 100
Publication 41.2 31.5 27.3 100
Community organisation 51.3 16.2 32.5 100
Government 89.6 1.2 9.2 100
Police 6.2 90.7 3.0 100
Legal Community legal centre 53.8 7.9 38.3 100
LawAccess/Legal Aid helpline 40.1 25.1 34.8 100
Solicitor 56.8 10.5 32.7 100
Court 67.0 15.6 17.4 100
All (%) 48.0 24.9 27.0 100
Total (No.) 23 477 12 197 13 212 48 887
Notes: Source of inquiry was not available for an additional 227770 inquiries to the Information Service.In 65% of inquiries, the source of inquiry was recorded as ‘Other’. These have been excluded from the analysis.Phone/counter inquiries excluded. See Appendix 1 for more details.
Source: Legal Aid NSW (unpublished data).

147Tables — Legal Assistance Services
Table 5-14: Referral destination by yearLegal Aid NSW Information Service, 2000–2002
Referral destination 2000 2001 2002 All% % % %
Not referreda Total not referred 64.3 70.4 76.7 70.3
Non-legal Government 4.7 2.7 3.2 3.5
Dispute resolution 0.3 0.2 0.3 0.3
Police 0.5 0.8 0.4 0.6
Total non-legal 5.5 3.7 3.9 4.4
Legal Community legal centre 9.1 7.1 6.8 7.6
Private solicitor 6.8 6.4 3.8 5.8
Court 6.2 6.1 3.8 5.5
Total legal 22.1 19.6 14.4 18.9
Other 8.1 6.3 5.0 6.5
Total (%) 100 100 100 100
Total (No.) 68 259 89 467 63 663 221 389
a ‘Not referred’ includes referrals to other sections of Legal Aid NSW.
Notes: Information about referral destination was missing for an additional 8030 (4%) inquiries for the Information Service.Information about referral destination was not collected for 139256 inquiries to the Advice Service.
Source: Legal Aid NSW (unpublished data).
Table 5-15: Referral destinationLawAccess NSW 2002
Referral destination Inquiries%
Not referred Total not referred 40.3
Non-legal Community organisation 3.0
Library 1.3
Government 7.1
Union/association 0.6
Dispute resolution 7.5
Police 1.2
Total non-legal 20.6
Legal Community legal centre 4.3
Legal Aid NSW 15.8
Solicitor 9.3
Court 9.7
Total legal 39.1
Total (%) 100
Total (No.) 60 948
Note: Information about referral destination was missing for an additional122 (0.2%) inquiries.
Source: LawAccess NSW (unpublished data).

148 Access to Justice and Legal Needs — Data Digest
Table 5-16: Referral destination by yearNSW Community Legal Centres 1999–2001
Referral destination 1999 2000 2001 All% % % %
Not referred Total not referred 67.7 65.3 62.2 65.0
Non-legal Community organisation 4.5 5.6 5.2 5.1
Government 2.2 2.5 2.8 2.5
Dispute resolutiona 0.7 0.6 0.9 0.7
Police 0.6 0.7 0.7 0.7
Non-legal (other)b 0.2 0.1 0.1 0.1
Total non-legal 8.2 9.5 9.7 9.1
Legal Community Legal Centre 4.7 4.6 5.1 4.8
Legal Aid NSW 5.0 3.9 4.2 4.4
Solicitor 6.8 8.0 9.7 8.2
Court 4.2 6.0 6.5 5.6
Total legal 20.7 22.5 25.5 23
Other 3.4 2.7 2.7 2.9
Total (%) 100 100 100 100
Total (No.) 104 855 107 304 113 538 325 697
a Includes complaint handling bodies
b Includes unions, health professionals and private organisations.
Source: Commonwealth Attorney-General’s Department National Information Scheme (unpublished data).
Table 5-17: Referral destination by broad area of lawLegal Aid NSW Information Service, 2000–2002
Referral Destination Family Crime Civil Total% % % %
Not referreda 39.6 21.8 38.6 100
Non-legal Government 21.0 14.9 64.2 100
Dispute resolution 18.0 5.7 76.3 100
Police 7.5 77.6 14.8 100
Legal Community Legal Centre 23.5 7.6 68.9 100
Private solicitor 38.6 19.0 42.5 100
Court 24.6 32.0 43.3 100
Other 19.0 14.9 66.1 100
All (%) 33.8 20.4 45.8 100
Total (No.) 31 060 18 779 42 147 91 986
a ‘Not referred’ includes referrals to other sections of Legal Aid NSW
Notes: Information about referral destination was missing for an additional 7923 (8%) inquiries for the Information Service.Information about referral destination was not collected for 139256 inquiries to the Advice Service.Phone/counter inquiries excluded. See Appendix 1 for more details.
Source: Legal Aid NSW (unpublished data).

149Tables — Legal Assistance Services
Table 5-18: Referral destination by broad area of lawLawAccess NSW, 2002
Referral destination Family Crime Civil Total% % % %
Not referred 28.3 16.4 55.3 100
Non-legal Community organisation 5.1 5.2 89.8 100
Library 16.1 19.4 64.5 100
Government 19.7 7.9 72.3 100
Union/Association 1.7 3.8 94.5 100
Dispute resolution 11.2 4.8 84.0 100
Police 3.8 69.9 26.2 100
Legal Community legal centre 20.7 14.4 64.8 100
Legal Aid NSW 44.1 23.5 32.5 100
Solicitor 20.6 15.1 64.4 100
Court 30.0 23.2 46.8 100
All (%) 26.7 16.8 56.5 100
Total (No.) 16 284 10 224 34 386 60 894
Note: Information about referral destination was missing for an additional 183 (0.3%) inquiries.
Source: LawAccess NSW 2002 (unpublished data).
Table 5-19: Referral destination by broad area of lawNSW Community Legal Centres, 1999–2001
Referral destination Family Crime Civil Total% % % %
Not referred 25.4 15.0 59.6 100
Non-legal Community organisation 8.5 3.7 87.8 100
Government 17.3 6.3 76.4 100
Dispute resolutiona 35.2 14.0 50.8 100
Police 23.3 51.9 24.8 100
Non-legal (other)b 2.6 2.4 95.0 100
Legal Other Community Legal Centre 24.4 12.6 63.0 100
Legal Aid NSW 47.4 19.8 32.8 100
Solicitor 50.5 10.6 38.9 100
Court 35.8 11.3 53.0 100
Other 28.9 11.5 59.6 100
All (%) 28.0 13.9 58.1 100
Total (No.) 91 179 45 126 189 221 325 526
a Includes complaint handling bodies.
b Includes unions, health professionals and private organisations.
Note: Information about referral destination was missing for an additional 980 (0.3%) inquiries.
Source: Commonwealth Attorney-General’s Department National Information Scheme (unpublished data).

Appendix 6: Tables — Dispute ResolutionAgencies
This appendix contains the usage data for each of the 24 dispute resolution agencies detailed in Section 2 of the
Digest. The data covers the three calendar years 2000, 2001 and 2002 and the three financial years 1999/2000, 2000/2001 and 2001/2002. For organisations with a national jurisdiction, NSW statistics have been reported where
available.
The data were taken directly from Annual Reports and Reviews. There are a number of differences in how the
agencies have reported their data. The agencies collect different data sets and use different categories and terms.In the case of recording approaches made to them by service users, some agencies record both inquiries and
complaints and others have more detailed categories such as free call number, disputes, grievances and problems.
Tribunals use the terms lodgements and applications. Some agencies distinguish between written and oralapproaches and some record administrative calls. Some agencies report their data in percentages, some in volume,
some in both, and some in percentages one year and volume the next. Some agencies did not report the same
information over all three years.
For these reasons there has been no attempt to map the data to a consistent reporting style.
The agencies appear in the following order, divided into Commonwealth and State agencies for each category:
Government
Tribunals
Self-regulated industry.
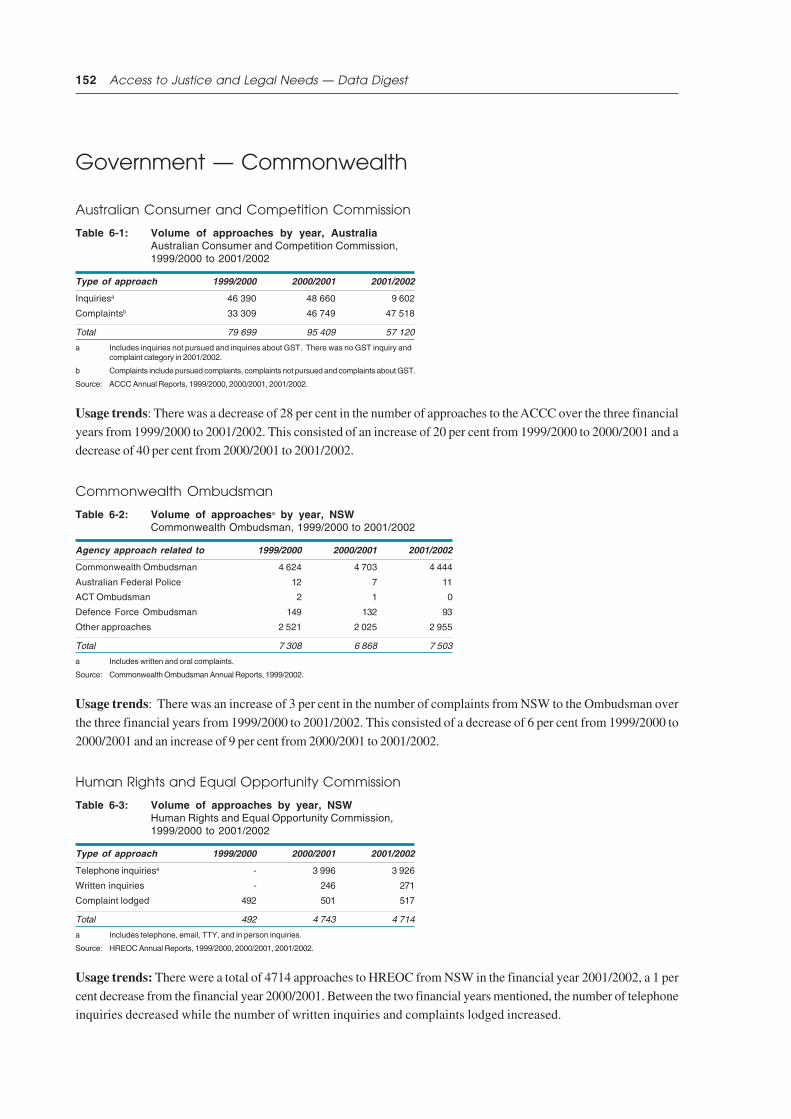
152 Access to Justice and Legal Needs — Data Digest
Government — Commonwealth
Australian Consumer and Competition Commission
Table 6-1: Volume of approaches by year, AustraliaAustralian Consumer and Competition Commission,1999/2000 to 2001/2002
Type of approach 1999/2000 2000/2001 2001/2002
Inquiriesa 46 390 48 660 9 602
Complaintsb 33 309 46 749 47 518
Total 79 699 95 409 57 120
a Includes inquiries not pursued and inquiries about GST. There was no GST inquiry andcomplaint category in 2001/2002.
b Complaints include pursued complaints, complaints not pursued and complaints about GST.
Source: ACCC Annual Reports, 1999/2000, 2000/2001, 2001/2002.
Usage trends: There was a decrease of 28 per cent in the number of approaches to the ACCC over the three financial
years from 1999/2000 to 2001/2002. This consisted of an increase of 20 per cent from 1999/2000 to 2000/2001 and adecrease of 40 per cent from 2000/2001 to 2001/2002.
Commonwealth Ombudsman
Table 6-2: Volume of approachesa by year, NSWCommonwealth Ombudsman, 1999/2000 to 2001/2002
Agency approach related to 1999/2000 2000/2001 2001/2002
Commonwealth Ombudsman 4 624 4 703 4 444
Australian Federal Police 12 7 11
ACT Ombudsman 2 1 0
Defence Force Ombudsman 149 132 93
Other approaches 2 521 2 025 2 955
Total 7 308 6 868 7 503
a Includes written and oral complaints.
Source: Commonwealth Ombudsman Annual Reports, 1999/2002.
Usage trends: There was an increase of 3 per cent in the number of complaints from NSW to the Ombudsman over
the three financial years from 1999/2000 to 2001/2002. This consisted of a decrease of 6 per cent from 1999/2000 to
2000/2001 and an increase of 9 per cent from 2000/2001 to 2001/2002.
Human Rights and Equal Opportunity Commission
Table 6-3: Volume of approaches by year, NSWHuman Rights and Equal Opportunity Commission,1999/2000 to 2001/2002
Type of approach 1999/2000 2000/2001 2001/2002
Telephone inquiriesa - 3 996 3 926
Written inquiries - 246 271
Complaint lodged 492 501 517
Total 492 4 743 4 714
a Includes telephone, email, TTY, and in person inquiries.
Source: HREOC Annual Reports, 1999/2000, 2000/2001, 2001/2002.
Usage trends: There were a total of 4714 approaches to HREOC from NSW in the financial year 2001/2002, a 1 per
cent decrease from the financial year 2000/2001. Between the two financial years mentioned, the number of telephoneinquiries decreased while the number of written inquiries and complaints lodged increased.
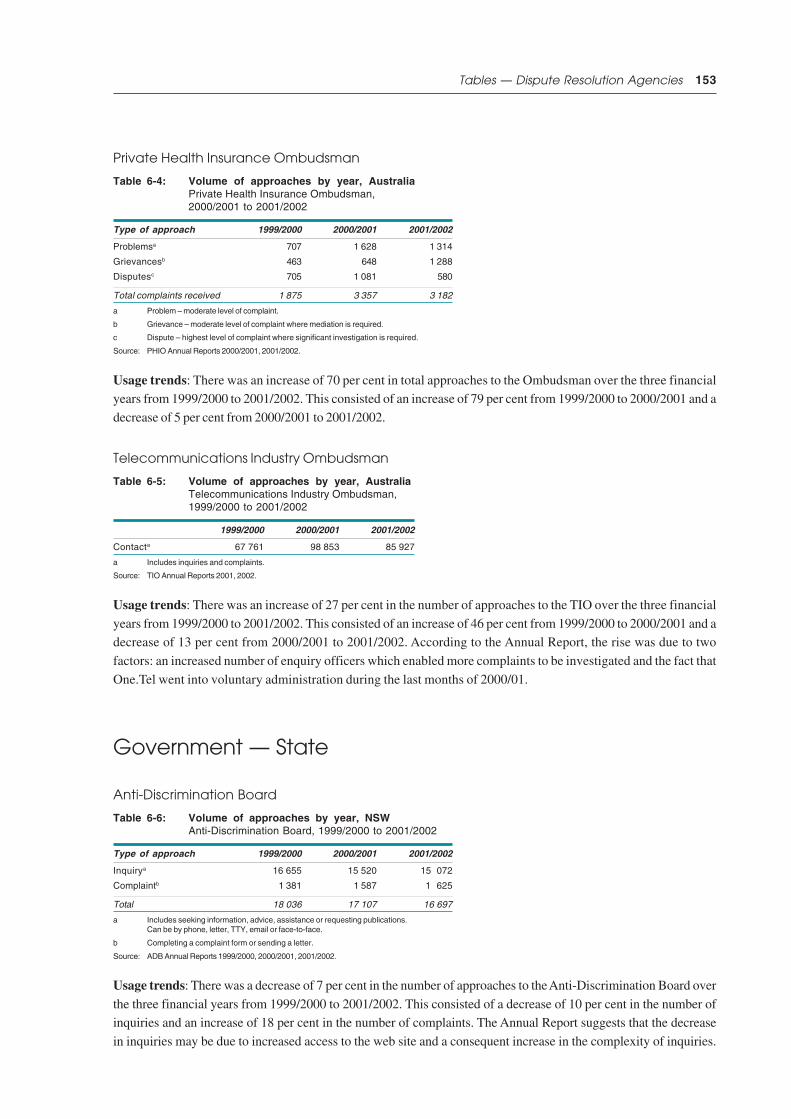
153Tables — Dispute Resolution Agencies
Private Health Insurance Ombudsman
Table 6-4: Volume of approaches by year, AustraliaPrivate Health Insurance Ombudsman,2000/2001 to 2001/2002
Type of approach 1999/2000 2000/2001 2001/2002
Problemsa 707 1 628 1 314
Grievancesb 463 648 1 288
Disputesc 705 1 081 580
Total complaints received 1 875 3 357 3 182
a Problem – moderate level of complaint.
b Grievance – moderate level of complaint where mediation is required.
c Dispute – highest level of complaint where significant investigation is required.
Source: PHIO Annual Reports 2000/2001, 2001/2002.
Usage trends: There was an increase of 70 per cent in total approaches to the Ombudsman over the three financialyears from 1999/2000 to 2001/2002. This consisted of an increase of 79 per cent from 1999/2000 to 2000/2001 and a
decrease of 5 per cent from 2000/2001 to 2001/2002.
Telecommunications Industry Ombudsman
Table 6-5: Volume of approaches by year, AustraliaTelecommunications Industry Ombudsman,1999/2000 to 2001/2002
1999/2000 2000/2001 2001/2002
Contacta 67 761 98 853 85 927
a Includes inquiries and complaints.
Source: TIO Annual Reports 2001, 2002.
Usage trends: There was an increase of 27 per cent in the number of approaches to the TIO over the three financial
years from 1999/2000 to 2001/2002. This consisted of an increase of 46 per cent from 1999/2000 to 2000/2001 and adecrease of 13 per cent from 2000/2001 to 2001/2002. According to the Annual Report, the rise was due to two
factors: an increased number of enquiry officers which enabled more complaints to be investigated and the fact that
One.Tel went into voluntary administration during the last months of 2000/01.
Government — State
Anti-Discrimination Board
Table 6-6: Volume of approaches by year, NSWAnti-Discrimination Board, 1999/2000 to 2001/2002
Type of approach 1999/2000 2000/2001 2001/2002
Inquirya 16 655 15 520 15 072
Complaintb 1 381 1 587 1 625
Total 18 036 17 107 16 697
a Includes seeking information, advice, assistance or requesting publications.Can be by phone, letter, TTY, email or face-to-face.
b Completing a complaint form or sending a letter.
Source: ADB Annual Reports 1999/2000, 2000/2001, 2001/2002.
Usage trends: There was a decrease of 7 per cent in the number of approaches to the Anti-Discrimination Board over
the three financial years from 1999/2000 to 2001/2002. This consisted of a decrease of 10 per cent in the number ofinquiries and an increase of 18 per cent in the number of complaints. The Annual Report suggests that the decrease
in inquiries may be due to increased access to the web site and a consequent increase in the complexity of inquiries.

154 Access to Justice and Legal Needs — Data Digest
Community Justice Centres
Table 6-7: Volume of complaintsa by year, NSWCommunity Justice Centres, 1999/2000 to 2001/2002
Type of complaint 1999/2000 2000/2001 2001/2002
Behavioural b 14 987 15 902 13 773
Specificc 9 157 10 883 8 737
Total 24 144 26 785 22 510
a Complaints are only recorded for Party A. There may be more than one complaint per case,for example, the average number of complaints per case in 2001/02 was 3.
b Complaints relating to the disputing behaviour.
c Complaints relating to the nature of the problem.
Source: CJC Annual Reports, 1999/2000, 2000/2001, 2001/2002.
Usage trends: The number of complaints to Community Justice Centres decreased by 7 per cent from 1999/2000 to
2001/2002. This consisted of an increase of 11 per cent from 1999/2000 to 2000/2001 and a decrease of 16 per centfrom 2000/2001 to 2001/2002.
NSW Health Care Complaints Commission
Table 6-8: Volume of complaints by year, NSWHealth Care Complaints Commission,1999/2000 to 2001/2002
Type of complaint 1999/2000 2000/2001 2001/2002
Telephone inquiriesa 5 340 6 635 5 310
Patient Support Serviceb 3 119 4 056 3 842
Written complaints 2 425 2 888 2 673
Total 10 884 13 579 11 825
a Telephone inquiries do not include administrative calls.
b Patient Support Service assists clients in resolving complaints with private and publichealth services.
Source: HCCC Annual Report 1999/2000, 2000/2001, 2001/2002.
Usage trends: There was an increase of 9 per cent in the number of approaches to the Commission over the three
financial years from 1999/2000 to 2001/2002. This consisted of a decrease of 1 per cent in the number of telephone
inquiries, an increase of 23 per cent in the number of inquiries to the Patient Support Service and an increase of 10per cent in the number of written complaints.
NSW Ombudsman
Table 6-9: Volume of approaches by year, NSWNSW Ombudsman, 1999/2000 to 2001/2002
Type of approach 1999/2000 2000/2001 2001/2002
Written complaints/notifications 9 388 9 820 8 292
Oral complaints/inquiries 24 025 26 564 26 533
Total 33 413 36 384 34 825
Source: NSW Ombudsman Annual Report 1999/2000, 2000/2001, 2001/2002.
Usage trends: There was an increase of 4 per cent in the number of approaches to the NSW Ombudsman over the
three financial years from 1999/2000 to 2001/2002. This consisted of a decrease of 12 per cent in the number of
written complaints and notifications and an increase of 10 per cent in the number of oral complaints and inquiries.

155Tables — Dispute Resolution Agencies
Office of Industrial Relations, NSW Department of Commerce
Table 6-10: Volume of complaints by year, NSWDepartment of Industrial Relations,a
1999/2000 to 2001/2002
1999/2000 2000/2001 2001/2002
Industrial complaints 6 132 5 953 4 300
a These figures apply to the Department of Industrial Relations, which was the nameof the Office of Industrial Relations prior to 2003.
Source: NSW Department of Industrial Relations Annual Report 1999/2000, 2000/2001, 2001/2002.
Usage trends: There was a decrease of 30 per cent in the number of industrial complaints to the Department ofIndustrial Relations over the three financial years from 1999/2000 to 2001/2002. This consisted of a decrease of 3 per
cent from 1999/2000 to 2000/2001 and a decrease of 28 per cent from 2000/2001 to 2001/2002. The Annual Report
noted that this was due to the adoption of early intervention strategies which resolve grievances prior to the formalcomplaint registration phase.
Office of the Legal Services Commissioner
Table 6-11: Volume of approaches by year, NSWOffice of the Legal Services Commissioner,1999/2000 to 2001/2002
Type of approach 1999/2000 2000/2001 2001/2002
Telephone inquiries 9 089 9 110 9 999
Written complaints 2 901 2 635 2 928
Total 11 990 11 745 12 927
Source: OLSC Annual Reports 1999/2000, 2000/2001, 2001/2002.
Usage trends: There was an increase of 8 per cent in the number of approaches over the three financial years from
1999/2000 to 2001/2002. This consisted of an increase of 10 per cent in the number of inquiries and an increase of 1
per cent in the number of complaints.
Tribunals — Commonwealth
Administrative Appeals Tribunal
Table 6-12: Volume of lodgements by year, AustraliaAdministrative Appeals Tribunal,1999/2000 to 2001/2002
1999/2000 2000/2001 2001/2002
Total lodgements 8 050 12 863 7 767
Source: AAT Annual Reports 1999/2000, 2000/2001, 2001/2002.
Usage trends: There was a decrease of 4 per cent in the number of lodgements over the three financial years from
1999/2000 to 2001/2002. This consisted of an increase of 60 per cent from 1999/2000 to 2000/2001 and a decrease of40 per cent from 2000/2001 to 2001/2002.

156 Access to Justice and Legal Needs — Data Digest
Migration Review Tribunal
Table 6-13: Volume of applications by year, Australia and NSWMigration Review Tribunal, 1999/2000 to 2001/2002
Region of residence of applicant 1999/2000 2000/2001 2001/2002
New applications (Australia) 6 480 7 211 8 531
New applications (NSW) 3 429a 4 133 -
a Reported as 3705 on p.15 of 2000/01 Annual Report.
Note: Figures for NSW were not reported in the 2001/2002 Annual Report.
Source: MRT Annual Reports 1999/2000, 2000/2001, 2001/2002.
Usage trends: There was an increase of 32 per cent in the number of new applications over the three financial years
from 1999/2000 to 2001/2002. This consisted of an increase of 11 per cent from 1999/2000 to 2000/2001 and an
increase of 18 per cent from 2000/2001 to 2001/2002.
Refugee Review Tribunal
Table 6-14: Volume of applications by year, AustraliaRefugee Review Tribunal, 1999/2000 to 2001/2002
1999/2000 2000/2001 2001/2002
New applications received 6 093 a 6 545 4 929
a This number was reported as 6133 on p. 17 of the 2000/2001 Annual Report.
Source: RRT Annual Reports 1999/2000, 2000/2001, 2001/2002.
Usage trends: There was a decrease of 19 per cent in the number of new applications over the three financial yearsfrom 1999/2000 to 2001/2002. This consisted of an increase of 7 per cent from 1999/2000 to 2000/2001 and a decrease
of 25 per cent from 2000/2001 to 2001/2002.
Social Security Appeals Tribunal
Table 6-15: Volume of applications by year, AustraliaSocial Security Appeals Tribunal,1999/2000 to 2001/2002
1999/2000 2000/2001 2001/2002
Applications received 9 231 9 349 9 576
Source: SSAT Annual Reports 2000/2001, 2001/2002.
Usage trends: There was an increase of 4 per cent in the number of applications received over the three financial
years from 1999/2000 to 2001/2002. This consisted of an increase of 1 per cent from 1999/2000 to 2000/2001 and anincrease of 2 per cent from 2000/2001 to 2001/2002.
Superannuation Complaints Tribunal
Table 6-16: Volume of approaches by year, Australia and NSWSuperannuation Complaints Tribunal, 1999/2000 to 2001/2002
Type of approach 1999/2000 2000/2001 2001/2002
Telephone inquiries (Australia) 10 603 8 733 11 993
Written complaints (Australia) 1 599 1 856 2 023
Written complaints (NSW) 486 637 671
Source: SCT Annual Reports 1999/2000, 2000/2001, 2001/2002.
Usage trends: There was an increase of 38 per cent in the number of written complaints from NSW over the three
financial years from 1999/2000 to 2001/2002. This consisted of an increase of 31 per cent from 1999/2000 to 2000/
2001 and an increase of 5 per cent from 2000/2001 to 2001/2002.

157Tables — Dispute Resolution Agencies
Tribunals — State
Administrative Decisions Tribunal
Table 6-17: Volume of applications by year, NSWAdministrative Decisions Tribunal,1999/2000 to 2001/2002
Type of application 1999/2000 2000/2001 2001/2002
General 374 350 293
Community Services 16 60 70
EEO 91 111 108
Retail Leases 152 a 107 137
Legal Services 35 38 38
Total 668 666 646
a 52 is quoted in the 2000/01 Annual Report.
Source: ADT Annual Reports, 1999/2000, 2000/2001, 2001/2002.
Usage trends: There was a decrease of 3 per cent in the number of applications to the ADT over the three financialyears from 1999/2000 to 2001/2002. This consisted of a decrease of 0.3 per cent from 1999/2000 to 2000/2001 and a
further decrease of 3 per cent from 2000/2001 to 2001/2002. The 2001/2002 ‘Revenue’ category was not included in
these calculations, as it commenced in 2001.
Consumer, Trader and Tenancy Tribunal (CTTT)
Table 6-18: Volume of applications by year, NSWConsumer Trader and Tenancy Tribunal,a
1999/2000 to 2001/2002
1999/2000 2000/2001 2001/2002
Total applications received 61 564 64 458 61 316
a Previously the Residential Tribunal (RT) and Fair Trading Tribunal (FTT).
Source: RT & FTT Annual Reports 1999/2000, 2000/2001; CTTT Annual Report 2001/2002.
Usage trends: There was a decrease of 0.4 per cent in the number of applications over the three financial years from1999/2000 to 2001/2002. This consisted of an increase of 5 per cent from 1999/2000 to 2000/2001 and a decrease of
5 per cent from 2000/2001 to 20001/2002.
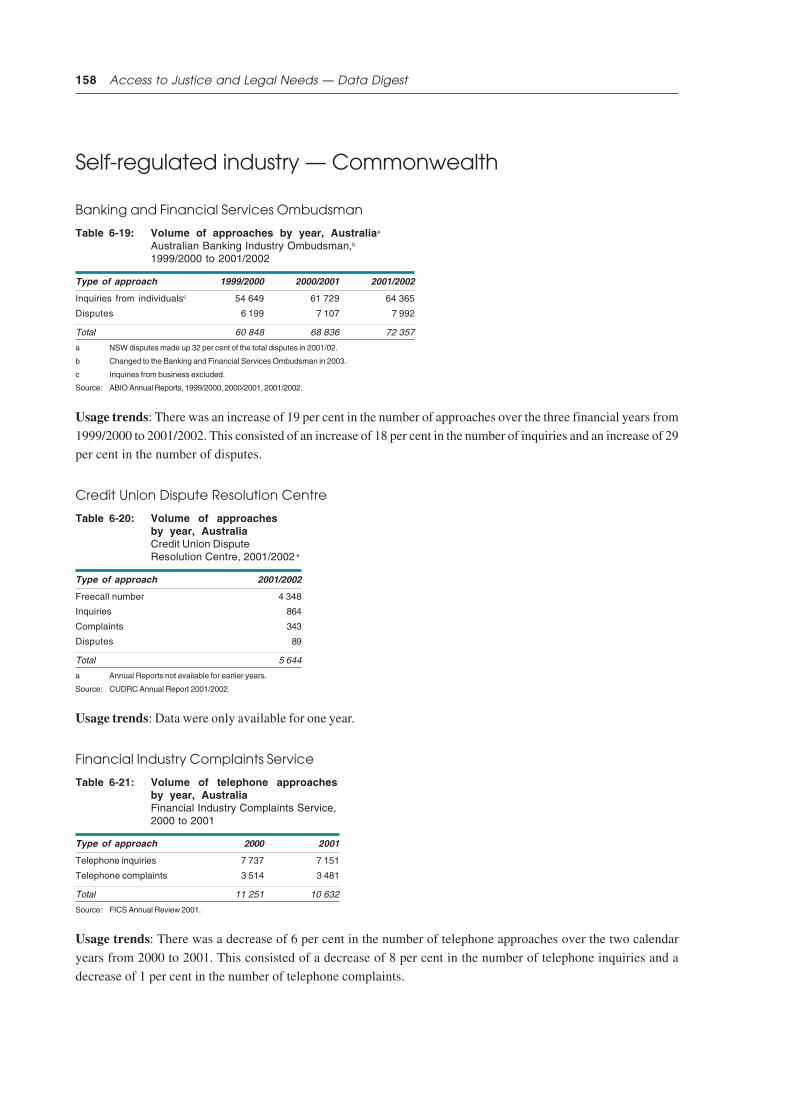
158 Access to Justice and Legal Needs — Data Digest
Self-regulated industry — Commonwealth
Banking and Financial Services Ombudsman
Table 6-19: Volume of approaches by year, Australiaa
Australian Banking Industry Ombudsman,b
1999/2000 to 2001/2002
Type of approach 1999/2000 2000/2001 2001/2002
Inquiries from individualsc 54 649 61 729 64 365
Disputes 6 199 7 107 7 992
Total 60 848 68 836 72 357
a NSW disputes made up 32 per cent of the total disputes in 2001/02.
b Changed to the Banking and Financial Services Ombudsman in 2003.
c Inquiries from business excluded.
Source: ABIO Annual Reports, 1999/2000, 2000/2001, 2001/2002.
Usage trends: There was an increase of 19 per cent in the number of approaches over the three financial years from
1999/2000 to 2001/2002. This consisted of an increase of 18 per cent in the number of inquiries and an increase of 29per cent in the number of disputes.
Credit Union Dispute Resolution Centre
Table 6-20: Volume of approachesby year, AustraliaCredit Union DisputeResolution Centre, 2001/2002 a
Type of approach 2001/2002
Freecall number 4 348
Inquiries 864
Complaints 343
Disputes 89
Total 5 644
a Annual Reports not available for earlier years.
Source: CUDRC Annual Report 2001/2002.
Usage trends: Data were only available for one year.
Financial Industry Complaints Service
Table 6-21: Volume of telephone approachesby year, AustraliaFinancial Industry Complaints Service,2000 to 2001
Type of approach 2000 2001
Telephone inquiries 7 737 7 151
Telephone complaints 3 514 3 481
Total 11 251 10 632
Source: FICS Annual Review 2001.
Usage trends: There was a decrease of 6 per cent in the number of telephone approaches over the two calendar
years from 2000 to 2001. This consisted of a decrease of 8 per cent in the number of telephone inquiries and a
decrease of 1 per cent in the number of telephone complaints.

159Tables — Dispute Resolution Agencies
Insurance Brokers Disputes Ltd
Table 6-22: Volume of approaches by year, AustraliaInsurance Brokers Disputes Ltd, 2000 to 2002
Type of approach 2000 2001 2002
Toll free callsa 3 388 3 288 4 031
Written complaints 161 195 155
Written complaints (NSW) 51 54 57
a Toll free calls include calls about new and existing complaints, verbal advice and brokerreferrals to other complaints schemes and relevant bodies.
Source: IBDF Annual Reports 2000, 2001, 2002.
Usage trends: There was an increase of 12 per cent in the number of complaints from New South Wales over the
three years from 2000 to 2002. This consisted of an increase of 6 per cent from 2000 to 2001 and an increase of 6 per
cent from 2001 to 2002.
Insurance Enquiries and Complaints Ltd
Table 6-23: Volume of approaches by year, Australia and NSWInsurance Enquiries and Complaints Ltd,1999/2000 to 2001/2002
Type of approach 1999/2000 2000/2001 2001/2002
Inquiries 56 855 68 252 75 487
Disputes (NSW) 991 1 089 1 169
Source: IEC Annual Reviews 2000, 2001, 2002.
Usage trends: There was an increase of 18 per cent in the number of disputes in NSW over the three financial years
from 1999/2000 to 2001/2002. This was comprised of an increase of 10 per cent from 1999/2000 to 2000/2001 and an
increase of 7 per cent from 2000/2001 to 2001/2002.
Self-regulated industry — State
Energy & Water Ombudsman NSW
Table 6-24: Volume of complaints by year, NSWEnergy & Water Ombudsman NSW,1999/2000 to 2001/2002
1999/2000 2000/2001 2001/2002
Complaints 3 648 4 344 4 908
Source: EWON Annual Reports 1999/2000, 2000/2001, 2001/2002.
Usage trends: There was an increase of 35 per cent in the number of complaints over the three financial years from
1999/2000 to 2001/2002. This consisted of an increase of 19 per cent from 1999/2000 to 2000/2001 and an increase of
13 per cent from 2000/2001 to 2001/2002.
Law and Justice Foundation Publications
Access to Justice Series
Access to Justice and Legal Needs: A Project to Identify Legal Needs, Pathways and Barriers for Disadvantaged
People in NSW. Stage 2, Quantitative Legal Needs Survey — Bega Valley (Pilot) (2003)
Access to Justice and Legal Needs: A Project to Identify Legal Needs, Pathways and Barriers for DisadvantagedPeople in NSW. Stage 1, Public Consultations (2003)
Access to Justice Roundtable: Proceedings of a Workshop, July 2002 (2003)
Gateways to the Law (2001)
Unrepresented Parties and the Equal Opportunity Tribunal (2000)
Future Directions for Pro Bono Legal Services in NSW Supplementary Report: Proposed Models (1999)
Legal Expense Insurance: an Experiment in Access to Justice (1998)
Law and Justice Foundation Research Reports incorporating the JusticeResearch Centre Monograph Series
Case Management Reform: an Evaluation of the District Court of NSW and County Court of Victoria 1996 Reforms(2003)
The Changing Face of Litigation: Unrepresented Litigants in the Family Court of Australia (2002)
Case Management Reform: a Study of the Federal Court's Individual Docket System (2002)
Legal Aid for Committals (2001)
Managing Prejudicial Publicity (2001)
Legal Services in Family Law (2000)
Model Key Performance Indicators for NSW Courts (2000)
Family Law Case Profiles (1999)
Claiming under the Motor Accidents Scheme (1998)
Plaintiffs' Satisfaction with Dispute Resolution Processes (1997)
The Prototype Access to Justice Monitor Queensland (1996)
Case Management Rolling Lists in the Family Court, Sydney Registry (1996)
Conveyancing Fees in a Competitive Market (1996)
Awards made under the Motor Accidents Act 1988 (1995)
Economic Evaluation of Differential Case Management (1995)

162 Access to Justice and Legal Needs — Data Digest
An Implementation Evaluation of Differential Case Management (1995)
Who Settles and Why? (1994)
Compensation in an Atmosphere of Reduced Legalism (1994)
So Who does use the Court? (1993)
The Costs of Civil Litigation (1993)
The Pace of Litigation in NSW (1991)
Role of Conciliation (1990)
Legal Information
Email Law: a Planning Guide for Delivery of Free Legal Assistance via Email (2001)
Best Practice Guidelines for Australian Legal Web Sites (2000)