access to care: investigating the perception and
TRANSCRIPT

0
A THESIS SUBMITTED TO THE GRADUATE DIVISION OF THE
UNIVERSITY OF HAWAIʻI AT HILO IN PARTIAL FULFILLMENT
OF THE REQUIREMENTS FOR THE DEGREE OF
DOCTOR OF NURSING PRACTICE
MAY 2021
Access to Care: Investigating the Perception and Experience of Native Hawaiian During
COVID-19
By
Kawailehua K. Paikai
Thesis Committee:
Katharyn Daub, EdD, MNEd, RN, CTN-A, Chairperson
Joan Pagan, DNP, MSN. Committee Co-Chairperson
Keywords: social determinants of health, Native Hawaiian(s), access to care, data collection, data
disaggregation, perception+experience

ii
ACKNOWLEDGEMENTS
I would like to acknowledge and thank the following people for their academic and
educational support. Dr. Katharyn Daub (committee chair), Dr. Joan Pagan (committee co-chair),
and Rebecca D’Haem (Academic Support) for your dedication, patience, and continuous
leadership in guiding the completion of this project. Mahalo to the University of Hawaiʻi at Hilo,
Doctor of Nursing Practice Program professors, teachers, and staff for the learning experience that
inspired my passion for rural health and the future of nursing in Hawaiʻi. Lastly, my husband,
Robin Paikai, worked tirelessly to support our family as I pursued my dreams. To my children who
allowed me their time, my parents and siblings who stepped in to assist with childcare, and my
mom Sandradee Hopkins always showed up to make sure I could do what I needed to succeed in
this program.

iii
ABSTRACT
Native Hawaiian data collection and dissemination continue to be underrepresented and
often inaccurate. While there is progress in how the government collects data on Native
Hawaiian Pacific Islander (NHPI) populations, there is still a lack of accurate and reliable health
data to assess access to care and healthcare utilization in the Native Hawaiian community. The
COVID-19 pandemic exposed the need for data disaggregation and appropriate funding for
Native Hawaiians and the organizations that serve them. Native Hawaiian health outcomes have
been highly affected by the pandemic, and there is limited data to address access to care and
health inequities. This project's scope is to pilot a screening tool to collect and analyze data from
the Native Hawaiian population regarding their perception and experiences to access care during
the COVID-19 pandemic.
Keywords: social determinants of health, Native Hawaiian(s), access to care, data collection, data
disaggregation, perception+experience,

iv
TABLE OF CONTENTS
ACKNOWLEDGEMENT...............................................................................................................ii
ABSTRACT...................................................................................................................................iii
TABLE OF CONTENTS…………………………………………………………………………iv
APPENDIX………………………………………………………………………………………..v
LIST OF FIGURES AND GRAPHS……………………………………………………………..vi
1 CHAPTER 1: INTRODUCTION........................................................................................7
1.1 Problem Statement.....................................................................................................................7
1.2 Significance to Population Health in Rural Communities.......................................................10
1.4 Aims and Objectives................................................................................................................10
1.5 Expected Outcomes.................................................................................................................12
2 CHAPTER 2: BACKGROUND…………………………………………………………13
2.1 Literature Review.....................................................................................................................14
2.2 Needs Assessment....................................................................................................................14
2.3 Data Collection........................................................................................................................15
2.4 Native Hawaiians.....................................................................................................................17
2.5 Access to Care..........................................................................................................................17
2.6 COVID-19................................................................................................................................19
2.7 Strengths and Weaknesses.......................................................................................................21
2.8 Conceptual Framework............................................................................................................22
2.9 Summary..................................................................................................................................26
3 CHAPTER 3: METHODS.................................................................................................27
3.1 Project Design..........................................................................................................................27
3.2 Participants...............................................................................................................................28
3.3 Methodology............................................................................................................................28
3.4 Protection of Human Subjects.................................................................................................31
3.5 Project Budget and Resources.................................................................................................31
4 CHAPTER 4: RESULTS...................................................................................................33
4.1 Data Collection........................................................................................................................33
4.2 Results......................................................................................................................................33
5 CHAPTER 5: DISCUSSION.............................................................................................53
5.1 Data Synthesis..........................................................................................................................53
5.2 Project Strengths and Limitations............................................................................................53
5.3 Implications for Practice……………………………………………………………………..54
5.4 Dissemination of Information..................................................................................................54
5.5 Conclusion...............................................................................................................................55
References......................................................................................................................................56

v
APPENDIX: PROJECT TIMELINE.............................................................................................61
APPENDIX B: NATIVE HAWAIIAN RECRUITMENT E-MAIL.............................................62
APPENDIX C: CONSENT FORM…...........................................................................................63
APPENDIX D: CITI TRAINING…………….……………………………………………….....65
APPENDIX E: SURVEY QUESTIONS.......................................................................................66
APPENDIX F: PROJECT FLYER…............................................................................................72
APPENDIX G: BROCHURE FRONT..........................................................................................73
APPENDIX H: BROCHURE BACK……………………………………………………………74

vi
LIST OF FIGURES AND GRAPHS
2.1 Logic Model.............................................................................................................................22
2.2 Concept Map............................................................................................................................24
2.3 Andersen’s Behavioral Model of Use......................................................................................25
4.1...................................................................................................................................................34
4.2...................................................................................................................................................35
4.3...................................................................................................................................................36
4.4...................................................................................................................................................36
4.5...................................................................................................................................................36
4.6...................................................................................................................................................37
4.7...................................................................................................................................................39
4.8...................................................................................................................................................39
4.9...................................................................................................................................................39
4.10.................................................................................................................................................40
4.11.................................................................................................................................................40
4.12.................................................................................................................................................40
4.13.................................................................................................................................................41
4.14.................................................................................................................................................41
4.15.................................................................................................................................................41
4.16.................................................................................................................................................42
4.17.................................................................................................................................................42
4.18.................................................................................................................................................42
4.19.................................................................................................................................................44
4.20.................................................................................................................................................44
4.21.................................................................................................................................................45
4.22.................................................................................................................................................46
4.23.................................................................................................................................................47
4.24.................................................................................................................................................47
4.25.................................................................................................................................................47
4.26.................................................................................................................................................48
4.27.................................................................................................................................................49
4.28.................................................................................................................................................50
4.29.................................................................................................................................................50
4.30.................................................................................................................................................51
4.32.................................................................................................................................................51

7
Access to Care: Investigating the Perception and Experience of Native Hawaiians During
COVID-19
Chapter 1: Introduction
Introduction
Traditionally, health care systems treat diseases. However, more recently, a shift toward a
different approach to address non-medical and lifestyle factors has become a focus for
collaboration. Specifically referred to as social determinants of health (SDOH): this includes
factors such as transportation, education, health care coverage, health equity, employment,
neighborhoods, and communities (Office of Disease Prevention and Health Promotion [ODPHP],
n.d.). SDOH plays a crucial role in the complexities that affect access to healthcare, health
equity, and health literacy. The underlying environmental, economic, and social risk factors
contributing to poor health outcomes will become opportunities. The health care providers,
health plan payers, policymakers, and health care systems have had to shift their approach to
improve health outcomes and health equity for vulnerable individuals and populations. At the
end of 2019, an outbreak of a novel coronavirus became a worldwide pandemic virus named
SARS-CoV-2 and a disease called COVID-19. The impact of COVID-19 has exposed the
importance of social determinants of health and access to care worldwide. However, COVID-19
has had a tremendous effect throughout the Pacific Islander communities in Hawaiʻi. COVID-19
has exposed an economic instability that has seen changes in access to health care, access to
primary care, health insurance coverage, and health literacy have caused increased difficulties for
individuals attempting to navigate an already complex healthcare system. Native Hawaiians have
seen socioeconomic factors play an essential role in infection and mortality rates.
Problem Statement

8
Minimal data addresses the perception and experiences of Native Hawaiian's access to
care during the SARS-CoV-2 (COVID-19) pandemic. Before the COVID-19 pandemic, it has
been a never-ending battle to ensure that Native Hawaiian public health data is reported both
timely and accurately. There is a need for better data collection methods and analysis to verify
Native Hawaiian information separately from the Pacific Islander and Asian populations. The
CDC revised race standards to identify five categories for a race: American Indian or Alaska
Native, Asian, Black or African American, Native Hawaiian or Other Pacific Islander, and
White. The Native Hawaiian population and communities have a higher likelihood of health
inequities contributing to difficulties in receiving adequate healthcare access (Kaholokula et al.,
2020).
According to the WHO, the definition of health is a state of complete physical, mental,
and social well-being. Social determinants of health are the conditions in which people are born,
grow, work, live, age, and the broader set of forces and systems shaping daily life needs. These
forces and systems include economic policies and procedures, development agendas, social
norms, social policies, and political systems. The idea is that circumstances shape national and
local-global resources, money, and power. According to the Centers for Disease Control, health
has several factors that break down into five broad categories: genetics, environmental and
physical influences, medical care, and social aspects. Social factors influence the health of
people and communities. An individual's social-economic position affects their education,
occupation, and income significantly. Health outcomes are related to social circumstances and
factors such as early childhood development, quality of education, living conditions, access to
health services, and the quality of those services. Factors include the ability to get food, the type

9
of work that someone does, the ability to get a job and keep it, social support, language, literacy,
incarceration, culture, access to cell phones, the internet, and social media.
A growing amount of research shows that addressing social determinants of health is the
primary way Hawaiians can achieve health equity and access to care. Health equity is the
absence of systematic disparities in health between and within social groups that have different
levels of underlying social advantages or disadvantages--that is, different positions in a social
hierarchy (Centers for Disease Control and Prevention, 2019).” The WHO, CDC, The Centers
for Medicare and Medicaid Services (CMS), and the State of Hawaiʻi Medicaid Programs
actively address social determinants of health to help achieve health equity and reduce
disparities. Healthcare organizations continue to ensure that access to health care and primary
care is equitable and culturally competent.
The Commission on Social Determinants of Health, created by the WHO, addresses
social determinants of health worldwide. The Commission guides its work by using three
principles for local communities and nations: improve daily living conditions, tackle the
inequitable distribution of power, money, and resources, and measure and understand the
problem and address the impact of an action. Hospitals and health systems are continually
navigating the changes in the healthcare environment, and with the current pandemic, these
changes can be daily.
Significance to Population Health in Rural Communities
A Public Health Crisis
A pandemic such as COVID-19 can wreak havoc on indigenous communities' health in a
public health crisis. Indigenous communities worldwide are at a disadvantage due to unaddressed
social determinants of health, including health inequities and limited access to care. The
10
difficulties seen in NHPI communities are due to a lack of reported disaggregated data reported
at all levels of government: federal, state, and county on NHPI populations (Samoa et al., 2020).
Census Data
According to the World Population Review, the median age in Hawaiʻi is about 38.5
years of age and has about 49.8% females compared to 50.2% of males. The state comprises a
diverse population of races due in part to foreign laborers working during the mid-1800s. The
racial composition of Hawaiʻi was Asian’s account for 37.79%, Caucasians 24.95%, those with
two or more races are 23.89%, Native Hawaiians at 10.06%, African Americans at 1.83%, and
other races at about 1.23% of the population residing Hawaiʻi. As of 2021, approximately
1,406,430 people are living in Hawaiʻi. Hawaiʻi is the only state where Asians are the largest
ethnic group. The Asian population is primarily Filipino but also includes Japanese, Chinese, and
Koreans. However, a large group of indigenous Native Hawaiians accounts for 6% of the
population. The most likely to be in poverty are Native Hawaiians, with 22.95% who live below
the poverty level (World Population Review, 2021).
The Purpose of the Project
The purpose of the project is to collect accurate and timely data from the Native
Hawaiian population to assess their perception and experiences to access care during COVID-19.
The study results will provide accurate and timely data on Native Hawaiian's access to care
during the COVID-19 pandemic. The data collected will assist community leaders,
policymakers, and researchers understand and address health care disparities that influenced this
population.
Aims and Objectives
Aim #1: Create a survey (tool) questionnaire assessing the effect of the perception and

11
experience of access to care for the Native Hawaiian population during the current
COVID-19 pandemic.
Objective #1: Collect demographic data, including age group, gender, race, language, and
the highest level of education completed.
Objective #2: Assess the perception and experiences of Native Hawaiians related to
COVID-19.
Objective #3: Assess the perception and experiences of Native Hawaiians related to
housing.
Objective #4: Assess the perception and experiences of Native Hawaiians related to
financial resources and healthcare insurance coverage.
Objective #5: Assess the perception and experiences of Native Hawaiians related to
transportation needs.
Objective #6: Assess the perception and experiences of Native Hawaiians related to
access to healthcare services such as a primary care provider, telehealth services, and specialists.
Objective #7: Determine the needs of Native Hawaiians in the community.
Aim #2: Determine how Native Hawaiians perceive and experience their ability to access
healthcare services during the current COVID-19 pandemic.
Objective #1: Identify key stakeholders by obtaining informed consent.
Objective #2: Design survey via Survey Monkey and establish a 30-day timeframe for
dissemination and return.
Objective #3: Distribute the study through e-mail to known Native Hawaiian contacts by
the student investigator and the staff of the Native Hawaiian organization, Papa ʻOla Lōkahi.
Objective #4: Collect fifty survey responses.

12
Objective #5: Determine how Native Hawaiians perceive and experience their ability to
access healthcare services during the COVID-19 pandemic.
Expected Outcomes
The overarching goal of the project is to collect Native Hawaiian data on access to care
during COVID-19. In turn, bringing awareness to the needs of Native Hawaiians to inform and
improve data collection specific to this population. The research question is, “does timely and
accurate data collection on access to care during COVID-19 bring awareness to the needs of
Native Hawaiians?” The expected outcome is that, yes, timely and accurate data collection does
bring awareness to the needs of this population. In addition, the collected data specifically came
from those who identify as Native Hawaiian. The data will separate Native Hawaiians from
Pacific Islanders or Asians who conform to Native Hawaiian and Pacific Islanders (NHPI). The
population impact is that the data collection creates an opportunity for community leaders and
organizations to utilize the data to advocate for policy change and to ensure that data is analyzed
and reported to show racial and ethnic diversity between Pacific Islander communities. Native
Hawaiians may receive appropriate funding for public programs, have access to resources and
services and address the specific health needs of this population.
13
Chapter 2: Background
Background
The Centers for Disease Control and Prevention (CDC) determined insufficient data
collection for Native Hawaiians and Pacific Islanders (NHPI). According to the 2010 U.S.
Census, approximately 1.2 million people identified as NHPI, and fifty-two percent (52%) live in
Hawaiʻi and California. The Post Enumeration Survey results in 2000 and 2010 show that
historically there are barriers in collecting data from this population due to distrust of
government or language barriers. Every ten years, a mandated census is written into the U.S.
Constitution to help allocate billions of dollars in federal funds for public services such as
healthcare (United States Census Bureau, n.d.)
According to the World Health Organization (WHO), data collection is “defined as the
ongoing systemic collection, analysis, and interpretation of health data necessary for designing,
implementing, and evaluating public health programs (World Health Organization [WHO], n.d.).
In 2013, because of the 2010 U.S. Census, the U.S. Department of Health and Human Services
and the Centers for Disease Control and Prevention launched a project to improve data collection
for the NHPI population. The National Health Interview Survey collected the information
conducted by the CDC’s National Center for Health Statistics. The project was a significant
milestone in magnifying data collection for underrepresented minority populations and exposing
the Native Hawaiian and Pacific Islander communities (Centers for Disease Control and
Prevention [CDC], 2014). While there is progress in how the government collects data on NHPI
populations, there is still a lack of accurate and reliable health data to assess access to care and
healthcare utilization in general, but even more so during a pandemic. Native Hawaiian health
outcomes have been highly affected in the current pandemic.

14
Literature Review
A review of the literature was completed to have an increased understanding of the
current evidence base (E.B.) information and knowledge regarding COVID-19, Native Hawaiian
data collection, disaggregated data, access to care, and health inequities. A review of the
literature was done through CINAHL, EBSCO, Medline, Google Scholar, and PubMed with
searched keywords such as “social determinants of health,” “Native Hawaiian,” “access to care,”
“health inequities,” and “perception+experience.” Also searched for information containing
“data collection,” COVID-19,” and “data disaggregation.” The search included full-text journal
articles, evidence-based articles, and scholarly peer-reviewed papers published within five years.
The literature review articles include published dates from 2015-2020. The research methods
used a demographic survey, literature review, community needs assessment, and distribution and
data analysis. However, for inclusion in this literature review, the criteria included data
collection, Native Hawaiians, access to care, and health inequities.
Needs Assessment
For the development of this Performance Improvement Project, a community needs
assessment was conducted by reviewing the Native Hawaiian and Pacific Islander (NHPI)
National Health Interview Survey (NHIS) and completing a literature review on Native
Hawaiians and access to care during COVID-19.
Population Identification
The target population is adults 18 years and older who are Native Hawaiian.
Identification of key stakeholders

15
The key stakeholders are Native Hawaiians and Native Hawaiian community leaders and
organizations. Additional stakeholders include Kawailehua Paikai, BSN, RN, Native Hawaiian
Health Scholar (2019 cohort), author; Katharyn Daub, EdD, MNEd, RN, CTN-A, Committee
Chair; Joan Thompson Pagan, Ph.D., MSN, Committee Member; The University of Hawaii at
Hilo, School of Nursing, Doctor of Nursing Practice program; and Papa ‘Ola Lōkahi, Native
Hawaiian Health Care Advocate.
Data Collection
The National Center for Health Statistics at the Centers for Disease Control and
Prevention released data from the Native Hawaiian and Pacific Islander (NHPI) National Health
Interview Survey (NHIS) on March 15, 2015 (Wu & Bakos, 2017). The report acknowledged
that data disaggregation for racial minority groups is essential to unmasking differences in health
disparities, cultures, behavior, and disease management. Here are a few statistics from the NHPI
NHIS; the disaggregated data for Native Hawaiians and health care access pre-pandemic are as
follows: Native Hawaiian adults (67.6%) in comparison to NHPI (58.6%) were more likely to
have private insurance. While (7.7%) of NHPI were likely to delay care due to costs, only (5.8%)
of Native Hawaiians would do the same. The percentage of Native Hawaiian adults (8.2%) with
no usual place of health care was lower than the other Pacific Islander groups (14.3%) (Zelaya et
al., 2017).
COVID-19 has exposed the need for the State of Hawaiʻi to measure, collect, and analyze
data for Native Hawaiians disaggregated as its group. At the beginning of the pandemic, it
appeared that Native Hawaiians were suffering at a very high rate to COVID-19. However, once
the data was disaggregated, the rates were much lower than other Pacific Islander and Asian
groups (Hofschneider, 2021). Population health is currently related to ethnic group or race.

16
Ethnic groups are put into broad categories of race. The CDC revised race standards to identify
five types for data on race (Centers for Disease Control and Prevention, 2015): American Indian
or Alaska Native, Asian, Black or African, Native Hawaiian or Pacific Islander, and White.
Native Hawaiians have often been grouped into the same categories as Asians and Pacific
Islanders. Asians which is a person having origins in any of the original peoples of the Far East,
Southeast Asia, or the Indian Subcontinent including, for example, Cambodia, China, India,
Japan, Korea, Malaysia, Pakistan, the Philippine Islands, Thailand, and Vietnam to name a few.
Native Hawaiian or Other Pacific Islanders are defined as a person having origins in any of the
original peoples of Hawaiʻi, Guam, Samoa, or other Pacific Islands. Policymakers and
researchers have recognized the importance of disaggregating data. They continue to support the
organizations that fight for the cause but progress is slow, and the health inequities in access to
care continue to remain prevalent (Kauh et al., 2021).
A recently released report called “Data Justice” was written in collaboration with the
support of Papa ʻOla Lōkahi and the Hawaiʻi Budget & Policy Center, indicated that “the value
of public programs lies in their ability to help people be as healthy, productive, and self-reliant as
possible (Kauahikaua & Pieper-Jordan, 2021a, p. 5).” The report addressed actions that need to
be taken to address the needs and achieve results for public programming for Native Hawaiians.
Those actions include the following three key steps: “collect and use data to identify needs;
design and evaluate programs; and decide how to spend money on them (Kauahikaua & Pieper-
Jordan, 2021, p. 5).” The report identifies solutions and next steps along with a continued need
for disaggregated data. Additional studies, surveys, data collection, and policy changes at all
levels of government are needed to collect high-quality data that is accurate and timely for all
NHPI populations.
17
Native Hawaiians
According to the Office of Hawaiian Affairs (OHA) data book, the terminology used by
agencies and organizations to distinguish the difference in Hawaiian blood ancestry is as follows.
The term “Native Hawaiian” with a capital “N” refers to persons of Hawaiian ancestry regardless
of blood quantum. The term native Hawaiian with a lower case “n” refers to those with fifty
percent and more blood quantum (Office of Hawaiian Affairs [OHA], 2019, “Native Hawaiian”
versus “native Hawaiian" section). For the purposes of this project, the Hawaiʻi Revised Statutes
[Chapter 10] Office of Hawaiian Affairs [§10-2] Definitions will be used to distinguish the
population being addressed. “Hawaiian” means any descendant of the aboriginal peoples
inhabiting the Hawaiian Islands which exercised sovereignty and subsisted in the Hawaiian
Islands in 1778, and which peoples thereafter have continued to reside in Hawaii; “native
Hawaiian” means any descendant of not less than one-half part of the races inhabiting the
Hawaiian Islands previous to 1778, as defined by the Hawaiian Homes Commission Act, 1920,
as amended; provided that the term identically refers to the descendants of such blood quantum
of such aboriginal peoples which exercised sovereignty and subsisted in the Hawaiian Islands in
1778 and which peoples thereafter continued to reside in Hawaii (OHA, 2019, Hawai‘i State,
Office of Hawaiian Affairs (OHA) section).”
Access to Care and Health Inequities
Access to care and health inequities have been a global issue between indigenous and
non-indigenous populations. They are often seen as an unfair disadvantage and should be a
fundamental right to health. A key determinant of inequitable health is believed to be racism.
Racism is known to influence healthcare, healthcare professionals, and medical education.

18
Racism is defined as an organization that distributes power, resources, and opportunities
unequally and is dated back to colonization (Jones et al., 2019).
The Native Hawaiian population has experienced a history of trauma not limited to social
and health disparities. Native Hawaiians have the shortest lifespan and highest mortality rates
compared to the total population in Hawaiʻi (Mokuau et al., 2016). Many Native Hawaiians live
below the poverty level, and therefore experience social-economic factors that are difficult to
navigate without resources and program guidance. According to research, Native Hawaiians are
more likely to work lower-paying jobs, live in more impoverished conditions, and be
incarcerated than other ethnic groups. They also have a genetic predisposition to diabetes,
cardiovascular disease, and obesity (Kaholokula, 2019).
COVID-19
The severe acute respiratory syndrome coronavirus 2 (SARS-CoV-2) was seen in Wuhan,
China, in December 2019. Also known as COVID-19, it has spread rapidly since March 2020
and has not slowed yet. The COVID-19 pandemic has profoundly affected the United States and
minority populations within the United States (Boserup et al., 2020). The pandemic had a
disproportionate impact on disadvantaged people. Americans who tested positive and died of
COVID-19 did so at a higher incident if they were Black, Latino, and Native American. Nearly
30% of COVID-19 cases affected Black Americans in the United States (Thakur et al., 2020). In
Hawaiʻi
Housing factors affected populations with increased COVID-19 incidence rates were
affected by multigenerational living conditions. Essential workers returning home to
multigeneration households also increased the likelihood of spreading COVID-19 to other family
members. The data varied by race, but 13% of NHPI live in multigenerational homes, 9.4% of

19
Asians, 10.3% of Hispanics, and 9.5% of Blacks compared to only 3.7% of non-Hispanic White
households (Raine et al., 2020). There is a high incidence of Native Hawaiians who are homeless
throughout the State of Hawaiʻi.
In the United States, health insurance coverage remains a barrier to healthcare access.
There are still millions of uninsured people even though the Affordable Care Act (ACA) has
increased the number of insured. Even with the expansion of Medicare and Medicaid programs
that provide health insurance at a low cost for lower-income and uninsured Americans, the loss
of employment caused by COVID-19 has significantly impacted individuals (Raine et al., 2020).
Transportation is a barrier to health care access as it depends on whether people live in
urban or rural areas. In the United States, 24% of black households, 17% of Hispanic
households, and 13% of Asian households do not own a vehicle compared to only 7% of White
households (Raine et al., 2020).
An estimated 41% of U.S. adults reported delaying or avoiding seeking medical care due
to COVID-19. Factors that may have contributed to the delay or avoidance of care were likely
due to the lockdowns. However, additional factors also included a concern for increased risk of
exposure to COVID-19, limited options for in-person appointments, and access to telehealth or
in-home health care services (Czeisler et al., 2020).
Telehealth services have increasingly become a common practice during the pandemic.
While there are many benefits that remote medical appointments allow patients to receive from
the comfort of their homes, it is still another barrier to care for the many people who do not have
internet connectivity (Raine et al., 2020). There is a higher likelihood that people who live in
rural areas considered underserved will continue to face this issue as a disparity.

20
Primary Care Providers and specialists are the backbones to efficient health care delivery.
The elderly population has been the most vulnerable throughout the COVID-19 pandemic. The
Native Hawaiian older adult population with chronic health conditions and more inadequate
health habits are at the most significant risk of losing their access to care. Native Hawaiian older
adults are underrepresented as Native Hawaiians comprised 24.3% of the total state population in
2008, but only 12.6% of residents age sixty and above are Native Hawaiian (Ka‘opua et al.,
2011). Health promotion and disease management remain a top priority for Hawaiʻi residents,
primary care providers, and health care specialists.
Strengths and Weaknesses
Strengths-Organizational Support
The strength of this project is that several Native Hawaiian organizations support an
increase in collecting population data. These organizations include but is not limited to the
following: The State of Hawaiʻi Department of Hawaiian Home Lands, Papa ʻOla Lōkahi, The
Queen’s Medical Center, Hawaiian Homestead Associations, Office of Hawaiian Affairs (OHA),
the University of Hawaiʻi System, and The Budget and Policy Counsel.
Gaps/Limitations/Weaknesses
This project's gaps, limitations, and weaknesses are the demographic data, sample size,
and responder bias. NHPI demographic data has limited data available that separates Native
Hawaiians and Pacific Islander groups. Native Hawaiians are underrepresented in research, and
the population has grown at a rate of 40.1% between 2000 and 2010. Many population-based
studies currently aggregate data on NHPI and Asian Americans, and because of this, it may
obscure disparities (Narcisse et al., 2018). With a sample size goal of collecting fifty surveys,
this may not be a large enough sample size compared to the population size. The survey may

21
have responder bias as some respondents may not feel comfortable being truthful or answering
all the questions.
Conceptual Framework
The conceptual frameworks used to guide this project included a logic model (see Figure
2.1), a concept map (see Figure 2.2), and the Andersen Behavioral Model (see Figure 2.3). A
logic model is a planning and evaluation tool. The logic model created for planning and
evaluating this project includes the following four columns: resources and inputs for the
intervention, activities for project implementation, outcomes and goals of the intervention, and
the expected impact of the intervention (see Figure 2.1 for more details).
The committee members' expertise, time, equipment, literature search, Native Hawaiian
participants, and IRB approval are listed in the resources and inputs column. The activities
include developing the access to care survey and recruiting participants to complete the study by
distributing flyers. Additional activities consist of the literature review on access to care,
COVID-19, Native Hawaiians, health inequities, and data collection. The third column of outputs
and outcomes consists of obtaining informed consent from participants and completing the
questionnaire via Survey Monkey. The questionnaire will collect accurate data on access to care
during COVID-19 for Native Hawaiians with the possibility of exposing health inequities. The
fourth and final column is the impact of the logic model. The project's goal is to meet the project
time frame, disseminate the data by developing a brochure for organizations that support Native
Hawaiians, and have the option to use the collected data for government policy, community
organizations, and the appropriation of funding and resources for Native Hawaiians.
Figure 2.1
Logic Model

22
Figure 2.1. Logic model for Access to Care: Investigating the Perception and Experience of
Native Hawaiians during COVID-19. Diagram created by Kawailehua Paikai, BSN, RN (2021).
The concept map created shows that to ensure participation to collect timely and accurate
data from the Native Hawaiian population; there must be trust. When building trust and
establishing relationships, factors to consider include culture, family, community resources,
government, health care providers, and health care insurers (see Figure 2.2 for more details). The
creator of the concept map shows how Native Hawaiian Data Collection is at the center of eight
factors that contribute to completing the task of collecting the surveys back. Access to care
during the COVID-19 pandemic is at the top as it is the type of data to be collected. To the right
of that going clockwise, additional factors include trust and community resources. To the left of
access to care are culture and family. At the bottom of the concept map are the government,

23
health care providers, and health care insurers, as they also play a role in Native Hawaiian Data
Collection.
Figure 2.2
Concept Map
Figure 2.2 Concept map for Access to Care: Investigating the Perception and Experience of
Native Hawaiians during COVID-19. Diagram created by Kawailehua Paikai, BSN, RN (2021).
The model guiding this project is The Behavioral Model of Health Services Use. The
model of health services’ use initially developed in the late 1960s and originally focused on the
family as the unit. According to Ronald Andersen, he shifted the focus toward the individual due
to difficulty developing measures at the family level. Ronald Andersen developed the Behavioral
Model of Health Services Use to improve understanding of how access to health care services,

24
support the development of interventions and enhance racial and ethnic disparities in access to
quality health care. The model examines the relationships between predisposing, enabling, and
needs factors that lead to health care services utilization (Andersen, 1995). The external
environmental factors also pose an issue for health care services utilization. A primary goal of
the model was to measure access to health care. There is a realization that access and having the
resources available increased the likelihood of use. The word “access” determined the actual use
of a service.
The creator of the diagram may use the foundation of Andersen’s Behavioral Model of
Health Services Use to include population-based issues present in the Native Hawaiian culture
and community. The predisposing factors seen within the Native Hawaiian population include
but are not limited to the following: demographics, Native Hawaiian data collection, historical
trauma, chronic disease, health inequities, and racial injustices. Knowledge deficits influence the
enabling factors, housing issues, lack of transportation, financial resources, and adequate access
to a primary care provider, telehealth services, specialists, and health insurance coverage. The
needs factors include access to care, available primary care providers, self-reported or perceived
health, and community resources. The fourth factor is the relationship of the external
environment. In 2020, an unknown external variant called COVID-19 emerged as a global
pandemic. The already existing external environmental factors are social supports, cultural
beliefs, government restrictions, and federal and state funding.
Figure 2.3
Andersen’s Behavioral Model of Health Services Use

25
Figure 2.3. The Andersen’s Behavioral Model for Access to Care: Investigating the Perception
and Experience of Native Hawaiians during COVID-19. Diagram created by Kawailehua Paikai,
BSN, RN (2021) to illustrate Andersen’s Behavioral Model of Health Services Use.
Summary
In summary, health inequities and access to care are evident in differences in social
factors such as education, employment status, income levels, gender, and ethnicity. It has been
shown in various countries that low, middle, or high income affects health, but people who are at
the highest risk of poor health are individuals who are living on the lower socioeconomic scale.
Seabrook & Avison (2012) state that socioeconomic status is a reliable predictor of health

26
disparities. People who live in rural communities or are of a lower-income bracket are more
likely to experience greater exposure to stress, poor living conditions, low job security, and face
financial difficulties than their counterparts from a higher socioeconomic status would. Those
who have a lower income also tend to be more likely to engage in riskier behavior such as
smoking and drug use. Health disparities are also related to geographical similarities. Those who
are lower-income and living in a rural community are more likely to be obese and engage in less
physical activity leading to additional health issues. Pathways are known to change over time.
People who have access to critical resources such as knowledge, money, power, prestige,
and beneficial social connections have a higher likelihood of accessing care because they have
access to the resources available. Those with access to resources are more likely to avoid or
delay diseases and seek help and education early to prevent disease progression. A person can
benefit from better health conditions by knowing and having the ability to help lead a healthier
lifestyle. By engaging Native Hawaiians in community-based participatory research (CBPR), we
can continue to improve Native Hawaiian health outcomes, reduce disparities, and address
continued study in minority populations (Fong et al., 2003). Recommendations to engage Native
Hawaiians in CBPR are to communicate openly and honestly, devote the time, support
indigenous and minority researchers, and balance community and academic benefits (Townsend
et al., 2015).

27
Chapter 3: Methods
The project was a qualitative designed quality improvement project that implemented a
survey-based study that involved a literature review, data collection, and analysis. The design
was a cross-sectional study that collected non-experimental descriptive data. The evaluation of
the data that was collected via Survey Monkey analyzed the statistical data to identify any
patterns or trends in the responses.
Project Design
A tool (survey) was created as a questionnaire that contained six demographic questions,
twenty-six, yes or no, multiple-choice, or fill-in-the-blanks survey responses. The survey was
distributed online through an e-mail sent to known Native Hawaiian contacts by the student
investigator and Papa ‘Ola Lōkahi staff. The e-mail included the study flyer with the Survey
Monkey link to the questionnaire and the approved consent to participate form. The quality
improvement project was piloted using a small sample size goal of fifty participants. Andersen’s
Behavioral Model of Health Services Use was used to guide the development of the aims and
objectives, and methodology.
The project administered a survey to adults eighteen and older who identified as Native
Hawaiian. The performance improvement project collected data that pertained directly to the
Native Hawaiian population and their perception and experiences with their access to healthcare
services during the COVID-19 pandemic in 2020. The IMPACT tool was designed to know how
a consumer of healthcare services perceives their accessibility to healthcare services during the
COVID-19 pandemic. The Native Hawaiian population's feedback and participation are essential
to improve how healthcare services are provided based on their own experience rather than
from those who provide their care.

28
Participants
A convenience sample of fifty participants was recruited over a one-month timeline to
complete the survey on the perception and experiences of Native Hawaiians' access to care
during COVID-19. Participants chose to participate voluntarily and at no cost or reimbursement.
The inclusion criteria required participants to live in Hawaiʻi, to have a Native Hawaiian blood
quantum, and to be at least eighteen years old to participate. An informed consent form was
distributed to all participants before completing the survey.
Methodology
Aim #1: Create a survey (tool) questionnaire assessing the effect of the perception and
experience of access to care for the Native Hawaiian population during the current
COVID-19 pandemic.
Objective #1: Collect demographic data, including age group, gender, race, language, and
the highest level of education completed.
Methods: An online survey via Survey Monkey was e-mailed to known Native Hawaiian
contacts of the student investigator and the staff of Papa ʻOla Lōkahi. The survey had six
demographic questions.
Objective #2: Assess the perception and experiences of Native Hawaiians related to
COVID-19.
Methods: An online survey via Survey Monkey was e-mailed to known Native Hawaiian
contacts of the student investigator and the staff of Papa ʻOla Lōkahi. The survey had twelve
questions regarding the perception and experiences of access to care for Native Hawaiian
participants during COVID-19.
29
Objective #3: Assess the perception and experiences of Native Hawaiians related to
housing.
Methods: An online survey via Survey Monkey was e-mailed to known Native Hawaiian
contacts of the student investigator and the staff of Papa ʻOla Lōkahi. The survey had five
questions related to housing.
Objective #4: Assess the perception and experiences of Native Hawaiians related to
financial resources and healthcare insurance coverage.
Methods: An online survey via Survey Monkey was e-mailed to known Native Hawaiian
contacts of the student investigator and the staff of Papa ʻOla Lōkahi. The survey had two
questions related to employment and healthcare insurance coverage.
Objective #5: Assess the perception and experiences of Native Hawaiians related to
transportation needs.
Methods: An online survey via Survey Monkey was e-mailed to known Native Hawaiian
contacts of the student investigator and the staff of Papa ʻOla Lōkahi. The survey had one
question related to transportation.
Objective #6: Assess the perception and experiences of Native Hawaiians related to
access to healthcare services such as a primary care provider, telehealth services, and specialists.
Methods: An online survey via Survey Monkey was e-mailed to known Native Hawaiian
contacts of the student investigator and the staff of Papa ʻOla Lōkahi. The survey had six
questions about access to a primary care provider, the internet, and a specialist.
Objective #7: Determine the needs of Native Hawaiians in the community.
Methods: A comprehensive literature review was performed over the year as the data
related to COVID-19 was constantly changing from March 2020 to the current. A total of thirty-

30
six evidence-based articles were reviewed, and twenty-one were selected and demonstrated
significance to the key terms.
Aim #2: Determine how Native Hawaiians perceive and experience their ability to access
healthcare services during the current COVID-19 pandemic.
Objective #1: Identify key stakeholders by obtaining informed consent.
Methods: The key stakeholders were identified in Chapter 2 of the performance
improvement project.
Objective #2: Design survey via Survey Monkey and establish a thirty-day timeframe for
dissemination and return.
Methods: A thirty-day timeline (see Appendix for project timeline) was set for survey
distribution, and completion was set from February 20, 2020-March 21, 2020.
Objective #3: Distribute survey through e-mail to known Native Hawaiian contacts by
student investigator and the staff of the Native Hawaiian organization, Papa ʻOla Lōkahi.
Methods: The surveys were distributed via a recruitment e-mail (see Appendix B) on
February 20, 2020. The e-mail included the consent form (see Appendix C) and the study flyer.
A courtesy e-mail was resent two weeks later to remind any participants who may not have
completed the survey.
Objective #4: Collect fifty survey responses.
Methods: The surveys were distributed and collected from February 20, 2020, to March
17, 2020. Fifty surveys were completed and collected; however, two surveys were discarded as
non-Native Hawaiian participants answered them.
Objective #5: Determine how Native Hawaiians perceive and experience their ability to
access healthcare services during the COVID-19 pandemic.

31
Methods: All data collected from the completed questionnaires were collected throughout
the twenty-six days and stored in a password-protected account registered to the student
investigator through Survey Monkey. The data collected was downloaded to a Microsoft Excel
spreadsheet stored on a password-protected computer owned by the student investigator.
Descriptive statistics were used to analyze and evaluate the data to identify and summarize the
perception and experiences of Native Hawaiians during COVID-19. The data were assessed for
validity and quality then disseminated via a brochure for distribution to Native Hawaiian
organizations to utilize as they see fit.
Protection of Human Subjects
Participants that completed the questionnaire did so at their free will. Participants had the option
to withdraw from completing the survey at any time. All participants' identifiable data was
protected during the study and was not collected when answering the questionnaire. The
questionnaire answers were stored on a password-protected account in Survey Monkey on a
password-protected computer. The Collaborative Institutional Training Initiative (CITI)
certification requirement was completed on 8/31/2019 (see Appendix D). The project was
submitted to the University of Hawaiʻi International Review Board (IRB) before implementation.
Consent forms were sent to each participant, explaining and detailing the project along with the
option to participate.
Project Budget and Resources
A project budget was supplied by the student investigator for the costs associated with a
subscription to Survey Monkey. The subscription was for three months, and the price was $234.
Although the survey goal was met in less than the one-month timeline goal, a time before
distribution and completion of the survey and time for the data to be reviewed and downloaded

32
accurately were allotted in the total three-month subscription. Although no funding was
requested for the project, the resources needed included the following: cooperation of the
organization assisting in distributing the survey, the participants' cooperation in completing the
study, and the chair and co-chair's expertise. There was no financial incentive given to any of the
Native Hawaiian participants to complete the questionnaire.

33
Chapter 4: Results
Data Collection
The project obtained IRB approval with exempt status on January 22, 2021. The student
investigator developed the questionnaire via Survey Monkey and made some changes in the
questions initially submitted for review. A modification request was presented with the changes,
and the final IRB approval was granted on February 19, 2021. The recruitment e-mail, along
with the study flyer and consent, was sent on February 20, 2021, and the survey link remained
open for twenty-six days until the goal was met and the fiftieth survey was received on March
17, 2021. The recruiting sample size of fifty participants was satisfied, but only forty-eight were
used as the actual sample size after review.
Results
Aim #1: Create a survey (tool) questionnaire (see Appendix E) assessing the effect of the
perception and experience of access to care for the Native Hawaiian population during
the current COVID-19 pandemic.
Objective #1: Collect demographic data, including age group, gender, race, language, and
the highest level of education completed.
The demographic information of the forty-eight participants included age, gender, Native
Hawaiian, Native Hawaiian blood quantum, language, and educational background.
The age of participants was 18-24, which included two individuals (4.17%), ages 25-34 included
nine individuals (18.75%), ages 35-44 included twenty-one individuals (43.75%), ages 45-54
included six individuals (12.5%), ages 55-64 had five individuals (10.42%), and ages 65 and
older included five individuals (10.42%). See Graph 4.1 below.
Graph 4.1

34
Demographics: In what age group are you?
The gender of the participants included thirteen males (27.08%) and thirty-five females
(72.92%). See Graph 4.2 below.
Graph 4.2
Demographics: Gender
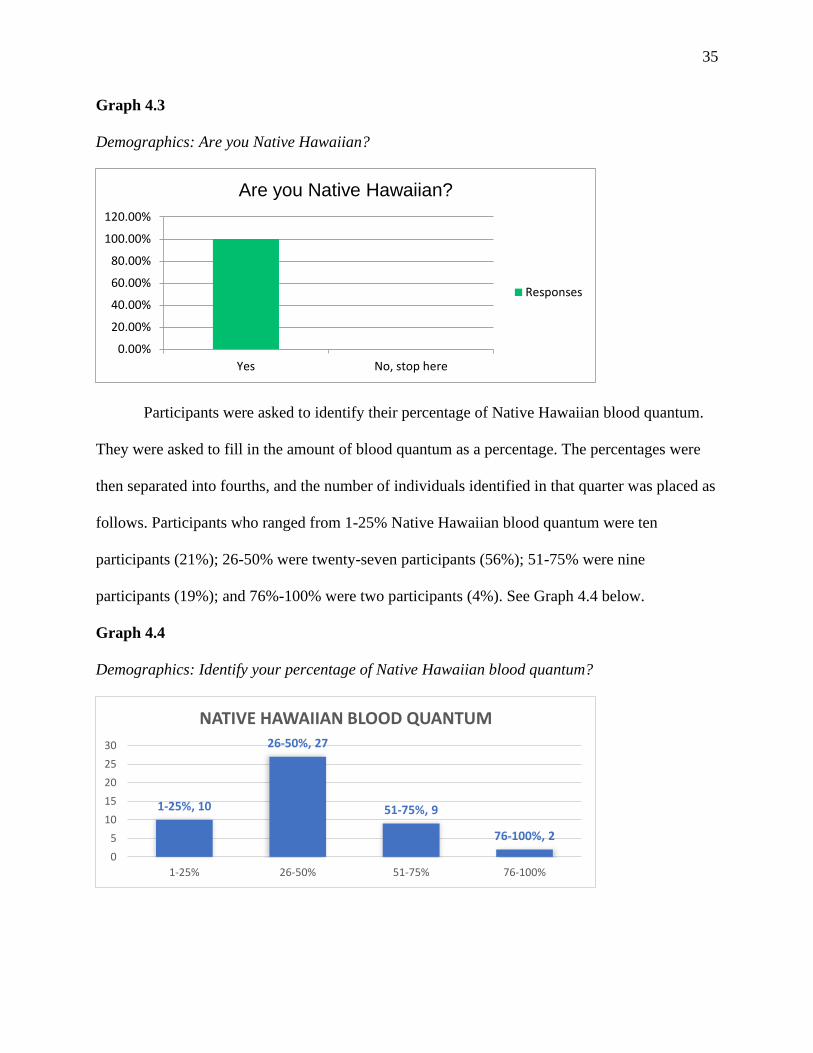
A total of fifty surveys were collected and (n=48) identified as Native Hawaiian. Two of
the surveys were answered by non-Native Hawaiians. However, the flyer (see Appendix F)
specified Native Hawaiian, those were discarded, and the remaining questions were based on
forty-eight participants' answers. All questionnaires used in the data collection for this project
asked, “are you Native Hawaiian?” identified as yes (100%) they are Native Hawaiian. See
Graph 4.3 below.
Under18
18-24 25-34 35-44 45-54 55-64 65+
0.00%
10.00%
20.00%
30.00%
40.00%
50.00%
In what age group are you?
Responses
Male Female Self-describe
0.00%
20.00%
40.00%
60.00%
80.00%
Gender
Responses
35
Graph 4.3
Demographics: Are you Native Hawaiian?
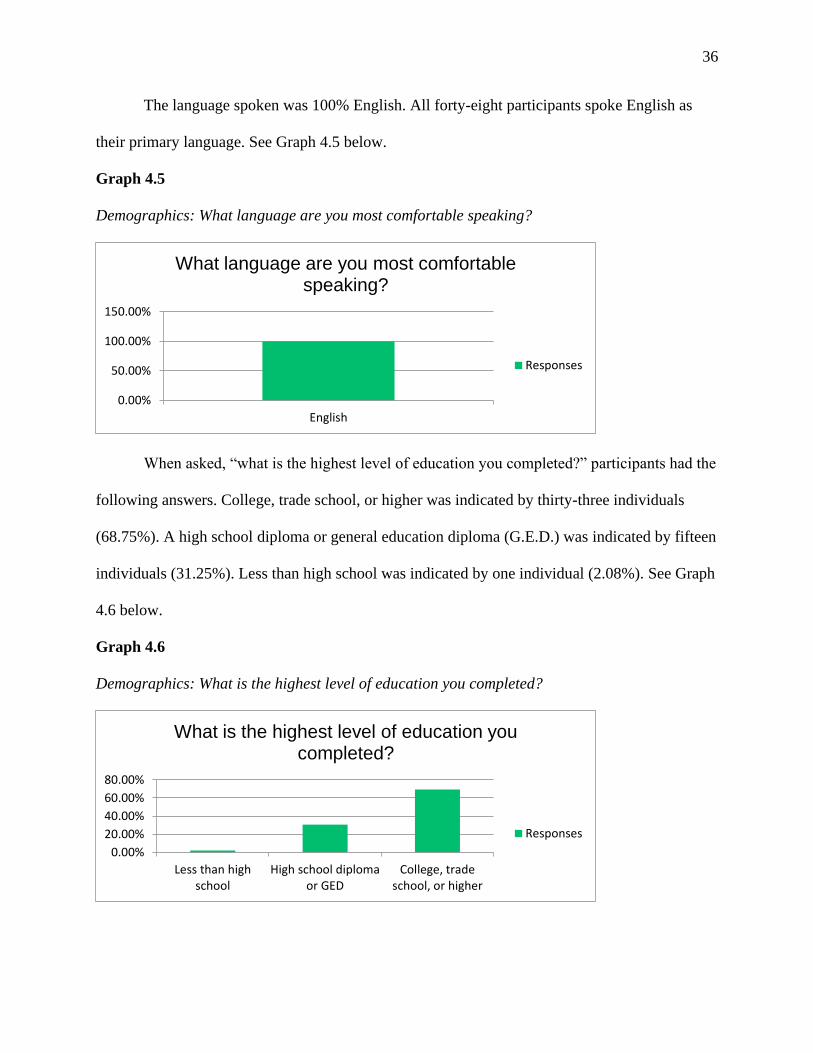
Participants were asked to identify their percentage of Native Hawaiian blood quantum.
They were asked to fill in the amount of blood quantum as a percentage. The percentages were
then separated into fourths, and the number of individuals identified in that quarter was placed as
follows. Participants who ranged from 1-25% Native Hawaiian blood quantum were ten
participants (21%); 26-50% were twenty-seven participants (56%); 51-75% were nine
participants (19%); and 76%-100% were two participants (4%). See Graph 4.4 below.
Graph 4.4
Demographics: Identify your percentage of Native Hawaiian blood quantum?
Yes No, stop here
0.00%
20.00%
40.00%
60.00%
80.00%
100.00%
120.00%
Are you Native Hawaiian?
Responses
1-25%, 10
26-50%, 27
51-75%, 9
76-100%, 2
1-25% 26-50% 51-75% 76-100%
0
5
10
15
20
25
30
NATIVE HAWAIIAN BLOOD QUANTUM
36
The language spoken was 100% English. All forty-eight participants spoke English as
their primary language. See Graph 4.5 below.
Graph 4.5
Demographics: What language are you most comfortable speaking?
When asked, “what is the highest level of education you completed?” participants had the
following answers. College, trade school, or higher was indicated by thirty-three individuals
(68.75%). A high school diploma or general education diploma (G.E.D.) was indicated by fifteen
individuals (31.25%). Less than high school was indicated by one individual (2.08%). See Graph
4.6 below.
Graph 4.6
Demographics: What is the highest level of education you completed?
English
0.00%
50.00%
100.00%
150.00%
What language are you most comfortable speaking?
Responses
Less than highschool
High school diplomaor GED
College, tradeschool, or higher
0.00%
20.00%
40.00%
60.00%
80.00%
What is the highest level of education you completed?
Responses

37
Objective #2: Assess the perception and experiences of Native Hawaiians related to
COVID-19.
The participants were surveyed on the following questions regarding access to care
during COVID-19. In Graph 4.7, participants were asked a Likert-scale style question, “I feel the
pandemic has affected my health.” Eight individuals strongly agreed (16.67%); thirteen agreed
(27.08%); twenty-one neither agrees nor disagree (43.75%); two disagreed (4.17%), and four
strongly disagreed (8.33%). In Graph 4.8, participants were asked, “if I wanted to be tested for
COVID-19, I had no issues doing so.” Eighteen individuals strongly agreed (37.5%); seventeen
agreed (35.42%); nine neither agreed nor disagreed (18.75%); three disagreed (6.25%), and one
strongly disagreed (2.08%).
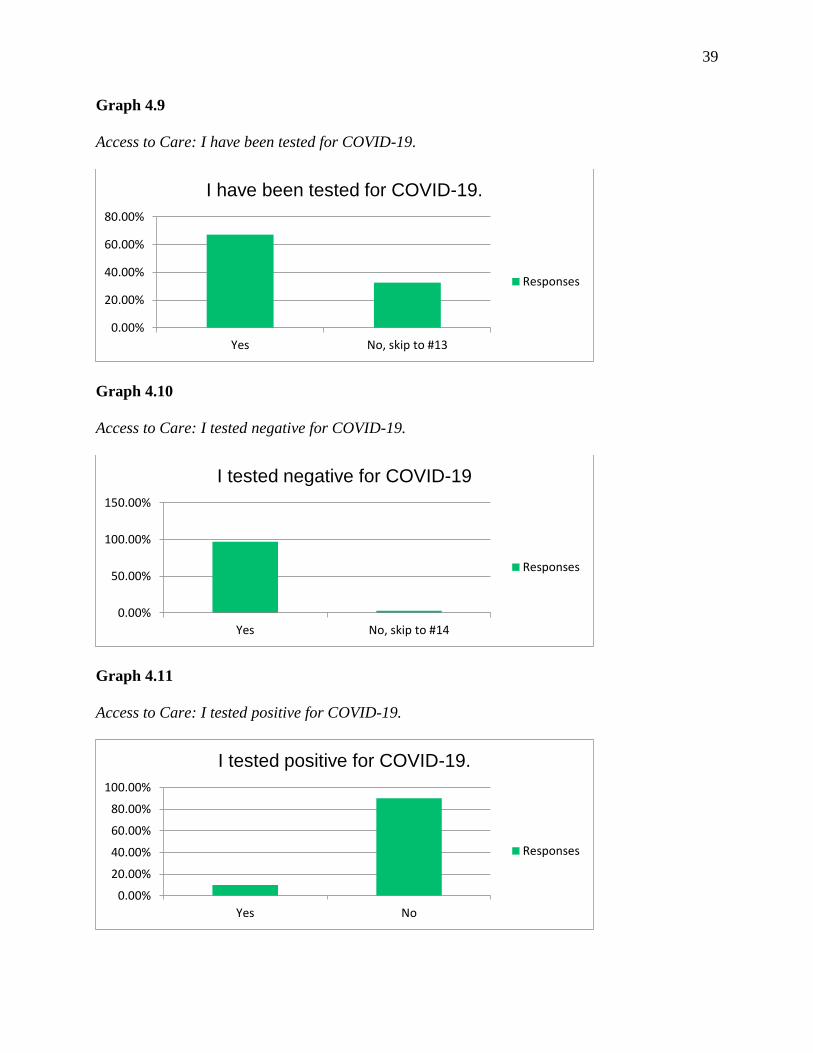
In Graph 4.9 through Graph 4.18, participants were asked to answer with yes or no
responses. Graph 4.9 stated, “I have been tested for COVID-19.” Thirty-three individuals
answered “yes,” (68.75%), and fifteen answered “no” (31.25%). Graph 4.10 stated, “I tested
negative for COVID-19.” Thirty-two answered “yes,” (96.97%), one answered “no,” (3.03%),
and fifteen individuals did not answer. Graph 4.11 stated, “I tested positive for COVID-19.”
Three answered, “yes,” (10%), twenty-seven answered, “no,” (90%), and eighteen individuals
did not answer. Graph 4.12 stated, “I have been hospitalized due to COVID-19.” Thirty
individuals responded, “no” (100%), eighteen individuals skipped this question. Graph 4.13
stated, “I wanted to be tested for COVID-19 and was unable to obtain a test.” Two individuals
answered, “yes,” (4.55%); forty-two answered, “no,” and four did not answer. In Graph 4.14,
participants answered the statement, “I have been exposed to COVID-19 by close contact.”
Thirteen individuals answered “yes” (27.08%), and thirty-five responded “no” (72.92%). In
Graph 4.15, “I know someone who has been affected by COVID-19,” forty-four individuals

38
answered “yes,” (91.67%), and four individuals said “no” (8.33%). Graph 4.16 asked participants
to answer the statement, “I have experienced difficulty obtaining a COVID-19 test.” Eleven
responded, “none of the above” (22.92%); four said “yes” (8.33%), and thirty-three said “no”
(68.75%). In Graph 4.17, participants were asked, “I have received some kind of healthcare
service during the COVID-19 pandemic.” Thirty-four individuals responded, “yes” (70.83%) and
fourteen “no” (29.17%). Lastly, Graph 4.18 stated, “I felt comfortable seeking care during the
pandemic.” Thirty-three answered “yes,” (68.75%) and fifteen “no” (31.25%). See Graphs 4.7-
4.18 below.
Graph 4.7
Access to Care: I feel the pandemic has affected my health.
Graph 4.8
Access to Care: If I wanted to be tested for COVID-19, I had no issues doing so.
Strongly agree Agree Neither agreenor disagree
Disagree Stronglydisagree
0.00%
10.00%
20.00%
30.00%
40.00%
50.00%
I feel the pandemic has affected my health.
Responses
Strongly agree Agree Neither agreenor disagree
Disagree Stronglydisagree
0.00%
10.00%
20.00%
30.00%
40.00%
If I wanted to be tested for COVID-19 I had no issues doing so.
Responses
39
Graph 4.9
Access to Care: I have been tested for COVID-19.
Graph 4.10
Access to Care: I tested negative for COVID-19.
Graph 4.11
Access to Care: I tested positive for COVID-19.
Yes No, skip to #13
0.00%
20.00%
40.00%
60.00%
80.00%
I have been tested for COVID-19.
Responses
Yes No, skip to #14
0.00%
50.00%
100.00%
150.00%
I tested negative for COVID-19
Responses
Yes No
0.00%
20.00%
40.00%
60.00%
80.00%
100.00%
I tested positive for COVID-19.
Responses

40
Graph 4.12
Access to Care: I have been hospitalized due to COVID-19.
Graph 4.13
Access to Care: I wanted to be tested for COVID-19 and was unable to obtain a test.
Graph 4.14
Access to Care: I have been exposed to COVID-19 by close contact.
Yes No
0.00%
20.00%
40.00%
60.00%
80.00%
100.00%
120.00%
I have been hospitalized due to COVID-19.
Responses
Yes No
0.00%
50.00%
100.00%
150.00%
I wanted to be tested for COVID-19 and was unable to obtain a test.
Responses
Yes No
0.00%
20.00%
40.00%
60.00%
80.00%
I have been exposed to COVID-19 by a close contact.
Responses

41
Graph 4.15
Access to Care: I know someone who has been affected by COVID-19.
Graph 4.16
Access to Care: I have experienced difficulty obtaining a COVID-19 test.
Graph 4.17
Access to Care: I have received some kind of healthcare service during the COVID-19 pandemic
Yes No
0.00%
50.00%
100.00%
I know someone who has been affected by COVID-19.
Responses
None of the above Yes No
0.00%
20.00%
40.00%
60.00%
80.00%
I have experienced difficulty obtaining a COVID-19 test.
Responses
Yes No
0.00%
100.00%
I have received some kind of healthcare service during the COVID-19 pandemic
(telehealth, face to face appointments, urgent care, emergency room services, etc.).
Responses

42
Graph 4.18
Access to Care: I felt comfortable seeking care during the pandemic.
Objective #3: Assess the perception and experiences of Native Hawaiians related to
housing.
Participants were asked five questions about housing. In Graphs 4.19-4.23, a mix of yes
or no, open-ended questions, and multiple-choice questions were answered. In Graph 4.19,
participants were asked, “how many people currently live with you, including yourself?” The
answers ranged from one to ten per household. Eight individuals lived alone (17%); four lived in
a family of two (8%); twelve lived in a home of three (25%); four lived with a total of four (8%);
eleven lived with five individuals (23%); three lived in households of six and seven (6%); one
lived with a family of eight (2%), and two lived in a home of ten (4%). In Graph 4.20a, two pie
charts were created utilizing the data from the question, “which zip code do you live in?” The
first pie chart indicated zip-codes, as seen in Graph 4.20b, and the second pie chart showed a
breakdown by island. Thirty-eight individuals were from ‘Oahu (81%); six were from Hawaiʻi
Island (11%); and four from the island of Mauʻi (8%). Graph 4.21 asked participants, “what is
your current housing situation?” Twenty-one said they are homeowners (43.75%); eighteen are
renters (37.5%); none identified as homeless or living in a shelter; seven live with family or
friends (14.58%), and two answered “other” (4.17%). Graph 4.22 asked, “are you worried about
Yes No
0.00%
20.00%
40.00%
60.00%
80.00%
I felt comfortable seeking care during the pandemic.
Responses

43
losing your housing?” Eight participants answered “yes” (16.67%), and forty said “no”
(83.33%). In Graph 4.23, participants were asked, “were you unable to pay your mortgage or rent
on time.” Four said “yes” (8.33%); thirty-nine said “no” (81.25%); five answered as “not
applicable” (10.42%). See Graphs 4.19-4.23 below.
Graph 4.19
Related to Housing: How many people currently live with you?
Graph 4.20a and b
Related to Housing: Which zip-code do you live in?
117%
29%
325%4
8%
523%
66%
76%
82%
90%
104%
HOUSEHOLD SIZE

44
a.
b.
Graph 4.21
Related to Housing: What is your current housing situation?
967346%n-3
967122%n-1
9674419%n-9
9670710%n-5
967928%n-4
967912%n-1
967322%
967902%
968152%
967974%n-2
967402%
967932%
967822%
968174%n-2
967208%n-4
968264%n-2
967068%n-4
968224%n-2
967592%n-1
968134%n-2
Zip Codes
96734
96712
96744
96707
96792
96791
96732
96790
96815
96797
96740
96793
96782
81%
8%11%
By Island
Oahu
Maui
Hawaiʻi

45
Graph 4.22
Related to Housing: Are you worried about losing your current housing?
Graph 4.23
Related to Housing: Were you unable to pay your mortgage or rent on time?
Objective #4: Assess the perception and experiences of Native Hawaiians related to
financial resources and healthcare insurance coverage.
Homeowner Renter Homeless orin a shelter
Living withfriends or
family
Other (pleasespecify)
0.00%10.00%20.00%30.00%40.00%50.00%
What is your current housing situation?
Responses
Yes No
0.00%
20.00%
40.00%
60.00%
80.00%
100.00%
Are you worried about losing your housing?
Responses
Not Applicable Yes No
0.00%
50.00%
100.00%
Were you unable to pay your mortgage or rent on time?
Responses
46
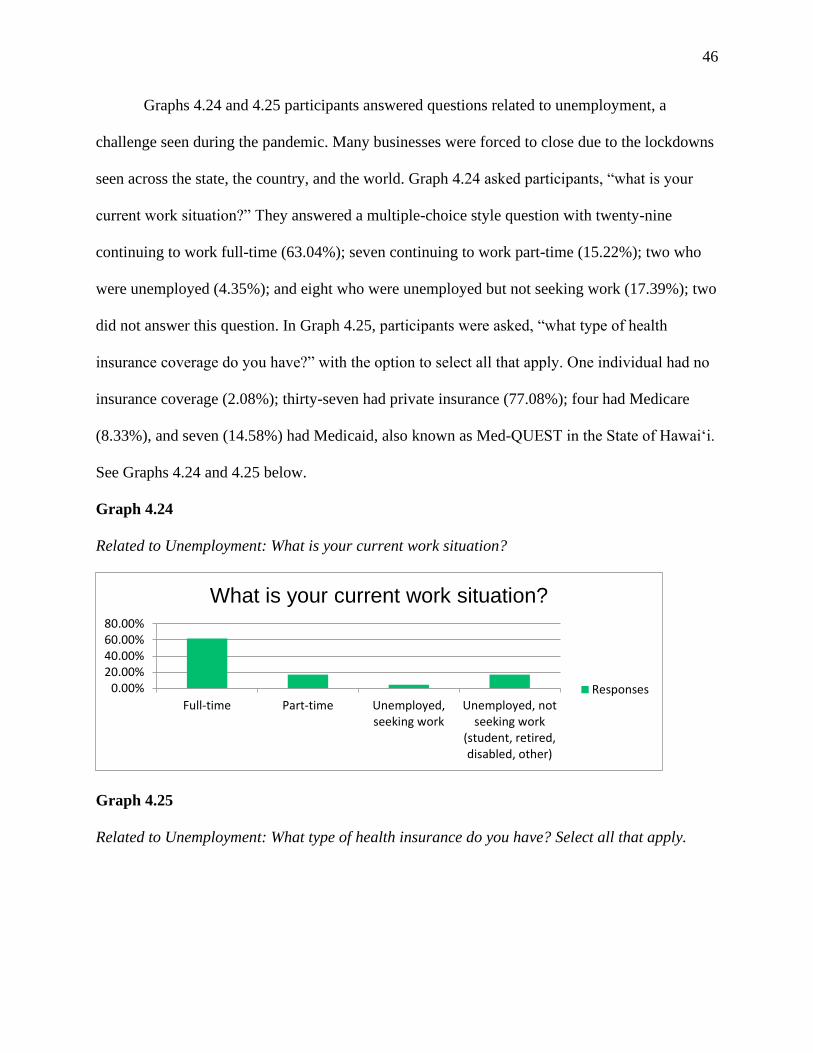
Graphs 4.24 and 4.25 participants answered questions related to unemployment, a
challenge seen during the pandemic. Many businesses were forced to close due to the lockdowns
seen across the state, the country, and the world. Graph 4.24 asked participants, “what is your
current work situation?” They answered a multiple-choice style question with twenty-nine
continuing to work full-time (63.04%); seven continuing to work part-time (15.22%); two who
were unemployed (4.35%); and eight who were unemployed but not seeking work (17.39%); two
did not answer this question. In Graph 4.25, participants were asked, “what type of health
insurance coverage do you have?” with the option to select all that apply. One individual had no
insurance coverage (2.08%); thirty-seven had private insurance (77.08%); four had Medicare
(8.33%), and seven (14.58%) had Medicaid, also known as Med-QUEST in the State of Hawaiʻi.
See Graphs 4.24 and 4.25 below.
Graph 4.24
Related to Unemployment: What is your current work situation?
Graph 4.25
Related to Unemployment: What type of health insurance do you have? Select all that apply.
Full-time Part-time Unemployed,seeking work
Unemployed, notseeking work
(student, retired,disabled, other)
0.00%20.00%40.00%60.00%80.00%
What is your current work situation?
Responses

47
Objective #5: Assess the perception and experiences of Native Hawaiians related to
transportation needs.
In Graph 4.26, participants were asked, “has lack of transportation kept you from medical
appointments, work, or getting things needed for daily living.” Six individuals responded, “yes”
(12.5%), and forty-two said, “no” (87.5%). See Graph 4.26 below.
Graph 4.26
Related to Transportation: Has lack of transportation kept you from medical appointments,
work, or getting things needed for daily living?
Objective #6: Assess the perception and experiences of Native Hawaiians related to
access to healthcare services such as a primary care provider, telehealth services, and
specialists. Graphs 4.27-4.32 participants answered questions regarding access to a primary care
None/Uninsured PrivateInsurance
Medicare Medicaid (Med-QUEST)
0.00%
20.00%
40.00%
60.00%
80.00%
100.00%
What type of health insurance coverage do you have? Select all that apply.
Responses
Yes No
0.00%
50.00%
100.00%
Has lack of transportation kept you from medical appointments, work, or getting
things needed for daily living?
Responses
48
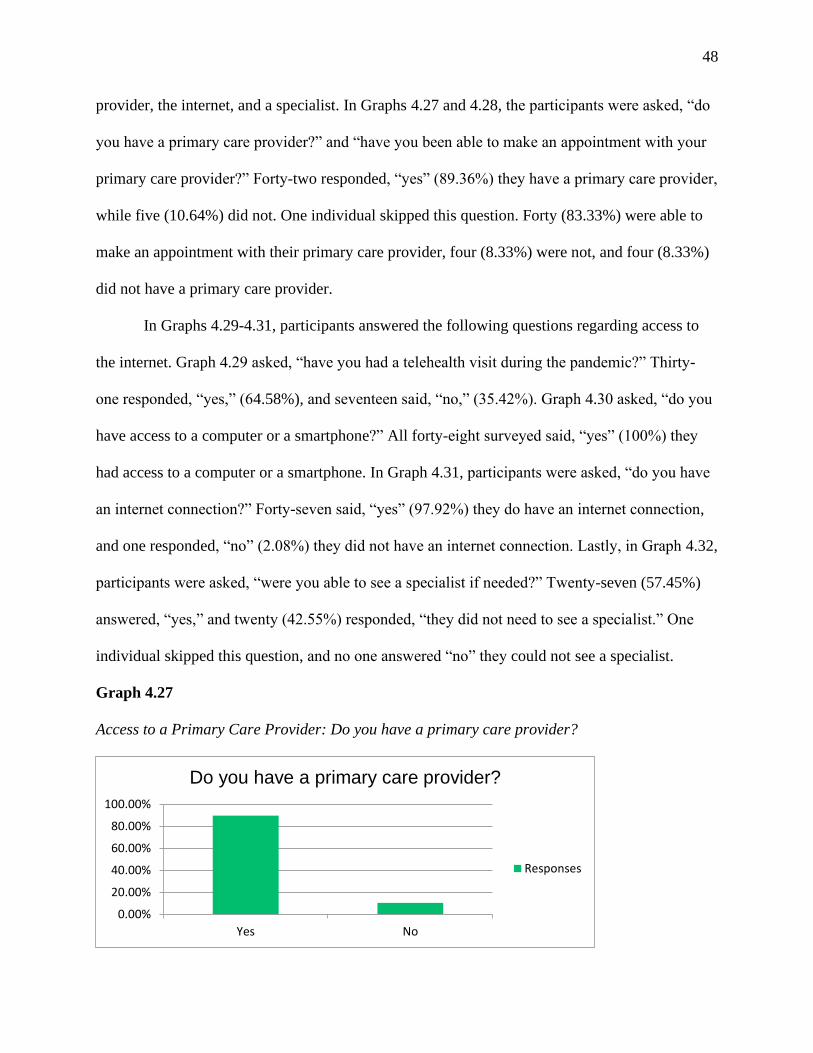
provider, the internet, and a specialist. In Graphs 4.27 and 4.28, the participants were asked, “do
you have a primary care provider?” and “have you been able to make an appointment with your
primary care provider?” Forty-two responded, “yes” (89.36%) they have a primary care provider,
while five (10.64%) did not. One individual skipped this question. Forty (83.33%) were able to
make an appointment with their primary care provider, four (8.33%) were not, and four (8.33%)
did not have a primary care provider.
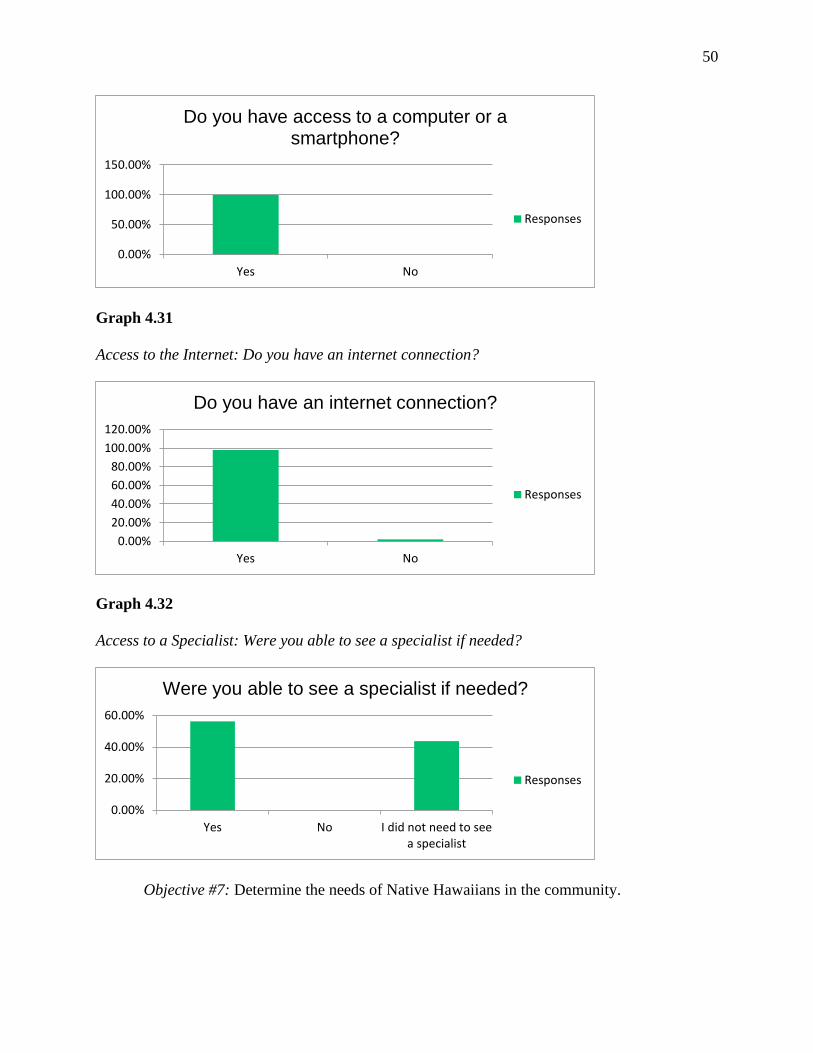
In Graphs 4.29-4.31, participants answered the following questions regarding access to
the internet. Graph 4.29 asked, “have you had a telehealth visit during the pandemic?” Thirty-
one responded, “yes,” (64.58%), and seventeen said, “no,” (35.42%). Graph 4.30 asked, “do you
have access to a computer or a smartphone?” All forty-eight surveyed said, “yes” (100%) they
had access to a computer or a smartphone. In Graph 4.31, participants were asked, “do you have
an internet connection?” Forty-seven said, “yes” (97.92%) they do have an internet connection,
and one responded, “no” (2.08%) they did not have an internet connection. Lastly, in Graph 4.32,
participants were asked, “were you able to see a specialist if needed?” Twenty-seven (57.45%)
answered, “yes,” and twenty (42.55%) responded, “they did not need to see a specialist.” One
individual skipped this question, and no one answered “no” they could not see a specialist.
Graph 4.27
Access to a Primary Care Provider: Do you have a primary care provider?
Yes No
0.00%
20.00%
40.00%
60.00%
80.00%
100.00%
Do you have a primary care provider?
Responses

49
Graph 4.28
Access to a Primary Care Provider: Have you been able to make an appointment with your
primary care provider during the pandemic if needed?
Graph 4.29
Access to the Internet: Have you had a telehealth visit during the pandemic?
Graph 4.30
Access to the Internet: Do you have access to a computer or a smartphone?
Yes NoI donʻt have a primary care provider.
0.00%
50.00%
100.00%
Have you been able to make an appointment with your primary care provider during the
pandemic if needed?
Responses
Yes No
0.00%
20.00%
40.00%
60.00%
80.00%
Have you had a telehealth visit during the pandemic?
Responses
50
Graph 4.31
Access to the Internet: Do you have an internet connection?
Graph 4.32
Access to a Specialist: Were you able to see a specialist if needed?
Objective #7: Determine the needs of Native Hawaiians in the community.
Yes No
0.00%
50.00%
100.00%
150.00%
Do you have access to a computer or a smartphone?
Responses
Yes No
0.00%
20.00%
40.00%
60.00%
80.00%
100.00%
120.00%
Do you have an internet connection?
Responses
Yes No I did not need to seea specialist
0.00%
20.00%
40.00%
60.00%
Were you able to see a specialist if needed?
Responses

51
The survey goals were met, and the needs of Native Hawaiians in the community were
identified and disseminated in the brochure.
Aim #2: Determine how Native Hawaiians perceive and experience their ability to access
healthcare services during the current COVID-19 pandemic.
Objective #1: Identify key stakeholders by obtaining informed consent.
The key stakeholders were identified as the Native Hawaiians who completed the survey.
Informed consent was given and acknowledged by completion of the questionnaire. The
objective was met.
Objective #2: Design survey via Survey Monkey and establish a 30-day timeframe for
dissemination and return.
The survey design was completed via Survey Monkey and completed within twenty-six
days of distribution. The objective was met.
Objective #3: Distribute the study through e-mail to known Native Hawaiian contacts by
the student investigator and the staff of the Native Hawaiian organization, Papa ʻOla Lōkahi.
The survey was distributed through e-mail to known Native Hawaiian contacts by the student
investigator and the staff of Papa ʻOla Lōkahi. The objective was met.
Objective #4: Collect fifty survey responses.
Fifty surveys were collected. However, only forty-eight were used in the data analysis as
two individuals were not Native Hawaiian.
Objective #5: Determine how Native Hawaiians perceive and experience their ability to
access healthcare services during the COVID-19 pandemic.

52
The goal of the performance improvement project was met, and the research question was
answered. Chapter 4 explains the results in detail and answers the Native Hawaiian participants'
perceptions and experiences in accessing healthcare services during the COVID-19 pandemic.

53
Chapter 5: Discussion
Data Synthesis
The overarching goal was to determine the perception and experiences of Native Hawaiians'
access to care during the COVID-19 pandemic. The data collected from the Native Hawaiian
participants revealed barriers to access to care during the COVID-19 pandemic. The data was
disseminated in a brochure created for future use for any Native Hawaiian organization that uses
the presented information. The findings suggested that Native Hawaiians are willing to
participate in surveys or questionnaires that may improve resources related to Native Hawaiians.
These findings are consistent with the literature, and the COVID-19 crisis demands a need for
“reliable and meaningful data collection.” Response efforts rely on the quick dissemination of
data analysis for informed-decision making (Kaholokula et al., 2020).
The overall findings of the pilot project show that the overarching goal was achieved, and
timely and accurate data collection is essential. It also validates the importance of disaggregating
data collection to separate the data of Native Hawaiians from the data of other Pacific Islander
and Asian groups.
Project Strengths and Limitations
The project's strengths identified the willingness of Native Hawaiian participants to
complete the questionnaire. The time frame goals to collect fifty surveys were met within
twenty-six days. The data collection tool was easy to use as the surveys were completed. Timely
and accurate data collection was achieved because the questionnaire was based on access to care
during the COVID-19 pandemic. The questionnaire was distributed, collected, and disseminated
during the COVID-19 pandemic.

54
The limitations identified as the sample size of forty-eight are minor compared to the
total population of Native Hawaiians. However, forty-eight was sufficient for this project, and
data analysis methods to determine if the goals were met. Despite a flyer, consent, and survey
stating the questionnaire targeted Native Hawaiians only, two of the fifty participants were not
Native Hawaiian. The two surveys were omitted from the results that result in two fewer
questionnaires completed for use in the data dissemination.
Implications for Practice
The data collected identified participants who faced barriers related to access to care
during COVID-19. Thirteen individuals did not think they could obtain a COVID-19 test without
any issues. There were 31.25% of individuals that did not feel comfortable seeking care during
the pandemic. Many families live in households of more than four people. Eleven Native
Hawaiians lived with five individuals (23%), three lived in homes of six and seven (6%), one
lived with a household of eight (2%), and two lived in a family of ten (4%). A total of 16.67% of
individuals had a fear of losing their housing. There were 8.33% of Native Hawaiians that
experienced an inability to pay their rent or mortgage. As for unemployment, 4.35% were
seeking work, and 17.39% were not seeking employment but were unemployed. 12.5% of Native
Hawaiians experienced a lack of transportation, and 10.64% did not have a primary care
provider.
The completion of this project informed practice by raising awareness of the importance of
Native Hawaii data collection along with the fears and uncertainties of Native Hawaiians during
the COVID-19 pandemic.
Dissemination Plans

55
A brochure was created to disseminate the essential data collected, results, and findings
of the project. A copy of the pamphlet is located in (Appendix G and H) for review. The title of
the brochure is Native Hawaiians' perception and experiences of access to care during COVID-
19. The brochure is available for use by any organization that supports Native Hawaiians in data
collection, resources, funding, or any community organizations that would like to use the
information collected by the researchers. The brochures key areas of dissemination included the
requirements for participation in the study, the significance of data collected regarding access to
care during COVID-19, the identified barriers, future research needed, and the acknowledgment
of those who made this project possible.
Conclusion
In conclusion, data collection for Native Hawaiians as its race and population remains an
ongoing battle as questionnaires, surveys, and other tools used for measurement are not often
widely available and tailored to only Native Hawaiians. Data disaggregation and grouping the
Native Hawaiian population with other Pacific Islander and Asian groups will continue to be an
issue. This project hopes that it is a continuation to support separating the data of Native
Hawaiians for future research. Additional research is needed to obtain data from a larger sample
size. Suppose an accurate representation of Native Hawaiians' perception and experiences is to
be achieved. In that case, future research will need to continue to improve the understanding of
the health concerns for this population. More research to specify data collection in access to care,
health insurance coverage, chronic disease rates, pandemic response, and resource development
are essential topics, to name a few. There is a continued need to identify areas of opportunity for
federal and state governments to create policies to address these concern.
56
References
Andersen, R. M. (1995). Revisiting the behavioral model and access to medical care: Does it
matter? Journal of Health and Social Behavior, 36(1), 1. https://doi.org/10.2307/2137284
Boserup, B., McKenney, M., & Elkbuli, A. (2020). Disproportionate impact of covid-19
pandemic on racial and ethnic minorities. The American Surgeon, 86(12), 1615–1622.
https://doi.org/10.1177/0003134820973356
Centers for Disease Control and Prevention. (2014). Native Hawaiian and Pacific Islander
(NHPI) National Health Interview Survey (NHIS).
https://www.cdc.gov/nchs/nhis/nhpi.html
Centers for Disease Control and Prevention. (2015). NHIS - race and hispanic origin - glossary.
http://www.cdc.gov/nchs/nhis/rhoi/rhoi_glossary.htm
Centers for Disease Control and Prevention. (2019). NCHHSTP Social Determinants of Health
[https://www.cdc.gov/nchhstp/socialdeterminants/faq.html].
Czeisler, M. É., Marynak, K., Clarke, K. E., Salah, Z., Shakya, I., Thierry, J. M., Ali, N.,
McMillan, H., Wiley, J. F., Weaver, M. D., Czeisler, C. A., Rajaratnam, S. M., &
Howard, M. E. (2020). Delay or avoidance of medical care because of covid-19–related
concerns — united states, june 2020. MMWR. Morbidity and Mortality Weekly Report,
69(35). https://doi.org/10.15585/mmwr.mm6935e3
Fong, M., Braun, K. L., & Tsark, J. (2003). Improving native hawaiian health through
community-based participatory research. Californian Journal of Health Promotion, 1(SI),
136–148. https://doi.org/10.32398/cjhp.v1isi.565
Galinsky, A. M., Simile, C., Zelaya, C. E., Norris, T., & Panapasa, S. V. (2019). Surveying
strategies for hard-to-survey populations: Lessons from the native hawaiian and pacific
57
islander national health interview survey. American Journal of Public Health, 109(10),
1384–1391. https://doi.org/10.2105/ajph.2019.305217
Hofschneider, A. (2021, January 24). Oha says better data is needed to tackle problems facing
native hawaiians. Honolulu Civil Beat. https://www.civilbeat.org/2021/01/oha-says-
better-data-is-needed-to-tackle-problems-facing-native-hawaiians/
Jones, R., Crowshoe, L., Reid, P., Calam, B., Curtis, E., Green, M., Huria, T., Jacklin, K.,
Kamaka, M., Lacey, C., Milroy, J., Paul, D., Pitama, S., Walker, L., Webb, G., & Ewen,
S. (2019). Educating for indigenous health equity. Academic Medicine, 94(4), 512–519.
https://doi.org/10.1097/acm.0000000000002476
Ka‘opua, L., Braun, K. L., Browne, C. V., Mokuau, N., & Park, C.-B. (2011). Why are native
hawaiians underrepresented in hawai‘i's older adult population? exploring social and
behavioral factors of longevity. Journal of Aging Research, 2011, 1–8.
https://doi.org/10.4061/2011/701232
Kaholokula, J. K. (2019). Achieving social and health equity in hawai‘i. In The value of hawaii 2
(pp. 254–264). University of Hawaii Press. https://doi.org/10.1515/9780824840259-037
Kaholokula, J. K., Samoa, R. A., Miyamoto, R. E., Palafox, N., & Daniels, S.-A. (Eds.). (2020).
COVID-19 special column: COVID:19 hits native Hawaiian and pacific islander
communities the hardest [Special issue]. Hawai?i Journal of Health & Social Welfare,
79(5).
Kauahikaua, L., & Pieper-Jordan, S. (2021, February). Data justice: About us, by us, for us —
hbpc. HBPC. https://www.hibudget.org/projects/data-justice

58
Kauh, T. J., Read, J., & Scheitler, A. J. (2021). The critical role of racial/ethnic data
disaggregation for health equity. Population Research and Policy Review, 40(1), 1–7.
https://doi.org/10.1007/s11113-020-09631-6
Mokuau, N., DeLeon, P. H., Keawe'aimoku Kaholokula, J., Soares, S., Tsark, J. U., & Haia, C.
(2016). Challenges and promise of health equity for native hawaiians. NAM Perspectives,
6(10). https://doi.org/10.31478/201610d
Narcisse, M.-R., Felix, H., Long, C. R., Hudson, T., Payakachat, N., Bursac, Z., & McElfish, P.
A. (2018). Frequency and predictors of health services use by native hawaiians and
pacific islanders: Evidence from the u.s. national health interview survey. BMC Health
Services Research, 18(1). https://doi.org/10.1186/s12913-018-3368-3
Office of Disease Prevention and Health Promotion. (n.d.). Social determinants of health |
healthy people 2020. HealthyPeople.gov. https://www.healthypeople.gov/2020/topics-
objectives/topic/social-determinants-of-health
Office of Hawaiian Affairs. (2019). Native Hawaiian Data Book [Digital Format]. The Office of
Hawaii Affairs. http://www.ohadatabook.com/fr_appendix.11.html
Raine, S., Liu, A., Mintz, J., Wahood, W., Huntley, K., & Haffizulla, F. (2020). Racial and
ethnic disparities in covid-19 outcomes: Social determination of health. International
Journal of Environmental Research and Public Health, 17(21), 8115.
https://doi.org/10.3390/ijerph17218115
Samoa, R., Kaholokula, J. K., Penaia, C., Tupai-Firestone, R., Faʻamoe-Timoteo, E., Laelan, M.,
& Aitaoto, N. (2020). COVID-19 and the State of Health of Pacific Islanders in the
United States, 17(1 & 2).

59
Seabrook, J. A., & Avison, W. R. (2012). Socioeconomic status and cumulative disadvantage
processes across the life course: Implications for health outcomes. Canadian Review of
Sociology/Revue canadienne de sociologie, 49(1), 50–68. https://doi.org/10.1111/j.1755-
618x.2011.01280.x
Thakur, N., Lovinsky-Desir, S., Bime, C., Wisnivesky, J. P., & Celedón, J. C. (2020). The
structural and social determinants of the racial/ethnic disparities in the u.s. covid-19
pandemic. what’s our role? American Journal of Respiratory and Critical Care Medicine,
202(7), 943–949. https://doi.org/10.1164/rccm.202005-1523pp
Townsend, C., Dillard, A., Hosoda, K., Maskarinec, G., Maunakea, A., Yoshimura, S., Hughes,
C., Palakiko, D.-M., Kehauoha, B., & Kaholokula, J. (2015). Community-based
participatory research integrates behavioral and biological research to achieve health
equity for native hawaiians. International Journal of Environmental Research and Public
Health, 13(1), 4. https://doi.org/10.3390/ijerph13010004
United States Census Bureau. (n.d.). Why we conduct the decennial census? The United States
Census Bureau. https://www.census.gov/programs-surveys/decennial-
census/about/why.html
World Health Organization. (n.d.). Who | data collection.
https://www.who.int/violence_injury_prevention/surveillance/en/
World Population Review. (2021). Hawaii Population 2021. Retrieved May 31, 2021, from
https://worldpopulationreview.com/states/hawaii-population
Wu, S., & Bakos, A. (2017). The native hawaiian and pacific islander national health interview
survey: Data collection in small populations. Public Health Reports, 132(6), 606–608.
https://doi.org/10.1177/0033354917729181

60
Zelaya, C., Galinsky, A., Simile, C., & Barnes, P. (2017, August). Vital and health statistics,
series 3, number 41 [PDF]. The Centers for Disease Control and Prevention.
https://www.cdc.gov/nchs/data/series/sr_03/sr03_041.pdf

61
Appendix
Project Timeline
Week 1-Week 2 Recruit Native Hawaiians to participate in the survey, distribute and
collect online surveys.
Week 3 Reminder e-mail sent to complete surveys sent.
Week 4 Closing of survey collection, data analysis completed

62
Appendix B
Native Hawaiian Recruitment E-mail
Aloha,
I developed an instrument in collaboration with guidance from the University of Hawaii at Hilo, School of Nursing Committee Members (Drs. Kathryn Daub and Joan Pagan). The IMPACT Tool aims to determine the native Hawaiian populations' perception and experience of their ability to access healthcare services during the COVID-19 pandemic. A survey consisting of thirty-two questions that include five demographic and twenty-seven yes or no, multiple-choice, or fill in the blank can be completed in approximately five minutes.
A panel of experts has reviewed the tool for construct validity. We want to pilot the instrument to determine its validity and reliability within the Native Hawaiian population. We are seeking the participation of Native Hawaiians as they are a significant group in the United States.
IRB approval (2020-01014) was granted to the University of Hawaii at Hilo on 1/22/2021 for this pilot study.
No personal identifiers will be collected from participants nor healthcare providers, and organizations. Responses will be reported in aggregate scores and demographic characteristics. Results of the pilot study will be shared with the University of Hawaii at Hilo and interested participants. The primary purpose of the pilot is to obtain psychometric data on the instrument.
Please, contact me with any questions or concerns about this study. We appreciate your support in piloting this instrument, please share it with friends and family members. Please review the attached consent to participate form.
Mahalo,
Kawailehua K. Paikai

63
Appendix C
Consent Form
Aloha! My name is Kawailehua Paikai, and I am a graduate student at the University of Hawai'i
at Hilo (UHH) in the Department of Nursing, Doctor of Nursing Program. I am doing a research
project as part of the requirements for earning my graduate degree.
What am I being asked to do?
If you participate in this project, you will be asked to fill out a survey. You are eligible to
participate if you are at least 18 years old, read and write in English, and have experienced any
attempt to receive healthcare service in any setting within the current pandemic timeframe. You
will be asked to complete a survey consisting of thirty-two questions that include five
demographic and twenty-seven yes or no, multiple-choice, and/or fill in the blank, which can be
completed in approximately five minutes.
Taking part in this study is your choice.
Your participation in this project is completely voluntary. You may stop participating at any
time. If you stop being in the study, there will be no penalty or loss to you. Your choice to
participate or not participate will not affect your rights to services with any of the participating
health care partners.
Why is this study being done?
The purpose of this study is to collect accurate and timely data from Native Hawaiians to assess
their perception and experiences with access to care during the COVID-19 pandemic.
What will happen if I decide to take part in this study?
If you decide to participate, you will be asked to complete a demographic questionnaire
consisting of six items and the twenty-six-question tool, which is answerable by Yes or No,
multiple-choice, or fill in the blank style questions. The questionnaire can be completed in about
5 minutes. The survey is accessed on a website to which I will provide you a link.
What are the risks and benefits of taking part in this study?
I believe there is little risk to you for participating in this research project. You may become
stressed or uncomfortable answering any of the survey questions. If you do become stressed or
uncomfortable, you can skip the question or take a break. You can also stop taking the survey or
you can withdraw from the project altogether.

64
There will be no direct benefit to you for participating in this survey. The results of this project
may help improve accurate and timely data collection of Native Hawaiians access to care during
the COVID-19 pandemic to assist community leaders, policy makers, and researchers to
understand and address health care disparities that specifically effect this population.
Confidentiality and Privacy:
I will not ask you for any personal information, such as your name or address. Please do not
include any personal information in your survey responses. I will keep all study data secure in a
locked filing cabinet in a locked office/encrypted on a password protected computer. Only my
University of Hawai'i advisor and I will have access to the information. Other agencies that have
legal permission have the right to review research records. The University of Hawai'i Human
Studies Program has the right to review research records for this study.
Compensation:
There will be no compensation for participation in this project.
Future Research Studies:
Identifiers will be removed from your identifiable private information and after removal of
identifiers, the data may be used for future research studies or distributed to another investigator
for future research studies, and we will not seek further approval from you for these future
studies.
Questions: If you have any questions about this study, please e-mail me at
[email protected]. You may also contact my advisor, Dr. Katharyn Daub, at 808-932-7067
or [email protected]. You may contact the UH Human Studies Program at 808-956-5007 or
[email protected]. to discuss problems, concerns, and questions; obtain information; or offer
input with an informed individual who is unaffiliated with the specific research protocol. Please
visit http://go.hawaii.edu/jRd for more information on your rights as a research participant.
To Access the Survey: Please go to the following web page:
https://www.surveymonkey.com/r/FBXW723. You should find a link and instructions for
completing the survey. Going to the first page of the survey implies your consent to participate in
this study.
Please print or save a copy of this page for your reference.
Mahalo!

65
Appendix D
CITI Training

66
Appendix E
Survey Questions
Survey Monkey Link: https://www.surveymonkey.com/r/FBXW723
1) What age group are you?
a) Under 18 years
b) 18-24 years old
c) 25-34 years old
d) 35-44 years old
e) 45-54 years old
f) 55-64 years old
g) 65+
2) Gender
a) Male
b) Female
c) Self-describe ______
3) Are you Native Hawaiian?
a) Yes
b) No
4) Identify your percentage of Native Hawaiian blood quantum. _________
5) What language are you most comfortable speaking?
a) English
b) Other, please specify
6) What is the highest level of education you completed?
67
a) Less than high school
b) High school or GED
c) College, trade school, or higher
7) I feel the pandemic has affected my health.
a) Strongly Agree
b) Agree
c) Neither agree nor disagree
d) Disagree
e) Strongly disagree
8) If I wanted to be tested for COVID-19 I had no issues doing so.
a) Strongly Agree
b) Agree
c) Neither agree nor disagree
d) Disagree
e) Strongly disagree
9) I have been tested for COVID-19. (If no may skip to question 13)
a) Yes
b) No
10) I tested negative for COVID-19.
a) Yes
b) No
11) I tested positive for COVID-19.
a) Yes

68
b) No
12) I have been hospitalized due to COVID-19.
a) Yes
b) No
13) I wanted to be tested for COVID-19 and I was unable to obtain a test.
a) Yes
b) No
14) I have been exposed to COVID-19 by a close contact.
a) Yes
b) No
15) I know someone who has been affected by COVID-19.
a) Yes
b) No
16) I have experienced difficulty obtaining a COVID-19 test.
a) Yes
b) No
17) I have received some kind of healthcare service during the COVID-19 pandemic (telehealth,
face to face appointments, urgent care, emergency room services, etc.).
a) Yes
b) No
18) I felt comfortable seeking care during the pandemic.
a) Yes
b) No
69
19) How many people currently live with you, including yourself? ________
20) Which zip-code do you live in? _____________
21) What is your current housing situation?
a) Homeowner
b) Renter
c) Homeless or in a shelter
d) Living with friends or family
e) Other, please specify
22) Are you worried about losing your housing?
a) Yes
b) No
23) Were you unable to pay your mortgage or rent on time?
a) Not Applicable
b) Yes
c) No
24) What is your current work situation? If other, please specify.
a) Full-time
b) Part-time
c) Unemployed seeking work
d) Unemployed not seeking work (student, retired, disabled, other)
25) What type of health insurance coverage do you have?
a) None/Uninsured
b) Private Insurance
70
c) Medicare
d) Medicaid (Med-QUEST)
26) Has lack of transportation kept you from medical appointments, work, or getting
things needed for daily living?
a) Yes
b) No
27) Do you have a primary care provider?
a) Yes
b) No
28) Have you been able to make an appointment with your primary care provider during the
pandemic if needed?
a) Yes
b) No
c) I don’t have a primary care provider
29) Have you had a telehealth visit during the pandemic?
a) Yes
b) No
30) Do you have access to a computer or a smartphone?
a) Yes
b) No
31) Do you have an internet connection?
a) Yes
b) No

71
32) Were you able to see a specialist if needed?
a) Yes
b) No
c) I did not need to see a specialist

72
Appendix F
Project Flyer

73
Appendix G
Brochure Front

74
Appendix H
Brochure Back