access, board size, and incentives in non-profit firms · access, board size and incentives in...
TRANSCRIPT

Access, Board Size, and Incentives in Non-Profit Firms*
Rajesh K. Aggarwal (University of Minnesota)
Mark Evans (Duke University)
Dhananjay Nanda#
(Duke University)
#Corresponding author. The Fuqua School of Business, Duke University, Durham, NC 27708. 919-660-7966. [email protected]
* We would like to thank seminar participants at Duke University, University of Iowa, and MIT for invaluable comments. We would also like to thank the Center for the Advancement of Social Entrepreneurship (CASE) for funding the project and the National Center for Charitable Statistics for providing us the Form 990 data.

Access, Board Size and Incentives in Non-Profit Firms Abstract:
We study the relation between board size and managerial incentives in non-profit firms. We present a model where board membership is granted to parties that wish to direct the manager’s actions in exchange for assets that they bring within the organization, but differ in the relative value they place on the nonprofit’s activities. In this setting, we show that the manager’s incentives are lower than would be had the board been smaller, although the nonprofit’s ability to raise funds is higher. Empirically, we find evidence consistent with our model’s predictions: non-profits that pursue more objectives have larger boards, lower managerial pay-performance sensitivities and higher revenue and program spending growth rates.

1 Introduction
Modern nonprofit (or not-for-profit) organizations were effectively established
in the United States by the Tariff Act of 1913. This act exempted orga-
nizations that operated exclusively for religious, charitable, scientific, and
educational purposes from the Sixteenth Amendment, which established the
federal income tax.1 To maintain its tax-exempt status, an organization
must satisfy three criteria: one, its activities must satisfy a public policy
purpose; two, it must satisfy a non-inurement clause that prohibits the dis-
tribution of earnings (revenues less expenses); and three, it must have a gov-
ernance structure. The non-inurement clause that legally bars a nonprofit
from distributing profits leads to the absence of residual claimants who would
otherwise direct and focus the organizations mission, thereby lowering a non-
profit’s opportunity cost to pursue multiple objectives.2 In this paper, we
propose that the number of objectives pursued by a nonprofit organization
is related to the size of its board of directors and explore the consequences
for managerial incentives.
We posit that directors of firms potentially have differing, possibly con-
flicting, objectives and that their board membership confers on them the
1This exemption was subsequently extended to organizations that operated for a lit-erary purpose and those that operated to prevent cruelty towards children and animals.
2Past research claims that the non-distribution constraint is both the cause of agencyproblems that lead nonprofits to be less efficient than for-profits (Alchian and Demsetz1972; Fama and Jensen 1983), and a way to resolve agency problems that would lead for-profit firms to under-supply a good or service (Hansmann 1996; Weisbrod 1988; Glaeserand Shleifer 2001).
1

ability to direct the organization’s managers to pursue these different goals.
An organization benefits from having these directors on the board because
they hold assets that it can employ to further its mission. The directors join
the board because they value the right to direct the firm’s manager to pursue
their goals. We then examine how the equilibrium size of an organization’s
board is associated with managerial incentives and its ability to raise and
spend funds. Specifically, we address three questions. First, is the size of
the board of directors associated with the variety of programs pursued by
the firm? Second, does board size affect managerial incentives or pay-for-
performance? Finally, how does board size affect a nonprofit’s ability to
raise and spend funds?
We propose that managerial incentives are determined in equilibrium,
through optimal contracting between a founder and outside parties that value
access to the manager, and also between managers and a board of directors
that represent the outside parties that are granted access. We begin by
presenting a model where a risk-averse agent is employed by a firm.3 Initially,
the firm’s founder, who cares about a single objective, has the sole right to
direct the manager’s actions. However, he can share this right by conferring
board membership (contracting rights) to other parties that value access
to directing managerial activites. The founder prefers to grant access to
the other parties because he directly benefits from assets that they own and
3Our model is rather general in that the tensions explored apply more broadly to allorganizations, for-profit and nonprofit. We believe, however, that the lack of a fiduciaryduty to a residual claimant in nonprofits makes it apply particularly well in this context.
2

bring within the firm once granted the right to direct the manager’s activities.
This relationship is characterized by incomplete contracting because the firm
cannot write explicit contracts with an external constituency that promise
the provision of a good that the constituency values in exchange for its asset.
The only way a constituency can ensure the provision of the good is by
itself directing the firm’s manager to provide it. Once granted access, the
parties collectively act as a single principal (the board) who offer an explicit
(complete) contract to a single agent (the manager) in a setting similar to
the multi-task principal-agent model of Holmstrom and Milgrom (1991). In
this setting, we show that the agent’s incentives are lower than they would
be had the contract been offered only by the founder.
Our view of what the board of directors does complements the moni-
toring view prevalent in the literature on for-profit firms. This monitoring
view suggests that the role of a board is to observe the manager’s actions
and intervene when necessary to resolve agency conflicts between managers
and owners (see, for example, Hermalin and Weisbach 2001.) We take the
view that the function of a nonprofit board is to establish firm objectives
and contract with top management (the agent) about these objectives on
behalf of the stakeholders and constituencies that it represents.4 For exam-
ple, a community hospital is responsible to physicians, patients, staff, health
4For example, Ben-Ner and Van Hoomissen (1991) state, "A nonprofit organizationwill be formed only if a group of interested stakeholders (individuals or organizations) hasthe ability to exercise control over the organization. Stakeholder control is a sine quanon for the existence of nonprofit organizations, because it avails the trust required forpatronizing the organization, revealing demand to it, and making donations to it."
3

maintenance organizations and the government. To the extent that boards
reflect the concerns of interested parties about non-profit activities, the na-
ture of contracting between boards and management will be influenced by
these concerns.
There are three empirical implications of our theory. First, our theory
predicts that board size will be larger when nonprofit firms pursue more
objectives. Second, the more directors there are (i.e., the larger the board
size), the weaker the pay-performance incentives are for managers. This
second prediction is the implication of multi-task agency (see Holmstrom and
Milgrom (1991)). Finally, we predict that a nonprofit’s ability to raise and
spend funds is positively related to the size of its board. The last implication
arises because, at the margin, the value of a director’s asset always exceeds
the marginal loss in output from all other activities.
The existing literature characterizes nonprofits as having varied objectives
such as prestige maximization, maximization of employee income, income
redistribution, or maximization of the supply of some good (see, for example,
Steinberg 2004 and Hansmann 1980 and 1987.)5 Therefore, we test our
model’s predictions using a sample of 501(c)3 nonprofit firms that filed Form
990’s with the Internal Revenue Service between 1998 and 2000. The sample
consists of 70,524 firm-year observations from 24,027 unique firms. The
Form 990 contains information about financial performance, program services
5Drucker (1992) states, "One of the basic differences between businesses and non-profits is that non-profits always have a multitude of constituencies."
4

offered, listing of officers and directors, and compensation paid to the officers
or directors. We find that the number of directors on a nonprofit’s board
is positively related to the number of program activities pursued by the
organization. In fact, after controlling for firm size the coefficient on program
activities is approximately one, suggesting that each program activity (on
average) is associated with one additional director on a board.
We construct two measures of pay-performance sensitivity for each CEO
or Executive Director. The first, the sensitivity of compensation to financial
performance, is derived by regressing the annual change in compensation on
the change in revenue and the change in yield (see Baber, et al. 2002). The
change in revenue measures a nonprofit’s effectiveness in raising funds and
the change in yield measures its efficiency in using funds.6 Since nonprofit
performance is unlikely to be solely measured in financial terms, we employ
a second measure, the coefficient of variation of chief executive’s compensa-
tion, to proxy for overall incentives based on both financial and non-financial
measures. Our results show that both measures of managerial incentives are
negatively related to the number of program activities and to board size.
The statistical and economic magnitudes of this negative association are sig-
nificant, and are robust to a myriad of specifications and controls for firm
and industry characteristics. Finally, we find that nonprofits’ revenue and
program spending growth are positively related to the number of programs
6Specifically, the change in yield captures the change in program spending ratio thatis not attributable to a change in funds raised by the organization.
5

pursued by the nonprofit, its board size, and to managerial incentives. The
remainder of the paper is organized as follows. In Section 2, we present our
model. In Section 3, we describe our data and measures of incentives, board
characteristics and firm programs. We present the econometric results in
Section 4. Section 5 concludes.
2 A Theory of Board Size
In this section, we present a theory of the size of a nonprofit organization’s
board of directors based on incomplete contracting (see Grossman and Hart
1986 and Hart and Moore 1990) and multitasking (see Holmstrom and Mil-
grom 1991). The organization in our model is initially controlled by a single
founder who is the sole party that has rights to direct the organization’s
manager to undertake activities. However, the founder can share access to
the manager by awarding contracting rights to other parties that may wish
to direct the manager’s activities. The founder may want to grant access to
these other parties because he directly benefits from assets that they own and
bring within the organization if they are granted access (see Rajan and Zin-
gales 1998). In our model, the founder and the other parties that are granted
access to the manager are the board, and the board contracts with the agent
(the manager) in a setting similar to the multi-task principal-agent model
of Holmstrom and Milgrom (1991). Each director encourages the manager
to pursue activities that he values, unconstrained by any fiduciary duty to
6
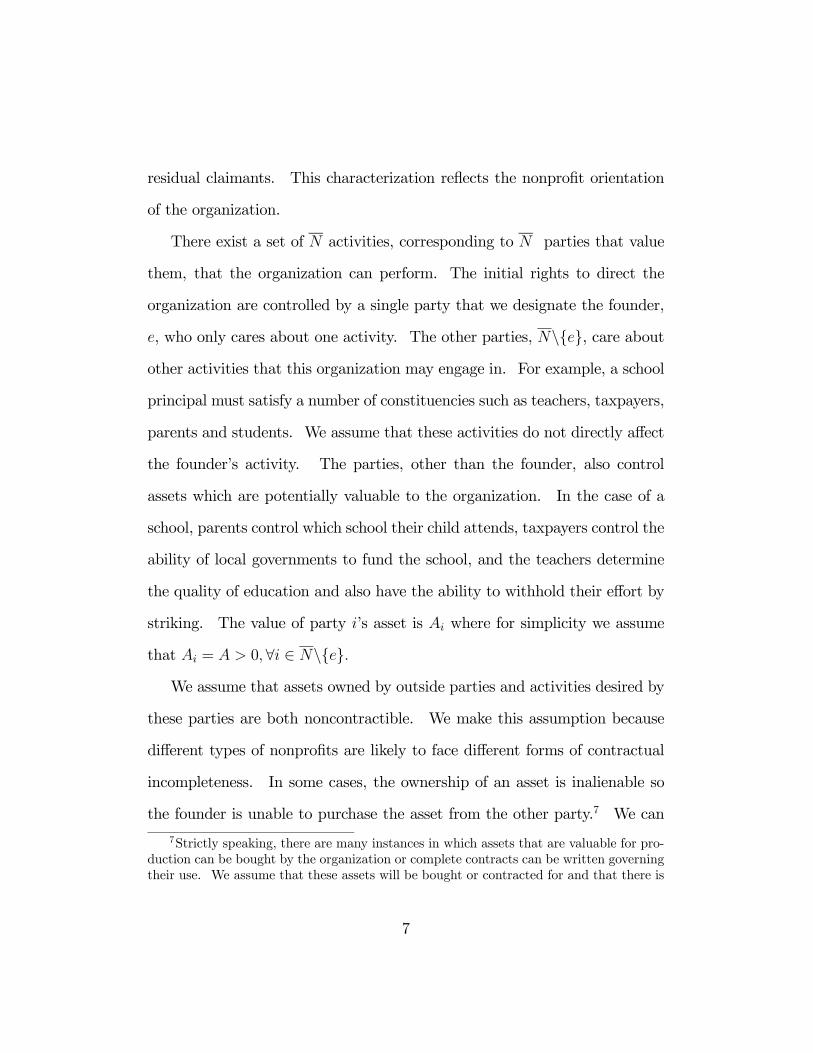
residual claimants. This characterization reflects the nonprofit orientation
of the organization.
There exist a set of N activities, corresponding to N parties that value
them, that the organization can perform. The initial rights to direct the
organization are controlled by a single party that we designate the founder,
e, who only cares about one activity. The other parties, N\{e}, care about
other activities that this organization may engage in. For example, a school
principal must satisfy a number of constituencies such as teachers, taxpayers,
parents and students. We assume that these activities do not directly affect
the founder’s activity. The parties, other than the founder, also control
assets which are potentially valuable to the organization. In the case of a
school, parents control which school their child attends, taxpayers control the
ability of local governments to fund the school, and the teachers determine
the quality of education and also have the ability to withhold their effort by
striking. The value of party i’s asset is Ai where for simplicity we assume
that Ai = A > 0,∀i ∈ N\{e}.
We assume that assets owned by outside parties and activities desired by
these parties are both noncontractible. We make this assumption because
different types of nonprofits are likely to face different forms of contractual
incompleteness. In some cases, the ownership of an asset is inalienable so
the founder is unable to purchase the asset from the other party.7 We can
7Strictly speaking, there are many instances in which assets that are valuable for pro-duction can be bought by the organization or complete contracts can be written governingtheir use. We assume that these assets will be bought or contracted for and that there is
7
think of these assets as relationship-specific investments similar in spirit to
Grossman and Hart (1986) and Hart and Moore (1990). For example, an
asset of this type would be the ability of a party, say a former government
official, to lobby the government on behalf of a nonprofit. Such an asset
would be valuable to a nonprofit organization dependent upon government
grants. As an example that does not conform to our setting, consider the
case of a university with a donor who wants it to name a library after him
in exchange for a donation. Our model does not apply to this setting be-
cause this is a case where the university and the donor can write an explicit
contract. Our model better applies to a museum with a benefactor who has
access to a network of potential donors (an asset that cannot be contracted
upon) which the museum can benefit from. The benefactor may wish to
gain access to the museum to promote a particular type of art that he favors.
In other cases, a founder cannot commit ex ante to contract with the agent
(management) to deliver ex post the desired amount of another interested
party’s activity. Contracting with management as well as management’s
choice of activities is unverifiable to external constituencies. Thus, the only
way in which the founder can benefit from the assets owned by the other par-
ties is by granting them access to contracting with the agent. In this case,
no need for access to be granted to the (former) owners of such assets. We are concernedwith situations in which control of an asset is difficult to contract over. We also notethat in many instances, nonprofits in effect pay for services from individuals by grantingthe individual board membership (see Lynn and Smith 2005). This, of course, also thenconveys access to the management of the nonprofit.
8

the parties bring their assets within the organization and the founder benefits
from them. This situation is commonplace in nonprofits that rely on large
donations. The founder is resource constrained and typically seeks out alter-
native sources of funding, typically donors. If the donor and the founder’s
interests and objectives are perfectly congruent, then a simple transfer of
funds is sufficient. While congruence may hold for some donations it is un-
likely to hold in general and as donations get larger. Further, as the number
of donors increases, divergence in objectives across donors is also likely to in-
crease. In these situations, the ability to direct the use of the funds becomes
more important for the donor.
While the asset, in this case money, seems as if it may be contractible,
writing a complete contract governing the use of a fungible asset is difficult
since funds can be shifted from other sources to circumvent the contract.
In cases of large donations, this problem is more severe as funds are added
to an endowment and used over a long period of time. Further, Glaeser
and Shleifer (2001) point out that the use of explicit contracts governing
donations can cause them to lose their tax-advantaged status. For these
reasons, the ability to influence the activities of the nonprofit will depend
more on access (board membership) and less on contracts. If the donation is
large enough and there is sufficient divergence in objectives, then we expect
that the donor will receive board membership.8
8To further illustrate this idea, suppose an organization that initially has the objectiveof finding a cure for cancer — a pure scientific research activity — has a small board solelycomposed of medical researchers. This organization approaches a potential contributor
9

Our model has two potential sources of contractual incompleteness that
lead to the use of access to influence management. If outside parties’ assets
and the nonprofit’s activities are noncontractible, then the founder grants
the parties access so that the founder may influence the use of their assets.
So, before the board contracts with the manager (at time 0), the founder
chooses the number of parties to grant access to the manager, or in other
words, chooses the size of the board.
Each party prefers to influence the organization’s activities (i.e., gain
access to the manager) if the value of their asset is lower than the benefit they
receive from directing the manager’s activities. Under what conditions would
the founder be willing to provide the other parties access to the manager in
exchange for their assets and under what conditions would the other parties
be willing to part with their assets in exchange for access to directing the
manager? The payoff (net of payment to the manager) to the founder from
granting access to the N − 1 other parties ({N − 1} ⊂ N\{e}) in exchange
for their N − 1 assets is:9
πe(N) = ze(N) + (N − 1)A, (1)
who believes that educating the masses regarding ways to avoid cancer is also a worth-while objective. The existing board adds the contributor to the board in exchange forcontributed assets, and in return, adds the objective of education, as well as, scientificresearch to the organization agenda. This addition creates a multiple-objective situationwhich both increases board size (adding the new contributor) and also creates incentivesto pursue two, not one, objective — that is, both education and research, not just research.
9Note that not every party that cares about the firm’s activities will be granted accessto the agent.
10
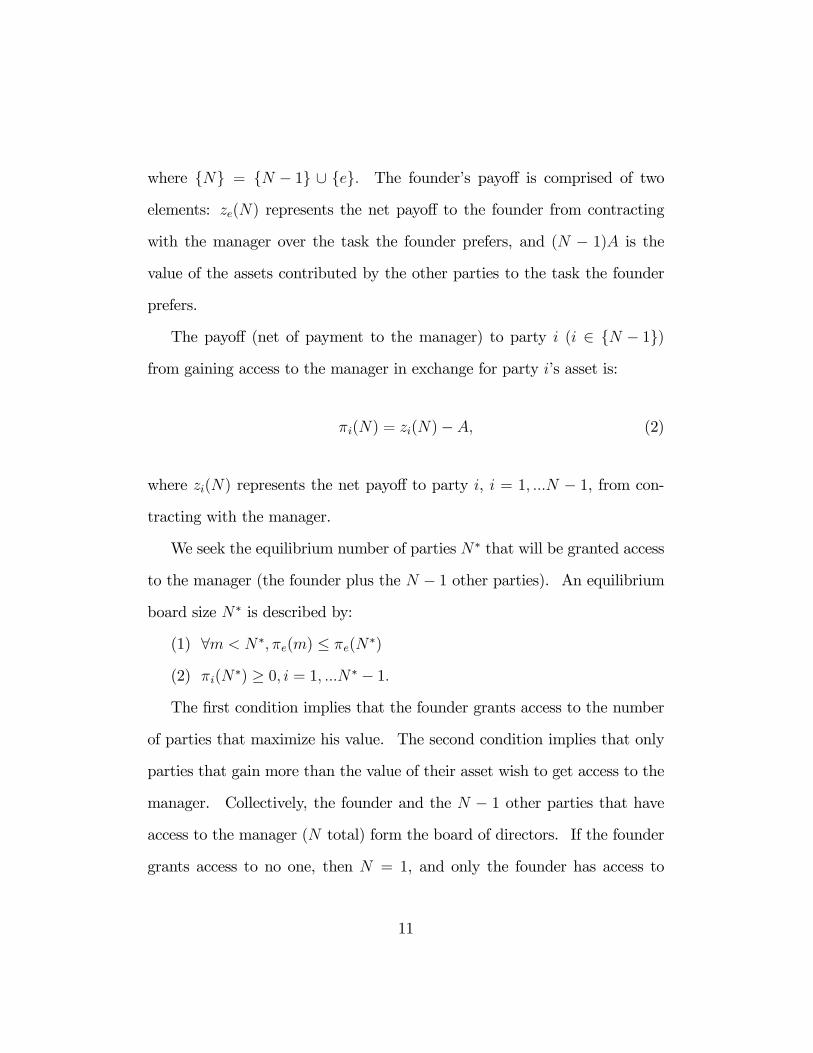
where {N} = {N − 1} ∪ {e}. The founder’s payoff is comprised of two
elements: ze(N) represents the net payoff to the founder from contracting
with the manager over the task the founder prefers, and (N − 1)A is the
value of the assets contributed by the other parties to the task the founder
prefers.
The payoff (net of payment to the manager) to party i (i ∈ {N − 1})
from gaining access to the manager in exchange for party i’s asset is:
πi(N) = zi(N)−A, (2)
where zi(N) represents the net payoff to party i, i = 1, ...N − 1, from con-
tracting with the manager.
We seek the equilibrium number of parties N∗ that will be granted access
to the manager (the founder plus the N − 1 other parties). An equilibrium
board size N∗ is described by:
(1) ∀m < N∗, πe(m) ≤ πe(N∗)
(2) πi(N∗) ≥ 0, i = 1, ...N∗ − 1.
The first condition implies that the founder grants access to the number
of parties that maximize his value. The second condition implies that only
parties that gain more than the value of their asset wish to get access to the
manager. Collectively, the founder and the N − 1 other parties that have
access to the manager (N total) form the board of directors. If the founder
grants access to no one, then N = 1, and only the founder has access to
11

the manager. For N > 1, there are multiple board members who direct the
managers’ activities.
At time 1, the organization employs a manager to produce output on
various tasks. Once access to directing the manager’s actions is granted,
the founder and the N − 1 other parties contract with the manager over the
organization’s activities. Given that there are N board members, there are
N tasks or values that matter at the organization level. What we have in
mind is that organizations may care about values or activities other than the
initial activity for which they were established. Of course, it may be the case
that some of these activities also impact the founder’s activity, but these may
also be values that matter to the organization independent of the founder’s
wishes. We associate these N tasks with N directors who contract with the
single manager performing these activities. Further, each task is associated
with a single director, who solely cares about that task and is indifferent to
the other N − 1 tasks.
So, at time 1, the board contracts with the manager in order to induce
him to work on the tasks that the board members care about. For director
i, i ∈ N , who cares about task i, the gross payoff from the manager taking
action xi is:
vi = xi + εi, (3)
where εi ∼ N [0, σ2i ] is a normally distributed shock to the performance mea-
sure vi for task i. For simplicity, we assume that the variances of the N
12
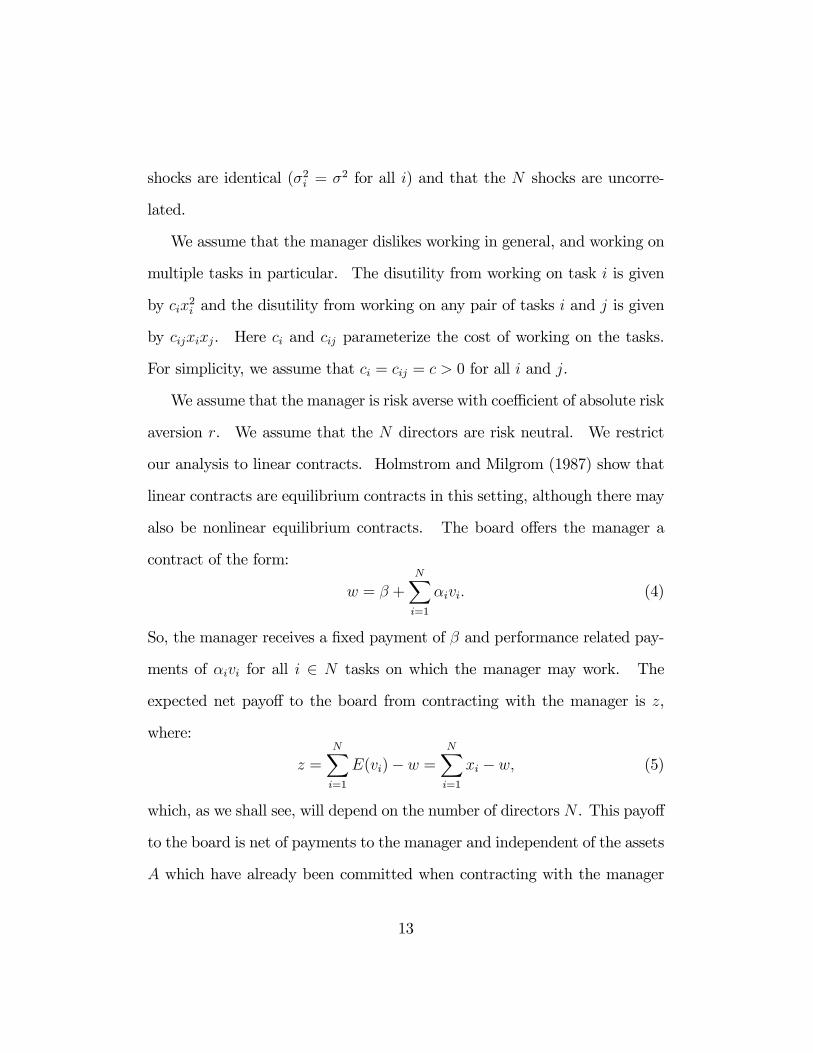
shocks are identical (σ2i = σ2 for all i) and that the N shocks are uncorre-
lated.
We assume that the manager dislikes working in general, and working on
multiple tasks in particular. The disutility from working on task i is given
by cix2i and the disutility from working on any pair of tasks i and j is given
by cijxixj. Here ci and cij parameterize the cost of working on the tasks.
For simplicity, we assume that ci = cij = c > 0 for all i and j.
We assume that the manager is risk averse with coefficient of absolute risk
aversion r. We assume that the N directors are risk neutral. We restrict
our analysis to linear contracts. Holmstrom and Milgrom (1987) show that
linear contracts are equilibrium contracts in this setting, although there may
also be nonlinear equilibrium contracts. The board offers the manager a
contract of the form:
w = β +NXi=1
αivi. (4)
So, the manager receives a fixed payment of β and performance related pay-
ments of αivi for all i ∈ N tasks on which the manager may work. The
expected net payoff to the board from contracting with the manager is z,
where:
z =NXi=1
E(vi)− w =NXi=1
xi − w, (5)
which, as we shall see, will depend on the number of directors N . This payoff
to the board is net of payments to the manager and independent of the assets
A which have already been committed when contracting with the manager
13

occurs.
We can now define the manager’s aggregate certainty equivalent utility
from contracting with the board as:
u = β +NXi=1
αixi − cNXi=1
x2i −c
2
NXi=1,i6=k
NXk=1
xkxi −r
2
NXi=1
α2iσ2. (6)
At time 2, the manager maximizes this certainty equivalent over the N tasks
and chooses an equilibrium activity level, xi, for each task i. At time 3,
outputs are realized and all payoffs are made.
The first order condition for any task i is:
αi = 2cxi + cNX
k=1,k 6=ixk. (7)
Solving all N first order conditions simultaneously, we get that the optimal
action taken on task i is:
xi =Nαi −
PNk=1,k 6=i αk
(N + 1) c. (8)
Here the −PN
k=1,k 6=i αk arises because any work done on task k detracts from
work done on task i (due to the negative complementarity between all pairs
of tasks) and αk provides incentives to work on task k. The board’s net
14

payoff from contracting with the agent is given by:
z =NXi=1
xi − cNXi=1
x2i −c
2
NXi=1,i6=k
NXk=1
xkxi −r
2
NXi=1
α2iσ2, (9)
where we assume that the agent will be held to his reservation utility. Substi-
tuting the agent’s action xi on every task i into the board’s objective function
and maximizing over the contract weights yields the equilibrium contracts.
Holmstrom and Milgrom (1991) have shown that the optimal contract for
a setting in which a single principal contracts with an agent over N tasks
would provide the agent with incentives for any task i of:
α0i =1
crσ2 (N + 1) + 1. (10)
It follows that the manager’s incentives for any task i are decreasing in the
cost of performing tasks, c, the manager’s risk aversion, r, and the variance
of the performance measures, σ2. These are standard results for the linear
principal-agent model. More importantly, the manager’s incentives for any
task i are decreasing in the number of tasks N . This is the comparative
static we will focus on in this paper.
Further, in equilibrium, the amount of managerial action on task i as a
function of number of tasks is:
x∗i (N) =1
c2rσ2 (N + 1)2 + (N + 1)c(11)
15
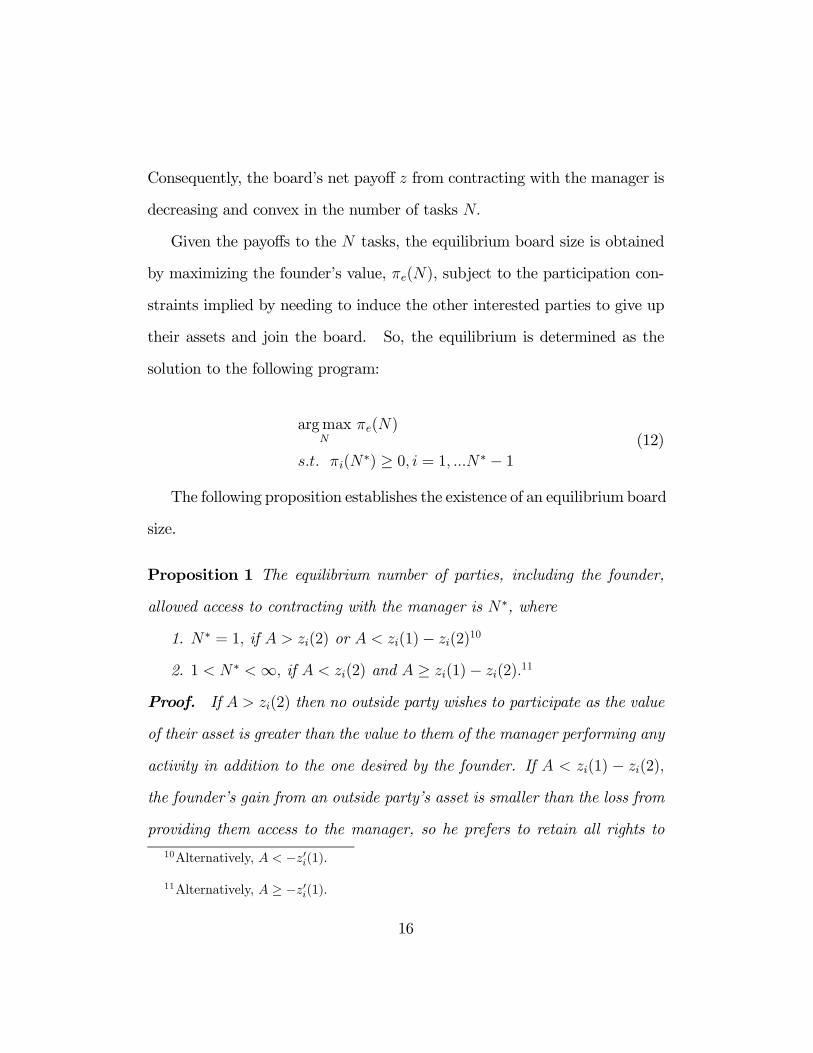
Consequently, the board’s net payoff z from contracting with the manager is
decreasing and convex in the number of tasks N.
Given the payoffs to the N tasks, the equilibrium board size is obtained
by maximizing the founder’s value, πe(N), subject to the participation con-
straints implied by needing to induce the other interested parties to give up
their assets and join the board. So, the equilibrium is determined as the
solution to the following program:
argmaxN
πe(N)
s.t. πi(N∗) ≥ 0, i = 1, ...N∗ − 1
(12)
The following proposition establishes the existence of an equilibrium board
size.
Proposition 1 The equilibrium number of parties, including the founder,
allowed access to contracting with the manager is N∗, where
1. N∗ = 1, if A > zi(2) or A < zi(1)− zi(2)10
2. 1 < N∗ <∞, if A < zi(2) and A ≥ zi(1)− zi(2).11
Proof. If A > zi(2) then no outside party wishes to participate as the value
of their asset is greater than the value to them of the manager performing any
activity in addition to the one desired by the founder. If A < zi(1) − zi(2),
the founder’s gain from an outside party’s asset is smaller than the loss from
providing them access to the manager, so he prefers to retain all rights to
10Alternatively, A < −z0i(1).
11Alternatively, A ≥ −z0i(1).
16

contracting with the agent. A < zi(2) and A ≥ zi(1) − zi(2) imply that the
asset value for at least one party, other than the founder, is less than the value
from the manager performing their task, and that the founder benefits from
granting access to at least one other party. Further, since zi(N) = ze(N) and
zi(N) is monotonically decreasing in N, there exists an bn such that πi(bn) ≥ 0and πi(m) < 0 for m > bn.These results show that the founder either chooses to add no parties to the
board of directors or chooses to keep adding parties to the board of directors
until the reduction in incentives from adding more directors no longer makes
it worthwhile for incremental parties to join the board. To see this, consider
A ≥ zi(1) − zi(2). In this case, A ≥ zi(m) − zi(m + 1),∀m > 1, and the
founder gains more from successively adding parties to the board of directors
than he loses in output. Thus, if the founder is willing to let one additional
party join the board, then the founder is willing to let all additional parties
join the board. From the founder’s perspective, the value or payoff to the
founder is strictly increasing in additional parties (past the initial additional
party).
However, this does not imply that the size of the board will be unbounded.
Other parties must be willing to participate. Since zi(m)− zi(m + 1) > 0,
∃ en > 1 such that πi(en)− πi(en+ 1) < A, and additional parties choose not
to join the board. Thus, what limits the size of the board of directors is
the contracting friction induced by having multiple directors that reduce the
gains from contracting with the manager. For example, a donor may choose
17

not to contribute to a large nonprofit because the activities that the donor
cares about will be diluted by the prior existence of a large number of other
tasks. Instead, the donor will find a smaller nonprofit where the donor will
have a greater ability to direct what the manager of the nonprofit does. The
optimal board size is determined by the tradeoff between the value of the
assets owned by outside parties and the value of the output produced by the
manager.
Our model has several implications. In our model, directors differ only to
the extent that they have different objectives and consequently the number of
firm objectives is increasing in the number of directors. Hence, the number
of tasks performed by an organization is increasing in the number of direc-
tors on the board. Further, our model shows that managerial incentives,
and consequently output, on every task is decreasing in the number of tasks
represented by directors on an organization’s board. Last, our model shows
that the payoff to the founder is increasing in the number of additional board
members, even though the output on any given task is decreasing in addi-
tional board members. These implications form the basis of the hypotheses
we test in the following sections of the paper.
3 Data & Sample Selection
We obtain data on nonprofit organizations from the National Center for
Charitable Statistics (NCCS) for 1998-2000. The NCCS compiles data on
18

Section 501(c)3 nonprofit organizations’ Form 990 tax returns filed with the
Internal Revenue Service (IRS). The filed Form 990s contain firms’ financial
data, compensation data for officers, directors, and other key employees, as
well as data on program services. The organizations are classified by industry
through a system called the National Taxonomy of Exempt Entities (NTEE).
The NTEE classifies each organization into one of 26 industries. We require
that each sample firm have all three years of data. We remove firms for which
no officer or key employee is paid, firms with missing or negative financial
variables for any year, or firms that experience CEO turnover during the
sample period. The final sample, after deletion of outliers (discussed below),
consists of 70,524 firm-years and 24,027 unique firms. Table 1 provides
descriptive statistics for our sample.
We proxy for the number of firm objectives by the number of programs
listed in Part III, “Statement of Program Service Accomplishments,” on the
IRS 990. In this section of the return, firms are required to describe “their
exempt purpose achievements in a clear and concise manner.” These achieve-
ments are totaled for each firm-year in order to obtain the number of pro-
grams. The mean (median) value for number of programs is 2.02 (1).
In addition to data on firm objectives, we need information on board
size, CEO incentives, and firm characteristics. The number of directors on
the board is listed in Part V, “List of Officers, Directors, Trustees, and Key
Employees,” on the IRS 990. The listed directors are totaled for each firm-
year in order to obtain board size. The mean (median) number of directors
19

is 15.00 (11). Because this variable is somewhat skewed we use its natural
logarithm in some specifications.
We use two measures of CEO pay-performance incentives. Our first mea-
sure is based on a specification used by Baber, Daniel, and Roberts (2002).
This pay-performance relation is derived as follows. Let PSPENDINGt,
REVt, and RATIOt be the amount that the nonprofit spends on program ac-
tivities, raises in revenue, and the ratio of program expense to total revenue,
respectively, in year t. Then,
PSPENDINGt = REVt ×RATIOt (13)
and
∆PSPENDINGt = [REVt ×RATIOt]− [REVt−1 ×RATIOt−1] (14)
or
∆PSPENDINGt = [∆REVt ×RATIOt−1] + [REVt ×∆RATIOt] . (15)
The first term is the change in program spending that is explained by the
change in revenue and the second term is the change in program spending
that is explained by the change in the average fraction of each revenue dollar
the nonprofit spends on program activities. If we deflate the above by
program spending in year t− 1, and substitute RATIOt−1 =PSPENDINGt−1
REVt−1,
20

we get∆PSPENDINGt
PSPENDINGt−1= %∆REVt +∆Y IELDt, (16)
where
∆Y IELDt =[REVt ×∆RATIOt]
PSPENDINGt−1. (17)
Now, %∆REVt indicates the organizations fundraising performance and
∆Y IELDt indicates its performance in fund usage. If we posit that compen-
sation partly depends on performance along these two financial dimensions
we obtain the regression specification
%∆COMPt = β0 + β1%∆REVt + β2∆Y IELDt + t, (18)
where %∆COMPt is the percentage change in compensation from year t−
1 to year t. In this specification, β1 and β2 represent pay-performance
sensitivities to fundraising and fund usage activities.
We obtain compensation data for CEOs from Part V of Form 990. If a
CEO or Executive Director is not designated, we use compensation data for
the highest paid officer, director, trustee, or key employee obtained from the
same section of the IRS return. We define total compensation as the sum
of base compensation, contributions to employee benefit plans and deferred
compensation, and expense accounts. We observe qualitatively similar re-
sults throughout if we only use base compensation. %∆COMPt is defined
21
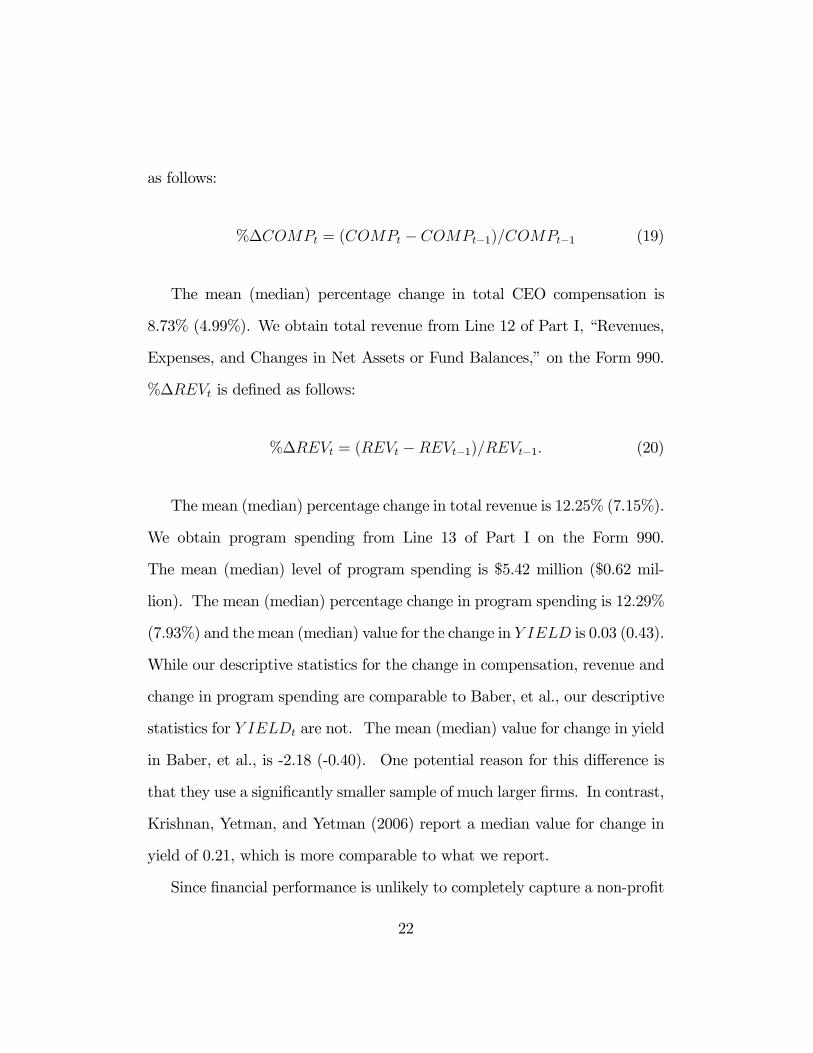
as follows:
%∆COMPt = (COMPt − COMPt−1)/COMPt−1 (19)
The mean (median) percentage change in total CEO compensation is
8.73% (4.99%). We obtain total revenue from Line 12 of Part I, “Revenues,
Expenses, and Changes in Net Assets or Fund Balances,” on the Form 990.
%∆REVt is defined as follows:
%∆REVt = (REVt −REVt−1)/REVt−1. (20)
The mean (median) percentage change in total revenue is 12.25% (7.15%).
We obtain program spending from Line 13 of Part I on the Form 990.
The mean (median) level of program spending is $5.42 million ($0.62 mil-
lion). The mean (median) percentage change in program spending is 12.29%
(7.93%) and the mean (median) value for the change in Y IELD is 0.03 (0.43).
While our descriptive statistics for the change in compensation, revenue and
change in program spending are comparable to Baber, et al., our descriptive
statistics for Y IELDt are not. The mean (median) value for change in yield
in Baber, et al., is -2.18 (-0.40). One potential reason for this difference is
that they use a significantly smaller sample of much larger firms. In contrast,
Krishnan, Yetman, and Yetman (2006) report a median value for change in
yield of 0.21, which is more comparable to what we report.
Since financial performance is unlikely to completely capture a non-profit
22

manager’s performance, we develop an alternative measure for incentives—the
coefficient of variation (COV) of total CEO compensation.12 The coefficient
of variation is defined as the standard deviation of compensation for the man-
ager divided by the manager’s mean compensation. Higher variation in com-
pensation is indicative of stronger pay-performance incentives conditional on
both there being time series variation in performance and the organization’s
use of pay-performance incentives. In our reported tests, the coefficient of
variation is calculated for total compensation, although we obtain qualita-
tively similar results using base compensation. The mean (median) values
for this variable using base and total compensation are 10.27 (6.76) and 10.67
(7.28), respectively.13
We measure firm size as the beginning of the year book value of the
nonprofit’s total assets. The mean (median) value for beginning of year
assets is $11.98 million ($0.66 million). Because this variable is highly skewed
we use the natural logarithm of this variable in our regression specifications
to control for firm size.
Univariate correlations are presented in Table 2. These results show
that board size, number of programs, and organization size are all signifi-
cantly positively correlated. In particular, the Pearson (Spearman) corre-
12For instance, Duca (1996) states that, "Nonprofit social services organizations rarelyhave a measure of profitability and often have multiple program goals and objectives.This makes it very difficult to identify any one or two performance measures that can beapplied across a variety of programs."
13In computing the COV variable, there are only two observations for some firms be-cause of oulier deletion. As a robustness check, we restrict the sample to three observationsper firm and obtain similar results.
23
lation for board size and number of programs is 0.156 (0.174). The re-
sults also provide preliminary evidence on pay-performance sensitivities. In
particular, percentage change in compensation is positively correlated with
percentage change in revenue, change in yield, and percentage change in pro-
gram spending. Pearson (Spearman) correlations among these variables are
0.152 (0.127), 0.020 (0.023), and 0.189 (0.168), respectively. In addition,
percentage change in revenue and change in yield are significantly negatively
correlated (-0.566 for Pearson and -0.507 for Spearman). The relations
among these variables are further investigated in our main empirical tests.
4 Empirical Results
Our model predicts relations between the number of non-profit objectives
(programs), non-profit board size, managerial incentives, and organization
performance. In particular, board size increases in firms’ objectives, man-
agerial incentives for any task will be decreasing in board size, whereas per-
formance on a task will be increasing in incentives for that task. We begin by
presenting univariate evidence on nonprofit organizations that are differenti-
ated by their source of funding. For instance, if the only source of funding
for an organization is program service revenues, it often behaves much like a
for-profit entity.14
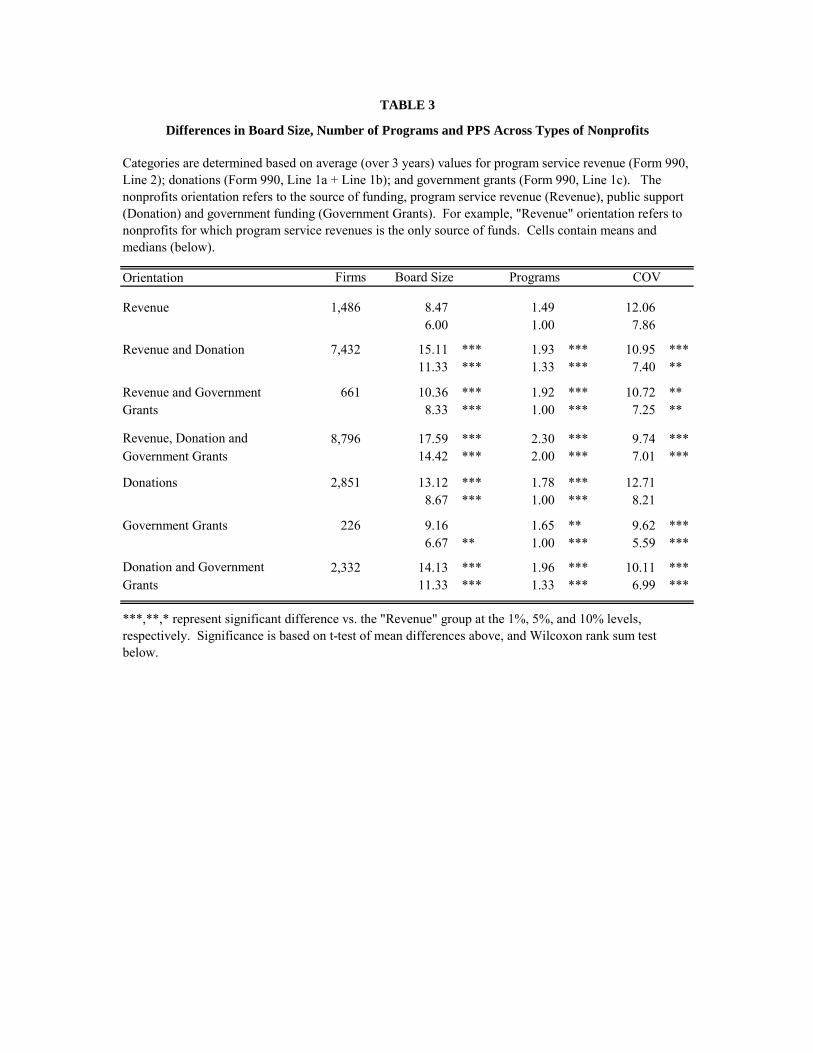
In Table 3, we provide univariate evidence that program variety, board
14Steinberg (2004) terms such organizations as Commercial Nonprofits.
24

size, and managerial incentives (as measured by the coefficient of variation
in pay) vary systematically with a nonprofit’s orientation as determined by
its source of funding. We identify three sources of funding, program service
revenues (Revenues), public support (Donations) and government funding
(Government Grants). We find that more focused organizations, which have
a single source of funds, have smaller boards, fewer programs, and higher
managerial incentives than do less focused organizations. As the number
of funding sources increases, so do board size and program variety, while
incentives are reduced. For instance, organizations whose sole funding source
is program service revenues (and thus are more likely to behave as for-profits)
have on average 8.5 directors, 1.5 programs, and a COV of 12.06.
By contrast, organizations that have both program service revenues and
public support have boards with 15.11 members, pursue 1.93 programs, and
the CEO’s COV is 10.95, on average. For organizations that raise funds
through program service revenues, public support, and government grants,
the corresponding statistics are: 17.59 directors, 2.3 programs, and a COV of
9.74, on average. Similarly, organizations that raise funds through donations
and government grants have larger boards (14.13 versus 13.12 and 9.16), more
programs (1.96 versus 1.78 and 1.65), and somewhat lower incentives (10.11
versus 12.71 and 9.62), than do organizations that solely raise funds through
either donations or government grants. From this preliminary evidence we
conclude that focused nonprofits have smaller boards, fewer programs and
greater managerial incentives. This evidence, albeit univariate, is consistent
25

with the predictions of our theory.
To confirm this preliminary evidence we perform several multivariate
tests. We first examine the impact of a firm’s number of programs on
board size after controlling for firm size. Second, we examine the effect of
firm objectives and board size on pay-performance sensitivity by augmenting
equation (18) with interaction terms for the number of programs and board
size. Third, we use the coefficient of variation of compensation as an alterna-
tive measure of managerial incentives and test for its relation to board size
and number of programs. Finally, we show that program variety, board size,
and the coefficient of variation of compensation are all positively related to
a nonprofit organization’s revenue and program spending growth.
4.1 Number of Programs and Board Size
To examine whether a nonprofit’s board size is related to its pursuit of mul-
tiple programs, we estimate the following specification:
BOARDi = β0 + β1PROGi + β2 ln(ASSETSi) + τ i + i. (21)
BOARDi is average board size over the sample period, PROGi is the average
number of programs over the sample period, and ln(ASSETSi) is the natural
log of average beginning of the year assets over the sample period. Industry
effects are represented by τ i. Because we use averages, this specification is
estimated over the cross-section of 24,027 firms. In all of our tests, we delete
26

outliers with respect to the three variables in equation (18) at the 1% and
99% levels.
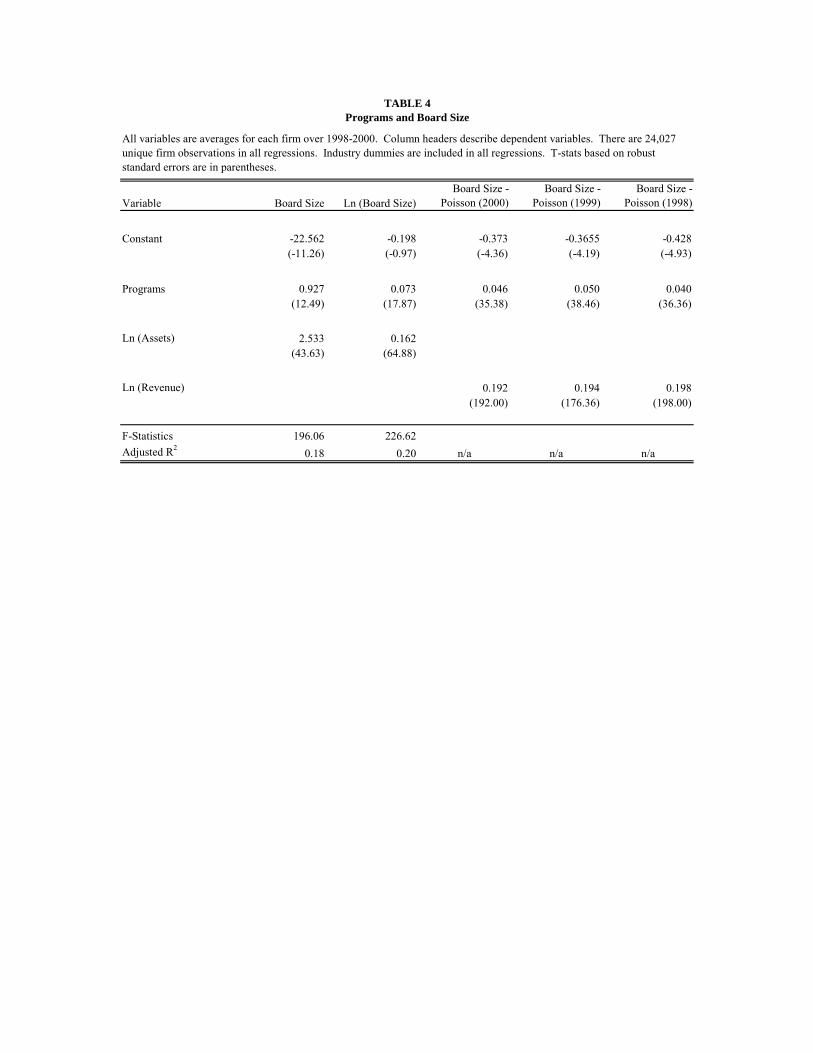
The results are presented in Table 4. Column 1 contains results for
the specification in equation (21). The coefficient on number of programs
is positive and significant. The coefficient magnitude (0.927) is very close
to the predicted sensitivity of the model, which predicts that each addi-
tional objective is associated with an additional board member. Columns 2
through 5 contain additional results using either different specifications for
the dependent variable or different estimation procedures. Column 2 uses
the natural log of board size. Columns 3, 4, and 5 describe year-by-year
Poisson regressions since our dependent variable can only take integer val-
ues. In each specification, the coefficient on number of programs is positive
and significant, as predicted, suggesting that board size is, in fact, related to
the number of programs pursued by a nonprofit firm.
Endogeneity is a potential concern with the above results in that it is
plausible that the size of the board drives the number of programs pursued.
However, we believe our interpretation of the results is appropriate. Our
theory asserts that board representation is granted to parties with differing
objectives based on whether they have assets which are valuable to the firm.
Thus, objectives and assets are the primitives of the model and determine
the organization’s mission and in turn the size of its board. Further, both
variables are fairly invariant over time, implying that they are potentially
innate to an organization’s business model. Nevertheless, the cross-sectional
27

association between the two variables is sufficient to validate our model even
though causality is virtually impossible to unambiguously establish.
4.2 Board Size and Pay-Performance Incentives
We next examine the effect of firm objectives and board size on pay-performance
sensitivity. Our first set of tests is based on the sensitivity of CEO com-
pensation to financial performance. We estimate the following version of
equation (18):
%∆COMPit = β0 + β1%∆REVit + β2∆Y IELDit + β3PROGit (22)
+β4 ln (BOARD)it + β5(%∆REVit × PROGit)
+β6 (∆Y IELDit × PROGit)
+β7(%∆REVit × ln (BOARDit))
+β8 (∆Y IELDit × ln (BOARDit)) + μt + τ i + it.
This specification extends equation (18) by including the interaction effects
of number of programs and board size, along with their main effects. Thus,
the coefficients on the interaction terms represent the incremental effect of an
increase in the number of programs (or board size) on the pay-performance
sensitivity with respect to the percentage change in total revenue and the
change in yield. Our model predicts that the coefficients on the board
size interactions will be negative, indicating that managerial incentives are
28
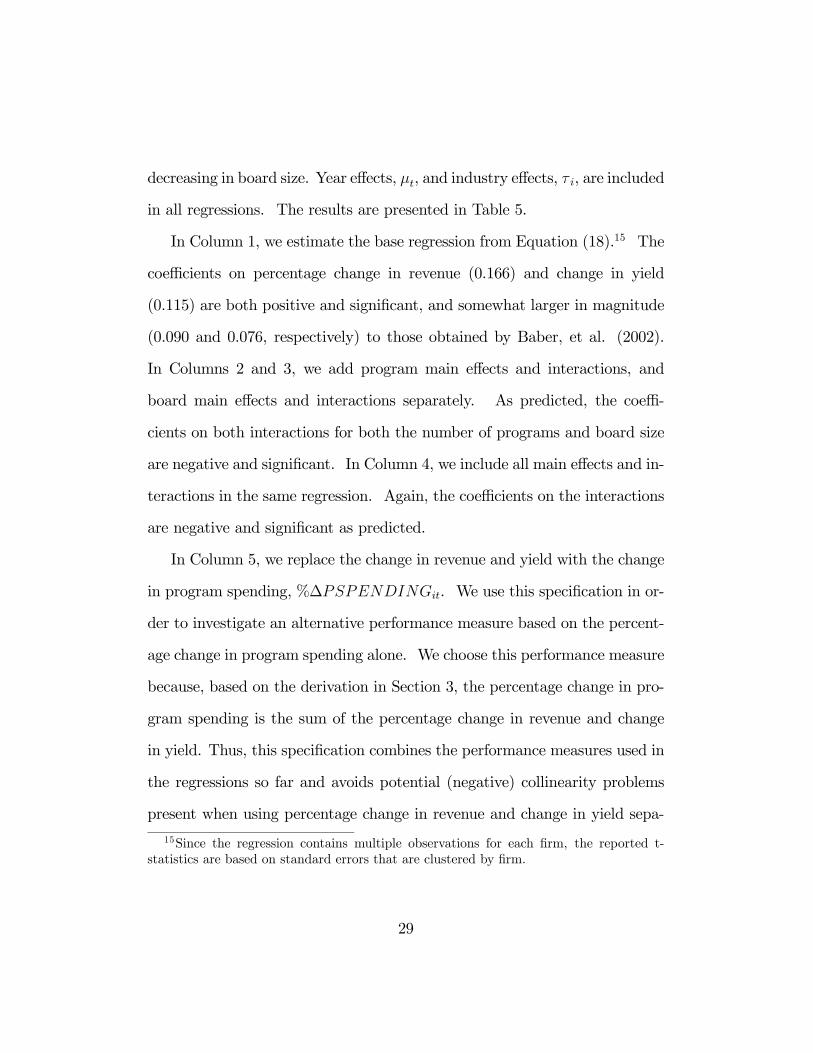
decreasing in board size. Year effects, μt, and industry effects, τ i, are included
in all regressions. The results are presented in Table 5.
In Column 1, we estimate the base regression from Equation (18).15 The
coefficients on percentage change in revenue (0.166) and change in yield
(0.115) are both positive and significant, and somewhat larger in magnitude
(0.090 and 0.076, respectively) to those obtained by Baber, et al. (2002).
In Columns 2 and 3, we add program main effects and interactions, and
board main effects and interactions separately. As predicted, the coeffi-
cients on both interactions for both the number of programs and board size
are negative and significant. In Column 4, we include all main effects and in-
teractions in the same regression. Again, the coefficients on the interactions
are negative and significant as predicted.
In Column 5, we replace the change in revenue and yield with the change
in program spending, %∆PSPENDINGit. We use this specification in or-
der to investigate an alternative performance measure based on the percent-
age change in program spending alone. We choose this performance measure
because, based on the derivation in Section 3, the percentage change in pro-
gram spending is the sum of the percentage change in revenue and change
in yield. Thus, this specification combines the performance measures used in
the regressions so far and avoids potential (negative) collinearity problems
present when using percentage change in revenue and change in yield sepa-
15Since the regression contains multiple observations for each firm, the reported t-statistics are based on standard errors that are clustered by firm.
29

rately. Column 5 reveals that the coefficient on percentage change in pro-
gram spending is significant and positive (0.224) and the coefficients on both
interaction terms are significant and negative, consistent with our predictions.
Overall, these results are consistent with our theory that the number of pro-
grams, through its effect on board size, reduces managerial pay-performance
incentives, as measured by financial pay-performance-sensitivity.
In nonprofit firms, managerial performance is likely to be measured in
non-financial as well as financial terms, thereby limiting the prior measure’s
ability to sufficiently capture pay-for-performance. Our second measure of
managers’ pay-performance incentives, the coefficient of variation of compen-
sation, captures incentives tied to financial and non-financial performance.
To examine the relations between compensation variability, board size, and
programs we estimate the following regression specification:
COVi = β0 + β1PROGi + β2 ln (BOARDi) (23)
+β3COV (Revenuei) + β4 ln(ASSETSi) + τ i + i.
COVi measures each firm’s manager’s coefficient of variation of total compen-
sation. Industry effects, τ i, are included in all specifications. Since larger or-
ganizations are likely to have lower performance volatilility and consequently
a lower coefficient of variation of pay, we add the coefficient of variation of
total revenue, COV (Revenuei), as an additional regressor. We control for
firm size by using the natural logarithm of firm assets, ln(ASSETSi), as an
30

independent variable.
Table 6 presents the results. In Columns 1 and 2, we regress COVi on
the number of programs and board size individually. The coefficients for
both are negative and significant as predicted. In Column 3, we estimate
the full specification as in Equation (23). The coefficients for number of
programs and board size remain both negative and significant, albeit smaller
in magnitude. In Column 4, we use board size deciles as a measure of board
size with similar results. These results provide further evidence on the
negative relation between managerial incentives and the number of programs
and board size, consistent with our theory.
4.3 Programs, Board Size, Incentives and Performance
Our final tests examine the effect of firm objectives, board size, and pay-
performance sensitivity on a nonprofit’s ability to raise funds. Our tests
examine whether a nonprofit’s program spending and revenue growth is af-
fected by its program variety, board size, and managerial incentives. We
estimate the following equation :
PERFi = β0 + β1COVi + β2 ln (BOARDi) + β3PROGi (24)
+β4 ln(ASSETSi) + τ i + it.
PERFi is the performance measure used in the regression, either the non-
profit’s average program spending growth or its average revenue growth rate.
31
Our model predicts that the coefficients β1, β2, and β3 will be positive, indi-
cating that organizational performance is increasing in managerial incentives,
board size, and program diversity. Industry effects, τ i, are included in all
regressions. The results are presented in Table 7.
In Column 1 and 2, we estimate the model with program spending growth
rate as the dependent variable, and in Columns 3 and 4, we use revenue
growth rate as the dependent variable. The coefficients on COV , our mea-
sure of incentives, are reliably positive and significant across all specifica-
tions, indicating that nonprofit performance is increasing in managerial pay-
performance sensitivity. In Columns 2 and 4, the coefficients on number of
programs and board size are also positive and significant, indicating that a
nonprofit’s ability to raise funds is also positively related to program variety
and board size. These results are consistent with our theory that board
members bring with them assets that are valuable to the nonprofit, which
increases its funds. This occurs because, at the margin, the asset value is
always in excess of the output loss on any one program.
4.4 Robustness Tests
Our empirical tests make a number of assumptions about the measures con-
structed from Form 990 data. To examine whether our inferences are af-
fected by these assumptions we conduct a number of robustness tests that
relax these assumptions or make alternative assumptions about the data.
Our first robustness test deals with our measure of board size. In the prior
32
analyses, board size is defined as the total number of directors, officers, or
key employees from Part V of IRS Form 990, and compensation is defined as
the sum of base compensation, benefits, and expense accounts. We re-run
all our tests by measuring board size as the total number of unpaid directors
and measuring compensation as base compensation only. Our results and
inferences are unaffected.
The next robustness test deals with the definition of the chief executive
or the highest ranked officer in a nonprofit organization. For purposes of
measuring incentives, we identify the top officer as the CEO (or other com-
parable title). If such a title is not found, we use the highest paid officer or
director. These criteria are consistent with that used in other studies (e.g.,
Baber, et al. 2002). As a robustness check, we identify the top officer as the
highest paid officer regardless of whether he or she is identified as the CEO.
All results are identical to those reported in the prior sections.
The results described in the previous sections include “government re-
lated” nonprofits. Since “government-related” nonprofits can be fundamen-
tally different from other nonprofits we performed all tests using a reduced
sample in which firms were eliminated if more than 40% of their revenues
(Form 990 Lines 1 through 3) were from government sources. This criterion
reduces the sample size by approximately 25%. All results are qualitatively
similar to those reported previously.
Our measure of the number of programs pursued by a nonprofit may be
subject to bias if nonprofits report the number of programs for publicity
33
reasons and not to reflect the true goals of the organization. To address this
concern we use the program-related expenses in the Form 990 to construct an
index that captures program diversity. This index is similar to a Herfindahl
index used to measure the degree of competition in a given industry. Our
variant of this index is:
Pi =1PN
j=1
³PSPENDINGij
TOTAL PSPENDINGi
´2 (25)
PSPENDINGij is the program spending on program j and organization
i. TOTAL PSPENDINGi is measured as the sum of all the program-
related expenses from Part III for organization i. This measure captures
the number of programs which are weighted based on their relative program
spending. For instance, for organizations with one program, Pi = 12 = 1.
For organizations with 2 programs which have equal amounts of program
expenses, Pi =1
2× 0.52 = 2.
When using this measure of the number of programs, all results are sim-
ilar to those previously reported with two exceptions. The coefficient on
the interaction between number of programs and change in yield in specifi-
cation (22) is insignificant (with a t-statistic of 1.10). When the change in
program spending is the dependent variable, the coefficient on programs in
specification (24) is also insignificant (with a t-statistic of 1.17).
Finally, we conduct two additional robustness tests that address the con-
cerns raised by Krishnan, Yetman, and Yetman (2006) implying that non-
34

profit firms misreport fundraising expenses. If program expenses are misre-
ported, our independent variables are measured with error and the relations
identified could potentially be spurious. Our first robustness check eliminates
firms that report zero fundraising expenses, since their data are most likely
to be suspect. Using this restricted sample, we reestimate regression (22)
and obtain similar results.
Next we reestimate regressions (22) and (23) separately for firms that
employ an outside accountant to audit their statements and those that do
not. Krishnan, et. al., report that firms with audited statements are less
likely to misreport expenses. Our results remain qualitatively similar in both
samples, albeit somewhat stronger in statistical terms for firms that employ
an outside accountant and somewhat weaker in the sample of firms that do
not have audited statements.
5 Conclusion
In this paper, we study the effect of a nonprofit organization’s board of
directors on managerial incentives. We present a model where a risk-averse
agent performs multiple tasks for a nonprofit firm that is governed bymultiple
directors who differ in the relative value they place on each task. We show
that the manager’s incentives are lower than they would be had the board
been smaller, although the organization’s ability to raise funds is higher.
We test these predictions using data on nonprofits from their Form 990
35

filings with the IRS. Our empirical results are consistent with our model’s
predictions. Specifically, we find that board size is positively associated
with the number of programs pursued by a nonprofit and negatively related
to its manager’s pay-performance sensitivities. We also show that program
spending and revenue growth are positively related to incentives, board size,
and program variety. Our results are robust to various specifications and
the inclusion of numerous controls.
While our empirical results are consistent with the model, we have only
begun to scratch the surface of the model’s implications for explaining board
behavior. Our proxies for board heterogeneity are rather crude. While it is
certainly plausible that greater board size reflects greater disagreement about
firm objectives, it would be preferable to have direct measures of differences
in board members’ objectives. For example, European firms often have em-
ployee union representation on the board, bank or debtholder representation
on the board, and in some cases, charitable foundation representation on the
board. To the extent that we have been able to find results consistent with
the theory in US nonprofit data, this suggests that multiple objectives may
in fact explain board behavior more generally.
36

References
[1] Baber, William R., Patricia L. Daniel and Andrea A. Roberts, 2002,
Compensation to managers of charitable organizations: An emipircal
study of the role of accounting measures of program activities. The Ac-
counting Review 77, 679-693.
[2] Ben-Ner, Avner and Theresa Van Hoomissen, 1991, Nonprofit organiza-
tions in a mixed economy: A demand and supply analysis. Annals of
Public and Cooperative Economics, 62, 519-50.
[3] Drucker, Peter F., 1992, Managing the non-profit organization: Princi-
ples and practices. HarperCollins Publishers, New York, NY.
[4] Duca, Diane J., 1996, Nonprofit boards: Roles, responsibilities, and
performance. John Wiley & Sons.
[5] Glaeser, Edward and Andrei Shleifer, 2001, Not-for-profit entrepreneurs.
Journal of Public Economics 81, 99-115.
[6] Grossman, Sanford and Oliver Hart, 1986, The costs and benefits of
ownership: A theory of vertical and lateral integration. Journal of Po-
litical Economy 94, 691-719.
37

[7] Hart, Oliver and John Moore, 1990, Property rights and the nature of
the firm. Journal of Political Economy 98, 1119-1158.
[8] Hermalin, Benjamin E. and Michael S. Weisbach, 2001, Boards of di-
rectors as an endogeneously determined institution: A survey of the
economic literature. UC Berkeley and University of Illinois working pa-
per.
[9] Holmstrom, Bengt and Paul Milgrom, 1987, Aggregation and linearity
in the provision of intertemporal incentives. Econometrica 55: 303-28.
[10] Holmstrom, Bengt and Paul Milgrom, 1991, Multitask principal agent
analyses—Incentive contracts, asset ownership, and job design. Journal
of Law, Economics, and Organization 7, 24-52 (Special Issue).
[11] Fama, Eugene F., and Michael C. Jensen, 1983, Agency problems and
residual claims. Journal of Law and Economics 26, 327-66.
[12] Jensen, Michael C. and Kevin J. Murphy, 1990, Performance pay and
top management incentives. Journal of Political Economy 98, 225-64.
[13] Krishnan, Ranjani, Michelle H. Yetman and Robert J. Yetman, 2006,
Expense misreporting in nonprofit organizations: An agency based
analysis. The Accounting Review 81, 399-420.
[14] Hansmann, Henry B., 1980, The role of nonprofit enterprise. Yale Law
Review, 89, 835-98.
38
[15] Hansmann, Henry B., 1996, The ownership of enterprise. Harvard Uni-
versity Press, Cambridge, MA.
[16] Lorsch, J. and E. MacIver, 1989, Pawns or potentates: The reality of
americas corporate boards. Harvard Business School Press, Boston, MA.
[17] Lynn, Laurence and Steven Smith, 2005, The performance challenge in
nonprofit organizations. University of Washington Working Paper.
[18] Rajan, Raghuram G. and Luigi Zingales, 1998, Power in a theory of the
firm. Quarterly Journal of Economics, 113, 387-432.
[19] Steinberg, Richard, 2004, The economics of nonprofit enterprises. Elgar,
Northampton, MA.
[20] Weisbrod, Burton, 1977, Toward a theory of the voluntary nonprofit
sector in a three sector economy. In Altruism, Morality and Economic
Theory, E.S. Phelps, ed, Russel Sage, NY.
39

Variable N Mean Standard Deviation Q1 Median Q3
Levels Variables a :Board Size 70,524 15.00 15.36 5.00 11.00 20.00No of Programs 70,524 2.02 1.34 1.00 1.00 3.00Total Assets, beginning of year (in $000s) 70,524 11,979.61 162,130.31 160.22 658.73 2,793.44Program Spending (in $000s) 70,524 5,420.24 36,074.74 216.94 620.56 2,179.47Total Revenue (in $000s) 70,524 7,223.83 53,621.66 307.60 868.87 2,959.57
Change Variables b :%Change in Compensation 46,501 8.73 22.15 0.00 4.99 11.71%Change in Revenue 46,501 12.25 32.00 -2.81 7.15 20.69Change in Yield 46,501 0.03 29.91 -8.66 0.43 9.93%Change in Program Spending 46,501 12.29 28.89 -0.25 7.93 19.12
Coefficient of Variation Variables c :COV, Base Compensation 24,027 10.27 11.06 3.71 6.76 12.43COV, Total Compensation 24,027 10.67 10.94 4.00 7.28 13.11
aIncludes three years of data, 1998-2000.bIncludes two years of data, 1999-2000.cNumber of unique firms is 24,027. At least two years of data per firm are required.
TABLE 1Descriptive Statistics

Ln (Board Size) Programs Ln (Assets) Ln (Revenue) %Δ Compensation %Δ Revenue Δ Yield %Δ PSpending
Ln (Board Size) 0.1738 0.3867 0.3590 0.0465 0.0227 -0.0017 0.0282<.0001 <.0001 <.0001 <.0001 <.0001 0.7196 <.0001
Programs 0.1557 0.1814 0.2174 0.0175 0.0192 -0.0013 0.0187<.0001 <.0001 <.0001 0.0002 <.0001 0.7797 <.0001
Ln (Assets) 0.3660 0.1748 0.8169 0.0258 -0.0422 0.0528 0.011<.0001 <.0001 <.0001 <.0001 <.0001 <.0001 0.0181
Ln (Revenue) 0.3401 0.2116 0.8320 0.0514 0.0989 -0.0383 0.0623<.0001 <.0001 <.0001 <.0001 <.0001 <.0001 <.0001
%Δ Compensation -0.0138 -0.0044 -0.0268 -0.0099 0.1271 0.0227 0.16810.0030 0.3476 <.0001 0.0323 <.0001 <.0001 <.0001
%Δ Revenue 0.0084 0.0121 -0.0582 0.0572 0.1520 -0.5067 0.47720.0701 0.0093 <.0001 <.0001 <.0001 <.0001 <.0001
Δ Yield -0.0067 0.0052 0.0380 -0.0436 0.0202 -0.5663 0.36930.1474 0.2659 <.0001 <.0001 <.0001 <.0001 <.0001
%Δ PSpending 0.0023 0.0080 -0.0251 0.0182 0.1893 0.5214 0.40800.6128 0.0835 <.0001 <.0001 <.0001 <.0001 <.0001
TABLE 2Univariate Correlations
Correlations of levels variables (described in Table 1) are based on 70,524 observations. Correlations of changes variables (described in Table 1) are based on 46,501 observations. Pearson (Spearman) correlations are presented below (above) the diagonal.
Orientation Firms Board Size Programs COV
Revenue 1,486 8.47 1.49 12.06 6.00 1.00 7.86
Revenue and Donation 7,432 15.11 *** 1.93 *** 10.95 ***11.33 *** 1.33 *** 7.40 **
Revenue and Government 661 10.36 *** 1.92 *** 10.72 **Grants 8.33 *** 1.00 *** 7.25 **
Revenue, Donation and 8,796 17.59 *** 2.30 *** 9.74 ***Government Grants 14.42 *** 2.00 *** 7.01 ***
Donations 2,851 13.12 *** 1.78 *** 12.71 8.67 *** 1.00 *** 8.21
Government Grants 226 9.16 1.65 ** 9.62 ***6.67 ** 1.00 *** 5.59 ***
Donation and Government 2,332 14.13 *** 1.96 *** 10.11 ***Grants 11.33 *** 1.33 *** 6.99 ***
TABLE 3
Differences in Board Size, Number of Programs and PPS Across Types of Nonprofits
Categories are determined based on average (over 3 years) values for program service revenue (Form 990, Line 2); donations (Form 990, Line 1a + Line 1b); and government grants (Form 990, Line 1c). The nonprofits orientation refers to the source of funding, program service revenue (Revenue), public support (Donation) and government funding (Government Grants). For example, "Revenue" orientation refers to nonprofits for which program service revenues is the only source of funds. Cells contain means and medians (below).
***,**,* represent significant difference vs. the "Revenue" group at the 1%, 5%, and 10% levels, respectively. Significance is based on t-test of mean differences above, and Wilcoxon rank sum test below.
Variable Board Size Ln (Board Size)Board Size -
Poisson (2000)Board Size -
Poisson (1999)Board Size -
Poisson (1998)
Constant -22.562 -0.198 -0.373 -0.3655 -0.428(-11.26) (-0.97) (-4.36) (-4.19) (-4.93)
Programs 0.927 0.073 0.046 0.050 0.040(12.49) (17.87) (35.38) (38.46) (36.36)
Ln (Assets) 2.533 0.162(43.63) (64.88)
Ln (Revenue) 0.192 0.194 0.198(192.00) (176.36) (198.00)
F-Statistics 196.06 226.62Adjusted R2 0.18 0.20 n/a n/a n/a
TABLE 4Programs and Board Size
All variables are averages for each firm over 1998-2000. Column headers describe dependent variables. There are 24,027 unique firm observations in all regressions. Industry dummies are included in all regressions. T-stats based on robust standard errors are in parentheses.

Variable (1) (2) (3) (4) (5)
Constant 13.085 12.904 12.678 12.548 13.162(2.94) (2.94) (2.82) (2.82) (2.89)
%Δ Revenue 0.166 0.193 0.240 0.258(24.23) (15.17) (13.10) (12.66)
Δ Yield 0.115 0.134 0.164 0.177(18.10) (11.34) (9.57) (9.39)
%Δ PSpending 0.224(11.98)
Programs 0.076 0.071 0.054(0.87) (0.80) (0.63)
Ln (Board Size) 0.092 0.080 0.048(0.78) (0.67) (0.41)
%Δ Revenue * Programs -0.014 -0.011(-2.71) (-2.21)
%Δ Revenue * Ln (Board Size) -0.034 -0.032(-4.70) (-4.43)
Δ Yield * No of Programs -0.010 -0.008(-2.10) (-1.72)
Δ Yield * Ln (Board Size) -0.022 -0.021(-3.38) (-3.14)
%Δ PSpending * Programs -0.010(-1.99)
%Δ PSpending * Ln (Board Size) -0.028(-4.25)
F-Statistics 76.18 69.62 71.43 65.60 65.25Adjusted R2 0.04 0.04 0.04 0.05 0.04
TABLE 5Effect of Programs and Board Size on CEO Financial Pay Performance Sensitivity
The dependent variable is the percent change in total CEO compensation for each firm for 1999 and 2000. There are 46,501 firm-year observations in each regression. Industry and year dummies are included in all regressions. T-stats, based on standard errors clustered by firm, are in parentheses.

Variable (1) (2) (3) (4)
Constant 15.868 15.685 15.725 14.887(5.68) (5.59) (5.62) (5.31)
Programs -0.189 -0.135 -0.132(-3.38) (-2.41) (-2.35)
Ln(Board Size) -0.760 -0.736(-8.52) (-8.20)
Board Size decile -0.229(-8.56)
COV (Revenue) 0.144 0.143 0.144 0.144(21.16) (21.13) (21.14) (21.16)
Ln (Assets) -0.419 -0.314 -0.300 -0.293(-11.40) (-8.30) (-7.81) (-7.55)
F-Statistics 53.40 55.86 54.14 54.21Adjusted R2 0.06 0.06 0.06 0.06
TABLE 6
All variables (except coefficient of variation) are averages for each firm over 1998-2000. The dependent variable is coefficient of variation of total CEO compensation in all specifications. There are 24,027 unique firm observations in all regressions. Industry dummies are included in all regressions. T-stats based on robust standard errors are in parentheses.
Effect of Programs and Board Size on Compensation Coefficient of Variation

Variable Pspending PspendingRevenue Growth
Revenue Growth
Constant 14.898 14.834 26.421 26.302(2.63) (2.62) (2.29) (2.28)
COV 0.275 0.277 0.216 0.221(12.52) (12.65) (10.06) (10.30)
Programs 0.246 0.471(2.02) (3.70)
Ln (Board Size) 0.500 0.998(2.79) (5.26)
Ln (Assets) -0.177 -0.293 -0.523 -0.750(-2.41) (-3.54) (-7.07) (-9.01)
F-Statistics 19.53 18.65 16.00 16.59Adjusted R2 0.02 0.02 0.02 0.02
TABLE 7
Effect of Programs, Board Size, Compensation Coefficient of Variation on Performance
All variables (except coefficient of variation) are averages for each firm over 1998-2000. The dependent variable is the average change in program spending in the first two specifications and the change in revenue in clumns 3 and 4. There are 24,027 unique firm observations in all regressions. Industry dummies are included in all regressions. T-stats based on robust standard errors are in parentheses.