accepted manuscript y.s. avadhut, j. weber, and j. schmedt
TRANSCRIPT

Accepted Manuscript
https://doi.org/10.1016/j.jmr.2017.06.012
Y.S. Avadhut, J. Weber, and J. Schmedt auf der Günne. Accurate determination of chemical shift
tensor orientations of single-crystals by solid-state magic angle spinning NMR. J. Magn. Reson.,
282:89--103, 2017.
Avadhut et al. (2017).
Accurate determination of chemical shift tensor
orientations of single-crystals by solid-state
magic angle spinning NMR
Yamini S. Avadhut [a,c], Johannes Weber [b,c], Jörn Schmedt auf der Günne*[b,c]
[a] Friedrich-Alexander-Universität Erlangen-Nürnberg
Erlangen Catalysis Resource Center
Egerlandstrasse 3, D-91058 Erlangen, Germany
[b] Universität Siegen, Department Chemie und Biologie,
Adolf-Reichweinstraße, D-57608 Siegen, Germany
[c] Ludwig-Maximilians-Universität München, Department Chemie,
Butenandtstraße 5-13 (D), D-81377 München, Germany
RECEIVED DATE (to be automatically inserted after your manuscript is accepted if required according
to the journal that you are submitting your paper to)
E-mail: [email protected]
1
Avadhut et al. (2017).
Abstract
An improved implementation of single-crystal magic-angle-spinning (MAS) NMR is presented which
gives access to chemical shift tensors both in orientation (relative to the crystal axis system) and
principal axis values. For mounting arbitrary crystals inside ordinary MAS rotors, a mounting tool is
described which allows to relate the crystal orientation determined by diffraction techniques to the rotor
coordinate system. The crystal is finally mounted into a MAS rotor equipped with a special insert
which allows a defined reorientation of the single-crystal by 90°.
The approach is based on the idea that the dispersive spectra, which are obtained when applying read-
pulses at specific rotor-phases, not only yield the size of the eigenvalues but also encode the orientation
of the different chemical shift (rank-2) tensors. For this purpose two 2D-data sets with orthogonal
crystal orientation are fitted simultaneously. The presented analysis for chemical shift tensors is
supported by an analytical formula which allows fast calculation of phase and amplitude of individual
spinning side-bands and by a protocol which solves the problem of finding the correct reference phase
of the spectrum. Different rotor-synchronized pulse-sequences are introduced for the same reason.
Experiments are performed on L-alanine and O-phosphorylethanolamine and the observed errors are
analyzed in detail. The experimental data are opposed to DFT-computed chemical shift tensors which
have been obtained by the extended embedded ion method.
2

Avadhut et al. (2017).
Introduction
The chemical shift δ is a tensor of rank 2. Despite of the fact that the full tensorial property, i.e. the
tensor eigenvalues (=principal axes values) and the tensor eigenvectors (=orientation of the principal
axes), can give valuable information about the local molecular structure, experimental determinations
of the full tensor information are comparably scarce. Most solid-state NMR investigations are restricted
to the principal axes values.1 The reasons why eigenvectors have been reported seldomly are (i)
necessary commercial goniometer probes are not widely available, (ii) homonuclear dipole-dipole
couplings may limit resolution, and (iii) low sensitivity.
Examples of such full investigations are given for various nuclei and with different NMR experiments,
for example 13C (see refs 2–6), 14 N (ref. 7), 19 F (ref. 8), 31 P (refs. 9–12), 59Co (ref. 13), and 207 Pb
(ref. 14) some of which have gained tremendous importance because the results serve as reference
values in NMR methodology development15–19 and in applications for determining bond and dihedral
angles.12,20–23 These experiments are commonly performed with the help of static measurements in
goniometer NMR probes.3,19 The possibility to obtain single crystal MAS spectra from powders24 by
selective excitation of a powder subset is a very interesting option but does not yield absolute tensor
orientations.
An alternative was introduced by Kunath-Fandrei et al.25 who suggested using magic-angle-
spinning (MAS) NMR where the rotor phase at the beginning of the read-pulse is systematically varied.
At moderate spinning frequencies the observed spectra contain a sideband pattern where the dispersive
line shapes of the individual spinning sidebands encode the chemical shift tensor orientation. The
authors showed that the sideband pattern contains enough information to determine shift tensor
eigenvectors from two different two-dimensional (2D) data sets. In their study they made use of a
single-crystal of high symmetry and a simple morphology which eased the data analysis. Klymachyov
and Dalal26 have used single crystal MAS NMR for the characterization of phase transitions. Kentgens
et al. 27,28 showed that single-crystal MAS NMR has sufficient sensitivity if combined with microcoils
to get tensor information even in case of minute crystals. Similar experiments have also been
performed for oriented polymers30. Earlier it had already been shown MAS spectra of single-crystals
become absorptive, when the rotor-phase at the read-pulse is averaged over a full revolution of the
3

Avadhut et al. (2017).
rotor ("carousel" averaging)31, which will become useful to determine the reference phase for the data
analysis.
In this work we extend the work by Kunath-Fandrei et al. in theory and hardware to allow a
routine application of this technique. To this end several issues had to be addressed: a practical way for
mounting arbitrary single-crystals in a defined way (section hardware), efficient data analysis by an
analytical formula for the line shape function (section theory) as well as an analytical protocol
including special pulse sequences which help to stabilize the baseline and define reference phase
(section pulse sequences and protocol).
During the rather long time between essentially finishing the current work (April 2011) and writing
down the current manuscript, several papers appeared, which deal with the derivation of the dispersive
side band pattern for a single crystal making use of irreducible spherical tensor representations for the
chemical shift (anisotropy) and Wigner matrices.32,33,34 Earlier the same strategy was used for the
derivation of the tensor of quadrupolar interaction27, and in fact was already introduced for arbitrary
interactions in a review by Antzutkin35 as well as the famous paper on rotating solids by Maricq and
Waugh36. Therefor, we omit this derivation, but instead provide a description in Cartesian space in
complete analogy to Herzfeld and Berger.37
4

Avadhut et al. (2017).
Theory
Coordinate systems and transformations
For the determination of tensor orientations from single-crystal MAS experiments it is convenient to
introduce seven right-handed, Cartesian coordinate systems denoted as {P, C, G, D, W, R, L} (=frames)
as shown in Figure 1. Well established in NMR under MAS conditions are the principal axis frame of a
specific interaction (P), the crystal (alternatively molecular) frame (C), the MAS rotor frame (R) and
the laboratory frame (L) in which the observation of the free induction decay (FID) is made. For single-
crystal MAS NMR we need three extra frames, because the orientation of the crystal is determined with
diffraction experiments prior to the NMR experiments on a diffractometer (frame D) while the crystal
orientation is approximately conserved by mounting it onto a goniometer adapter (G) before being
glued into a small cube (German: Würfel, W) whose orientation relative to R must be determined in
order to relate the crystal frame C to the rotor frame R. The precise definitions of the individual frames
are given as follows:
5

Avadhut et al. (2017).
6
Figure 1: Various reference frames of the experiment and sets of rotation matrices for transformations
between the (P) principal coordinate system of the chemical shift tensor, (C) crystal coordinate system,
(G) goniometer coordinate system, (D) diffractogram coordinate system, (W) cube coordinate system,
(R) MAS rotor coordinate system, and (L) laboratory coordinate system. All coordination systems are
right-handed.
Avadhut et al. (2017).
1. P is the principal axes frame. It consists of the three orthonormal eigenvectors {e1P ,e2
P ,e3P} of
the chemical shift tensor.
2. C is the crystal axes frame, whose basis vectors e iC are defined via an orthogonalization
procedure from the (real-space) crystal axes a, b, and c: e1C=a /∣a∣ , e2
C=b−b⋅e1
C/∣b−b⋅e1
C∣ ,
e3C=e1
C×e2
C . In case of a cubic or orthorhombic crystal the expressions simplify to e1C=a /∣a∣ ,
e2C=b /∣b∣ , e3
C=c /∣c∣ . In case of a monoclinic crystal the axes are e1
C=a /∣a∣ , e2
C=b /∣b∣ ,
e3C=e1
C×e2
C=c*/∣c*∣ , where c* is the third basis vector of the reciprocal cell.
3. G is the goniometer adapter frame. The origin of its basis vectors e iG is located at the
intersection point of the rotation axis and the fixation plane. e1G points away from the notch in
the base ring of the adaptor, e2G is along the rotation axis (and perpendicular to the fixation
plane) of the adaptor pointing towards its tip, and e3G=e1
G×e2
G .
4. W is the frame of the cube (german: ”Würfel”), that hosts the single-crystal and is inserted to
the MAS rotor. Three cube faces were marked with different hatching (vertical-red-lines,
horizontal-green-lines, cross-blue-lines) and assigned as the normal planes of e iW , i=1,2,3 ,
respectively. The face marked with cross-lines contains the borehole, i.e. e3W is parallel with the
long axis of the cylindrical borehole. e1W and e2
W are chosen along the intersecting edges of
horizontal-green-cross and vertical-red-cross line faces, respectively. Parallel placement of
cube W in the rotor is defined as e1W being parallel to the rotor axis e1
R (defined below) with
e1W⋅e1R=1 , e2
W⋅e2
R=1 , and e3
W⋅e3
R=1 ; perpendicular placement means that e1
W⋅e3
R=1 ,
e2W⋅e2
R=1 , and e3
W⋅e1
R=−1 via rotating the cube by 90° around e2
W .
5. D is the diffractometer frame. It is close (but not identical) to G with its basis vectors defined
as: e1D=e2
D×e3
D is perpendicular to the rotation axis of the goniometer and the X-ray beam
(pointing away from the CCD camera in the parking position on our diffractometer), e2D is
along the rotation axis (and identical to e2G ) and e3
D is pointing towards X-ray beam source. In
our case, we found that D differs from G via clockwise rotation by 0.56 ° around e2G . The
7

Avadhut et al. (2017).
diffractometer frame may vary for different diffractometers.
6. R is the (MAS) rotor axis system, and defined by: e3R is the rotor spinning axis, e1
R is along the
line from the center towards a point on the rotor wall at which the anticlockwise rotation is
optically detected using white-to-black contrast, and e2R=e3
R×e1
R .
7. L is the Lab coordinate system. It is defined by: e3L is along the external magnetic field B0 ,
e1L is perpendicular to e3
L and lies in the plane spanned by the symmetry axis of the solenoid
coil and B0 , and e2L=e3
L×e1
L .
The relative orientations between any two frames can be expressed by direction cosines or alternatively
by Euler angles.38 A general rotation matrix R to transform a vector or a tensor from one coordinate
system (A) to another (B) can be decomposed as the product of the three individual rotations
R (ΩAB)=R(α AB , βAB , γ AB)=R z(α)R y '(β)R z ' ' (γ ) , (1)
where AB is the symbol denoting a set of Euler angles AB , AB , AB and R z , R y ' ,
R z ' ' are rotation matrices in Cartesian space which describe a rotation around z -axis by an angle
, rotation around the newly formed y ' -axis by an angle and a last rotation around the newly
formed z ' ' -axis through , respectively.38. Here, the {x , y , z} indicates the starting reference frame
axes while primes on the axes denote the intermediate rotated frames. The R AB rotation matrix
with the set of Euler angles AB , AB , AB is defined as,
R (ΩAB)=(cos γAB sin γ AB 0−sin γ AB cos γ AB 0
0 0 1)⋅(
cosβAB 0 −sinβAB
0 1 0sinβAB 0 cosβAB
)⋅(cosαAB sin αAB 0−sinα AB cosαAB 0
0 0 1) , (2)
We followed the Rose convention38 and passive rotations as described by Schmidt-Rohr and Spiess39
for the definitions of Euler angles and rotation matrices.
8
Avadhut et al. (2017).
Analytic treatment of single-crystal MAS NMR signals
In Fourier-transform NMR, the spectrum S (ω) of a single nucleus n can be described by40
S (ω)=aL(ω ;ωnL ,λn)exp {i(θ+θ0)} , (3)
where S ∈ℂ is a complex valued function depending on the frequency , the signal amplitude a
, the Larmor frequency of the nucleus ωnL , the peak-width parameter λ n , the signal phase θ , and the
phase correction angle of zeroth order θ0 used in post processing of the NMR spectrum. The complex
Lorentzian, L, is defined as
L(ω ;ωnL ,λn )=
λn
λn2+(ω−ωn
L)2
⏟A
+i−(ω−ωn
L)
λn2+(ω−ωn
L)
2
⏟D
, (4)
A is called the absorption Lorentzian, D the dispersion Lorentzian. Both θ and θ0 do not depend on
. θ0 is adjusted during the post processing ("phasing") of the NMR spectrum, so that θ+θ0=0 ,
which causes the real part of a carousel averaged 1-crystal NMR spectrum to have a purely absorptive
line shape
Re[S (ω)]=aA(ω ;ωnL ,λn) , (5)
At present, solid-state NMR spectra of crystalline compounds are mostly recorded for powdered
samples, which forms a perfect carousel average and hence can be phased to purely absorptive line
shapes. If the nucleus under investigation is bound in a low-symmetric environment, the chemical shift
anisotropy (CSA) leads to a signal broadening, which reflects the dependency of the resonance signal
on the different orientations of the crystallites (or more accurately: the chemical shift tensor) with
respect to the magnetic field. Under MAS conditions at moderate spinning frequencies (νrot<δanisoνref )
the CSA is partly averaged out, so that the resonance signal splits into a central band and various
spinning sidebands (SSBs), all of which have the same signal phase θ . Thus, the spectrum remains
purely absorptive. In the following we will drop the subscript n which refers to nuclei from different
chemical environments.
Contrarily, in rotor-synchronized MAS NMR spectra of single crystalline (non-powdered) samples the
phases of the SSBs generally differ from one another so that no phasing to a purely absorptive
spectrum is possible. Instead, the line shape of each SSB is a mixture of absorptive and dispersive parts
9

Avadhut et al. (2017).
depending on the tensor orientation in the magnetic field.36,41 By rotor-synchronization we understand
in this context, that the radio frequency (rf) excitation pulse is fixed with respect the rotor position. If
the rf excitation is evenly distributed over the rotor phase, e.g. by numerous excitations at random
times, the single-crystal MAS spectra show purely absorptive line shapes similar to powdered
sample.41,42 The complex NMR signal S t , which is obtained by43,
S t ~tr {t I +} , (6)
where I += I xi I y is a shift operator. For the time-dependent Hamiltonian, using Baker-Hausdorff
relation for time evolution series39, the density matrix is proportional to,
ρ(t)=exp∫0
tiωLdt=exp i{−γnuc B0∫0
tδ zz
L dt} , (7)
In this work, we follow the classical approach of Herzfeld et al.,37 but extend it to the
calculation of the intensities and the phases of dispersive spinning sidebands. Figure 2 shows the
chosen laboratory coordinate system. Under MAS conditions the sample is spun at an angular
frequency r around the rotor axis e3R which has an angle RL relative to the applied magnetic field
B0 . The field lines of the latter lie along e3L . Hence, in the R-frame the sample sees the direction of
the static magnetic field oscillating according to the following equation (see also Figure 2)
e3L
R=sin RL cosRL ,sin RL sinRL ,cos RL , (8)
where
RL=0RLr t , (9)
10

Avadhut et al. (2017).
is the rotation angle of the rotor measured at time t relative to an offset α0RL .
The precession frequency of a given spin is
L=−nuc B0 B0⋅
R⋅B0
T , (10)
where δR is the chemical shift tensor for that spin in a molecule/crystal expressed in the rotor axis
frame. R may be obtained from C , which is the shift tensor expressed in the orthogonalized crystal
coordinate system, according to
R=R CR R PC⋅
P⋅R−1
PC R−1CR , (11)
where P is the chemical shift tensor in the principal axis frame P in which the chemical shift
tensor is diagonal.
P=
xxP
0 0
0 yyP 0
0 0 zzP . (12)
11
Figure 2: The coordinate system with the rotor axis frame as reference; the (0,0,1) vector is the axis of
rotation of the sample; B0 is a unit vector in the direction of the applied magnetic field.37
Avadhut et al. (2017).
In the secular approximation only the z-component of L is of interest in the laboratory frame (L),
whose relation to δiso and the components δiiR is obtained by combination of equation (10) and (11):
zzL=[ iso
12
3cos2RL−1 zz
R−iso]sin2
RL [ 12 xxR− yy
R cos 2RL xyR sin 2RL]
2sin RL cos RL [ xzR cosRL yz
R sinRL](13)
Evaluation of L , combining equations (7) and (13) and, shows that it contains a time independent
term, a term which oscillates through αRL at 2ωr , and a term which oscillates at r ,
ωL=(−γnuc B0)(δiso+
12
(3cos2 βRL−1) (δ zzR−δiso)+
sin2β RL[ 12
(δxxR−δ yy
R )cos (2α RL)+δxyR sin(2α RL)]+
2sin βRL cos βRL (δ xzR cosα RL+δ yz
R sin α RL) )
. (14)
For the magic angle βRL=βmagic=arccos(1/√3) , the term (3cos2βRL−1) in equation (14) becomes
zero, and hence
L
= −nuc B0iso23
xxR
2cos2RL−
yyR
2cos 2RL xy
R sin 2RL22
3 xz
R cosRL yzR sin RL
(15)
The free induction decay for the entire sample is given by equation (7)
12

Avadhut et al. (2017).
ρ(t)=exp {i θ(α PL ,βPL , γPL ,t )} = exp{ i (−γnuc B0 )((δiso t )+ (1
2ωr)(
23 )[
δxxR
2sin 2αRL−
δxxR
2sin 2α0
RL]−(
12ωr
)(23 ) [
δ yyR
2sin 2αRL+
δ yyR
2sin 2α0
RL ]+
(1
2ωr)(
23 ) [δxy
R sin (2αRL−π2 )−δxy
R sin (2α0RL−π
2 )]+( 1
ωr )(2√2
3 ) [δxzR sinαRL−δxz
R sin α0RL ]+
( 1ωr )(
2√23 )[δyz
R sin (αRL−π2 )−δyz
R sin (α0RL−π
2 ) ]) }
(16)
The NMR signal generated by any pulse sequence can be expressed as,40
S (t)=∑NaN exp {i(ωN t+θN)}exp {−t /T 2} , (17)
where, a N is the N th sideband intensity, N is the N th sideband resonance frequency, θN is the
N th sideband phase of the signal component, and 1/T2 is a damping rate constant. Hereafter 1/T 2 is
neglected for simplicity of an analytical function. Equation (16) can be expressed in the form of
equation (17) using the following property of the Bessel functions of the first kind44–46
exp {i zsin }= ∑n=−∞
∞
J n z exp {i n} . (18)
It follows that
exp {i [θ0+C 1sin θ1+C2 sin θ2+ .....+Cnsin θn ] }=
∑n1=−∞
∞
∑n2=−∞
∞
..... ∑nn=−∞
∞
J n1(C1) J n 2
(C2) ... J nn(Cn) × exp {i [θ0+n1 θ1+n2 θ2+...+nn θn ] }
. (19)
Thus, equation (16) becomes,
13

Avadhut et al. (2017).
ρ(t)=exp {iθ(αPL ,βPL , γPL ,t )} =∑j=−∞
∞
J j(κ xxR) ∑
j'=−∞
∞
J j '(κxxR) ∑
k=−∞
∞
J k (κyyR) ∑
k '=−∞
∞
J k ' (κyyR)
∑l=−∞
∞
J l(κxyR) ∑
l '=−∞
∞
J l ' (κxyR) ∑
m=−∞
∞
J m(κxzR)
∑m'=−∞
∞
Jm ' (κxzR) ∑
n=−∞
∞
J n(κyzR) ∑
n '=−∞
∞
J n ' (κyzR) ×
exp { i( −γnuc B0δ iso t+ωr t (2 j−2k+2 l+m+n )+
α0RL
[2 ( j− j ' )−2(k−k ')+2(l−l ' )+(m−m' )+(n−n ')]
−π2
[(l−l ' )+(n−n ')]) }
, (20)
where,
κxxR=−γnuc B0(
12ωr
)(δxx
R
3 ) ∧ κyyR=−γnuc B0(
12ωr
)(δyy
R
3 ) ,
xyR=−nuc B0 1
2r 2
3 xyR
,
xzR=−nuc B0 1
r 22
3 xzR
∧ yzR=−nuc B0 1
r 22
3 yzR
.
(21)
The free induction decay in equation (20) consists of a central resonance at the isotropic chemical shift
and a series of non-absorptive spinning sidebands spaced r apart.
The intensities and the phases of the sidebands
As per Herzfeld et al.,37 it is convenient to call the sideband located at N r from the isotropic
resonance the N th sideband. If the position of the isotropic resonance is not known, the N th sideband
may be identified as the line which moves N r when the spinning speed is changed by r .
Using N=2 j−2k+2 l+m+n as substitution in equation (20), the relative intensity and the phase of
the N th sideband is
14

Avadhut et al. (2017).
SN = ∑j=−∞
∞
J j(κxxR) ∑
j '=−∞
∞
J j ' (κxxR) ∑
k=−∞
∞
J k(κyyR) ∑
k '=−∞
∞
J k ' (κyyR)∑
l=−∞
∞
J l(κxyR)
∑l'=−∞
∞
J l ' (κxyR) ∑
m'=−∞
∞
J m ' (κxzR) ∑
n=−∞
∞
J n(κyzR) ∑
n '=−∞
∞
J n ' (κyzR) J N−2j+2k−2l−n(κxz
R)
× exp { i( α0RL
[2 ( j− j ' )−2(k−k ')+2(l−l ' )
+(N−2 j+2 k−2 l−n−m' )+(n−n ' )]
−π2
[(l−l ' )+(n−n ' )] ) }
(22)
The infinite sums and Bessel's function in equation (22) may be eliminated by using following
property44–46,
J n z =1
2∫0
2
exp {i z sin−i n }d . (23)
and equation (18).
The resultant equation can be written as
SN = exp{ i (−κxxR sin(2α0
RL)+κyy
R sin (2α0RL)
+κxyR cos(2α0
RL)−κxz
R sin(α0RL)+κyz
R cos(α0RL)) }
×1
2π∫0
2π
exp{ i(α0RL−θ)N+κxx
Rsin(2θ)−κyy
Rsin(2θ)−κxy
Rcos (2θ)
+κxzR sin(θ)−κ yz
R cos(θ) } dθ
(24)
Equation (24) is an analytical function to calculate the intensities and the phases of the dispersive
spinning sidebands, encoded in the complex valued SN.
Symmetry related shielding tensors in single-crystals
It has been recognized early that two crystallographically equivalent nuclei (CEN), i.e. a pair of nuclei
which belongs to the same crystallographic site (alias two representatives of a crystallographic orbit in
IUCR terminology47), do not necessarily have the same shielding tensor contribution for a given
orientation in a single crystal NMR experiment.48 Although these nuclei and their electronic
environments are related to one another by some symmetry operation, the orientation of their
15

Avadhut et al. (2017).
corresponding nuclear magnetic shielding tensors relative to the magnetic field vectors can be different.
This becomes manifest in single crystal NMR rotation plots where some of the CEN show different
chemical shifts depending on the crystal orientation, while others don´t. For example, four different
NMR signals are visible from the eight crystallographically equivalent 31P nuclei the unit cell of 2-
aminoethyl-phosphonic acid.9 Single-crystal MAS-NMR spectra which are in the focus of the present
work are affected by this inequivalence as well. In order to decide whether two CEN have the same
shielding tensor contribution to the Hamiltonian or not, it is helpful to investigate the symmetry
relationships between them, which are given for all possible space groups in the International Tables
Of Crystallography Volume A.47 Two CEN will in general have the same contribution if their tensors
have the same orientation, we thus call them “orientationally equivalent” to distinguish this case from
the terms “chemical equivalence” and “magnetic equivalence” which have been defined in different
ways depending on context.40,49
The question whether two representatives are orientationally equivalent can be answered by
investigation of the symmetry elements of the space group: A pair of CEN related by a translation or an
inversion will be orientationally equivalent, since the (symmetric part of the) chemical shift tensor is
invariant to these symmetry operations. However, other symmetry operations like reflections, rotations
and rotoinversions by angles different from 360° lead to orientational inequivalence. To find out
orientational (in)equivalences quickly, and to derive the orientations of shielding tensors of nuclei from
the same crystallographic orbit, we follow the general approach described in chapter 11.1 of ref.47 and
set up a transformation matrix Wk and a translation vector wk . The vector wk can be omitted for
the reason mentioned above. Although these matrices define transformations in fractional coordinate
space, their principal character stays the same when transformed to orthogonalized Cartesian
coordinates. The latter transformation is needed to calculate the reorientation of the shielding tensor of
a magnetically inequivalent site.
In SIMPSON50,51 simulations of the single-crystal NMR spectra care must be taken for orientationally
inequivalent nuclei and a simulation for each of them has to be done. In order to save computational
resources, the individual orientations can be simulated as separate spin systems. A different strategy
was used by Hansen et al. 52. The observed spectrum is a superposition of the orientationally
inequivalent nuclei, with the relative abundance of the respective orientations as weights.
16
Avadhut et al. (2017).
Phase correction for single-crystal MAS NMR / Phase reference in single-crystal MAS NMR
In general, single-crystal NMR spectra under MAS are dispersive in nature. The line shape of each
spinning sideband of single-crystal spectra has a particular phase which is given by equation (24) 36,41.
In single-crystal MAS NMR, the signal phase is important as it provides information about chemical
shift tensor orientation. In order to obtain a stable phase reference we use the fact that a single-crystal
MAS NMR spectrum averaged over an infinite number of evenly spaced starting angles αPR generates
an absorptive spectrum, which has been termed carousel averaging.31
An interesting question is how many uniformly spaced starting angles αPR will be necessary to get an
sufficiently absorptive spectrum for phase referencing in single-crystal MAS NMR. Figure 3 shows the
signal averaging for various numbers N c of seats in carousel. It is observed that the absorptive
character of the spectrum rapidly improves for increasing an increasing number of seats N c . For
example, the absorptive character for a spectrum with N c=20 (Figure 3), shows a signal phases below
0.05° for the four sidebands of highest intensity. The number N c necessary to achieve a close-to-
absorptive spectrum may however depend on the chemical shift tensor.
17

Avadhut et al. (2017).
18
Figure 3: Signal averaging of single-crystal magic angle spinning spectra for (I) N c=2 , (II) N c=5 ,
(III) N c=10 , and (IV) N c=20 being the number of “seats”, i.e. starting angles αRL in the carousel
average; a sufficiently absorptive spectrum is observed for N c=20 (IV); numerical simulation
parameters are: ωr /2π=1.5kHz , chemical shift anisotropy parameter δaniso=−68.3ppm , and
asymmetry parameter η=0.76 ; single-crystal orientation specified by Euler angles αPR=350 ° ,
βPR=95° , and γPR=100 ° .

Avadhut et al. (2017).
Experimental Details
Hardware
Single-crystal MAS NMR in principle can be done without any specialized hardware. However, if the
aim of the investigation is the determination of the chemical shift tensor orientation in the
(orthogonalized) crystal axes system, the crystal has to be either of a simple morphology25 or its
orientation, i.e., the orientation of the crystallographic unit cell in the laboratory frame, has to be
determined independently. A convenient way to determine it is offered by standard diffraction
techniques. In the following we describe two home-made tools which represent a minor financial
investment comparable to a few ceramic rotors, which allowed us to use a standard MAS probe for
single-crystal MAS NMR experiments. The basic idea is to transfer the information about the crystal
orientation from the goniometer of the diffractometer into a MAS rotor insert, by gluing the crystal into
a small cube which can then be put into a cubic void of an insert which fits the cylindric void of a MAS
rotor as described in Figure 4.
Single-crystal mounting equipment
In Figure 4-I a tool is shown which can be used for mounting a single-crystal with a dimension of about
1 mm3 in a magic angle spinning (MAS) rotor. This equipment comprises the following parts. A
standard goniometer is used to measure a single-crystal orientation on an X-ray diffractometer. The
goniometer adapter ( c ) with known orientation of the single-crystal can be screwed on the goniometer
holder ( b ) that is fixed permanently to plate ( a ). The cube ( e ) with 2 mm3 dimension is tightened to
a movable cube holder ( f ). The cube is made from polychlorotrifluoroethylene (PCTFE or Kel-F).
Single-crystal is transferred with a linear bearing into the opening of a cube with a cylindrical void with
known orientation. The single-crystal can be glued into the cube using suitable glue for example 2-
components epoxy resine.
19

Avadhut et al. (2017).
Rotor insert
To determine the orientation of the single-crystal in the MAS rotor, it is necessary to achieve the light
detection mark which has a fixed position on the rotor. This can be achieved using a specially designed
rotor with three parts, a rotor insert with a bottom cap as a single piece ( j ) which can be inserted/fixed
in a both open ended 4 mm ZrO2 MAS rotor ( k ) with a drive cap ( l ) on the top as shown in Figure 4-
II. The rotor insert is made of black polyoxymethylene (POM) material. A small middle strip of the
bottom cap of the insert is replaced by white polyvinyl chloride (PVC) to achieve the fixed light
20
Figure 4: A complete hardware assembly for a rotorsynchronized magic angle spinning NMR
experiment of a single-crystal; a base plate a ; a goniometer holder b ; a goniometer adapter c with
the single-crystal i a rod d ; a cube e ; a movable cube holder f ; tightening screws g ; an adjustment
wheel h ; a black polyoxymethylene rotor insert with a cavity for the cube e and a white mark
inserted in bottom cap as a single piece j ; and a 4 mm both open end MAS rotor k with a drive cap
l .

Avadhut et al. (2017).
detection mark on the MAS rotor for spin detection. At the center of the insert, a cubic hole is pressed
with the exact dimensions of the sample cube, so that the single-crystal is located in the homogeneous
part of the rf coil. Finally, the complete rotor insert including the sample cube as a single unit is placed
in a both open ended 4 mm ZrO2 MAS rotor ( k ) with a drive cap ( l ) (Figure 4-II).
The cube assembly gives freedom to choose two different orientations for a
rotorsynchronized MAS NMR of a single-crystal, which is sufficient to allow a high-accuracy
determination of the chemical shift tensor orientations.
Phase corrected rotorsynchronized pulse sequence
In single-crystal MAS NMR the signal phase is of utmost importance, because it is the observable from
which the chemical shift tensor orientation is determined. A simple one-pulse excitation scheme which
previously25 has been used to measure single-crystal MAS NMR spectra has the disadvantage that the
dead time delay needs to be compensated for by zeroth and first order phase correction of the spectra,
which in turn introduces baseline rolling and a phase error which increases the further away a sideband
is from the pivot-point.53 A properly setup spin-echo experiment, where the delay after the -pulse
has been optimized as to minimize the need for a first-order phase correction has the advantage that the
phase and amplitude of the individual spinning sidebands can be measured with higher accuracy. We
therefor introduce a rotor-sychronized spin-echo experiment and doubly rotor-synchronized ramped
cross-polarization followed by a spin-echo experiment which reduce phase-distortions to a tolerable
level and are described in the following.
Figure 5-I shows a phase compensated 2D rotor-synchronized spin echo experiment. For
rare spins (e.g. 13C, 15N) to achieve sensitivity, a doubly rotor-synchronized ramped based cross-
polarization (CP-RAMP)54 followed by a spin-echo pulse sequence55,56 is shown in Figure 5-II. In this
pulse sequence the first trigger signal ( t trig ), activated when the black-to-white contrast of the rotor
meets the detector of the MAS unit, initiates the ramped based cross-polarization (CP-RAMP)
sequence. After this the 13C/X magnetization in the xy-plane is restored to the z-direction by a /2
pulse on X-channel which is 90° out of phase with first /2 pulse on H-channel. When the rotor
phase reaches its starting value for the next time, a second trigger signal is executed. It is then waited
for a programmable t1 period before executing the rotorsynchronized spin-echo pulse sequence.
21

Avadhut et al. (2017).
22
Figure 5: Rotorsynchronized two-dimensional (2D) experiments: (I) A modified 2D spin-echo pulse
sequence; (II) A 2D CP-RAMP followed by a modified rotorsynchronized spin-echo pulse sequence
used for single-crystal measurements; t trig is the trigger signal; r designates a rotor period; is a
small delay which has to be determined once from powder measurement so that (small) first-order
phase corrections become unnecessary as explained in the reference.56

Avadhut et al. (2017).
Experimental protocol
The following protocol contains the necessary steps to perform the chemical shift tensors analysis using
the rotorsynchronized cross-polarization spin-echo MAS NMR of a single-crystal.
1. Determine the spectrometer constant/timing 0RL , which is spectrometer specific and depends
on the time delay between the trigger signal t trig and rf pulse. It has to be done only once. To
determine 0RL : Do following 2-8 steps for a reference sample where the chemical shift tensor
orientations are known from different sources for example from point group symmetry, static
single-crystal experiments or from quantum chemical calculations.
2. Fix a single-crystal on a goniometer adapter and determine the orientation matrix by an X-ray
measurement ⇒ RCG .
3. Fix the goniometer adapter on the mounting equipment (Figure 4, b ) and transfer the single-
crystal into the cube (Figure 4, e ) without changing its orientation, RGW . Glue the single-
crystal into the cube.
4. Transfer the sample cube (Figure 4, e ) by placing the cube coordinate system parallel to the
rotor coordinate system into the rotor insert (Figure 4, j ) and place the insert into the MAS
rotor (Figure 4, k ), RWR , so-called parallel orientation.
5. Obtain the phase corrected rotorsynchronized single-crystal MAS NMR spectra using pulse
sequences shown in Figure 5 which does not require unwanted subsequent baseline corrections
of the spectrum.
6. Similarly, obtain the rotor-synchronized single-crystal MAS NMR spectra for the second
orientation by rotating the cube around e2W
by 90° in the MAS rotor insert to so-called
perpendicular orientation.
7. Obtain the both orientations of the single-crystal in the MAS rotor system with the help of
different frame transformations as shown in Figure 1, R(ΩCR) .
8. Determine the chemical shift tensor orientations from a grid search followed by a least square
fitting procedure of simulated data with experimental data using the (modified32) SIMPSON
23

Avadhut et al. (2017).
program.50,51
Experimental Section
Sample preparation
Single-crystals of 13C1-labeled L-alanine (CAS No. 21764-56-7) and O-phosphorylethanolamine (CAS
No. 1071-23-4) are grown from saturated aqueous solutions. The commercial L-alanine (13C1, 99%
enriched) and O-phosphorylethanolamine samples are purchased from the Cambridge Isotope
Laboratories Inc. and Sigma, respectively. The L-alanine crystals are orthorhombic and belong to
space-group P212121 (No. 19) with four molecules per unit cell. The unit cell parameters a=6.063 A ,
b=12.261 A , c=5.785 A and the fractional coordinates have been determined by neutron
diffraction.57,58 The O-phosphorylethanolamine crystals are monoclinic and belong to the spacegroup
P 21/ c with four molecules per unit cell. The unit cell parameters a=9.015 A , b=7.745 A ,
c=8.788A , and =102.51 ° and fractional coordinates have been determined by neutron
diffraction.59
Solid state NMR spectroscopy
All experiments are performed on a Bruker Avance-III NMR spectrometer operating at a resonance
frequency of 500.13 MHz for 1H, 125.75 MHz for 13C, and 202.45 MHz for 31P. A commercial 4 mm
triple-resonance MAS probe is used for the slow rotation of the single-crystals. The size of the crystal
is chosen such that it fits into the cube (for L-alanine 1.2 mm×0.8 mm×0.9 mm and for O-
phosphorylethanolamine 0.9 mm×1.0 mm×0.8 mm ). The L-alanine and O-phosphorylethanolamine
crystals are spun at 1.5 kHz and 4 kHz, respectively. Principal axes values of the 13C chemical shift
tensor for the L-alanine were determined from a least-square fitting procedure of a simulated spectrum
to an experimental slow MAS NMR spectrum as described in ref. 32. For the L-alanine experiment, 256
scans with repetition time delay of 3 s are accumulated per row. In total 20 different measurements are
performed at changing rotor position (rotor phase γCR obtained by varying t1) at the time of pulse
irradiation by 18° between each experiment. Contact time of 3 ms is used for all experiments.
Saturation pulse combs are applied prior to relaxation delays in all experiments to prepare the identical
initial spin system for each transient. During all pseudo-2D experiments, we used t1 increments and 2D
24

Avadhut et al. (2017).
data acquisition.
Computational details
Quantum chemical calculations of absolute magnetic shielding tensors were performed. The
experimentally determined structure of L-alanine from neutron diffraction at room temperature57 served
as input structure. The calculations were performed with the Extended Embedded Ion Method (EEIM),
an embedded cluster approach in which the quantum cluster (QC, i.e. the quantum chemically treated
region) is placed in an exact, self-consistent electrostatic potential, which is obtained from first
principles, i.e. without empirical parameters. For details on the EEIM we refer to ref. 60.
Two different QCs were created for EEIM calculations. The first QC included only a single
alanine molecule ([L-ala]1, see Figure 6 a), the second QC consisted of 15 alanine molecules ([L-ala]15,
see Figure 6 b). The pcS-2 basis set61 as stored in the Gaussian basis set library62,63 was used for [L-
ala]1, whereas a locally dense basis was used for QC [L-ala]15, where atomic basis functions (AOs) are
assigned on the basis of a spherical shell expansion around the central alanine molecule (see 60 for
details). In the innermost shell (shell range r1=[0,2.5[ Å atomic basis functions of the pcS-2 type
were used, whereas for the second shell range, r2=[ 2.5,6 .0 [ Å the pc-1 basis64 was used. In the third
shell range, r3≥6.0 Å the CEP-4G basis plus pseudo potentials as shipped with the GAUSSIAN 03
program were used. Further details on the cluster setup are listed in Table 1.
The GAUSSIAN 0365 program package was used for electronic structure calculations within
EEIM. The hybrid density functional mPW1PW66 is used throughout with tight convergence criteria for
the SCF. Quadrature in the DFT calculations was performed on a pruned grid of 99 radial shells and
590 angular points per shell on each atom. Atomic charges were obtained by NBO population
analysis-,67 absolute nuclear magnetic shielding tensors by the GIAO method.68
Isotropic chemical shifts iso and shift tensor eigenvalues ii are calculated from the
corresponding absolute shielding values by the conversion equation
ii , calc
13 C= ii , calc
13 C−A
B, i=1,2,3 . (25)
with A = 184.599 ppm and B = -1.07156, that was derived from internal calibration of the shielding
tensor eigenvalues. (Figure S1 in the supplementary information shows the correlation of experimental
25

Avadhut et al. (2017).
and calculated shielding tensor eigenvalues and the calibration line that was used to determine the
parameters A and B in equation (25).) Chemical shift anisotropy parameters (CSA) are given in the
Haeberlen-Mehring-Spiess convention49,69,70 i.e. in terms of the reduced anisotropy aniso=ccP− iso and
the asymmetry =bbP− aa
P/ aniso , where the shift tensor principal axes eigenvalues 11
P , 22P , 33
P
have been sorted according to ∣ ccP−iso∣≥∣aa
P− iso∣≥∣ bb
P−iso∣ .
By default the GAUSSIAN program changes the orientation of the molecular clusters to the so-called
standard orientation of molecular spectroscopy, which is inconvenient for the specification of the
shielding tensor orientation, however. By means of a suitable rotation matrix of the kind of equation (2)
we transformed the tensors to a locally defined “molecular” (M) Cartesian coordinate system or in
terms of the crystal coordinate system (C). While we focus on the latter one for brevity in the
following, the orientation in the “molecular” frame has some conceptual advantages and is given in the
Supplemental Information.
Table 1: Setup of cluster calculations for L-alanine.
Calc.
No
Cluster definitions
QC Typea Setupb
1 [L-ala]1
Figure 6a
EIM mPW1PW level, pcS-2 basis for all atoms; N a=7 , N b=4 , N c=7 , ⌊N 1N 2 ⌋=500 ,
N rcp=1500 ; rms=2.23×10⁻¹⁰ V
2 [L-ala]15
Figure 6b
EEIM mPW1PW level, basis in shell range r 12.5 : pcS-2 for all atoms; range 2.5≤r26.0 :
pcS-1 for all atoms range r3≥6.0 : CEP-4G basis plus pseudo potentials for all atoms;
N a=7 , N b=4 , N c=7 , ⌊N 1N 2 ⌋=600 , N rcp=2300 ; rms=3.88×10⁻⁷ Va EIM=embedded ion method, EEIM=extended embedded ion method.
b formula ri = shortest distance to one of the atoms of the central alanine molecule, for the meaning of other symbols see
ref. 60
26

Avadhut et al. (2017).
27
Figure 6: Quantum clusters chosen for EEIM calculations on L-alanine. (a): [L-ala]1, (b): [L-ala]15; all
atomic sites of the central alanine unit serve as reference points for the local basis expansion; atomic
site labels as in crystal structure.

Avadhut et al. (2017).
Results and Discussion
In order to validate the proposed protocol and the hardware assembly for single-crystal MAS NMR
experiment, single-crystals of L-alanine and O-phosphorylethanolamine are considered as model
systems. These are well investigated compounds both with respect to their crystal structures57–59 and
with respect to chemical shift tensors whose orientations are known from static single-crystal NMR
measurements with a goniometer probe.2,6,21,71
The following section starts with the discussion on the proposed protocol followed by single-
crystal MAS NMR spectra for various orientations. We further discuss critical error sources which
could prevent routine application of this method. Finally we discuss the derived analytical function and
quantum chemical calculations.
A 13C slow MAS-NMR spectrum of a L-alanine powdered sample is recorded (see Figure 7) to
obtain the chemical shift tensor eigenvalues and chemical shift anisotropy (CSA) parameters. The
28
Figure 7: Slowly rotated 13C{1H} CP-MAS NMR spectrum MAS=500Hz of powdered L-alanine
(bottom) and simulated spectrum (top) using the SIMPSON program;50,51 the optimized CSA
parameters are shown in the 2.

Avadhut et al. (2017).
spectrum shows three distinct signals CA , CB and CC at iso CA=177.1 ppm , iso CB=50.2ppm
and iso CC =19.1ppm , respectively, whose assignment to the crystallographic sites has been
reported in ref. 2 and is affirmed by the EEIM calculations: site C1 corresponds to signal CA, C2 to CB,
and C3 to CC (see also Fig. 6a). Experimental eigenvalues and CSA parameters for 13C are derived from
sideband patterns of the slow MAS NMR spectrum and are given together with the calculated ones in
2. Experimental and calculated values are in good agreement with root mean square deviations of
RMSD isoexp ,iso
calc=0.7ppm for isotropic chemical shifts and RMSD iiexp ,ii
calc=1.5 ppm for the nine
shift tensor eigenvalues.
Table 2: Experimental and calculated 13C chemical shift parameters of L-alanine. Calculated values use
the site labeling of the crystal structure (see Figure 6), experimental signals are labeled in Figure 7.
Isotropic chemical shifts are given in col. 3, CSA values in cols. 4+5. For convenience the principal
axes values of the chemical shift tensor are given in col. 6-8.
Exp. and Calc. sites δiso/ppm b δaniso/ ppm b η δ11 /ppm b δ22 /ppm b δ33 /ppm b ref
Experiment
calc. 2 (Figure 6 b)
(calc. 1 (Figure 6 a)
CA
C1
C1
177.09
175.3c
177.4d
176.2e
173.09f
176.8g
176.4
177.1
-70.73
-70.33c
-70.33g
-72.8
-73.1
0.77
0.81c
0.78g
0.745
0.766
239.76
239.0c
239±4g
239.8
241.7
185.16
182.0c
184±3g
185.6
185.7
106.36
105.0c
106±1g
103.6
104.0)
This work
2
2
2
2
71
This work
This work
Experiment
calc. 2 (Figure 6 b),
(calc. 1 (Figure 6 a)
CB
C2
C2
50.22
50.7d
50.5e
49.44f
50.9g
51.1
52.1
-18.96
-19.66g
-20.8
-22.7
0.59
0.35g
0.502
0.444
65.36
63±1g
66.8
68.4
54.05
56±1g
56.3
58.4
31.27
30±3g
30.3
29.4)
This work
2
2
2
71
This work
This work
Experiment CC 19.73
20.0d
19.5e
11.49 0.96 31.23 19.54 8.42 This work
2
2
29
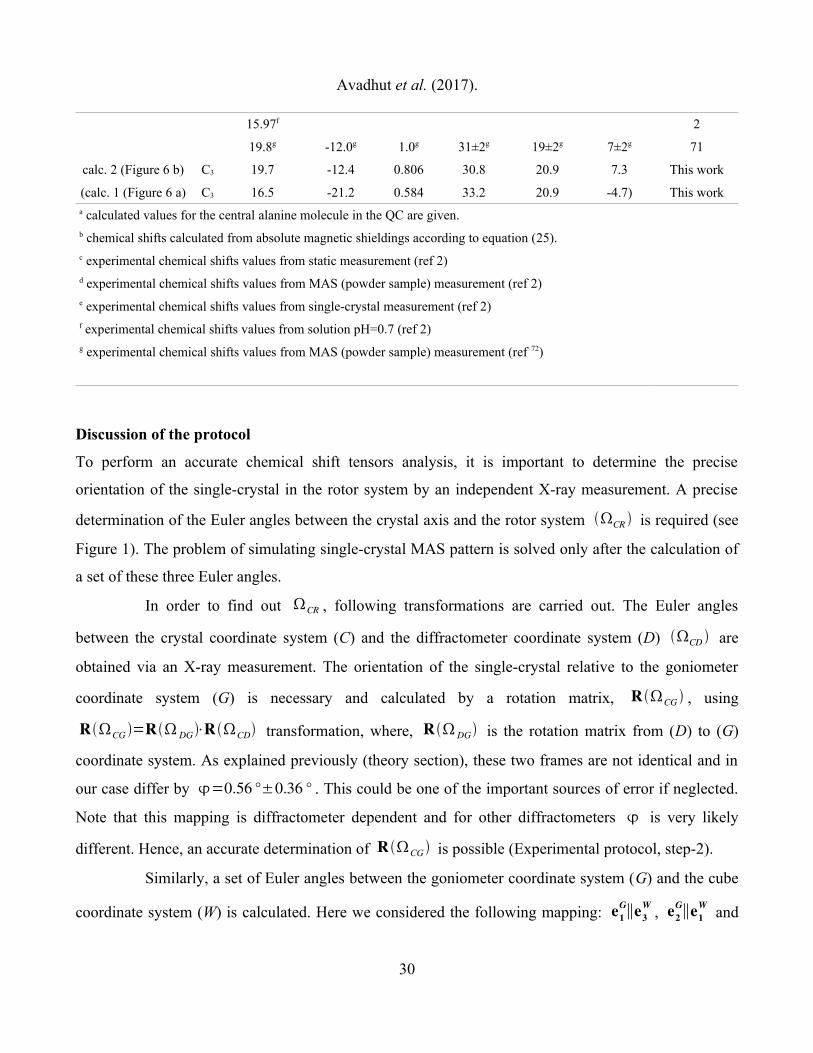
Avadhut et al. (2017).
calc. 2 (Figure 6 b)
(calc. 1 (Figure 6 a)
C3
C3
15.97f
19.8g
19.7
16.5
-12.0g
-12.4
-21.2
1.0g
0.806
0.584
31±2g
30.8
33.2
19±2g
20.9
20.9
7±2g
7.3
-4.7)
2
71
This work
This worka calculated values for the central alanine molecule in the QC are given.b chemical shifts calculated from absolute magnetic shieldings according to equation (25).c experimental chemical shifts values from static measurement (ref 2)d experimental chemical shifts values from MAS (powder sample) measurement (ref 2)e experimental chemical shifts values from single-crystal measurement (ref 2)f experimental chemical shifts values from solution pH=0.7 (ref 2)g experimental chemical shifts values from MAS (powder sample) measurement (ref 72)
Discussion of the protocol
To perform an accurate chemical shift tensors analysis, it is important to determine the precise
orientation of the single-crystal in the rotor system by an independent X-ray measurement. A precise
determination of the Euler angles between the crystal axis and the rotor system CR is required (see
Figure 1). The problem of simulating single-crystal MAS pattern is solved only after the calculation of
a set of these three Euler angles.
In order to find out CR , following transformations are carried out. The Euler angles
between the crystal coordinate system (C) and the diffractometer coordinate system (D) CD are
obtained via an X-ray measurement. The orientation of the single-crystal relative to the goniometer
coordinate system (G) is necessary and calculated by a rotation matrix, RCG , using
RCG =R DG⋅RCD transformation, where, RDG is the rotation matrix from (D) to (G)
coordinate system. As explained previously (theory section), these two frames are not identical and in
our case differ by =0.56 °±0.36 ° . This could be one of the important sources of error if neglected.
Note that this mapping is diffractometer dependent and for other diffractometers is very likely
different. Hence, an accurate determination of RCG is possible (Experimental protocol, step-2).
Similarly, a set of Euler angles between the goniometer coordinate system (G) and the cube
coordinate system (W) is calculated. Here we considered the following mapping: e1G∥e3W
, e2G∥e1W
and
30
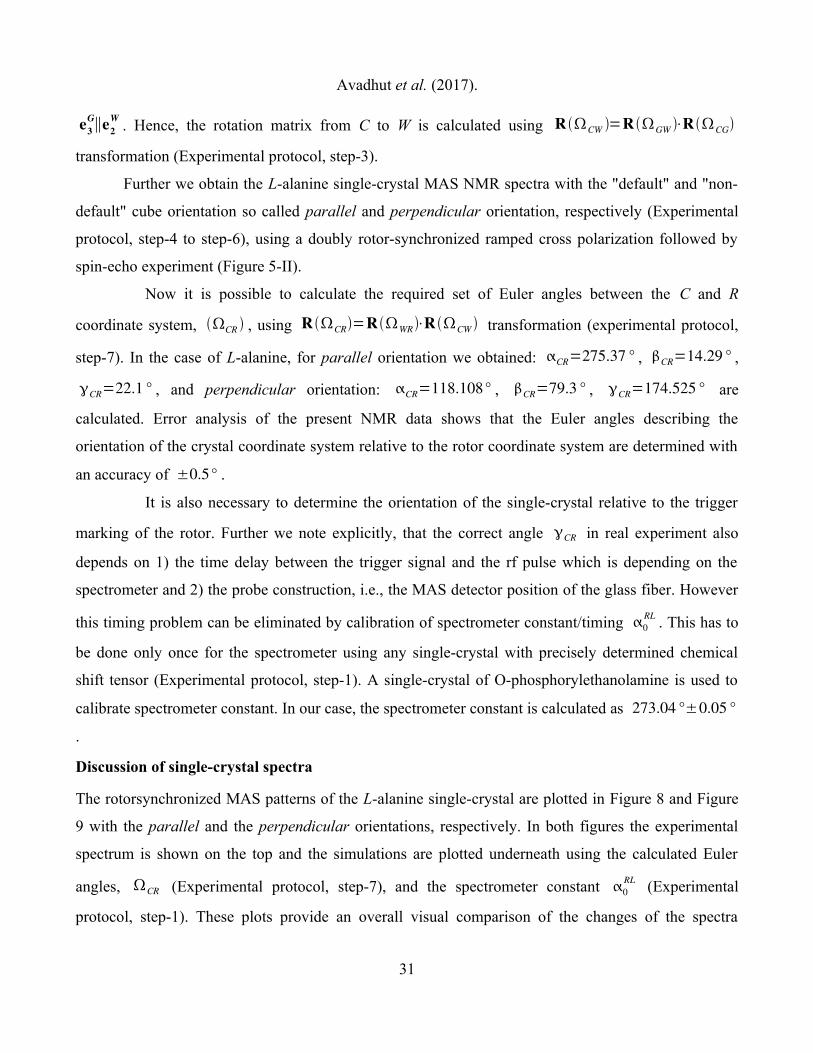
Avadhut et al. (2017).
e3G∥e2W
. Hence, the rotation matrix from C to W is calculated using R CW =R GW ⋅RCG
transformation (Experimental protocol, step-3).
Further we obtain the L-alanine single-crystal MAS NMR spectra with the "default" and "non-
default" cube orientation so called parallel and perpendicular orientation, respectively (Experimental
protocol, step-4 to step-6), using a doubly rotor-synchronized ramped cross polarization followed by
spin-echo experiment (Figure 5-II).
Now it is possible to calculate the required set of Euler angles between the C and R
coordinate system, CR , using RCR=RWR⋅RCW transformation (experimental protocol,
step-7). In the case of L-alanine, for parallel orientation we obtained: CR=275.37 ° , CR=14.29° ,
CR=22.1 ° , and perpendicular orientation: CR=118.108° , CR=79.3 ° , CR=174.525 ° are
calculated. Error analysis of the present NMR data shows that the Euler angles describing the
orientation of the crystal coordinate system relative to the rotor coordinate system are determined with
an accuracy of ±0.5° .
It is also necessary to determine the orientation of the single-crystal relative to the trigger
marking of the rotor. Further we note explicitly, that the correct angle CR in real experiment also
depends on 1) the time delay between the trigger signal and the rf pulse which is depending on the
spectrometer and 2) the probe construction, i.e., the MAS detector position of the glass fiber. However
this timing problem can be eliminated by calibration of spectrometer constant/timing 0RL . This has to
be done only once for the spectrometer using any single-crystal with precisely determined chemical
shift tensor (Experimental protocol, step-1). A single-crystal of O-phosphorylethanolamine is used to
calibrate spectrometer constant. In our case, the spectrometer constant is calculated as 273.04 °±0.05 °
.
Discussion of single-crystal spectra
The rotorsynchronized MAS patterns of the L-alanine single-crystal are plotted in Figure 8 and Figure
9 with the parallel and the perpendicular orientations, respectively. In both figures the experimental
spectrum is shown on the top and the simulations are plotted underneath using the calculated Euler
angles, CR (Experimental protocol, step-7), and the spectrometer constant 0RL (Experimental
protocol, step-1). These plots provide an overall visual comparison of the changes of the spectra
31
Avadhut et al. (2017).
depending on the rotor position which is indicated by the angle CR .
Clearly, the two spectra sets are distinctly different as is to be expected because in the first
case, the cube axes are parallel to the rotor axes whereas in the second case, it is perpendicular when
rotating around the e2W
axis by 90°. The spectral extension of the spinning sidebands are comparable
due to fact that that angle between rotor axis and the external magnetic field B0 is ≈54.74° . After a
full rotor period identical MAS spectra are obtained in the both cases.
32

Avadhut et al. (2017).
In this test case of L-alanine, the orientation of the 13C1 chemical shift tensor is determined with the
33
Figure 8: Comparison of (top) experimental rotorsynchronized 13C{1H} CP-MAS NMR spectra of L-
alanine with (bottom) simulations for cube axes parallel to the rotor axes; the simulation parameters
are: δ11=239.7 ppm δ22=185.1ppm , δ33=106.3 ppm , αPC=348.87 ° , βPC=94.99° ,
γPC=127.92 ° , αCR=275.37° , βCR=14.29 ° , γCR=22.1 ° , and α0RL=273.04 ° .

Avadhut et al. (2017).
help of exact initial orientation of the single-crystal when the rf pulse is applied. The problem of
simulating both the orientation patterns is simplified since only the rotor angle CR is found for which
the simulation of the MAS pattern taken for the whole rotor cycle, matches the experimental spectrum
(Experimental protocol, step-8). The result is shown in the bottom spectrum of the Figure 8 and the
Figure 9. It is now possible to follow the various changes of the line shapes as functions of the rotor
angle and there is clearly convincing coincidence between the simulated data and the experimental
data.
34

Avadhut et al. (2017).
35
Figure 9: Comparison of (top) experimental rotorsynchronized 13C{1H} CP-MAS NMR spectra of L-
alanine with (bottom) simulations for cube axes perpendicular to the rotor axes; the simulation
parameters are: 11=239.7 ppm 22=185.1 ppm , 33=106.3 ppm , PC=348.87° , PC=94.99 ° ,
PC=127.92° , CR=118.1° , CR=79.3 ° , CR=174.52 ° , and 0RL=273.04 ° .
Avadhut et al. (2017).
Error analysis
There are minor deviations between the simulated and the experimental pattern possibly due to the
following error sources. One of the major source of error is instabilities in the MAS frequency.
Typically, for 1.5 kHz±1 Hz sample spinning frequency, the error is about ±0.24 ° . The rotation of
the single-crystal inside the rotor does not cause any instabilities, possibly because the plastic insert
adds a significant amount of mass which is homogeneously distributed in the rotor. As described in the
hardware section, the cube was chosen such that it fits into the rotor insert but it does not mean that it is
tightly fixed by the rotor insert wall. In our case, the cube has an angular deviation of 0.024° inside the
rotor insert along the rotor axis. Hence it might well be the case that the crystallographic axis can be
tilted slightly with respect to the rotor axis during measurements which causes the error in the Euler
angle set RCR (see Figure 1 and protocol step-7). Another source of error can be from X-ray
diffractometer which can determine the crystal to laboratory orientation within 0.01 ° accuracy which
affects/influences the staring Euler angle set R(ΩCG) (see Figure 1 and protocol step-2). Moreover, a
further source of error could be caused by fixing the single-crystal from the goniometer into the
cylindrical void of the cube and hence the set of Euler angle R(ΩGW ) (see Figure 1 and protocol step-
3). However, in our case this possible source of error is negated by holding the mounting tool
vertically. Some minor errors can occur while fixing the standard goniometer adapter on the
homemade single-crystal mounting tool (Figure 4) which is neglected in this work.
The simulations have shown, that the chemical shift tensors and their orientations in the
crystal coordinate system can be determined with an accuracy about ±1 ° . The angular deviations of
the tensor orientations from the single-crystal MAS and the traditional static single-crystal NMR2, and
the single-crystal MAS and the quantum chemical calculations are given in the supplemental
information for the three tensor eigenvectors e iPC1i=1,2,3 .
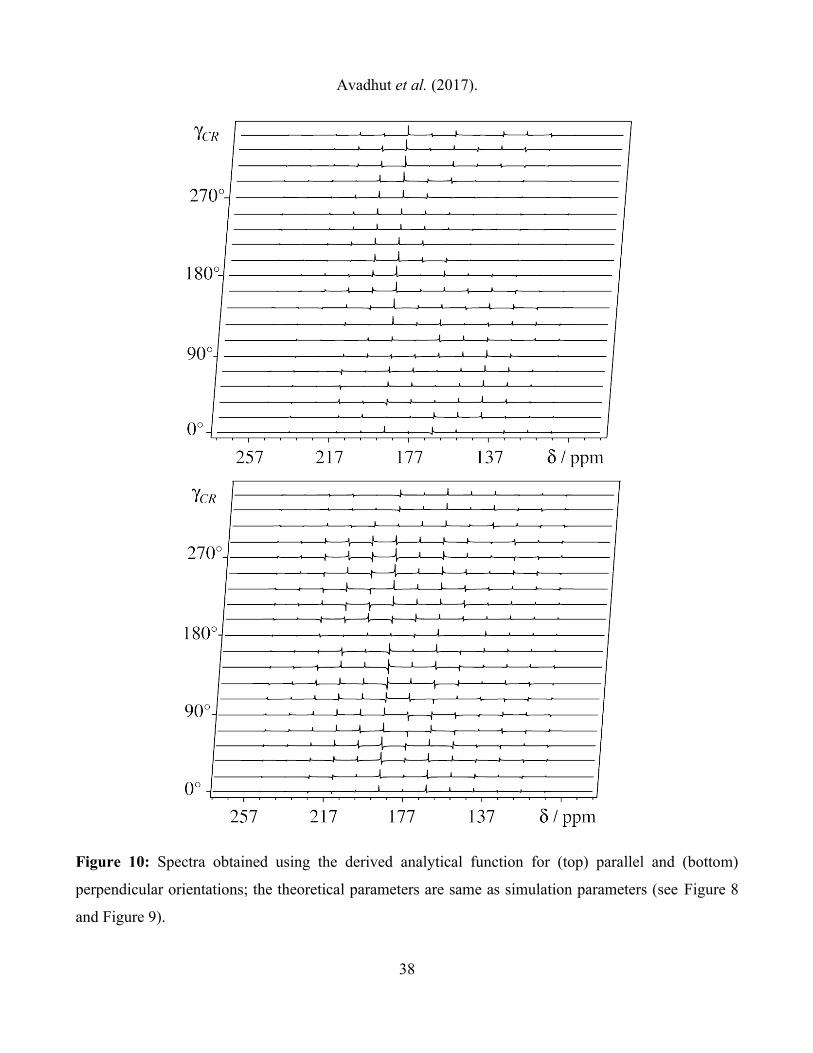
Numerical Validation
In order to estimate an accuracy for the orientation determination, we have evaluated the complete set
of rotorsynchronized spectra over a full rotor period using the derived analytical function. For the
parallel and the perpendicular orientations, the line intensities and the phases of the dispersive spinning
36

Avadhut et al. (2017).
sidebands are plotted in the Figure 10. The calculated intensities and the phases of complete 2D
patterns for both the orientations are seen to agree closely with experimentally measured values.
37
Avadhut et al. (2017).
38
Figure 10: Spectra obtained using the derived analytical function for (top) parallel and (bottom)
perpendicular orientations; the theoretical parameters are same as simulation parameters (see Figure 8
and Figure 9).

Avadhut et al. (2017).
To compare the simulated spectra and the spectra obtained from the derived analytical function
with the experimental data in more detail few selected slices taken from Figure 9 and Figure 10
(bottom), respectively, are shown in Figure 11. The simulated spectra and the spectra from the
analytical function are slightly shifted towards left (b) and right (c) with respect to the experimental
spectra (a), such that all line shapes can be compared more easily. Additionally, the sum projection
from all rotor positions obtained by experiment is compared with the simulated sum projection by
using calculated CR , CR , and CR for both the orientations (shown in the supplementary
information) which shows all spinning sidebands are absorptive and positive.
The chemical shift tensor orientations of the 13C1 with respect to the crystal coordinate system
obtained by the MAS and the static NMR is shown in Figure 12. Additionally, tensor direction cosines
of the 13C1 from the MAS and the static are compared in reference 3. Hence, we can anticipate that with
the presented approach, the determination of the chemical tensors including their orientations can be
made as precise as with the traditional static single-crystal NMR.
39
Figure 11: Comparison of three slices for perpendicular orientation of the rotorsynchronized MAS
NMR spectra (a) with the corresponding simulations (b) taken from Figure 9 and spectra obtained
using the derived analytical function (c) taken from Figure 10 (bottom); the simulated spectra and the
spectra obtained by the analytical function are slightly shifted towards the left and the right to the
experimental spectra, respectively.
Avadhut et al. (2017).
Orientation relative to the crystal axis system
The orientation of the chemical shift tensors with respect to the crystal axes a, b, c is shown in Figure
12 and is given in terms of direction cosines in Table 3. The tensors are shown in ellipsoid
representation73 with eigenvectors of principal axis system relative to the crystal axis system. Table 3
contains also the Euler angles for the rotation matrices R PC C1 ,PC C1 ,PC C1 which
transform the P- of site C1 to the C coordinate system as well as the Euler angles for the rotation matrix
R CP C1 ,CP C1 , CP C1 for the back-transformation from the C- to the P- coordinate system.
The chemical shift tensors of symmetry-related, crystallographically identical sites (e.g. C1a and C1b)
have different orientations relative to the crystal axis system.
The values obtained by single-crystal MAS compare well with those from Naito et al.2 and
with calculated ones obtained with the EEIM method (see Figure 12 and T
40

Avadhut et al. (2017).
41
Figure 12: 13C chemical shift tensors orientation of 13C1-labeled L-alanine in comparison to the
molecular frame and the crystal axis system {e1,C e2,C e3C} from MAS (thick), static (intermediate), and
EEIM (thin); all C-atoms were created by symmetry operation (x, y, z); tensors are shown in ellipsoid
representation60 with eigenvectors e1P
(red), e2P
(green), and e3P
(blue) relative to the crystal axis
system ( e1C
(red), e2C
(green), and e3C
(blue)); atomic site labels as in crystal structure.

Avadhut et al. (2017).
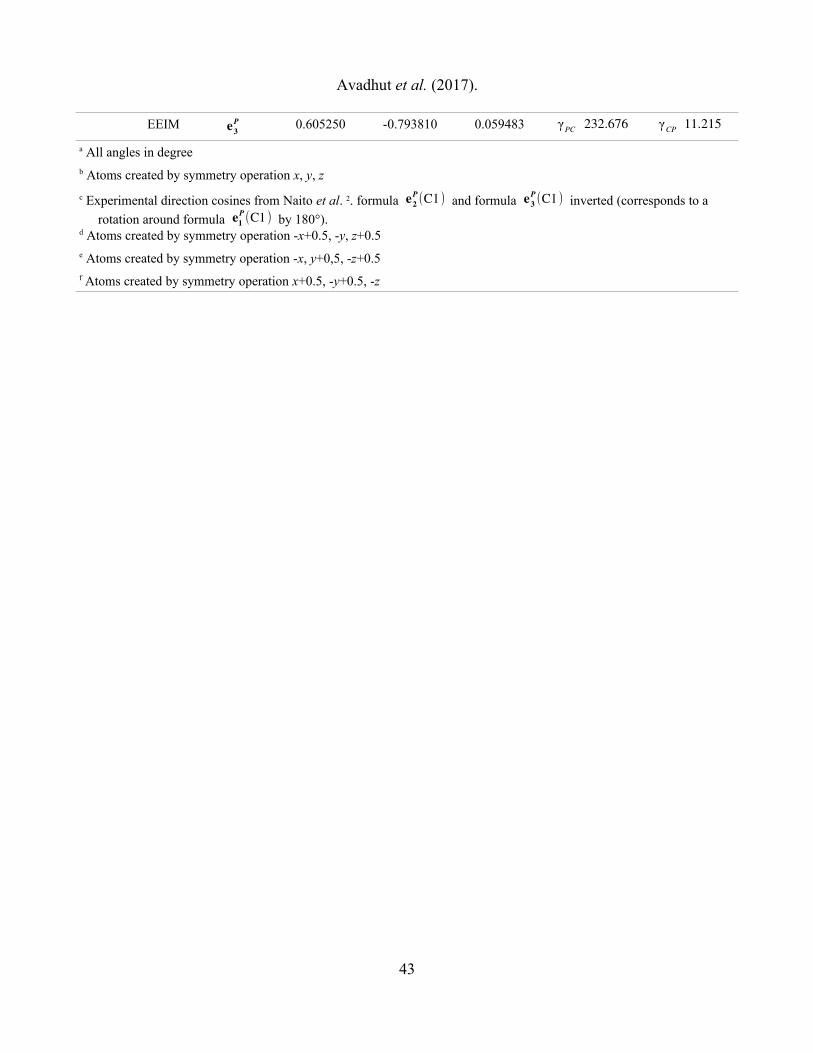
Table 3: Direction cosines of chemical shift tensors of 13C1-labeled L-alanine to the respective crystal
coordinate system
Site Method Eigenvectors e1C e2
C e3C Euler Anglesa Euler Anglesa
C1b
(COO-)
(carboxy)
MAS e1P 0.203786 -0.052516 0.977605 PC 348.869 CP 52.079
Staticc e1P 0.2005 -0.0719 0.9771 PC 348.669 CP 52.963
EEIM e1P 0.190040 -0.071526 0.979167 PC 348.785 CP 52.676
MAS e2P 0.763899 -0.616009 -0.192330 PC 94.899 CP 94.899
Static e2P 0.7737 -0.6025 -0.2029 PC 93.7154 CP 93.7154
EEIM e2P 0.773018 -0.603945 -0.194147 PC 93.4101 CP 93.4101
MAS e3P 0.612314 0.785986 -0.085416 PC 127.919 CP 191.129
Static e3P 0.6011 0.7966 -0.0648 PC 127.038 CP 191.331
EEIM e3P 0.605250 0.793810 -0.059483 PC 127.324 CP 191.215
C1d
(carboxy)
MAS e1P -0.203786 0.052516 0.977605 PC 348.869 CP 232.079
EEIM e1P -0.190040 0.071526 0.979167 PC 348.785 CP 232.676
MAS e2P -0.763899 0.616009 -0.192330 PC 94.899 CP 94.899
EEIM e2P -0.773018 0.603945 -0.194147 PC 93.4101 CP 93.4101
MAS e3P -0.612314 -0.785986 -0.085416 PC 307.919 CP 191.129
EEIM e3P -0.605250 -0.793810 -0.059483 PC 307.324 CP 191.215
C1e
(carboxy)
MAS e1P -0.203786 -0.052516 -0.977605 PC 168.869 CP 127.920
EEIM e1P --0.190040 -0.071526 -0.979167 PC 168.785 CP 127.324
MAS e2P -0.763899 -0.616009 0.192330 PC 85.100 CP 85.100
EEIM e2P -0.773018 -0.603945 0.194147 PC 86.5899 CP 86.590
MAS e3P -0.612314 0.785986 0.085416 PC 52.080 CP 11.129
EEIM e3P -0.605250 0.793810 0.059483 PC 52.6759 CP 11.215
C1f
(carboxy)
MAS e1P 0.203786 0.052516 -0.977605 αPC 168.869 αCP 307.920
EEIM e1P 0.190040 0.071526 -0.979167 αPC 168.785 αCP 307.324
MAS e2P 0.763899 0.616009 0.192330 βPC 85.100 βCP 85.100
EEIM e2P 0.773018 0.603945 0.194147 βPC 86.5899 βCP 86.590
MAS e3P 0.612314 -0.785986 0.085416 γPC 232.080 γCP 11.129
42
Avadhut et al. (2017).
EEIM e3P 0.605250 -0.793810 0.059483 γPC 232.676 γCP 11.215
a All angles in degreeb Atoms created by symmetry operation x, y, z
c Experimental direction cosines from Naito et al. 2. formula e2P(C1) and formula e3
P(C1 ) inverted (corresponds to a
rotation around formula e1P(C1 ) by 180°).
d Atoms created by symmetry operation -x+0.5, -y, z+0.5e Atoms created by symmetry operation -x, y+0,5, -z+0.5f Atoms created by symmetry operation x+0.5, -y+0.5, -z
43
Avadhut et al. (2017).
Conclusions
For the first time, we have shown that rotor-synchronized single-crystal MAS-NMR spectra can give
access to full tensor information (eigenvalues and eigenvectors), even if the tensor has an arbitrary
orientation with respect to the crystal frame. We have given a full implementation in theory as well as
in hardware and have suggested a protocol, which can be used to obtain accurate chemical shift tensor
orientations with respect to any of the typically used frames, of which the crystal or the molecular
frame are frequently used.
A cost-effective homemade single-crystal mounting tool provides high accuracy for mounting and
remounting a single-crystal in various orientations inside the magic angle spinning rotor with the
stability of MAS frequency. The proposed hardware assembly is a mandatory, essential, and primary
requirement to use this method as a routine tool and may be transferred to different rotor types as well
as rotor sizes. The specialized homemade rotor insert design achieves stable spinning frequencies up to
15 kHz. A thorough/detailed experimental protocol based on phase corrected, rotor-synchronized pulse
sequences leads to full chemical shift tensor information as precise as with typical static single-crystal
NMR experiments. An analytical function is derived to calculate the intensities and phases of the
dispersive line shape of the spinning sidebands and yields shift tensor orientations that agree closely
(deviations below ±1 ° in Euler angles) with calculated values or those determined by static
experiments. The derived analytical function may lead to a software development for deconvolution
since it allows fast calculation of single-crystal MAS spectra. As an example, the chemical shift tensor
orientations of 13C1-labeled L-alanine in the crystal coordinate system are determined and supported by
quantum chemical EEIM calculations.
The potential advantages of this method are low cost, large resolution enhancement, use of
standard MAS probes, and considerable time saving compared to the traditional static single-crystal
NMR. Further, this method offers better spectral resolution in case of small single-crystals due to
suppression of dipole-dipole couplings by magic angle spinning. A foreseeable application is to obtain
chemical shift tensor orientations in partially oriented materials. Also, this method can be extended to
all other rank 2 interaction tensors detectable by NMR. An extension to quadrupolar tensors/electric
field gradients by the piggyback/microcoil design was already done in the mean time27, although for a
simple case, where the quadrupolar tensor orientation coincides with the symmetry axes of the crystal.
44

Avadhut et al. (2017).
Our method can be used as a routine/standard tool to determine the tensors in arbitrary orientations
with respect to the crystal frame. Furthermore, it could become useful to study motion and dynamics in
crystals, for example ion dynamics, which would add a spatial dimension to the NMR analysis which is
lacking in many of the standard NMR techniques. Finally, tensor orientation data may help to
determine the space-group in difficult cases, that are not solvable by X-ray diffraction alone. When the
accuracy shielding tensor orientations is of primary interest, the selective excitation of similarly
oriented crystallites may only comprise a tiny subset, which has a effectively smaller sample volume
than the our used single crystals.
Acknowledgment
We gratefully acknowledge financial support through the Emmy-Noether program of the DFG
(SCHM1570-2). We also grateful to Prof. Dr. W. Schnick for the possibility to use the facilities at the
chair of inorganic solid-state chemistry. We thank the Leibniz-Rechenzentrum for computational
resources. We acknowledge to Prof. Dr. O. M. Oeckler and Prof. Dr. U. Müller for useful discussions.
We also thank C. Minke and T. Miller for technical support.
Supporting Information Available
References
(1) MacKenzie, K. J. D.; Smith, M. E. Multinuclear Solid-State Nuclear Magnetic Resonance ofInorganic Materials; Pergamon, 2002; Vol. 6.
(2) Naito, A.; Ganapathy, S.; Akasaka, K.; McDowell, C. A. J. Chem. Phys. 1981, 74 (6), 3190.(3) Lauterbur, P. Phys. Rev. Lett. 1958, 1 (9), 343.(4) Janes, N.; Ganapathy, S.; Oldfield, E. J. Magn. Reson. 1983, 54 (1), 111.(5) Sherwood, M. H.; Alderman, D. W.; Grant, D. M. Journal of Magnetic Resonance (1969) 1989,
84 (3), 466.(6) Vinding, M. S.; Kessler, T. O.; Vosegaard, T. Journal of Magnetic Resonance 2016, 269, 120.(7) Haberkorn, R. A.; Stark, R. E.; Van Willigen, H.; Griffin, R. G. J. Am. Chem. Soc. 1981, 103
(10), 2534.(8) Griffin, R. G.; Ellett, J. D.; Mehring, M.; Bullitt, J. G.; Waugh, J. S. J. Chem. Phys. 1972, 57 (5),
2147.
45
Avadhut et al. (2017).
(9) Van Calsteren, M.; Birnbaum, G. I.; Smith, I. C. P. J. Chem. Phys. 1987, 86 (10), 5405.(10) Kohler, S. J.; Ellett, J. D.; Klein, M. P. J. Chem. Phys. 1976, 65, 2922.(11) Kohler, S. J.; Ellett, J. D.; Klein, M. P. J. Chem. Phys. 1976, 64 (11), 4451.(12) Herzfeld, J.; Griffin, R. G.; Haberkorn, R. A. Biochem. 1978, 17 (14), 2711.(13) Spiess, H. W.; Haas, H.; Hartmann, H. J. Chem. Phys. 1969, 50 (7), 3057.(14) Lauterbur, P. C.; Burke, J. J. J. Chem. Phys. 1965, 42 (1), 439.(15) Pausak, S.; Pines, A.; Waugh, J. S. J. Chem. Phys. 1973, 59 (2), 591.(16) Pines, A.; Chang, J. J.; Griffin, R. G. J. Chem. Phys. 1974, 61 (3), 1021.(17) Pausak, S.; Tegenfeldt, J.; Waugh, J. S. J. Chem. Phys. 1974, 61 (4), 1338.(18) Honkonen, R. S.; Doty, F. D.; Ellis, P. D. J. Am. Chem. Soc. 1983, 105 (13), 4163.(19) Vosegaard, T.; Langer, V.; Daugaard, P.; Hald, E.; Bildsoe, H. Rev. Sci. Instrum. 1996, 67 (6),
2130.(20) Griffin, R. G.; Powers, L.; Pershan, P. S. Biochem. 1978, 17 (14), 2718.(21) Kohler, S. J.; Klein, M. P. Biochem. 1976, 15 (5), 967.(22) Kohler, S. J.; Klein, M. P. Biochem. 1977, 16 (3), 519.(23) Murray, D. K.; Harrison, J. C.; Wallace, W. E. J. Colloid Interface Sci. 2005, 288 (1), 166.(24) Pell, A. J.; Pintacuda, G.; Emsley, L. The Journal of Chemical Physics 2011, 135 (14), 144201.(25) Kunath-Fandrei, G. H.; Kelbauskas, L.; Döring, D.; Rager, H.; Jäger, C. Phys. Chem. Miner.
1998, 26 (1), 55.(26) Klymachyov, A. N.; Dalal, N. S. Zeitschrift für Physik B Condensed Matter 1997, 104 (4), 651.(27) Vasa, S. K.; Ernst, R. H. van E.; Janssen, J. W. G.; Kentgens, A. P. M. Phys. Chem. Chem. Phys.
2010, 12, 4813.(28) Kentgens, A. P. M.; Bart, J.; van Bentum, P. J. M.; Brinkmann, A.; van Eck, E. R. H.;
Gardeniers, J. G. E.; Janssen, J. W. G.; Knijn, P.; Vasa, S.; Verkuijlen, M. H. W. J. Chem. Phys.2008, 128 (5), 052202.
(29) Kentgens, A. P. M.; Bart, J.; van Bentum, P. J. M.; Brinkmann, A.; van Eck, E. R. H.;Gardeniers, J. G. E.; Janssen, J. W. G.; Knijn, P.; Vasa, S.; Verkuijlen, M. H. W. The Journal ofChemical Physics 2008, 128 (5), 052202.
(30) Harbison, O. S.; Spiess, H. W. Chem. Phys. Lett. 1986, 124 (2), 128.(31) Levitt, M. H. J. Magn. Reson. 1989, 82 (2), 427.(32) Avadhut, Y. Quantitative solid state nuclear magnetic resonance methods for inorganic materials.
Text.PhDThesis, Ludwig-Maximilians-Universität München, 2012.(33) Pell, A. J.; Pintacuda, G. Progress in Nuclear Magnetic Resonance Spectroscopy 2015, 84–85,
33.(34) Pell, A. J.; Clement, R. J.; Grey, C. P.; Emsley, L.; Pintacuda, G. J. Chem. Phys. 2013, 138 (11),
114201.
46

Avadhut et al. (2017).
(35) Antzutkin, O. N. Prog. Nucl. Magn. Reson. Spectrosc. 1999, 35 (3), 203.(36) Maricq, M. M.; Waugh, J. S. J. Chem. Phys. 1979, 70 (7), 3300.(37) Herzfeld, J.; Berger, A. E. J. Chem. Phys. 1980, 73 (12), 6021.(38) Rose, M. E. Elementary Theory of Angular Momentum; Dover Publications Inc., 1995.(39) Schmidt-Rohr, K.; Spiess, H. W. Multidimensional Solid-State NMR and Polymers; Academic
Press, 1994.(40) Levitt, M. H. Spin Dynamics: Basics of Nuclear Magnetic Resonance, 2nd ed.; John Wiley &
Sons, 2008.(41) Olejniczak, E. T.; Vega, S.; Griffin, R. G. J. Chem. Phys. 1984, 81 (11), 4804.(42) Antzutkin, O. N.; Shekar, S. C.; Levitt, M. H. J. Magn. Reson. A 1995, 115 (1), 7.(43) Mehring, M. High-Resolution NMR in solids, in NMR Basic Principles and Progress; Springer,
Berlin, 1976; Vol. 11.(44) Kreyszig, E. Advanced Engineering Mathematics, 10th ed.; Wiley, 2011.(45) Arfken, G. B.; Weber, H. J. Mathematical Methods for Physicists, Fourth Edition, 4th ed.;
Academic Press, 1995.(46) Abramowitz, M.; Stegun, I. A. Handbook of mathematical functions with formulas, graphs, and
mathematical tables; Courier Dover Publications, 1964.(47) Hahn, T. International tables for crystallography, Volume A, 5th ed.; Springer Dordrecht: The
Netherland, 2005; Vol. A.(48) Weil, J. A.; Buch, T.; Clapp, J. E. In Advances in Magnetic and Optical Resonance; John S.
Waugh, Ed.; Academic Press, 1973; Vol. Volume 6, pp 183–257.(49) Mehring, M. Principles of High Resolution NMR in Solids, 2nd ed.; Springer-Verlag Berlin,
1983; Vol. 87.(50) Bak, M.; Rasmussen, J. T.; Nielsen, N. C. J. Magn. Reson. 2000, 147 (2), 296.(51) Vosegaard, T.; Malmendal, A.; Nielsen, N. C. Monatshefte für Chemie 2002, 133 (12), 1555.(52) Hansen, M. R.; Vosegaard, T.; Jakobsen, H. J.; Skibsted, J. J. Phys. Chem. A 2004, 108 (4), 586.(53) Slichter, C. P. Principles of Magnetic Resonance, 3rd ed.; Springer Berlin Heidelberg, 1992.(54) Metz, G.; Wu, X. L.; Smith, S. O. J. Magn. Reson. A 1994, 110 (2), 219.(55) Hahn, E. Phys. Rev. 1950, 80 (4), 580.(56) Avadhut, Y. S.; Schneider, D.; Schmedt auf der Günne, J. J. Magn. Reson. 2009, 201 (1), 1.(57) Wilson, C. C.; Myles, D.; Ghosh, M.; Johnson, L. N.; Wang, W. New J. Chem. 2005, 29 (10),
1318.(58) Lehmann, M. S.; Koetzle, T. F.; Hamilton, W. C. J. Am. Chem. Soc. 1972, 94 (8), 2657.(59) Weber, H.-P.; McMullan, R. K.; Swaminathan, S.; Craven, B. M. Acta Cryst. B 1984, 40 (5), 506.(60) Weber, J.; Schmedt auf der Günne, J. Phys. Chem. Chem. Phys. 2009, 12 (3), 583.(61) Jensen, F. J. Chem. Theory Comput. 2008, 4 (5), 719.(62) Feller, D. J. Comp. Chem. 1996, 17 (13), 1571.
47

Avadhut et al. (2017).
(63) Schuchardt, K. L.; Didier, B. T.; Elsethagen, T.; Sun, L.; Gurumoorthi, V.; Chase, J.; Li, J.;Windus, T. L. J. Chem. Inf. Model. 2007, 47 (3), 1045.
(64) Jensen, F. J. Chem. Phys. 2001, 115 (20), 9113.(65) Frisch, M. J. GAUSSIAN 03 program, Revision D.01; 2004.(66) Adamo, C.; Barone, V. J. Chem. Phys. 1998, 108 (2), 664.(67) Glendering, E. D.; Badenhoop, J. K.; Reed, A. E.; Carpenter, J. E.; Bohmann, J. A.; Morales, C.
M.; Weinhold, F. Theoretical Chemistry Institute, University of Wisconsin, Madison, WINo. 2001.
(68) Wolinski, K.; Hinton, J. F.; Pulay, P. J. Am. Chem. Soc. 1990, 112 (23), 8251.(69) Haeberlen, U. High resolution NMR in solids: Advances in Magnetic Resonance, Suppl. 1;
Academic Press: New York, 1976.(70) Spiess, H. W. NMR Basic Principles and Progress, 2nd ed.; Springer, Berlin, 1978; Vol. 15.(71) Kohler, S. J.; Klein, M. P. J. Am. Chem. Soc. 1977, 99 (25), 8290.(72) Ye, C.; Fu, R.; Hu, J.; Hou, L.; Ding, S. Magn. Reson. Chem. 1993, 31 (8), 699.(73) Radeglia, R. Solid State Nucl. Magn. Reson. 1995, 4 (5), 317.
48