accepted manuscript - modir3-3.irmodir3-3.ir/article-english/isi280-20175388284.pdf · accepted...
TRANSCRIPT
Accepted Manuscript
The ugly side of customer management – Consumer reactions tofirm-initiated contract terminations
Anke Lepthien, Dominik Papies, Michel Clement, ValentynaMelnyk
PII: S0167-8116(17)30006-XDOI: doi: 10.1016/j.ijresmar.2017.02.001Reference: IJRM 1205
To appear in: International Journal of Research in Marketing
Received date: 6 May 2014
Please cite this article as: Anke Lepthien, Dominik Papies, Michel Clement, ValentynaMelnyk , The ugly side of customer management – Consumer reactions to firm-initiatedcontract terminations. The address for the corresponding author was captured as affiliationfor all authors. Please check if appropriate. Ijrm(2017), doi: 10.1016/j.ijresmar.2017.02.001
This is a PDF file of an unedited manuscript that has been accepted for publication. Asa service to our customers we are providing this early version of the manuscript. Themanuscript will undergo copyediting, typesetting, and review of the resulting proof beforeit is published in its final form. Please note that during the production process errors maybe discovered which could affect the content, and all legal disclaimers that apply to thejournal pertain.

ACCEP
TED M
ANUSC
RIPT
1
The Ugly Side of Customer Management –
Consumer Reactions to Firm-initiated Contract Terminations
Anke Lepthien
Institute of Marketing, University of Hamburg, Germany
& Institute of Human Resource Management and Organizations
Hamburg University of Technology, Germany
Dominik Papies
School of Business and Economics, University of Tuebingen, Germany
Michel Clement
Institute of Marketing, University of Hamburg, Germany
Valentyna Melnyk
School of Communication, Journalism and Marketing, Massey University, New Zealand
==========================================================
ARTICLE INFO
Article history:
First received on May 6, 2014 and was under review for 6½ months.
Senior Editor: Don R. Lehmann
============================================================
Contact Information:
Anke Lepthien is PhD-Student at the University of Hamburg, Institute of Marketing, Moorweidenstr. 18, 20148 Hamburg, Germany, e-mail: [email protected]
Dominik Papies is Professor of Marketing at the University of Tuebingen School of Business and Economics, Nauklerstr. 47, 72074 Tuebingen, Germany, e-mail: [email protected]
Michel Clement is Professor of Marketing and Media at the University of Hamburg, Institute of Marketing & Research Center for Media and Communication, Moorweidenstr. 18, 20148 Hamburg, Germany, e-mail: [email protected]
Valentyna Melnyk is Professor of Marketing and Consumer Research at Massey University, School of Communication, Journalism & Marketing, Private Bag 102904, Auckland 0745, New Zealand, e-mail: [email protected]
ACCEPTED MANUSCRIPT

ACCEP
TED M
ANUSC
RIPT
2
The Ugly Side of Customer Management –
Consumer Reactions to Firm-initiated Contract Terminations
Abstract
Many firms apply “customer demarketing” strategies and dismiss unprofitable
customers. However, empirical research on the consequences of dismissing customers is
scarce. We address this research gap and develop and empirically analyze a theoretical
framework of consumer reactions to customer demarketing based on the theory of dual
entitlement. We conduct seven experiments in which we identify the main effect of observing
customer demarketing and analyze several moderating and mediating factors. In addition, we
use a field study to illustrate the consequences of experiencing a contract termination in a
real-world setting, in which a firm terminated contracts for more than 10,000 customers. The
results show that consumers disapprove of customer demarketing, regardless of whether they
experience it themselves or only observe it, regardless of the responsibility for the cause of
the contract termination, and regardless of the social proximity to the dismissed customers.
The effect is, however, somewhat weaker if customer demarketing is perceived to be a
common occurrence, if alternative offers are made, and if the financial cause is framed as a
loss. Furthermore, firms can dampen the negative effect of customer demarketing by offering
substantial monetary compensation to dismissed customers. We identify perceived fairness of
the firm’s behavior as the underlying process that causes the negative effects of customer
demarketing, and this also holds when we control for potential alternative mediators (i.e.,
warmth and competence perceptions).
Keywords: Customer Management, Customer Demarketing, Fairness, CLV
ACCEPTED MANUSCRIPT

ACCEP
TED M
ANUSC
RIPT
1
1. Introduction
Unprofitable customers account for up to 50% of bank customers and up to 40% of mail-
order company customers (e.g., Ang & Taylor 2005). Shah et al. (2012) find that up to 35% of
customers who cross-buy are unprofitable, accounting for up to 88% of a firm’s total loss from its
customers. As we embrace the notion that firms should focus their marketing activities on the
most profitable customer segments (e.g., Homburg, Droll, & Totzek 2008, Rust, Kumar, &
Venkatesan 2011), what should they do about unprofitable customers – particularly when all
attempts to turn them into profitable customers fail?
The business press provides frequent evidence of companies that dismissed unprofitable
customers by terminating their contracts (with or without an option of a new (inferior) contract).
The literature refers to this strategy as “customer demarketing” (Kotler & Levy 1971, Bradley &
Blythe 2014) or “customer abandonment” (Haenlein, Kaplan, & Schoder 2006).1 Table 1 contains
a sample of companies that have terminated contracts with customers, and we provide an
example for a termination letter in Appendix B.
TABLE 1 about here
Although Kotler and Levy introduced the concept of selective demarketing to the
literature as early as 1971, academic research on customer demarketing remains scarce. Lehmann
(1999, p. 15) encourages researchers to “consider the impact of customer deletion decisions and
efforts, rather than just attempts to attract customers. (Because 80% to 90% of customers are
unprofitable, this is a potentially major area)”. However, we find very little research that
empirically addresses the consequences of selective demarketing (see Table 2; a notable
exception is the research by Haenlein & Kaplan (2010, 2011, 2012), who study the consumer
1 We will use the term “customer demarketing” throughout the manuscript.
ACCEPTED MANUSCRIPT
ACCEP
TED M
ANUSC
RIPT
2
response to different customer demarketing strategies). One reason for this dearth of research
may be managers’ unwillingness to share data on this delicate topic.
Hence, despite its frequent occurrence, the consequences of customer demarketing are not
well understood. Formally terminating customer contracts not only is likely to adversely affect
the brand attitude of these customers but also may spill over to other current or potential
customers. This effect will be amplified if news about the contract terminations is picked up by
the press or by multipliers on the Internet (e.g., blogs, forums), as Table 1 demonstrates. Hence,
dismissing unprofitable customers is likely to reduce losses, but it will also negatively affect the
brand attitude of individuals who are subject to customer demarketing actions.
We identify and address two major research gaps. First, it is not clear to what extent
customer demarketing negatively affects individuals who experience or merely observe a contract
termination of somebody else. Second, it is largely unknown what companies should or should
not do to decrease those negative effects. We base our analysis and framework on the theory of
dual entitlement (Kahneman, Knetsch, & Thaler 1986), which posits that consumers evaluate the
adequacy or fairness of a transaction that they observe. Across eight studies (seven experiments
and one large field study), we empirically investigate the effect of customer demarketing on two
key outcome variables, one of which is attitudinal (i.e., brand attitude), while the other is
behavioral (i.e., WoM). Based on the dual entitlement framework, we study the role of perceived
fairness as the primary underlying process. Further, we assess two alternative mediators (i.e.,
warmth and competence perceptions) and investigate several moderators that may decrease the
negative effect of customer demarketing on the outcomes. In addition, our field study provides a
unique opportunity to study the effect of experiencing customer demarketing in cooperation with
a leading service provider from the consumer utilities sector (electricity, natural gas, water) in
Europe that canceled contracts with a large number of customers who were identified as
ACCEPTED MANUSCRIPT

ACCEP
TED M
ANUSC
RIPT
3
unprofitable because of changes in the regulatory framework. This setting allows us to illustrate
the effect of customer demarketing on key variables in a real-world setting.
Our study makes several contributions to the literature. First, we demonstrate the extent to
which consumers respond negatively to customer demarketing. Second, as Table 2 reveals, our
knowledge of the underlying psychological mechanisms that cause the negative response (i.e., its
potential mediators) is limited. The only study that has addressed this, Haenlein & Kaplan
(2010), proposes the attitudinal response to customer demarketing as a mediator. We build on
these findings and shed further light on the underlying processes of consumers’ response (both
attitudinal and behavioral) to customer demarketing by investigating a new mediator (perceived
fairness). We also assess whether perceived fairness serves as a mediator if we control for
potential alternative mediators (i.e., warmth and competence perceptions). Third, we make an
important academic and managerial contribution by investigating moderating variables that can
or cannot decrease the effect of customer demarketing. Importantly, for the managerial
contribution, most of those moderators can be actively utilized by the firm. Finally, we
complement the experimental studies with a field study in which we observe responses of
customers whose contracts were terminated in a real customer demarketing setting.
2. Theory and Hypotheses Development
2.1 Literature Overview
Most research in the customer demarketing context is of a conceptual or theoretical
nature. Mittal, Sarkees, & Murshed (2008) suggest implementation strategies of customer
demarketing, and Shin, Sudhir, & Yoon (2012) and Pazgal, Sobermann, & Thomadsen (2013)
underline that dismissing customers can increase profit. These papers are valuable starting points
to empirically investigate the effects of customer demarketing. They are complemented by
simulation studies (e.g., Haenlein, Kaplan, & Schoder 2006) that analyze the consequences of
ACCEPTED MANUSCRIPT

ACCEP
TED M
ANUSC
RIPT
4
including customer demarketing as an option in CLV calculation. Other research has addressed
the boundary conditions of the profitability of demarketing, e.g., Kim & Lee (2007) show in an
analytical model that demarketing in cases of strong network externalities is less likely to be
profitable. Conversely, non-paying (unprofitable) customers may be needed to increase the size
of a network to attract paying customers (Gupta & Mela 2008).
Empirical research on the topic of customer demarketing is scarce. A notable exception is
research by Haenlein & Kaplan (2010, 2011, 2012), who empirically analyze consumer reactions
to different ways of customer demarketing by assessing the effects of different demarketing
strategies relative to one another. However, to assess the extent to which customer demarketing is
damaging for the firm and whether potential moderators may be able to offset its negative effects,
it is important to know the effect of demarketing compared to no demarketing, and this is the
void that our research addresses. We summarize all studies we are aware of in Table 2.
TABLE 2 about here
2.2 Main Effect and Mediators
We argue that the unilateral termination of a contract by a firm (even if the firm
simultaneously offers the option to enter a new contract) is likely to be perceived as unjust or
unfair. The dual entitlement principle (Kahneman, Knetsch, & Thaler 1986) suggests that
consumers have a notion about the adequate outcome of a transaction they observe between a
firm and its customers. A firm is entitled to a “reference profit”, while consumers are entitled to
an adequate “reference price”. Societies develop “a consensus as to what constitutes an equitable
relationship” (Walster, Berscheid, & Walster 1973, p.152). Indeed, it has been shown in several
domains that fairness evaluations (e.g., Kahneman, Knetsch, & Thaler 1986) are an important
ingredient in human decision making (e.g., price fairness; Bolton, Keh, & Alba 2010), service
recovery (Patterson, Cowley, & Prasongsukarn 2006), or inter-firm relationships (Samaha,
ACCEPTED MANUSCRIPT
ACCEP
TED M
ANUSC
RIPT
5
Palmatier, & Dant 2011)), which may be even more important than a financial gain (Turillo et al.
2002). Consumers make judgments about the fairness of the transactions they observe and will
view deviations from the reference entitlements as unfair. Thus, a firm terminating contracts with
its customers will be perceived as unfair because these actions are inconsistent with how a firm is
supposed to treat its customers (Porath, MacInnis, & Folkes 2011). When individuals perceive
treatment as unjust or unfair, they will penalize the party who violates some consensual fairness
standard, even if this penalization is associated with costs (Turillo et al. 2002). Hence, customer
demarketing is likely to result in attitudinal (e.g., negative emotions) and behavioral reactions
(e.g., looking at means of “revenge” via negative WoM or consumer brand sabotage) towards the
firm (Bolton, Warlop, & Alba 2003; Haenlein & Kaplan 2010; Kähr et al. 2016).
Importantly, consumers do not need to be directly involved in a relationship with a
company to react to customer demarketing. Based on social identification theory (Tajfel &
Turner 1986), consumers who observe a relationship between a firm and its customers are likely
to identify with one of the two parties involved, more likely with the customers. This
identification is strengthened by direct or vicarious experiences of conflicts or failures of the
party with which one can identify (Ashforth & Mael 1989).
Based on these considerations, we expect both customers experiencing demarketing and
those merely observing it to show similar attitudinal responses to customer demarketing. We
expect the behavioral reaction to be in the same direction but weaker in magnitude among
observing customers because they are less personally involved and are typically not faced with
any direct decisions with respect to the firm (Haenlein & Kaplan 2010).
Our framework (Figure 1) suggests that because of the unfairness perceptions, consumers
who observe or experience customer demarketing will adjust their attitude to the brand.
Furthermore, a consumer may communicate her disapproval to other – active or potential –
ACCEPTED MANUSCRIPT
ACCEP
TED M
ANUSC
RIPT
6
customers, thus initiating negative word-of-mouth (negative WoM; Anderson 1998). Both brand
attitude and intentions to engage in negative WoM have been identified as predictors of the
respective behaviors and will serve as dependent variables in our analyses. In sum, we expect that
customer demarketing will have negative effects on brand attitude and negative WoM intentions
with regard to the brand that dismisses the customers, and we expect that these effects are
mediated by fairness perceptions. We therefore hypothesize:
H1: Customer demarketing (a) decreases brand attitude and (b) increases intentions to
engage in negative WoM.
H2: The effect of customer demarketing on (a) brand attitude and (b) intentions to engage
in negative WoM is mediated by the perceived fairness of the firm’s behavior.
FIGURE 1 about here
It is possible that perceived fairness may not be the only channel through which customer
demarketing transmits its harmful consequences. Recent evidence suggests that consumers also
perceive brands and companies along the dimensions of warmth and competence (Aaker et al.
2012; Kervyn et al. 2012). Specifically, the warmth dimension reflects traits related to perceived
intent, including trustworthiness and morality, while competence includes traits related to ability
and efficacy (Aaker et al. 2010). Importantly, warmth and competence perceptions are automatic
and may not only affect fairness perceptions (which are more cognitive in nature, e.g., Xia,
Monroe, & Cox 2004) but also independently increase both attitude and behavioral intentions
towards brands (Kervyn et al. 2012; Hess & Melnyk 2016). We argue that dismissing customers
to increase profitability may decrease warmth perceptions because “self-profit” at the expense of
“other-profit” falls into the morality domain, which is the fundamental component of warmth
judgment (Wojciszke et al. 1998). With respect to competence, although “self-profit” tendencies
(i.e., the decision to dismiss some customers to ensure profitability of the firm) may, ceteris
ACCEPTED MANUSCRIPT

ACCEP
TED M
ANUSC
RIPT
7
paribus, increase competence perceptions, the initial capabilities of the firm will also influence
competence judgments (Cuddy et al. 2008). That is, consumers may perceive the firm as
incompetent by attracting unprofitable customers in the first place, which implies a negative
effect of customer demarketing on perceived competence. In sum, because warmth and
competence perceptions increase both attitude and behavioral intentions towards brands (Kervyn
et al. 2012; Hess & Melnyk 2016), both constructs may mediate the impact of customer
demarketing on our dependent variables:
H3: The effect of customer demarketing on (a) brand attitude and (b) intentions to engage
in negative WoM is mediated by the perception of the firm’s warmth.
H4: The effect of customer demarketing on (a) brand attitude and (b) intentions to engage
in negative WoM is mediated by the perception of the firm’s competence.
It is important to note that previous research has argued that by being automatic and
difficult to control (Cuddy et al. 2008), warmth and competence perceptions inform other, more
cognitive judgments, including fairness (Kervyn et al. 2012). Although we do not propose formal
hypotheses, we also expect that warmth and competence have a direct effect on fairness.
2.3 Moderators
To increase firms’ understanding of how to mitigate negative effects of customer
demarketing, we investigate several moderators of the effect of customer demarketing on the
outcome variables. One factor relates to the question of who is responsible for the cause of the
customer demarketing action (e.g., see Gelbrich (2010) for the case of service failures). In
making causal attributions, the most important judgment concerns the locus of causality (internal
ACCEPTED MANUSCRIPT

ACCEP
TED M
ANUSC
RIPT
8
or external factors) (Xenikou, Furnham & McCarrey 1997).2 Hence, if a consumer observes a
contract termination by a firm, she will seek to identify the party that is responsible for this event
and can be held accountable (McColl-Kennedy & Sparks 2003). Generally, in the case of
negative events, consumers are more likely to make internal attributions, i.e., place blame on the
firm, as opposed to external attributions, i.e., place blame on a situation or other customers
(Tomlinson & Mayer 2009). However, if a consumer engages in fraudulent or unethical behavior
(e.g., makes excessive use of mobile downloads that reduce the available bandwidth for other
users in the area), other consumers are less likely to disapprove of customer demarketing because
they will be more likely to make an external attribution of the firm’s need to terminate the
contract. If, in contrast, the firm bears full responsibility for the customer demarketing because,
e.g., the unprofitability of certain customers is due to the firm’s cost structure, consumers may
strongly disapprove of the contract termination. We argue that the attribution of responsibility
(i.e., locus of causality) serves as a moderator of the effect of customer demarketing.
H5: Attribution of responsibility moderates the effects of customer demarketing on
fairness, such that customer demarketing has a weaker effect on perceived fairness when the
responsibility for demarketing is attributed to the customer as opposed to the firm.
A cue such as observing customer demarketing will primarily influence those consumers
who view the cue as relevant to their own decision making. This may especially be the case when
demarketing affects consumers who are socially close to the observer (Haenlein 2013) because
individuals feel more empathy when members of one’s social in-group have negative experiences
as opposed to members of a social out-group (Tarrant, Dazely, & Cottom 2009). We therefore
2 Weiner (1985) later added the dimensions of stability and controllability; however, those dimensions are independent of the locus of causality and are more applicable to person-to-person interactions rather than person-to-company interactions. Therefore, in this paper, we focus on the locus of causality (i.e., who is responsible) dimension of attribution.
ACCEPTED MANUSCRIPT

ACCEP
TED M
ANUSC
RIPT
9
expect that social proximity (i.e., the extent to which other people are perceived as socially
similar (Trope et al. 2007)) will increase the relevance of a transaction and deviations from the
entitlements. This is also supported by the construal level, which suggests that consumers will
mentally represent socially close objects and events with more detail and specificity, which is
equivalent to low-level construal (Trope et al. 2007). We argue that the effect of customer
demarketing is moderated by the social proximity to those who are affected by demarketing:
H6: Social proximity moderates the effects of observing customer demarketing on
fairness, such that customer demarketing in socially close groups has a stronger effect on
perceived fairness than customer demarketing in socially distant groups.
External factors that can influence the reference point of what consumers perceive to be
common or frequent may also influence fairness perception. One of those factors is commonness
of a particular observed behavior because it can change or distort fairness judgments via the
availability heuristic (Tversky & Kahneman 1973). For example, research suggests that in
contexts (e.g., industries or countries) where differential treatments are part of the norm,
consumers perceive differential customer treatment as less unfair and react less negatively to non-
preferred treatment (Mayser & von Wangenheim 2013). Therefore, we expect the negative effect
of customer demarketing to be less severe when consumers perceive demarketing to be rather
common as opposed to very uncommon.
H7: Perceptions of customer demarketing as common (at the marketplace) moderate the
effects of observing customer demarketing on fairness, such that they decrease the effect of
customer demarketing on perceived fairness.
Finally, it is important to consider mechanisms of coping with unfairness. Research
suggests that one coping mechanism for “feeling duped” is the activation of a downwards
comparison, i.e., comparing the current situation to the worst scenario and being comforted by
ACCEPTED MANUSCRIPT

ACCEP
TED M
ANUSC
RIPT
10
the relatively moderate loss (Markman et al. 1993; Vohs et al. 2007). When the firm can activate
this framing by specifying the loss if the customer did not have the contract in the first place, the
termination may be perceived as less unfair (cf. prospect theory, Kahneman and Tversky 1979).
The firm can active this framing through the information released in the context of the customer
demarketing, e.g., it can highlight how much was gained for a customer (lost for the firm) so far
due to a contract or the potential loss (if they did not have the contract in the first place).
Frames may also differ depending on the object of the losses and gains, but the direction
of this effect is not clear a priori. On the one hand, conventional wisdom suggests that consumers
should care about their own gains and losses more than those of a firm. This view is consistent
with the idea of the “fear-of-loss” framework (Camerer 2005), which suggests that loss aversion
is akin to an emotional state that is activated only if the object of potential loss is regarded as
self-relevant. Thus, a customer’s loss should have a stronger effect on perceived fairness. This
suggests that highlighting customers’ losses (if they did not have the contract in the first place) is
more likely to increase fairness perception than highlighting the corresponding customers’ gains
(due to having had the contract). On the other hand, new circumstances (e.g., termination of a
contract) activate competitive behavior, i.e., a customer attempts to obtain a slightly superior
position to the other party (Poppe and Valkenberg 2003). This competitive motivation may in
turn enhance attention to any potential losses made by the firm, which could also bring some
satisfaction from mental retaliation and hence decrease unfairness. Further, Kahneman, Knetsch
& Thaler (1986) find that fairness perceptions are susceptible to framing effects, e.g., people do
not judge firms as unfair that introduce wage cuts because they were losing money. Therefore,
framing in terms of the firm’s losses is also more likely to enhance fairness perceptions than the
framing in terms of the firm’s gains. Irrespective of the object of the frame, we expect loss
ACCEPTED MANUSCRIPT
ACCEP
TED M
ANUSC
RIPT
11
framing to reduce unfairness more than framing that highlights gains. Nevertheless, we explicitly
control for the effects of the object of the frame on the fairness perceptions.
H8: Loss (versus gain) framing of customer demarketing moderates the effects of
customer demarketing on fairness perceptions, such that the effect is less negative in the loss
framing compared to the gain framing.
The perception of unfairness arises because the dismissed customers are deprived of the
possibility to extract the utility from the transaction to which they are entitled. We suggest there
may be two ways that a firm is able to implement customer demarketing while giving customers
the opportunity to extract utility from the transaction to keep the negative effects on fairness at
bay. First, the firm offers the customer a new contract under different terms that are now
profitable for the firm (e.g., because of higher prices). An example for such a new contract would
be a situation in which a bank moves a customer to its low-cost subsidiary (Bott and Reuter
2000). This may also indicate to the customer or the observer that the firm cares about the
customer’s entitlement, which in turn may reduce negative emotions towards the firm (Porath,
MacInnis, & Folkes 2011). We therefore hypothesize:
H9: Making alternative offers for dismissed customers moderates the effect of customer
demarketing on fairness perceptions, such that the presence of alternative offers (versus no offer)
increases perceived fairness
The second approach is monetary compensation (e.g., by offering a one-time payment). It
gives customers the possibility to derive the utility to which they are entitled to and may serve as
a signal that the firm acknowledges responsibility for granting the customer her due entitlement.
This acknowledgment may reduce negative emotions towards the firm (Porath, MacInnis, &
Folkes 2011), therefore mitigating the negative effects of customer demarketing:
ACCEPTED MANUSCRIPT

ACCEP
TED M
ANUSC
RIPT
12
H10: Monetary compensation for dismissed customers moderates the effect of customer
demarketing on fairness perceptions, such that customer demarketing with monetary
compensation (versus no monetary compensation) increases perceived fairness.
3. Experimental Analysis
We investigate the effect of customer demarketing in seven experimental studies. Table 3
provides an overview, and Appendix B & F provides the manipulations. We use Study 1 to test
H1&H2 and to assess warmth and competence as potential alternative mediators (H3&H4). We
test H5 in Study 2, whereas H6 is analyzed in Study 3. The moderating role of commonness (H7)
is analyzed in Study 4. In Study 5, we look at H8. We analyze H9 and H10 in Studies 6 and 7,
respectively. In all studies, we measure the mediators and dependent variables with 7-point
Likert-type scales. We analyze the results for (moderated) mediation with Process Models 4, 6
and 7, respectively (Hayes 2013) and report the respective unstandardized regression coefficients.
TABLE 3 about here
3.1. Study 1: Main Effect and Mediation
Procedure. In Study 1, we assess the main effect of customer demarketing and the role of
the perceived fairness as mediator. In addition, we shed some light on warmth and competence
perceptions as potential alternative mediators to explain why consumers respond negatively to
customer demarketing (H3 & H4). We recruited respondents, representative of the German
market, through a market research firm for a short online experiment and randomly assigned
them to one treatment in a 2-group (demarketing vs. no demarketing) between-subjects design.
The final sample consisted of 2813 respondents (mean age = 45.49, SD = 12.53; 48.4% female).
3 Across all online experiments that follow, we applied the same consistent rule on the elimination of respondents who provided random answers to ensure sufficient data quality. Specifically, at the end of the corresponding online questionnaire, we asked respondents to indicate the share of truthful answers they provided
ACCEPTED MANUSCRIPT

ACCEP
TED M
ANUSC
RIPT
13
Materials. Participants read a newspaper article about a mobile phone provider. It stated
that the firm would release the earnings report next week and information on the profitability of
their customers (control condition). In the customer demarketing condition, the article also
contained the information that the contracts with the unprofitable customers were terminated.
Manipulation check. Respondents indicated their agreement to the statement that in the
newspaper article, a firm had terminated contracts with unprofitable customers. As intended, the
mean in the customer demarketing condition (M = 5.98; SD = 1.75) was significantly higher (t =
19.66, p<.001) than that in the control condition (M = 2.12; SD = 1.52).
Measures. We measure perceived fairness of the firm’s behavior with a three-item scale:
the behavior of Brand A is reasonable, Brand A treats its customers fairly, and the behavior of
Brand A is just (α = .96; Bolton, Keh & Alba 2010). We measure attitude toward Brand A with a
four-item scale: Brand A is “good”, “pleasant”, “likeable”, and “appealing” (α = .98; Spears and
Singh 2004). We measure the intention to engage in negative WoM (nWoM) with a three-item
scale: “I would not recommend Brand A to someone who seeks my advice”, “I say negative
things about Brand A to other people”, and “I would not recommend Brand A to others.”
(α = .91; Price & Arnould 1999). In addition, we measure warmth and competence perceptions
following Aaker et al. (2012) by asking to which extent the firm was seen as warm and friendly
(α = .95) and competent and capable (α = .96).
FIGURE 2 & TABLE 4 about here
Results. H1 specifies the direct effect of customer demarketing on brand attitude and
(Wlömert & Papies 2016). If a respondent stated on an 11-point scale (1 = only random answers to 11 = only truthful answers) that she provided less than or equal to 50% truthful answers, the respondent was excluded. We also excluded those respondents who selected the identical scale point across all answers throughout the questionnaire. This rule resulted in the exclusion of 29 respondents (9.4%) in Study 1, 31 respondents (6.6% of the sample) in Study 2, 49 respondents (8.4%) in Study 4, 23 respondents (4.6%) in Study 5, 24 respondents (6.0%) in Study 6, and 38 respondents (7.2%) in Study 7. We also assessed whether our results depended on the specification of these exclusion rules, which was not the case. The results of these robustness checks are available upon request.
ACCEPTED MANUSCRIPT
ACCEP
TED M
ANUSC
RIPT
14
intention to engage in negative WoM. ANOVA results indicate that customer demarketing
(versus no demarketing) indeed affects fairness perceptions (F = 191.24, p<.001), attitude (F =
168.22, p<.001), and intention to engage in nWoM (F = 147.09, p<.001), which supports H1.
Table 4 reveals that the effects are in the hypothesized direction.
Figure 2 provides insights into the mediating relationships. In Figure 2a we once again see
the strong negative main effect of customer demarketing on perceived fairness (-2.484). On top
of that, fairness shows a strong relation to both brand attitude and intention to negative WoM.
This supports the theory that fairness is a mediator of the negative effect of customer
demarketing. The indirect effect via fairness on attitude is -.99 (= -2.484*.399), the indirect on
negative WoM is 1.04 (=-2.484*-.421). The bootstrapped standard errors of the indirect effects
indicate that these effects are significant. Table A1 in the Appendix contains detailed results. A
comparison of the total effect of customer demarketing on brand attitude (i.e., -2.3) to the indirect
effect via fairness suggests that 43% of the total effect is mediated by fairness alone.4 The same
holds for the corresponding effect on negative WoM.
The case is less clear for the role of perceived warmth and competence. We see a
significant mediation both via warmth (-.563 = -2.109*.267) and via competence (-.604
= -2.019*.299) if brand attitude is the dependent variable. The corresponding effect sizes,
however, are smaller compared to fairness. The mediation via warmth accounts for 24%, and the
mediation via competence accounts for 26% of the effect of customer demarketing, which
highlights the strong role of fairness because fairness alone accounts for 43% of the effect. For
the behavioral measure of nWoM, we do not find evidence that warmth or competence
perceptions function as a mediator. These findings provide only partial support for H3 & H4 and
4 Indirect effect (= -.990) / total effect (= -2.3) = .43.
ACCEPTED MANUSCRIPT
ACCEP
TED M
ANUSC
RIPT
15
support the notion that fairness is indeed a key mediator for the effects of customer demarketing.
While these analyses consider a parallel mediation of warmth, competence, and fairness, previous
research implies that warmth and competence may also be antecedents to perceived fairness
(Cuddy et al. 2008; Kervyn et al. 2012). Specifically, because warmth and competence
evaluations are automatic and happen in a “split second” (Cuddy et al. 2008), it is reasonable to
expect that those automatic evaluations are likely to inform fairness evaluations, which are much
more cognitive in nature (e.g., Xia, Monroe, & Cox 2004). The results of a serial mediation
(Figure 2b)5 support the notion that both warmth and competence positively affect fairness
perceptions. However, even after controlling for warmth and competence as antecedents of
perceived fairness, customer demarketing still exerts a substantial negative influence on
perceived fairness (Appendix, Tables A1/A2).
Discussion. This study finds that consumers disapprove of demarketing, and they
disapprove because they perceive customer demarketing as unfair. In addition, this study
investigates warmth and competence perceptions as potential alternative mediators. The results
show that perceived warmth as well as competence are strongly affected by customer
demarketing, but the evidence for their role as mediators is mixed. Warmth and competence
mediate the effects for attitudinal responses but not behavioral responses (nWoM). Overall, the
mediation via warmth and competence is weaker than that via fairness. In sum, the results support
the theory that fairness indeed is a key mediator that explains why consumers react to customer
demarketing. We therefore focus on perceived fairness as a mediator in the following studies.
Figure 2c and Table A3 (Appendix) summarize the results with fairness as mediator.
3.2 Study 2: The Main Effect of Customer Demarketing & Attribution
5 We thank an anonymous reviewer for bringing up this idea.
ACCEPTED MANUSCRIPT

ACCEP
TED M
ANUSC
RIPT
16
Procedure. We test H5 in an online experiment using a 2 (customer demarketing vs. no
customer demarketing) x 2 (attribution to customers vs. attribution to the firm) between-subjects
design. We recruited respondents, representative of the German market, through a market
research firm and randomly assigned them to one of the four experimental groups. The final
sample consisted of 437 (mean age: 44.44 (SD: 12.46), 48.7% female).
Material. Participants read a newspaper article about the same mobile phone provider that
we used in the previous study. The article informed the reader that the firm would release the
annual earnings report next week (control condition). In the customer demarketing condition, the
article contained information that some customers were identified as unprofitable and stated that
the contracts with the unprofitable customers were terminated. On a separate page, respondents
read an article that was labeled as background information on the topic of customer profitability.
A fictitious expert stated that either the firm is responsible for customers being unprofitable due
to poor calculations (“attribution to the firm” condition) or that the customers are responsible for
being unprofitable due to misuse of the service (“attribution to the customer” condition). We
measured our dependent variables afterwards.
Manipulation check. Respondents indicated their agreement to the statement that in the
newspaper article, the firm had terminated contracts with unprofitable customers. As intended,
the mean in the customer demarketing conditions (M = 5.79, SD = 1.75) is significantly (t =
13.90; p<.001) higher than the mean of the no-demarketing conditions (M = 3.48, SD = 1.73). To
assess the effectiveness of the attribution manipulation, respondents stated on a 7-point Likert
scale whether the article reported that the customers were responsible for being unprofitable for
the firm. As intended, the mean in the attribution-to-customer conditions (M = 5.22, SD = 1.77)
is significantly (t = 10.18; p<.001) higher than the mean of the attribution-to-firm conditions (M
= 3.36, SD = 2.06). Respondents also stated whether the article reported that the firm was
ACCEPTED MANUSCRIPT
ACCEP
TED M
ANUSC
RIPT
17
responsible for customers being unprofitable for the firm. As intended, the mean in the
attribution-to-firm conditions (M = 5.25, SD = 1.85) is significantly (t = 12.02; p<.001) higher
than the mean of the attribution-to-customers conditions (M = 3.08, SD = 1.91).6
Measures. We use the same measures as before to assess perceived fairness (α = .96),
attitude toward Brand A (α = .97), and intention to engage in negative WoM (α = .82).
Results. We estimate a model allowing for moderated mediation (Hayes 2013, Process
Model 7). Figure 3 shows the results. The significant effect of customer demarketing on fairness
(-1.126) indicates that fairness perception is reduced by more than 1 point on a 7-point Likert
scale due to customer demarketing in the attribution-to-customer condition, which is in line with
Study 1. The substantial effects of fairness on brand attitude and negative WoM indicate that
demarketing does have an unfavorable effect on brand attitude and negative WoM via fairness as
a mediator. This again supports H2.
FIGURE 3 about here
H5 posits that the evaluation of customer demarketing depends on the attribution of
responsibility. However, despite the significant differences in the objective level of customer’s
fault across the conditions (i.e., attribution manipulation), the interaction effect between customer
demarketing and attribution on the dependent variables is only marginally significant (p=.07).
The interaction effect (-.520) suggests that respondents tend to consider the objective
information, but the confidence intervals are wide and include zero, which is more consistent
with the notion of self-serving bias and the fundamental attribution error (Ross 1977). This
suggests that – even despite objective facts – people automatically attribute blame for negative
events such as customer demarketing to the actions of the firm rather than situational factors or
6 In a robustness check, we assess whether the results change when we exclude respondents who incorrectly recalled whether customer demarketing took place. The substantive findings do not change.
ACCEPTED MANUSCRIPT

ACCEP
TED M
ANUSC
RIPT
18
the actions of other customers (Mezulis et al. 2004). The conditional indirect effects (which
capture for each level of the moderator the total effect via the mediator fairness) mirror this
picture. The indirect effect in the attribution-to-customer condition is -.862 (=-1.126*.766) for
brand attitude and .611 (-1.126*-.543) for nWoM. The corresponding effects in the attribution-to-
firm condition are -1.261 for brand attitude and .894 for nWoM. The differences between the two
conditions are not significant, as evidenced by the index of moderated mediation, where the
confidence interval includes zero. See Table A4 in the Appendix for detailed results. The effect
sizes suggest that 79% of the total on brand attitude is mediated by fairness in the firm condition
(74% in the customer condition). For nWoM as dependent variable, 73% of the total effect is
mediated by fairness in the firm condition (47% in the customer condition).
Discussion. Customer demarketing has negative effects, regardless of whether the
customer or the firm is to be blamed objectively. Shifting the responsibility to the unprofitable
customers may somewhat alleviate the negative effects of demarketing, but this strategy clearly
fails to offset the negative effects of customer demarketing.
3.2 Study 3: The Effect of Customer Demarketing and Social Proximity
Procedure. Study 3 assesses the moderating effect of social proximity (H6). A total of 190
business studies undergraduates (mean age = 22.93, SD = 2.83; 50.0% female) of a large German
university were randomly assigned to one treatment in a 2 (socially close vs. socially distant) x 2
(demarketing vs. no demarketing) between-subjects paper-and-pencil experiment.
Materials. Participants read a newspaper article about a test market of a mobile phone
provider that was not yet active in the German market. It stated that some customers in the test
market were unprofitable. In the customer demarketing condition, the article concluded by stating
that the contracts with some of the unprofitable test market participants were terminated. We
manipulated social proximity by placing the test market participants who were described in the
ACCEPTED MANUSCRIPT

ACCEP
TED M
ANUSC
RIPT
19
newspaper article in either a social in-group or out-group. In the in-group condition, students of
the university where the study was conducted were the test market participants. In the out-group
condition, participants of the test market were law students of a fictitious private law school from
a culturally different part of the country that relied on high tuition fees and portrayed itself as an
elite school. This type of school was chosen as an out-group because pretests had established that
business undergraduates perceive law students as culturally different. Furthermore, this particular
area in Germany was perceived as culturally different from where the study was conducted.
Manipulation check. To assess whether this manipulation of in-group vs. out-group was
effective, we rely on findings from Berger and Heath (2008), who identify aspects (similarity,
liking, and cost of being confused as a member of the group) of perceived social proximity. We
asked four questions relating to these aspects (“The students in the newspaper article are very
similar to me and my friends”; “I feel very positive about the students in the newspaper article”;
“I can identify very well with the students in the newspaper article”; “Being mistaken for one of
the students in the newspaper article would be very unpleasant for me and my friends”). As
intended, we find a significantly (t = 4.84; p<.01) lower mean for the out-group (M = 2.58; SD =
1.27) than the in-group conditions (M = 3.58; SD = 1.46) for the average of the four items.
Measures. We use the same measures as before to assess the perceived fairness of the
firm’s behavior (α=.89), brand attitude (α=.91), and intention to engage in nWoM (α=.82).
FIGURE 4 about here
Results. The results (Figure 4) replicate our findings from the previous studies and show a
negative effect of customer demarketing on perceived fairness. Again, perceived fairness
mediates the effect, and the indirect effect of customer demarketing on brand attitude (nWoM)
is -.83 (.677) when contracts of socially distant customers are terminated (the direct effect of
ACCEPTED MANUSCRIPT
ACCEP
TED M
ANUSC
RIPT
20
customer demarketing on attitude (.113) is insignificant).7 The bootstrapped confidence intervals
(Table A5 Appendix) indicate these effects as significant. The theory proposes that respondents
will disapprove less of customer demarketing of socially distant customers (H6). However, the
results do not support this because respondents disapprove of customer demarketing regardless of
social proximity, as evidenced by the negative (-.122) but insignificant interaction.
Discussion. Study 3 corroborates the findings from Studies 1&2. Further, it shows that
observing demarketing has a similarly negative effect on attitude and negative WoM regardless
of the social proximity to the customers who were dismissed. Consistent with the social
identification theory (Tajfel & Turner 1986), the latter result suggests that customers are likely to
identify themselves with other customers even if they are not socially close. This suggests that
firms cannot rely on a communication strategy to mitigate the effects of customer demarketing
that portrays the dismissed customers as a non-representative group that is different from other
customers. One alternative explanation may be that although our manipulation of social
proximity resulted in significant differences between the conditions, it was relatively weak in
order to keep it as realistic as possible (e.g., it did not include close friends or family). It may
well be that contrasting extreme levels of social proximity (e.g., a stranger versus a family
member) will increase the magnitude of the effect; we also expect that consumers may be less
forgiving if customer demarketing concerns their close family members. However, importantly
for this research, the results suggest that the negative effect of demarketing is sustained even at
relatively low levels of social proximity.
3.4 Study 4: The Moderating Role of Perceived Commonness
7 The sign of the direct effects of customer demarketing on attitude and nWoM appears to be inconsistent with the previous studies. However, the effect is clearly insignificant, i.e., small with very wide confidence intervals. This suggests that the effect of customer demarketing may be fully mediated by fairness, which may also be due to a weak manipulation of social proximity.
ACCEPTED MANUSCRIPT
ACCEP
TED M
ANUSC
RIPT
21
Procedure. Study 4 tests whether the effect of customer demarketing depends on whether
it was perceived to be a common or uncommon event. We recruited respondents, representative
of the German market, through a market research firm and assigned them to one treatment in a 2
(common vs. uncommon) x 2 (demarketing vs. no demarketing) between-subjects design. The
final sample consisted of 537 respondents (mean age = 43.65 (SD = 12.80); 46.9% female).
Materials. Participants read a newspaper article about the same mobile phone provider
that we used above. It said that the firm would release the earnings report (control condition) and
information about an internal study on potentially unprofitable customers. In the customer
demarketing condition, the article added that some customers were identified as unprofitable and
that the contracts with the unprofitable customers were terminated. On a separate page,
respondents read background information on the topic of customer profitability. In the condition
“common” (“uncommon”), the fictitious expert that was interviewed stated that it was quite
common (very uncommon) for firms to terminate contracts with unprofitable customers.
Manipulation check. Respondents indicated their agreement to the statement that in the
article, a firm had terminated contracts with unprofitable customers. As intended, the mean in the
customer demarketing condition (M = 5.81; SD = 1.73) is significantly higher (t = 13.19, p<.001)
than that in the control condition (M = 3.70; SD = 1.97). In addition, respondents indicated their
agreement to the statement that it is very uncommon for firms to terminate contracts with some of
its customers. As intended, the mean in the uncommon condition (M = 5.45; SD = 1.85) is higher
(t = 17.25; p<.001) than that in the common one (M = 2.66; SD = 1.90).
Measures. We use the same measures as before to assess the perceived fairness of the
firm’s behavior (α = .97), brand attitude (α = .97), and intention to engage in nWoM (α = .89).
FIGURE 5 about here
ACCEPTED MANUSCRIPT
ACCEP
TED M
ANUSC
RIPT
22
Results. We test H7 using a moderated mediation (Process Model 7; Hayes 2013). The
results (Figure 5) replicate the negative effect of customer demarketing from the previous studies.
As theory suggests, customer demarketing is viewed as less unfair when consumers perceive it to
be rather common versus very uncommon, i.e., the interaction (.562) is significant. Accordingly,
the conditional indirect effects via fairness differ significantly from one another (index of
moderated mediation is significant), i.e., the indirect effect on attitude is -1.140 (-1.579) if
demarketing is perceived as common (uncommon). The indirect effect on nWoM is .743 (1.030)
if demarketing is viewed as common (uncommon). Table A6 (Appendix) has detailed results.
The effect sizes suggest that 86% of the total effect on brand attitude is mediated by fairness in
the uncommon condition (70% in the common condition). For nWoM, 51% of the total effect is
mediated by fairness in the uncommon condition (40% in the common condition).
Discussion. Study 4 identifies commonness of customer demarketing as a moderator of
the negative demarketing effect, i.e., the slope is less negative in the common condition than in
the condition in which customer demarketing is perceived to be uncommon. The interaction,
however, is not strong enough to offset the negative effect of customer demarketing, i.e., even if
it is perceived as common, we see a negative effect on fairness and brand attitude. This implies
that consumers are likely to react to demarketing even if it is perceived as common.
3.5 Study 5: Framing Justification for Customer Demarketing as a Loss versus Gain
In Study 5, we investigate H8, i.e., whether a firm can reduce the effect of customer
demarketing using different demarketing letter framing (i.e., losses vs. gains, while controlling
for whether those losses vs. gains are associated with the firm vs. the customer). Furthermore, to
extend the previous studies, we manipulate customer demarketing as being experienced.
Procedure. We recruited respondents, representative of the German market, through a
market research firm for a short online experiment. Respondents were randomly assigned to one
ACCEPTED MANUSCRIPT

ACCEP
TED M
ANUSC
RIPT
23
of the four scenarios in a 2 (loss vs. gain) x 2 (firm vs. customer) between-subjects design. The
final sample consisted of 482 respondents (mean age = 42.76 (SD = 12.59); 47.7% female).
Materials. We asked respondents to imagine a situation in which they arrived home after
a normal day and found a letter from their wireless provider in their mail. Respondents then read
the letter that said that calculations had shown that based on the respondents’ consumption level,
the firm took a loss by providing the service to them, or the firm would have made a gain if the
firm had not served them. The consumer scenarios read that the consumer had made a gain
compared to the charges of other wireless carriers, or the consumer would have incurred a loss if
she had used similar services at other wireless carriers. In all conditions, the value of either a loss
or a gain is indicated with 200€ per year. We measured our dependent variables afterwards.
Manipulation check. To assess whether the manipulation of gain/loss and firm/customer
was effective, we asked for the degree of agreement (1 = completely disagree, 7 = completely
agree) with four statements that described the letter as referring either to (1) losses or (2) gains
incurred (3) by the firm or (4) by the customer. As intended, consumers perceived more strongly
that the letter referred to losses in the loss condition (M = 4.47, SD = 1.44) than in the gain
condition (M = 4.06, SD = 1.35), and the difference was significant (t=3.26, p=.001). Consumers
in the customer condition perceived the letter to refer to customers (M =3.56; SD = 1.32; t=5.19,
p<.001) more strongly than those in the firm condition (M=2.91; SD = 1.44).
Measures. We use the same measures as in the previous studies to assess the perceived
fairness of the firm (α=.94), brand attitude (α=.96), and intention to engage in nWoM (α=.86).
FIGURE 6 about here
Results. We test H8 by estimating a moderated mediation (Process Model 7; Hayes 2013,
Figure 6). Consistent with Studies 1-4, we find that perceived fairness mediates the relation
between customer demarketing framing and the dependent variables attitude and negative WoM.
ACCEPTED MANUSCRIPT

ACCEP
TED M
ANUSC
RIPT
24
The indirect effect of loss vs. gain via fairness is .409 in the firm condition and .135 in the
customer condition. Hence, the indirect effect is weaker in the customer condition, although this
difference fails to be significant at the 5% level, as evidenced by the insignificant interaction
(-.418) and the insignificant index of moderated mediation (see Table A7 in the Appendix).
Discussion. These results suggest that letter framing can influence firm perceptions,
particularly with respect to its fairness, i.e., the framing of the justification for the customer
demarketing in terms of loss for a company seems to increase perceptions of firm fairness. This is
consistent with the idea that fairness perceptions are susceptible to framing effects and provides
further support for the suggestion that a firm’s action will be perceived as less unfair and more
acceptable when its profits are threatened (Kahneman, Knetsch, & Thaler 1986).
3.6 Study 6: Offering Alternatives
Procedure. We designed Study 6 to assess to what extent firms can alleviate the negative
effect of customer demarketing by making alternative offers to customers whose contracts were
terminated (H9). We recruited respondents through a professional market research firm and
randomly assigned them to one of four treatments (no demarketing; demarketing without
alternative offer; demarketing with new contract in subsidiary; demarketing with contract in other
firm). The sample consisted of 373 respondents (mean age = 40.27 (SD = 12.16); 53.1% female).
Materials. Participants read a newspaper article about a bank. We measured our
dependent variables afterwards. In the control condition, the article stated that the bank would
present its earnings report. In the customer demarketing condition without alternative offers, it
said that some customers were identified as unprofitable, and their contracts would be terminated.
In the alternative offer condition, the article added that all customers whose contracts were
terminated would receive an offer for a new contract with the bank’s online-only subsidiary.
ACCEPTED MANUSCRIPT

ACCEP
TED M
ANUSC
RIPT
25
Manipulation check. Respondents indicated their agreement to the statement that in the
newspaper article, a firm had terminated contracts with unprofitable customers. As intended, the
mean in the demarketing conditions (M = 5.42; SD = 1.88) is significantly higher (t = 21.23,
p<.001) than that in the control condition (M = 1.94; SD = 1.27). The respondents in the
demarketing conditions indicated their agreement with the statement that the bank offered an
alternative contract to the customers with the terminated contracts. As intended, the mean in the
condition with compensation (M = 6.09; SD = 1.48) is significantly higher (t = 22.83, p<.001)
than that in the demarketing condition without compensation (M = 1.82; SD = 1.43).
Measures. We use the same measures as before to assess the perceived fairness of the
firm’s behavior (α=.98), brand attitude (α=.97), and intention to engage in nWoM (α=.84).
Results. This study (Table 4) again replicates the main negative effect of observing
customer demarketing, i.e., mean fairness perceptions in the customer demarketing condition
(M = 2.11) are lower than those in the control condition (M = 4.04), and the difference is
significant (t = 11.38; p < .001). However, an alternative offer made by the firm reduces the
negative effect, i.e., fairness perceptions are somewhat higher (M = 2.46; t = 1.93; p = .054) in
the case in which the firm makes an alternative offer than in the case of customer demarketing
without an alternative offer.
Discussion. Firms engaging in customer demarketing can somewhat decrease their
negative effect by making an alternative offer to affected customers. This will not offset the
negative effect of customer demarketing but will weaken it. However, these offers are typically
more profitable for the company, and provided that the company is interested in keeping the
customer under a new contract, this could be a viable solution strategy.
3.7 Study 7: The Effect of Customer Demarketing with Monetary Compensation
Procedure. Study 7 tests the effect of monetary compensation (H10). We recruited
ACCEPTED MANUSCRIPT

ACCEP
TED M
ANUSC
RIPT
26
respondents through a market research firm and randomly assigned them to one of three
monetary compensated demarketing treatments (15€, 50€, 100€8) and two control groups
(demarketing without compensation, no demarketing) in a between-subjects online experiment.
The final sample consisted of 491 subjects (mean age = 48.93; SD = 13.93; 49.5% female).
Materials. Participants read a newspaper article containing information about a fictitious
mobile phone service provider in Germany and assessed the dependent variables afterwards. In
the customer demarketing conditions, the article stated that some customers were unprofitable
and their contracts had been terminated. In the monetary compensation manipulation, we added
that the dismissed customers had received monetary compensation of 15€, 50€, or 100€. The
control group read that the provider would present its earnings report.
Manipulation check. To check if the monetary manipulation was effective, we asked
respondents whether the dismissed customers received a monetary compensation. As intended,
we find a significant difference in the mean (p<.001) for the conditions with compensation than
for both control groups (demarketing without monetary compensation, no demarketing).
Measures. We use the same measures as in the previous studies to assess the perceived
fairness of the firm’s behavior (α=.97), brand attitude (α=.96), intention to engage in nWoM
(α=.86) and intention to sign a contract with the firm (single item).
Results. Our results replicate the negative impact of customer demarketing on perceived
fairness, attitude, and negative WoM (Table 4).9 Theory predicts that the negative effect of
demarketing is lower if the firm offers monetary compensation. Our results show that this is
8 We chose this maximum amount because it had been used by service providers in the telecommunication industry to compensate for customer demarketing (see the example of 1&1 in Table 1).
9 We also ran ANOVAs for the whole sample and controlled for whether the respondents indicated correctly whether there was monetary compensation. For all three dependent variables, the control variable was insignificant (fairness: p=.83; attitude: p=.06; nWoM: p=.58). We also estimated our results with only those respondents who correctly indicated whether compensation was given (n=370). However, the results do not change. For the sake of parsimony and consistency with the other studies, we chose to report the results for all the respondents.
ACCEPTED MANUSCRIPT

ACCEP
TED M
ANUSC
RIPT
27
indeed the case (Table 4). Interestingly, however, the amount of the compensation really matters.
Only for substantial amounts (i.e., 100€), we find that perceived fairness (M = 2.50) increases
compared to no compensation (M = 2.02). The difference is significant (t = 2.13; p = .034). At
the same time, offering a small compensation of only 15€ seems worse (M = 1.65) than offering
no compensation, although the effect fails to be significant at the 5% level (t = 1.90; p = .059).
Discussion. Offering monetary compensation to customers whose contracts are terminated
can reduce the harm caused by observing demarketing. Hence, monetary compensation is an
effective tool in restoring distributive justice and increasing fairness perceptions (Tax et al.
1998). However, contrary to conventional wisdom, it does not completely eliminate the negative
effects of customer demarketing. Importantly, our results suggest that the effect of monetary
compensation on fairness and the dependent variables can vary in a non-monotonic way with the
compensation amount. For example, a small amount of monetary compensation may be perceived
as too little and insulting when compared with what consumers feel is fair given a specific
contract and/or social norms, leading to detrimental trivialization effects of such a compensation
versus no compensation at all (Gneezy & Rustichini 2000; Liu et al. 2015). Hence, the financial
burden that is needed to reduce the negative effects is high, and firms should use monetary
compensation only in selected situations, e.g., when they expect high public visibility of the
contract terminations. Compensation strategies require a careful evaluation of customers’
perceptions with respect to the value of the alternative offer.
4. Illustrating the Effect of Customer Demarketing – A Field Study
4.1 Background
In 2010, a European service provider from the household utilities industry (electricity,
natural gas, and water) identified a segment of customers whose contracts no longer guaranteed a
sufficient profitability margin due to new conditions in the regulatory framework. The service
ACCEPTED MANUSCRIPT

ACCEP
TED M
ANUSC
RIPT
28
provider terminated the contracts with these customers by sending them a letter stating that the
current contract would be terminated.
4.2 Procedure
We initiated a research collaboration with the firm a few weeks after the company had
terminated the contracts to learn about the consequences of this customer demarketing
implementation. In 2011, approximately twelve months after the demarketing letters were sent
out, we surveyed 7,829 households from the region where the service provider was active and
where the contracts were terminated. The paper-and-pencil survey was labeled as academic
research carried out by a large German university. Neither the survey nor the mailing contained
any hints as to the service provider, and they contained no questions on or references to customer
demarketing or contract terminations to avoid any salience effects.
At the time of the survey, all households were subscribers of this utility, either with the
industry partner or with a competing provider. The addresses of the respondents were randomly
drawn from the customer database as follows. We took a random sample of customers who left
the company after the contract termination, a random sample of customers who decided to sign a
new contract with the firm, and a random sample of customers who did not react to the contract
termination. The service provider was legally obliged to continue a basic service to the last group
with limited service levels even if they did not choose a new provider or entered new contract
with the old provider.10 In addition, we contacted a random sample of customers who were not
affected by the customer demarketing implementation because they had contracts that did not
contain those components in question; these customers served as a control group. All
10 One could argue that because customers were offered an alternative contract, this contract termination is not truly customer demarketing. Study 6 (above), however, suggests that the consequences are similar; hence, we treat this case as customer demarketing, while being aware that this may be a special case of customer demarketing.
ACCEPTED MANUSCRIPT

ACCEP
TED M
ANUSC
RIPT
29
questionnaires had an identical design; a small code that was not informative to the respondents
allowed us to identify to which group a response belonged. All households were located in the
same metropolitan region in Germany. We received 407 responses from customers who were not
affected by the contract termination and 711 responses from dismissed customers (= 1,118
responses; 14.28% response rate).11 For the following analyses, we combine all households who
received customer demarketing into our treatment group. All surveyed households that had not
received the contract termination letter served as a control group.
4.3 Measures
To avoid that respondents associated the questionnaire with the particular service
provider, we did not use the provider’s brand name. Instead, we initially asked respondents who
were customers of that service provider at the time of the survey to name their current provider of
that particular utility. All other respondents were asked to name the firm that provided that utility
to their household two years prior. All questions then related to the brand the respondents named.
This procedure ensured that the object of all questions is always the same provider (i.e., the focal
firm). We applied the same measurements as before to assess the perceived fairness of the firm’s
behavior (α=.89), brand attitude (α=.91), and nWoM intention (α=.82). In addition, we provided
an alphabetical list to respondents that contained the 10 largest brands (our focal brand was
among them) that provided this utility in this region. We then asked the respondents to indicate
their intention to sign a contract with each brand if they had to choose a provider today. We use
this as an additional dependent variable.
11 To assess non-response, we test whether early respondents differed from late respondents in our focal variables (Armstrong & Overton 1977). We cannot identify a significant difference. Additionally, we do not detect significant differences between households that were affected by demarketing compared to those that were not. In addition, we test for an interaction between demarketing treatment and response time, again without a significant result. We therefore conclude that non-response should not be a problem for our results.
ACCEPTED MANUSCRIPT

ACCEP
TED M
ANUSC
RIPT
30
4.4 Results
When assessing the impact of the contract termination on our dependent variables, it is
important to note that we were not involved in the planning and execution of the customer
demarketing intervention. This also implies that the assignment of respondents to the treatment
condition was not random. Rather, customers received the customer demarketing treatment when
they had a certain type of contract with the firm. This particular contract was offered until two
years before the termination, and at that time, this particular contract was the only contract
offered by the firm. We therefore cannot exclude the existence of a selection bias. To address
potential self-selection problems, we complement our analysis with a propensity score matching
procedure that is often used in similar (quasi-experimental) settings (e.g., Rosenbaum & Rubin
1985). The general idea is that for every household that was affected by customer demarketing,
we identify a household that was not affected but is as similar as possible in all other aspects, and
this assessment is based on the propensity to be subject to customer demarketing. We then
compare our dependent variable only between the households affected by demarketing and their
identified matching partners from the non-affected households. We follow the literature on
propensity score matching and estimate the propensity scores with a probit model, using a Kernel
estimator (Epanechnikov, bandwidth of .06) and common support (i.e., only households with
similar propensity scores are included in the comparison; Caliendo & Kopeinig 2008). The
matching removes most of the observable differences in the covariates between the two treatment
groups (Appendix D), which becomes evident in a standardized bias after a matching of less than
5%, suggesting a good matching quality (Caliendo & Kopeinig 2008). The results of the matched
and unmatched sample are very similar. To conserve space, we present only the main findings in
Table 9 (see Appendix C-E for details), which are based on a comparison between all customers
from our sample who received customer demarketing (treatment) and those who did not (control).
ACCEPTED MANUSCRIPT

ACCEP
TED M
ANUSC
RIPT
31
Does experiencing real customer demarketing have a measurable effect on key variables
such as brand attitude or nWoM? The answer is unequivocal: yes, it does. On a 7-point scale,
demarketing reduces the perceived fairness 1.68 points, and the indirect effect via fairness show
strong effects on attitude and nWoM (Table 5). The effect on the intention to sign a new contract
with this provider appears to be the strongest, which highlights the detrimental effect of customer
demarketing on the firm’s relationship to the customer base. In the unmatched sample, the effects
are almost the same (lower part table 9). We estimate several other versions of the model that
included different sets of the covariates. However, none of our focal coefficients changes in a
meaningful way. We therefore report the most parsimonious model.
TABLE 5 about here
In line with the previous studies, we find that consumers disapprove of demarketing
because they perceive it as unfair, as evidenced by the significant indirect effects of the mediation
via fairness. Hence, this field study supports the findings from the experiments, and the size of
the effects (e.g., the effect on fairness) is quite similar to the experimental studies. One aspect of
this field study deserves attention. The survey was conducted one year after the customer
demarketing “treatment”, which is a long time frame compared to lab experiments, where the
dependent variables are measured usually minutes after the treatment. Nonetheless, we find
strong effects. This suggests that customer demarketing leaves sustainable and long-lasting scars
on the relationship between a company and its customers.
5. Discussion
Across seven experiments and a field study, we shed light on consumer reactions to
customer demarketing and investigate the underlying mechanisms (mediators) and ways to
mitigate the negative effects (moderators). Specifically, we empirically demonstrate the extent to
which customer demarketing affects both attitudinal (reduces brand attitude) as well as
ACCEPTED MANUSCRIPT

ACCEP
TED M
ANUSC
RIPT
32
behavioral (increases negative WoM) customer responses. Our results have a number of
important theoretical and managerial implications.
5.1. Theoretical Implications
First, our study demonstrates how remarkably sustainable the effects of customer
demarketing are. For example, we find the negative effects of customer demarketing in a field
study in which the measurement was performed one year after the contract terminations.
Importantly, and consistent with social identification theory (Tajfel & Turner 1986), merely
observing customer demarketing in the marketplace induces negative consumer reactions, both
attitudinal and behavioral, i.e., one does not need to experience customer demarketing directly to
respond in these ways. Thus, our empirical insights add to the mostly conceptual or theoretical
literature about customer demarketing (e.g., Mittal, Sarkees, & Murshed 2008, Kotler & Levy
1971) and extend the empirical work by Haenlein & Kaplan (2010, 2011, 2012) by testing new
mediators and moderators. The fact that the results are consistent across all studies, cover close to
2800 respondents in the experimental studies alone and are independent of the method of analysis
in the field study (i.e., matched or unmatched sample) provides confidence in the robustness of
the results. The findings are summarized in Table 3.
Second, our results on the underlying mechanisms suggest that customer demarketing
produces negative effects because it is perceived as unfair. This also holds when we introduce
two alternative mediators (warmth and competence). Overall, our results suggest that if firms
successfully address consumers’ fairness concerns, they can mitigate the negative effects of
customer demarketing. Furthermore, on a broader level, our findings suggest that excessive
customer demarketing that is perceived as unfair may contribute to anti-corporate sentiments
among some consumers (e.g., Cronin et al. 2012). Although it is not at the center of our study,
our findings also contribute to the stream of literature on the antecedents of warmth and
ACCEPTED MANUSCRIPT
ACCEP
TED M
ANUSC
RIPT
33
competence perceptions of the company (Aaker et al. 2012; Kervyn et al. 2012) by uncovering
how customer demarketing affects those perceptions.
Third, this research contributes to the stream of literature on customer lifetime value
(CLV; Venkatesan & Kumar 2004) by providing insights about strategic options to manage
unprofitable customers. Our results shed light on both (1) insignificant and (2) significant
moderators of the negative effects of customer demarketing. With respect to the first group of
moderators, we find that the effects of customer demarketing are largely independent of whether
the objective reason for demarketing is attributed to the firm or the customer. This is consistent
with the notion of self-serving bias, i.e., despite objective facts, people automatically attribute
blame for negative events such as customer demarketing to the actions of the firm rather than to
situational factors or the actions of other customers (Mezulis et al. 2004). Furthermore, the effects
of customer demarketing remain strong regardless of the social distance to those customers
whose contracts were terminated. This finding is consistent with the idea that when observing
demarketing, consumers are likely to identify with other customers, even ones who are socially
distant from them, and react accordingly (Tajfel & Turner 1986).
With respect to the second group of moderators, we identify several moderators that could
substantially reduce the negative effect of customer demarketing. Specifically, consistent with the
idea that the commonness of an observed behavior changes fairness judgments via the availability
heuristic (Tversky & Kahneman 1973), the effects of demarketing will be less negative if firms
succeed in communicating that customer demarketing is quite common. Furthermore, consistent
with loss aversion theory, the negative effect will also be reduced if the company frames the
cause for customer demarketing as a loss to the firm. This finding is also in line with the dual
entitlement principle (Kahneman, Knetsch & Thaler 1986), suggesting that transactions are
perceived as unfair if one of the two parties involved is deprived of their entitlement. Hence,
ACCEPTED MANUSCRIPT
ACCEP
TED M
ANUSC
RIPT
34
firms can mitigate the negative effect of demarketing when they raise awareness that there is a
loss involved for the firm if the firm does not take action.
Finally, firms can mitigate the negative effects of demarketing by making an alternative
offer, which may be an attractive option if the firm is interested in keeping the customer under
the terms of a new contract. Our results provide further evidence for the economics theory
suggesting that monetary compensation is an effective tool in restoring distributive justice and
increasing fairness perceptions (Tax et al. 1998). However, the effect of monetary compensation
on fairness and the dependent variables can vary in a non-monotonic way with the compensation
amount. For example, a small monetary compensation may be perceived as too little and insulting
when compared with what consumers feel is fair given a specific contract and/or social norms,
leading to detrimental trivialization effects of such a compensation versus no compensation at all
(Gneezy & Rustichini 2000; Liu et al. 2015). Our results are consistent with Gneezy & Rustichini
(2000) and suggest that too small compensation could be worse than no compensation. In sum,
firms can reduce the effects when the dismissed customers receive substantial monetary
compensation, while small compensations could backfire. A substantial compensation will allow
the customer to extract utility from the relationship of which she would otherwise be deprived.
Additionally, such compensation would signal that the firm seriously considers the customer’s
position. This will mitigate – albeit not eliminate – the negative effects of customer demarketing.
5.2. Managerial Implications
Our management implications address the question whether a firm should terminate
contracts with customers at all. Our results highlight the negative consequences of customer
demarketing and hence suggest that prevention is important. This implies that firms should
carefully monitor their customer acquisition strategy to avoid attracting unprofitable customers in
the first place. At the same time, firms must monitor their existing customers’ risk of becoming
ACCEPTED MANUSCRIPT

ACCEP
TED M
ANUSC
RIPT
35
unprofitable. Hence, a firm should calculate and predict customers’ lifetime values (CLV). This
requires predicting and monitoring customers’ usage behavior, particularly in industries where
unlimited usage plans are common but costs depend on usage (e.g., telecommunication). A firm
can then provide early incentives to customers to either become profitable or to systematically
reduce switching costs for those customers at risk. This is against many managers’ intuition,
particularly when the management compensation is linked to indicators such as “number of new
customers” (Kaplan 2012). The relevance of these processes is highlighted by a recent case of a
German bank (“number 26”, Table 1) that gives customers a free checking account and free cash
withdrawal at all national ATMs. However, the bank incurred positive marginal costs for each
cash withdrawal, which rendered customers who frequently withdrew money unprofitable. The
firm terminated the contracts with these customers, which led to substantial negative WoM.
Careful monitoring of the CLV may have reduced the harm. Thus, only if CLV is negative and
when all means of making the future CLV positive have failed should a firm consider customer
demarketing. Firms must also act within accepted ethical boundaries; otherwise, unfairness
perceptions and their consequences are likely to be even more severe. Thus, corporate social
responsibility requires the careful evaluation of customer demarketing.
When firms choose a customer demarketing strategy, they must be prepared that
consumers will perceive such an action as unfair, cold, and incompetent and penalize the firm.
This harms the firm’s brand image and evokes the tendency of individuals to engage in negative
WoM. This impact holds not only for consumers directly experiencing demarketing but also for
those merely observing it, e.g., by reading about it in the media. While our results show that it is
difficult to mitigate the negative effects of customer demarketing, they also offer important
insights for managers not only on effective strategies to decrease the negative effects but also on
strategies that (although commonly used) are ineffective. We summarize those below.
ACCEPTED MANUSCRIPT
ACCEP
TED M
ANUSC
RIPT
36
Implications for what firms should do. (1) Firms should communicate the commonness of
customer demarketing in the marketplace, as it helps to reduce its negative effects across the
board. (2) Firms should make an alternative offer. Provided a firm wants to keep the customer
under new conditions, it is likely to be a very effective strategy that increases customer
profitability and mitigates the negative effects of customer demarketing. (3) Firms should
consider substantial financial compensation if it is sufficiently important to dismiss customers.
(4) Firms should justify demarketing by focusing on the framing of the loss to the firm (if
possible, by quantifying the monetary value of the loss). As these types of framing do not damage
the perception of the firm’s competence, they help significantly reduce the unfairness perception
and resulting negative effects of customer demarketing.
Implications for what firms should NOT do. (1) The company should not underestimate
the negative effects demarketing has on customers who are merely observe it or learn about it
from the press. (2) Firms should not offer small compensation, as they may backfire. (3) Firms
should not publicly attribute blame to the customers because due to self-serving bias, most
customers will blame it on the firm anyway. (4) Firms should not distance existing customers
from dismissed ones and communicate “they are different”, as consumers are still likely to
identity with other consumers rather than with the company. (5) Firms should not justify
customer demarketing by focusing on gains framing (i.e., how much the customer has gained
from this company so far, or how much a company can gain by dismissing the customer), as gain
frames tend to amplify the negative effects of customer demarketing.
6. Limitations and Future Research
As with any research, this research has a number of limitation that offer potential avenues
for further research. First, it was important for this study that the manipulations were perceived as
realistic as possible, which could have weakened the strength of the manipulation (particularly in
ACCEPTED MANUSCRIPT

ACCEP
TED M
ANUSC
RIPT
37
Study 3). However, future studies may want to increase the strength of manipulation or use actual
data (if available) on the reactions to customer demarketing. Second, although empirical evidence
suggests that the directions of behavioral intentions are good predictors of the directions of actual
behavior (Chandon et al. 2005), the intentions might differ from actual behavior. We hope that
researchers will increasingly find opportunities to collect behavioral data in this very sensitive
field. Third, our data do not allow us to estimate the cash flow effects that occur from terminating
customers. Although simulations have shown the potential benefits on profitability due to
selective demarketing (e.g., Haenlein, Kaplan, & Schoder 2006), an empirical test is still a
challenge because it requires a monetary quantification of the negative spill-over effects to other
(potential) customers. Hence, a promising avenue for a future research would be addressing the
effects of customer demarketing on firm’s profitability – especially as disruptive behavior (using
social media) of individuals is an element that should be included in the calculation of the CLV.
Additionally, customer demarketing may increase the prevalence of anti-corporate attitudes,
which may amplify these effects. Fourth, while we show that fairness perceptions are an
important driver of the negative effects of customer demarketing – even if we control for
potential alternative mediators – future research should explore other potential mediators. For
example, as openness about firm’s losses seem to reduce unfairness perceptions, it is worthwhile
to test how the number or type of communication before termination helps to close the unfairness
gap between firms and customers. Fifth, as we conducted our studies in Germany, we cannot
generalize the findings across different cultures. Further, although in our field study we identified
segments of customers that differed in their behavioral reactions to customer demarketing, the
study’s setup did not allow us to clearly disentangle cause and effect and hence reliably describe
the differences among those segments. This offers opportunities for future research to examine
difference among the types of demarked/terminated customers. Finally, although our results
ACCEPTED MANUSCRIPT

ACCEP
TED M
ANUSC
RIPT
38
across industries suggest that even for less vital services (Internet), customer demarketing is
associated with strong negative effects, the effects could be even stronger for utilities providers.
This opens avenues for future research to address the generalizability of our findings to other
settings, such as entertainment services, utilities providers, or B2B.
References
Aaker, Jennifer L., Garbinsky, Emily N., & Vohs, Kathleen D. (2012). Cultivating admiration in brands: Warmth, competence, and landing in the “golden quadrant”. Journal of Consumer Psychology, 22(2), 191–194.
Aaker, Jennifer L., Vohs, Kathleen D., & Mogilner, Cassie (2010). Nonprofits are seen as warm and for-profits as competent: Firm stereotypes matter. Journal of Consumer Research, 37(2), 224-237.
Anderson, Eugene W. (1998). Customer Satisfaction and Word-of-Mouth. Journal of Service Research, 1(1), 5–17.
Ang, Lawrence, & Taylor, Ben (2005). Managing customer profitability using portfolio matrices. Journal of Database Marketing & Customer Strategy Management, 12(4), 298–304.
Armstrong, J. Scott, & Overton, Terry S. (1977). Estimating Nonresponse Bias in Mail Surveys. Journal of Marketing Research, 14(3), 396–402.
Ashforth, Blake E., & Mael, Fred (1989). Social Identity Theory and the Organization. The Academy of Management Review, 14(1), 20–39.
Berger, Jonah, & Heath, Chip (2008). Who Drives Divergence? Identity Signaling, Outgroup Dissimilarity, and the Abandonment of Cultural Tastes. Journal of Personality and Social Psychology, 95(3), 593–607.
Bolton, Lisa E., Keh, Hean T., & Alba, Joseph W. (2010). How Do Price Fairness Perceptions Differ Across Culture. Journal of Marketing Research, 47(3), 564–576.
Bolton, Lisa E., Warlop, Luk, & Alba, Joseph W. (2003). Consumer Perceptions of Price (Un)Fairness. Journal of Consumer Research, 29(4), 474–491.
Bott, Hermann, & Reuter, Wolfgang (2000). Die Abschiebung, retrieved from http://www.spiegel.de/spiegel/print/d-16044510.html
Bradley, Nigel, & Blythe, Jim (2014). Demarketing: an Overview of the antecedents and current status of the discipline. In Nigel Bradley & Jim Blythe (Eds.), Demarketing, (pp. 1-8). New York: Routhledge.
Caliendo, Marco, & Kopeinig, Sabine (2008). Some practical guidance for the implementation of propensity score matching. Journal of Economic Surveys, 22(1), 31–72.
Camerer, Colin (2005). Three Cheers—Psychological, Theoretical, Empirical—for Loss Aversion. Journal of Marketing Research, 42(2), 129–133.
Chandon, Pierre, Morwitz, Vicky G., & Reinartz, Werner J. (2005). Do Intentions Really Predict Behavior? Self-Generated Validity Effects in Survey Research. Journal of Marketing, 69(2), 1–14.
Cronin, Tracey, Reysen, Stephen, & Branscombe, Nyla R. (2012). Wal-Mart’s Conscientious Objectors: Perceived Illegitimacy, Moral Anger, and Retaliatory Consumer Behavior. Basic & Applied Social Psychology, 34(4), 322–335.
ACCEPTED MANUSCRIPT

ACCEP
TED M
ANUSC
RIPT
39
Cuddy, Amy J. C., Fiske, Susan T., & Glick, Peter (2008). Warmth and competence as universal dimensions of social perception: The stereotype content model and the BIAS map. Advances in Experimental Social Psychology, 40, 61–149.
Gelbrich, Katja (2010). Anger, frustration, and helplessness after service failure: coping strategies and effective informational support. Journal of the Academy of Marketing Science, 38(5), 567–585.
Gneezy, Uri, and Rustichini, Aldo (2000). Pay enough or don't pay at all. Quarterly Journal of Economics, 115(3), 791–810.
Gupta, Sunil, & Mela, Carl F. (2008). What is a free Customer Worth? Armchair calculations of nonpaying customers’ value can lead to flawed strategies. Harvard Business Review, 86(11), 102–109.
Haenlein, Michael (2013). Social interactions in customer churn decisions: The impact of relationship directionality. International Journal of Research in Marketing, 30(3), 236–248.
Haenlein, Michael, & Kaplan, Andreas M. (2010). An empirical analysis of attitudinal and behavioral reactions toward the abandonment of unprofitable customer relationships. Journal of Relationship Marketing, 9(4), 200–228.
Haenlein, Michael, & Kaplan, Andreas M. (2011). Evaluating the consequences of abandoning unprofitable customers: A comparison of direct and indirect abandonment strategies. Zeitschrift für Betriebswirtschaft, 81(2), 77–94.
Haenlein, Michael, & Kaplan, Andreas M. (2012). The impact of unprofitable customer abandonment on current customers’ exit, voice, and loyalty intentions: an empirical analysis. Journal of Services Marketing, 26(6), 458–470.
Haenlein, Michael, Kaplan, Andreas M., & Schoder, Detlef (2006). Valuing the Real Option of Abandoning Unprofitable Customers when calculating Customer Lifetime Value. Journal of Marketing, 70(3), 5–20.
Hayes, Andrew F. (2013). Introduction to Mediation, Moderation, and Conditional Process Analysis: A Regression-Based Approach New York: The Guilford Press.
Hess, Alexandra C. & Melnyk, Valentyna (2016). Pink or blue? The impact of gender cues on brand perceptions. European Journal of Marketing, 50(9/10), 1550–1574.
Homburg, Christian, Droll, Mathias, & Totzek, Dirk (2008). Customer Prioritization: Does It Pay Off, and How Should It Be Implemented. Journal of Marketing, 72(5), 110–130.
Kahneman, Daniel, & Tversky, Amos (1979). Prospect theory: An analysis of decision under risk. Econometrica, 47(2), 263–291.
Kahneman, Daniel, Knetsch, Jack J., & Thaler, Richard (1986). Fairness as a Constraint on Profit Seeking: Entitlements in the Market. The American Economic Review, 76 (4), 728–741.
Kaplan, Robert S. (2012). When to Drop an Unprofitable Customer. Harvard Business Review, 90(4), 137–141.
Kähr, Andrea, Nyffenegger, Bettina, Krohmer, Harley, & Hoyer, Wayne D (2016). When Hostile Consumers Wreak Havoc on Your Brand: The Phenomenon of Consumer Brand Sabotage. Journal of Marketing, 80 (3), 25-41.
Kervyn, Nicolas, Fiske, Susan T., & Malone, Chris (2012). Brands as Intentional Agents Framework: How Perceived Intentions and Ability Can Map Brand Perception. Journal of Consumer Psychology, 22(2), 166–176.
Kim, Eunjin, & Lee, Byungtae (2007). An economic analysis of customer selection and leveraging strategies in a market where network externalities exist. Decision Support Systems, 44(1), 124–134.
Kotler, Philip & Levy, Sidney J. (1971). Demarketing, yes, demarketing. Harvard Business Review, 49(6), 74–80.
ACCEPTED MANUSCRIPT
ACCEP
TED M
ANUSC
RIPT
40
Lehmann, Donald R. (1999). Consumer behavior and Y2K. Journal of Marketing, 63(Fundamental Issues and Directions for Marketing), 14–18.
Liu, Peggy J., Lamberton, Cait, & Haws, Kelly L. (2015). Should Firms Use Small Financial Benefits to Express Appreciation to Consumers? Understanding and Avoiding Trivialization Effects. Journal of Marketing, 79(3), 74–90.
Markman, Keith D., Gavanski, Igor, Sherman, Steven J., & McMullen, Matthew N. (1993). The mental simulation of better and worse possible worlds. Journal of Experimental Social Psychology, 29(1), 87–109.
Mayser, Sabine, & von Wangenheim, Florian (2013). Perceived fairness of differential customer treatment consumers’ understanding of distributive justice really matters. Journal of Service Research, 16(1), 99-113.
McColl-Kennedy, Janet R. & Sparks, Beverley A. (2003). Application of Fairness Theory to Service Failures and Service Recovery. Journal of Service Research, 5(3), 251–266.
Mezulis, A. H., Abramson, L. Y., Hyde, J. S., & Hankin, B. L. (2004). Is there a universal positivity bias in attributions? A meta-analytic review of individual, developmental, and cultural differences in the self-serving attributional bias. Psychological Bulletin, 130(5), 711-747.
Mittal, Vitas, Sarkees, Matthew, & Murshed, Feisal (2008). The Right Way to Manage Unprofitable Customers. Harvard Business Review, 86(4), 94–102.
Patterson, Paul. G., Cowley, Elizabeth, & Prasongsukarn, Kriengsin (2006). Service failure recovery: The moderating impact of individual-level cultural value orientation on perceptions of justice. International Journal of Research in Marketing, 23(3), 263–277.
Pazgal, Amit, Soberman, David, & Thomadsen, Raphael (2013). Profit-Increasing Consumer Exit. Marketing Science, 32(6), 998–1008.
Poppe, Matthijs, & Valkenberg, Huib (2003). Effects of Gain versus Loss and Certain versus Probable Outcomes on Social Value Orientations. European Journal of Social Psychology, 33(3), 331-337.
Porath, Christine, MacInnis, Deborah, & Folkes, Valerie S. (2011). It’s Unfair: Why Customers Who Merely Observe an Uncivil Employee Abandon the Company. Journal of Service Research, 14(3), 302–317.
Price, Linda L., & Arnould, Eric J. (1999). Commercial Friendships: Service Provider-Client Relationships in Context. Journal of Marketing, 63(4), 38–56.
Rosenbaum, Paul R., & Rubin, Donald B. (1985). Constructing a control group using multivariate matched sampling methods that incorporate propensity score. American Statistician, 39(1), 33–38.
Ross, Lee. (1977). The intuitive psychologist and his shortcomings: Distortions in the attribution process. Advances in Experimental Social Psychology, New York: Academic Press. pp. 173–220.
Rust, Roland T., Kumar, V., & Venkatesan, Rajkumar (2011). Will the frog change into a prince? Predicting future customer profitability. International Journal of Research in Marketing, 28(4), 281–294.
Samaha, Stephen A., Palmatier, Robert W., & Dant, Rajiv P. (2011). Poisoning Relationships: Perceived Unfairness in Channels of Distribution. Journal of Marketing, 75(3), 99–117.
Shah, Denish, Kumar, V., Qu, Yingge, & Chen, Sylia (2012). Unprofitable Cross-Buying: Evidence from Consumer & Business Markets. Journal of Marketing, 76(3), 78–95.
Shin, Jiwoong, Sudhir, K., & Yoon, Dae H. (2012). When to “Fire” Customers: Customer Cost-Based Pricing. Management Science, 58(5), 932–947.
Spears, Nancy, & Singh, Surendra N. (2004). Measuring Attitude Toward the Brand and Purchase Intentions. Journal of Current Issues & Research in Advertising, 26(2), 53–66.
ACCEPTED MANUSCRIPT
ACCEP
TED M
ANUSC
RIPT
41
Tajfel, Henri, & Turner, John C. (1986). The social identity theory of intergroup behavior. In Stephen Worchel & William G. Austin (Eds.), Psychology of intergroup relations, (pp. 7–24). Chicago: Nelson-Hall.
Tarrant, Mark, Dazeley, Sarah, & Cottom, Tom (2009). Social categorization and empathy for outgroup members. British Journal of Social Psychology, 48(3), 427–446.
Tax, Stephen S., Brown, Stephen S. W., & Chandrashekaran, Murali (1998). Customer evaluations of service complaint experiences: implications for relationship marketing. Journal of Marketing, 62(2), 60-76.
Tomlinson, Edward C., & Mayer, Roger C. (2009). The role of causal attribution dimensions in trust repair. Academy of Management Review, (34:1), 85-104.
Trope, Yaacov, Liberman, Nira, & Wakslak, Cheryl (2007). Construal Levels and Psychological Distance: Effects on Representation, Prediction, Evaluation, and Behavior. Journal of Consumer Psychology, 17(2), 83–95.
Turillo, Carmelo J., Folger, Robert, Lavelle, James J., Umphress, Elizabeth E., & Gee, Julie O. (2002). Is virtue its own reward? Self-sacrificial decisions for the sake of fairness. Organizational Behavior and Human Decision Processes, 89 (1), 839–865.
Tversky, Amos, & Kahneman, Daniel (1973). Availability: A heuristic for judging frequency and probability. Cognitive Psychology, 5(2), 207-232.
Vohs, Kathleen D., Baumeister Roy F., & Chin Jason (2007). Feeling duped: Emotional, motivational, and cognitive aspects of being exploited by others. Review of General Psychology, 11(2), 127–141.
Venkatesan, R., & Kumar, V. (2004). A customer lifetime value framework for customer selection and resource allocation strategy. Journal of Marketing, 68(4), 106-125.
Walster, Elaine, Berscheid, Ellen, & Walster, G. William (1973). New directions in equity research. Journal of Personality and Social Psychology, 25(2), 151-176.
Weiner, B. (1985). An attributional theory of achievement motivation and emotion. Psychological Review, 92(4), 548–573.
Wlömert, N., & Papies, D. (2016). On-demand streaming services and music industry revenues — Insights from Spotify’s market entry. International Journal of Research in Marketing, 33(2), 314–327.
Wojciszke, Bogdan, Bazinska, Roza, & Jaworski, Marcin (1998). On the dominance of moral categories in impression formation. Personality and Social Psychology Bulletin, 24(12), 1251-1263.
Xenikou, Athena, Furnham, Adrian, & McCarrey, Michael (1997). Attributional style for negative events: A proposition for a more reliable and valid measure of attributional style. British Journal of Psychology, 88(1), 53–69.
Xia, L., Monroe, K. B., & Cox, J. L. (2004). The price is unfair! A conceptual framework of price fairness perceptions. Journal of Marketing, 68(4), 1-15.
ACCEPTED MANUSCRIPT

ACCEP
TED M
ANUSC
RIPT42
TABLES AND FIGURES
TABLE 1: Examples of Customer Demarketing
Industry Company Product/Service Year Background Customer Demarketing Method Source Telecommunication O2 Mobile phone
service 2011 High expenses for heavy users of
a mobile tariff with a cost cap Termination http://www.teltarif.de/o2-o-kuendigung-
rauswurf-vielnutzer-poweruser-heavy-user-kosten-airbag/news/42631.html
Telecommunication Deutsche Telekom
ISDN 2009 Dismissing unattractive existing contracts to save costs
Termination http://www.spiegel.de/wirtschaft/0,1518,626542,00.html
Telecommunication EPlus Data plan for mobile phones
2008 Permanent data activity reduces the network quality
Termination http://www.zdnet.de/news/39189273/e-plus-kuendigt-kunden-mit-daten-flatrate.htm
Telecommunication Sprint Nextel Data plan for mobile phones
2007 Calling customer-service lines too often
Letters notifying some customers that their service would be canceled one month later due to excessive calls to customer service (sample letter: Appendix A)
http://news.cnet.com/8301-10784_3-9739869-7.html
Telecommunication Comcast Broadband internet 2007 In regions where it is too expensive to invest in the network infrastructure, it is cheaper to discontinue service to heavy users
Cutting off service – often without warning – when high-speed Internet customers exceed an unstated download limit
http://www.infoworld.com/d/adventures-in-it/comcast-silently-terminates-broadband-customers-405
Telecommunication Verizon Data plan for mobile phones
2007 Unusually high data activity over an extended period
Disconnect the mobile number http://www.dslreports.com/shownews/82762
Telecommunication 1&1 Broadband Internet 2005 Excessive data activity on unlimited subscription plans
Customer service offers 100 Euro if the customer terminates the contract
http://www.heise.de/newsticker/meldung/Goldener-Handschlag-fuer-Power-Sauger-108291.html
Energy Provider RheinEnergy Natural gas and electricity
2011 Unprofitability of existing contracts
Written notice of termination because of rearrangement of offerings
http://blog.guhlke.com/2011/07/rheinenergie-kundigt-fairregio-duo.html
Financial Service Provider
Number26 Checking account 2016 Unprofitability of existing contracts
Written notice of termination without explanation
http://www.handelsblatt.com/finanzen/steuern-recht/recht/fintech-number26-chef-verteidigt-girokonto-kuendigungen/13674190.html
Financial Service Provider
BHW Building savings contract
2007 Unprofitability of existing building saving contracts because of high fixed interest rates
Termination and payout http://www.vedix.de/bhw-bausparkasse-kundigt-kunden-563/
Retail Filene’s Basement
Off-price men's and women's apparel, home goods, and accessories
2003 Returned too many items and made too many complaints about service
Letter from the chain's corporate parent telling them they were no longer welcome in the stores
http://www.sunjournal.com/node/647822
ACCEPTED MANUSCRIPT
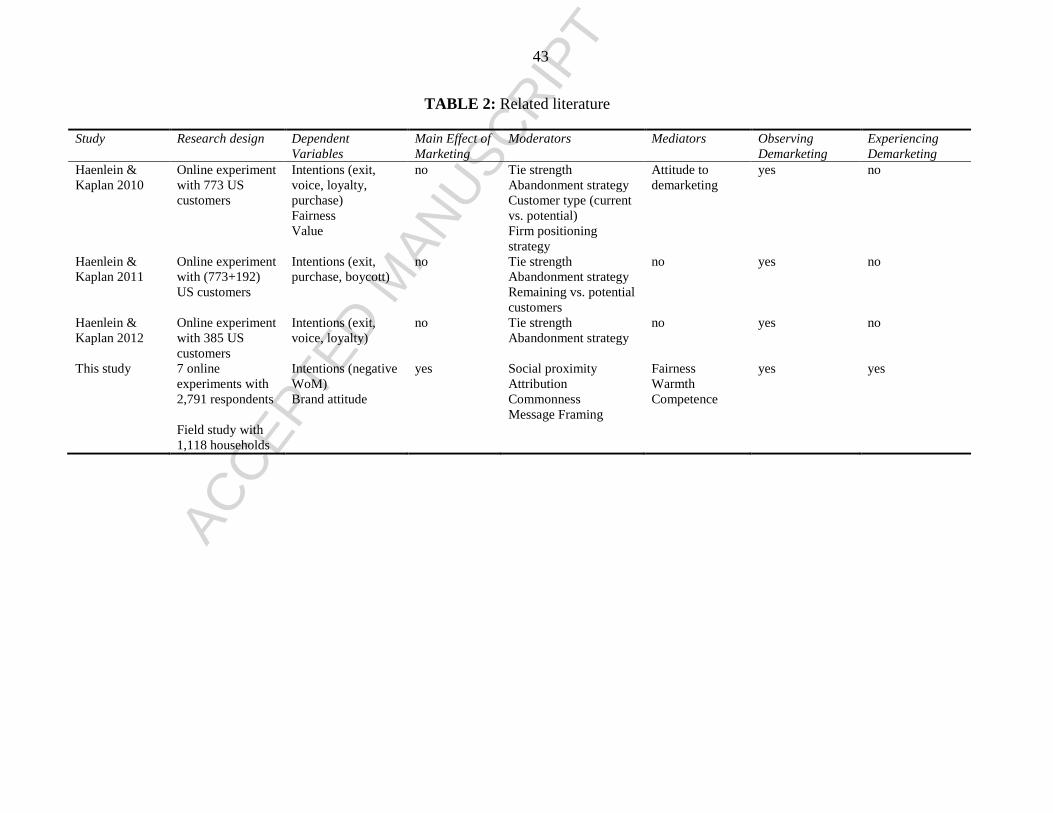
ACCEP
TED M
ANUSC
RIPT43
TABLE 2: Related literature
Study Research design Dependent Variables
Main Effect of Marketing
Moderators Mediators Observing Demarketing
Experiencing Demarketing
Haenlein & Kaplan 2010
Online experiment with 773 US customers
Intentions (exit, voice, loyalty, purchase) Fairness Value
no Tie strength Abandonment strategy Customer type (current vs. potential) Firm positioning strategy
Attitude to demarketing
yes no
Haenlein & Kaplan 2011
Online experiment with (773+192) US customers
Intentions (exit, purchase, boycott)
no Tie strength Abandonment strategy Remaining vs. potential customers
no yes no
Haenlein & Kaplan 2012
Online experiment with 385 US customers
Intentions (exit, voice, loyalty)
no Tie strength Abandonment strategy
no yes no
This study 7 online experiments with 2,791 respondents Field study with 1,118 households
Intentions (negative WoM) Brand attitude
yes Social proximity Attribution Commonness Message Framing
Fairness Warmth Competence
yes yes
ACCEPTED MANUSCRIPT
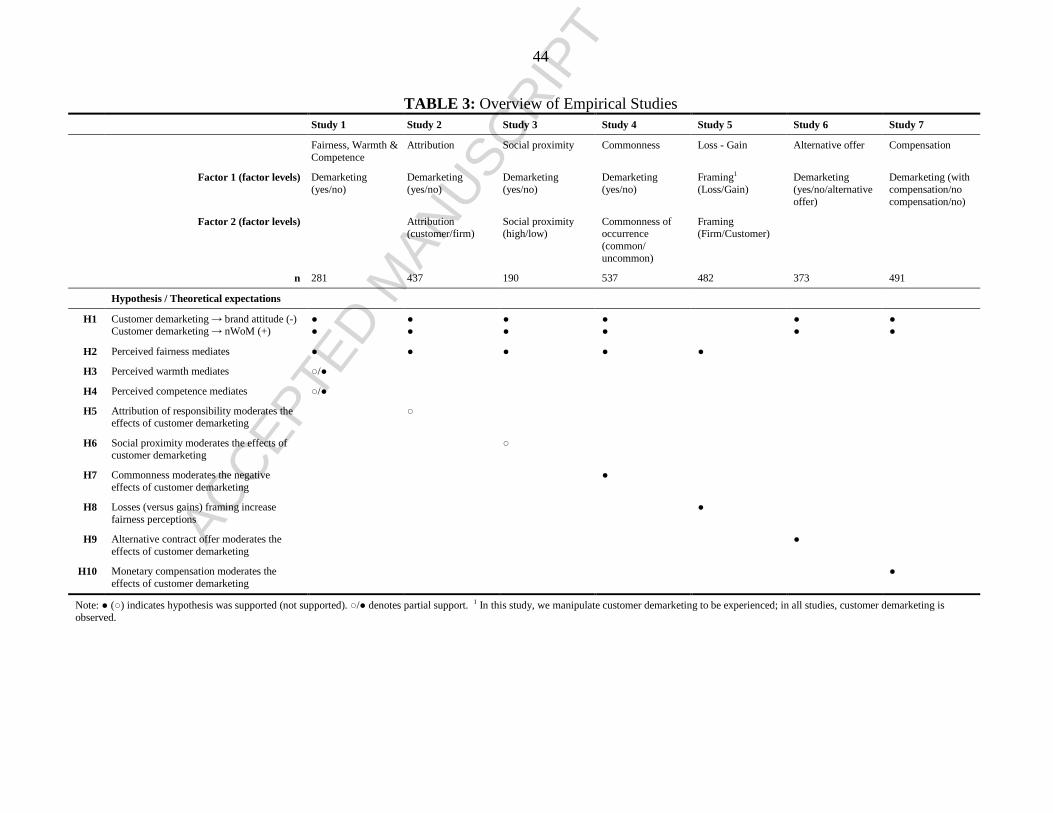
ACCEP
TED M
ANUSC
RIPT44
TABLE 3: Overview of Empirical Studies Study 1 Study 2 Study 3 Study 4 Study 5 Study 6 Study 7
Fairness, Warmth & Competence
Attribution Social proximity Commonness Loss - Gain Alternative offer Compensation
Factor 1 (factor levels) Demarketing (yes/no)
Demarketing (yes/no)
Demarketing (yes/no)
Demarketing (yes/no)
Framing1 (Loss/Gain)
Demarketing (yes/no/alternative offer)
Demarketing (with compensation/no compensation/no)
Factor 2 (factor levels) Attribution (customer/firm)
Social proximity (high/low)
Commonness of occurrence (common/ uncommon)
Framing (Firm/Customer)
n 281 437 190 537 482 373 491
Hypothesis / Theoretical expectations
H1 Customer demarketing → brand attitude (-) Customer demarketing → nWoM (+)
● ●
● ●
● ●
● ●
● ●
● ●
H2 Perceived fairness mediates ● ● ● ● ●
H3 Perceived warmth mediates ○/●
H4 Perceived competence mediates ○/●
H5 Attribution of responsibility moderates the effects of customer demarketing
○
H6 Social proximity moderates the effects of customer demarketing
○
H7 Commonness moderates the negative effects of customer demarketing
●
H8 Losses (versus gains) framing increase fairness perceptions
●
H9 Alternative contract offer moderates the effects of customer demarketing
●
H10 Monetary compensation moderates the effects of customer demarketing
●
Note: ● (○) indicates hypothesis was supported (not supported). ○/● denotes partial support. 1 In this study, we manipulate customer demarketing to be experienced; in all studies, customer demarketing is observed.
ACCEPTED MANUSCRIPT

ACCEP
TED M
ANUSC
RIPT
45
TABLE 4: Results (means and SD) for Studies 1-7
Study Factor 1 Factor 2 Fairness Brand Attitude
nWoM
Study 1 No Customer Demarketing [138] 4.83 (1.27) 4.59 (1.30) 2.82 (1.51) Customer Demarketing [143] 2.35 (1.70) 2.29 (1.64) 5.23 (1.80)
Study 2 No Customer Demarketing
Attribution Firm [112] 3.51 (1.46) 3.51 (1.54) 4.35 (1.49) Attribution Customer [106] 4.01 (1.58) 3.83 (1.57) 3.67 (1.59)
Customer Demarketing Attribution Firm [107] 1.87 (1.26) 1.92 (1.12) 5.58 (1.45) Attribution Customer [112] 2.89 (1.56) 2.67 (1.46) 4.97 (1.48)
Study 3 No Customer Demarketing
Socially close [30/39/38]* 4.27 (1.16) 4.38 (1.35) 3.59 (1.76) Socially distant [39/42/39]* 4.30 (.994) 4.11 (1.30) 3.72 (1.57)
Customer Demarketing Socially close [40/38/40]* 2.63 (1.18) 3.34 (1.23) 4.12 (1.46) Socially distant [42/42/41]* 2.90 (1.36) 3.42 (1.33) 4.31 (1.38)
Study 4 No Customer Demarketing
Uncommon [132] 4.21 (1.45) 4.03 (1.45) 3.18 (1.47) Common [129] 3.87 (1.42) 3.86 (1.35) 3.70 (1.50)
Customer Demarketing Uncommon [141] 2.19 (1.50) 2.20 (1.43) 5.19 (1.70) Common [135] 2.40 (1.45) 2.23 (1.38) 5.57 (1.54)
Study 5 Gain frame
Firm frame [122] 1.77 (1.13) 2.01 (1.22) 5.92 (1.35) Customer frame [117] 1.92 (1.26) 2.52 (1.38) 5.60 (1.53)
Loss frame Firm frame [123] 2.40 (1.53) 2.56 (1.45) 5.63 (1.56) Customer frame [120] 2.13 (1.29) 2.47 (1.47) 5.58 (1.61)
Study 6 No Customer Demarketing [132] 4.04 (1.32) 3.86 (1.43) 3.34 (1.46) Customer Demarketing [123] 2.11 (1.39) 2.04 (1.25) 5.22 (1.65) Alternative Offer [118] 2.46 (1.52) 2.53 (1.51) 4.96 (1.57)
Study 7
No Customer Demarketing [88] 3.94 (1.20) 3.90 (1.24) 3.34 (1.48)
Customer Demarketing [111] 2.02 (1.53) 2.12 (1.37) 5.22 (1.81)
Compensation 15€ [95] 1.66 (1.20) 1.82 (1.14) 5.45 (1.67)
Compensation 50€ [98] 2.18 (1.48) 2.16 (1.22) 5.27 (1.62)
Compensation 100€ [99] 2.50 (1.70) 2.54 (1.45) 5.06 (1.65)
Note: We report means per cell (standard deviation in brackets). Values in square brackets are sample sizes. * Sample sizes vary between conditions because of missing values.
ACCEPTED MANUSCRIPT
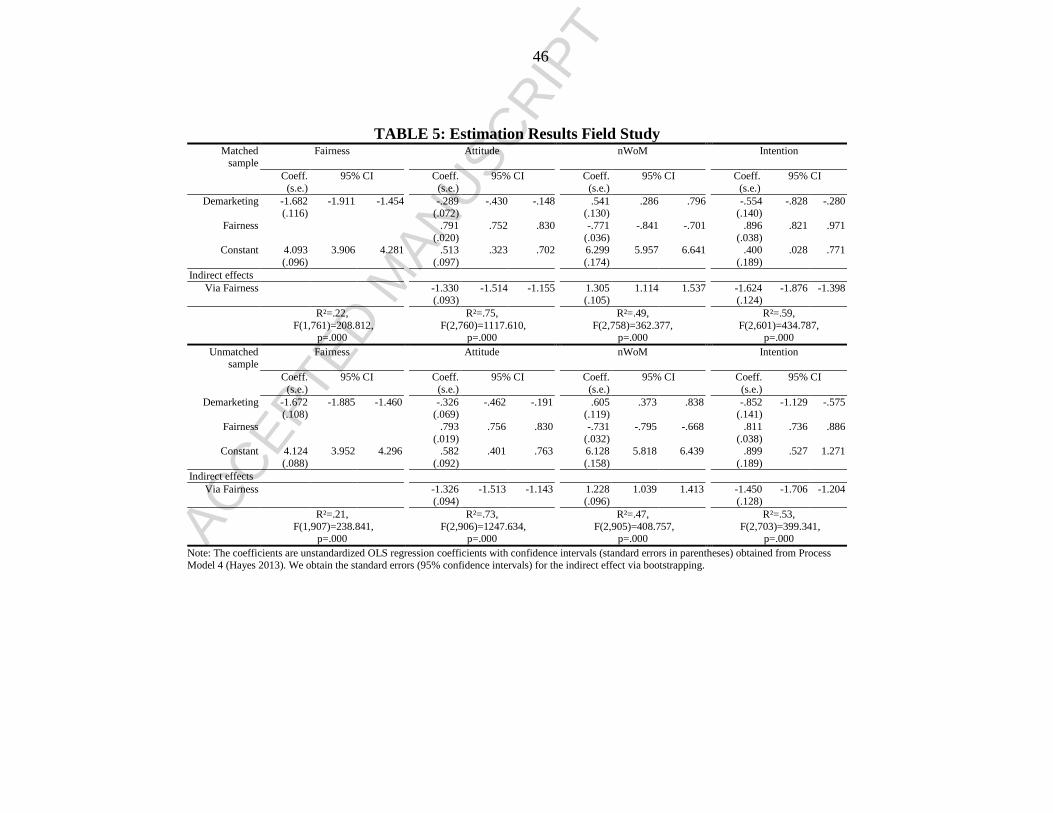
ACCEP
TED M
ANUSC
RIPT46
TABLE 5: Estimation Results Field Study Matched
sample Fairness Attitude nWoM Intention
Coeff. (s.e.)
95% CI Coeff. (s.e.)
95% CI Coeff. (s.e.)
95% CI Coeff. (s.e.)
95% CI
Demarketing -1.682 (.116)
-1.911 -1.454 -.289 (.072)
-.430 -.148 .541 (.130)
.286 .796 -.554(.140)
-.828 -.280
Fairness .791 (.020)
.752 .830 -.771 (.036)
-.841 -.701 .896(.038)
.821 .971
Constant 4.093 (.096)
3.906 4.281 .513 (.097)
.323 .702 6.299 (.174)
5.957 6.641 .400 (.189)
.028 .771
Indirect effects Via Fairness -1.330
(.093) -1.514 -1.155 1.305
(.105) 1.114 1.537 -1.624
(.124)-1.876 -1.398
R²=.22, F(1,761)=208.812,
p=.000
R²=.75, F(2,760)=1117.610,
p=.000
R²=.49, F(2,758)=362.377,
p=.000
R²=.59, F(2,601)=434.787,
p=.000 Unmatched
sample Fairness Attitude nWoM Intention
Coeff. (s.e.)
95% CI Coeff. (s.e.)
95% CI Coeff. (s.e.)
95% CI Coeff.(s.e.)
95% CI
Demarketing -1.672 (.108)
-1.885 -1.460 -.326 (.069)
-.462 -.191 .605 (.119)
.373 .838 -.852(.141)
-1.129 -.575
Fairness .793 (.019)
.756 .830 -.731 (.032)
-.795 -.668 .811 (.038)
.736 .886
Constant 4.124 (.088)
3.952 4.296 .582 (.092)
.401 .763 6.128 (.158)
5.818 6.439 .899 (.189)
.527 1.271
Indirect effects Via Fairness -1.326
(.094) -1.513 -1.143 1.228
(.096) 1.039 1.413 -1.450
(.128)-1.706 -1.204
R²=.21, F(1,907)=238.841,
p=.000
R²=.73, F(2,906)=1247.634,
p=.000
R²=.47, F(2,905)=408.757,
p=.000
R²=.53, F(2,703)=399.341,
p=.000 Note: The coefficients are unstandardized OLS regression coefficients with confidence intervals (standard errors in parentheses) obtained from Process Model 4 (Hayes 2013). We obtain the standard errors (95% confidence intervals) for the indirect effect via bootstrapping.
ACCEPTED MANUSCRIPT

ACCEP
TED M
ANUSC
RIPT
47
FIGURE 1: Conceptual Framework of Customer Demarketing in Commercial Contexts
Brand Attitude Negative WoM
Perceived Fairness Warmth
Competence
Customer Demarketing
Attribution Social Proximity Commonness
Loss/Gain
Alternative Offer Compensation
ACCEPTED MANUSCRIPT
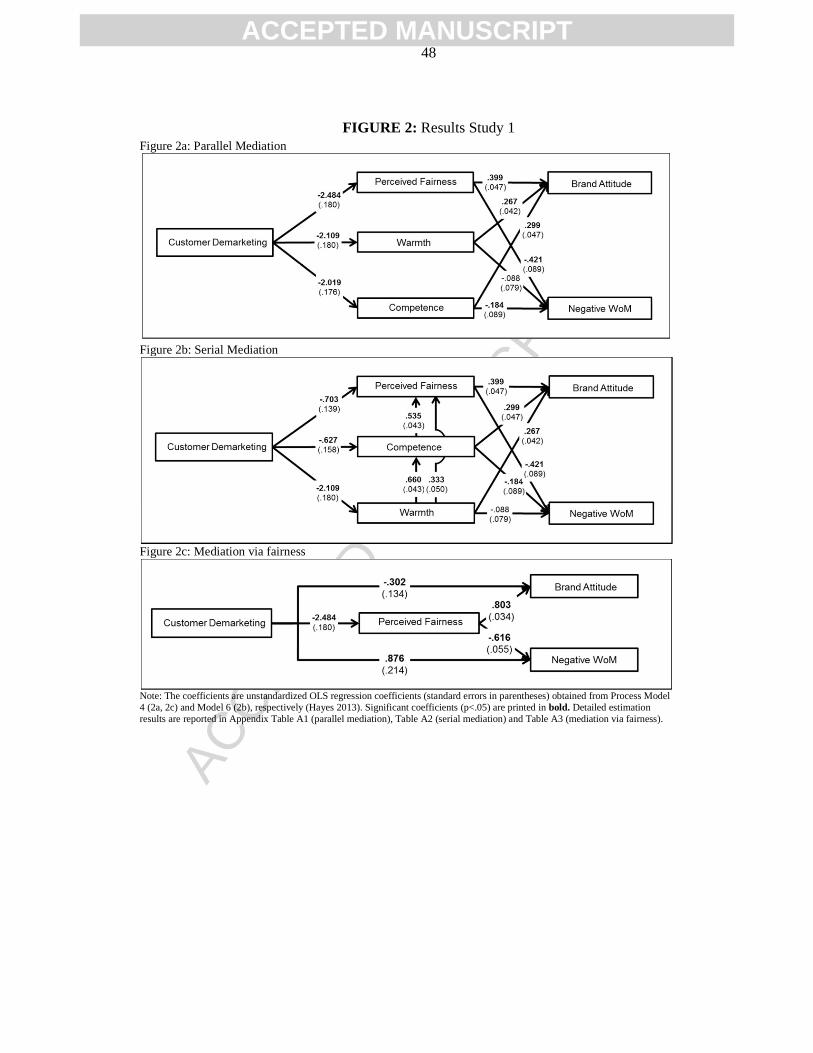
ACCEP
TED M
ANUSC
RIPT
48
FIGURE 2: Results Study 1 Figure 2a: Parallel Mediation
Figure 2b: Serial Mediation
Figure 2c: Mediation via fairness
Note: The coefficients are unstandardized OLS regression coefficients (standard errors in parentheses) obtained from Process Model 4 (2a, 2c) and Model 6 (2b), respectively (Hayes 2013). Significant coefficients (p<.05) are printed in bold. Detailed estimation results are reported in Appendix Table A1 (parallel mediation), Table A2 (serial mediation) and Table A3 (mediation via fairness).
ACCEPTED MANUSCRIPT

ACCEP
TED M
ANUSC
RIPT
49
FIGURE 3: Results Study 2
Note: The coefficients are unstandardized OLS regression coefficients (standard errors in parentheses) obtained from Process Model 7 (Hayes 2013). Significant coefficients (p<.05) are printed in bold. Detailed estimation results are reported in Table A4 (Appendix).
FIGURE 4: Results Study 3
Note: The coefficients are unstandardized OLS regression coefficients (standard errors in parentheses) obtained from Process Model 7 (Hayes 2013). Significant coefficients (p<.05) are printed in bold. Detailed estimation results are reported in Table A5 (Appendix).
FIGURE 5: Results Study 4
Note: The coefficients are unstandardized OLS regression coefficients (standard errors in parentheses) obtained from Process Model 7 (Hayes 2013). Significant coefficients (p<.05) are printed in bold. Detailed estimation results are reported in Table A6 (Appendix).
ACCEPTED MANUSCRIPT
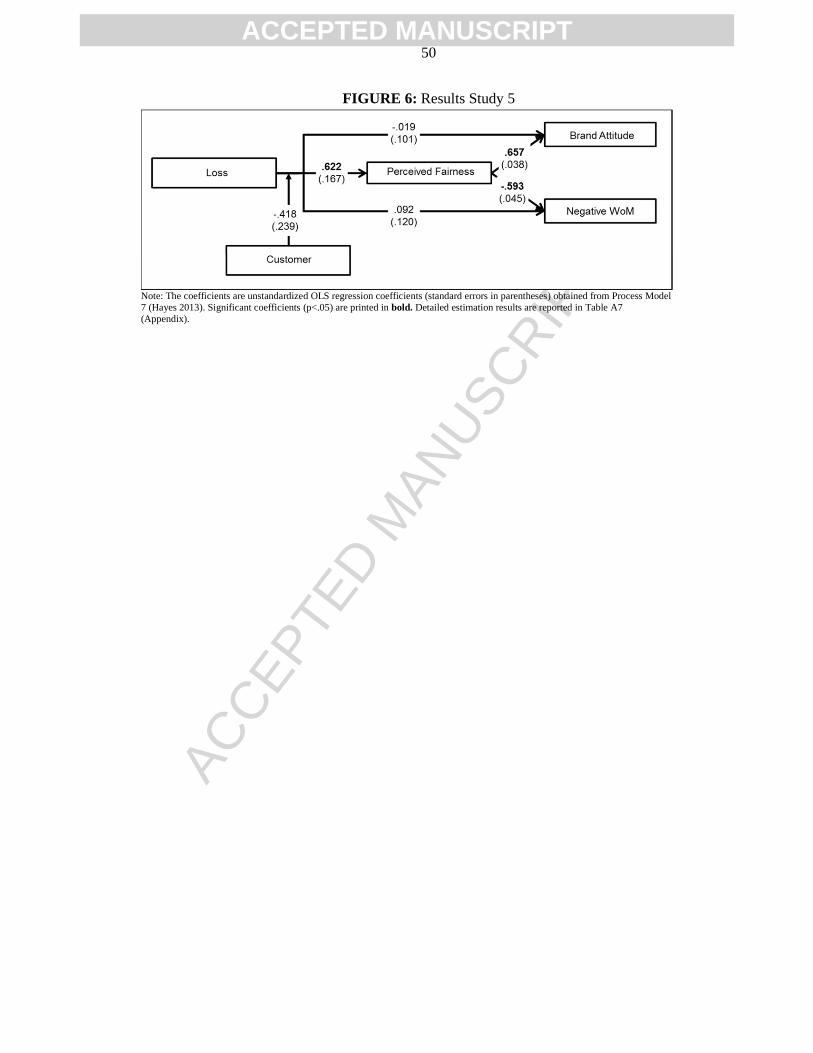
ACCEP
TED M
ANUSC
RIPT
50
FIGURE 6: Results Study 5
Note: The coefficients are unstandardized OLS regression coefficients (standard errors in parentheses) obtained from Process Model 7 (Hayes 2013). Significant coefficients (p<.05) are printed in bold. Detailed estimation results are reported in Table A7 (Appendix).
ACCEPTED MANUSCRIPT