accepted manuscript can electrocoagulation process be an … manuscript can... · the influenced...
TRANSCRIPT

1
Can electrocoagulation process be an appropriate technology for phosphorus removal from municipal wastewater?
D. Duc Nguyena, b, H. Hao Ngoc, W. Guoc, T. Thanh Nguyenc, Soon W. Changa, A. Jangd, Yong S. Yoone
a Department of Environmental Energy & Engineering, Kyonggi University, 442-760, Republic of Korea b Ho Chi Minh City University of Natural Resources and Environment, Viet Nam c Centre for Technology in Water and Wastewater, School of Civil and Environmental Engineering, University of Technology, Sydney (UTS), Australia d Department of Water Resource, Graduate School of Water Resources, Sungkyunkwan University (SKKU), 16419, Republic of Korea e Department of Chemical Engineering, Dankook University, 448-701, Republic of Korea
Highlights
New configuration of electrocoagulation (EC) was developed for better TP removal. The influenced factors on phosphorus removal in the EC process were investigated. EC with higher voltage, initial conductivity and longer electrolysis time is efficient. Specific rates of energy and iron consumptions during the EC process were measured. Passivation layer formed on the surface of electrodes during operation were
overcome.
Abstract
This paper evaluated a novel pilot scale electrocoagulation (EC) system for improving total phosphorus (TP) removal from municipal wastewater. This EC system was operated in continuous and batch operating mode under differing conditions (e.g. flow rate, initial concentration, electrolysis time, conductivity, voltage) to evaluate correlative phosphorus and electrical energy consumption. The results demonstrated that the EC system could effectively remove phosphorus to meet current stringent discharge standards of less than 0.2 mg/L within 2 to 5 min. This target was achieved in all ranges of initial TP concentrations studied. It was also found that an increase in conductivity of solution, voltages, or electrolysis time, correlated with improved TP removal efficiency and reduced specific energy consumption. Based on these results, some key economic considerations, such as operating costs, cost-effectiveness, product manufacturing feasibility, facility design and retrofitting, and program implementation are also discussed. This EC process can conclusively be highly efficient in a relatively simple, easily managed, and cost-effective for wastewater treatment system.
2
Keywords
Phosphorus removal; Electrocoagulation; Iron electrode; Energy consumption; Iron consumption
1. Introduction
Phosphorus and nitrogen pollution now pose a serious problem in wastewater being generated today all over the globe and has become a serious issue. Both pollutants have proven to be difficult and expensive to mitigate in the waste stream. Consider phosphorus removal for example: to eliminate phosphorus in municipal wastewater using conventional biological treatment systems is difficult due to inherent limitations of the activated sludge method of mitigation, which is inherently less effective. This treatment method still allows in a residual phosphorus concentration in the effluent which exceeds the wastewater discharge guideline. In a typical biological treatment plant, phosphorus is passed through to the sludge phase, and then removed depending on the amount of excess sludge. Thus, its removal is limited and variable, resulting in low removal efficiency even less than 30% (Hosni et al., 2007 and Sommariva et al., 1997). In this circumstance, addition of chemicals to the process can reduce phosphate levels somewhat, the lack of an efficient process means that any remaining phosphate must be removed via other techniques (Bektaş et al., 2004 and Zeng, 2012) or via recombinant chemical dosing. The latter is time consuming, labor intensive, and expensive.
Sources of phosphorus emissions into the environment are mostly effluents from non-point agricultural runoff, and point sources from industrial plants, and municipal wastewater treatment, etc. (Krishnan Rajeshwar, 1997). Wastewaters containing phosphorus are discharged into receiving waters in excess of the threshold-accepting environmental optimums, which contributes to the acceleration of the eutrophication process in a rapid and unnatural way, overwhelming the natural processes that would otherwise normalize the contaminant load. Normally, phosphorus exists in three main forms in wastewater, namely orthophosphate, polyphosphate, and organic phosphorus. However, the primary phosphorus compounds in wastewaters are generally orthophosphates (Tran et al., 2012), except in the special case of wastewater.
So far, most large scale biological wastewater treatment systems can meet applicable water quality discharge standards for TN and TP of less than 20 mg TN/L and 2 mgTP/L, respectively. However, only recently have governments realized the catastrophic environmental implications (e.g. eutrophication, red tide) of treated wastewater containing residual phosphorus concentrations above the recommended limits (Bui and Yoon, 2011). Therefore, governments have urged wastewater treatment plant operators to improve existing treatment systems and encouraged technological innovation to achieve better removal efficiencies, so that the new wastewater discharge standards can be met. Many countries have already implemented new standards for discharge, for instance, 0.5–1.0 mg/L in the USA, 1–2 mg/L in France (Attour et al., 2014) and less than 0.2 mg/L in South Korea. Even though conventional biological treatment processes are economical, they have long hydraulic retention time and large volume requirements which reduce efficiency. In addition, exponentially greater land and facility requirements sometimes make these technologies less attractive than physicochemical treatments, which can provide for shorter retention time,

3
greater efficiency, easy installation, and simpler operation and maintenance (Tran et al., 2012, Asselin et al., 2008, Nguyen et al., 2013 and Gatsios et al., 2015). Therefore, there is a need for innovation and applied advanced technology to improve efficiency in phosphorus removal, which requires less space, less capital investment, easier installation, simple equipment, lower operating and maintenance costs, and elimination of additional frequent chemical use (Bektaş et al., 2004, Markus et al., 2011, Wahab et al., 2011 and Oleszkiewicz and Barnard, 2006).
Electrocoagulation (EC) is an electrochemical technology that treats drinking water and wastewater which offers many advantages over traditional physicochemical treatments, such as higher efficiency, short retention time, elimination of need to neutralize excess chemicals, reduction of sludge production, and prevention of secondary pollution caused by added chemicals or unintended chemical reactions. Electrodes and equipment also require less space and are simple to operate (Asselin et al., 2008, Linares-Hernández et al., 2009, Hernández-Ortega et al., 2010 and Nguyen et al., 2014).
EC uses an electrochemical cell with a Direct Current (DC) voltage applied, usually to iron or aluminum electrodes, with water or wastewater as the electrolyte. During EC treatment of wastewaters, several electrochemical, physicochemical and chemical processes take place in the electrolysis device. This process produces the metal ions generation that takes place at the anode, and then creates both iron hydroxides and poly-hydroxides that have significant sorption ability. Meanwhile, hydrogen gas is continuously generated from the cathode, and with the added help of scouring and floating, the pollutants and flocculated particles are formed on the electrodes' surface. Then they flow out of the EC device (Krishnan Rajeshwar, 1997 and Tran et al., 2012).
For a long time, electrochemical technologies in water and wastewater treatment were not widely implemented due to a lack of capital and expensive operating costs. Nowadays, electrocoagulation technologies have advanced to such a stage that they are not only comparable with other technologies in terms of cost, they are also more efficient and more compact (Bennett et al., 2007, Chen, 2004, Wang et al., 2004 and Sadeddin et al., 2011).
When iron is used as electrode material, the dominant reactions involved can be summarized as follows (Linares-Hernández et al., 2009, Bensadok et al., 2011, Christos Comninellis, 2010, Bernal-Martínez et al., 2013, Linares-Hernández et al., 2010 and H.A. Moreno et al., 2009):
At the cathode:
2H2O(l) + 2e− → H2(g) + 2OH−(eq) (1)
At the anode:
Fe(s) → Fe2 +(eq) + 2e− (2)
Fe(s) → Fe3 +(eq) + 3e−. (3)
In the bulk solution, multi-core coordination compounds and Fe3(PO4)2, Fe(OH)2, Fe(OH)3 precipitates can be formed, with a simplified reactions as follows:
Fe2 +(eq) + 2H2O(l) → Fe(OH)2(s) + 2H+
(eq) (4)
4Fe2 +(eq) + 10H2O(l) + O2(g) → 4Fe(OH)3(s) + 8H+
(eq) (5)
4
3Fe2 +(eq) + 2PO4 (eq)
3 − → Fe3(PO4)2(s) (6)
Fe3 +(eq) + PO4 (eq)
3 − → FePO4(s). (7)
The EC technology used in this study is regarded as a new, urgently needed solution that overcomes the disadvantages of existing EC technologies, for instance, the new EC process can self-cleaning electrode surfaces, enhanced interactivity and reactivity between coagulants (complexes, iron hydroxides, etc.) and contaminants (soluble, colloidal, suspended solid, etc.) in the wastewater, uniform corrosion over the surface of electrodes, short electrolysis times, and lower operating costs.
The main aim of this research is to investigate the performance of the EC process using iron cylindrical electrodes in continuous and batch operating mode for removing phosphorus in municipal wastewater under various experimental conditions. The system was optimized in terms of TP initial concentrations, different voltages, conductivities and electrolysis time, reaction rate constant for TP removal, and sludge production. In addition, the effect of some operating variables such as pH and NaCl concentrations added to wastewater on phosphorus removal of EC process were also evaluated.
2. Materials and methods
2.1. Characterization of wastewater
The real wastewater (RWW) was collected from the effluent of municipal wastewater treatment plant in Y City, South Korea, with characteristics of pH, SS, CODMn, TN, TP, conductivity, and alkalinity were 6.76–7.06, 20 mg SS/L, 2.27–9.3 mg CODMn/L, 6.11–13.3 mg TN/L, 1.73–3.2 mg TP/L, 427–496 μS/cm, and 43–127 mg CaCO3/L, respectively.
2.2. Experimental set-up
During the experiment, the temperature and pH did not alter much, remaining at the ambient wastewater temperatures and in neutral pH ranges. Wastewater treated by the EC device was sampled at different times and the initial characteristics varied over time. The electrodes were directly connected to an adjustable DC power supply, providing a direct current (0–15 A) and voltage (0–30 V) allowed for the desired value in each experiment to be set in advance.
Innovation is evident in this electrolysis device in which it employs a pair of iron electrodes. Their concentric cylindrical shapes increase the shear stress of the upward flow rate needed to more efficiently clean up the pollutants, or flocculated particles. In addition, soluble hydroxides are formed on the electrodes' surface.
EC treatments were experimentally carried out in batch mode and continuous mode for treating RWW. This allowed field and laboratory data to be generated for comparative analysis, based on both known and unknown variables.
2.2.1. Batch mode experimental
A system in batch operating mode (BOM) is shown in Fig. 1a. The respective internal dimensions and material of batch EC reactor were 15.5 cm length × 12 cm width × 19 cm height, with an effective volume of 3 L, and was made from polyacrylate. A pair of iron electrodes was placed in concentric cylinders together and immersed into the reactor, with the inside iron electrode dimensions were 5.7 cm inside diameter (ID) × 13 cm height (H), with

5
an effective area of 233 cm²; outside iron electrode dimensions were 11.05 cm outside diameter (OD) × 13 cm high (H), with an effective area of 451 cm². The gap between the electrodes was 2.675 cm. The mixture was mixed at a speed of 150 rpm by lab stirrer in order to increase contact with the net mass in the electrolyte.
Fig. 1. Schematic diagram of the EC system for BOMs (a) and COMs (b)
2.2.2. Continuous mode experimental
Fig. 1b shows a system in continuous operating mode (COM). Wastewater was contained in a 200 L polypropylene tank, and was pumped continuously at various flow rates into the cylindrical distribution box at the bottom of EC device by a peristaltic pump, then upflowed to an annular region between two coaxial cylinder electrodes. The EC device in COM consists of a pair of cylindrically shaped iron electrodes each comprising a pair of two, nested concentric cylinders with inside electrode dimensions were 5.7 cm ID × 94.5 cm H, and the effective area of 0.17 m². The outside electrode dimensions were 11.05 cm OD × 100 cm H and the effective surface area was 0.33 m², but the total geometric area of 0.35 m². The gap between the electrodes was 2.675 cm.
2.3. Analytical methods
All wastewater samples always followed proper laboratory protocols for sampling, preservation, and storage of specimens. Samples were filtered with 0.45 μm glass microfiber filters before analysis. The water quality parameters and voltage were analyzed according to standard methods as described in detail by Nguyen et al. (2013).
3. Results and discussion
3.1. Variation of wastewater pH versus electrolysis time
Wastewater pH is a key factor that can have a pronounced impact on EC processes, especially the coagulation and flocculation processes. It also has significant negative effects on aquatic life of effluent receiving water resources.
Variations in pH found over electrolysis time for different sodium chloride (NaCl) concentrations, initial TP concentrations, and applied voltages, are presented in Figs. 2a–4a,
6
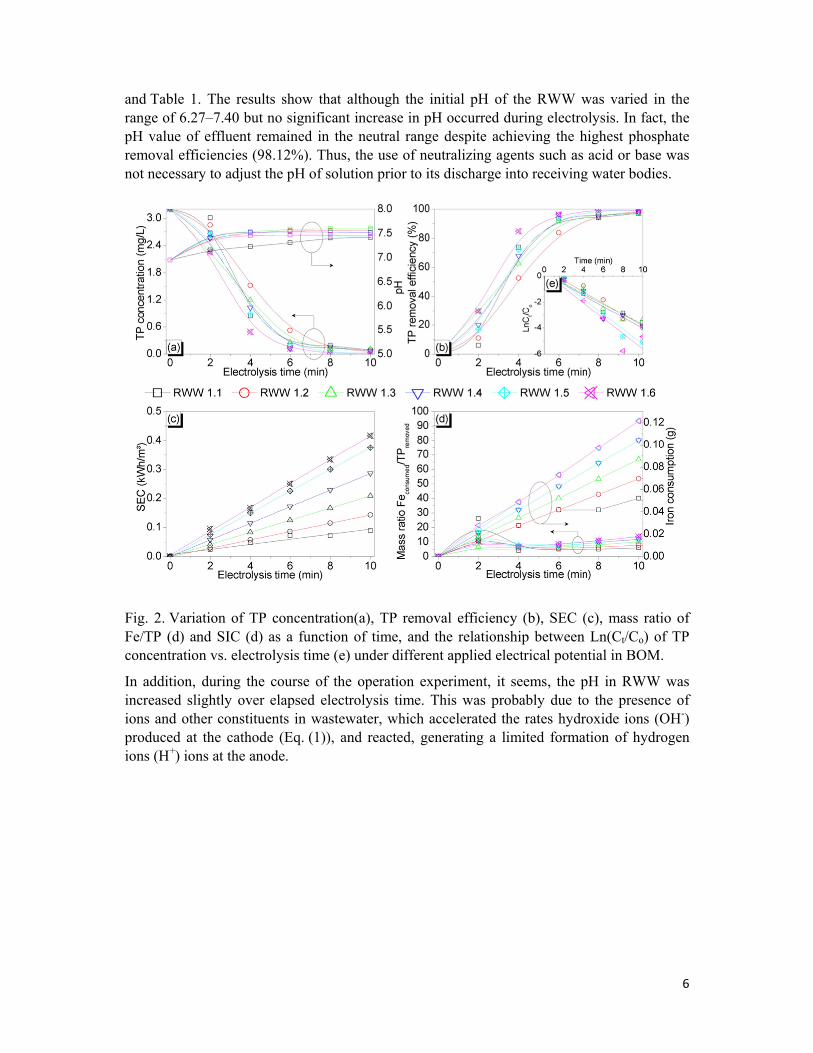
and Table 1. The results show that although the initial pH of the RWW was varied in the range of 6.27–7.40 but no significant increase in pH occurred during electrolysis. In fact, the pH value of effluent remained in the neutral range despite achieving the highest phosphate removal efficiencies (98.12%). Thus, the use of neutralizing agents such as acid or base was not necessary to adjust the pH of solution prior to its discharge into receiving water bodies.
Fig. 2. Variation of TP concentration(a), TP removal efficiency (b), SEC (c), mass ratio of Fe/TP (d) and SIC (d) as a function of time, and the relationship between Ln(Ct/Co) of TP concentration vs. electrolysis time (e) under different applied electrical potential in BOM.
In addition, during the course of the operation experiment, it seems, the pH in RWW was increased slightly over elapsed electrolysis time. This was probably due to the presence of ions and other constituents in wastewater, which accelerated the rates hydroxide ions (OH-) produced at the cathode (Eq. (1)), and reacted, generating a limited formation of hydrogen ions (H+) ions at the anode.

7
Table 1. Operational conditions and key experimental parameters of the EC process
Experiment no.
NaCl conc.
(wt.%)
Volt. (V)
Conductivity (μS/cm)
Current (A)
Current density (A/m²)
pH
Avg. Avg. Avg. ± Stdev Avg. ± Stdev
Avg. ± Stdev Avg. ± Stdev
Operating in batch mode using a RWW with different voltages
Serial 1
RWW1.1 Without adding
5 465.33±15.77 0.36±0.05 10.53±1.6 7.25±0.18
RWW1.2 6 465±15.91 0.4±0.00 11.69±0.0 7.43±0.24
RWW1.3 7 465.67±15.58 0.5±0.00 14.62±0.0 7.46±0.25
RWW1.4 8 466.17±15.38 0.6±0.00 17.54±0.0 7.43±0.23
RWW1.5 9 466.83±14.93 0.7±0.00 20.47±0.0 7.38±0.21
RWW1.6 10 465.5±15.49 0.72±0.04 21.05±1.31 7.37±0.21
Operating in batch mode with different NaCl concentrations added to RWW
Serial 2
RWW2.1 0.01 10 653.43±3.95 0.83±0.05 24.36 ± 1.51 7.35±0.06
RWW2.2 0.02 882.83±3.19 1.1±0.0 32.16±0.0 7.34±0.05
RWW2.3 0.03 1081.33±3.39 1.33±0.05 38.98±1.51 7.32±0.04
RWW2.4 0.04 1297.5±3.99 1.53±0.05 44.83±1.51 7.27±0.03
RWW2.5 0.05 1482.5±4.72 1.73±0.05 50.68±1.51 7.28±0.03
Operating in continuous mode with different NaCl concentrations added to RWW
Serial 3
RWW3.1 0.00 10 484.13±5.33 2.62±0.04 10.54±0.16 7.28±0.4
RWW3.2 0.01 677.13±7.85 3.51±0.02 14.11±0.08 7.48±0.35
RWW3.3 0.02 884.38±12.41 4.44±0.05 17.84±0.19 7.65±0.46
RWW3.4 0.03 1104±7.37 5.08±0.07 20.43±0.28 7.59±0.39
RWW3.5 0.04 1290.63±65.13 6.06±0.06 24.36±0.24 7.80±0.40
RWW3.6 0.05 1487.25±8.19 6.73±0.06 27.06±0.23 7.88±0.58
Avg.: average; Stdev.: standard deviation; and Volt.: voltage.

8
3.2. Variation of the conductivity as a function of sodium chloride
The voltage, amperage, electrolysis time and the solution's electrical conductivity are important operating factors that have a significant impact upon the EC processes efficiency and operational costs (Christos Comninellis, 2010 and Hosny, 1996). These results demonstrated that sodium chloride (NaCl) concentration increases directly proportional to the increase of conductivity of solution NaCl and were almost compatible with first-order linear function. Interestingly, increasing NaCl concentration of a solution could increase phosphate removal efficiency during a shorter electrolysis time, but an increased conductivity of solution would increase the energy consumption, causing a subsequent increase of the operating costs. Another critical issue when using NaCl is its higher efficiency in increasing the conductivity of a solution and the relatively low environmental impact of a moderate level of table salt.
Equally important, that the EC process also generated chlorine, the reactions will occur on the surface of the anode to create chlorine products (Cl2, HOCl, OCl−) in the electrolyte solution (Bektaş et al., 2004 and Awad and Galwa, 2005), hydroxyl radicals ( OH) (Awad and Galwa, 2005 and Li et al., 2003), and peroxide (H2O2) (Drogui et al., 2001). Interestingly, these are agents that will contribute to wastewater disinfection, and then participate in the oxidation of organic compounds in wastewater. So, by adding NaCl to wastewater, conductivity is increased and this generates oxidizing agents as by-products (Şengil and özacar, 2006).
To study the effects of electrical conductivity on the TP treatment efficiency of the overall EC process performance, the initial conductivity of the wastewater must be adjusted by adding an appropriate amount of NaCl from 0.0 to 0.05% by weight. Then, by varying the electrical conductivity from 440 to 1500 μS/cm (the electrical conductivity of river water was generally < 1500 μS/cm), and the initial concentration of TP from 1.0 mg/L to 3.0 mg/L, the corresponding rates can be measured and compared.
Since it is desirable to shorten electrolysis time and increase current density, the concentration of table salt can be increased. This will increase the capacity of the wastewater treatment, thus reducing operating costs. It will, however, result in faster electrode corrosion. Consequently, the electrode replacement cycle will be shortened (Shin and Bae, 2007).
Therefore, accordingly (Hosny, 1996 and İrdemez et al., 2006) the variation of TP concentration during the electrolysis process over time can be modified by the following equation:
(8)
The integration of the above equation and abbreviated, we get:
(9)
where: is removal rate constant (1/min); t is electrolysis time (min); Co is initial concentration of TP (mg/L); Ct is concentration of TP at time t (mg/L); I is current (A); A is area of electrode (cm²); V is volume of cell (liter); r1 is radius of an inside electrode (cm); and r2 is radius of an outside electrode (cm).

9
Eq. (9) can be then applied to describing their move phosphate from wastewaters through the EC process, and k could be calculated from the slope value of the plot Ln (Ct/Co) vs. electrolysis time (t) in the inset figures.
Overall, each experiment and its effect on pH level, electrolysis time, solution conductivity, voltage and current density as measured during the phosphorus removal operation improved our understanding.
3.3. Phosphate removal in BOM and COM systems
3.3.1. Batch operating mode experiment
These experiments analyzed the effects of electrical voltage in the EC process on the efficiency of removing phosphorus. In order to determine the most favorable electrical potentials for the optimal operating costs and phosphorus removal, the EC process was implemented by changing the voltage levels from 5, 6, 7, 8, 9 and 10 V, respectively (Table 1).
Results obtained and shown in Fig. 2 indicated that increasing the initial applied electrical voltage of 5, 6, 7, 8, 9, and 10 V, while the initial conductivity of the solution was kept almost unchanged, resulted in removal efficiencies of phosphorus that were increasingly proportional to the electrical voltage and electrolysis time. For example, for 8 min electrolysis time the maximum TP removal efficiency percentages of 94.06%, 96.25%, 96.55%, 95.0%, 99.06% and 99.69% were achieved, and these corresponded to the applied electrical voltages of 5, 6, 7, 8, 9, and 10 V, respectively. Meanwhile the specific energy consumption (SEC) and specific iron consumption (SIC) increased significantly with an increase in electrolysis time and voltage.
The results also indicated that TP levels could be achieved at less than 0.2 mg/L by increasing electrolysis time or/and voltage. Thus, in this study, the most appropriate electrolysis time and voltage were 6 min and 10 V in terms of BOM, resulting in SEC and SIC of 0.25 kWh/m³ and 0.0729 g, respectively.
The relationship between Ln(Ct/Co) of TP concentration and electrolysis time in BOMs followed the first order linear equations similarly (Fig. 2e and Table S1). Based on the observed results, the increase in TP reduction rate was significant for operating at 9, and 10 V. While at 9 V and 10 V, the SEC (Fig. 2c) and SIC (Fig. 2d) increased sharply, and was well correlated with the electrolysis time under study conditions through the first order linear equation (Table S2).
Experiments were run in BOMs to determine the effects of different NaCl concentrations and electrolysis times on total TP removal efficiency, while the initial voltage value was kept at a constant 10 V (Fig. 7, Table 1). The resultant TP concentration is reported here, according to retention time and the initial amount of NaCl dissolved in the raw wastewater solution.
As results shown in Fig. 3(a, b), under the same experimental conditions (e.g. initial of TP, 10 V, pH), the more the initial feed is increased in NaCl the greater the rate of TP reduction. Similarly, the results shown in Fig. 3(c, d), indicate that when the initial amount of NaCl increases, the SEC and SIC are higher. It is therefore concluded that adding NaCl to the raw wastewater at 0.01%, 0.02%, 0.03%, 0.04% and 0.05% in terms of weigh, corresponds to
10
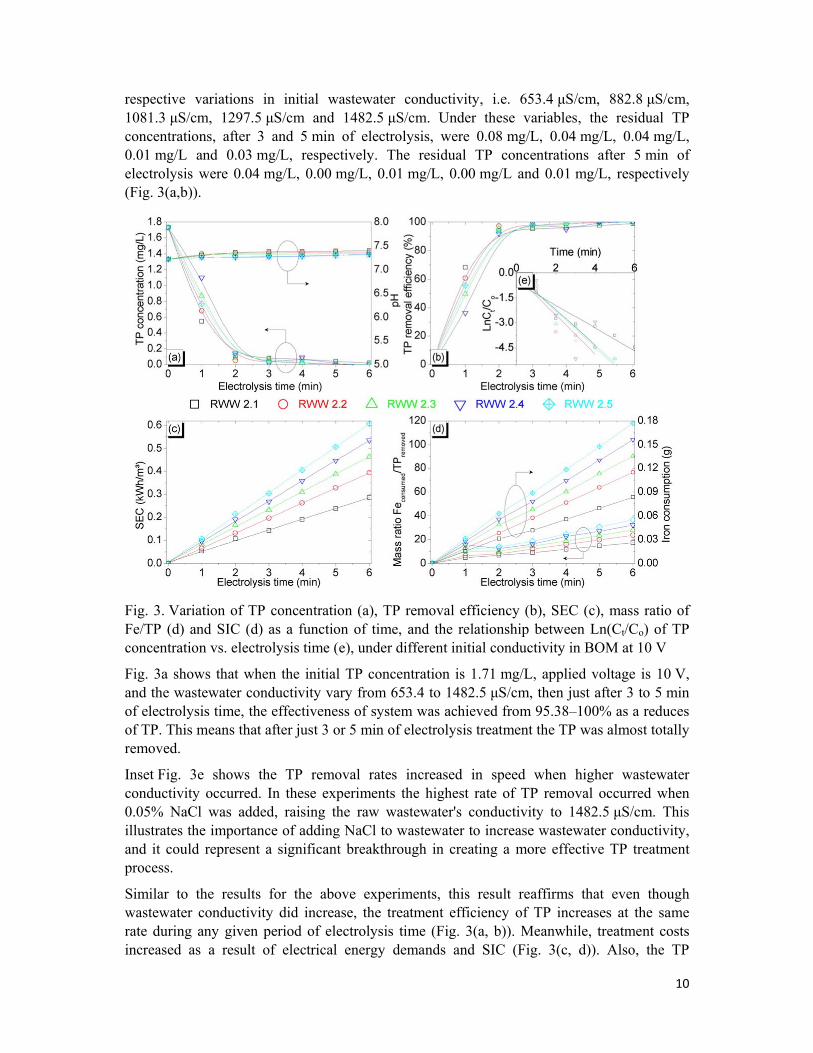
respective variations in initial wastewater conductivity, i.e. 653.4 μS/cm, 882.8 μS/cm, 1081.3 μS/cm, 1297.5 μS/cm and 1482.5 μS/cm. Under these variables, the residual TP concentrations, after 3 and 5 min of electrolysis, were 0.08 mg/L, 0.04 mg/L, 0.04 mg/L, 0.01 mg/L and 0.03 mg/L, respectively. The residual TP concentrations after 5 min of electrolysis were 0.04 mg/L, 0.00 mg/L, 0.01 mg/L, 0.00 mg/L and 0.01 mg/L, respectively (Fig. 3(a,b)).
Fig. 3. Variation of TP concentration (a), TP removal efficiency (b), SEC (c), mass ratio of Fe/TP (d) and SIC (d) as a function of time, and the relationship between Ln(Ct/Co) of TP concentration vs. electrolysis time (e), under different initial conductivity in BOM at 10 V
Fig. 3a shows that when the initial TP concentration is 1.71 mg/L, applied voltage is 10 V, and the wastewater conductivity vary from 653.4 to 1482.5 μS/cm, then just after 3 to 5 min of electrolysis time, the effectiveness of system was achieved from 95.38–100% as a reduces of TP. This means that after just 3 or 5 min of electrolysis treatment the TP was almost totally removed.
Inset Fig. 3e shows the TP removal rates increased in speed when higher wastewater conductivity occurred. In these experiments the highest rate of TP removal occurred when 0.05% NaCl was added, raising the raw wastewater's conductivity to 1482.5 μS/cm. This illustrates the importance of adding NaCl to wastewater to increase wastewater conductivity, and it could represent a significant breakthrough in creating a more effective TP treatment process.
Similar to the results for the above experiments, this result reaffirms that even though wastewater conductivity did increase, the treatment efficiency of TP increases at the same rate during any given period of electrolysis time (Fig. 3(a, b)). Meanwhile, treatment costs increased as a result of electrical energy demands and SIC (Fig. 3(c, d)). Also, the TP

11
removal rates of Ln(Ct/Co) and SEC correlated well with electrolysis time through the first order linear equation (Tables S3, S4).
3.3.2. Continuous operating mode experiment
Electrode fouling played an important role in compromising the performance of EC process over time. An effort was made to design this EC system to create vertical-flow, generating small, more frequent gas bubbles of hydrogen and oxygen gases formed by the ionic electrolysis of H₂O (Eq 1). These were meant to provide greater shear stress over the electrode's surface in order to remove and lift up foulants, and to restrict their interaction with the electrodes. The magnitude of shear stress prevents the particles from becoming like the layers of a cake over the electrode's surface.
Trials were conducted to determine the minimum electrolysis time needed, and the quantity of NaCl that must be added to the wastewater in order to achieve the best TP removal efficiency in the shortest retention time. These trials were carried out by conducting EC experiments at various flow rates (Table 2), with experimental conditions set at an initial TP concentration of 2.66 mg/L and applied voltage of 10 V (Table 1).
Table 2. Continuous operating conditions of flow rate parameters
Parameters Units Values Flow rate L/min 0 8.5 8 7 6 5 4 3 2 Electrolysis time min 0.00 0.78 0.83 0.95 1.11 1.33 1.66 2.22 3.33
The results are presented in Fig. 4(a, b), which show the trend in TP concentration and TP removal efficiency as a function of operating time. Fig. 4e illustrates the TP removal rate as Ln(Ct/Co) with electrolysis time and linear regression fit (Table S5).
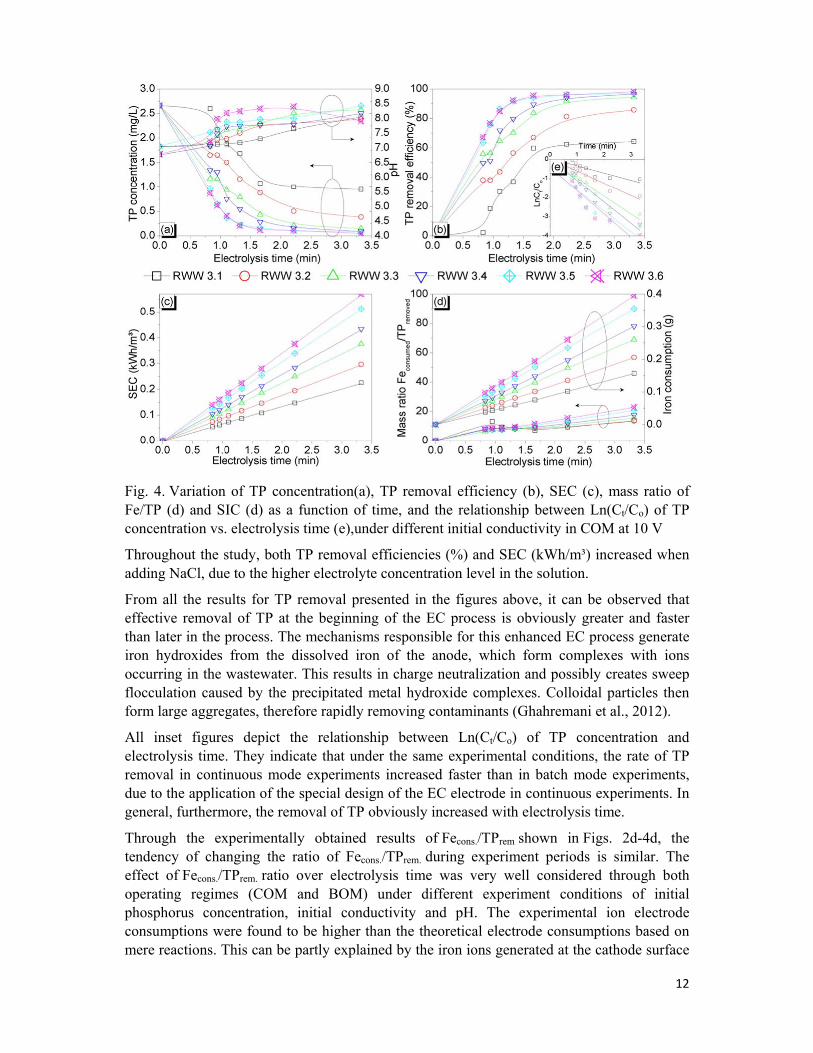
In six experiments were conducted with an initial wastewater conductivity of 484.13 μS/cm; then 677.13 μS/cm, 884.38 μS/cm, 1104.0 μS/cm, 1290.63 μS/cm and 1487.25 μS/cm, respectively. The higher the initial conductivity, the more rapid was TP removal (Fig. 4b). For example, the corresponding TP removal efficiencies were 59.77% (1.07 mg/L), 66.92% (0.88 mg/L), 83.83% (0.43 mg/L), 89.47% (0.28 mg/L), 93.98% (0.16 mg/L) and 95.49% (0.12 mg/L), respectively, with just 1.66 min of electrolysis time. These results also indicated that TP levels of less than 0.1 mg/L could be achieved during 2.2 min of retention time by adjusting the solution's initial conductivity. Here, the most appropriate conductivity of solution should be adjusted to within the range 1290.6–1487.25 μS/cm, in terms of TP removal (Fig. 4(a, b)).
It was also found that the higher the initial conductivity, the more SEC and SIC occurred (Fig. 4(c, d), Table 10S). Similarly, it can be concluded that the rate of TP reduction increased with more electrolysis time (Fig. 4a), or by decreasing the flow rate of the influent, while increasing the SEC and SIC. Based on the results obtained, 64.29–98.12% TP reduction could be achieved.
12
Fig. 4. Variation of TP concentration(a), TP removal efficiency (b), SEC (c), mass ratio of Fe/TP (d) and SIC (d) as a function of time, and the relationship between Ln(Ct/Co) of TP concentration vs. electrolysis time (e),under different initial conductivity in COM at 10 V
Throughout the study, both TP removal efficiencies (%) and SEC (kWh/m³) increased when adding NaCl, due to the higher electrolyte concentration level in the solution.
From all the results for TP removal presented in the figures above, it can be observed that effective removal of TP at the beginning of the EC process is obviously greater and faster than later in the process. The mechanisms responsible for this enhanced EC process generate iron hydroxides from the dissolved iron of the anode, which form complexes with ions occurring in the wastewater. This results in charge neutralization and possibly creates sweep flocculation caused by the precipitated metal hydroxide complexes. Colloidal particles then form large aggregates, therefore rapidly removing contaminants (Ghahremani et al., 2012).
All inset figures depict the relationship between Ln(Ct/Co) of TP concentration and electrolysis time. They indicate that under the same experimental conditions, the rate of TP removal in continuous mode experiments increased faster than in batch mode experiments, due to the application of the special design of the EC electrode in continuous experiments. In general, furthermore, the removal of TP obviously increased with electrolysis time.
Through the experimentally obtained results of Fecons./TPrem shown in Figs. 2d-4d, the tendency of changing the ratio of Fecons./TPrem. during experiment periods is similar. The effect of Fecons./TPrem. ratio over electrolysis time was very well considered through both operating regimes (COM and BOM) under different experiment conditions of initial phosphorus concentration, initial conductivity and pH. The experimental ion electrode consumptions were found to be higher than the theoretical electrode consumptions based on mere reactions. This can be partly explained by the iron ions generated at the cathode surface
13
having been involved in both processes in aqueous solution: 1) reacted directly with orthophosphate, and 2) formed bridging complexes and/or flocs, then adsorbed phosphate and other substances onto their floc particles, under which the phosphate was removed.
The results also indicate that TP reduction of less than 0.2 mg/L can be achieved, with a mass ratio of Fecons./TPrem. Indeed, Fecons./TPrem. mass ratio increases with increasing phosphate removal. However, selecting appropriate ratios of Fecons./TPrem. plays an important role in not only optimal use of the iron electrode, but also to avoid secondary contamination by excess iron ions created. Thus, in this study, the most appropriate mass ratios of Fecons./TPrem.for moderate to low strength wastewater should be in a ranged 4.9 to 11.5 (equal to molar ratio 2.72 to 6.38). Consequently, it is noted that in case of excess iron ions in aqueous solution, there will be a visual indication signaled by the brownish color of ferrous ions, or the dark green color of ferric ions. An additional qualitative water quality indicator is a slightly fishy smell such conditions induces.
A short retention time, highly efficient TP removal, low SEC, and simple operation are the necessary conditions that current technology must have in order to: firstly, deliver technological and economic benefits; and secondly, meet new national effluent discharge regulations. The economic and engineering feasibility of this method of EC application for low to moderate contamination of TP in wastewaters can be achieved and enhance retention. It is a flexible process and easy to achieve, yet meets high environmental standards in every way.
For this study, a strong linear relationship was observed between the SEC and electrolysis time (Tables S2, S4, S6 and Figs. 2c-4c), indicating that the first-order linear function was most appropriate for describing the SEC over the time of the EC process. Thus, it corresponds to the type of model (COM or BOM), which can correctly predict power consumption as a function of the electrolysis time.
4. Conclusions
A range of different EC processing options and variables were thoroughly investigated to assess the performance and maintenance requirements of various experimental scenarios. The main findings are as follows:
This is a revolutionary technology that has been overlooked in the past due to technical limitations. High conductivity ensures that the process performs very efficiently, and reduces overall cost and shortens retention time.
It can be designed in the form of compact modules, capable of treating large quantities of wastewater. It can also be designed for the individual needs of a particular application or specific wastewater treatment system design, or mass produced as retrofit kits based on volumes and flow rates.
The relationship between Ln(Ct/Co) of TP concentration, SEC, and SIC with electrolysis time in BOM and COM is similar and results indicate a strong linear relationship.
Using the same experimental conditions, results showed that the TP removal rate in COMs is faster than in BOMs, and this rate will increase faster when either or both conductivities or applied voltages or electrolysis time are increased.

14
Interestingly, iron pipe or similar scrap iron can potentially be reused, especially in hard-pressed emerging countries, thereby minimizing the replacement cost of electrodes by iron waste. During operation, both TP removal efficiencies and SEC was found to increase with higher applied potential voltages, and the addition of a conductor in varying quantities. However, in practice, the optimum operating regime needs to be a harmonious combination between these factors, for the greatest efficiency and cost savings.
Acknowledgments
This work was supported in part by grants from Korea Ministry of Environment as “Global Top Project’ (project No. GT-11-82-008-1).
Reference
Asselin, M., Drogui, P., Benmoussa, H., Blais, J.-F., 2008. Effectiveness of electrocoagulation process in removing organic compounds from slaughterhouse wastewater using monopolar and bipolar electrolytic cells. Chemosphere 72, 1727–1733.
Attour, A., Touati, M., Tlili, M., Ben Amor, M., Lapicque, F., Leclerc, J.P., 2014. Influence of operating parameters on phosphate removal from water by electrocoagulation using aluminum electrodes. Sep. Purif. Technol.
Awad, H.S., Galwa, N.A., 2005. Electrochemical degradation of acid blue and basic brown dyes on Pb/PbO2 electrode in the presence of different conductive electrolyte and effect of various operating factors. Chemosphere 61, 1327–1335.
Bektaş, N., Akbulut, H., Inan, H., Dimoglo, A., 2004. Removal of phosphate from aqueous solutions by electro-coagulation. J. Hazard. Mater. 106, 101–105.
Bennett, G.F., Wang, L.K., Hung, Y.T., Shammas, N.K., 2007. Advanced physicochemical treatment technologies, handbook of environmental engineering. J. Hazard. Mater. 148, 778–779.
Bensadok, K., El Hanafi, N., Lapicque, F., 2011. Electrochemical treatment of dairy effluent using combined Al and Ti/Pt electrodes system. Desalination 280, 244–251.
Bernal-Martínez, L.A., Barrera-Díaz, C., Natividad, R., Rodrigo,M.A., 2013. Effect of the continuous and pulse in situ iron addition onto the performance of an integrated electrochemical–ozone reactor for wastewater treatment. Fuel 110, 133–140.
Bui, H.H., Yoon, Y.S., 2011. Removal characteristics of T-P within sewage by electrolysis using cylindrical Fe electrode. Kor. Soc. Waste Res. Recycl. 28, 32–42.
Chen, G., 2004. Electrochemical technologies inwastewater treatment. Sep. Purif. Technol. 38, 11–41.
Christos Comninellis, G.C., 2010. Electrochemistry for the Environment. Springer New York Dordrecht Heidelberg London.
Drogui, P., Elmaleh, S., Rumeau, M., Bernard, C., Rambaud, A., 2001. Oxidising and disinfecting by hydrogen peroxide produced in a two-electrode cell. Water Res. 35, 3235–3241.
Gatsios, E., Hahladakis, J.N., Gidarakos, E., 2015. Optimization of electrocoagulation (EC) process for the purification of a real industrial wastewater from toxic metals. J. Environ. Manage. 154, 117–127.
15
Ghahremani, H., Bagheri, S., Hassani, S.M., Khoshchehreh, M.R., 2012. Treatment of dairy industry wastewater using an electrocoagulation process. Adv. Environ. Biology 6, 897–1901.
H.A. Moreno, C., Cocke, D.L., Gomes, J.A.G., Morkovsky, P., Parga, J.R., Peterson, E., Garcia, C., 2009. Electrochemical reactions for electrocoagulation using iron electrodes. ind. eng. chem. res. 48, 2275–2282.
Hernández-Ortega,M., Ponziak, T., Barrera-Díaz, C., Rodrigo,M.A., Roa-Morales, G., Bilyeu, B., 2010. Use of a combined electrocoagulation–ozone process as a pre-treatment for industrial wastewater. Desalination 250, 144–149.
Hosni, K., BenMoussa, S., Ben Amor, M., 2007. Conditions influencing the removal of phosphate from synthetic wastewater: influence of the ionic composition. Desalination 206, 279–285.
Hosny, A.Y., 1996. Separating oil from oil–water emulsions by electroflotation technique. Sep. Technol. 6, 9–17.
İrdemez, Ş., Yildiz, Y.Ş., Tosunoğlu, V., 2006. Optimization of phosphate removal from wastewater by electrocoagulation with aluminum plate electrodes. Sep. Purif. Technol. 52, 394–401.
Krishnan Rajeshwar, J.G.I., 1997. Environmental Electrochemistry: Fundamentals and Applications in Pollution Abatement. Elsevier Science & Technology Books.
Li, Y., Wang, F., Zhou, G., Ni, Y., 2003. Aniline degradation by electrocatalytic oxidation. Chemosphere 53, 1229–1234.
Linares-Hernández, I., Barrera-Díaz, C., Roa-Morales, G., Bilyeu, B., Ureña-Núñez, F., 2009. Influence of the anodic material on electrocoagulation performance. Chem. Eng. J. 148, 97–105.
Linares-Hernández, I., Barrera-Díaz, C., Bilyeu, B., Juárez-GarcíaRojas, P., Campos-Medina, E., 2010. A combined electrocoagulation–electrooxidation treatment for industrial
wastewater. J. Hazard. Mater. 175, 688–694. Markus, J.A., Santroch, J.A., Tumuluri, S., Xi, Y., Arifin, A., Portman, D., 2011. Technical
and Economic Evaluation of Nitrogen and Phosphorus Removal at Municipal Wastewater Treatment Facilities. Engineer ing & Ar chitecture Services, Tetra Tech, Inc.
Nguyen, D.-D., Kim, S.-D., Yoon, Y.-S., 2013. Enhanced phosphorus and COD removals for retrofit of existing sewage treatment by electrocoagulation process with cylindrical aluminum
electrodes. Desalin. Water Treat. 1–12. Nguyen, D.D., Ngo, H.H., Yoon, Y.S., 2014. A new hybrid treatment system of bioreactors
and electrocoagulation for superior removal of organic and nutrient pollutants from municipal wastewater. Bioresour. Technol. 153, 116–125.
Oleszkiewicz, J.A., Barnard, J.L., 2006. Nutrient removal technology in North America and the European Union: a review. Water Qual. Res. J. Can. 41, 449–462.
Sadeddin, K., Naser, A., Firas, A., 2011. Removal of turbidity and suspended solids by electrocoagulation to improve feed water quality of reverse osmosis plant. Desalination 268, 204–207.
Şengil, İ.A., özacar, M., 2006. Treatment of dairy wastewaters by electrocoagulation using mild steel electrodes. J. Hazard. Mater. 137, 1197–1205.
Shin, C.H., Bae, J.-S., 2007. Operational performance of an electrolytic reactor in configurating a greywater treatment system for sewage/wastewater reuse. Ind. Eng. Chem. 13, 1091–1097.
Sommariva, C., Converti, A., Del Borghi, M., 1997. Increase in phosphate removal from wastewater by alternating aerobic and anaerobic conditions. Desalination 108, 255–260.

16
Tran, N., Drogui, P., Blais, J.-F., Mercier, G., 2012. Phosphorus removal from spiked municipal wastewater using either electrochemical coagulation or chemical coagulation as tertiary treatment. Sep. Purif. Technol. 95, 16–25.
Wahab, M.A., Hassine, R.B., Jellali, S., 2011. Removal of phosphorus fromaqueous solution by Posidonia oceanica fibers using continuous stirring tank reactor. J. Hazard. Mater. 189, 577–585.
Wang, L.K., Hung, Y.T., Shammas, N.K., 2004. Physicochemical Treatment Processes: Volume 3 Handbook of Environmental Engineering. Humana Press Inc.
Zeng, Z., 2012. Phosphorus removal by ceramic tight ultra-filtration (CTUF) membranes for RO pre-treatment. TU Delft. Delft University of Technology