acceptability of fortified rice by participants of...
TRANSCRIPT

T : 88-02-9881265, 8824180-87F : 88-02-8823542, 8823614W : www.brac.net
BRAC Research and Evaluation DivisionBRAC Centre, 75 MohakhaliDhaka 1212, Bangladesh
Acceptability of Fortified Rice by Participants of Government Social Safety Net Programmes

Acceptability of Fortified Rice by
Participants of Government Social Safety
Net Programmes
Barnali Chakraborty Senior Research Fellow, RED, BRAC
Fahmida Akter Staff Researcher, RED, BRAC
June 2014
Research and Evaluation Division (RED), BRAC, 75 Mohakhali, Dhaka 1212, Bangladesh
Telephone: (88-02) 9881265-72, 8824180-7 (PABX) Fax: (88-02) 8823542
E-mail: [email protected], Website: www.brac.net/research

Copyright © 2014 BRAC
June 2014
Editing:
Iftekhar A. Chaudhury
Printing and publication
Altamas Pasha
Cover design
Md. Abdur Razzaque
Design and layout
Md. Akram Hossain
Published by:
Research and Evaluation Division
BRAC
BRAC Centre
75 Mohakhali
Dhaka 1212, Bangladesh
Telephone: (88-02) 9881265-72, 8824180-7 (PABX)
Fax: (88-02) 8823542
Website: www.brac.net/research
BRAC/RED publishes research reports, scientific papers, monographs, working
papers, research compendium in Bangla (Nirjash), proceedings, manuals, and other
publications on subjects relating to poverty, social development and human rights,
health and nutrition, education, gender, environment, and governance.
Printed by Zaman Printing and Packaging, 41-42, Islampur Road (Adel Complex) Dhaka 1100.

iii
Acronyms
BBS Bangladesh Bureau of Statistics
BDT Bangladeshi Taka
CI Confidence Interval
GoB Government of Bangladesh
HH Household
HIES Household Income and Expenditure Survey
MDMR Ministry of Disaster Management and Relief
MWCA Ministry of Women and Children Affairs
NGO Non-Governmental Organization
OR Odds Ratio
RED Research and Evaluation Division
SPSS Statistical Package for Social Science
SSC Secondary School Certificate
UP Union Parishad
VGD Vulnerable Group Development
VGF Vulnerable Group Feeding
WFP World Food Programme
WHO World Health Organization
iv
Table of contents
Acronyms iii
Acknowledgments vii
Executive Summary ix
Chapter 1: Background information
1.1 Introduction 1
1.2 Introducing fortified rice to Bangladesh 2
Chapter 2: Objectives and methodology
2.1 Objectives 3
2.2 Methodology 3
2.2.1 Study design and population 3
2.2.2 Sample size and selection 4
2.2.3 Data collection 5
2.2.4 Data analysis 5
2.2.5 Quality control 6
Chapter 3: Results
3.1 Household characteristics 7
3.2 Knowledge, frequency and amount of pushti chal received 9
3.3 Usage, cooking method and consumption pattern of pushti chal 10
3.4 Taste and other traits of pushti chal 13
3.5 Acceptance and willingness to buy 15
Chapter 4: Discussion, conclusions and recommendations
4.1 Discussion 20
4.2 Conclusions 23
4.3 Recommendations 24
References 25
Annex A: Consent form and questionnaire (English version) 27
Annex B: Additional tables 34

v
List of tables
Table 1: Distribution of households by demographic and socio-economic
characteristics 7
Table 2: Distribution of households by food security, source of regular rice and
health status 8
Table 3: Distribution of households by knowledge/information received on pushti chal 9
Table 4: Frequency and amount of pushti chal received by the households 10
Table 5: Distribution of beneficiary households by usage of pushti chal 10
Table 6: Distribution of households by cooking method of pushti chal 11
Table 7: Distribution of households by consumption pattern of pushti chal 12
Table 8 : Taste and other traits of pushti chal 13
Table 9: Respondents’ acceptance of pushti chal (in terms of taste) by food
security status, location, level of knowledge and appearance 14
Table 10 : Perceived change in health experienced after consuming pushti chal by
households 15
Table 11: Respondents’ view and perceptions about pushti chal 16
Table 12: Distribution of households by willingness to buy pushti chal 17
Table 13: Factors associated with willingness to buy pushti chal at higher price 18

vi
This page intentionally left blank

vii
Acknowledgments
The acceptability trial on micronutrient fortified rice, or ‘pushti chal’ was conducted in
line with the agreement for the Acceptability Study on Fortified Rice which was signed
between BRAC and WFP in August, 2013. The study was carried out in two upazilas - Kurigram Sadar and Satkhira Sadar where WFP, in collaboration with the
Government of Bangladesh is piloting the distribution of pushti chal through two of
the Government’s social safety net programmes. The main objective of the study was
to determine the participants’ perception about pushti chal in relation to taste and
appearance (such as its colour, texture and smell) and their overall acceptance of
fortified rice. The study was supported by the Dutch-based multinational company
DSM.
WFP has chosen the Research and Evaluation Division (RED), BRAC as a partner in
conducting this study. The research team thanks Dr. WMH Jaim, former Director of
RED and Dr Moslem Uddin Mia, former senior researcher of RED, who provided
enormous support in initiating the study. The study team of RED acknowledges the
huge support received from Ms Jessica Staskiewicz, Ms Rachel Fuli, Mr Nurul Afsar,
Mr Rezaul Karim and Ms Carla Unger of the WFP rice fortification team in the
development of survey tools and the review of the report.
Special thanks are conveyed to Dr Ahmed Mushtaque Raza Chowdhury, Vice
Chairperson of BRAC and Interim Executive Director, Dr Mahabub Hossain, Advisor
to the Executive Director, BRAC and the lead researchers of RED, Mr Samir Ranjan
Nath and Dr Hashima-E-Nasreen, for their continuous support and technical
feedback in conducting the study and finalizing the report. Editorial comments from
Mr Iftekhar A Chaudhury coordinator, Editing and Publications of RED is greatly
acknowledged. Special thanks also go to RED researchers for their technical
feedback. The authors acknowledge the sincere support of administration, field
management and data management units of RED in implementing the study. Special
thanks go to the field enumerators who collected vital information from the
participants in the field. The authors highly acknowledge the generous support of Mr
Mesbah ul Alam, Secretary, Ministry of Disaster Management and Relief; Mr Tariq Ul-
Islam, Secretary, Ministry of Women and Children Affairs; and the Project
Implementation Officer and Upazila Women Affairs Officer of Kurigram Sadar and
Satkhira Sadar Upazilas. The study team acknowledges the co-operation of the
research participants sampled from the Vulnerable Group Development (VGD)
programme and Vulnerable Group Feeding (VGF) programme who gave their
precious time to respond to the survey questions. The report would not have been
possible without their active participation.
RED is supported by BRAC's core fund and funds from donor agencies,
organizations and governments worldwide. Current donors of BRAC and RED
include Aga Khan Foundation Canada, Agricultural Innovation in Dryland Africa
viii
Project-Spain, Asian Disaster Preparedness Center, AusAid, Australian High
Commission, The World Vegetable Centre (AVRDC), Bencom S.r.L, BRAC-UK,
BRAC-USA, British Council, Campaign for Popular Education, Canadian International
Development Agency, CARE-Bangladesh, Center for Development Research,
Commonwealth Foundation, Department For International Development (DFID),
Deutsche Gesellschaft für Internationale Zusammenarbeit (GIZ), EACI-Qatar,
Embassy of the Kingdom of the Netherlands, Euro consult Mott Mac Donald,
European Commission, Family Health International, FHI Solutions, LLC, Foundation
Open Society Institute, The Global Alliance for Improved Nutrition, Global
Development Network, The Global Fund, Govt. of Bangladesh (GoB), The Hospital for
Sick Children, Canada, International Centre for Diarrheal Disease Research,
Bangladesh (ICDDR,B,) International Food Policy Research Institute (IFPRI),
International Labour Organization, International Potato Centre, International Rice
Research Institute, International Union for Conservation of Nature and Natural
Resources, Liverpool School of Tropical Medicine, Manusher Jonno Foundation,
Oxfam Novib (NOVIB), Oxford University, Rockefeller Foundation, Safer World, Sight
Saver-UK, Social Marketing Company, UN Women, UNICEF, Unilever-UK, United
Nations Development Programme, University of Bonn, University of Leeds, University
Research Company LLC, Vision Spring, Women WIN, World Bank, World Fish and
World Food Programme.

ix
Executive summary
Background
In Bangladesh, the World Food Programme (WFP), in partnership with the
Government has been working to introduce fortified rice, (locally known as ‘pushti chal’), proven in international studies to be effective in mitigating micronutrient
deficiencies. Pushti chal has been designed to be identical to normal rice in shape,
colour and texture. It involves the mixing of fortified rice kernels with polished rice at a
ratio of 1:100. The fortified rice kernels contain rice flour mixed with powdered vitamin
A, vitamin B1, vitamin B12, folic acid, iron and zinc. The pre-mix formulation was
produced in accordance with WHO guidelines and the micronutrient requirements of
the population of Bangladesh1.
At the time of the survey, WFP, in partnership with the Government had begun
piloting the distribution of fortified rice under two of the Government’s food-based
social safety net programmes, the Vulnerable Group Feeding (VGF) programme
under the Ministry of Disaster Management and Relief and the Vulnerable Group
Development (VGD) programme under the Ministry of Women and Children Affairs,
with an aim to scale-up distributions dependent on the findings of the feasibility and
acceptability studies undertaken during a pilot stage. The VGF programme is a relief
programme that provides food ration(s) to households that are vulnerable to hunger
during times of disaster. On the other hand, VGD programme is a transformational
social safety net programme that provides services to ultra-poor women participants
including income-generating activities along with a monthly food ration. On a pilot
basis, a sample of participants under these programmes received fortified rice in
place of normal rice over a period of at least six months, starting from June, 2013 in
Kurigram Sadar for VGD and from August 2013 in Satkhira Sadar for VGF.
In Satkhira Sadar, fortified rice was distributed among 6,000 female or male
participants of the VGF programme, with a monthly VGF household ration of 20 kg of
fortified rice. In Kurigram Sadar, distribution of fortified rice was targeted to 2,794
women participants of the VGD programme, each of whom received a monthly
household ration of 30 kg of fortified rice, as per the programme design. At each rice
distribution information leaflets were available to inform the participants about the
nutritional benefits of consuming pushti chal and advice about recommended
cooking as well as storage practices in order to best retain the nutritional qualities of
1 Proposed formulation includes: 100 mcg Vitamin A (Palmitate), 0.35 mg Vitamin B1 (Thiamin), 0.8 mcg
Vitamin B12 (Cyanocobalamine), 100 mcg Folic Acid (Folic acid), 7 mg Iron (Ferric pyrophosphate), 5 mg
Zinc (Zinc Oxide) per 100 gram uncooked rice, including 30% overage to compensate for losses during
storage and food preparation. This is based on the experience with wholemeal wheat flour (atta)
fortification in Bangladesh, the WHO guidelines for flour fortification and the prevalence of micronutrient
deficiencies in Bangladesh. The composition has been approved by the Bangladesh Medical Research
Council, and if necessary will be further revised to ensure its suitability to the population.

x
pushti chal. Where NGO partners were available verbal messages reinforced the
content of the leaflets.
Overview on research objective and methodology
A study was conducted by BRAC-RED in partnership with WFP to determine the
participants’ perception about the pushti chal in relation to its taste and appearance
(such as colour, texture and smell).
The specific objectives of the study are to:
assess the acceptability of fortified rice with a sample of participants enrolled in
food based social safety nets;
look into potential regional differences in the acceptance of fortified rice.
The acceptability study was carried out in Kurigram Sadar and Satkhira Sadar from
31 August to 9 September 2013 with participants from the VGD and VGF
programmes respectively. A sample of 808 participants (400 in Kurigram Sadar and
408 in Satkhira Sadar) was selected from the total list of VGD and VGF cardholders
using a systematic random sampling technique. A pre-tested structured
questionnaire was used to obtain information about acceptance of rice in terms of its
taste, texture and overall acceptability from the VGD or VGF programme participant
authorised to receive the rice. It also obtained socioeconomic and demographic
information.
Data analysis was performed using SPSS version 17. Descriptive analyses were
performed to generate tables of the relevant variables. Independent variables (i.e. the
presumed cause) included demographic and socioeconomic information, knowledge
and perception about pushti chal, cooking practice and intake pattern. The
dependent variables (i.e. the presumed effect) were acceptance in terms of taste and
texture as well as the willingness to buy the rice. Pearson’s chi-square test was used
to test the association between variables. A multivariate logistic regression was
performed to determine the extent of willingness to buy pushti chal at high price
across the small variance in income across the lower socioeconomic profile of the
respondents.
Key findings2
Demographic and socioeconomic information
The findings are generally reflective of the poor socioeconomic and food security
profile of social safety net programme research participant households:
The median income of households was 4,500 BDT/month in Kurigram
Sadar and 4,000 BDT/month in Satkhira Sadar.
2 All data refers to the responses of the programme participants (or respondents) selected for this survey

xi
About half of the household heads (main wage earner and decision maker)
was found to have no formal education and about one-quarter was found to
have a minimal literacy level (ability to read and write) in all areas (20% in
Kurigram Sadar and 33% in Satkhira Sadar).
Seventy seven per cent of households in Kurigram Sadar and 94% in
Satkhira Sadar experienced rice shortage for 6 months or more prior to the
survey period.
Receipt of awareness messages on pushti chal
Ninety per cent of the respondents (from the VGD programme) in Kurigram Sadar
said they had received awareness messages regarding pushti chal; but only 21%
of the respondents in Satkhira Sadar (VGF programme) did.
This reflects programme design, where VGD participants (women) are also in
regular contact with NGO partners, mostly for other training and other supporting
activities while in Satkhira Sadar the VGF programme involves simple distribution
of food by government officials.
Taste, colour and smell
Seventy eight per cent of respondents in Kurigram Sadar and 84% in Satkhira
Sadar rated the taste of pushti chal as the same or even better than normal rice.
100% of respondents said that any perceived difference in the colour of the
fortified was acceptable.
99% of the respondents indicated that the fortified rice was acceptable despite
any perceived difference in smell.
Overall acceptance
When asked to provide their overall rating of the fortified rice on a scale from
excellent to very bad, the fortified rice was rated as ‘excellent’ or ‘good’ by 95%
of respondents in Kurigram Sadar and 78% of respondents in Satkhira Sadar.
Perceived health benefits of pushti chal
Fifty three per cent of respondents in Kurigram Sadar reported that they or
members of their household had experienced changes in health after consuming
pushti chal, although only 16% reported the same in Satkhira Sadar.
They mostly (51% in Kurigram Sadar and 15% in Satkhira Sadar) indicated
positive benefits such as weight gain, fewer instances of disease, improved
appetite etc.
Wider acceptance of pushti chal
The majority of the respondents in Kurigram Sadar (72%) and majority in Satkhira
Sadar (59%) believed that pushti chal would be accepted by their community,

xii
citing improved nutritional value and quality of the fortified rice compared to
normal rice.
Those who stated they received awareness messages reported a significantly
higher level of satisfaction with the taste of pushti chal in comparison to those
who indicated they did not receive awareness messages.
Willingness to buy
More than 90% of respondents in both areas stated that they would buy pushti chal if it was available in the market.
Regardless of their acceptance or preference for pushti chal, respondents were
found to be price-sensitive. The proportion that was willing to buy dropped to
35% in Kurigram Sadar and 13% in Satkhira Sadar when the price of pushti chal was proposed at a higher level compared to normal rice.
Households that had suffered from any rice shortage even for less than a month
due to financial inadequacy during the year preceding the survey period were
significantly less likely (adjusted Odds Ratio: 0.515; 95% Confidence Interval:
0.326;0.815) to buy pushti chal if the price was comparatively higher.
Respondents who received awareness messages were significantly twice as
likely to buy pushti chal over normal rice, even at the higher price, (95%
Confidence Interval: 1.908;3.127) than those that did not.
Participants in the VGD programme residing at Kurigram Sadar who received
additional training along with the food ration were twice as likely to buy at higher
price (95% CI: 1.353;3.686) in comparison to the VGF participants residing in
Satkhira Sadar.
Conclusion and recommendations
The large majority of respondents in both Kurigram Sadar and Satkhira Sadar were
accepting of the pushti chal. They were also willing to purchase fortified rice instead
of normal rice if it was available in the market, particularly if the market price was
within the price range of normal rice. Further, the results indicated a strong
correlation with the receipt of awareness messages and the depth of acceptance of
fortified rice and on the willingness to buy pushti chal at a higher price. Therefore,
when making the fortified rice available at scale or in the market place,
comprehensive awareness messaging and counseling may be effective in motivating
purchase and/or consumption of pushti chal. If aiming for market purchase by
households with a similar economic profile to those of the VGD and VGF participants,
a subsidized price may be required.

1
1. Background information
1.1 Introduction
According to the 2009 WHO landscape analysis Bangladesh is considered advanced
in its strong focus to promote nutrition at the central level (UNS: SCN 2009).
However, the country is still considered to have one of the highest prevalence’s of
under nutrition in the world as per the global atlas, despite significant economic gains
in recent decades (Bhutta et al. 2013). Micronutrient deficiencies are the most hidden
form of under nutrition, and are highly prevalent across the entire socioeconomic
spectrum in Bangladesh. Micronutrients refer to those vitamins and minerals (such
as, iron, iodine, zinc, vitamin A, vitamin B, etc.) which, while required in only small
amounts are essential for good nutrition, health and development (Swaminathan
1985). The effects of micronutrient deficiencies are intergenerational, presenting in a
cyclic process from conception to adulthood and are reflected in child and maternal
death, physical disabilities, impaired intellectual growth, low productivity and high
healthcare costs (Black et al. 2008, FFI, GAIN, MI, USAID, WB and UNICEF 2009).
Those most affected by micronutrient deficiencies are pregnant or lactating women,
adolescent girls and young children.
The most immediate cause of developing a micronutrient deficiency is the inadequate
intake of micronutrient rich food (FFI, GAIN, MI, USAID, WB and UNICEF 2009). A
variety of factors including affordability, dietary behaviour, inadequate knowledge and
awareness undermine the intake of nutritionally rich and diversified food. In
Bangladesh, rice is the staple food that accounts for 62 per cent of total per capita
energy intake, yet has very low levels of micronutrients (BBS 2011, Dexter 1998).
There are a number of strategies that have proven to be effective in mitigating
micronutrient deficiencies globally, e.g., supplementation, fortification, increasing
production, and disease control measures (FAO and ILSI 1997, Copenhagen
Consensus 2008). Recently, food fortification, particularly the fortification of staple
food has been highlighted as one of the most cost-effective solutions to address
multiple micronutrient deficiencies, particularly at scale and across a wide range of
demographic profiles (Copenhagen Consensus, 2008, Angeles-Agdeppa et al. 2011,
Beinner et al. 2010 and FFI, GAIN, MI, USAID, WB and UNICEF 2009). For heavy
rice-consuming populations such as that of Bangladesh, the fortification of rice is a
logical approach, if it is well accepted by the consumers. Fortified rice has already
been introduced in several countries such as the Philippines, Brazil, Colombia, Costa
Rica, USA, and India etc. (USAID, A2Z, AED and IFT 2008).
Around 30 studies in 13 countries have demonstrated the safety, stability, bio-
availability, acceptability, efficacy and effectiveness of fortified rice (PATH 2013). The

2
findings overall indicate that fortified rice is stable and safe to eat as well as effective
in reducing targeted micronutrient deficiencies.
1.2 Introducing fortified rice to Bangladesh
The fortified rice introduced to Bangladesh is known as ‘pushti chal’ and comprises a
pre-mixed fortified kernel containing vitamin A, vitamin B1, vitamin B12, folic acid, iron
and zinc. The micronutrient content of the fortified rice kernels is 195 mcg vitamin A
(palmitate), 0.52 mg vitamin B1 (thiamin), 1.3 mcg vitamin B12 (Cyanocobalamine),
170 mcg folic acid, 6 mg iron (ferric pyrophosphate) and 4mg zinc (zinc oxide). The
formulation is based on the previous experience of WFP regarding wholemeal wheat
flour (atta) fortification and it is in line with WHO recommendations (WHO 2009). The
identified vitamins and minerals are powdered and mixed with rice flour to form a pre-
mix, and kernels are produced applying ‘hot extrusion’ technology. The resulting
fortified kernels are then mixed with polished rice at the ratio of 1:100.
The main objective of this study was to determine the overall acceptability of fortified
rice amongst participants of rice based social safety net programmes and to inform
the further scale up of the distribution of fortified rice in Bangladesh. WFP, in
partnership with the Ministry of Disaster Management and Relief and the Ministry of
Women and Children’s Affairs agreed to pilot the distribution of fortified rice in place
of the normal rice ration in two of the country’s largest food-based social safety net
programmes, the Vulnerable Group Feeding (VGF) and Vulnerable Group
Development (VGD) programmes. BRAC-RED conducted this study on a sample of
participants from the VGD and VGF programmes in partnership with WFP to assess
the overall acceptability of fortified rice by considering its taste, colour, smell, and
price sensitivity. The study also looked into potential regional variations in the
acceptability of fortified rice.

3
2. Objectives and methodology
2.1 Objectives
General Objective. Determine safety net participants’ perception of pushti chal in
relation to its taste, colour and smell, as well as overall acceptability.
Specific objectives:
1. To assess the acceptability of fortified rice with the participants of rice-based
social safety nets; and
2. To investigate if there are regional differences in the acceptance of fortified rice.
2.2 Methodology
2.2.1 Study design and population
A descriptive cross-sectional study was conducted among those who were receiving
pushti chal through the Government’s VGD and VGF programmmes. The programme
areas for the fortified rice pilot were selected by WFP together with the relevant
ministries based on geographical proximity to local rice millers with the required
blending facilities. The study sites included Kurigram Sadar (a sub-district of Kurigram
that is located in the north) and Satkhira Sadar (a sub-district of Satkhira, located in
the south). A total of 8,794 persons received fortified rice, including 2,794 women
who were receiving pushti chal through the VGD programme in Kurigram Sadar and
6,000 persons (mainly women) who were receiving pushti chal through the VGF
programme in Satkhira Sadar. In Kurigram Sadar the distribution of fortified rice
began in June 2013 and in Satkhira Sadar it began in August 2013 for a period of at
least 6 months.The surveys where undertaken when all the participants had received
at least one month’s ration of fortified rice.
Participant profiles
The VGF programme, under the Ministry of Disaster Management and Relief, is a
relief programme providing a food ration to persons whose household members are
vulnerable to hunger at times of emergency. They typically receive a ration of 20kg of
rice, for a decided period of time.
The VGF participants fulfil the following terms and conditions (Mozumder et al. 2009):
1. Males/females who are day labourers or temporary labourers or those whose
income is irregular and/or inadequate or those who have no source of income at
all

4
2. Males/females who are landless or own less than 0.15 acres of land
3. Wives of disabled or handicapped husbands
4. Poor males/females who suffer due to river erosion/flood
Males/females who are receiving any benefit under government/non-government
organization’s food assistance programme including VGD are not eligible for
obtaining a VGF card, neither will households with a member who already holds a
VGF card.
The VGD programme is a transformational social safety net programme, under the
Ministry of Women and Children Affairs. In VGD, ultra-poor women participants
receive training on a diverse array of topics, including income generating activities, as
well as a monthly household food ration of 30kg of rice.
As per the VGD programme design, the VGD participants and their household are
those who at least fulfill four of the following criteria (WFP 2006, Mozumder et al. 2009):
1. Household members consume less than two full meals per day
2. Owning no land or less than 0.15 acres of land
3. Very poor housing conditions (material and sanitation facilities)
4. Extremely low and irregular family income from daily or casual labour
5. Household headed by a woman with no adult male income earner and no other
source of income
VGD Exclusion Criteria, even if the four criteria are fulfilled, the presence of any one of
the following criteria will make her non eligible for inclusion:
1. If the woman is outside the 18 – 49 age bracket
2. If she is already member of another similar food and/or cash assistance
programme
3. If she was a VGD cardholder at any time during the previous two VGD cycles
4. If she is an adolescent who is taking care of the household in the absence of the
housewife
2.2.2 Sample size and selection
Assuming that 50% of the target population will either accept pushti chal or not, at a
95% confidence interval and 5% margin of error, the required sample size was
estimated at 384 for each of the two locations. The total sample size for both
locations was rounded up to 800 (approx.). Eight additional persons were interviewed
in place of those who had not yet opened or consumed the package of fortified rice
at the time of survey.
The formula used for sample calculation is given below:
n=z2 pq/α2

5
Here, n denotes for sample size. The z value is 1.96 at 95% confidence interval, p
equals the proportion of population expected to accept pushti chal, q equals (1-p)
and α is the margin of error.
The sampled households were selected following systematic random sampling from
the available list of participants.
2.2.3 Data collection
A pre-tested, structured questionnaire (Annex A: Consent form and Questionnaire)
was used to obtain data on socioeconomic profile of the participants and their
households, demography and the acceptance of pushti chal in terms of its taste,
texture and satisfaction. Female household members (the VGD cardholders) were
selected as the respondents in the case of VGD households. Women who prepared
food were selected as primary respondent for the survey in case of VGF.
Respondents were selected for interview based on their willingness to participate in
the interview, as per the consent form (see Annex A: Consent Form and
Questionnaire). 99% of the respondents from both the VGD and VGF programmes
were female in both Kurigram Sadar (VGD) and Satkhira Sadar (VGF).
The senior researchers provided extensive training to the twenty data collectors. The
training included a briefing of the objectives of the survey, interviewing techniques,
ways to pose questions and code answers along with a detailed explanation of each
question and its relevance to the survey. Data was collected from 31st August to 9th
September 2013.
2.2.4 Data analysis
Data analyses were performed with SPSS version 17. Descriptive analyses were
performed with the cleaned data set to generate tables about the relevant variables.
Independent variables3 included demographic and socioeconomic information,
knowledge and perceptions on pushti chal, cooking practice, and intake pattern. The
dependent variables included acceptance in terms of taste, smell and texture as well
as willingness to buy the fortified rice. Pearson’s chi-square test was used to test the
association of the acceptance of rice by taste with socioeconomic variables,
distribution areas, and other traits. Based on the assumption that ‘willingness to buy’
indicated a deeper level of acceptance of the fortified rice, a multivariate logistic
regression was performed to determine the extent of association of willingness to buy
pushti chal by the participants (particularly who are ready to buy at higher price) with
socioeconomic background, level of knowledge about pushti chal and residing areas.
An initial set of variables were selected for the logistic regression model. These
variables were assumed to have a logical association with the willingness to buy
fortified rice, including occupation and literacy status of household heads (main wage
earner and decision maker), food security status, level of acquired knowledge about
3 The dependent variable is the variable that is being observed or measured. The independent variable is
the variable that ‘logically’ has some effect or causes change in the dependent variable.
6
pushti chal, distribution areas and acceptance of the taste of pushti chal. Income was
not included as VGD and VGF participants were solely from the lower income group.
The selected variables were first checked if any significant higher correlation existed
across the variables (Annex B). No such correlation was found. Then the variables
were included in a univariate model to check the level of association of the selected
variables with willingness to buy. The covariates found to be associated with
willingness to buy at higher price (with a p value of 0.25) were included in the
multivariate regression model (Hosmer DW et al. 2013). In the univariate model
almost all the selected variables except acceptance of taste were found to be
associated with willingness to buy at a p value<0.25 and were included in the
multivariate model. In the multivariate model significance level was encountered if p
value was less than 0.05.
2.2.5 Quality control
Supervision and monitoring were undertaken by the field monitoring team to ensure
the quality of the data. Day-to-day field activities were controlled and monitored by
field supervisors through spot checking, through cross checking of data collection
procedure as well as questionnaires. The team members checked each other’s
activities before handing the completed questionnaires over to the team leader, who
in turn reviewed them before passing them on for data coding and entry. Senior
investigators monitored all activities and assisted the field team in order to maintain
the homogeneity of data.
7
3. Results
3.1 Household characteristics
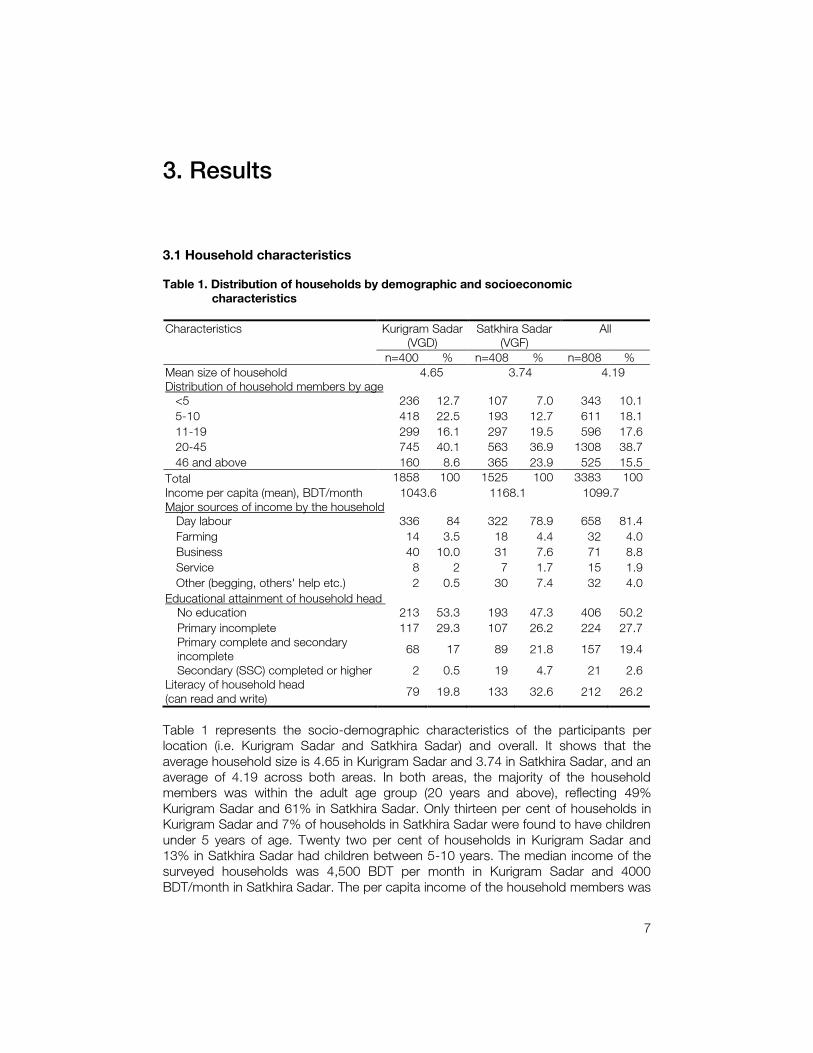
Table 1. Distribution of households by demographic and socioeconomic
characteristics
Characteristics Kurigram Sadar
(VGD)
Satkhira Sadar
(VGF)
All
n=400 % n=408 % n=808 %
Mean size of household 4.65 3.74 4.19
Distribution of household members by age
<5 236 12.7 107 7.0 343 10.1
5-10 418 22.5 193 12.7 611 18.1
11-19 299 16.1 297 19.5 596 17.6
20-45 745 40.1 563 36.9 1308 38.7
46 and above 160 8.6 365 23.9 525 15.5
Total 1858 100 1525 100 3383 100
Income per capita (mean), BDT/month 1043.6 1168.1 1099.7
Major sources of income by the household
Day labour 336 84 322 78.9 658 81.4
Farming 14 3.5 18 4.4 32 4.0
Business 40 10.0 31 7.6 71 8.8
Service 8 2 7 1.7 15 1.9
Other (begging, others' help etc.) 2 0.5 30 7.4 32 4.0
Educational attainment of household head
No education 213 53.3 193 47.3 406 50.2
Primary incomplete 117 29.3 107 26.2 224 27.7
Primary complete and secondary
incomplete 68 17 89 21.8 157 19.4
Secondary (SSC) completed or higher 2 0.5 19 4.7 21 2.6
Literacy of household head
(can read and write) 79 19.8 133 32.6 212 26.2
Table 1 represents the socio-demographic characteristics of the participants per
location (i.e. Kurigram Sadar and Satkhira Sadar) and overall. It shows that the
average household size is 4.65 in Kurigram Sadar and 3.74 in Satkhira Sadar, and an
average of 4.19 across both areas. In both areas, the majority of the household
members was within the adult age group (20 years and above), reflecting 49%
Kurigram Sadar and 61% in Satkhira Sadar. Only thirteen per cent of households in
Kurigram Sadar and 7% of households in Satkhira Sadar were found to have children
under 5 years of age. Twenty two per cent of households in Kurigram Sadar and
13% in Satkhira Sadar had children between 5-10 years. The median income of the
surveyed households was 4,500 BDT per month in Kurigram Sadar and 4000
BDT/month in Satkhira Sadar. The per capita income of the household members was

8
1,044 BDT/month in Kurigram Sadar and 1168 BDT/month in Satkhira Sadar on
average. The main source of income among the households was found to be daily
labour work (84% in Kurigram Sadar and 79% in Satkhira Sadar). About half of the
household heads (the person nominated as the main wage earner and decision
maker) were found to have no education (53% in Kurigram Sadar and 47% in
Satkhira Sadar). More than one-quarter of the household heads were found to have
minimal literacy level (ability to read and write letters) in all areas (20% in Kurigram
Sadar and 33% in Satkhira Sadar).
Table 2. Distribution of households by food security, source of regular rice and health
status
Characteristics Kurigram
Sadar
Satkhira
Sadar
All
n=400 % n=408 % All=808 %
Frequency of household food shortage (last year from survey period)
Never 94 23.5 25 6.1 119 14.7
Seldom (≤1 month in a year) 25 6.3 30 7.4 55 6.8
Sometimes (2 to 5 months) 240 60 228 55.9 468 57.9
Almost always (6 to 10 months) 26 6.5 91 22.3 117 14.5
Always (11/12 months) 15 3.8 34 8.3 49 6.1
Source of rice in households with adequate food
Home production 4 1.0 4 1.0 8 1.0
Purchase 63 15.8 11 2.7 74 9.2
As wage/in kind 7 1.8 2 0.5 9 1.1
Both home production and purchasing 10 2.5 5 1.2 15 1.9
Both purchasing and wage 10 2.5 3 0.7 13 1.6
Total 94 23.5 25 6.1 119 14.7
Health status of the household members while surveying
Normal 1679 90.4 1270 83.3 2949 87.2
Ill-health 93 5.0 209 13.7 302 8.9
Pregnant 19 1.0 8 0.5 27 0.8
Lactating 64 3.4 38 2.5 102 3.0
Pregnant and Lactating 3 0.2 0 0 3 0.1
Total 1858 100 1525 100 3383 100
Table 2 shows that overall only 15% of households ‘never’ experienced any food
shortage (i.e. had sufficient rice to eat) at any time during the 12 months prior to the
date of surveying. The main source of rice for households with an adequate supply of
food was through purchase in a local market, rather than home production or as
wages4. In Kurigram Sadar around 70% of households had experienced rice
shortage ‘sometimes’ to ‘always’ in the last year, and 87% indicated the same in
Satkhira Sadar. In Kurigram Sadar 6% of households and in Satkhira Sadar 22% of
households reported that they had to struggle with food shortages almost always (i.e.
for a period of 6 to 10 months), and 3% in Kurigram Sadar and 8% in Satkhira Sadar
reported constant food shortages over the full 12 months.
4 The source of rice for households who did experience food shortages was not captured in the survey.

9
In regards to health status, 90% of the study population in Kurigram Sadar and 83%
of the study population in Satkhira Sadar that had received pushti chal were found to
be of average or normal health. A small number of the respondents (99% of whom
were women) were found to be pregnant or lactating (5% in Kurigram Sadar and 3%
in Satkhira Sadar).
3.2 Knowledge, frequency and amount of pushti chal received
Table 3. Distribution of households by knowledge/information received on pushti chal
Characteristics Kurigram
Sadar (VGD)
Satkhira
Sadar (VGF)
All
n=400 % n=408 % n=808 %
Information on pushti chal Received 361 90.3 85 20.8 446 55.2
Not received 39 9.7 323 79.2 362 44.8
Sources of information
Union Parishad (UP) Chairman/Member 34 9.4 22 25.9 56 12.6
NGO workers 214 59.3 1 1.2 215 48.2
WFP Staff 94 26.0 0 0 94 21.1
Leaflets 1 0.3 41 48.2 42 9.4
UP chairman and NGO worker 4 1.1 0 0 4 0.9
NGO and WFP staff 5 1.4 0 0 5 1.1
UP and WFP 3 0.8 0 0 3 0.7
Others (relatives, friends...) 6 1.7 21 24.7 27 6.1
Knowledge about the pushti chal (multi response)
It has better nutritional value than normal rice 269 74.5 75 88.2 344 77.1
It is good for health 234 64.8 40 47.1 274 61.4
How to cook it 248 68.7 23 27.1 271 60.8
How to store it 116 32.1 5 5.9 121 27.1
It is suitable for everyone 77 21.3 26 30.6 103 23.1
Others 3 0.8 0 0 3 0.7
Table 3 represents the distribution of households that had received any kind of
awareness message or information on pushti chal. Ninety per cent of respondents in
Kurigram Sadar said that they had received information on pushti chal whereas, only
21% indicated the same in Satkhira Sadar. This is thought to be due to the
differences in programme design between VGD and VGF, where in Satkhira Sadar,
the participants of the VGF programme receive food as relief and there is no contact
between participants and NGO officials, and only little contact with local Government
officials. Where as participants from Kurigram Sadar under the VGD programme have
regular contact with NGO staff, as well as Government officials, who can relay the
messages on the leaflets, answer questions and reinforce awareness messages. That
is a necessary support considering the low literacy levels of the participants. The
added benefit of verbal messaging is reflected in the higher levels of knowledge on
benefits, appropriate storage, and cooking of the fortified rice of the participants in
Kurigram Sadar compared to Satkhira Sadar.

10
Table 4. Frequency and amount of pushti chal received
Characteristics Kurigram Sadar
(VGD)
Satkhira Sadar
(VGF)
All
n=400 % n=408 % n=808 %
Frequency of receiving pushti chal
Once 0 0 408 100 408 50.5
Twice 44 11 0 0 44 5.4
Thrice 356 89 0 0 356 44.1
Amount of pushti chal received last time
20 kg 0 0 408 100 408 50.5
30 kg 388 97 0 0 388 48.0
Between 21 to 29 kg 12 3 0 0 12 1.5
Table 4 reflects the distribution and consumption of the fortified rice. The findings
indicate that 89% of households in Kurigram Sadar had received pushti chal three
times by the time of survey, while the remainder had received two distributions. In
Satkhira Sadar all respondents had received the ration once. In Kurigram Sadar,
almost all of the households (97%) said they have received their full entitlement of
30kg of pushti chal and in Satkhira Sadar all participants indicated they received their
full planned ration of 20kg.
3.3 Usage, cooking method and consumption pattern of pushti chal
Table 5. Distribution of households by usage of pushti chal
Characteristics
Kurigram Sadar
(VGD)
Satkhira
Sadar (VGF) Total
n=400 % n=408 % n=808 %
Utilization/usage of the pushti chal
Eaten 386 96.5 374 91.7 760 94.1
Partly eaten 12 3 29 7.1 41 5.1
Not eaten5 2 0.5 5 1.2 7 0.9
Alternate usage of the pushti chal (other than eating)
Sold it to meet urgent non-food
needs 3 0.8 3 0.7 6 0.7
Sold it to buy other food items 1 0.3 2 0.5 3 0.4
Shared with relatives or
neighbours 1 0.3 5 1.2 6 0.7
Didn’t like it/haven’t used it 9 2.3 2 0.5 11 1.4
Bird/Animal feeding 0 0.0 20 4.9 20 2.5
Regular rice is still not finished 0 0.0 2 0.5 2 0.2
Total 14 3.5 34 8.3 48 5.9
Table 5 reflects the utilization of the pushti chal, 94% of the respondents over both
areas indicated that their household members consumed all of the pushti chal
5 These households were removed from subsequent analyses.

11
received. Under 5% had eaten a partial ration while very few (less than 2%) had not
eaten any of the pushti chal by the time of survey. When asked about their alternate
use of pushti chal, respondents indicated several reasons, including selling the ration
to buy food items or non-food items, sharing it with others outside the household,
feeding it to animals (4.9%), and so on.
Table 6. Distribution of households by cooking method of pushti chal
Characteristics Kurigram Sadar
(VGD)
Satkhira Sadar
(VGF)
All
n=398 % n=403 % n=801 %
Cooking method practiced for pushti chal
Discard the excess water after cooking 16 4.0 357 88.6 373 46.6
Absorb the whole water during cooking 382 96.0 46 11.4 428 53.4
Cooking method of regular rice
Discard the excess water after cooking 24 6.0 382 93.6 406 50.2
Absorb the whole water during cooking 376 94.0 26 6.4 402 49.8
Rice cooked during the period of having pushti chal
Only pushti chal 367 92.2 346 85.9 713 89.0
Pushti chal and normal rice mixed 19 4.8 12 3.0 31 3.9
Pushti chal and normal rice separately 12 3.0 45 11.2 57 7.1
Table 6 reflects the cooking methods employed. Cooking by the absorption method
is recommended in order to retain the maximum amount of nutrients, and is reflected
as such in the leaflets. In Kurigram Sadar, the majority of households (96%) cooked
pushti chal using the recommended absorption method while only 11% did so in
Satkhira Sadar. This is thought to be reflective of take-up from the awareness
messaging, but more so regional differences in traditional cooking methods, i.e.
participants in Kurigram Sadar traditionally use the absorption method for both
fortified and regular rice, while in Satkhira Sadar the boiling/discarding method is
applied. The majority of households consumed only the pushti chal, very few
households mixed the pushti chal with normal rice (5% in Kurigram Sadar and 3% in
Satkhira Sadar) while cooking, and a few also ate both the normal and pushti chal (separately) over the survey period (3% in Kurigram Sadar and 11% in Satkhira
Sadar).
Table 7 demonstrates the eating habits of the pushti chal. In the majority of
households (99%) all members consumed pushti chal as the staple of their regular
main meal, complemented by a number of curries/dishes. Over two third of
households consumed the pushti chal with vegetable curry. Forty-one per cent in
Kurigram Sadar and 33% in Satkhira Sadar consumed pushti chal with meat/fish
curry. Twenty-three per cent of households in Kurigram and 18% in Satkhira Sadar
reported that they consumed pushti chal with mashed potatoes or mashed
vegetables. Note, that in order to obtain absolute numbers on the different types of
dishes consumed with the fortified rice multiple responses were counted, reflected by
the inflated n value.

12
More than twenty per cent of households in both Kurigram Sadar and Satkhira Sadar
consumed more pushti chal than normal rice, while more than 65% consumed the
equivalent quantity as normal rice. Similar patterns of consumption were reflected
across the different age groups in both areas (see Annex B).The main reason
provided by the respondents who ate more fortified rice than normal was a superior
taste (92%). For those respondents that indicated they consumed less fortified rice
than they did normal rice (10% in Kurigram Sadar and 14% in Satkhira Sadar), the
major reasons provided were dissatisfaction with the smell (70% in Kurigram Sadar
and 35% in Satkhira Sadar), an aversion to the taste (31% in Kurigram Sadar and
22% in Satkhira Sadar), because it was unfamiliar (4% in Kurigram Sadar and 15% in
Satkhira Sadar) and because it was larger or more coarse than the rice normally
consumed, requiring a smaller amount (26% - only in Satkhira Sadar).
Table 7. Distribution of households by consumption pattern of pushti chal
Characteristics Kurigram Sadar
(VGD)
Satkhira Sadar
(VGF)
Total
n=398 % n=403 % n=801 %
Households where all members ate pushti chal
396 99.5 398 98.8 794 99.1
Households where not all members ate
pushti chal 2 0.5 5 1.2 7 0.9
Dishes/types of dishes eaten with pushti chal (note multiple responses counted)
Meat or fish curry 162 40.7 133 33.0 295 36.8
Mashed dried fish (bhorta) 14 3.5 0 0.0 14 1.7
Mashed potato or other mashed vegetables
(bhorta) 91 22.9 71 17.6 162 20.2
Vegetable curry 264 66.3 349 86.6 613 76.5
Dal 77 19.3 132 32.8 209 26.1
Plain rice without curry 5 1.3 0 0.0 5 0.6
Quantity eaten by household members n=1837 n=1497 n=3334
More than normal 422 23.0 321 21.4 743 22.3
Less than normal 191 10.4 203 13.6 394 11.8
As usual 1224 66.6 973 65.0 2197 65.9
Reasons behind eating more amount of
pushti chal n=422 n=321 n=743
Liked the smell of rice 5 1.2 34 10.6 39 5.2
Liked the taste of rice 401 95.0 281 87.5 682 91.8
More appetite than normal 16 3.8 6 1.9 22 3.0
Reasons behind eating less amount of
pushti chal n=191 n=203 n=394
Did not like the colour 0 0 5 2.5 5 1.3
Didn't like the smell 124 64.9 71 35.0 195 49.5
Did not like the taste 59 30.9 44 21.7 103 26.1
Not used to the rice 8 4.2 30 14.8 38 9.6
The general rice was not good quality 0 0 1 0.5 1 0.3
Large/coarse rice kernels requiring smaller
amount 0 0 52 25.6 52 13.2

13
In a negligible number of households (0.9%, or 2 households from Kurigram Sadar
and 5 from Satkhira Sadar) pushti chal was not consumed by every household
member. A total of 15 individuals did not consume the fortified rice at all, the reason
being either the absence of the individual from the household, or in three cases only,
concerns on the quality of the fortified rice.
3.4 Taste and other traits of pushti chal
Table 8. Taste and other traits of pushti chal
Characteristics
Kurigram Sadar
(VGD)
Satkhira Sadar
(VGF)
Total
n=398 % n=403 % n=801 %
Noticed difference in color of pushti chal after it is cooked compared to uncooked rice
Reddish 102 25.6 148 36.7 250 31.2
Same as normal 283 71.1 237 58.8 520 64.9
Yellowish 12 3.0 3 0.7 15 1.9
Cream/brown 1 0.3 0 0 1 0.1
Blackish 0 0 15 3.7 15 1.9
Acceptance of different colours
Acceptable 74 64.3 144 86.7 218 77.6
Somewhat acceptable 41 35.7 22 13.3 63 22.4
Not Acceptable 0 0.0 0 0.0 0 0.0
Total 115 100 166 100 281 100
Noticed difference in smell of pushti chal after it is cooked compared to uncooked rice
Different to normal rice 184 46.2 149 37.0 333 41.6
Same as normal rice 214 53.8 254 63.0 468 58.4
Total 398 100 403 100 801 100
Acceptance of different smell
Acceptable 113 61.4 102 68.5 215 64.6
Somewhat acceptable 68 37.0 47 31.5 115 34.5
Not acceptable 3 1.6 0 0 3 0.9
Total 184 100 149 100 333 100
Rating of taste about pushti chal Same as normal rice 97 24.4 119 29.5 216 27.0
Better 213 53.5 217 53.8 430 53.7
Worse 88 22.1 65 16.1 153 19.1
Don’t know 0 0 2 0.5 2 0.2
Total 398 100 403 100 801 100
Table 8 reflects perceived differences in colour, smell, taste, and acceptance of the
pushti chal.
Colour: About two third of households in both areas (71% in Kurigram Sadar and
59% in Satkhira Sadar) indicated that the cooked pushti chal was same in colour
compared to the regular rice they consumed. If a difference was perceived, the
majority of households (77%) still found the fortified rice to be acceptable.
Smell: Fifty-eight per cent of households overall (54% in Kurigram Sadar and 63% in
Satkhira Sadar) perceived no difference in the smell of the cooked fortified rice
14
compared to normal rice. If a different smell was perceived, the majority of
households (61% in Kurigram Sadar and 69% in Satkhira Sadar) still found the
fortified rice to be acceptable.
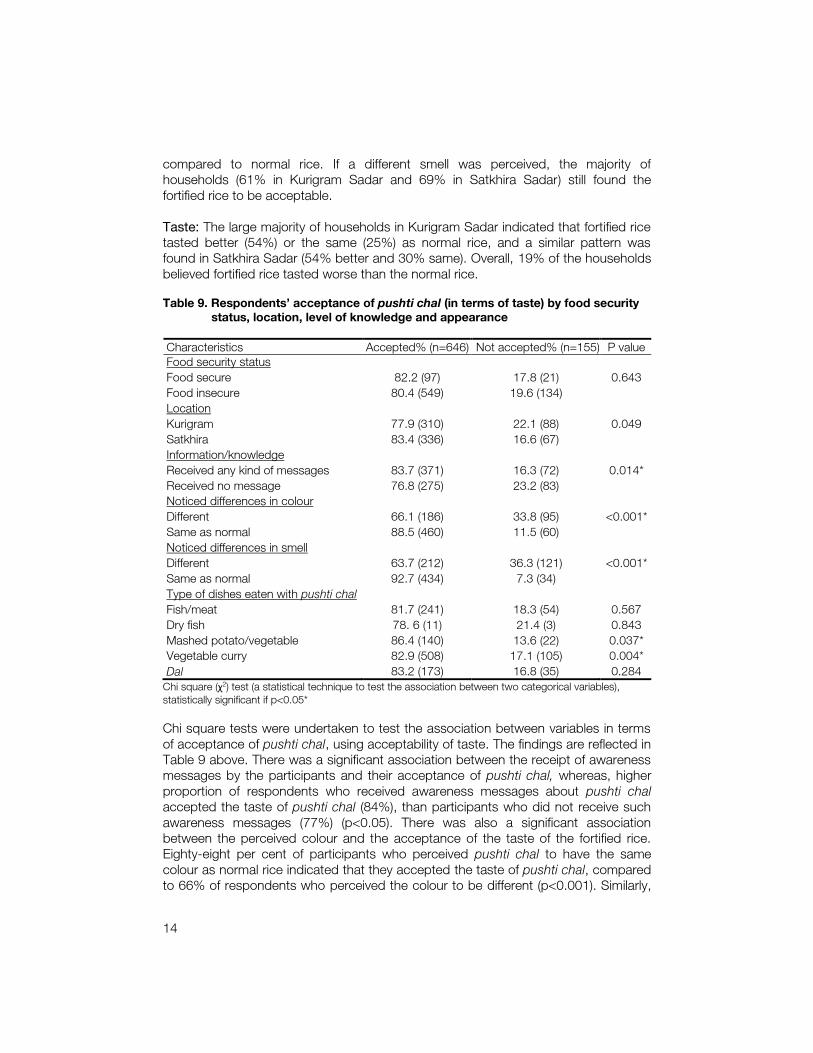
Taste: The large majority of households in Kurigram Sadar indicated that fortified rice
tasted better (54%) or the same (25%) as normal rice, and a similar pattern was
found in Satkhira Sadar (54% better and 30% same). Overall, 19% of the households
believed fortified rice tasted worse than the normal rice.
Table 9. Respondents’ acceptance of pushti chal (in terms of taste) by food security
status, location, level of knowledge and appearance
Characteristics Accepted% (n=646) Not accepted% (n=155) P value
Food security status
Food secure 82.2 (97) 17.8 (21) 0.643
Food insecure 80.4 (549) 19.6 (134)
Location
Kurigram 77.9 (310) 22.1 (88) 0.049
Satkhira 83.4 (336) 16.6 (67)
Information/knowledge
Received any kind of messages 83.7 (371) 16.3 (72) 0.014*
Received no message 76.8 (275) 23.2 (83)
Noticed differences in colour
Different 66.1 (186) 33.8 (95) <0.001*
Same as normal 88.5 (460) 11.5 (60)
Noticed differences in smell
Different 63.7 (212) 36.3 (121) <0.001*
Same as normal 92.7 (434) 7.3 (34)
Type of dishes eaten with pushti chal
Fish/meat 81.7 (241) 18.3 (54) 0.567
Dry fish 78. 6 (11) 21.4 (3) 0.843
Mashed potato/vegetable 86.4 (140) 13.6 (22) 0.037*
Vegetable curry 82.9 (508) 17.1 (105) 0.004*
Dal 83.2 (173) 16.8 (35) 0.284
Chi square (χ2) test (a statistical technique to test the association between two categorical variables),
statistically significant if p<0.05*
Chi square tests were undertaken to test the association between variables in terms
of acceptance of pushti chal, using acceptability of taste. The findings are reflected in
Table 9 above. There was a significant association between the receipt of awareness
messages by the participants and their acceptance of pushti chal, whereas, higher
proportion of respondents who received awareness messages about pushti chal accepted the taste of pushti chal (84%), than participants who did not receive such
awareness messages (77%) (p<0.05). There was also a significant association
between the perceived colour and the acceptance of the taste of the fortified rice.
Eighty-eight per cent of participants who perceived pushti chal to have the same
colour as normal rice indicated that they accepted the taste of pushti chal, compared
to 66% of respondents who perceived the colour to be different (p<0.001). Similarly,

15
a higher proportion of respondents (93%) who perceived no difference in smell
accepted the taste of the fortified rice compared to those who noticed a difference in
smell (64%) (p<0.001). Table 9 also indicates that the acceptance of the taste of
fortified rice varied with the dishes it was eaten with. Specifically, those who ate
pushti chal with mashed potatoes or vegetables or vegetable curries indicated that
they accepted the taste of fortified rice (p<0.05).
Table 10. Perceived change in health experienced after consuming pushti chal by
households
Characteristics Kurigram
Sadar (VGD)
Satkhira
Sadar (VGF)
All
n=398 % n=403 % n=801 %
Experienced change in health after consumption 211 53.0 65 16.1 276 34.5
Experienced no change in health after
consumption 187 47.0 338 83.9 525 65.5
Type of differences experienced
Felt better than before 205 51.5 62 14.6 267 33.4
Health is has improved 130 32.7 43 10.7 173 21.6
Gained weight 3 0.8 9 2.2 12 1.5
Relatively less/no disease 38 9.5 0 0.0 38 4.7
Gained more energy, appetite increased 32 8.0 8 2.0 40 5.0
Appetite improved 2 0.5 2 0.5 4 0.5
Felt worse 6 1.5 3 1.5 9 1.1
Stomach problem 6 1.5 1 1.5 7 0.9
Appetite reduced 0 0.0 1 0.0 1 0.1
Gas 0 0.0 1 0.0 1 0.1
Table 10 reflects any perceived changes in health after consuming fortified rice. In
Kurigram Sadar, 53% of households reported a change in health after consumption
of pushti chal while 16% of households perceived changes in health in Satkhira
Sadar. The majority of respondents indicated that the change was an improvement in
health, noting weight gain, decreased morbidity, less disease, etc. after consuming
pushti chal. A negligible number (less than 1%) across both areas reported ill health
after consuming fortified rice, and provided stomach problems, reduced appetite,
and gas as the presenting issues. These households had related these issues with
the consumption of the pushti chal but the cause was not confirmed. Except one
household, all household members had recovered by the time of survey. Among
those stated to be ill, one was in the under-5 age group, five were between 5 to 10
years of age, and six were in the adolescent age group.
3.5 Acceptance and willingness to buy
Table 11 represents the respondents’ views about how pushti chal would be
accepted by other people in their community, as well as the respondents’ personal
overall opinion of pushti chal. Seventy two per cent of households in Kurigram Sadar
and 59% in Satkhira Sadar believed that persons in their community would accept
pushti chal. Multiple responses were collected, and of these, 77% of respondents in

16
Kurigram Sadar and 21% in Satkhira Sadar reasoned that community members
would accept pushti chal due to its higher nutritional value, 18% of respondents in
Kurigram Sadar and 4% in Satkhira Sadar stated the community would accept pushti chal due to health benefits, and a large proportion (39% in Kurigram Sadar and 66%
in Satkhira Sadar) also stated that community members would appreciate the better
quality of fortified rice.
Table 11. Respondents’ perception on community acceptance and overall perception
and rating of pushti chal
Kurigram Sadar
(VGD)
Satkhira Sadar
(VGF)
Total
Characteristics n=398 % n=403 % n=808 %
Perceptions on community members’ acceptance of pushti chal
Will accept 287 72.1 238 59.1 525 65.5
Will not accept 39 9.8 30 7.4 69 8.6
Don't Know 72 18.1 135 33.5 207 25.8
Possible reasons for community members’ acceptance of pushti chal (multiple responses)
Quality of rice is good by taste, smell 39 13.6 158 66.4 197
Nutritious 221 77.0 50 21.0 271
Good for health and less disease 18 6.3 4 1.7 22
Food scarcity 7 2.4 12 5.0 19
Low price 14 4.9 10 4.2 24
Tastes same as normal 0 0.0 4 1.7 4
Total 287 54.7 238 45.3 525
Respondents’ perception (opinion) overall about pushti chal (multiple response)
Nutritious 227 57.0 60 14.9 287
Good for health (weight gain, less disease,
energy gain etc. 133 33.4 50 12.4 183
Quality is good in terms of taste, smell and
colour 223 56.0 338 83.9 561
Quality is bad by taste, smell and colour 81 20.4 121 30.0 202
It is for free/cheaper 16 4.0 22 5.5 38
It requires more amount of curries, but can
tackle food insecurity 31 7.8 50 12.4 81
Respondents' overall rating on pushti chal
Excellent 60 15.1 53 13.2 113 14.1
Good 319 80.2 262 65.0 581 72.5
Normal (Not different from daily rice) 3 0.8 32 7.9 35 4.4
Slightly bad 15 3.8 55 13.6 70 8.7
Very bad 1 0.3 1 0.2 2 0.2
When providing their own opinion on pushti chal respondents stated that they found
the pushti chal to be nutritious (57% in Kurigram Sadar and 15% in Satkhira Sadar),
of good quality (56% in Kurigram Sadar and 84% in Satkhira Sadar), and good for
health (33% in Kurigram Sadar and 12% in Satkhira Sadar), however, a proportion of
participants also indicated that the pushti chal was of poor quality (20% in Kurigram
Sadar and 30% in Satkhira Sadar). When asked to provide their overall rating of the

17
fortified rice on a scale from excellent to very bad, 95% of respondents in Kurigram
Sadar rated the fortified rice to be ‘excellent ‘or ‘good’, as did 78% of the
respondents from Satkhira Sadar. Table 12. Distribution of households by willingness to buy pushti chal
Willingness to buy Kurigram Sadar
(VGD)
Satkhira Sadar
(VGF)
Total
n=398 % n=403 % n=801 %
Will buy if available in market 359 90.2 366 90.8 725 90.5
Will not buy if available in market 39 9.8 37 9.2 76 9.5
If price is higher
Will buy 138 34.7 52 12.9 190 23.7
Will not buy 221 55.5 314 77.9 535 66.8
Ready to pay extra price for pushti chal
10 tk/kilogram more than normal rice 2 0.5 0 0 2 0.2
5 tk/kilogram more than normal rice 25 6.3 6 1.5 31 3.9
2-3 tk/kilogram more than normal
rice 47 11.8 2 0.5 49 6.1
1-2 tk/kilogram more than normal
rice 64 16.1 44 10.9 108 13.5
If price is same as regular one
Will buy 302 75.9 307 76.2 609 76.0
Will not buy 57 14.3 59 14.6 116 14.5
If price is less than the regular one
Will buy 395 99.2 395 98.0 790 98.6
Will not buy 3 0.8 8 2.0 11 1.4
Table 12 reflects the respondents’ willingness to purchase the fortified rice in the
market, noting that all households received the pushti chal as their due entitlement
and at no cost under the VGD and VGF social safety net programmes. A willingness
to buy the fortified rice product in the market is considered to reflect a greater level of
acceptance. About 90% of respondents across both areas indicated they would buy
pushti chal if it was available in the market. Seventy-six per cent of households overall
responded that they would purchase fortified rice over normal rice if the market price
was equivalent, and 99% indicated they would buy pushti chal if its market price was
lower than that for normal rice.
When asked if they would purchase fortified rice at a higher market price than normal
rice the survey respondents were found to be less willing to purchase pushti chal, although thirty-five per cent in Kurigram Sadar and 13% in Satkhira Sadar were still
ready to buy pushti chal at a higher price. When the additional cost was indicated,
13% of respondents overall were ready to pay an additional 1-2 BDT per kilogram,
and 28% in Kurigram Sadar if it was 3 BDT or less. However, if the price of pushti chal was 5 BDT/kg or more than the price of normal rice, only 4% of respondents
indicated that they would purchase it.

18
Table 13. Factors associated with willingness to buy pushti chal at higher price
Characteristics n=725 % ready to pay
a higher price Odds Ratio
¥
(95% CI)
Adjusted Odds Ratio¥¥
(95% CI)
Literacy status of household head P=0.073 P=0.010
Illiterate 532 24.4% 1 1
Literate 193 31.1% 1.395 (0.970;2.006) 1.735* (1.142;2.636)
Occupation P=0.004** P=0.111
Farming 49 20.4% 1 1
Small business 84 36.9% 2.281 (1.000;5.200) 1.547 (0.643;3.724)
Service 35 22.9% 1.156 (0.404;3.306) 0.751 (0.242;2.328)
Labour 489 27.6% 1.487 (0.722;3.063) 1.230 (0.567;2.669)
Others (begging,
disabled,
unemployed)
68 8.8% 0.377 (0.127;1.121) 0.448 (0.144;1.391)
Food security status P<0.001** P=0.004
Secure 111 46.8% 1 1
Insecure6 614 22.5% 0.329 (0.217;0.500) 0.515* (0.326;0.815)
Knowledge P<0.001** P=0.010
Received
no knowledge
323 13.9% 1 1
Received knowledge 402 36.1% 3.486 (1.189;3.206) 1.908* (1.164;3.127)
Location P<0.001** P=0.002
Satkhira Sadar 366 14.2% 1 1
Kurigram Sadar 359 38.4% 3.771 (2.624;5.417) 2.233**(1.353;3.686)
Acceptance of taste P=0.980
Not included in
multivariate model¥¥¥
Accepted 591 73.8% 1
Not accepted 134 73.9% 0.994 (0.649;1.524)
NB: Multivariate logistic regression; statistically significant if **p<0.01, *p<0.05. *Odds ratio is calculated
through univariate analysis indicating the increase in favour of willingness to pay for a one-unit increase in
the explanatory variable without controlling effects of other explanatory variables in the model. ¥Adjusted
odds ratio is calculated through multivariate analysis indicating the increase in favour of willingness to pay
for a one-unit increase in the explanatory variable while controlling for other explanatory variables in the
model. In the regression model, dependent variable was coded as 1 if beneficiaries were ready to buy at
higher price, and coded 0 if not ready to buy at higher price. ¥¥¥
The variables which had a p value of <0.25
in the univariate model were considered to be included in the multivariate model, and thus acceptance of
taste was excluded from the multivariate model.
Considering a willingness to buy fortified rice in the market as a proxy variable for
level of acceptance of fortified rice, analyses were undertaken to determine what
extent different factors were associated with respondents’ willingness to buy pushti chal at higher price, findings are reflected in Table 13. In the univariate analyses
literacy status and occupation of the head of household, food shortage, receipt of
6 For the purposes of these analyses, households who had any rice shortage during the last year (even for
less than a month) due to limited purchasing power, are considered food insecure. Those who did not
face any kind of rice shortage during the last 12 months (from time of survey) are considered as food
secure.

19
awareness messages, and location, were found to be significantly associated with a
willingness to buy fortified rice at higher price. In the multivariate analysis food
shortage, literacy level, receipt of awareness messages and location were found to
be significantly associated with willingness to buy.
The results show that, controlling effects of other explanatory variables included in
the model, respondents from households which had rice shortage due to limited
purchasing power during the last year from before the survey period, even for less
than a month, were less likely to buy pushti chal if the price was higher in comparison
to those who had ‘never’ suffered a shortage of food (aOR: 0.515, 95% CI:
0.326;0.815). Again, controlling effects of other explanatory variables included in the
model, respondents from households whose heads had a greater level of literacy
were significantly more likely (nearly twice as much) to buy pushti chal at higher price
in comparison to households whose heads were considered illiterate (p<0.05, 95%
CI: 1.142;2.636).The households that had received awareness messages about
pushti chal were twice as likely to buy pushti chal, even at a higher price (p<0.01,
95% CI: 1.164;3.127), in comparison to those from households who did not. The
VGD participants residing in Kurigram Sadar were also twice as likely to indicate that
they would buy pushti chal, even at the higher price (p<0.01; 95% CI: 1.353;3.686),
than the VGF participants/recipients residing in Satkhira Sadar.

20
4. Discussion, conclusions and
recommendations
4.1 Discussion
Socioeconomic status
Most of the food-based safety net programmes in Bangladesh are designed to target
vulnerable households residing in poverty-prone, disaster-prone, or food insecure
areas, the programmes apply pre-set selection criteria that include minimal land
ownership, inadequacy in income, day labourers, susceptibility to natural disasters,
inadequate agricultural production and so on (Rahman et al. 2011). The survey of
VGD and VGF participants in the pilot of fortified rice and surveyed for this research,
reflects such a socioeconomic profile. The main occupation of the participants’
households was to found day labouring, and the large majority had experienced food
shortages over the past 12 months. In both areas, per capita income of the
household members reflects the national per capita income for the poor, that is,
those who fall below the lower poverty line with a per capita income of 1102.84 BDT.
The income profile also reflects the divisional level per capita income for the poor in
Rangpur Division where Kurigram Sadar is located and Khulna Division where
Satkhira Sadar is located (BBS 2011).
Receipt of fortified rice and awareness messaging
It was confirmed that during the pilot period, the VGD participants in Kurigram Sadar
received their monthly entitlement of 30 kg of pushti chal and in Satkhira Sadar the
VGF participants received a household ration of 20 kg of fortified rice. The fortified
rice was accompanied by leaflets that provided brief awareness messages on
nutritional benefits and recommended storage and cooking practices. Ninety per cent
of the respondents in Kurigram Sadar confirmed they had received information on
pushti chal. However, in Satkhira Sadar only 21% reported receiving such awareness
messages. This reflects both the low literacy levels of the participants overall, and the
difference in programme design and services between VGD and VGF. For the pilot
study NGO partners were in regular contact with VGD participants assisting the
Government in distribution of the fortified rice and delivering training activities and
were therefore, available to read out the pushti chal leaflets and to provide further
reinforcing verbal messages. WFP staff were also present during the distributions to
reinforce awareness messaging, however, WFP’s involvement in VGD is particular to
this pilot stage of the rice fortification initiative. In Satkhira Sadar the VGF participants
were provided with leaflets containing information about pushti chal, but without NGO
partners to assist in reading the leaflets and less engagement of the Government
officials due to the programme design, it is expected that the uptake of the

21
awareness messaging would be less, which seems to reflect in regional differences
across a number of variables. Furthermore, the participants in Satkhira Sadar were
only in receipt of one month’s ration of fortified rice and thus, accompanying
awareness messaging compared to three months in Kurigram Sadar.
Cooking practice and consumption of fortified rice
In Kurigram Sadar most participants (96%) cooked the fortified rice by the
recommended absorption method. However, in Satkhira Sadar the majority did not
(only 11%). This finding may be explained both due to the regional difference in
cooking practices (where absorption is practiced in Kurigram area but boiling and
discarding excess cooking water in Satkhira area) and distribution of awareness
messages (the majority had received it in the north, while few had received it in the
south).
More than two thirds of household members across all age groups consumed the
same quantity of fortified rice as normal rice. Among the remaining third some (22%)
were found to eat more than normal rice, citing improved taste, and some (12%)
consumed less, citing an unpleasant smell as the reason why. Almost all households
who received pushti chal consumed it as their main meal component complemented
by different curries and dishes. The findings suggest that the type of dishes
consumed alongside the fortified rice may have contributed to the perception that
fortified rice tasted better than normal rice (primarily when eaten with mashed
potatoes/vegetables and vegetable curry rather than with other dishes).
Taste, colour and smell
The fortification process of pushti chal allows the flexible adaptation of micronutrient
formulation, shape, and colour to suit population needs and match to the type of rice
they will be mixed with (DSM and Buhler n.d., Kunz R 2009). It is therefore,
hypothesized that there should be little or no impact in terms of appearance, taste
and texture on consumers. In this study, the participants’ opinions were collected to
determine if they perceived any differences in taste, colour, smell and texture of
fortified rice over normal rice, and whether any perceived differences were acceptable
or not acceptable. The majority of respondents who noticed a difference in colour
perceived that pushti chal took on a reddish colour when cooked (possibly linked to
the powdered iron present in the fortified kernel), but of the respondents most of
them found it to be acceptable. Less than half of the respondents perceived a
different smell to normal rice although overall it was also found to be acceptable. The
large majority of the respondents found that the fortified rice tasted the same or even
better than normal rice.
To further investigate the perceived difference of colour and smell, a WFP staff
member cooked a sample of the fortified rice distributed to participants which was
drawn by an external inspection agent in June 2013. The sample was cooked in
February 2014 through the absorption method. The rice was noted to be an
acceptable cream colour, however, a faint smell was perceptible during cooking. It
22
was noted that a possible cause of the smell may come from the rice the fortified
kernels blended with rather than the fortified kernels itself. Typically, rough rice goes
through a parboiling process where it is soaked in water for 24 hours or more at
ambient temperature (Juliano BO 1993). If the water is not changed every 12 hours
the rice tends to absorb odours; such instances of re-using water have been noted in
some rural areas of Bangladesh.
Changes in health
Evidence suggests that fortified rice with single or multiple micronutrients is effective
in mitigating micronutrient deficiencies with no toxic effects (PATH 2013). In this
study, more than half of the participants who were interviewed reported an
improvement in health following consumption, including less morbidity, weight gain,
improved appetite, and so on. Logically, these findings were mostly reported by
participants from Kurigram Sadar (52%) who had received the pushti chal for 3
months (in most cases), than participants from Satkhira Sadar (15%) who had only
received pushti chal for one month.
A negligible number of participants (about 1%) reported mild, and temporary ill health
which was related to the consumption of fortified rice, although it is uncertain whether
this was due to consumption of the pushti chal or not, noting it could be due to the
quality of the received rice overall, other foods consumed, or another cause entirely.
In all but one case symptoms had disappeared by the time of survey.
Community acceptance of pushti chal
As a whole, the bulk of the respondents in Kurigram Sadar and the majority in
Satkhira Sadar determined that pushti chal would be accepted by their community.
Open answers were collected to determine why, with more than three quarters of
respondents in Kurigram Sadar referring to the nutritional value of fortified rice as well
as its better quality, while in Satkhira Sadar, most respondents assumed that the
local people would accept fortified rice as it had a better taste and smell. Further
analyses confirm that the regional differences may reflect the better take-up of the
awareness messaging in Kurigram Sadar. As the majority of respondents in Satkhira
Sadar stated they did not receive awareness messages about pushti chal, it can be
assumed that participants in this region were less aware about the nutritional benefits
and more readily identified the positive tangible aspects of the fortified rice as their
reason for preference.
Willingness to buy
In this study, respondents were found to be price sensitive. While more than 90%
stated that they would buy pushti chal over normal rice if it was available in market,
their willingness to buy the fortified rice dropped when the price was raised above
normal rice, even if they perceive it to be of better quality or to be more nutritious.
The proportion of respondents willing to buy fortified rice at a higher price dropped as
the price increased. Overall about 15% of the respondents who indicated they would

23
purchase if available in market would buy if the increased price was marginal, i.e. 1-2
BDT/kg more, and among the respondents from Kurigram 18% indicated they would
purchase at this marginal increase in price.
As the surveyed households are from the lower income bracket, face food shortages,
and have low purchasing power their priority is to purchase enough food to satisfy
their hunger, while nutritional value is of secondary importance. The findings are
reflective of this, in that households suffering from food shortages at any time in the
preceding 12 months were less likely to buy fortified rice at a higher than normal rice
market price.
On the other hand, it was found that respondents who received awareness
messages about pushti chal were twice as likely to buy pushti chal, even at a higher
price. This implies that counselling and awareness messages had a positive impact
on motivation and behaviour. The VGD participants were also significantly more likely
(twice as much) to buy pushti chal at the higher price in comparison to the VGF
participants. The finding may be related to the fact that VGD beneficiaries received
training on income generating activities in addition to the rice ration and awareness
messages, whereas, VGF participants receive only rice. The programme differences
may lead to a number of enhancing factors, such as increased purchasing power,
nutrition knowledge, or another motivation for the VGD participants’ willingness to
purchase fortified rice at higher price compared to the VGF participants. Logically,
literacy status of the household head was also found to be a significant factor in
influencing respondents’ motivation as these people were capable of reading the
messages from the leaflets, and wider, and therefore, more informed by the benefits
of fortification.
4.2 Conclusions
Overall, the findings of this research are conclusive, in that the large majority of the
sampled respondents from the VGD programme in Kurigram Sadar and the VGF
programme in Satkhira Sadar accept pushti chal. This was found, regardless of any
differences in colour, taste or smell between fortified rice and normal rice.
Impressively, households also reported improvements in health which were attributed
to the nutritional benefit from consuming pushti chal. A strong level of acceptance
was revealed, with the majority of respondents indicating that they would purchase
fortified rice over normal rice if it was available in the market at the same price as
normal rice.
Critical factors affecting the acceptance of fortified rice include the take-up of the
awareness messages provided through the accompanying information leaflets and
direct verbal awareness raising of the participants. The modality of awareness
messaging is critical. VGD participants with a greater level of contact with NGO
officials and households headed by someone with a higher level of literacy were
found to be more likely to accept fortified rice than participants enrolled in VGF, or
with less literate household heads. This is specifically reflected in perceived
preference of the taste and smell of the fortified rice, and on the willingness to buy
24
pushti chal, even if the price is higher. It is possible that the awareness messaging
also assisted to reinforce the application of the recommended cooking method (i.e.
absorption, as seen in Kurigram Sadar), however, regional differences in traditional
cooking may also have impacted. Therefore, comprehensive awareness raising on
the fortified rice, involving both verbal messages and counseling/real life examples
might be useful to build understanding and motivate the consumption of fortified rice. If marketing the rice to consumers with an economic profile similar to the VGD and
VGF participants, a subsidized price might need to be considered.
It should be noted that the research findings are limited to the socioeconomic profile
of the sampled respondents, therefore, the findings cannot be readily generalized to
the larger population of Bangladesh, or beyond.
4.3 Recommendations
Awareness messaging involving different modalities for delivery (pictorial, verbal,
written, and counseling, and real examples) might be most effective to build
knowledge and motivate for the consumption of fortified rice over normal rice.
A subsidized price would be required for people with a lower socioeconomic
profile to purchase the fortified rice in the market.
A larger scale trial across different socioeconomic profiles may provide more
generalizable findings if aiming to market the rice to the general public.

25
References
Angeles-Agdeppa I, Saises M, Capanzana M, Juneja LR, Sakaguchi N (2011). Pilot-scale
commercialization of iron-fortified rice: effects on anemia status. Food Nutr Bull. 32(1):3-12.
Black RE, Allen LH, Bhutta ZA et al. (2008). Maternal and child under nutrition: global and
regional exposures and consequences. The Lancet; 371: 243-60.
Beinner MA, Velasquez-Meléndez G, Pessoa MC and Greiner T. (2010). "Iron-Fortified Rice Is
As Efficacious As Supplemental Iron Drops in Infants and Young Children". Journal of Nutrition
(140): 49–53.
Bhutta ZA, Das JK, Rizvi A, Gaffey MF, Walker N, Horton S, Webb P, Lartey A, Black RE;
Lancet Nutrition Interventions Review Group; Maternal and Child Nutrition Study Group. (2013).
Evidence-based interventions for improvement of maternal and child nutrition: what can be
done and at what cost? Part of the 2013 Lancet Series on Maternal and Child Undernutrition.
The Lancet 382 (9890): 452-77. doi:10.1016/S0140-6736(13)60996-4. PubMed: 23746776.
Copenhagen Consensus 2008 Outcomes. Copenhagen Consensus website. Available at:
www.copenhagenconsensus.com/Default.aspx?ID=953.
Dexter PB (1998). Rice fortification for developing countries, USAID opportunities for
micronutrient interventions program. Available at: http://pdf.usaid.gov/pdf_docs/
PNACD279.pdf. (Accessed on 10 March, 2014)
DSM and Buhler (n.d.). Mutririce Process: A Breakthrough in rice fortification. Available at:
www.buhlergroup.com/global/en/services/nutrition-solutions/nutririce.htm. (Accessed on 30
Dec, 2013)
FAO and ILSI (1997). Food and Agriculture Organization of the United Nations
and International Life Sciences Institute. 1997. Preventing micronutrient malnutrition: a guide to
food-based approaches. Why policy makers should give priority to food-based strategies.
Food and Agriculture Organization; 1997 Available from: www.fao.org/DOCREP/x0245e
/x0245e01.htm
FFI (Flour Fortification Initiative), GAIN, MI, USAID, The World Bank and UNICEF (2009).
Investing in the future: A united call to action on vitamin and mineral deficiencies. Global
Report. Available at: www.unitedcalltoaction.org/documents/Investing_in_the_future.pdf.
(Accessed on 10 Dec, 2011).
Hosmer DW, Lemeshow S and Sturdivant RX (2013). Model-building and strategies and
methods for logistic regression. Applied logistic regression, Third edition, Wiley Series in
Probability and Statistics. John Wiley and Sons Inc; (Online publication).
Hosmer, Jr., D. W., Lemeshow, S. and Sturdivant, R. X. (2013) Model-Building Strategies and
Methods for Logistic Regression, in Applied Logistic Regression, Third Edition, John Wiley &
Sons, Inc., Hoboken, NJ, USA. doi: 10.1002/9781118548387.ch 4
icddr,b, UNICEF, Bangladesh, GAIN and Institute of Public Health and Nutrition (2013).
National Micronutrients Status Survey 2011-12. Dhaka: icddrb.
Juliano BO (1993). Rice in human nutrition. FAO Food and Nutrition Series. No. 26.IRRI and
FAO. Rome. Available at: www.fao.org/docrep/t0567e/t0567e0h.htm (Accessed on 30 Dec,
2013)
26
Kunz R (2009). Technical profile: A Breakthrough in rice fortification. Available at:
www.buhlergroup.com/global/en/services/nutrition-solutions/nutririce.htm. (Accessed on 30
Dec, 2013)
Mozumder MAK, Islam MM, Alam S, and Rahman M (2009). Transparency and accountability
for ensuring food security in Bangladesh: A Study on field institutions. Final Report CF #
3/07.Department of Public Administration.
PATH (2013).Ultra rice technology research summary table. Available at:
www.path.org/publications/files/MCHN_u_r_res_sum_tbl.pdf. (accessed on 31 Dec, 2013)
Rahman HZ, Choudhury LA and Ali KS (2011). A PPRC-UNDP research initiative social safety
nets in Bangladesh. Dhaka: Power and Participation Research Centre (PPRC).
Swaminathan MS (1985). Essentials of food and nutrition, Vol.1. India: Bangalore Print and
Publishing Company.
UNS: SCN (2009). United Nations System: Standing Committee on Nutrition (2009).
Landscape analysis on countries readiness to accelerate action in nutrition. SCN News, No:
37, ISSN:1564-3743. Available at:
www.unscn.org/layout/modules/resources/files/scnnews37.pdf. (Accessed on 22 July, 2012)
USAID, A2Z, AED, IFT (2008). Rice Fortification in Developing Countries: A Critical Review of
the Technical and Economic Feasibility.
WFP, Bangladesh, Vulnerable Group Development (VGD) (2006). Available at:
www.documents.wfp.org/stellent/groups/public/documents/liaison_offices/wfp120731.pdf.
(Accessed on 03 Dec, 2013)
WHO, FAO, UNICEF, GAIN, MI, and FFI (2009). Recommendations on wheat and maize flour
fortification. Meeting report: Interim consensus statement. Geneva: World Health Organization.
Available at: www.who.int/nutrition/publications/micronutrients/wheat_maize_fort.pdf
(Accessed on 16 February, 2014)

27
Annex A: Consent Form and Questionnaire (English version)
INFORMED CONSENT
Research and Evaluation Division, BRAC
Study on Acceptability of Pushti Chal (Fortified Rice) - 2013
Assallamu-alaikum/Aadab,
I am ______________ from BRAC. BRAC, in collaboration with the United Nations World Food
Programme, would like to know your opinion on the ‚Pushti chal‛ or fortified rice, which you
have been receiving under the Government’s VGD programme (Kurigram) OR VGF programme
(Satkhira). The information you give us will help us in the scale-up of fortified rice in
Bangladesh.
This survey will take less than 20 minutes. Your participation is completely voluntary and there
is no personal benefit for participation in this research. If you do not wish to answer a question,
or wish to quit the survey, you are allowed to do so at any time you like with no effect on your
current or future participation in safety net programmes.
If you agree to participate the information will be used for research purposes only. All
information collected during the interview will be kept confidential by the researcher. You will
not be quoted anywhere nor will your name be identified in reports or publications.
If you have any questions about this study, you may call: [880 2 9881265, Ext 3719]
Participant’s Name: ___________________ Identification Number:___________________
May I begin the interview now?
For researcher: Check one: Has agreed Has not agreed
Signature/ thumb print of Participant: ___________________________________
Interviewer’s Name: ________________________ Interviewer’s ID:
Checked by: _______________________________ Checker’s ID:
2

28
Questionnaire
Acceptability of Pushti Chal (A collaborative project with WFP)
Section – A: Socio-economic and Demographic Information
Respondents: Female VGD/VGF Participants
Household Information Interview Information
Household No:
HH Head Name:
Name of
Village:
Respondent’s Name :
Name of Union: Respondent’s VGD/VGF
Programme ID:
Name of
Upazila:
Date of data collection:
Q.
No.
Question Coding categories Remarks
1. Have you received the ‚Pushti chal‛? 1=Yes
2=No
(If no, stop
interviewing)
2. How many members are there in your
household?
persons
Q3.Family members Information
(Insert code from table below where indicated)
Line
No
Name of
family
members
Gender
(insert
code)
Age Marital
Status
(insert
code)
Health
Condition
(insert
code)
Can
write &
read
(1=Yes,
2=No)
Class
Passed
Information
(insert
code)
Occupation
(insert code)
Years Month Main Secondary
1.
2.
3.
4.
5.
6.
7.
8.
9.
10. N. B. Circle the line. no of respondent

29
Gender
code
Marital Status
Code
Health
condition
Code
Class Passed Code Occupation code
1=
Female
2= Male
1 =
Unmarried
2 = Married
3 =Separated
4 = Divorced
5= Widow
1=Normal
2=Ill
3=Pregnant
4=Lactating
5=If, pregnant
and lactating
Numerical value of Class
Passed
11= HSC/Alim
12=Degree/BA/Hons/MBBS/E
ngineer/LLB/Fazil
13= MA/Masters/ Kamil
50= Religious education
00=Had attended in school but
did not pass any class
77=Never attended in school
88=Don’t know
99=Not applicable
1 =
Agriculture
2= Business
3 = Service
4 = Day
labour
5 = Lives
abroad
6 = Housewife
7 = Driver
8 = Student
9 = Unemployed
(>6 yr)
10 = Ready Made
Garments worker
11 =
Rickshaw/Van
Pullar
12 = Construction
labour
13 = Others
99=Not applicable
(<6 yr)
Q.
No.
Question Coding categories/Answers Remarks
4. What is your average monthly
household income? (Calculate
average income: divide total income
of last 1 year by 12)
Tk. …………….
5. What is the major source of your
household income?
1 = Labor ,2 = Agriculture,
3 = Business, 4 = Service, 5 =
Cattle/Poultry rearing, 6 = Begging
7= Others (specify)……..
6. How frequently do you face food
(rice) shortage in the household?
(During last 1 year)
1 = Never, 2 = Seldom (≤1 month in
a year), 3 = Sometimes, 4 = Almost
always, 5 = Always
If never,
skip to
Q8
7. How many months did you have
food (rice) shortage? (During last 1
year)
-----------month
8. If rice is adequate for household,
what is the major source of having it?
(During last 1 year)
1 = Home production, 2 = Purchase,
3 = Begging, 4 = As wage/ In Kind
5 = Others (Specify)------
Multiple
answers
possible

30
Section – B: Assessment of Taste, Awareness and Acceptability
Respondents: Female VGD/VGF Participants
Q.
No.
Question Coding categories/Answers Remarks
Awareness, Cooking and Eating Practices of Pushti Chal
9. Have you received any
information about the pushti chal?
1=Yes, 2=No If no,
skip to
Q12
10. If yes, from which source? 1= UP chairman/member, 2= NGO workers
3=WFP officers, 4= Leaflet, 5= Others
Specify---
11. What do you know about
Pushti chal?
1 = It has better nutritional value than normal
rice
2 = It is good for health
3 = How to cook it, 4 = How to store it
5 = It is suitable for everyone
6 = Others (Specify)------------
Multiple
answers
possible.
12. How did you cook the Pushti Chal?
1 = Discard the excess water after cooking
2= Absorb the whole water during cooking
13. Normally, how do you cook
your regular rice?
1 = Discarded the excess water after
cooking
2= Absorbed the whole water during
cooking
14. How was the quality of
general rice?
1 = Acceptable, 2 = Somewhat acceptable
3 = Not acceptable
15. How many times have you
received Pushti chal?
______ times
16. When did you last get the
Pushti chal?
Month ______________
17. How much Pushti chal did
you receive last time?
_______kg
18. What did you do with the
Pushti chal you received last
time?
1=Eaten, 2=Partly eaten, 3=Not eaten If eaten,
skip to
Q-20
19. If not or partly eaten, what did
you do with the pushti chal?
1= Sold it to meet urgent non-food needs
2 = Sold it to buy other food items
3 = Shared with relatives or neighbors
4= Didn’t like it/haven’t used it
5= Bird/Animal Feeding
6= Others (Specify)……….
Multiple
answers
possible
20. During the period you have
been receiving Pushti chal, which rice do you cook?
1 = Only Pushti chal 2 = Pushti chal & normal rice mixed
3 = Pushti chal & normal rice separately
4 = Others (Specify)……….
21. Did all the members in your
household eat pushti chal?
1=Yes, 2=No If yes,
skip to
Q-24

31
22. If no, who didn’t eat pushti chal?
Group Line no. Multiple
answers
possible 1 = Small children (<5y)
2 = Young children (5-10 y)
3 = Adolescent boys (11-19 y)
4 = Adolescent girls (11-19 y)
5 = Adult males and non-
pregnant females (≥20y)
6 = Pregnant/lactating females
23. If no, why didn’t members eat
pushti chal?
Reasons:
1._______________________
2._______________________
3._______________________
Record
the major
three
reasons
(rank)
24. What dishes/types of food did
you eat with the pushti chal for your last lunch?
1 = Meat or fish curry, 2 = Dried fish mash
3 = Potato mash/other vegetables mash
4 = Vegetable curry, 5 = Dal
6 = Plain rice (no curry)
7 = Others (specify)---------------
Multiple
answers
possible
Taste and Other Traits of Pushti Chal
25. Have you noticed any
difference in color of pushti chal after it is cooked
compared to uncooked rice?
1 = Yes different to normal rice (Specify the
color)---------------------------
2 = No, same as normal rice
If no,
skip to
Q-27
26. If yes, is the colour of the
pushti chal acceptable to
you?
1 = Acceptable, 2 = Somewhat acceptable
3 = Not acceptable
27. Have you noticed any
difference in smell of the
cooked pushti chal compared
to normal rice?
1 = Yes, different to normal rice
2 = No, same as normal rice If no,
skip to
Q-29
28. If yes, is the smell of the
pushti chal acceptable to
you?
1 = Acceptable, 2 = Somewhat acceptable
3 = Not acceptable
29. How did the pushti chal taste?
1 = Same as normal rice
2 = Better than normal rice
3 = Poorer than normal rice
4 = Don’t know
5 = Others (specify)____________
Acceptance of Pushti Chal & Willingness to Buy
30. Do you think people in your
locality will accept this rice?
1 = Yes, 2 = No,
3 = Don’t know If no or
don’t
know,
skip to
Q-32
31. Why do you think people in
your locality will accept it?
Reason: _________________________
32. Beside pushti chal did you
purchase normal rice? (During
last 1 month before Pushti Chal finished)
1=Yes, 2=No If no,
skip to
Q-34

32
33. If yes, how much normal rice
do you purchase in a month?
(During last 1 month)
_______kg
34. If available in market, would
you be ready to buy pushti chal instead of normal rice?
1 = Yes, 2 = No If no,
skip to
Q-39
35. Will you buy the pushti chal if the price is more than the
price of the normal rice?
1 = Yes, 2 = No
36. Will you buy the pushti chal if the price is a little bit more
than the price of the normal
rice?
1 = Yes, 2 = No
37. How much more would you
pay for pushti chal?
1 = 10 tk/kilogram more than normal rice
2 = 5 tk/kilogram more than normal rice
3 = 2-3 tk/kilogram more than normal rice
4 = 1-2 tk/kilogram more than normal rice
38. Will you buy the pushti chal if the price is same as the price
of the normal rice?
1 = Yes, 2 = No
39. Will you buy the pushti chal if the price is less than the price
of the normal rice?
1 = Yes, 2 = No
Consumption pattern of Pushti chal of different age groups and reason
40. When you last received the rice, did your household members eat more/less/normal
pushti chal than normal rice?
Household members Line No. Consumption pattern: If household
members eat more/less/normal
pushti chal than normal rice (insert
code)
Reason
(insert
code)
1 = Small children (<5y)
2 = Young children (5-10 y)
3 = Adolescent boys (11-19 y)
4 = Adolescent girls (11-19 y)
5 = Adult males and non-
pregnant females (≥20y)
6 = Pregnant/ Lactating
women

33
Consumption pattern Code Reasons Code
1 = More than normal rice
2 = Less than normal rice
3 = Same as normal rice
1 = Did not like the color
2 = Did not like the smell
3 = Did not like the taste
4 = Not used to the rice
5 = General rice was not tasty
6 = Caused or aggravated
indigestion
7 = Caused other health
problems
8 = Liked the smell of rice
9= Liked the taste of rice
10 = More appetite than
normal
11 = Others (specify)
Changes in health condition due to Pushti Chal consumption
41. Did any member of your
household experience any
change in health condition after
consuming pushti chal?
1 = Yes, 2 = No If no,
skip to
Q-46
42. If yes, who? Group Line no Multiple
replies
possible 1 = Small children (<5y)
2 = Young children (5-10 y)
3 = Adolescent boys (11- 9y)
4 = Adolescent girls (11-19y)
5 = Adult males and non-
pregnant females (≥20y)
6 = Pregnant/lactating women
43. What change in health did they
experience after eating pushti chal?
1 = Feel better than before (specify)------
2 = Feel sick (specify)_______________
3 = Others (specify) _______________
If feel
better
Skip to
Q46
44. If feel sick, who became sick? Group Line no Multiple
replies
possible 1 = Small children (< 5y)
2 = Young children (5-10 y)
3 = Adolescent boys (11-19 y)
4 = Adolescent girls (11-19 y)
5 = Adult males and non-
pregnant females (≥20 y)
6 = Pregnant/lactating females
45. Is he/she cured/better by now? 1 = Yes, 2 = No
46. Overall how will you evaluate the
rice?
1 = Excellent, 2 = Good,
3 = Normal (No different from daily rice)
4 = Slightly bad, 5 = Very bad,
6 = Don’t know,
7 = Others (specify) ________
47. Respondent’s perception (opinion) overall about the pushti chal: _________________________________________________________________________________
_________________________________________________________________________________
_________________________________________________________________________________

34
Annex B. Additional tables
Table B1. Pearson correlation matrix between household characteristics variable
Literacy
status of HH
head
Food security
status
Level of
knowledge
received
Household
income
Location Acceptance of
taste
Occupation of
HH head
Literacy status of
HH head 1 -.082* .044 -.120** -.153** .054 .157**
Food security
status -.082* 1 .158** .180** -.276** -.025 -.155**
knowledge
received .044 .158** 1 .037 -.682** -.066 .014
Location -.153** -.276** -.682** -.087* 1 -.118** -.020
Acceptance of
taste .054 -.025 -.066 .080* -.118** 1 .014
Occupation of HH
head .157** -.155** .014 -.234** -.020 .014 1
* Correlation is significant at the 0.05 level,** correlation is significant at the 0.01 level .
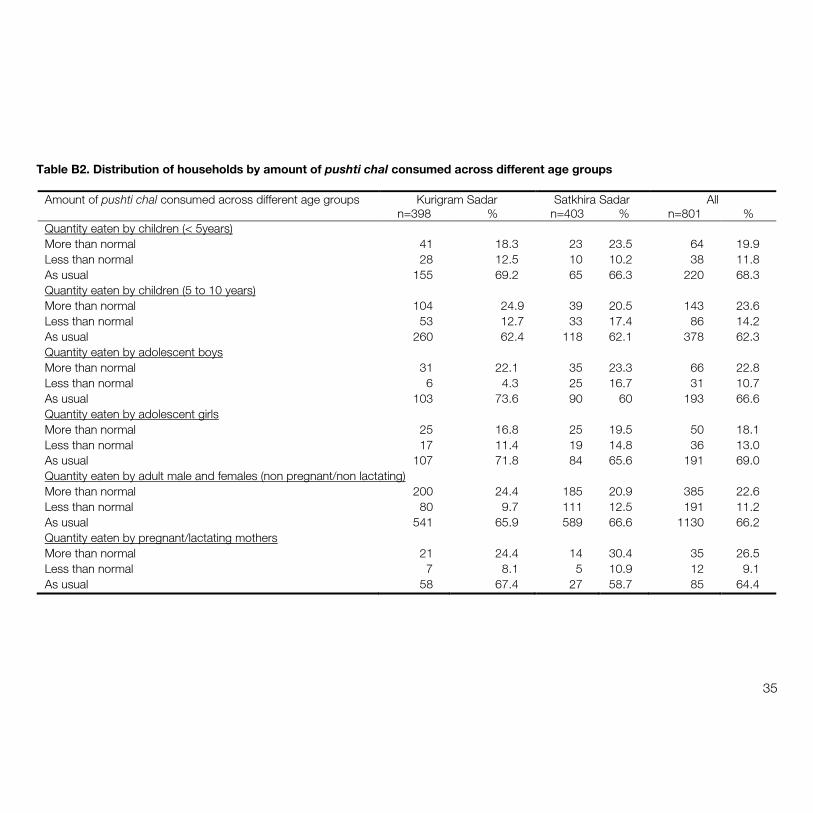
35
Table B2. Distribution of households by amount of pushti chal consumed across different age groups
Amount of pushti chal consumed across different age groups Kurigram Sadar Satkhira Sadar All
n=398 % n=403 % n=801 %
Quantity eaten by children (< 5years)
More than normal 41 18.3 23 23.5 64 19.9
Less than normal 28 12.5 10 10.2 38 11.8
As usual 155 69.2 65 66.3 220 68.3
Quantity eaten by children (5 to 10 years)
More than normal 104 24.9 39 20.5 143 23.6
Less than normal 53 12.7 33 17.4 86 14.2
As usual 260 62.4 118 62.1 378 62.3
Quantity eaten by adolescent boys
More than normal 31 22.1 35 23.3 66 22.8
Less than normal 6 4.3 25 16.7 31 10.7
As usual 103 73.6 90 60 193 66.6
Quantity eaten by adolescent girls
More than normal 25 16.8 25 19.5 50 18.1
Less than normal 17 11.4 19 14.8 36 13.0
As usual 107 71.8 84 65.6 191 69.0
Quantity eaten by adult male and females (non pregnant/non lactating)
More than normal 200 24.4 185 20.9 385 22.6
Less than normal 80 9.7 111 12.5 191 11.2
As usual 541 65.9 589 66.6 1130 66.2
Quantity eaten by pregnant/lactating mothers
More than normal 21 24.4 14 30.4 35 26.5
Less than normal 7 8.1 5 10.9 12 9.1
As usual 58 67.4 27 58.7 85 64.4

T : 88-02-9881265, 8824180-87F : 88-02-8823542, 8823614W : www.brac.net
BRAC Research and Evaluation DivisionBRAC Centre, 75 MohakhaliDhaka 1212, Bangladesh
Acceptability of Fortified Rice by Participants of Government Social Safety Net Programmes