accelerating sequence-to-graph alignment on heterogeneous
TRANSCRIPT

50th International Conference on Parallel Processing (ICPP)
Accelerating Sequence-to-Graph Alignment on
Heterogeneous Processors
Zonghao Feng, Qiong Luo
Department of Computer Science and EngineeringThe Hong Kong University of Science and Technology
{zfengah,luo}@cse.ust.hk
August, 2021
1 / 15
Sequence-to-Graph Alignment
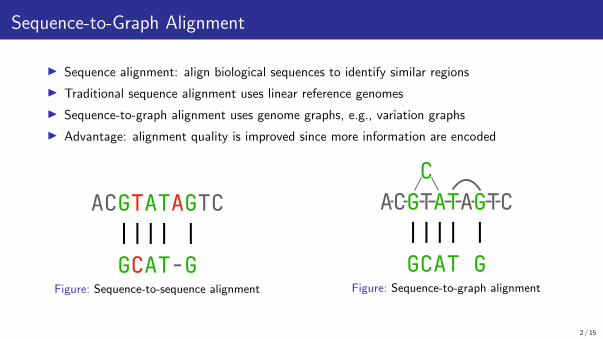
▶ Sequence alignment: align biological sequences to identify similar regions
▶ Traditional sequence alignment uses linear reference genomes
▶ Sequence-to-graph alignment uses genome graphs, e.g., variation graphs
▶ Advantage: alignment quality is improved since more information are encoded
ACGTATAGTC
GCAT-G|||| |
|
Figure: Sequence-to-sequence alignment
ACGTATAGTC
GCAT G|||| |
C
Figure: Sequence-to-graph alignment
2 / 15
Challenges
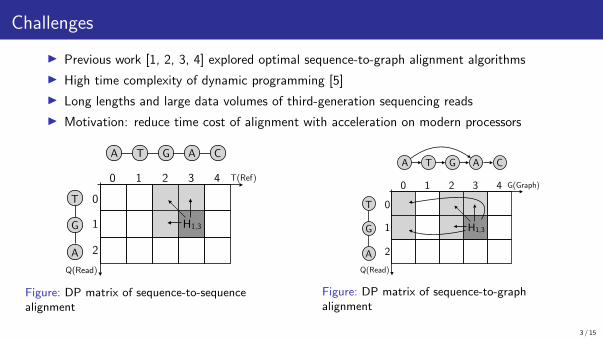
▶ Previous work [1, 2, 3, 4] explored optimal sequence-to-graph alignment algorithms
▶ High time complexity of dynamic programming [5]
▶ Long lengths and large data volumes of third-generation sequencing reads
▶ Motivation: reduce time cost of alignment with acceleration on modern processors
4
2
1
0
3210
Q(Read)
T(Ref)
x
T
G
A
A T G A C
H1,3
Figure: DP matrix of sequence-to-sequencealignment
4
2
1
0
3210
x
x
A T G A C
T
G
A
H1,3
Q(Read)
G(Graph)
Figure: DP matrix of sequence-to-graphalignment
3 / 15

Our Work
▶ We propose HGA (Heterogeneous Graph Aligner), a sequence-to-graph alignment
algorithm parallelized on both the CPU and GPUs.
▶ On the CPU, we adopt inter-sequence vectorization approach and apply optimizations for
frequent structures in genome graphs.
▶ On the GPU, we propose a GPU-friendly graph data structure GCSR (Genome CSR) to
shrink data size and reduce global memory loads, and apply architecture-aware
optimizations to increase memory locality and throughput.
▶ Our experimental results show that HGA outperforms the state-of-the-art
sequence-to-graph aligner by up to 15.8 times, and demonstrates strong scalability on
both the CPU and GPUs.
4 / 15

Overview
▶ CPU main thread handles:▶ Input genome graph and reads▶ Dispatch reads to CPU and GPU workers▶ Manage memory transfer between the
CPU and GPUs▶ Collect alignment results for output
▶ CPU workers adopt inter-sequence SIMD
parallelization, i.e., each SIMD lane
corresponds to one read
▶ Multiple GPUs are utilized for alignment,
each GPU thread aligns one read
Main threadGraph
Reads
CPU worker threads
GPU #0
GPU #1
GPU #N
...
CPU
GPU threads
Figure: Overview of HGA’s workflow
5 / 15

Parallelization on GPUs
▶ Each thread in a thread block is
responsible for aligning one read
to the genome graph.
▶ The global memory stores the
reference genome graph and a
batch of reads.
▶ The shared memory of each
block is used as the buffer of the
dynamic programming matrix to
increase memory locality.
Global Memory
Thread #0GraphThread #1
Thread #2
Thread #N
Block #0
Block #1
Block #2
...
Shared Memory
...
...
...
...
...
{Reads 0...N
Grid
Figure: The design of HGA on GPU
6 / 15

Optimizations for Frequent Structures
Single-nucleotide polymorphism (SNP)
▶ A SNP is a single substitution of a base in
the genome.
▶ It is the most common structure in
variation graphs.
Optimization
▶ We store DNA bases in the power of 2 and
merge the original base and the variant
with bitwise or.
▶ We can check if there is at least one
matched base between the read and the
SNP using bitwise and. [6]
i-3
i-1
i-2
idin(i)=2
din(i-1)=1 dout(i-1)=1
din(i-2)=1 dout(i-2)=1
Figure: A SNP in genome graph
Example: ’A’=(0001)2, ’C’=(0100)2.
Merge SNP: ’AC’ = (0001)2 or (0100)2 = (0101)2.
’C’ matches ’AC’: (0100)2 and (0101)2 = (0100)2 > 0
7 / 15
Genome CSR (GCSR) Graph Structure
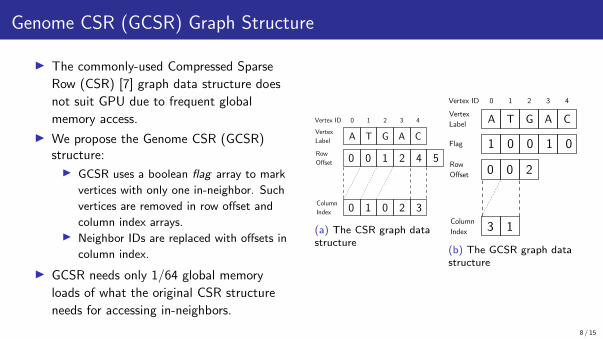
▶ The commonly-used Compressed Sparse
Row (CSR) [7] graph data structure does
not suit GPU due to frequent global
memory access.
▶ We propose the Genome CSR (GCSR)structure:▶ GCSR uses a boolean flag array to mark
vertices with only one in-neighbor. Such
vertices are removed in row offset and
column index arrays.▶ Neighbor IDs are replaced with offsets in
column index.
▶ GCSR needs only 1/64 global memory
loads of what the original CSR structure
needs for accessing in-neighbors.
0 1 0 2 3
0 0 1 2 4 5
A T G A CVertex Label
Row Offset
Column Index
0 1 2 3 4Vertex ID
(a) The CSR graph datastructure
3 1
0 0 2
A T G A CVertex Label
Row Offset
Column Index
0 1 2 3 4Vertex ID
1 0 0 1 0Flag
(b) The GCSR graph datastructure
8 / 15

GPU Memory Access Optimizations
▶ To achieve coalesced access of global
memory, we group the bases at the
same position in different reads.
▶ The shared memory in each thread
block is equally divided for each
thread to use. To avoid shared
memory bank conflicts, we reorganize
the data in a stripe layout, so that we
can utilize all the shared memory
banks and maximize memory
throughput.
0 1 2 3 4 5 6 7 ... 29 30 31Bank IDdp[0][2]
dp[1][2]
dp[31][2]
Thread #0Thread #1
Thread #31
...
dp[2][2]Thread #2
(a) The original layout. Bank conflict occurs on bank #2.
0 1 2 3 4 5 6 7 ... 29 30 31Bank ID
dp[0][2] dp[1][2] dp[31][2]
Thread #0Thread #1
Thread #31
...
dp[2][2]Thread #2
(b) The optimized layout. No bank conflict occurs.
Figure: Comparison of shared memory access patterns
9 / 15
Overall Performance
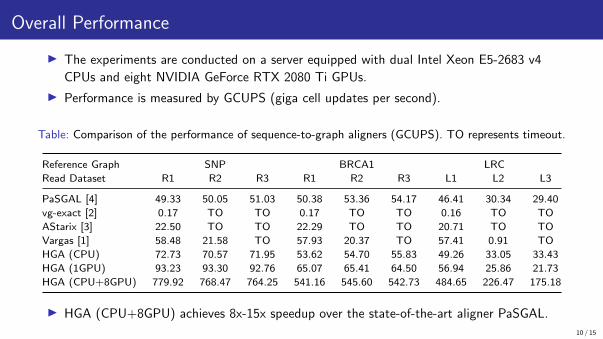
▶ The experiments are conducted on a server equipped with dual Intel Xeon E5-2683 v4
CPUs and eight NVIDIA GeForce RTX 2080 Ti GPUs.
▶ Performance is measured by GCUPS (giga cell updates per second).
Table: Comparison of the performance of sequence-to-graph aligners (GCUPS). TO represents timeout.
Reference Graph SNP BRCA1 LRC
Read Dataset R1 R2 R3 R1 R2 R3 L1 L2 L3
PaSGAL [4] 49.33 50.05 51.03 50.38 53.36 54.17 46.41 30.34 29.40
vg-exact [2] 0.17 TO TO 0.17 TO TO 0.16 TO TO
AStarix [3] 22.50 TO TO 22.29 TO TO 20.71 TO TO
Vargas [1] 58.48 21.58 TO 57.93 20.37 TO 57.41 0.91 TO
HGA (CPU) 72.73 70.57 71.95 53.62 54.70 55.83 49.26 33.05 33.43
HGA (1GPU) 93.23 93.30 92.76 65.07 65.41 64.50 56.94 25.86 21.73
HGA (CPU+8GPU) 779.92 768.47 764.25 541.16 545.60 542.73 484.65 226.47 175.18
▶ HGA (CPU+8GPU) achieves 8x-15x speedup over the state-of-the-art aligner PaSGAL.
10 / 15
Impact of Read Length
128 512 2048 8192 32768Read length
0
20
40
60
GC
UP
S
PaSGAL
AStarix
Vargas
HGA (CPU)
HGA (GPU)
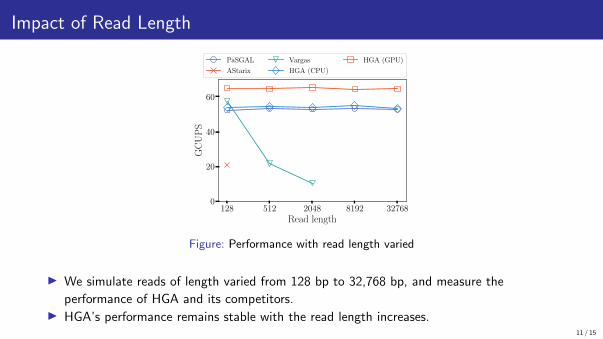
Figure: Performance with read length varied
▶ We simulate reads of length varied from 128 bp to 32,768 bp, and measure the
performance of HGA and its competitors.▶ HGA’s performance remains stable with the read length increases.
11 / 15
Scalability on a single GPU
1 2 4 8 16 34 68 136Number of thread blocks
1
4
16
64
GC
UP
S
R1
L1
R2
L2
R3
L3
(a) Performance with number ofCUDA thread blocks varied
1 2 4 8 16 32 64 128Number of threads per block
1
4
16
64
GC
UP
S
R1
L1
R2
L2
R3
L3
(b) Performance with number ofCUDA threads per block varied
# threads per block1248163264128
#th
read
bloc
ks
12
4816
3468134
GC
UP
S
0.001
0.01
0.1
1.0
10.0
100.0
(c) Performance with the totalnumber of threads varied
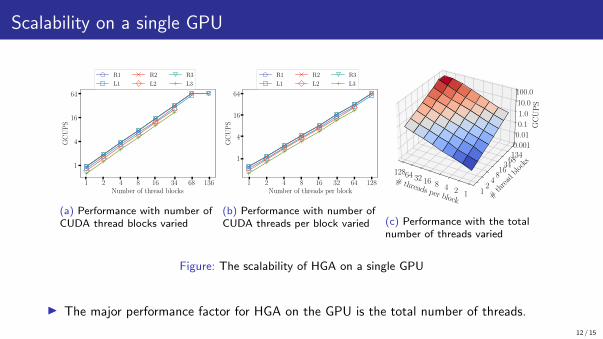
Figure: The scalability of HGA on a single GPU
▶ The major performance factor for HGA on the GPU is the total number of threads.
12 / 15

Scalability on multiple GPUs
1 2 3 4 5 6 7 8Number of GPUs
0
100
200
300
400
500
600
GC
UP
S
R1
L1
R2
L2
R3
L3
Figure: Performance with number of GPUs varied
▶ HGA achieves nearly linear speedups with the number of GPUs. Specifically, using 8 GPUs
is 7.8 times faster than using 1 GPU.
13 / 15

Thank you!
14 / 15

References I
[1] Charlotte A. Darby et al. “Vargas: Heuristic-Free Alignment for Assessing Linear and Graph ReadAligners”. en. In: Bioinformatics 36.12 (2020), pp. 3712–3718. issn: 1367-4803.
[2] Erik Garrison et al. “Variation Graph Toolkit Improves Read Mapping by Representing Genetic Variation inthe Reference”. en. In: Nature Biotechnology 36.9 (2018), pp. 875–879. issn: 1087-0156, 1546-1696.
[3] Pesho Ivanov et al. “AStarix: Fast and Optimal Sequence-to-Graph Alignment”. en. In: 24th AnnualInternational Conference on Research in Computational Molecular Biology. RECOMB 2020. Padua, Italy:Springer, 2020, pp. 104–119. isbn: 978-3-030-45257-5.
[4] Chirag Jain et al. “Accelerating Sequence Alignment to Graphs”. en. In: 2019 IEEE International Paralleland Distributed Processing Symposium. IPDPS 2019. Rio de Janeiro, Brazil: IEEE, 2019, pp. 451–461.isbn: 978-1-72811-246-6.
[5] Gonzalo Navarro. “Improved Approximate Pattern Matching on Hypertext”. en. In: Theoretical ComputerScience 237.1-2 (2000), pp. 455–463.
[6] Wei Quan, Bo Liu, and Yadong Wang. “SALT: A Fast, Memory-Efficient and SNP-Aware Short ReadAlignment Tool”. In: 2019 IEEE International Conference on Bioinformatics and Biomedicine. BIBM 2019.San Diego, CA, USA: IEEE, 2019, pp. 1774–1779.
[7] Yousef Saad. Iterative Methods for Sparse Linear Systems. Second. SIAM, 2003.
15 / 15