accelerating global ambition
TRANSCRIPT
Annual Report & Accounts 2021QinetiQ Group plc
QinetiQ Group plcAnnual Report & Accounts 2021
Accelerating global ambition
© Crown copyright 2013

Our purpose QinetiQ is dedicated to protecting lives, defending sovereign capability and securing the vital interests of our customers.
Who we are We are a leading science and engineering company operating primarily in the defence and security markets. We are an information, knowledge and technology based company with the breadth and depth of more than 6,500 highly dedicated employees.
What we do We apply our unique technical expertise across the product lifecycle, helping our customers to create, test and use defence and security capabilities. Not only do we develop cutting-edge technology and turn it into a capability, we also tell customers if that capability will work when it is critically needed and ensure they are trained and operationally ready to use it when it matters.
Anticipating the current, emerging and future threat environment and proactively understanding our customers’ needs to provide mission-led innovation is critical to our success.
See more online at www.QinetiQ.com
* Throughout this report FY21/2021 refers to QinetiQ’s financial year ended 31 March 2021.
** The report also refers to “Underlying” measures of performance. Definitions of the Group’s alternative performance measures can be found on page 183.

2020
2020
2020 2020
2019
2019
2019 2019
2021
2021
2021 2021£1,151.0m
£112.3m
£1,278.2m
£972.1m
£117.6m
£1,072.9m £133.2m
£776.4m
£114.8m
£911.1m £124.9m
2020 2020
2019 2019
2021 202122.1p 21.9p
£151.8m
20.0p 18.7p
19.7p 20.1p
Strategic report
02 About QinetiQ
04 Our stakeholders
06 Chairman’s statement
08 Chief Executive Officer’s review
10 Our business model
12 Trading environment
14 Market themes
16 Our growth strategy
18 Operating review
22 Chief Financial Officer’s review
26 Key performance indicators
30 Risk management
37 Longer-term viability assessment
37 Going concern statement
38 Stakeholder engagement
39 Responsible and sustainable business
48 Section 172 (1) statement
50 Non-financial information statement
Governance
55 An introduction from our Chairman
57 Governance framework
58 Board of Directors
60 Board activity
61 Board decision making
65 Purpose, values and culture
67 Stakeholder engagement
72 Division of responsibilities
75 Composition, succession and evaluation
75 Nominations Committee report
80 Director effectiveness
83 Audit, risk and internal control
85 Audit Committee report
92 Risk & Security Committee report
95 Directors’ remuneration report
97 Remuneration at a glance
100 Annual report on remuneration
113 Directors’ report
117 Independent auditors’ report
Financial statements
128 Consolidated income statement
129 Consolidated comprehensive income statement
129 Consolidated statement of changes in equity
130 Consolidated balance sheet
131 Consolidated cash flow statement
131 Reconciliation of movements in net cash
132 Notes to the financial statements
176 Company balance sheet
177 Company statement of changes in equity
178 Notes to the Company financial statements
Other information
180 Five-year financial summary
181 Additional financial information
182 Glossary
184 Shareholder information
Contents
Full operating capability on the LTPA
After a two-year transition period, we successfully reached full operating capability on the renegotiated LTPA contract, on schedule, with positive customer feedback.
Leveraging capabilities to drive growth
We won a number of strategically significant contracts in the period, demonstrating our ability to leverage our global expertise to drive UK and international growth.
Grown international revenue to 33% of Group
Supported by strong US business growth and continued organic growth in other international markets, international revenues increased to 33% of Group revenue.
Improved employee engagement
We adapted our ways of working in the midst of COVID-19 and continued to listen to our people to understand what matters to them, with employee engagement increasing by 6%.
Embedding sustainability into the business
We introduced a new sustainability KPI as part of our drive to embed sustainability into our strategy. We also made significant progress against our greenhouse gas emissions target.
Strategic portfolio optimisation
We completed the disposal of three non-core businesses (OptaSense, Boldon James and Commerce Decisions) and acquired Naimuri, a highly complementary advanced data analytics business.
Financial highlightsA strong financial performance, delivering our fifth consecutive year of revenue growth
Non-financial highlightsPositioning ourselves for long-term sustainable global growth
How we have performed
Underlying earnings per share
22.1p(FY20: 20.0p)
Statutory earnings per share
21.9p(FY20: 18.7p)
Statutory operating profit
£112.3m(FY20: £117.6m)
Revenue
£1,278.2m(FY20: £1,072.9m)
Underlying operating profit
£151.8m(FY20: £133.2m)
Orders
£1,151.0m(FY20: £972.1m)
1Annual Report & Accounts 2021
Strategic Report

Australia UK US
About QinetiQ
We are a global company delivering mission-led innovation around the worldOur home countries, where we have more than 500 people in-country are the UK, US and Australia. We also have a significant in-country presence in Canada, Germany and Belgium. Many of our facilities around the world are unique assets that are critical to maintaining national defence capabilities, and are often the only place where certain trials can take place.
74%
26%
17%
67%
Where we operate
Home countriesPriority countries
Revenue by divisionRevenue by customer location
UK £857.8mUS £215.6mAustralia £77.9mEurope £88.2mRest of world £38.7m
EMEA Services £939.9mGlobal Products £338.3m
6%
7%3%
Germany
2 QinetiQ Group plc
CanadaSites: 2 Employees: 76
Sites: 5 Employees: 532
Sites: 6 Employees: 638
Sites: 32 Employees: 5,368
BelgiumSites: 1 Employees: 156
Sites: 3 Employees: 111

How we are structuredWe report through two divisions; EMEA Services and Global ProductsWithin these two divisions our business units are aligned to customer domains or geographies.
Maritime & Land Delivers operational advantage to customers by providing independent research, evaluation and training services.
United StatesDevelops and manufactures innovative defence products specialising in robotics, autonomy and sensing solutions.
Cyber & InformationHelps customers respond to evolving threats based on our expertise in cyber security, secure communication networks and devices, intelligence gathering and training.
EMEA Products Provides research services and bespoke technological solutions developed from intellectual property spun out from EMEA Services. QinetiQ Target Systems is reported in EMEA Products.
Air & Space De-risks complex aerospace programmes by testing systems and equipment, evaluating the risks and assuring safety.
Space Products Develops small satellites, payload instruments, subsystems and ground station services.
International Our International business leverages our expertise and skills developed in the UK and applies them to opportunities in attractive markets globally.
Approximate revenue
£105mFY20: £100m
Approximate revenue
£250mFY20: £185m
Approximate revenue
£90mFY20: £105m
Approximate revenue
£225mFY20: £200m
Approximate revenue
£40mFY20: £25m
Approximate revenue
£360mFY20: £315m
Approximate revenue
£210mFY20: £120m
EMEA ServicesCombines world-leading expertise with unique facilities to generate and assure capability. It does this through capability integration, threat representation and operational readiness, underpinned by long-term contracts that provide good revenue visibility and cash generation.
Global productsDelivers innovative solutions and products to meet customer requirements. It undertakes contract-funded research and development, developing intellectual property in partnership with key customers and through internal funding with potential for new revenue streams.
Our business modelSee how we create value for our stakeholders in our business model on pages 10 to 11.
Our growth strategyRead more about our strategy to drive long-term growth for the benefit of all stakeholders on page 16.
Our people and cultureOur success is dependent on our people and ability to foster the right culture. Learn more about our people and culture on pages 42 to 46.
3Annual Report & Accounts 2021
Strategic Report

About QinetiQ
Our stakeholdersCreating value for all of our stakeholders is critical to our long-term success
Our approach to engagement:In order to deliver responsibly and for the benefit of all stakeholders we must understand what matters to our stakeholders. To do this we engage in a variety of ways in an open and transparent manner, trying to identify common goals. In some cases the Board will engage directly with certain stakeholders, however in others the relevant delivery teams will manage this engagement. This is dependent on the stakeholder and issues considered, with engagement led by those best placed to effect any necessary change. We expect that our approach and how we engage with our stakeholders will continue evolving as we pursue further growth and geographic expansion.
Primary stakeholdersOther stakeholders
Customers
Primary stakeholders
Other stakeholders
Suppliers
Shareholders
Communities
Employees
Regulators
Our customers are at the centre of our vision and the foundation of our success. We strive to apply our strengths to their advantage to deliver mission-led innovation, and invest time in understanding and responding to their needs.
We occupy a unique position in defence, working in partnership with various suppliers to deliver the best solutions for our customers. We strive to adopt a collaborative approach and ensure we treat our suppliers with integrity, taking a fair and sustainable approach.
Our shareholders’ ongoing support enables us to invest in our business and execute our growth strategy for the benefit of all stakeholders. In return we aim to deliver long-term sustainable growth and attractive returns.
We strive to be a good neighbour, having a positive impact on our local communities and wider society; from our outreach programme, inspiring the next generation of scientists and engineers, to providing services to ensure the safety and security of members of society.
We are a people business and our employees are critical to our success. Their health, safety and wellbeing is vital and we are committed to providing fulfilling careers where our employees can perform meaningful and intellectually stimulating work.
Various aspects of our business involve oversight from regulators. We engage with regulators to understand changing regulations, ensuring we can meet these requirements.
Regu
lato
rs
Communities
Our stakeholders
Shareholders
Empl
oyee
s CustomersOur
Stakeholders
Suppliers
See Stakeholder engagement on page 38. See Section 172 (1) statement on page 48.
Our stakeholders
4 QinetiQ Group plc
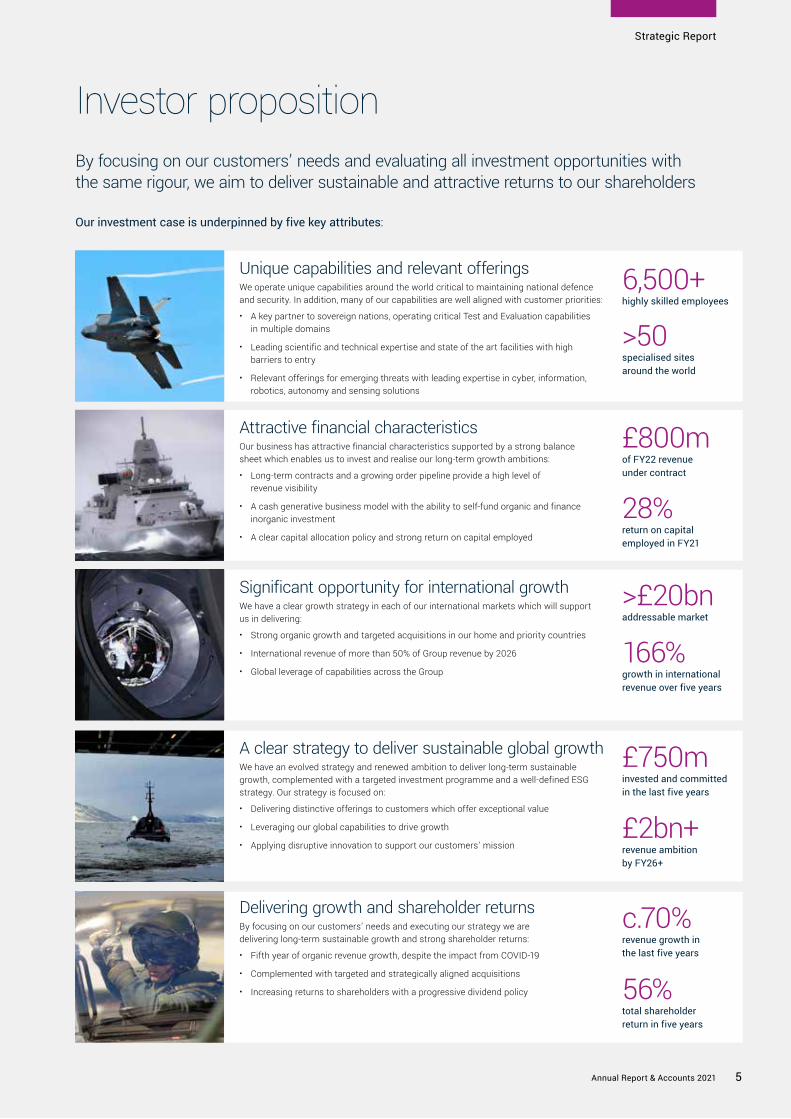
Investor propositionBy focusing on our customers’ needs and evaluating all investment opportunities with the same rigour, we aim to deliver sustainable and attractive returns to our shareholders
Unique capabilities and relevant offeringsWe operate unique capabilities around the world critical to maintaining national defence and security. In addition, many of our capabilities are well aligned with customer priorities:
• A key partner to sovereign nations, operating critical Test and Evaluation capabilities in multiple domains
• Leading scientific and technical expertise and state of the art facilities with high barriers to entry
• Relevant offerings for emerging threats with leading expertise in cyber, information, robotics, autonomy and sensing solutions
Attractive financial characteristics Our business has attractive financial characteristics supported by a strong balance sheet which enables us to invest and realise our long-term growth ambitions:
• Long-term contracts and a growing order pipeline provide a high level of revenue visibility
• A cash generative business model with the ability to self-fund organic and finance inorganic investment
• A clear capital allocation policy and strong return on capital employed
Delivering growth and shareholder returnsBy focusing on our customers’ needs and executing our strategy we are delivering long-term sustainable growth and strong shareholder returns:
• Fifth year of organic revenue growth, despite the impact from COVID-19
• Complemented with targeted and strategically aligned acquisitions
• Increasing returns to shareholders with a progressive dividend policy
Significant opportunity for international growthWe have a clear growth strategy in each of our international markets which will support us in delivering:
• Strong organic growth and targeted acquisitions in our home and priority countries
• International revenue of more than 50% of Group revenue by 2026
• Global leverage of capabilities across the Group
A clear strategy to deliver sustainable global growth We have an evolved strategy and renewed ambition to deliver long-term sustainable growth, complemented with a targeted investment programme and a well-defined ESG strategy. Our strategy is focused on:
• Delivering distinctive offerings to customers which offer exceptional value
• Leveraging our global capabilities to drive growth
• Applying disruptive innovation to support our customers’ mission
Our investment case is underpinned by five key attributes:
6,500+highly skilled employees
£800mof FY22 revenue under contract
£750minvested and committed in the last five years
c.70%revenue growth in the last five years
>50specialised sites around the world
>£20bnaddressable market
166%growth in international revenue over five years
28%return on capital employed in FY21
£2bn+ revenue ambition by FY26+
56%total shareholder return in five years
5Annual Report & Accounts 2021
Strategic Report

“ QinetiQ has demonstrated its resillience through this last year, but we also took a number of bold steps to drive future growth.”
The last year has been like no other, with every aspect of our lives affected by the COVID-19 pandemic. While all individuals and businesses have been impacted in one way or another, QinetiQ has continued to focus on our core purpose; to protect lives, defend sovereign capability and secure the vital interests of our customers.
I am extremely proud of how we have delivered mission critical outputs for our customers in these uncertain times. This has been made possible by the commitment, dedication and resilience of our people. We took difficult decisions at the start of the year to preserve cash and ensure we emerged from the pandemic well positioned for future growth. These decisions were tough, but nonetheless necessary as we adapted to the initial disruption and new ways of working.
Maintaining the health, safety and wellbeing of our peopleAs we navigated the challenges presented by the pandemic, our first priority was safeguarding the health, safety and wellbeing of our people. Like many organisations, we were forced to quickly adapt to home and hybrid working models. As a defence and security business there were naturally a number of activities which could not be conducted from home, and we introduced all necessary social distancing and PPE requirements to facilitate this. We placed a firm emphasis on communicating openly with our people throughout the pandemic to ensure we had a shared understanding and approach.
More generally we continued to focus on engaging with our employees through the “Global Employee Voice” network to understand the issues they face in order to improve how it feels to work at and be a part of the QinetiQ family. Encouragingly, employee engagement increased again this year by 6%, following a 10% increase in engagement in the prior year.
Integrity We take pride in our decisions, and work to create a sustainable and responsible business. We take personal responsibility to do the right thing, both as an organisation and as individuals.
Collaboration Delivering value through partnership and teamwork, we actively collaborate with our colleagues, customers and industry partners. We know that working together is the best way to meet our customers’ needs.
Performance Our performance is measured by how we deliver for our customers; meeting their needs through flawless execution and delivery of the mission-critical solutions on which they depend.
Our values
See our Board of Directors on page 58.
See our Governance framework on page 57.
Chairman’s statement
6 QinetiQ Group plc

2012 2013 2014 2015 2016 2017 2018 2019 2020* 2021
Key Final Interim
* Following the onset of COVID-19 we deferred our final FY20 dividend until the full impact was known. We subsequently paid the final FY20 dividend in November 2020.
Delivering responsibly and sustainably for the benefit of all our stakeholdersAs a Board we recognise the importance of delivering results in the right way. We considered our wider purpose during the year and remain focused on creating the right culture to support long-term growth for the benefit of all interested parties. From our engagement process it is apparent that sustainability is becoming increasingly important to all of our main stakeholder groups; our customers, our shareholders and our employees.
QinetiQ currently possesses strong ESG credentials and I am pleased that we are rated “AA” by MSCI and as the “Sector Leader” in Aerospace and Defence by Sustainalytics. Despite this we must not be complacent or stand still and as expectations on businesses continue to grow, we are committed to improving our ESG credentials. Sustainability issues were previously discussed at the Risk & CSR Committee meetings, however ESG has now become a topic for discussion at main Board level, not just at a sub-committee. We have been focusing on how we can further embed sustainability into our core business strategy, and introduced a new sustainability-linked performance metric as a key performance indicator for the business during the year. We are working on our net zero plan and intend to publish this in due course.
Board changes There were some changes to the membership of the Board during the year. Admiral Sir James Burnell-Nugent retired at the end of 2020 having served on the Board for over nine years. On behalf of us all, I want to thank James for his outstanding contribution to the Board and wider business over that period. He was replaced by General Sir Gordon Messenger who brings a wealth of military experience having served as a Royal Marine for 37 years, finally retiring as Vice-Chief of the Defence Staff. Deputy Chair, Michael Harper, who has now served on the Board for nine years will also be stepping down in due course, once a replacement for him has been agreed. James and Michael have guided the company with skill and diligence through a difficult transition to where we are now and I am sincerely grateful
to both of them for their contribution. Overall I am confident we have the right mix of skills and experience on the Board to provide effective challenge and support to the business as it continues to grow.
It was with great sadness that we received the news that Ian Mason, who had served on the Board since 2014, unexpectedly passed away in April 2021. Ian will be greatly missed, not only for his strong contribution to the Board, but also as a trusted friend and colleague. Our thoughts are with Ian’s family.
Emerging with strength to deliver long-term successWe made some tough decisions at the start of the year to maintain the resilience of our business, however FY21 has been a truly encouraging year for QinetiQ. Despite difficulties and challenges in adapting to our new ways of working and in managing a global business in the current environment, our performance has been excellent. We have delivered a fifth year of growth, something made possible by the ongoing commitment and hard work of our people, who I would again, like to thank for their contribution. In this context I would particularly like to thank Steve and the Global Leadership Team for their dedication and hard work.
QinetiQ has demonstrated its resilience through this last year but we also took a number of bold steps to drive future growth; we launched an evolved strategy and renewed ambition, and we accelerated our digital investment to improve collaboration and digital solutions for our customers. I am confident that these, combined with our increased focus on sustainability and the continued resilience of our people, will support us in achieving excellent results and exceeding our stakeholders’ expectations over the long-term.
Neil JohnsonNon-executive Chairman20 May 2021
0.9p1.1p
1.4p1.8p 1.9p 2.0p 2.1p 2.1p 2.2p 2.2p
2.0p
2.7p
3.2p
3.6p3.8p
4.0p4.2p
4.5p 4.4p4.7p
2.9p
3.8p
4.6p
5.4p5.7p
6.0p6.3p
6.6p 6.6p6.9p
Historical dividend payments
7Annual Report & Accounts 2021
Strategic Report

“ Throughout this challenging year, QinetiQ has proven its commitment and focus to deliver critical defence and security capabilities for our customers.”
Through continued and disciplined execution of our strategy we have delivered our fifth year of growth, despite the challenging market environment due to the COVID-19 pandemic. Our FY21 performance was strong, with the largest order intake in a decade growing orders by 18% (11% on an organic basis), delivering revenue growth of 19% (10% on an organic basis), growing underlying operating profit by 14% (6% on an organic basis) with underlying operating profit margins at the top end of our short-term target range at 11.9%. We also delivered a strong cash performance with 131% underlying cash conversion before capital expenditure. International revenue now represents 33% of Group revenue, grown from £158m in FY16 to £420m in FY21.
Strong organic growth was complemented by revenue and profit contribution from recently acquired businesses. This includes the advanced sensing solutions business formerly known as MTEQ, acquired in December 2019, training specialist NSC, acquired in February 2020, and Naimuri, a specialist in software development and data analytics, acquired in July 2020. This contribution was partially offset by the disposals of Boldon James, Commerce Decisions and OptaSense in the year. These transactions were all strategy-led choices to allow increased focus on our core offerings and reflect our ambition to grow the company by delivering mission-led innovation for our defence and security customers’ advantage.
This year has proved to be an important further step in the maturity and development of the company, demonstrating our strength, resilience and delivering on our promises for all our stakeholders. This year we have not only navigated the challenging dynamics of COVID-19 but we have pushed forward, launching our evolved strategy, increasing the scale of our ambition and delivering a strong set of financial results. With our strategy firmly embedded and producing consistent results, we are making good progress in building a truly integrated global defence and security company.
We are committed to providing a safe environment at all Company sites for the benefit of our employees, contractors, tenants and visitors. In March 2021 there was an incident at our Pendine site in the UK, which resulted in one of our employees
See Our business model on page 10.
See Our growth strategy on page 16.
Chief Executive Officer’s review
sustaining serious injuries. Our focus will remain on supporting our colleague and their family over the coming months and anyone across the business who has been affected by the incident. We are continuing to support the external investigations into the incident and we have launched our own, to better understand what happened and any lessons we can learn and apply so to continue to improve our safety first culture.
Successfully mitigating the challenges of COVID-19The COVID-19 pandemic has had a profound impact on people and our society throughout 2020. With a long-term vision-based strategy focused on anticipating and adapting to our customers’ needs, a strong balance sheet and a significant order backlog, QinetiQ is well placed to continue delivering growth, as we have seen through our financial results and customer feedback this year. Our response focused on our three strategic priorities of protecting the health and wellbeing of our employees, continuing to deliver critical work for our customers and maintaining the strength of QinetiQ for the long-term.
As we entered the COVID-19 crisis, we took necessary and decisive action to maintain the strength of our company and ensure we retained the critical skills and capabilities to drive long-term growth. We implemented a series of short-term temporary actions which included salary reductions, stringent cost control, incentives paid in shares and deferral of the dividend decision. The actions taken increased the resilience of the company, allowing us to maintain a strong balance sheet, deliver for our customers and to position the company for growth as we emerged from the crisis. We adapted our ways of working to ensure we continued to deliver for our customers while ensuring we protected the health and wellbeing of our employees.
As the COVID-19 pandemic continues to evolve in all of the countries in which we operate, we continue to follow national guidelines, providing testing and equipment as appropriate to support our employees and interactions with our customers. This “new normal” is continuing to prove effective and will be a
8 QinetiQ Group plc

catalyst for change in our ways of working. Like all businesses, QinetiQ has been impacted by the COVID-19 pandemic, by differing amounts across the company, but we have successfully managed to offset the negative impacts through our strong, decisive and collective actions pulling together as a company to deliver a strong financial performance even in the face of this unprecedented global pandemic.
The changing market dynamics present opportunities for the GroupAs a global defence and security company we operate in six home and priority markets with a multi-domestic strategy, supporting the development and sustainment of indigenous capabilities.
As the threat environment becomes increasingly complex, enabled by rapid technological advances and our adversaries’ alternative approaches to warfare, Western forces must rethink their approach to defence and security. The importance of information advantage, emerging technologies, cyber capabilities and autonomous systems is increasing significantly. In addition, the interoperability between platforms to create integrated systems and seamless co-ordination between forces and nations, to ensure a concerted approach to countering modern threats, including those that sit below the threshold of conventional warfare, is of paramount importance.
Pressure on Government resources world-wide will intensify and global Defence departments will need to balance investment in traditional platforms against investment in new technologies including data and information capability. With our domain knowledge, partnering skills and a track record of delivering mission-led innovation to create and assure capabilities with agility and at pace, whilst delivering efficiencies and savings to customers, we are well positioned to benefit from this transition. We are investing significantly in digital transformation to enhance customer solutions. While the world around us continues to change, our offerings are becoming more relevant than ever. Furthermore, in our home countries of the UK, US and Australia we are well aligned with the key areas of future increased spend, such as data analytics, robotics, autonomy and sensing – partnering alongside our customers to help solve their complex challenges.
Evolution of the strategy to accelerate future growthOur strategy to apply mission-led innovation for our customers’ advantage has enabled us to grow in an uncertain world over the last five years. We have delivered c.70% revenue growth and c.40% operating profit growth, more than doubled our order backlog, increased our qualified order pipeline by three times to over £6bn and increased our 3 year forward revenue under contract by c.60%. We have made seven acquisitions and three disposals, invested significantly to drive organic growth and modernised the LTPA contract and relationship with the UK MOD.
In light of the changing market dynamics and our successful track record of growth, at our Interim Results we announced an evolution of our strategy to reflect our global business, our distinctive offerings, and the innovative approach we take to solving our customers’ problems.
Following five years of growth we have evolved our strategy and created greater focus for our next five years of growth, building distinctive offerings to provide high-value solutions, supporting nations with a shared defence and security mission. We have redefined our addressable market from >£8bn to >£20bn per year, with increased clarity around our distinctive offerings into our target markets in the UK and Australia and specific inclusion of the RDT&E market in the US (£15bn addressable market) and reduced our Rest of World addressable market to reflect our reprioritised focus. We are targeting global expansion through careful investment decisions and execution of a multi-domestic strategy, delivering value for our customers and growing our revenues to over £2bn. The next phase of growth will have a lower capital intensity, thereby supporting a strong return on capital (ROCE) for our shareholders.
Environmental, Social and Governance (ESG)Our core purpose as a company is clear, and what drives us as a company and as employees is our critical role in defence and security; protecting the lives of our armed forces and the societies in which we operate, and defending sovereign capability. This core purpose is central to our organisation and at the heart of what we do.
Across the company we take our ESG responsibility seriously. Ensuring it is embedded into our operations and strategy reduces risk and creates value, something we have done for many years. While we uphold the highest ethical standards and a sensitive approach to conservation, we also support and enable our customers’ ESG needs and expectations through the services and products we deliver. In FY19 we set a target to reduce our scope 1 and scope 2 greenhouse gas emissions by 25% from an FY19 baseline, by FY25 – we have exceeded this target in FY21, with a 28% reduction, earlier than targeted due to the change in working patterns through COVID-19. We will publish our plan towards Net Zero in the next year.
Our value proposition is in providing mission-led innovation for our customers to help solve their complex defence and security challenges – this value proposition helps both to support the achievement of operational outcomes and the implementation of strong ESG values, for both us and for our customers. We help our customers “Create it”, for example in the development of new bomb disposal equipment, or new sensing and autonomy platforms using robotics to take our armed forces out of harm’s way; we help our customers “Test it”, ensuring the equipment works as it should improving safety and accuracy; and we help our customers “Use it”, supporting our customers with their training needs, often in a combined live and synthetic environment reducing emissions, cost and improving safety.
Our purpose is underpinned by our commitment to operate responsibly and sustainably for the benefit of all our stakeholders, looking after the environments in which we operate, acting as a strong ethical leader in defence and helping to make society safer for us all.
Steve WadeyChief Executive Officer20 May 2021
9Annual Report & Accounts 2021
Strategic Report

A sustainable business model creating value for all stakeholders
CustomersWe deliver mission critical solutions to our customers helping them to address their most pressing challenges. They benefit from a responsive and agile approach, the ability to innovate at pace and value for money.
EmployeesOur employees work in an environment where the work they do makes a genuine difference to our customers and their safety. They have rewarding careers in highly skilled areas and are able to satisfy their intellectual curiosities.
SuppliersWorking with our suppliers we bring together complementary industry leading thinking in a truly collaborative environment to the benefit of the customer, QinetiQ and our suppliers.
ShareholdersOur business model, supported by our strategy, aims to deliver sustainable long-term growth and returns to our shareholders.
6%increase in employee engagement
1,000SMEs paid ahead of schedule during COVID-19
11%increase in underlying EPS
49our Net Promoter Score is in the category of “Good”
Customer focusOur employees are inherently customer focused and adopt innovative and leading approaches to exceed our customers’ expectations. This approach is underpinned by a high-performance culture where employees are engaged and empowered, supporting strong customer relationships and enabling us to act as a trusted partner’ in the delivery of critical services.
Our fundamental strengths
Stakeholder value creation
Technical expertiseMany of our employees are highly skilled scientists and engineers with deep domain knowledge and know-how. Their technical expertise is critical to delivering mission-led innovation for our customers and our success is dependent on our ability to recruit, retain and engage high-calibre people.
Collaborative approachThe modern threat environment often requires collaboration across industry and academia to procure the most effective solution. By forming complementary partnerships and by managing large networks of small and medium size enterprises, our collaborative approach ensures we deliver the most effective solutions for customers.
Distinctive offeringsWe operate some of the most advanced Research, Development, Test & Evaluation facilities around the world. These facilities are often unique assets that are of strategic importance to national defence capabilities. By combining these facilities with the unique expertise of our people we are able to support our customers in countering current, future and emerging threats.
Our business model
Financial characteristics and sustaining our business modelA large proportion of our work is delivered under long-term contracts and we typically start the year with a significant proportion of revenue under contact, providing a high level of revenue visibility. In addition our business is cash generative by nature, meaning we are able to organically invest in our capabilities and sustain our business model.
Our people are critical to our success and we are continually investing to support their career development, wellbeing and engagement. We are also investing in our facilities and digital infrastructure tools, ensuring we can continue to support our customers against the future and emerging threats they must contend with.
10 QinetiQ Group plc

Our customer value proposition
Test itAssuring a capability will work when it
is critically needed
We offer customers agile and realistic testing experiences so they can be sure that their
capability works when it is critically needed. We operate some of the most advanced land, sea and
air ranges in the world and combine the ability to manage live-fire exercises and rehearsals
with our digitally-enabled infrastructure to provide customers with realistic and cost effective
testing solutions.
Create itDeveloping cutting-edge technology and rapidly turning it into capability
Utilising our research and experimentation capabilities, our test and evaluation expertise and extensive domain knowledge, we develop
and apply cutting-edge technology to help our customers create a true capability. We
evaluate, integrate and secure the platforms, systems, information and assets on
which missions depend.
What do we do?We deliver mission-led innovation by
applying our inherent strengths to support the agile development of solutions that
meet our customers’ needs; helping them to create, test and use critical defence and security capabilities.
Use itEnsuring our customers are trained
and operationally ready
Combining real and simulated training experiences we can ensure our customers are operationally
ready to use their capabilities when it matters. By blending testing, mission rehearsal and training,
and analysis we give customers tangible evidence about how their capabilities perform within highly authentic environments and provide
advice on how to prepare them for operational use.
131%underlying cash conversion (pre-capex) in FY21
£800mof FY22 revenue under contract
11Annual Report & Accounts 2021
Strategic Report

Trading environment
In March 2021, the UK published the Integrated Review, which will determine defence and security policy moving forwards. This followed the previous announcement of the allocation of an additional £24.1bn in funding over a four-year period in November 2020, the largest investment in UK defence since the Cold War period. The Integrated Review has placed science and technology at the heart of the UK’s defence
UK
The UK, US and Australia are our home countries and collectively represent 90% of our revenue. We also have a significant presence in our three priority countries of Canada, Germany and Belgium.
The US maintains the largest defence budget worldwide, with the FY21 budget of $741bn, more than the next ten largest countries combined. Despite the impact of COVID-19, the FY22 budget request of $753bn is broadly flat in real terms and highlights the need to counter the threat from China as the Department
Current revenue Market opportunity
Current revenue Market opportunity
Revenue
Revenue
Market share
Market share
£858m
£216m
<30%
<2%
>£3bn+2–3% growth
>£15bn+3% growth
US
policy with innovation cited as critical to UK success. Over the next four years, the UK will invest over £6.6bn in research and development to develop next generation and emerging technologies in areas such as cyber, space, directed energy weapons, and advanced high-speed missiles.
As the UK seeks to develop and deploy next generation capabilities faster than their adversaries, we are well positioned to support them in applying mission-led innovation to achieve this. Our unrivalled expertise in Research & Development and Test & Evaluation combined with our recent investment to modernise UK test ranges will help our customers generate and assure new and emerging technologies at pace. Delivering value for money remains critical to our customers and we will continue to utilise innovative delivery models to support our customers in achieving this.
of Defence’s top challenge. It also cited the need to deter destabilising behaviour by Russia and emphasised the need for collaboration with partners and allies to build the concepts, capabilities, and posture necessary to meet these challenges.
In the US, we are a market leader in robotics, autonomy and advanced sensing solutions, an area of budget growth, delivering value to our customers through the rapid development and deployment of disruptive solutions. We have ambitious growth plans in the US. This is underpinned by a relevant offering with a growing need to provide actionable intelligence into war fighters’ hands quicker and a push to develop and integrate multiple autonomous and semi-autonomous systems as the US seeks to invest in next generation technologies to maintain a technological advantage.
12 QinetiQ Group plc
Sources
Jane’s Market Budget Forecast April 2021, UK MOD and US DOD forecasts for RDT&E, Australia Defence publications and QinetiQ estimates.
Market share based on FY21 revenue.
CAGR: Compound Annual Growth Rate.
Higher growth rate than US market due to focus on high priority growth segments.
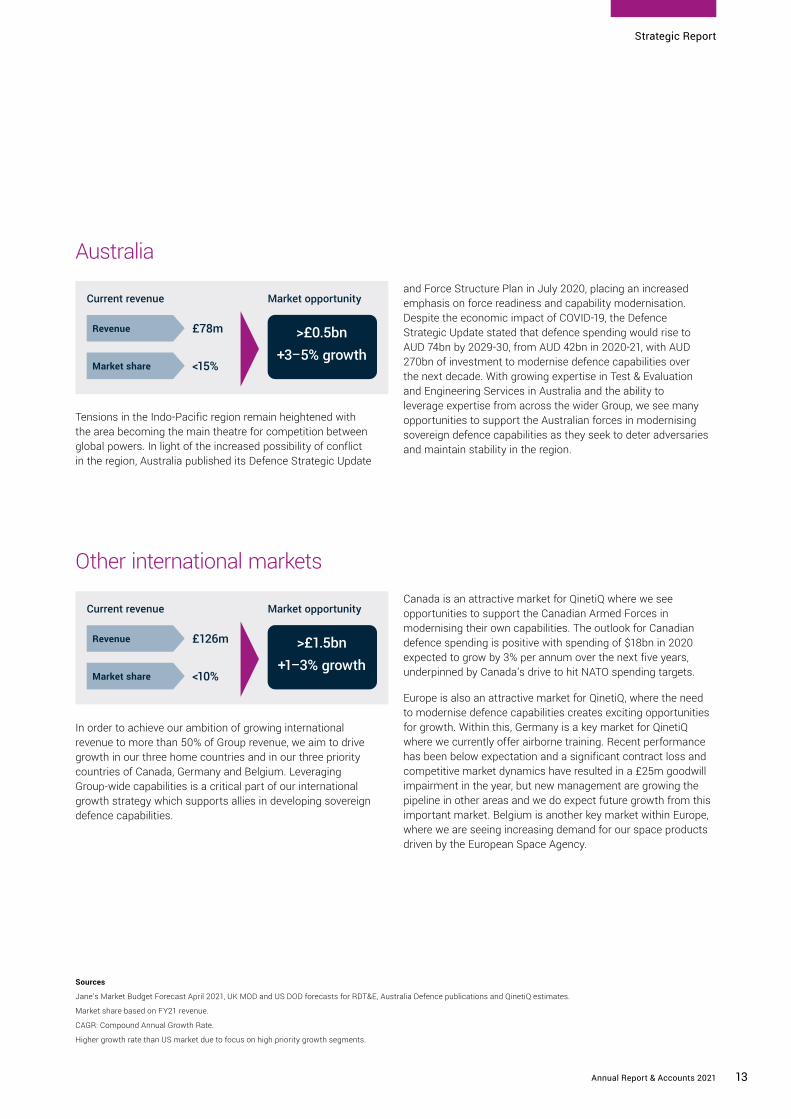
Tensions in the Indo-Pacific region remain heightened with the area becoming the main theatre for competition between global powers. In light of the increased possibility of conflict in the region, Australia published its Defence Strategic Update
In order to achieve our ambition of growing international revenue to more than 50% of Group revenue, we aim to drive growth in our three home countries and in our three priority countries of Canada, Germany and Belgium. Leveraging Group-wide capabilities is a critical part of our international growth strategy which supports allies in developing sovereign defence capabilities.
Current revenue Market opportunity
Current revenue Market opportunity
Revenue
Revenue
Market share
Market share
£78m
£126m
<15%
<10%
>£0.5bn+3–5% growth
>£1.5bn+1–3% growth
Australia
Other international markets
and Force Structure Plan in July 2020, placing an increased emphasis on force readiness and capability modernisation. Despite the economic impact of COVID-19, the Defence Strategic Update stated that defence spending would rise to AUD 74bn by 2029-30, from AUD 42bn in 2020-21, with AUD 270bn of investment to modernise defence capabilities over the next decade. With growing expertise in Test & Evaluation and Engineering Services in Australia and the ability to leverage expertise from across the wider Group, we see many opportunities to support the Australian forces in modernising sovereign defence capabilities as they seek to deter adversaries and maintain stability in the region.
Canada is an attractive market for QinetiQ where we see opportunities to support the Canadian Armed Forces in modernising their own capabilities. The outlook for Canadian defence spending is positive with spending of $18bn in 2020 expected to grow by 3% per annum over the next five years, underpinned by Canada’s drive to hit NATO spending targets.
Europe is also an attractive market for QinetiQ, where the need to modernise defence capabilities creates exciting opportunities for growth. Within this, Germany is a key market for QinetiQ where we currently offer airborne training. Recent performance has been below expectation and a significant contract loss and competitive market dynamics have resulted in a £25m goodwill impairment in the year, but new management are growing the pipeline in other areas and we do expect future growth from this important market. Belgium is another key market within Europe, where we are seeing increasing demand for our space products driven by the European Space Agency.
13Annual Report & Accounts 2021
Strategic Report

Market themesThe long-term themes reshaping defence markets around the worldThe markets in which we operate are continually evolving as our customers adapt to the dynamic threat environment around them. Most of our customers now seek to rapidly modernise their defence and security capabilities so they can better address current and future threats. They want to achieve operational advantage over an adversary, protect themselves and their stakeholders against the impact of action against them, or project power at range to deter malicious actors.
The level of modernisation required to achieve these outcomes in today’s environment relies on successful innovation through the effective application of science, engineering and technology to enhance existing capabilities, create and assure new ones, and train users to deploy them effectively. That innovation must be focused solely where it needs to deliver an impact for defence and security users and in essence, to be successful must always be “mission-led”.
1. Rising global tensions and increasingly complex threats
The threat environment continues to become increasingly complex, fuelled by rapid advances in technology and heightened geopolitical tensions. From hypersonic missiles and advanced fighter jets to low cost consumer drones adapted to cause harm, technological advances have enhanced the lethality of threats at both ends of the spectrum, giving both state and non-state actors access to capabilities which undermine western superiority. In parallel to traditional threats, digital-based threats continue to grow in sophistication, and are often deployed in conjunction with more conventional threat forms.
2. The proliferation of grey-zone warfareGrey-zone activity has increased significantly in recent years as the supremacy of western forces has driven adversaries to adopt new tactics. Grey-zone tactics often include acts which would not typically provoke a conventional military response, but nevertheless undermine defence and security, as well as economic and political stability. Typical threats in this space include cyber-attacks aimed at compromising critical national infrastructure, disinformation campaigns and political meddling. Key challenges for our customers include improving cyber resilience, improving threat detection and adapting at pace.
3. Need for advanced capabilities, informational advantage and better interoperability
Maintaining technological superiority is critical in this increasingly complex threat environment. Our customers are investing heavily in R&D to develop next generation capabilities and ensure informational advantage. Areas such as robotics, autonomy, advanced data analytics, artificial intelligence and novel weapons are all of particular interest to our customers. These new and emerging technologies must be integrated with traditional defence capabilities and across our markets there is a need for greater interoperability between platforms and systems to create true capabilities. This extends to the need for greater cooperation between different forces and nations to ensure a concerted effort in countering these modern threats.
4. Resilience of supply chainsIn light of the growing tension and competition between global powers, nations are increasingly focused on developing resilient domestic supply chains. These supply chains must operate cohesively, as a single ecosystem, to respond to the changing and complex customer requirement. This is a critical part of maintaining a sovereign defence capability that can function without undue reliance on international trade and expertise or raw materials from potentially hostile states.
How are defence and security markets changing?
14 QinetiQ Group plc

How are we evolving to these new market dynamics?
1. Delivering disruptive science, engineering and technology required to modernise defence and security capabilities
QinetiQ was founded on innovation with Research, Development, Test & Evaluation at the core of what we do. As a predominantly service-based business we are uniquely placed to operate across the breadth of platforms, systems and lifecycles unlike a more traditional vertical platform manufacturer. We can experiment, innovate and develop new capabilities, drawing on a broad range of existing, emerging and disruptive technologies. We emulate advanced threats and test and evaluate the resilience and interoperability of the systems and platforms used to respond to these threats to provide assurances. We have invested heavily in contracts such as the LTPA to ensure we have the capabilities to generate and assure future capabilities and will continue to apply disruptive innovation to create relevant capabilities and offerings.
2. Delivering value for money through innovative delivery models
Governments around the world face significant fiscal pressure with high budget deficits and growing debt levels exacerbated by the impact of COVID-19 support programmes. Against this backdrop nations have a growing number of threats to defend against and must wrestle with modernising traditional defence capabilities while also developing future digitally enabled technologies. This means defence budgets must deliver value for money. We act as a strategic partner to our customers, understanding their challenges and applying our technical expertise to provide innovative solutions. We believe by focusing on our customers’ needs and helping them realise cost efficiencies we can create opportunities for growth. Engineering Delivery Partner is an example of an innovative delivery model we have adopted for the provision of engineering services to the UK MOD, which has delivered both savings to the customer and growth in our business.
3. Partnering for innovationThe capabilities our customers require can often be so complex that no one company can deliver them alone. In addition, cutting-edge technology is more often found in the commercial sector and academia. The defence industry can benefit from leveraging this technology, but it needs new and more effective partnerships to rapidly convert emerging technologies into assured deployable capability. We collaborate across the supply chain, but also form novel partnerships with organisations outside of defence to provide the agility and expertise required to innovate at pace. Our ability to work across platforms and technologies and form powerful partnerships helps deliver mission-led innovation to our customers.
4. A multi-domestic strategyOur strategy is a multi-domestic strategy aimed at developing sovereign defence capabilities within the countries in which we operate. A key example of this approach in action is the recent development of an unmanned aerial systems flight test range in Australia on behalf of the Queensland Government, which will act as a critical component of many unmanned aerial systems programmes and initiatives (read more on page 20).
15Annual Report & Accounts 2021
Strategic Report

Our growth strategy
Global leverage Distinctive offerings Disruptive innovation
We are building an integrated global defence and security company and will leverage our capabilities through single routes to market in the UK, the US, Australia, Canada, Germany and Belgium.
By co-creating distinctive products and services we will offer exceptional value for our customers in engineering, experimentation, test, training, information and autonomous systems.
We will continue to invest in and apply disruptive business models, digitisation and advanced technologies to enable our customers’ operational mission at pace.
Our visionOur vision is to be the chosen partner around the world for mission-critical solutions, innovating for our customers’ advantage.
Evolving our strategy
Strategic enablersOur strategy is underpinned by our strategic enablers, which support long-term growth in our business. These strategic enablers are sustainability, a high performance culture, complementary acquisitions and our digital transformation programme.
Our strategyOur three strategic pillars that will help us to achieve our vision are complementary and mutually reinforcing. These are global leverage, distinctive offerings and disruptive innovation.
Since we launched our vision-based strategy in 2016 we have delivered excellent growth in an uncertain environment. While our vision and drive to deliver mission-led innovation for our customers’ advantage remains unchanged, in light of our growth to date and the changing threat environment, we have evolved our strategy to support the next phase of our global growth.
Sustainability / ESGWe are continuously improving our ESG focus to ensure we deliver responsibly and sustainably for the benefit of all stakeholders. Sound governance structures and effective risk management are critical to the execution of our strategy and will ensure that progress against our strategy is sustainable.
A high performance inclusive cultureWe are nurturing a high-performance inclusive culture, where employees are engaged and understand how they contribute to our success. This is supported by our core values of integrity, collaboration and performance, which encompass who we are and how we operate.
Digital transformation and globalisationOur digital transformation will help support our next phase of global growth and our investment in digital is aimed at:
• Enhancing customer solutions
• Enabling collaboration• Developing modern,
integrated tools and systems
Complementary acquisitionsWe accelerate our strategic progress by acquiring highly complementary companies. These strategically aligned businesses often add a unique capability to the Group, supporting the delivery of distinctive offerings to customers and accelerating growth, sometimes in international markets.
16 QinetiQ Group plc

Global leverage• Successfully leveraging our capabilities into the global Test and Evaluation market,
with notable contract wins in Australia and Canada.
• Increasing international utilisation of UK ranges with a five year contract signed with the US Air Force to train at MOD Aberporth and MOD Hebrides.
• Our Modular E-X-Drive technology developed in the UK is being integrated onto an existing combat vehicle under a US Army contract to trial hybrid electric drive technology.
Distinctive offerings• Completed the two-year transition programme under the LTPA achieving
“Full Operating Capability”.
• Made significant progress integrating our combined US operations. Our US business delivered four prototype vehicles to the US DoD, under the Robotic Combat Vehicle Light (RCV-L) programme.
• Acquired Naimuri, a highly complementary advanced data analytics business, and disposed of three non-core businesses (Boldon James, Commerce Decisions and OptaSense).
Disruptive innovation• Signed a pre-collaboration agreement to work alongside industry partners and
the UK MOD on the UK’s next generation fighter concept known as Tempest.
• Appointed to lead the Weapons Sector Research Framework by DSTL to research and develop new and novel technologies including laser and radio-frequency directed energy weapons.
• Engineering Delivery Partner, our innovative delivery model for the provision of engineering services to the UK MOD, surpassed 1,100 tasks and £600m of orders since inception.
Our achievements over the last five years Our ambition for the next five years
• c.70% revenue growth, c.40% underlying operating profit growth
• More than doubled our order backlog
• Invested significantly to drive organic growth: LTPA, R&D, Digitisation
• Strategy-led portfolio decisions: Seven acquisitions and three disposals
• Increased international share of revenue from 21% to 33%
• Delivering sustainably and responsibly – 28% reduction in Scope 1 & 2 emissions since FY19
• The same level of growth to deliver >£2bn revenue at stable margins
• Strong Return on Capital Employed
• Investment to drive continued organic growth: LTPA, R&D, Digitisation, ESG
• Continued disciplined acquisition strategy – both in acquisition and delivery
• Significant growth in our international markets, targeting >50% of our revenue from international
• Net Zero plan published and making good progress
Strategic progress
FY26+ £2bn+FY21 £1.3bn
c.70% growth
c.70% growth
FY16 £755m
International 21%
US 17%
AUS 6%
RoW 10%
RoW
US
AUS
GERBEL
CAN
UK 67%
UK 79%
Strategic achievements in FY21
17Annual Report & Accounts 2021
Strategic Report

Operating review
Financial performance2021
£m2020
£m
Orders1 866.0 670.0
Revenue 939.9 797.4
Underlying operating profit 118.6 100.6
Underlying operating margin 12.6% 12.6%
Book to bill ratio2 1.2x 1.1x
Total funded order backlog 2,710.6 2,797.7
1 Includes share of orders from Joint Ventures and excludes the LTPA contract amendment signed in FY20.
2 B2B ratio is orders won, excluding the share of orders from JV orders, divided by revenue recognised, excluding the LTPA contract.
Orders for the year increased by 29% to £866.0m (2020: £670.0m), including £19.3m from acquisitions and growing £173.2m (26%) on an organic basis. The organic increase was driven by £158m of orders for Typhoon phase 1 under the Engineering Delivery Partner (EDP) framework contract.
Revenue increased by 18% to £939.9m (2020: £797.4m), including £18.3m from acquisitions, and grew by 15% on an organic basis, principally driven by new work under the EDP contract, Defence Digital contracts (in Cyber & Information) and ongoing growth in Australia.
At the beginning of FY22, £684m of the division’s FY22 revenue was under contract, compared to £656m (of the FY21 revenue) at the same point last year. This reflects the contribution from the acquired business in the year together with the 26% organic increase in orders won in the year.
Underlying operating profit grew by 18% to £118.6m (2020: £100.6m) assisted by the inorganic contribution from acquisitions. Organic underlying operating profit growth was 13% driven by revenue growth, good margin performance on LTPA and EDP, and cost actions, including lower travel whilst most employees were working from home.
Including the Long Term Partnering Agreement (LTPA), the proportion of EMEA Services revenue derived from single source contracts has reduced slightly to approximately 68% (2020: approximately 70%). While we have increased revenue derived from competitive contracts this has continued to be complemented by growth in single source EDP work.
FY21 reviewMaritime & Land (39% of EMEA Services revenue)The Maritime & Land business delivers operational advantage to customers by providing independent research, evaluation and training services.
• We successfully completed the Reinvigorated LTPA two-year transition programme and achieved Full Operating Capability (FOC) on 31 March 2021. Following the 2016 and 2019 LTPA amendments, we have transformed the Test, Evaluation and Training Services contract from an availability-style approach to one that delivers clear outputs to customers measured through delivery of Event Types (trials and other activities) and by improving our capabilities through our investment programme. Over the transition period we have delivered all milestones on or ahead of schedule improving our services, enhancing customer engagement and maximising value for money. The transition phase also saw a significant mobilisation of our investment programme with over 50 projects commencing and a number reaching a conclusion, for example, new weapons facilities at the Hebrides and Shoeburyness ranges and the delivery of a new range helicopter supporting operations in Scotland.
• Leveraging our investment in UK T&E, we were awarded a five year $27m contract with the US Air Force in Europe (USAFE) to provide training events and targets for their F-15E and F-35 5th generation fighter aircrafts, utilising facilities at MOD Aberporth and MOD Hebrides ranges. This is an important example of our LTPA investment attracting international customers to our UK ranges – the first return to the UK for the USAFE since 2015 for their training needs. Initial air-to-air missile target firings at our Hebrides range in the financial year have been successful.
• In June 2020, alongside industry partners MBDA and Thales, we were appointed to lead the Weapons Sector Research Framework (WSRF) by DSTL, expected to be worth £300m over five years. The framework, which brings together over 70 industry and academic partners to develop and exploit technology for the benefit of the UK, replaces the previous Weapons Science and Technology Centre (WSTC) contract, with a broader scope of research activities including laser and radio-frequency directed energy weapons.
EMEA ServicesOverviewEMEA (Europe, Middle East and Australasia) Services combines world-leading expertise with unique facilities to provide capability generation and assurance, underpinned by long-term contracts that provide good visibility of revenue and cash flows. The division is also a market leader in research and advice in specialist areas such as Command, Control, Communications, Computers, Intelligence, Surveillance and Reconnaissance (C4ISR), weapons and energetics, and cyber security.
18 QinetiQ Group plc

Air & Space (24% of EMEA Services revenue)The Air & Space business de-risks complex aerospace programmes by evaluating systems and equipment, assessing the risks and assuring safety.
• Engineering Delivery Partner (EDP) has continued to drive performance, surpassing 1,100 tasks and £600m of orders since inception in October 2018. Delivery in the year has remained strong with over 3,400 deliverables to our customers through the EDP contract. Key contract awards through EDP include:
- A five-year contract valued at £158m to provide a range of engineering services for Typhoon, from planning and acceptance through to regulatory assurance, trials support and optimisation of in-service capability.
- Two five-year contracts totalling £28m to provide engineering and safety services for the A400M and P8 Poseidon aircrafts. Services include providing support to the multi-nation certification and qualification programme, release to service, safety and airworthiness, structural integrity, environmental management support and trials.
- An extension of the EDP contract with a multi-year agreement named Futures Lab, replacing and building on the former Niteworks contract, to bring EDP’s network of SMEs and technology organisations to solve complex defence challenges, maximising innovation and exploitation of new capabilities to the front line.
• QinetiQ has signed a pre-collaboration agreement to work alongside industry partners and the UK MOD on the UK’s next generation fighter concept known as Tempest. Drawing on our extensive T&E expertise and investment in new digital techniques we will provide capability assurance, helping streamline the development programme while also exploring how our advanced technologies could be used to enhance operational capability of the platform.
• In June 2020 we completed an Army Warfighting Experiment, with an airborne team comprising a manned helicopter and semi-autonomous unmanned aircraft working together to identify targets, the first time such a trial has taken place in the UK.
• As outlined in our 4 March 2021 Investor Seminar, Renewed ambition to accelerate sustainable growth, to ensure we are even more relevant to the changing character of warfare and stay ahead for our customers’ advantage, one important area of our digital transformation programme is our investment in digital T&E to enable the rapid development of next generation products & services. This investment will expand our strong physical offerings into the virtual world to add greater value and pace to our customers and enable our future growth.
Cyber & Information (27% of EMEA Services revenue)The Cyber & Information business helps government and commercial customers respond to fast-evolving threats based on its expertise in training, secure communication networks and devices, intelligence gathering and surveillance sensors, and cyber security.
• As cyber capabilities and informational advantage become increasingly critical we are seeing growing demand for C4ISR (Command, Control, Communications, Computers, Intelligence, Surveillance, and Reconnaissance), data intelligence and training services across our markets.
• In July 2020 we acquired Naimuri, a leading software development and data analytics company for £24.4m, net of cash received. Naimuri partners with QinetiQ on a number of key programmes delivering mission-led innovation to UK intelligence and law enforcement customers. We aim to invest in their capabilities to drive growth in existing security markets and new defence markets.
• Vivace is our agile QinetiQ-run programme for the Home Office where we are working with over 250 organisations to rapidly bring the best minds to bear on the most complex digital challenges for front line law enforcement and security – this programme has been renewed and is delivering significant wider benefits to society, for example, supporting how human trafficking cases can be solved quicker in a more technically advanced way, and using technology to catch child abuse offenders and keeping children safe online.
• We have been recognised as a key strategic supplier to Strategic Command (Defence Digital and Defence Intelligence), winning orders in excess of £82m in the period across the UK Army’s communication and information programme (BATCIS contract), Defence’s new operational IT programme (New Style of IT contract), supporting the transformation of Defence Intelligence, intelligence solution contracts and various ongoing services including support to crypt-key developments and Skynet 5 operations.
• Included in the above, we have won a £18m contract through EDP in support of the ongoing transformation of Strategic Command’s Defence Intelligence capabilities. This contract will support many areas of the transformation of Defence Intelligence including training, information assessment and operation, and Typhoon mission data production; providing advice and technical leadership to improve interoperability of systems and platforms, the broader exploitation of key information assets and support to the modernisation of the defence information enterprise. Also included is a new Rapid Innovation Capability based on similar agile services provided to the Home Office under the Vivace contract, bringing ideas from concept to operational capability at pace. This contract has been won in collaboration with Naimuri, Inzpire and NSC – a great example of leveraging our acquired capabilities into an important core and growing market.
• In December 2020 we acquired the final 15% share capital of Inzpire Group Limited, two years after our initial strategic investment. Both Inzpire and NSC, leading providers of operational training, mission rehearsal and simulation across the Air and Land domain, are performing well and delivering strong growth.
19Annual Report & Accounts 2021
Strategic Report

Operating review continued
Financial performance2021
£m2020
£m
Orders 285.0 302.1
Revenue 338.3 275.5
Underlying operating profit 33.2 32.6
Underlying operating margin 9.8% 11.8%
Book to bill ratio1 0.8x 1.1x
Funded backlog 233.5 307.2
1 B2B ratio is orders won divided by revenue recognised.
Orders decreased by 6% to £285.0m (2020: £302.1m) following the significant €75m order for the European Space Agency Altius contract in FY20 and delays in US contracting due to COVID-19 and the change in administration, offset by an £83m inorganic contribution from the prior year MTEQ acquisition. The organic orders decline was 26%.
At the beginning of FY22, £117m of the division’s FY22 revenue was under contract, compared to £193m (of the FY21 revenue) at the same point last year. This decrease reflects the lost contribution from the disposed business in the year together with the timing of orders and delivery, especially in the US and QTS.
Revenue was up 23% on a reported basis at £338.3m (2020: £275.5m), primarily due to a whole year’s contribution from the MTEQ business acquired in December 2019. On an organic basis, revenue decreased by 6% due to COVID-19 impacting delivery of small robotics in the US and shipments in QTS and OptaSense (before disposal).
Global Products underlying operating profit grew by 2% to £33.2m (2020: £32.6m) reflecting a whole year’s trading of MTEQ. On an organic basis operating profit decreased by 20%. This was driven primarily by QTS delays of high margin products and a loss in OptaSense prior to disposal.
Global ProductsOverviewGlobal Products delivers innovative solutions to meet customer requirements. The division is technology-based and has shorter order cycles than EMEA Services. Our strategy is to expand the product portfolio and win larger, longer-term programmes to improve the consistency of the financial performance of this division.
International (10% of EMEA Services revenue)Our International business leverages our expertise and the skills we have developed in the UK and applies them to opportunities in attractive markets globally.
• Leveraging our T&E expertise from the UK we won two important contracts in Australia, to design & construct and operate & maintain an unmanned aerial systems (UAS) flight test range in Queensland. The test range was opened on schedule and has completed its first customer exercise in December 2020. This demonstrates excellent progress in leveraging our UK capabilities to support international growth.
• In November 2020 we won a framework contract with the Australian Space Services Training Areas and Simulation Branch (SSTASB) worth up to AU$55m over five years, to provide consultancy and advice for satellite communications, PNT (position, navigation and timing), simulation, health knowledge management, and records digitisation.
• We have commenced a multi-million investment programme in Australia to create and operate an Engineering and Innovation Centre, to leverage our global engineering capabilities and products, such as targets and robotics into the Australian market.
• In Canada we are making good progress and secured a contract to develop a roadmap for the modernisation of Royal Canadian Air Force (RCAF) air weapons ranges. This is a critical step in accommodating Canada’s next generation of fighter aircraft and a major step in becoming a trusted partner in the region.
• In Germany, despite COVID-19 impacting flying hours in Q1, flying activity recovered strongly resulting in revenue for the year being roughly flat compared to the prior year. However, order intake in the year was less than target and new orders are taking longer to convert than our original expectations. As a result of this and re-baselining the future business plan with the new Managing Director of the business, we have written down £25m of goodwill associated with the acquisition in anticipation of the financial impact of lower revenue and margins. We continue to seek ways to leverage our capabilities within QinetiQ Germany and see good opportunities to drive long-term growth in this significant European defence market.
20 QinetiQ Group plc

FY21 reviewUnited States (62% of Global Products revenue)Our US operations are managed as a single business, bringing together our expertise in robotics with the acquired capabilities (from MTEQ in December 2019) of autonomy and sensing solutions.
• In July 2020 we signed an agreement with the Defense Counterintelligence & Security Agency enabling us to operate all of our US defence operations under a Special Security Agreement. This replaces the previous Proxy Agreement, fundamentally changing how we approach the world’s largest defence market.
• Our US business has experienced some COVID-19 and change of administration delays impacting performance. MTEQ, that we acquired in December 2019, has delivered revenue growth compared to the previous 12 months on a like-for-like basis (part of which was before QinetiQ’s ownership) and positive momentum is growing, with continued growth in key sectors, strong delivery and cost efficiencies.
• We won a number of notable contracts in the year including: a $24m four-year sensor services contract; a $21m three-year contract to provide architecture and multi-modal sensor integration for mounted and dismounted war fighters; and three contracts totalling $47m across sensor research, development, engineering services. We are successfully leveraging our capabilities into our global markets, with the hybrid electric drive technology in the US, supporting expanded targets capabilities and pursuing sales of US robotics systems into Australia. Our orders won provide a strong foundation for growth, in many areas of increased customer funding. We continue our expansion into Airborne ISR, large robotic combat vehicles and early development on Space payloads.
• In partnership with Pratt Miller Defense, we delivered the four prototype vehicles required to the US DoD ahead of schedule, under the Robotic Combat Vehicle Light (RCV-L) programme, in advance of testing and experimentation in 2021.
• We delivered over 300 thermal sighting units to the US Army national training centres to support enhanced soldier training, and completed multiple critical ISR, Maritime and Robotics systems for the US Army and other customers, providing higher confidence in target detection and engagement.
• With our focus on larger and longer-term programs of record we are establishing strategic relationships on major programmes, including the Pratt Miller partnership on the RCV-L, with Hypersat for the launch of six commercial hyperspectral satellites and with General Atomics for our work on aircraft carrier launch and recovery systems and our ISR systems.
Space Products (12% of Global Products revenue)QinetiQ’s Space Products business provides satellites, payload instruments, sub-systems and ground station services.
• We have won a number of significant new contracts in our Belgium Space business, including a new contract with the European Space Agency worth €8.5m for the development and production of microgravity based heat transfer experiments,
expected to be installed on the International Space Station in 2026. This represents further progress as we build on our €4m investment into new, higher grade cleanroom facilities in Belgium.
EMEA Products (23% of Global Products revenue)EMEA Products provides research services and bespoke technological solutions developed from intellectual property spun out from EMEA Services. It also includes our QinetiQ Target Systems (QTS) business.
• Working in partnership with BAE Systems, our E-X-Drive technology has been selected for use by the US Army for their prototype hybrid-electric Bradley Fighting Vehicle. This is a £7m prototype contract as a testbed for integrating the E-X-Drive as part of a series hybrid powertrain under the Combat Vehicle Power and Energy architecture and mobility capabilities development program. It is an excellent example of deploying our IP to enhanced operational performance whilst improving the sustainability of the platform.
• QinetiQ Target Systems experienced significant disruption due to COVID-19 during the first half with cancellations of trials and deployments due to travel restrictions around the world. The business saw a good level of recovery in the second half with customers resuming trials and exercises. Furthermore, in the second half we won some significant orders giving further confidence in business recovery and growth. We expect to return to pre-COVID levels from FY22 and we remain extremely positive on the longer-term outlook for the business.
Disposals (3% of Global Products revenue)During FY21 we completed three disposals of non-core businesses resulting in a net cash benefit of £54.4m (combined enterprise value of £69m). The decision to divest of these three businesses was a strategic choice to allow increased focus on our core capabilities:
• In June 2020 we completed the sale of Boldon James to HelpSystems International Limited for an enterprise value of £30m. Boldon James was acquired by QinetiQ in 2007 and it has become a leading provider of data classification and secure email solutions. In the year ended 31 March 2020 Boldon James generated revenue of £9m.
• In November 2020 we completed the sale of Commerce Decisions to Harris Computer, a division of Constellation Software, for an enterprise value of £8.5m and deferred consideration of up to £1.5m contingent on performance to March 2022. QinetiQ acquired Commerce Decisions in 2008 and it has become a market leader providing software and consultancy services to enable some of the largest and most complex procurements around the world. In the year ended 31 March 2020 Commerce Decisions generated revenue of £8.3m.
• In December 2020 we completed the sale of OptaSense to Luna Innovations Inc. for an enterprise value of £29m. QinetiQ created OptaSense in 2008 and it has become a global leader in distributed fibre optic sensing solutions, delivering decision-ready data in multiple vertical markets, including pipelines, oil and gas, border and perimeter security, transportation, and power and utilities. In the year ended 31 March 2020 OptaSense generated revenue of £24.2m.
21Annual Report & Accounts 2021
Strategic Report

“ Our rigorous focus on performance and ensuring we keep costs under control means we were successfully able to offset the impact from COVID-19.”
Overview of full year resultsWe reported a strong performance in FY21, delivering growth across orders, revenue and profitability as we continue to successfully implement our strategy. Our rigorous focus on performance and ensuring we keep costs under control means we were successfully able to offset the impact from COVID-19. We enter FY22 in a strong position, with a large order backlog and a robust balance sheet. Strong cash generation from the company has continued in FY21 with 131% cash conversion, and a net cash position of £164.1m continues to provide support for investment opportunities.
Orders in the year totalled £1,151.0m (2020: £972.1m), an 18% increase, 11% on an organic basis. This included £158m of Typhoon phase 1 orders under the EDP framework contract in EMEA services.
At the beginning of FY22, approximately £800m of the Group’s FY22 revenue was under contract, compared to £850m (of the FY21 revenue) at the same point last year. This reflects the disposal of businesses and converting backlog on long-term contracts into revenue during the year.
Revenue increased 19% to £1,278.2m (2020: £1,072.9m), assisted by an additional £117.2m from a full-year of trading from our FY20 acquisitions and a small contribution from Naimuri which completed in the first half of FY21. Revenue grew by 10% on an organic basis, with a 15% organic increase in EMEA Services primarily due to Engineering Delivery Partner (EDP) offset by a 6% organic decrease in Global Products driven by COVID-19 related impacts in QTS, OptaSense and our US business.
See our Financial KPIs on pages 28 to 29.
Chief Financial Officer’s review
Financial performance
(£m)
Statutory results Underlying* results
2021 2020 2021 2020
Revenue 1,278.2 1,072.9 1,278.2 1,072.9
Operating profit 112.3 117.6 151.8 133.2
Profit after tax 124.7 106.5 126.1 113.7
(p)
Earnings per share 21.9 18.7 22.1 20.0
Dividend per share 6.9 6.6 6.9 6.6
(£m)
Underlying* results
2021 2020
Total funded order backlog 2,944.1 3,104.9
Total orders1 1,151.0 972.1
Net cash inflow from operations 199.0 177.8
Cash conversion ratio 131% 133%
Free cash flow 103.1 59.5
Net cash 164.1 84.7
1 Includes share of orders from Joint Ventures and excludes LTPA contract amendment signed post year end in 2019.
* Definitions of the Group’s alternative performance measures can be found on page 183.
22 QinetiQ Group plc

Underlying operating profit was up 14% at £151.8m (2020: £133.2m). The majority of the increase was due to a full year contribution from businesses acquired in the prior year (offset partially by the impact of three disposals in the current year) but the organic performance was still an increase of 6% (£7.3m), a strong performance considering the impact on operations due to COVID-19. The inorganic growth also included a small contribution from Naimuri, which was acquired in the first half of FY21.
EMEA Services operating profit grew 18% assisted by a full-year of trading from our FY20 NSC acquisition and FY21 acquisition of Naimuri. On an organic basis EMEA Services profit grew by 13% due to revenue growth and significant cost savings. Global Products underlying operating profit grew by 2% reflecting a full year of trading from our FY20 MTEQ acquisition. On an organic basis Global Products profit declined by 20% due to COVID-19 significantly impacting shipments in QTS and OptaSense (before disposal).
Total operating profit was £112.3m (2020: £117.6m), net of a £39.5m expense in respect of specific adjusting items (2020: £15.6m), as set out opposite.
Underlying profit before tax increased 13% to £149.9m (2020: £132.2m) in line with the increase in underlying operating profit, with underlying net finance expense at £1.9m (2020: £1.0m). Total profit before tax was £146.2m (2020: £123.1m).
Specific adjusting items Specific adjusting items, shown in the “middle column”, at the profit after tax level amounted to a total net loss of £1.4m (2020: net loss of £7.2m). This included a gain on sale of businesses and investments of £28.7m (2020: £nil) and finance income of £7.1m (2020: £6.5m) related to the defined benefit pension net surplus, offset by a £25.4m goodwill impairment (2020: £14.1m) in relation to the QinetiQ Germany business and £10.9m amortisation of acquisition-related intangibles (2020: £7.5m). The tax effect of items impacting profit before tax was an income of £2.3m (2020: expense of £1.4m). The tax line also included a £3.3m gain in the prior year from recognising US tax losses.
Further analysis is set out in note 4 with goodwill (and impairments of) discussed in note 14.
Net finance costsNet finance income was £5.2m (2020: £5.5m). The underlying net finance expense was £1.9m (2020: £1.0m) with additional income of £7.1m (2020: £6.5m) in respect of the defined benefit pension net surplus reported within specific adjusting items.
Order bridge
* Acquisitions comprise of £98.9m for MTEQ and NSC for period with no prior year comparator and £3.8m for Naimuri. Disposals comprise £24.6m for Optasense, Boldon James and Commerce Decisions (sold in FY21), for the equivalent periods after disposal in prior year (FY20).
Revenue bridge
* Acquisitions comprise of £109.6m for MTEQ and NSC for period with no prior year comparator and £7.6m Naimuri. Disposals comprise of £17.2m of revenue from Optasense, Boldon James and Commerce Decisions (sold in FY21), for the equivalent periods after disposal in prior year (FY20).
18% total growth 19% reported growth
11% organic growth 10% organic growth
£972.1m£1,048.3m
£1,151.0m
£1,072.9m£1,161.0m
£1,278.2m(£24.6m)
(£71.9m)
(£17.2m)
(£14.3m) (£2.2m)
(£0.5m)£173.2m
£121.8m
£117.2m
£102.7m
23Annual Report & Accounts 2021
Strategic Report

Chief Financial Officer’s review continued
TaxThe total tax charge was £21.5m (2020: £16.6m). Deferred tax has been calculated at the rate at which the timing difference is expected to reverse. The underlying tax charge was £23.8m (2020: £18.5m) with an underlying effective tax rate of 15.9% for the year ending 31 March 2021 (2020: 14.0%). The effective tax rate continues to be below the UK statutory rate, primarily as a result of the benefit of research and development expenditure credits (‘RDEC’) in the UK which are accounted for under IAS 12 within the tax line. An adjusted effective tax rate before the impact of RDEC would be 19.4%. The effective tax rate is expected to remain below the UK statutory rate in the medium term, subject to any tax legislation changes, the geographic mix of profits, the recognition of deferred tax assets and while the benefit of net RDEC retained by the Group remains in the tax line.
The tax in respect of the pre-tax specific adjusting items of £3.7m (note 4) was a £2.3m net income. The prior year tax in respect of the pre-tax specific adjusting items of £9.1m was a £1.4m net expense. Together with a £3.3m credit in respect of recognition of tax losses in the US the total specific adjusting items tax income in the prior year was £1.9m.
At 31 March 2021 the Group had unused tax losses and US carried forward interest expenses of £73.2m (2020: £90.3m) which are available for offset against future taxable profits.
Cash flow, working capital, capex and net cashUnderlying net cash flow from operations was £199.0m (2020: £177.8m) with an underlying operating cash conversion pre-capex of 131% (2020: 133%). This included a £12.7m working capital unwind driven by the timing of contract receivables
Capital expenditure decreased to £79.5m (2020: £107.8m) impacted by project delays due to COVID-19. We continue to invest in core contracts including the LTPA following the contract amendment announced in April 2019. After paying tax and net interest of £16.4m the Group generated free cash flow of £103.1m (2020: £59.5m), before business disposal proceeds, net of cash divested and transaction costs, of £54.4m (2020: £nil) and business acquisition consideration of £28.5m (2020: £90.2m). Looking forward, given the nature of our business model, we expect to continue to fund our capex requirements from operational cash flow.
As at 31 March 2021 the Group had £164.1m net cash (2020: £84.7m). The increase in net cash was primarily due to the £103.1m free cash flow and business disposal proceeds of £54.4m, offset by business acquisition consideration of £28.5m and dividend payments of £37.7m (2020: £38.0m).
The Company is party to a £275m multi-currency revolving credit facility (with an “accordion” feature to expand up to a maximum of £400m), provided by a consortium of banks, of which £65m will mature on 27 September 2024 and £210m will mature on 27 September 2025. The facility, undrawn as at 31 March 2021, contains a modest pricing adjustment (+/- 2bps), aligned to delivering our FY25 (Scope 1 and 2) carbon reduction target.
* Definitions of the Group’s alternative performance measures can be found on page 183.
** Acquisitions comprise of £11.8m for MTEQ and NSC for period with no prior year comparator and £1.8m for Naimuri. Disposals comprise of £1.3m from Optasense, Boldon James and Commerce Decisions (sold in FY21), for the equivalent periods after disposal in prior year (FY20).
Underlying operating profit* bridge
6% organic growth
(£6.2m)(£1.0m) £138.2m
£13.6m £151.8m£13.5m
(£1.3m)£133.2m
14% reported growth
EMEAServicesorganic
GlobalProductsorganic
ForeignExchange
2021 (excl.Acquisitions)
Acquisitions(current &
prior year)**
2021
24 QinetiQ Group plc

Capital allocationPriorities for capital allocation remain in the long-term as:
1. Organic investment complemented by bolt-on acquisitions where there is a strong strategic fit;
2. The maintenance of balance sheet strength;
3. A progressive dividend; and
4. The return of excess cash to shareholders.
The Group is not subject to any externally imposed capital requirements.
Through FY21 we have demonstrated our capital allocation policy in action, continuing our investment in our core international business, disposing of non-core assets and acquiring strategically aligned capabilities to drive long-term growth.
Return on Capital Employed (ROCE)In order to help understand the overall return profile of the Group, last year we reported our Return on Capital Employed, using the calculation of: Underlying EBITA / (average capital employed less net pension asset), where average capital employed is defined as shareholders equity plus net debt (or minus net cash).
For FY21 Group ROCE was 28%, in line with the previous year (2020: 28%). As we continue to invest in our business to support sustainable long term growth our ROCE is forecast to decrease but to remain attractive, at the upper end of the 15-20% range.
Earnings per share Underlying basic earnings per share increased by 11% to 22.1p (2020: 20.0p) benefiting from the higher underlying profit after tax. Basic earnings per share for the total Group (including specific adjusting items) increased 17% to 21.9p (2020: 18.7p).
The average number of shares in issue during the year, as used in the basic earnings per share calculations, was 569.7m (2020: 567.0m) and there were 571m shares in issue at 31 March 2021 (all net of Treasury shares).
Dividend The Board proposes a final FY21 dividend per share of 4.7p (2020: 4.4p) making the full year dividend 6.9p (2020: 6.6p). The full year dividend represents an increase of 5% in line with the Group’s progressive dividend policy.
Subject to approval at the Annual General Meeting, the final FY21 dividend will be paid on 26 August 2021 to shareholders on the register at 30 July 2021.
PensionsThe net pension asset under IAS 19, before adjusting for deferred tax, was £214.3m (31 March 2020: £309.7m). The key driver for the decrease in the net pension asset since the March 2020 year end was losses due to changes in financial assumptions (primarily in respect of inflation), which increase the present value of scheme liabilities, partially offset by an increase in value of scheme assets.
The key assumptions used in the IAS 19 valuation of the scheme are set out in note 28.
For the avoidance of doubt, the strategic report covering pages 1 to 51 has been approved by the Board and signed on their behalf by:
David SmithChief Financial Officer20 May 2021
25Annual Report & Accounts 2021
Strategic Report

The overall objective of our strategy is to deliver sustainable growth, creating long-term value for our stakeholders.
Our progress is measured by a range of financial and non-financial key performance indicators (KPIs). Understanding measurements that give us insight into issues such as customer satisfaction, health and safety and employee engagement help us enhance our performance and are vital in ensuring our progress is sustainable.
Meanwhile measures such as orders, organic revenue growth, profitability and cash flow track our financial performance. Similar indicators are used to review performance in each of the Group’s business units and where relevant, are accompanied by indicators specific to those business units.
During FY21 we reviewed and updated our non-financial KPIs to reflect our priorities and those of our stakeholders. We added greenhouse gas emissions as a KPI, evolved our early careers KPI to be global (previously UK only) and while we will continue to report and monitor voluntary employee turnover, it is no longer a KPI. We have evolved our early careers target from UK only to global.
See Responsible & sustainable business on pages 39 to 47.
Non-financial KPIs
Description
The Net Promoter Score is an internationally recognised metric for customer satisfaction. The NPS is calculated by deducting the percentage of customers who are detractors from the percentage who are promoters, and can therefore range from -100 to +100.
Description
The Lost Time Incident (LTI) rate is calculated using the total number of accidents resulting in at least one day taken off work, multiplied by 1,000 divided by the average number of employees in that year.
Performance this year
Our customer feedback score remains in the category of “Good” supported by our continual improvement approach to actioning customer feedback. We have seen a decrease in score against the prior year with the sample size increasing, however no systemic trends have been identified.
Performance this year
Our LTI decreased slightly in FY21 to 2.6, from 2.7 in FY20, supported by our ongoing commitment to safety through our Safe for Life programme and new EHS strategy (see page 42).
Link to strategy
Measuring customer satisfaction provides us with insight into our customers’ views. Complemented with qualitative surveys, this provides us with actionable insights that enable us to improve our customer experience.
This supports our ambition of becoming our customers’ chosen partner which requires a relentless focus on meeting their needs in both our home countries and overseas.
Customer satisfaction is a metric used for the Bonus Banking Plan.
Link to strategy
As a company it is imperative we operate with the highest level of safety. Not only is this the right thing to do for our people, but for our customers who entrust us with safety-critical work.
The safety, health and wellbeing of our people is therefore intrinsically linked to our strategic success.
49(FY20: 59)
Customer satisfaction (Net Promoter Score)
FY20
FY19
FY21 49
59
50
2.6(FY20: 2.7)
Health and safety (LTI)
FY20
FY19
FY21 2.6
2.7
4.4
Key Performance Indicators
26 QinetiQ Group plc

Description
The total number of our early careers community (apprentices, graduates, sponsored students) as a percentage of our global workforce. (We have previously only reported our UK performance).
Description
In FY19 we implemented Peakon, an employee engagement measurement tool, which provides regular insights into how our people feel about working at QinetiQ, enabling us to identify what we are doing well, but also where we can improve and take action.
Description
In FY19 we set a target to reduce our scope 1 and scope 2 greenhouse gas emissions, by 25% from the FY19 baseline, aligned with science based targets.
Performance this year
We have increased our investment in early careers and in the UK our early careers population increased from 2.3% to 3.6% of the UK workforce. We are now measuring this metric globally and the global proportion is 3.3% (see page 44).
Performance this year
At the end of FY21 our engagement score increased to 7.3, supported by our “Engagement in Action” programme. There is still more to do and we will continue to build on our progress, implementing initiatives aimed at improving the experience of our employees (see page 43).
Performance this year
In FY21 we achieved a significant reduction in our scope 1 & 2 emissions (see page 40) making good progress towards our FY25 target. This benefitted from changes to ways of working due to COVID-19, reducing our emissions.
Link to strategy
As a knowledge-based business it is critical to our long-term viability that we develop the next generation of employees.
This year we updated this KPI to be global, to reflect our global business and the maturing nature of our international operations.
Link to strategy
Employee engagement is a key part of sustaining our strategy. Having an engaged workforce delivers increased productivity and retention. Improving employee engagement is essential to creating a positive culture within QinetiQ and aligns with our behaviour of “listen”.
Link to strategy
Setting a target and measuring and reporting our greenhouse gas emissions is an important way to demonstrate our commitment to addressing climate change, a critical part of our sustainability strategy, and underpinning our wider business performance.
3.3(FY20: 2.3% UK)
Early careers talent (%)
7.3(FY20: 6.9)
Employee engagement (Score out of 10)
29,444(FY20: 35,587)
Greenhouse gas emissions Scope 1 & 2 (tonnes CO2e)
FY20 (UK)
FY19 (UK)
FY21 (Global) 3.3%
2.3%
4.0%
FY20
FY19
FY21 7.3
6.9
6.3
FY20
FY19
FY21 29,444
35,587
41,073
27Annual Report & Accounts 2021
Strategic Report

Description
This is the level of new orders and amendments to existing orders booked in the year. This provides a measure of the Group’s ability to sustain and grow QinetiQ. While some orders are booked and delivered in-year, the level of orders booked in the year is one indicator of future financial performance.
Description
This represents revenue derived from non-UK customers, that was recognised in the period. International revenue demonstrates the Group’s ability to win and deliver work outside of the UK. Building a global defence and security business and leveraging Group-wide capabilities is a core pillar of our strategy.
Description
The Group’s organic revenue growth is calculated by taking the increase in revenue over prior year pro-forma revenue, at constant exchange rates. It excludes the impact of acquisitions and disposals. See glossary for definition.
Performance this year
Orders in the year were £1,151.0m, up by 18%, or by 11% on an organic basis. This organic increase was driven by EMEA Services where orders grew by 26% on an organic basis due to excellent growth in EDP orders. In Global Products orders declined by 26% on an organic basis due to contracting delays in the US and a large order for the European Space Agency in the prior year. This was offset by the contribution from MTEQ in the US.
Performance this year
Non-UK revenue grew by 26% (£87.0m) to £420.4m in FY21. This was driven by an inorganic contribution of £98.9m in the US, following the acquisition of MTEQ in 2019. On an organic basis international revenue marginally declined due to COVID-19 significantly impacting Global Products shipments in QTS and OptaSense (before disposal).
Performance this year
Revenue grew by 10% on an organic basis, driven by a strong performance in EMEA Services where organic revenue growth was 15%, due to excellent growth in EDP and good delivery on the LTPA contract. This was partially offset by an organic decline of 6% in Global Products, reflecting COVID-19 disruption in QinetiQ Target Systems, OptaSense and our existing US operations.
Link to strategy
Order intake enables us to assess the effectiveness and execution of our strategy which is designed to grow the Group. Order intake is used as a metric for the Bonus Banking Plan, but for executive remuneration purposes is adjusted to exclude businesses acquired during the year.
Link to strategy
Growing our international revenues and leveraging Group-wide capabilities to support growth is a core pillar of our strategy, which aims to deliver long-term sustainable growth for shareholders. International revenue was previously used as a metric for remuneration purposes in the Deferred Share Plan in FY20. It is no longer used for remuneration purposes but remains a key KPI.
Link to strategy
Organic revenue growth demonstrates the Group’s ability to grow market share and sources of revenue within its chosen markets before the effect of acquisitions, disposals and currency translation. Delivering long-term sustainable growth is critical to our success. Our organic growth rate reflects the successful execution of a relevant and consistent strategy.
£1,151.0m(FY20: £972.1m)
Orders (£m)
FY20
FY19
FY21 £1,151.0m
£972.1m
£776.4m
£420.4m(FY20: £333.4m)
International revenue (£m)
FY20
FY19
FY21 £420.4m
£333.4m
£273.7m
10%(FY20: 10%)
Organic revenue growth (%)
FY20
FY19
FY21 10%
10%
8%
Key Performance Indicators
Financial KPIs
28 QinetiQ Group plc

Description
The earnings before interest and tax, excluding all specific adjusting items. See glossary for definition.
Description
The underlying earnings, net of interest and tax, excluding all specific adjusting items, expressed in pence per share. See glossary for definition.
Description
This represents net cash flow from operations before cash flows of specific adjusting items and capital expenditure. See glossary for definition.
Performance this year
Underlying operating profit increased by 14% (£18.6m) to £151.8m. This includes an inorganic contribution of £11.8m from the acquisitions of MTEQ and NSC, completed in the prior year, as well as a £1.8m contribution from the acquisition of Naimuri, completed in July 2020. This was partially offset by the disposals of Boldon James, Commerce Decisions and OptaSense. On an organic basis underlying operating profit increased by 6%.
Performance this year
Underlying earnings per share grew by 11% (2.1p) to 22.1p, with the higher growth in underlying operating profit partially offset by a higher effective tax rate (see note 9).
Performance this year
Underlying net cash flow from operations was particularly strong, growing by 12%. This reflects a strong profit performance and low working capital unwind from the good position at the end of FY20.
Link to strategy
Underlying operating profit is used by the Group for performance analysis as a measure of operating profitability. Specific adjusting items are excluded because their size and nature mask the true underlying performance year-on-year.
Link to strategy
Underlying EPS provides a measure of the earnings generated by the Group after deducting tax and interest. Specific adjusting items are excluded because their size and nature mask the true underlying performance year-on-year.
Link to strategy
This provides a measure of the Group’s ability to generate cash from its operations and gives an indication of its ability to make discretionary investments in facilities and capabilities and pay dividends to shareholders.
£151.8m(FY20: £133.2m)
Underlying operating profit (£m)
FY20
FY19
FY21 £151.8m
£133.2m
£124.9m
22.1p(FY20: 20.0p)
Underlying earnings per share (p)
FY20
FY19
FY21 22.1p
20.0p
19.7p
£199.0m(FY20: £177.8m)
Underlying net cash flow from operations (£m)
FY20
FY19
FY21 £199.0m
£177.8m
£135.3m
29Annual Report & Accounts 2021
Strategic Report

Risk managementOur approach to identifying and managing risks
How we protect our businessEffective management of current and emerging risks is critical to achieving our strategic goals. Our Group Director of Risk & Governance has oversight and responsibility for risk management across the organisation, providing risk expertise and support to the businesses and reporting risk information to the Global Leadership Team, the Board and its Audit and Risk & Security Committees.
Risk processes cannot operate in isolation and, like safety and security, must work within an appropriate culture to create effective risk based decision making. Our Group-wide risk management framework supports and develops the risk culture within the organisation to inform our decision-making at both the strategic and operational levels, adopting both a top-down and bottom-up approach. Our culture and risk management processes together enable us to be stronger and more resilient in the face of challenges, managing threat and optimising opportunity, to support the long-term success of our business. The risk management framework continues to evolve with our business and the rapidly changing external environment in which we operate to ensure we are best placed to deliver results, while simultaneously innovating for our customers’ advantage.
Principal risksThe Group Risk Register consists of material risks relating to the effective delivery of our strategy. The Board and Global Leadership Team look to assess these principal risks from a number of different perspectives, both individually and collectively. The Board recognises that some risks may be affected by factors outside the control of the Company and that despite the robustness of the risk management processes they cannot provide absolute assurance and unknown risks may manifest without warning. We have proven processes in place to rapidly deploy appropriate management in these situations, and utilise lessons learned across the organisation as part of our ongoing drive for continuous improvement. These were successfully deployed in the early stages of the COVID-19 pandemic and proved to be effective and deliver business resilience.
Over the past 12 months one new material risk has been included in our Group risk profile relating to the successful delivery of our ambitious US growth strategy. The Mergers and Acquisition risk has increased in likelihood due to the heightened growth ambition coupled with our recent acquisition in the US (read more on our performance in the US on page 21). Despite the major global crisis created by the COVID-19 pandemic and the rapidly changing external environment all other risks have remained stable owing to the resilience of our business model and our effective crisis and risk management processes. Identifying, attracting and retaining the right people now and
in the future is essential to QinetiQ’s success and while the associated Group risks have previously been mitigated to a level that they are no longer considered to pose a principal risk to QinetiQ, they remain a key consideration in our operational and strategic planning and, where localised risk remains, are included and managed within other identified risks.
Emerging risksWe define emerging risks as newly developing or changing risks, where the extent and implications are not yet fully understood. These risks are identified and managed using the same established risk management framework as our principal risks and are included as part of our strategic planning process to ensure we capitalise on the opportunity and minimise the downsides they present. Where appropriate we establish “Working Groups” to monitor and scrutinise the potential impacts of the emerging risks and ensure relevant mitigation actions are undertaken at pace. We also consider the wider impact of emerging external risk, for example where a risk creates challenges for our customers it may create an opportunity where we have well aligned capability to further support them, and therefore allows us to make good progress in the current environment.
The evolving COVID-19 pandemic has, to date, had limited impact on our operations. Our sites and facilities have remained open; we quickly transitioned to a hybrid remote working model and accelerated our digital transformation programme to support new ways of working. Overall this has meant we are more globally connected and have maintained our top priority of protecting our people’s health and wellbeing. Looking forward the potential global economic impacts of the pandemic and their subsequent effect on QinetiQ remain uncertain.
Whilst Brexit has had negligible operational impact on QinetiQ to date we continue to monitor this as a developing risk because of the ongoing uncertainty around the potential broader, including economic, ramifications. We have and continue to undertake robust mitigation throughout the Brexit transition, including proactive management of supply chain dependencies and ensuring our employees and systems were prepared for any resultant changes, including in the regulatory environment.
We recognise that ESG concerns are rapidly moving up our investors’ and stakeholders’ agenda and our subsequent need to ensure we provide visibility on the materiality of the potential risks and how we are managing them. We have a well-established Corporate Responsibility & Sustainability (CR&S) Programme in place, bolstered by robust sponsorship from the Global Leadership Team and our Board, to ensure we are identifying and managing the ESG risks to our company, including compliance with legislative and reporting requirements.
30 QinetiQ Group plc

Through 2020 issues such as climate change, the COVID-19 pandemic, a growing focus on diversity and inclusion, new customer requirements (e.g. social value in UK Government procurement) and defence ethics were all key topics. We carefully track the emerging ESG risks, assessing their potential impacts and where necessary building in additional workstreams under the CR&S Programme to ensure robust mitigation is undertaken. To reflect the growing importance and necessary focus, our CR&S Director now reports on the Programme directly to the Board, rather than via a sub-committee.
We have described our approach to ESG in more detail in the responsible and sustainable business section of this report (pages 39 to 47).
Risk management and assurance activityThree lines modelOur risk management and assurance activity follows the established three lines model with the first and second line reporting to Global Leadership Team and Board, and the third line reporting to the relevant Board Committees. The first line is performed by operational management, who own and manage the risks in accordance with the Group Operating Model; the second line is performed by the compliance, assurance and risk functions; and the third line is performed by the internal audit team and external assurance providers.
BoardResponsible for effective risk management and internal control across the QinetiQ Group
Set risk appetite and assess principal and emerging risks
Audit Committee and Risk & Security CommitteeReceive reports from the
assurance functionsMonitor and review the
principal and emerging risksRisk deep dives Monitor the effectiveness
of internal controls
Global Leadership TeamIdentify and monitor the principal and emerging risks, as well as material risks (including operational)
reported from the businesses and Group functions
Management Independent Assurance
1st LineManagers identify and evaluate risks
Design and operate internal controls and other mitigation measures
Application of risk appetite, delegated authorities, policies, procedures
and codes of practice
Report risks through relevant reporting and escalation processes
Manage the day to day operational risks
2nd LineRisk Management and other oversight functions with limited independence
Design and facilitate the risk management processes
across the Group
Provide risk expertise and support
Responsible for continually improving the risk management
process across the Group
Monitor compliance with policies and standards
Report to the Board and the Global Leadership Team
3rd LineInternal Audit and other external independent assurance providers
Review and evaluate risk management activity and provide assurance over the effectiveness
of the control environment
Manage the confidential reporting process
Report to the Board and the Global Leadership Team
The three lines model
31Annual Report & Accounts 2021
Strategic Report

Risk management continued
Cautious Balanced Eager
Commercial
Opportunities relating to increased market share where we have proven delivery into existing markets
Opportunities that translate proven delivery into new markets
Opportunities that translate new capability or delivery into existing customers
Opportunities that involve new capability or delivery into new markets
Operational
Operational delivery
Compliance with legal and regulatory requirements
QinetiQ risk appetiteThe Board identifies and reviews its tolerance to risk by establishing a clear risk appetite and setting appropriate delegations of authority to the executive and senior leaders. We focus on those critical risk areas necessary to achieve our strategic goals. Risk appetite is articulated by defining three categories which balance scrutiny and mitigation activity against likely benefit:
CautiousAvoidance of uncertainty – with negligible or low residual risk. Applying innovation prudently where the risks are fully understood.
BalancedPreference for delivery options that have a low or moderate degree of residual risk. Applying innovation only where successful delivery is likely.
EagerWilling to consider delivery options with greater inherent risk and eager to be innovative.
Strategic risks
Execution of our UK growth strategy
Risk Impact Mitigation
UK Government budget constraints lead to reduced spending in core markets in which we operate. This and the ever increasing pace required to introduce new technology to respond to emerging threats results in a risk that our approaches/offerings for evaluating capability may not remain relevant.
COVID-19:There remains the potential for this risk to be exacerbated by the impact of COVID-19 both requiring different approaches to deliver in a COVID secure way and any impact on Government spending.
A reduction in revenue and associated profitability from the Group’s UK Defence and Security contracts.
Our strategy is focused on leading and modernising UK test and evaluation in support of our UK and overseas customers’ objectives and developing our training and mission rehearsal and data intelligence/cyber businesses. This includes ongoing proactive engagement with our major customers to enable us to support their objectives through mission-led innovation.
Our focused investment into contracts enhances our offerings that support our customers with their efficiency challenges as well as ensuring that we provide the right services as the threat environment continues to evolve. We continue to deliver new customer solutions and are increasingly moving towards modelling and synthetics, as well as embracing the next generation of digital transformation.
We are expanding the links between our UK and global Test & Evaluation business as evidenced through securing the contract to build and operate the Queensland Flight Test Range and post Brexit will maintain relationships with the UK Government to support bilateral relationships within Europe; there is increased recognition that T&E is an enabler to military capability and prosperity.
MetricsCustomer satisfaction All financial KPIs
ResponsibilityGroup Function Director Business Development Managing Directors A&S, M&L and C&I
Risk appetiteEager
Likelihood/ImpactMedium/Medium
Proximity/Velocity1-2 yrs/Medium
StrategyGlobal LeverageDistinctive OfferingsDisruptive Innovation
32 QinetiQ Group plc

Execution of our US growth strategy
Risk Impact Mitigation
There is a risk that the US Business will be unable to establish a robust and distinct position in the marketplace and deliver our significant growth ambitions, resulting in impact to the strategic direction of the Group and potential reputational damage.
COVID-19:The ongoing impact of the pandemic may exacerbate this risk through increased customer budget constraints.
Adverse impact on the Group’s financial performance.
Our US strategy is focused on developing our relationships with the DoD through mission-led innovation at pace in areas of technology such as robotics and autonomy, sensor solutions and systems, artificial intelligence and maritime systems where we feel we have strong technology capability and the ability to deliver the most appropriate products or services. We have developed specific and ambitious growth strategies for the US and are developing our capability to enact those strategies through robust operational integration.
We undertake extensive due diligence, taking the appropriate professional advice to ensure structural, regulatory, legal and political risks are understood and minimised. In addition, our US business is included in our Group Audit and Assurance plans.
The creation of single routes to market enables our in-country team to leverage the global QinetiQ brand and our Group-wide capabilities; maximising the opportunities to cross-sell and offer more comprehensive solutions to the domestic challenges our US customers face.
We are maturing our global end-to-end processes and systems, and the integration of our US business, as well as the global leverage of capabilities, such that we can act with agility and pace in response to our US customer requirements.
MetricsAll financial KPIsUS revenue as % of total revenue
ResponsibilityPresident US Business
Risk appetiteBalanced to Eager
Likelihood/ImpactHigh / Very High
Proximity/Velocity0-1 yrs/Medium
StrategyGlobal LeverageDistinctive OfferingsDisruptive Innovation
International strategy
Risk Impact Mitigation
Our International Business conducts business in a number of markets, including Australia, Canada and Germany. Plans to grow these businesses to achieve our Global Leverage may be impacted by external influences outside of our control, such as geo-political risks, or specific risks arising from working in new markets and globalised operation. Political uncertainties, including the UK leaving the EU could also impact the availability and focus of customer budgets.
COVID-19:The ongoing impact of the pandemic may exacerbate this risk through increased budget constraints and restrictions on International travel however the acceleration of our digital investment programme has resulted in increased connectivity across our international businesses.
Unable to realise expected growth in the planned timeframes.
Our international strategy is focused on our home and priority markets where we feel we have the best routes to access with the most appropriate products or services. We have developed specific and ambitious growth strategies for Australia and our three priority markets.
We undertake extensive due diligence, taking the appropriate professional advice to ensure structural, regulatory, legal and political risks are understood and minimised. In addition, our international businesses are included in our Group Audit and Assurance plans.
The creation of single routes to market enables our in-country teams to leverage the global QinetiQ brand and our Group-wide capabilities; maximising the opportunities to cross-sell and offer more comprehensive solutions to the domestic challenges our customers face.
We are maturing our global end-to-end processes and systems, as well as the global leverage of capabilities, such that we can act with agility and pace in response to our customer requirements.
MetricsAll financial KPIsInternational revenue as % of total revenue
ResponsibilityManaging Director, International Managing Director, A&S
Risk appetiteBalanced to Eager
Likelihood/ImpactHigh/High
Proximity/Velocity0-1 yrs/Medium
StrategyGlobal LeverageDistinctive OfferingsDisruptive Innovation
33Annual Report & Accounts 2021
Strategic Report

Strategic risks continued
Risk management continued
Innovation strategy
Risk Impact Mitigation
Failure to innovate to enable the realisation of new ideas for our customers and our organisation in the face of market and environmental changes such as rapidly evolving customer needs, technological change and increased competition.
Specifically failure to:
• Create a culture of innovation;• Develop relevant business models,
processes and products/services; • Attract and retain the right talent.
COVID-19: The global implications of the pandemic, both internally and for our customers, have provided an opportunity for increased innovation in collaborative working and customer engagement through digital means.
Negative impact on the Group’s market position, competitiveness, future growth.
Global initiatives to ensure innovation and the necessary underlying culture is embedded across the Group, including:
• Investment in innovative approaches and tools, for example the use of digital platforms to provide enhanced collaboration environments for our employees and customers, and virtual environments to demonstrate our capabilities;
• Diversity and Inclusion programmes to drive and foster diverse thinking;
• Commercial innovation, including agile approaches to contracting;
• Ensure we identify, attract and retain the right people now and for the future.
Ongoing Group-wide communications and training to drive understanding and adoption of our mission-led innovation ethos, to deliver better operational outcomes for customers and end-users; working collaboratively to solve complex problems, at pace.
Metrics Customer satisfaction Employee engagement
Responsibility Group Function Director Business Development Group Function Director Strategy & Planning Group Function Director Technical Group Function Director Human Resources
Risk appetite Balanced
Likelihood/Impact High/High
Proximity/Velocity 1-2yrs/Low
Strategy Global Leverage Distinctive Offerings Disruptive Innovation
A material change to the UK Government’s use of existing large contracts
Risk Impact Mitigation
The Long Term Partnering Agreement (LTPA) is a 25-year partnering contract with the UK MOD to provide test, evaluation, and training services.
The Engineering Delivery Partnership (EDP) programme is a 10 year agreement delivered by the Aurora Engineering Partnership and is established as the default route for contracted engineering services for UK MOD Defence Equipment & Support (DE&S) and is also available to the wider UK MOD.
UK Government budget constraints, could lead to a material change in use of these large contracts.
COVID-19: Budget constraints may be exacerbated by the impact of the pandemic.
The LTPA and EDP directly contribute a material proportion of the Group’s revenue and earnings and if utilisation of these contracts were to change, our financial performance could be adversely impacted.
We are investing significantly into the LTPA capabilities to ensure they remain relevant and modern. The investment portfolio is agile to changing customer needs and technological advances to ensure we remain at the cutting edge.
At the end of March we transitioned to a fully output based contract, an approach that delivers clear outputs to customers, measured through the delivery of event types. This enables us to capitalise on opportunities delivering outputs in new and agile ways, optimising the efficient delivery of the contract.
EDP is a collaborative programme with DE&S and our Aurora partners, that provides customers with key capacity and capability, focused on long-term outcomes that maximise efficiencies and operational performance. By undertaking larger programmes of work, we are able to leverage our scale and drive out duplication. Our customer solutions have consistently demonstrated our ability to achieve challenging value for money and performance targets.
Metrics All financial KPIs except orders Customer satisfaction
Responsibility Managing Director M&L Managing Director A&S LTPA Portfolio Director
Risk appetite Balanced
Likelihood/Impact Medium/ High
Proximity/Velocity 0-1yrs/Low
Strategy Global Leverage Distinctive Offerings Disruptive Innovation
34 QinetiQ Group plc

Mergers and acquisitions
Risk Impact Mitigation
M&A activity continues to form a key element of our strategic growth plans in order to expand our customer offerings within our home markets of the UK, the US and Australia, as well as in our priority growth markets. There is a risk that our new acquisition selection and integration do not realise the maximum potential benefits.
COVID-19: The ongoing effects of the pandemic may exacerbate this risk, including the impact of potential customer budget constraints.
Adverse impact on the Group’s financial performance.
Robust governance is underpinned by the M&A Committee, which reports to the Board, and the relevant Integration Steering Committees for newly acquired companies.
All acquisitions are thoroughly assessed for strong strategic alignment for value creation potential and for integration risk. Extensive due diligence involves internal experts and a variety of external advisory companies, and every integration is managed separately to ensure focus. Best practice, learned from successful integrations, is rigorously applied to each new transaction.
Portfolio rationalisation is ongoing where appropriate, including the disposal of OptaSense, Boldon James and Commerce Decisions.
Metrics Inorganic Growth Revenue & Profit
Responsibility Group Function Director Strategy & Planning Group Managing Directors Chief Financial Officer
Risk appetite Balanced
Likelihood/Impact High/High
Proximity/Velocity 1-2yrs/Low
Strategy Global Leverage Distinctive Offerings
The transformation and digitisation programme
Risk Impact Mitigation
The Transformation and Digitisation Programme aims to position QinetiQ for further growth by globalising consistently around the customer to deliver excellence. In order to achieve this we must invest in our processes and systems to embed a robust Global Operating Model, supported by digital transformation, including improved technology, data and analytics. This requires significant alignment and effort across the Group as well as cultural and behavioural changes.
There is a risk that the investment required to achieve the intended outcomes is greater than budgeted, that the programme benefits are not fully realised and our Group ambitions are constrained.
COVID-19: The global restrictions imposed as a consequence of the pandemic presented the opportunity to accelerate parts of our digital programme resulting in enhanced global connectivity and the rapid adoption of hybrid-working.
Failure to realise benefits will challenge our ability to meet our strategic growth targets and limit our capacity to scale affordably.
Global Leadership Team workstream sponsorship and Group-wide stakeholder engagement.
Budget and scope managed through a robust project governance model reporting to the Global Leadership Team and Board that gives sufficient flexibility to respond to changing customer needs but with the guiderails in place to identify and control potential cost overruns.
Benefits realisation is managed through a strong focus on change management to drive adoption and the required changes to behaviours. For example key functions creating their own roadmaps to deliver a globalised service sponsored at Global Leadership level.
Identify and deploy the right people to deliver the programme and maximise the benefits.
Metrics Customer satisfaction Employee Engagement All financial KPIs
Responsibility Group Function Director Business Transformation & Services
Risk appetite Balanced
Likelihood/Impact High/High
Proximity/Velocity 0-1yrs/Medium
Strategy Global Leverage Distinctive Offerings Disruptive Innovation
35Annual Report & Accounts 2021
Strategic Report

Operational risks
Risk management continued
Significant breach of relevant laws and regulations
Risk Impact Mitigation
We operate in highly regulated environments across many jurisdictions. Non-compliance to existing and new requirements, such as the Task Force on Climate-related Financial Disclosures (TCFD), presents risks to people, property and the environment as well as having the potential to compromise our ability to conduct business in certain markets, potentially having an impact on a variety of stakeholders.
COVID-19: The consequences of the pandemic, including increased hybrid working and reduced numbers on-site, has the potential to exacerbate the risk of a safety or regulatory non-compliance.
Failure to comply with particular regulations could result in serious detriment to people, property and the environment, and/or a combination of fines, penalties, civil or criminal action, suspension or debarment from government contracts, as well as significant reputational damage to QinetiQ.
Maintaining and strengthening a proactive safety and regulatory compliance culture across the Group is a key part in minimising the risk of a failure.
The Group Operating Model clearly defines lines of responsibility through the organisation. In addition we have robust policy, procedures and mandatory training in place. The QinetiQ Code of Conduct sets out clear expectations for the Group and its employees; in some areas, such as bribery and corruption, the company adopts a zero tolerance approach.
We drive continuous improvement using a range of approaches such as audit and evaluation, focused training, strategic improvement programmes, and business objectives.
One example is our Group-wide Health, Safety and Environment strategy where each manager in the Group shares a supporting collective objective delivering personal ownership towards continuous safety improvement.
The effectiveness of our Internal Controls Framework is tested via the use of a Group-wide Board Assurance Map.
ESG risks are robustly managed under the CR&S Programme.
Metrics Health, Safety & Environment Mandatory training compliance Commercial intermediary monitoring
Responsibility Company Secretary/Group General Counsel Group Function Director Technical Group Managing Directors
Risk appetite Cautious
Likelihood/Impact Medium/High
Proximity/Velocity 0-1yr/High
Strategy Global Leverage Distinctive Offerings
Security and IT systems
Risk Impact Mitigation
A breach of physical or data security, cyber-attacks or IT systems failure leading to loss of customer or company information could have an adverse impact on our reputation, customer confidence and operational delivery.
COVID-19: The consequences of the pandemic, including increased hybrid working, has the potential to exacerbate the data and cyber security risks.
Significant reputational damage, as well as service interruptions and the possibility of withdrawal of our accredited status (our “licence to operate”) resulting in exclusion from some types of government contracts and subsequent impact on orders, revenue and profit.
As a key supplier in the Sovereign National Security supply chain, we must ensure that the organisation’s security meets Governments’ and other relevant requirements worldwide. We employ a holistic security threat approach through four interlocking pillars: Physical, Information, Cyber and Personnel Security. Our changing and increasingly sophisticated threat environment is continuously reviewed, using appropriate tools and techniques, as part of our over-arching Security Strategy such that new and emerging threats are removed or mitigated, ensuring our strategy appropriately balances the security, cost and flexibility required for any given solution.
Our programme of continuous security improvement includes:
• A Group Cyber Security Standard; • Targeted Cyber Security Training for key IT employees;• Deployment and continual upgrade of cyber security detection
and protective technologies;• Annual strategic security reviews;• Mandatory security awareness training for all employees and
contractors;• Continuous Group-wide communications to employees;• Annual group-wide Security Culture survey;• Regular updates to the Risk & Security Committee.
Security culture, behaviour and ensuring our people have appropriate awareness of the threats to our organisation is critical to our risk mitigation. To further embed this we have introduced collective security objectives for our Leadership Teams.
Our on-going digital transformation and IT improvement programme continues to deliver improved IT robustness through a range of approaches including renewing IT systems and moving to cloud based solutions.
Metrics Cyber dashboard Security dashboard
Responsibility Group Director Transformation and Business Services
Risk appetite Cautious
Likelihood/Impact High/High
Proximity/Velocity 0-1yr/High
Strategy Global Leverage Distinctive Offerings
36 QinetiQ Group plc

Longer-term viability assessment Assessing the prospects of the Group The Group’s corporate planning processes involve the following individual processes covering differing time frames:
1. An annual Integrated Strategic Business Plan (ISBP) process that looks at the financial outlook for the following five years. This process commences with an assessment of the orders pipeline producing an order intake scenario. A review of the phased delivery profile and the cost base required to support this enables generation of base-case, high-case and low-case profit forecasts. Capex and working capital requirements are also collected, reviewed, approved and a cash flow produced for the plan period;
2. An annual budget process that covers the first year of the five-year planning horizon in detail;
3. A bi-annual forecast process to update the view of the first budget year (the year which would be in progress);
4. A rolling monthly “latest best estimate” process to assess significant changes to the budget/forecast for the year in progress; and
5. The financial impact of principal risks (individually and cumulative), together with mitigating actions.
The corporate planning process is underpinned by assessing scenarios and risks that encompass a wide spectrum of potential outcomes, both favourable and adverse. The downside risk scenarios are designed to explore the resilience of the Group to the potential impact of all the significant risks set out on pages 32 to 36, or a combination of those risks.
The scenarios are designed to be severe but plausible, and take full account of the availability and likely effectiveness of the mitigating actions that could be taken to avoid or reduce the impact or occurrence of the underlying risks, and that realistically would be open to them in the circumstances. In considering the likely effectiveness of such actions, the conclusions of the Board’s regular monitoring and review of risk and internal control systems, as discussed on page 83, is taken into account.
Alongside the annual review of risk scenarios applied to the strategic plan, performance is rigorously monitored to alert the Board and Global Leadership Team to the potential crystallisation of a key risk.
COVID-19 can manifest itself on Group performance through two key factors: lack of availability of key resource to provide our services due to illness or H&S restrictions; reduced availability of funds to our customers to procure our services. Both are considered within the Group’s sensitivity analysis, with the former becoming a lower probability risk as the successful vaccination programme rolls out.
We consider that this stress-testing based assessment of the Group’s prospects is reasonable in the circumstances of the inherent uncertainty involved.
The period over which we confirm longer-term viabilityThe period over which the Directors consider it possible to form a reasonable expectation as to the Group’s longer-term viability is the five-year period to 31 March 2026. This is the period covered by our strategic planning process and is subject to stress-testing and scenario planning around potential risks. It has been selected because it presents the Board and readers of the Annual Report with a reasonable degree of confidence while still providing an appropriate longer-term outlook.
Confirmation of longer-term viability As noted on page 116, the Directors confirm that their assessment of the principal risks facing the Group was robust. Based upon the robust assessment of the principal risks facing the Group and their stress-testing based assessment of the Group’s prospects, all of which are described in this statement, the Directors have a reasonable expectation that the Group will be able to continue in operation and meet its liabilities as they fall due over the period to 31 March 2026.
Going concern statementThe Group’s activities, combined with the factors that are likely to affect its future development and performance, are set out on pages 18 to 36. The Chief Financial Officer’s review on pages 22 to 25 sets out details of the financial position of the Group, the cash flows, committed borrowing facilities, liquidity, and the Group’s policies and processes for managing its capital and financial risks. Note 27 on page 150 to the financial statements also provides details of the Group’s hedging activities, financial instruments, and its exposure to liquidity and credit risk.
The Group meets its day-to-day working capital requirements through its available cash funds and its bank facilities. The COVID-19 crisis has introduced considerably more uncertainty across markets globally. As such the market conditions in which the Group operates are expected to be challenging as spending from the Group’s key customers comes under pressure. Despite these challenges, and considering the decisive action already
taken by management to maintain the strength of our business, the Directors believe that the Group is well positioned to manage its overall business risks successfully.
After making enquiries, the Directors have a reasonable expectation that the Group has adequate resources to continue in operational existence for the foreseeable future. The Group therefore continues to adopt the going-concern basis in preparing its financial statements.
The Group is exposed to various risks and uncertainties, the principal ones being summarised in the “Principal risks” section on pages 30 to 36. Crystallisation of such risks, to the extent not fully mitigated, would lead to a negative impact on the Group’s financial results but none are deemed to be sufficiently material to prevent the Group from continuing as a going concern for at least the next 12 months.
37Annual Report & Accounts 2021
Strategic Report

Customers QinetiQ customers value the relationships we build with them and the time we invest in understanding their needs. They appreciate the depth and breadth of knowledge we apply to providing them with mission critical solutions and the flexibility we show in helping them reach their goals. They expect delivery to be on time, every time and to the highest standards.
How we engage Impact of engagement
Every QinetiQ customer has a delivery team continually engaging with them and adapting our approach to ensure their objectives are achieved. In addition, we regularly take the time to step back and listen and act upon our customers’ views on our performance and relationships through our formal customer research systems.
Our delivery teams continually adapt our approach to ensure customers’ needs are met. The formal feedback we receive is reviewed at all levels of our organisation to ensure we continuously improve and evolve our business processes and delivery solutions.
Shareholders
Our shareholders value sustainable and long-term growth delivered through the successful execution of our strategy. As part of this, they expect us to do business in a sustainable and ethical manner taking into account other key stakeholders.
How we engage Impact of engagement
We engaged with our shareholders during the year through virtual roadshows, results presentations and the AGM. In addition, our Chairman proactively engaged with shareholders to seek their views on the business, strategy and management team. Our Chair of the Remuneration Committee also met with several shareholders to seek their views on remuneration matters ahead of the AGM.
We greatly value our shareholders’ feedback which is shared with the executive team and the Board. The feedback received during the year has influenced our strategic thinking. Following feedback from investors we have increased our emphasis on ESG related matters and are improving our disclosure accordingly.
Employees Our employees want to work in a safe, diverse and inclusive environment that offers successful and rewarding careers. Our employees greatly value our engagement and efforts to action their feedback.
How we engage Impact of engagement
Our methods of engagement include: Quarterly Peakon surveys, Q-talks, Global roadshows led by our CEO and Global Leadership Team, our Global Employee Voice Group (GEV) and other engagement forums (e.g. works councils), as well as indirectly through feedback on platforms such as Glassdoor.
Our engagement has helped us to identify priority focus areas to improve the employee experience. By listening to our people we have been able to drive improvements in these areas which have been recognised in more recent Peakon surveys (equipment, growth and reward). Engagement with our employees has informed our response to the COVID-19 pandemic and our employees have been supportive of our approach.
Suppliers Suppliers value a collaborative environment where they are treated fairly and are valued regardless of their respective size.
How we engage Impact of engagement
In addition to day-to-day engagement through normal business activity, we actively engaged with key partners through a series of “Board to Board” meetings. We engage with our suppliers through our QinetiQ Collaborate Programme, we seek new suppliers, through our presence at external events and engagement with Small to Medium sized Enterprises through our participation at “Meet the Buyer” events.
This engagement continues to ensure we are partnering effectively to support our customers. It gives us insight into industry developments and ensures effective collaboration between QinetiQ and its partners and suppliers.
Communities Our communities want us to be considerate neighbours but also a source of future employment and opportunities.
How we engage Impact of engagement
We engage via a variety of community investment activity such as outreach, volunteering, supporting local charities and community liaison.
Our community investment activity is viewed positively. Through our community liaison, our regular updates have ensured local people are aware of our activity.Our outreach activity has provided benefit to young people.
Regulators Our regulators expect us to meet high standards of safety and environmental stewardship and legal requirements.
How we engage Impact of engagement
We engage with regulators via meetings, audits and reports. Through engagement we are able to ensure we continue to meet the high standards expected by regulators.
Stakeholder engagementUnderstanding what matters to our stakeholders
Regu
lato
rs
Communities
Our stakeholders
Shareholders
Empl
oyee
s Customers
Suppliers
Our stakeholders
See our Section 172 (1) statement on pages 48 to 49.38 QinetiQ Group plc

Our purposeProtecting lives, defending sovereign capability and securing the vital interests of our customers
Environmental Social GovernanceMaterial issuesClimate Change
Environmental Management Waste and Resources
Conservation and Biodiversity Sustainable solutions for customers
Financing linked to GHG targets
Material issuesEmployee Engagement Diversity and Inclusion
Employee Health Safety & Wellbeing Employee Learning and Development Employee Reward and Recognition
Community investment & STEM outreach
Material issuesBusiness Ethics Code of Conduct
Anti-bribery and Corruption Tackling Modern Slavery
Ethical Trading Policy Responsible & Sustainable Procurement
Leadership Remuneration
Integrity Fully supported by
Board & GLT
Our valuesCollaboration
Industry engagement and leadership Cross-functional approach
Performance MSCI: AA rating
Sustainalytics: A&D Sector Leader
We deliver responsibly, sustainably and for the benefit of all our stakeholders
Responsible and sustainable business
Our Corporate Responsibility and Sustainability (CR&S) strategy underpins our business strategy and is designed to meet stakeholder expectations across environmental, social and governance (ESG) themes. During FY21 we have been focusing on improving how CR&S is embedded in the strategic planning process and a review was undertaken, looking at our core non-financial KPIs. We have introduced some changes, including a new KPI for our greenhouse gas emissions, reflecting our focus on climate change (see page 27). By ensuring we are building ESG into the heart of our strategy and decision making we are better able to manage risks and create value.
To drive continuous improvement we regularly undertake materiality reviews; this structured process allows us to assess global trends, best practice (e.g. connecting with the Sustainable Development Goals), understand stakeholder expectations and align with our business strategy. The landscape is rapidly changing and it is important that we evolve our strategy to ensure we are focused on what is most important. CR&S progress and plans are tracked via monthly performance review by the GLT and we also ensure it is embedded across our risk management process. This ensures delivery of responsible business practice has top level support and is underpinned by strong governance.
Our Risk and CSR Committee has received reports and briefings on all material CR&S issues including business ethics, anti-bribery and corruption, health and safety, diversity and inclusion (D&I), environment, reputational risk and human rights (see page 92). This is supported by committees including the Business Ethics Committee and new Climate Change Steering Group. Following recognition of the growing importance of ESG issues to stakeholders, during FY21 we have transitioned reporting on CR&S to the Board directly, starting at the January Board meeting see page 56.
Collaboration and engagementUnderstanding the current priorities of our stakeholders (primarily customers, shareholders and employees) is achieved through regular engagement. Examples in FY21 include a focus on ESG in one of our Investor Seminars and a range of webinars for our employees. We are proactive in our sector, in FY21 accepting the Chair role for the Sustainability Working Group with our trade body and Industry co-Chair the Climate Change and Sustainability Steering Group in the UK Defence Suppliers Forum. We are also actively collaborating with customers and peers across topics such as ethics, D&I and skills. We have been leading a programme around the Sustainable Development Goals creating information sharing workshops for those in our sector to learn and share best practice.
Our focus on Environmental, Social and Governance issues
Our QinetiQ purpose and strategy is enabled by our high performance inclusive culture, underpinned by our values and behaviours and our commitment to deliver responsibly and sustainably for the benefit of all of our stakeholders.
Strategy, materiality and stakeholder engagement
39Annual Report & Accounts 2021
Strategic Report

In FY19 we set a target to reduce our scope 1 and 2 greenhouse gas (GHG) emissions by 25% by FY25 from an FY19 baseline (aligned with Science Based Targets) and continue to make good progress. We have seen a 28% reduction in our emissions (against the baseline); this has been primarily due to working differently during the COVID-19 pandemic, for example reduced use of QinetiQ vehicles and significantly less employees working on our sites. While it is positive that our emissions were less overall, we do expect some increase in FY22 as we see a change in working patterns.
We have been focusing on developing our net zero strategy and we plan to retain a FY25 target as an interim step. We continue to implement improvement programmes across our business, underpinned by our ISO 50001 certification; some examples of energy efficiency action taken in the year include:
• Upgrades to air conditioning units on our Malvern site, which will increase efficiency and significantly increase the proportion of free cooling. We have seen significant energy savings since installation.
• We have started a programme to remove and replace the use of Sulphur hexafluoride (SF6) within some range equipment. While we only use very small amounts, this refrigerant has a very high global warming potential and so removal equates into a significant reduction of emissions.
• We own and manage a significant number of buildings and so have been emptying buildings no longer used, and moving to “background” heating, to minimise energy use but protect building fabric.
• We have engaged with employees through campaigns such as “the Battle of the Base-load” targeting unnecessary overnight and weekend energy consumption and holiday shutdowns and we have a monthly call with our Energy Champions to discuss projects and ideas.
Environmental stewardship
Responsible and sustainable business continued
FY21 FY20 FY19
Total Scope 1 emissions (tCO2e) 15,872 19,289 20,096
Total Scope 2 emissions (tCO2e) 13,572 16,298 20,977
Total Scope 1 & 2 emissions (tCO2e) 29,444 35,587 41,073
Intensity ratio (tCO2e per £m of revenue) 23 33 45
Energy consumption (kWh) resulting in above reported emissions 122,808,625 139,780,656 N/A
Proportion of energy consumption arising from UK operations (%) 99% 98% N/A
Proportion of emissions arising from UK operations (%) 99% 98% N/A
Figures subject to FY21 assurance process undertaken by PwC.
Greenhouse gas emissions and energy management
Environmental stewardship has never been more important, with climate change and impact on biodiversity ever growing global concerns. We actively play our part through reducing our greenhouse gas emissions, our conservation activities and the solutions we provide for our customers to meet their sustainability agenda.
In FY22 we will focus on:
• Developing our net zero strategy
• Further roll out of sub-metering
• Renewable generation using photovoltaic arrays and assessment of other potential capability
• Electric vehicles and charging infrastructure
PricewaterhouseCoopers LLP (PwC) carried out a limited assurance engagement on selected GHG emissions data for the year ending 31 March 2021 in accordance with International Standard on Assurance Engagements 3000 (revised) and 3410, issued by the International Auditing and Assurance Standards Board. A copy of PwC’s report and our methodology is on our website (www.qinetiq.com/en/our-company/corporate-responsibility/climate-change). A summary of our Scope 1 and Scope 2 emissions is shown above; we have adopted a financial control approach and have used defra emission factors. The figures that have been covered by this assurance process are indicated in the table by the following symbol: We also publish here our energy performance and examples of energy action taken in the year, meeting the SECR (Streamlined Energy and Carbon Reporting) requirements.
Responding to climate change: TCFD reporting During FY21 we have been preparing for the formal Task Force on Climate-related Financial Disclosures (TCFD) reporting requirements, which come into force for large companies in FY22. TCFD requires us to demonstrate our understanding of the impact and opportunities that climate change poses to QinetiQ Group over the short, medium and long term. This is not just physical risks (eg changes to temperature and precipitation) but “transition” risk, such as policy or disruptive technology as the world de-carbonises. To meet this requirement we will be using the framework recommended by TCFD, outlining our approach to governance, strategy, risk management and metrics and targets.
Governance: In FY21 we put in place a new Climate Change Steering Committee which is chaired by our CFO. We have clear oversight by both our GLT and our Board and will report regularly. We will also be working closely with senior leaders responsible for strategy and for risk.
40 QinetiQ Group plc

Environmental stewardship
Strategy: A key area will be for us to outline the actual and potential impacts of climate related risks and opportunities across the Group, and embed consideration of climate change into our strategy and financial planning. We will also be able to consider our resilience under different climate change scenarios.
Risk management: There is no one-size-fits-all methodology and we are selecting appropriate scenarios in order to undertake the physical risk assessments. We have previously undertaken climate change risks assessments for core sites and are looking to build on this to create a robust methodology to roll out to all sites and assets that enables us to identify, assess and then manage climate related risks. We are also working on our approach to transition risk, to reflect the territories where we have sites, customers and suppliers. We know that this is not a one-off exercise, but we will need to develop an approach that allows us to update appropriately.
Metrics and targets: In FY21 we updated our Group non-financial KPIs and will now be tracking our GHG emissions as one of our core KPIs (previously reported but not a KPI). We are transitioning from our current FY25 emissions reduction target (which focuses on scope 1 and scope 2 emission) to a net zero strategy. We will also need to look at specific metrics and targets to assess risk and build into our strategy and risk processes.
See our Non-financial KPIs on pages 26 to 27.
Environmental stewardship As part of our refreshed Global EHS Strategy (page 42), we strengthened our commitment to environmental stewardship. We work to protect our environment, minimising our footprint, seeking to enhance biodiversity and delivering responsibly and sustainably for our customers. This has been the case throughout the pandemic as we’ve maintained our focus on environmental protection while our sites have remained operational, as underpinned by our ISO 14001 certification in the UK and Canada. Environmental issues are reviewed regularly by the MDs and at the Risk & Security Committee.
Our waste target is to increase the annual proportion (%) of UK waste re-used and recycled from our underlying waste production. We have implemented Waste Management Action Plans at our significant waste producing sites which account for 95% of waste produced. Performance declined slightly with 81.5% (FY20: 84.7%) of underlying waste reused or recycled. This was mainly because our Disposals Management Group, as a key enabler of our reuse and recycling activities, was limited by COVID-19 restrictions. However total waste was significantly lower in FY21, down by approximately 34% on the previous year.
During the year we have engaged and communicated with our people on a range of environmental issues, explaining our approach to environmental stewardship and encouraging their participation. Although during the pandemic we’ve had to pause our environmental volunteering programme, we used World Environment Day as an opportunity to engage with our teams through various virtual events. We’ve helped to strengthen the links between good environmental stewardship and good business, for example how the business critical work on St. Kilda has been achieved through meticulous planning for environmental protection in this extremely sensitive habitat. Many of the sites we run on behalf of the UK MOD have significant conservation protection and so our Sustainability Appraisal approach ensures we can balance complex trials with careful protection of rare flora and fauna.
As we see our climate changing we are anticipating changes to habitats and so recognise the need to continue to balance operational resilience alongside potentially new populations of rare species. We also work with organisations such as Marwell Wildlife to facilitate research studies. Using our technical specialists, we took an innovative approach to understanding the potential acoustic impact on marine mammals of a new sea-skimming aerial target, to ensure delivery of a customer trial met our shared high standards of environmental stewardship.
Sustainable solutionsQinetiQ’s global team is driving military land platform electrification through the development of the third generation Modular E-X-Drive transmission. Working with BAE Systems as prime contractor, QinetiQ’s world leading electric drive technology will be integrated into a Bradley Fighting Vehicle for demonstration in summer 2022. As part of a hybrid electric powertrain which is inherently more fuel efficient than a conventional mechanical system, E-X-Drive will deliver improved automotive performance, increased on board electrical power to feed integrated sub systems, as well as carbon emissions reduction supporting the sustainability goals of our customers.
41Annual Report & Accounts 2021
Strategic Report

Responsible and sustainable business continued
We recognise that to support our strategy we must embed a high performance inclusive culture, where health, safety and wellbeing is a priority and our people are engaged, empowered and clear about how they contribute to our success and feel recognised. We strive to be a good neighbour and have a positive impact in the communities that we operate in.
The health and wellbeing of our people and the environment in which we operate are intrinsically linked to our success; with our people, investors and regulators expecting to see a commitment to continuous improvement. A focus area for the strategy has seen the development of a new EHS competency framework, which now clearly frames the knowledge, skills and behaviours needed for people to successfully carry out their role. Leaders and managers play a significant role in cultivating a culture of safety and wellbeing; leading the way and role modelling the right behaviours.
We will continue to provide a framework and tools to improve the conversations and engagement with our people, to communicate a clear message to support our EHS vision and strategy. We have a thriving global network of EHS practitioners, who engage regularly to support global working and share best practice.
COVID-19Engaging regularly with our people, we put in place a range of guidance and controls to protect their safety, health and wellbeing, whether working at home or on site. This has included enabling 80% of our employees to work remotely with practical guidance, and office and IT equipment, developing a “working on site” policy, online training to support safe working on site, COVID-19 testing for those coming onto site and ensuring all our sites adhere to COVID-19 guidance in line with government regulations in each location.
Working through the pandemic has been challenging and so we have provided additional support through flexible working and special paid leave.
We have delivered a series of manager briefings to over 800 managers globally and in January we ran a company-wide, manager led intervention, to engage with our teams on COVID-19 related safety and wellbeing aspects. This has been positively received enabling our people to share their experiences and any challenges they face. We continue to monitor the advice and guidance provided by our home country governments ensuring the right precautions are in place which meet these requirements as well as our company standards.
In March 2021 there was an incident which resulted in one of our employees sustaining serious injuries. We are supporting external investigations and undertaking our own, to better understand what happened and any lessons we can learn and apply (see page 94).
The LTI rate for the whole of the Group is a key non-financial KPI (see page 26) and has decreased from 2.7 in FY20 to 2.6 in FY21. Safety issues are part of a regular governance drumbeat, monthly through MD meetings, quarterly through GLT meetings and the Risk & Security Committee, with six monthly summary overviews to Board. There were no prosecutions, prohibition notices or improvement notices issued by regulators in the UK during the last financial year for safety or environmental matters.
1 LTI rate is calculated as the number of lost time incidents where the employee is away from work for one or more days, times 1,000, divided by the total number of employees.
Lost Time Incident (LTI) Rate1
2020
2021
2.7
2.6
The health, safety and wellbeing of our people is our priority and with COVID-19, support for our people and their families has never been more important. Since 2017 when we launched our three year Environment, Health and Safety (EHS) strategy we have significantly reduced the number of safety incidents and contributed towards driving a new level of safety culture in our company. This year we have updated our EHS strategy with four key themes:
1. Enabling and empowering safe and competent people who are engaged to make informed EHS decisions
2. Building a community of strong, active and visible leaders who have a clear commitment to safety, employee wellbeing and environmental matters
3. Globalising our approach to EHS, so that we strengthen governance, support global working, and share best practice
4. Continuous monitoring and improving to strengthen performance and enhance employee wellbeing while creating a safe, successful and resilient business
Social: Our people and our communities
Improving the safety, health and wellbeing of our people
42 QinetiQ Group plc

Social: Our people and our communities
Our focus for FY22:
• Further improve employee engagement by focusing on our priority improvement areas
• Embed our Global Employee Voice approach
• Launch our global wellbeing strategy
• Continue to develop our approach to new ways of working, including leadership and employee support
Wellbeing The wellbeing of our people has been one of our top priorities as we have navigated the pandemic. We have supported our people through a range of mechanisms, signposting to existing resources, such as our network of Mental Health First Aiders and our Employee Assistance Programme, while creating new guidance and resources, resilience workshops and a focus on managers regularly “checking-in”with their teams - to reflect not only that employees have had to adapt to working differently but also that COVID-19 impacted our wellbeing.
This year we have developed a new global wellbeing strategy, as part of the EHS strategy, which focuses on five pillars: physical health, mental health, personal growth, work environment and financial wellbeing. The strategy sets a five year timeline, to create and sustain a culture that will differentiate us in our sector, where all our people are proud to work and we are focused on both our personal and collective wellbeing.
Engaging with our peopleOur people have adapted quickly to new ways of working due to COVID-19. This has provided an opportunity to create a more flexible and inclusive working environment, with greater choice for our people to ensure they are at their most productive in hybrid ways of working, whether working remotely, on our sites or through a blended approach.
Employee engagement is a strategic priority and has been more important than ever through the pandemic. We measure engagement quarterly across the Group and it has continued to improve, with a score of 7.3 in January 2021 compared with 6.9 in January 2020. We continue to see good levels of participation (an average of 74%) similar to FY20. Listening and responding to feedback from our people has helped us improve the employee experience, ensuring we can identify the top priorities for us to address via our Engagement in Action plan. We introduced specific COVID-19 pandemic questions into Peakon to gain
insights into how our people felt about our response to the pandemic. The feedback tells us that our people feel that we responded appropriately and implemented the right precautions to keep them safe.
We communicate regularly with our people through a range of channels and this was even more important this year as we adapted to the pandemic. Our Global Employee Roadshow became virtual to ensure we continued to provide clarity on our strategic priorities, and so employees know how they can contribute and are supported to deliver our goals; we had a higher than ever attendance. We also introduced a COVID-19 information hub, issued regular COVID-19 news bulletins to keep employees informed as government requirements and our own measures evolved across our home and priority countries.
We have revised the purpose and vision of the Employee Engagement Group and re-launched as the Global Employee Voice (GEV) which has representatives from each of our home and priority countries, including our subsidiary companies. The GEV meet regularly with the CEO and Group Director of Human Resources and the Chair actively participates at leadership engagements events. The GEV have met with the Chairman and Board members during the year (see page 68). We also have a range of employee networks as part of diversity and inclusion programme (see page 45).
To underpin our commitment to engagement, our leaders have a collective objective for engagement as part of their incentivisation. We have also maintained a focus on supporting managers, recognising the additional challenges they have faced with changes to our ways of working. We have provided additional toolkits and resources, to support wellbeing and virtual working.
Our voluntary turnover was 8.7% in FY21 compared with 9.7% in FY20 with key hotspots in markets such as US and Australia.
See our Non-financial KPIs on pages 26 to 27.
43Annual Report & Accounts 2021
Strategic Report

Responsible and sustainable business continued
Developing our peopleAs a result of the pandemic, we have adapted the way in which we deliver our learning and talent management programmes. Our priorities have focused on maintaining critical SQEP (Suitably Qualified and Experienced Person) capability, nurturing and growing our early careers talent pipeline and enabling our leaders to manage team and individual performance effectively as they adjusted to remote working or hybrid working practices in their teams. To achieve this we have;
• Developed a virtual corporate induction and manager team essentials programme for the UK
• Made significant progress in implementing globalised people systems and processes by deploying Success Factors, a global Human Resources Information System
• Increased our investment in and focus on early careers talent within Australia and UK
• Strengthened our in house coaching capability
• Continued collaboration with industry, e.g. the UK Defence Growth Partnership and STEM futures, focusing on future skills.
• Matured our Talent Management approach in areas of identification and assessment to enable global growth.
As a member of The 5% Club, we commit to publishing a breakdown of our UK early careers community (see chart below). We also show the percentage of our UK workforce that comprises early careers; this increased to 3.6% in FY21, compared with 2.3% in the previous year.
Graduates
Sponsored students
% UK Workforce
Apprentices
Early careersWe have increased our investment in and focus on early careers talent, with a total of 229 apprentices, graduates and year-in-industry students at end of FY21. The FY21 UK intake has significantly increased compared with FY20. In Australia we continue to develop our early careers pipeline with a new cohort on-boarded virtually, building on the new approach developed in the UK. The virtual on-boarding included a range of channels and interventions and received great feedback from the community, winning an Innovation Award in the 2020 recognition programme. For the cohort that completed their programmes in 2020 we hosted a virtual celebration event. The engagement in this community has significantly improved (by 1.6) in Peakon since July 2020. The Early careers % continues to be a key KPI, and this year we have expanded it to be a Global, not just UK focused (see page 27). In addition, we provided 19 high quality, paid summer placements across our business.
See our Non-financial KPIs on pages 26 to 27.
As well as providing apprenticeships for employees early in their career, we are also actively supporting 33 colleagues at later stages of their careers to undertake apprenticeships.
Social: Our people and communities continued
Our focus for developing our people in FY22:
• Update and globalise mandatory training
• Continue to globalise our people systems and processes
• Use Success Factors to support career development and talent management
• Continue investment and development of our early careers talent
• Improve strategic workforce planning to underpin our skills and resourcing strategy
FY18 129
109 90
FY19 FY20 FY21101 67 72
50 98
2 24
2.3 3.6
11
4.8
8
4.0
2018201920202021
44 QinetiQ Group plc

Social: Our people and communities continued
Creating a diverse and inclusive environmentOur people are critical to our success, so it is vital that we create a workplace that is inclusive; where our differences are not only embraced but make us stronger. To achieve this our Inclusion 2025 strategy is focusing on building a workplace and culture where everyone can feel valued, be authentic and realise their full potential. Our focus in FY21 has been across three key themes, awareness of the importance of diversity and inclusion (D&I) to QinetiQ, leadership and employees.
• We have delivered awareness campaigns on the importance of D&I as well as targeted campaigns on autism, dyslexia, mental health, women in STEM, psychological safety, gender balance, Black History Month, LGBT History Month, the menopause and disability.
• We rolled out “inclusion” training for all employees and have developed a new resource hub on a wide range of D&I topics. We have also created a series of short tool-kits and have rolled out language and banter team discussion sessions, across the business.
Gender diversityFY21 FY20
Female Male Female Male
Board directors1 3 (37%) 5 (63%) 2 (22%) 7 (78%)
Senior managers2 57 (19%) 239 (81%) 54 (17%) 267 (83%)
All employees3 1,447 (22%) 5,145 (78%) 1,384 (20%) 5,080 (80%)
1 For more information on Board diversity see page 76.
2 Senior managers are defined as employees who have responsibility for planning, directing or controlling the activities of the Group, or a strategically significant part of it. This includes directors of subsidiary companies. It includes our Global Leadership Team (GLT) but excludes our CEO and CFO who are captured under Board directors.
3 Excluding senior managers.
Total employee gender mixMaleFemale
Our D&I priorities in FY22 will be to:
• Continue to raise awareness of the benefits of a high performing inclusive culture
• Mobilise our leaders to continue to undertake D&I activities
• Embed our D&I employee networks across the business
• Increase our focus on gender balance, working towards improving female representation at senior leadership level
• For the second year we had D&I as part of our leadership incentive scheme. Leaders were required to actively participate in D&I activity and over the course of the year have run team sessions, written blogs and supported reverse mentoring and employee networks.
• We have launched new employee networks to broaden the range of diversity focus. In addition we introduced D&I champions in each of our business units and functions (Terms of reference on page 80). Our champions and network leaders meet regularly to share ideas and best practice.
• Our reverse mentoring programme has been very successful with our second and third cohorts launched in FY21.
• Our continued focus on gender balance has ensured that for the third year QinetiQ has been awarded an “Employer of Choice for Gender Equality” citation in Australia.
1,447 1,384
5,0805,145
FY21 FY20
45Annual Report & Accounts 2021
Strategic Report

FY21 Case studyInternational Women in Engineering Day (INWED): 23rd June 2020 To celebrate INWED we ran a communications campaign and a series of virtual events; a webinar on engineers “Shaping the world” in Australia, “Meet the Engineer” panels in the UK, and in the US, a live practical activity. In each session, attendees were able to talk to our female engineer panellists about their career pathways.
Social: Our people and communities continued
Reward and recognitionReward and recognition are key elements of our people strategy and an important part of our overall value proposition for employees. We have been listening to feedback and our focus in FY21 has been on rewarding for performance, our All Employee Incentive scheme, our Thank-Q programme and our approach to the gender pay gap.
Our Rewarding for Performance framework has continued to embed across the Group, including extending our Pay & Progression board and policy to be global. As part of initial response to COVID-19 our Board, GLT and senior leaders voluntarily took short-term measures to support our cost and cash conservation activities (see page 94 for details). Our All Employee Incentive Scheme (AEIS) for FY21 performance was increased to £1,250 for stretch performance (previously £1,000), and our FY21 award payout of £1,217 reflects the outstanding contribution by our people. Our Thank-Q programme continues to be the key mechanism for spontaneous through year employee recognition, and for FY21 we held a virtual gala event to recognise and celebrate those employees who have gone above an beyond. Our mean UK Gender Pay Gap for FY20 (reported in March 2021) has decreased to 13.9 % (14.8% in the previous year).
Supporting the armed forces As a signatory to the UK Armed Forces Covenant and Gold Award winners in the MOD Defence Employer Recognition Scheme, we are proud to support the armed forces, our own employees who serve as reservists, cadet force adult volunteers, forces spouses and cadets. This year we launched a new network for employees who are ex-military (veterans and reservists) as part of our D&I programme.
Investing in our communityOur aim is to be a good neighbour to benefit the wider socio-economic wellbeing of the communities where we operate. Our approach is to understand local needs of the communities in which our businesses are based, and to align these with our business strategy and our employees’ professional skills. We offer time for volunteering and one of the main ways we support our local communities is through STEM (science, technology, engineering and maths) outreach with young people, raising aspirations and signposting to rewarding careers. Due to COVID-19, we have had to quickly adapt our outreach activities, which have traditionally been in person and so could not continue safely in that format. With schools closed for part of the year and the need for our employees to focus on their core role to support national defence and security, we have not been able to reach as many young people directly through outreach activities as we have done in previous years. However, we adapted our volunteering criteria to recognise a new need in our communities and ways for our employees to contribute, for example supporting the emergency services. At a time when COVID-19 has caused significant uncertainty for many young people in education, it is important that we continue to play our part.
Responsible and sustainable business continued
We have valued the expertise of partners such as the Jon Egging Trust, STEM Learning and Primary Engineer in the UK to continue to understand young peoples’ current needs, and to design and deliver virtual and remote outreach activities, which we can deliver globally. Our STEM Ambassadors have adapted resources and engaged with partner schools to adapt to their new needs.
Highlights in FY21 include:
• Adapting STEM Outreach activities to a virtual audience in the UK, US and Australia, such as a “Meet our Engineers” event for International Women in Engineering Day in June
• Our STEM Ambassadors engaged with an estimated 1,000 young people in the UK through bespoke online outreach activities, and through larger events or external organisers such as Ask Me I’m an Engineer
• Our Australia CR&S Committee continued to work together remotely and fundraise over $25k for a number of their chosen charities (eg supporting veterans, mental health and emergency services)
• Launch of a three-year charity partnership with SSAFA, The Armed Forces Charity, in the UK
In FY22 our focus will be:
• To further develop virtual STEM outreach resources and activities, reaching a wider and more diverse audience
• Continue to learn from and collaborate with our charity and outreach partners and contribute to employee engagement
• Focus on our Armed Forces Covenant commitments
46 QinetiQ Group plc

Governance: How we do business
Business ethics – doing business the right wayOur Code of Conduct defines our ethical standards, providing clear direction and guidance on how we do business. It also contains information on ethical decision-making and how to seek help. We review it annually to reflect the evolving needs of our business, the regulatory environment and best practice. Annual business ethics training is mandatory and supports our people in understanding and using the Code of Conduct. The training is undertaken by our Board and is available to our suppliers and customers. We provide a number of challenging scenarios to help our people know what to do if they were to come across issues such as bribery, fraud, harassment, conflict of interest and modern slavery.
We strive to create an environment where our people feel confident to “speak up” and provide a number of different ways for them to seek help or raise concerns, which we promote in awareness campaigns, in the code of conduct and in our ethics training. They can talk to a manager, use our ethics email advice services, our global network of Ethics Champions and our independently run, 24/7, confidential reporting line. We have responded to all queries received via our ethics email advice services and confidential reporting line. These routes are also available to third parties. We provide guidance for managers on how to create an open and inclusive environment where our people feel confident to raise concerns, and how to listen to and support anyone who may come to them with an issue. Our approach to confidential reporting is overseen by our Audit Committee (see page 88). Our ethics programme is overseen by our Business Ethics Committee, chaired by our Chief Ethics Officer (the Company Secretary). We are members of our trade association, ADS, Business Ethics Network where members can share best practice on ethics, human rights and anti-bribery.
Anti-bribery and corruption (ABC)We have a zero-tolerance approach to bribery and corruption. Our ABC programme is continuously reviewed to ensure that it adheres to regulatory requirements and addresses the bribery and corruption risks that we recognise face our Company. The principles of our anti-bribery and corruption procedure are embedded within key processes and instructions, covering subjects such as the use of commercial intermediaries, gifts and hospitality and facilitation payments. All third parties that we engage with are subject to initial, and repeat, risk-based due diligence, along with ongoing monitoring to address bribery and corruption risks. In addition to our mandatory business ethics training we provide specific training for our people in roles with a higher potential exposure to bribery and corruption risks which is repeated bi-annually. The programme is overseen by the Chief Ethics Officer and receives internal assurance and oversight to ensure that it remains effective. No material breaches of our procedures were identified during the year.
Human rightsAs part of our ongoing programme to address modern slavery, we introduced a new action plan across the Group. We provide in-depth training to people in key roles and continue to develop new supporting resources for all employees. We regularly review our policies and our approach to risk in the supply chain. Our Supplier Code of Conduct helps to ensure our suppliers have clarity of their responsibilities on human rights. Our annual modern slavery and human trafficking statements are published on our website. We seek to anticipate, prevent and mitigate potential negative human rights impacts through our policy and processes, which underpin our commitment to responsible business practices. For example, we address salient human rights issues through our Code of Conduct, trading policy, international business risk management process and export controls process. We monitor the application of these policies and procedures through our business assurance processes and regular self-assessment with oversight by our Business Ethics Committee. We believe that this integrated approach is effective in ensuring our business acts responsibly and respects all human rights.
Working with our supply chainOur supply chain is an extension of our own organisation. We ensure that it is committed to the same standards of safety, security and governance as we are. We have a Supplier Code of Conduct and our on-boarding and vetting process ensures that suppliers understand the issues important to us. We are signatories to the UK Prompt Payment Code, and report our payment details as required by legislation. We focused on paying small supplier early through COVID-19. In FY21 we ran supplier events to raise awareness of issues such as social value and modern slavery. Working in collaboration with wider industry we foster and develop ecosystems which draw together communities to answer complex science, engineering and technology challenges, supporting our customer offering. Through this approach we enable access to opportunities of Small to Medium Sized Enterprises and non-traditional defence suppliers, removing barriers of entry and promoting inclusive procurement.
This section focuses on how key aspects of governance support how we do business responsibly and sustainably. It is linked to our corporate governance section which provides detail on Board oversight.
47Annual Report & Accounts 2021
Strategic Report

Section 172 (1) statementWe welcome our responsibilities to promote the success of the company in accordance with section 172 of the 2006 Companies Act.
The Board of Directors confirm that during the year under review, it has acted to promote the long-term success of the Company for the benefit of the shareholders, while having due regard to matters set out in section 172(1)(a) to (f) of the Companies Act 2006, being:
s. 172(1) matter Relevant disclosures
(a) The likely consequences of any decision in the long term Company purpose – pages 39 and 65
Business model – pages 10–11
Strategy – page 16
Dividend policy – page 25
Longer-term viability statement – page 37
(b) The interests of the Company’s employees Improving the safety, health and wellbeing of our people – pages 42–43
Engaging with our people – page 43
Developing our people – page 44
Rewarding and recognising our people – page 46
Non-financial information statement – pages 50–51
Board employee engagement – pages 67–68
Diversity and inclusion – page 45 and 79 to 80
(c) The need to foster the Company’s business relationships with suppliers, customers and others
Business ethics – doing business the right way – page 47
Anti-bribery and corruption – pages 47 and 51
Human rights – pages 47 and 51
Modern slavery – pages 47 and 51
Supply chains – page 47
Supplier stakeholder management – page 47
(d) The impact of the Company’s operations on the community and the environment
Responding to climate change – pages 40–41
Greenhouse gas emissions and energy management – page 40
Investing in our community – page 46
TCFD disclosures – page 40
(e) The desirability of the Company maintaining a reputation for high standards of business conduct
Stakeholder propositions – page 4
Our sustainable business model – pages 10–11
Our values – page 6
Our Culture – page 66
Our approach to responsible and sustainable business – page 39
Internal controls – page 86
(f) The need to act fairly between members of the Company Investor engagement – pages 69–70
The Annual General meeting – page 71
48 QinetiQ Group plc

Typically in large and complex companies such as QinetiQ, the Directors fulfil their duties partly through a governance framework that delegates day-to-day decision making to the employees of the company. The Board recognises that such delegation needs to be part of a robust governance structure, which covers our values, how we engage with our stakeholders, and how the Board assures itself that the governance structure and systems of controls continue to be robust. The main methods used by the Directors to perform their duties include:
• An annual strategy meeting which assesses the long-term sustainable success of the Group and our impact on key Stakeholders
• The Board’s risk management procedures identify the potential consequences of decisions in the short, medium and long term so that mitigation plans can be put in place to prevent, reduce or eliminate risks to our business and wider stakeholders (see pages 30 to 36)
• The Board sets the Group’s purpose, values and strategy and ensures it is aligned with our culture (see page 65)
• Direct and indirect stakeholder engagement (see pages 38 and 67 to 71)
• External assurance is received through audits, stakeholder surveys and reports from brokers and advisers
• Specific training for our Directors and senior managers (see page 82)
• Regularly scheduled Board presentations and reports, by way of example: customer engagement, risk register reports, health & safety reports, whistle blowing reports (if relevant), defence process review, dividend policy and people and culture strategy and developments
• The discharge of Directors’ duties and oversight of these duties, of which further details are included in the Governance section
• Corporate responsibility, including business ethics, anti-bribery and corruption, human rights, environmental stewardship and use of resources, sustainable solutions, greenhouse gas emissions and energy management, investing in our local communities and our commitment to the armed forces
• Formal consideration of any these factors which are relevant to any major decisions taken by the Board throughout the year
• Review of many of these topics through the risk management process and other standard Audit Committee, Risk & CSR Committee and Remuneration Committee agenda items
Our Chairman, with the assistance of the Company Secretary, sets the agenda for each Board meeting to ensure that the requirements of section 172 are always met and considered through a combination of the following:
• Board papers ensure that stakeholder factors are addressed where judged relevant
• Standing agenda points and papers presented at each Board meeting: for example, the CEO presents updates on the financial overview, strategic progress, investor relations, businesses development, and operational progress. The Company Secretary also presents at each Board meeting relevant corporate governance and compliance matters
• A rolling agenda of matters to be considered by the Board throughout the year, including a two-day strategy review, which considers the purpose and strategy for the Group, supported by a budget for the following year and a medium-term (five-year) financial plan. Agenda items for the following year are set based on the discussions held and decisions taken by the Board throughout the year
• Consistent approach to minute taking with details as to when section 172 factors are being considered
Board activity and principal decisions in FY21The principal decisions taken by the Board in FY21 are detailed on pages 60 to 64. These decisions cover a variety of topics, including the Group’s response to COVID-19, our Environment, Health and Safety strategy and portfolio optimisation decisions. Due to the nature of these decisions, a variety of stakeholders had to be factored into the Board’s discussions.
49Annual Report & Accounts 2021
Strategic Report

Non-financial information Section Pages
Business model Business model 10–11
Policies Non-financial information statement
50–51
Principal risks Risk review 31–32
Principal risk management 32–36
Risk performance 32–36
Key performance indicators Key performance indicators 26–29
Certain of the non-financial information required pursuant to the Companies Act is provided by reference to the following locations:
Our peoplePolicy statement Description
Code of Conduct Our Code of conduct lays out our ethical standards, providing our people with clear direction and guidance on how we do business across the Company. There are details on ethical decision making and also how to seek help and raise concerns. The code is structured to include a range of advice for our people, our customers and partners, our company and shareholders and our communities and the public. We review our Code of Conduct annually to reflect the needs of our business, regulations and best practice.
Health and safety Our Health and Safety policy outlines our commitment to continuously improving standards of safety management and compliance. The effectiveness of the policy is governed through our assurance process and our six-monthly self certification. Safety issues are part of a regular governance timetable, monthly through MD meetings, quarterly through Global Leadership Team (GLT) meetings and Board with a six-monthly summary overview to the Board.
Diversity and inclusion Our Equality, Diversity and Inclusion (ED&I) policy details our approach to promoting ED&I in our workplace. The effectiveness is governed via our assurance processes and KPI with monthly oversight by our GLT as well as regular oversight by the Board.
The environmentPolicy statement Description
Environmental management We are committed to embedding an environmentally sustainable approach to business because we understand its importance to our business and our stakeholders. The effectiveness of our policy is governed through our assurance process and our six-monthly self certification. Environmental issues are part of a regular governance timetable, with oversight by the GLT and the Board. We are certified to ISO 14001 in the UK and Canada and so are subject to external audit.
Energy and carbon management Underpinning our ISO 50001 certified energy management system is our energy and carbon management policy, which creates the framework for our Energy Management Action plans. Our policy is part of regular governance review and self certification as well as external audit to ensure we are meeting certification requirements.
Waste management We recognise that reducing waste meets our sustainability goals, and improves efficiency. The effectiveness is governed via our assurance processes and KPI with monthly oversight by our GLT as well as regular oversight by the Board.
Sustainability appraisal Sustainability appraisals are required under the LTPA. They involve an assessment of an activity across 16 sustainability themes. The effectiveness is governed via our assurance processes as well as regular review and oversight by the UK MOD customer.
Non-financial information statementThe non-financial reporting requirements contained in sections 414CA and 414CB of the Companies Act 2006 are addressed within this section by means of cross reference in order to indicate where they are located within the strategic narrative and to avoid duplication here.
We have a range of policy and guidance, some of which is published on our website: www.QinetiQ.com.
50 QinetiQ Group plc

Community and Society Policy statement Description
Volunteering policy Our policy provides guidance for employees to use company time to use their skills to make a positive difference in the community. The effectiveness is monitored by the CR&S team and via our assurance process.
Safeguarding children and vulnerable adults
Our policy explains the importance of safeguarding as part of our community investment programme and outlines requirements for risk assessment and the right behaviours. The policy is managed both by the CR&S team and locally by safeguarding experts in our Early Careers Team and is managed via our assurance process.
Tax Our Tax strategy (available on our website) outlines our commitment to being compliant with tax legislation, wherever we do business. We recognise our responsibility to pay the right amount of tax, at the right time and in the right jurisdiction. Oversight of this commitment comes through external challenge, such as business risk reviews and audit questions from tax authorities and external auditors and internal reviews such as quarterly tax updates with executive level reviews of process and procedure.
Sponsorship and donations Our policy is designed to ensure that all donations are made to appropriate organisations. We ensure that there is screening and due diligence and we also undertake selection with oversight of the CR&S team and the Sponsorship and Donation Committee. This is managed by our assurance process.
Human rightsPolicy statement Description
Human rights We seek to anticipate and prevent potential negative human rights impacts through our policy and processes and address salient human rights issues through our Code of Conduct, trading policy, international business risk management process and export controls process. We monitor the application of these policies through our business assurance processes and regular self assessment and with leadership oversight (GLT and Board). We believe that this integrated approach is effective in ensuring our business acts responsibly and respects human rights.
Modern slavery Our policy focuses on management of the supply chain and the requirements for due diligence. In addition we include modern slavery in our resourcing policy. The effectiveness is monitoring via our assurance programme and leadership oversight (GLT and Board).
Supply chain code of conduct Our supplier code of conduct helps ensure our suppliers have clarity on our expectations on human rights issues.
International trade compliance As an international business, it is vital that we operate fully within the requirements of international export requirements and this is address by our policy. The effectiveness is monitoring via our assurance programme and leadership oversight (GLT and Board).
Anti-bribery and anti-corruptionPolicy statement Description
Code of Conduct Our Code of conduct lays out our ethical standards, and contains advice on anti-bribery and corruption.
Anti-bribery and corruption Our anti-bribery and corruption policy sets out our responsibilities in observing and upholding our zero tolerance approach to all forms of bribery and corruption. This important policy has significant senior oversight at GLT and Board level, is managed via our assurance processes and self certification and there are regular internal audits.
Commercial intermediaries Managing commercial intermediaries is one of a suite of key polices which supports our zero tolerance approach to ABC. It provides clear guidance on approach. This policy has executive and Board oversight, is subject to our assurance process and self certification.
Sanction screening It is key that we comply with any sanctions requirements and so undertake various screenings. This is captured in our policy which has GLT and Board oversight, is subject to our assurance process and self certification.
Gifts and hospitality Our gifts and hospitality policy is one of a suite of polices which supports our zero tolerance approach to ABC. It provides clear guidance on what is appropriate and how to record. This policy has GLT and Board oversight, is subject to our assurance process and self certification.
51Annual Report & Accounts 2021
Strategic Report

52 QinetiQ Group plc
Corporate Governance

53Annual Report & Accounts 2021
Governance
An introduction from our Chairman 55
Governance framework 57
Board of Directors 58
Board activity 60
Board decision making 61
Purpose, values and culture 65
Stakeholder engagement 67
Division of responsibilities 72
Composition, succession and evaluation 75
Nominations Committee report 75
Director effectiveness 80
Audit, risk and internal control 83
Audit Committee report 85
Risk & Security Committee report 92
Remuneration at a glance 97
Annual report on remuneration 100
Directors’ report 113
Independent auditors’ report 117

Statement of compliance with the 2018 UK Corporate Governance Code (the Code)
1. Board Leadership and Company purposeProvides an overview of the activities undertaken by the Board in the year, how the Board has considered its s. 172(1) responsibilities and its governance framework
Code principle A
• Section 172(1) statement – pages 48 to 49 and 61 to 64
• Board of Directors – pages 58 - 59
Code principle B
• Our growth strategy – page 16
• Section 172(1) statement – pages 48 to 49 and 61 to 64
• Company purpose – page 65
• Culture – pages 66 to 67
Code principle C
• Strategic report – pages 2 to 51
• Audit Committee report – pages 85 to 91
• Risk & Security Committee report – pages 92 to 94
Code principle D
• Our people and communities – pages 42 to 45
• Stakeholder engagement – page 38 and 67 to 71
• Section 172(1) statement – pages 48 to 49 and 61 to 64
Code principle E
• Our people and communities – pages 42 to 45
• Employee engagement – pages 67 to 69
• Confidential reporting – page 84
2. Division of responsibilitiesExplains the roles of the Board and its Directors
Code principle F
• Governance framework – page 57
• Division of responsibilities – pages 72 to 74
Code principle G
• Governance framework – page 57
• Board of Directors – pages 58 to 59
• Division of responsibilities pages – 72 to 74
Code principle H
• Section 172(1) statement – pages 48 to 49 and 61 to 64
• Time commitment – page 73
Code principle I
• Board and Committee processes – page 74
3. Composition, succession and evaluationSets out key processes, which ensure that the Board and its Committees can operate effectively
Code principle J
• Nominations Committee report – pages 75 to 82
Code principle K
• Board of Directors – pages 58 to 59
• Nominations Committee report – pages 75 to 82
Code principle L
• Director effectiveness – pages 80 to 82
4. Audit, risk and internal control Explains the role of the Board, the Audit Committee and the Risk & Security Committee in ensuring the integrity of the financial statements and maintaining effective systems of internal controls
Code principle M
• Audit Committee report – pages 85 to 91
Code principle N
• Fair, balanced and understandable – page 89
Code principle O
• Risk Management – pages 30 to 36
• Audit Committee report – pages 85 to 91
• Risk & Security Committee report – pages 92 to 94
5. Remuneration Describes the Company’s remuneration arrangements in respect of its Directors, how these have been implemented in FY21, and details of our remuneration policy
Code principle P
• Directors remuneration report – pages 95 to 112
Code principle Q
• Directors remuneration report – pages 95 to 112
Code principle R
• Directors remuneration report – pages 95 to 112
Listed below are the Code principles, and details of where we have addressed them in this Annual Report.
The Board is accountable to shareholders for its standards of governance and throughout the year the Board has applied and been compliant with the principles and provisions set out in the Code, with the exception of Provision 38 (alignment of Executive Directors’ pension with those available to the employees). See page 99 for further information. The Code is publicly available at www.frc.org.uk.
Corporate Governance
54 QinetiQ Group plc

Dear Shareholder,I am pleased to present this year’s corporate governance statement. This report provides a summary of the system of governance adopted by the Company and will enable our shareholders to evaluate the manner in which the Code’s principles and provisions have been applied by the Company (Listing Rule 9).
Board activities and response to COVID-19The year has been dominated by the COVID-19 pandemic and the unprecedented challenges it has presented. At the outset of the pandemic, we as a Board worked quickly and decisively with the senior management team in developing a Group-wide strategic framework to focus on three main priorities:
1. Protecting our employees’, and their families’, health and wellbeing
2. Continuing to deliver for our customers, to support national defence and security
3. Sustaining our company for the long term
This framework has remained relevant and important throughout the pandemic and has allowed us to focus on delivery and response to the challenging environment in which we continue to operate.
During the year we have called on the extensive skills and experience of the entire Board when navigating through this period. Our robust governance framework, and how this is implemented, has been fundamental to our ability to do this successfully.
“ As a Board, we have focused on taking the essential decisions and steps to successfully navigate QinetiQ through this unprecedented period of time, while protecting all of our stakeholders.”
Stakeholder engagement – more important than ever As a result of the pandemic, the Board had to make a number of challenging decisions, which affected all our stakeholders in different ways, and we have sought to balance the needs of our many stakeholders throughout the year, be they employees, customers, suppliers, shareholders or regulators, while taking steps to secure the Group’s longer term success. There has been a constant dialogue with all of the main stakeholder groups, and on behalf of the Board, I would like to take this opportunity to thank them all for their partnership during this very challenging time.
The 2018 UK Corporate Governance Code emphasises the need for boards to develop effective relationships with all stakeholders, including understanding their views. My fellow Directors and I have worked extensively on our approach to these important matters, to ensure that all voices – those of shareholders, employees, customers, suppliers and communities – find their way to the Boardroom.
Environmental, Social and Governance (ESG) During the year, the Board and I have had many discussions on how to best keep evolving our approach to ESG matters. As part of our regular business review, we are able to oversee and monitor management of ESG issues, which are being delivered through our Corporate Responsibility and Sustainability function. We are proud of the significant progress made to date on our ESG strategy, and we continue to support the business in its ambition to embed this further into corporate strategy and decision making.
An introduction from our Chairman
55Annual Report & Accounts 2021
Governance

We recognise and welcome the growing focus by our shareholders, customers and employees on these important matters, the need for us to reflect our stakeholders’ expectations, and the added value in areas such as business opportunities, employee engagement, and energy efficiency. This approach has informed and guided our response to the COVID-19 pandemic, with a focus on caring for our employees, supporting the communities and customers we serve, and help protect and restore the economies we operate within.
To ensure that the Board can provide the appropriate oversight to ESG issues we have established a new Climate Change Steering Committee, chaired by our CFO. The Climate Change Steering Committee is placed underneath the Global Leadership Team, with the CFO providing a direct link to the Board.
CulturePromoting a culture of openness and debate in the boardroom is one of my key responsibilities as Chairman, and as a Board we play an important leadership role in promoting the desired culture throughout the organisation. By spending time with the business and its people, the Board and I have seen that the culture and values of QinetiQ (integrity, collaboration and performance), are clearly embedded and genuinely lived. In QinetiQ, I have found a culture that is grounded, responsible and humble, where people have confidence in their capabilities and our strategy, and with a strong desire to learn and develop. The Company has spent considerable time over the last few years getting the culture right and we are continuing this journey.
Board and Management Succession In April 2021 we announced with great sadness that Ian Mason had passed away suddenly. Ian had been a Non-Executive Director on the QinetiQ Board since June 2014. He was a trusted and valued colleague and friend, and our thoughts are with his family.
We welcomed Shonaid Jemmett-Page to the Board in May 2020. She took on the position as Audit Committee Chair when Paul Murray stepped down from the Board in July 2020. Shonaid has a strong financial background and is an experienced Non-Executive Director in the energy and financial sectors, which has served to strengthen the Code’s requirement that at least one member of the Committee has recent and relevant financial experience. During the year she has provided the Audit Committee with a fresh perspective, suitable challenge and scrutiny of the external auditors, and her input to the Board discussions has been invaluable.
In October 2020 Gordon Messenger was appointed to the Board and in January 2021 he succeeded James Burnell-Nugent, who retired from the Board in December 2020, as the Chair of the Risk & Security (formerly Risk & CSR) Committee. Gordon’s unique operational experience from the Defence sector has already enabled him to steer the Risk & Security Committee successfully in its new direction.
Ensuring a diverse culture on the Board and the Global Leadership Team (GLT) is crucial to improving effectiveness, encouraging constructive debate, delivering superior performance and enhancing the success of the Company. We currently have 37.5% women on the Board and 27% women on the GLT. We continue to be committed to our gender and ethnic minority diversity targets on the Board, the GLT and the Group as a whole.
Restructuring our Committees In order to simplify the scope and to better align with the evolving skills and experience profile of the Board and the operational focus of the GLT, the Board decided that it would be most appropriate to oversee the very important matters of ESG and Corporate Responsibility & Sustainability at Board level, by the Board as whole, by way of a regular and in-depth agenda item.
Through our many discussions, we also agreed that Risk management and Security are such important matters, as part of our corporate strategy and our Governance framework, that these two items would be best overseen by a Committee of their own. Therefore, during the year, the Risk & CSR Committee evolved into the Risk & Security Committee.
RemunerationThis year was the first year of the Directors’ Remuneration Policy that was approved by shareholders at the AGM in 2020 (the Policy). The Board’s Remuneration Committee has focused during the year on ensuring that the Policy is continuing to operate as intended to reward, retain and incentivise appropriately the Executive Directors who are driving the Company’s success. It has done so by seeking to ensure that the Company’s remuneration schemes and their outcomes for Executive Directors continue to be transparent, aligned with the Company’s strategy and aligned with the interests of, and returns delivered to, shareholders.
Annual General Meeting We are delighted this year to for the first time offer shareholders the opportunity listen to the AGM via a secure telephone line. Further details will be posted in the Notice of AGM and on www.QinetiQ.com.
ConclusionI would like to take this opportunity to express my gratitude to all employees of QinetiQ, the CEO and his executive team and my fellow Directors for all their hard work during this challenging time. All the people of QinetiQ have shown incredible resilience, coming together to deliver critical outputs to our defence and security customers against the backdrop of a global pandemic.
Neil JohnsonNon-Executive Chairman
Corporate Governance Statement
An introduction from our Chairman continued
56 QinetiQ Group plc

Shareholders
Responsible for the leadership of the Board and for ensuring that it operates effectively through dynamic discussions and challenge.
The Board is responsible for leading the Group, by setting strategic priorities and overseeing the delivery of the strategy in a way that promotes sustainable long-term growth, while cultivating a balanced approach to risk within a framework of effective controls and
taking into account the interests of a diverse range of stakeholders.
Responsible for the day-to-day running of the Group’s business and performance, and the development and implementation of the Group strategy.
The interaction between the Board and the GLT enables the Board to receive information first-hand about the Company and its operations and to give guidance on strategy and oversight of the business direct to senior management.
The GLT meets twice a month. It is responsible for the day-to-day management of the Group’s activity. The focus of the GLT includes managing the business, delivering the strategy, managing risk, establishing financial and operational targets and monitoring performance
against those targets.
Reviews and monitors the Group’s financial accounting and reporting processes
and the integrity of published financial statements. Reviews the Group’s system of internal control, including the effectiveness
of its internal audit function and the independence and effectiveness of its
external auditor.
See pages 85 to 91 for Committee Report
To provide scrutiny and assurance to the Board, that the required standards of
risk management, security, health and safety within the UK, and internationally,
are achieved.
See pages 92 to 94 for Committee Report
Considers the structure, size and composition of the Board and Committees, and succession planning. It identifies and proposes individuals
to be Directors and also for Executive Management, and establishes the criteria for
any new positions.
See pages 75 to 82 for Committee Report
Established in 2016 following the requirements of the Market Abuse Regulations (MAR). The
Committee comprises all Board members except for when called on short notice when it comprises the Chairman, the CEO, the CFO
and any one of the Committee Chairs.
Determines and recommends to the Board the framework for the remuneration of the Company’s Chairman, CEO, CFO and GLT.
Oversees workforce remuneration and workforce policy.
See pages 95 to 112 for Committee Report
Chairman
Board of Directors
The Chief Executive Officer
The Global Leadership Team (GLT)
Committees
Audit Committee
Risk & Security Committee
Nominations Committee
Disclosure Committee
Remuneration Committee
This is the structure through which the Company is managed. It has evolved over time, and continues to evolve to meet the needs of the business and the Company’s stakeholders. Boards of large companies invariably delegate day-to-day management and decision-making to Executive Management. Directors should maintain oversight of a company’s performance and ensure that management is acting in accordance with the strategy and its delegated authorities. At QinetiQ, the culture, values and standards that underpin this delegation help to ensure that when decisions are made, their wider impact has been considered. The Board has reserved certain matters (posted at www.QinetiQ.com) for its own consideration so that it can exercise judgement directly when making major decisions, and in doing so, promoting the success of the Company. The Company’s success depends on the Board’s continued commitment to high standards of corporate governance and a strong, positive culture across the business, while managing effectively the risks and uncertainties of the markets in which it operates.
Governance framework
Board leadership and Company purpose
57Annual Report & Accounts 2021
Governance

Neil JohnsonChairman Nationality: British
Skills, competence and experience: Neil’s former CEO experience and current roles as a plc Chairman and Non-Executive Director brings to the Board relevant knowledge, challenge and leadership.
Starting his career at Sandhurst and the Army, Neil spent much of his early career in the automotive and engineering industries. He was worldwide Sales and Marketing Director at Jaguar before being seconded to the UK Ministry of Defence to command 4th Battalion The Royal Green Jackets. He returned to the industry with British Aerospace, initially running Land Rover and then all of its European automotive operations. Neil was later CEO of the RAC, and former Director General of the EEF and a Home Office appointed Independent Member of the Metropolitan Police Authority. He was previously Chairman of Motability Operations and Centaur Media plc.
Other appointments: Chairman of Electra Private Equity plc and Senior Independent Non-Executive Director of the Business Growth Fund.
Michael HarperDeputy Chairman and Senior Independent Non-Executive Director Nationality: British
Skills, competence and experience: Michael brings to the Board a wealth of operational and corporate experience from a lengthy career as a business leader and Board member within, among others, the engineering and aviation industries. He continues to provide highly valuable advice to the Board and its discussions, in particular in his capacity as the Senior Independent Director.
Michael has served as Chairman of Ricardo plc, Vitec Group plc, and BBA Aviation plc, having previously been its CEO. Michael previously served as Senior Independent Director of Catlin Group Limited, as a Non-Executive Director of Williams plc and the Aerospace Technology Institute, and as CEO of Kidde plc.
Other appointments: N/A
Steve WadeyChief Executive Officer Nationality: British
Skills, competence and experience: Steve’s proven track record of driving growth, and his in-depth experience of defence and technology industries is of essential importance and benefit to the Board.
Steve is a Fellow of the Institution of Engineering and Technology, the Royal Aeronautical Society, and the Royal Academy of Engineering. He was previously Co-Chair of the UK Defence Growth Partnership, a member of the Prime Minister’s Business Advisory Group, Co-Chair of the National Defence Industries Council Research and Development Group, and a Non-Executive Director of the UK MOD Research and Development Board. Steve has held various roles with MBDA, including as Managing Director, MBDA UK. Previously he held various roles with Matra BAe Dynamics and British Aerospace.
Other appointments: Chair of the Defence Industry Liaison Board of the UK Department for International Trade, Defence & Security Exports.
Lynn BrubakerIndependent Non-Executive Director Nationality: American
Skills, competence and experience: Lynn’s experience from a number of senior Board positions at various US-based companies, in particular in the aerospace sector, makes her a valuable member of the Board and enables her to provide insightful advice on matters such as strategy and customer stakeholder management.
Lynn has held positions as Non-Executive Director of Force Protection, Inc., Seabury Group, Graham Partners, Cordiem, the Nordam Group, the Flight Safety Foundation (as Chair), the Hexcel Corporation and as a member of the Management Advisory Council of the Federal Aviation Administration. Lynn was also the Vice President and General Manager of Commercial Aerospace at Honeywell International.
Other appointments: Non-Executive Director of FARO Technologies Inc.
David SmithChief Financial Officer Nationality: British
Skills, competence and experience: David provides significant expertise to the Group from his broad and comprehensive executive experience in blue-chip companies and work in the aerospace and defence, technology, and automotive sectors.
David is an Associate of the Chartered Institute of Management Accountants and a member of its Advisory Panel. He was previously the CFO of Rolls-Royce Holdings plc, having joined as CFO of its Aerospace Division. Prior to that, David was CFO of Edwards Group and CEO of Jaguar Land Rover, having previously been its CFO. He has also held a variety of roles with the Ford Motor Company, and was previously a Non-Executive Director of Motability Group plc.
Other appointments: N/A
General Sir Gordon Messenger Independent Non-Executive Director Nationality: British
Skills, competence and experience: Gordon brings vast experience from the armed forces having served for 37 years as a Royal Marine. Throughout his military career he served in key appointments in various UK and NATO Headquarters, overseeing the planning and execution of UK and coalition military and humanitarian relief operations worldwide. He most recently served as Vice Chief of the Defence Staff, a position he held for three years until his retirement in 2019.
His unique experience enables him to provide invaluable insight in his role as the Chair of the Risk & Security Committee.
Other appointments: UK Member of the international Defence Reform Advisory Board for Ukraine.
Board of Directors - an experienced and balanced Board The Chairman considers all of the Directors to contribute valuably, and to continue to be paramount to the Company’s long-term sustainable success.
Board Leadership and Company purpose continued
58 QinetiQ Group plc

Jon MessentCompany Secretary and Group General Counsel Nationality: British
Skills, competence and experience: Jon joined QinetiQ from Chloride Group plc where he held a similar role. He has a background in legal private practice as well as General Counsel and Company Secretary.
Susan SearleIndependent Non-Executive Director Nationality: British
Skills, competence and experience: Susan brings to the Board essential experience of investing in growing technology businesses, acquisitions and exploitation of new technologies. Her experience as a plc Remuneration Committee Chair enables her to efficiently and valuably chair the Remuneration Committee.
Susan was a founder of Touchstone Innovations plc, and formerly its CEO. She has served on a variety of private company boards in engineering, healthcare and advanced materials, and held a variety of commercial and business development roles with Shell Chemicals, the Bank of Nova Scotia, Montech (Australia), and Signet Group plc. Previously Susan was the Senior Independent Director and Remuneration Committee Chair of Horizon Discovery Group plc, and Chair of Mercia Asset Management plc and Schroder UK Public Private Trust plc.
Other appointments: Senior Independent Non-Executive Director and Chair of the Remuneration Committee of Benchmark Holdings plc.
Shonaid Jemmett-PageIndependent Non-Executive Director Nationality: British
Skills, competence and experience: Shonaid brings to the Board a wealth of experience from previous roles as an Executive and Non-Executive Director from a breadth of sectors, including industrial and technology based businesses with international operations. This, combined with her extensive financial experience, enables her to successfully chair the Audit Committee.
Previously Shonaid was the Chief Operating Officer of CDC Group plc, the UK Government’s development finance institution, having joined from Unilever, where she was Senior Vice-President Finance and Information, Home and Personal Care, originally in Asia and later for the Group as a whole. Her early career was spent at KPMG, latterly as a partner. Her Board level experience includes Non-Executive Chair of Origo Partners plc and MSAmlin plc, and Non-Executive Director roles at GKN plc, Close Brothers Group plc and APR Energy plc.
Other appointments: Non-Executive Chair of Greencoat UK Wind plc and Cordiant Digital Infrastructure Limited, Senior Independent Director of ClearBank Ltd and Non-Executive Director of Caledonia Investments plc.
Committee Membership Key
Audit Chairman of CommitteeRisk and SecurityNominations Remuneration
59Annual Report & Accounts 2021
Governance
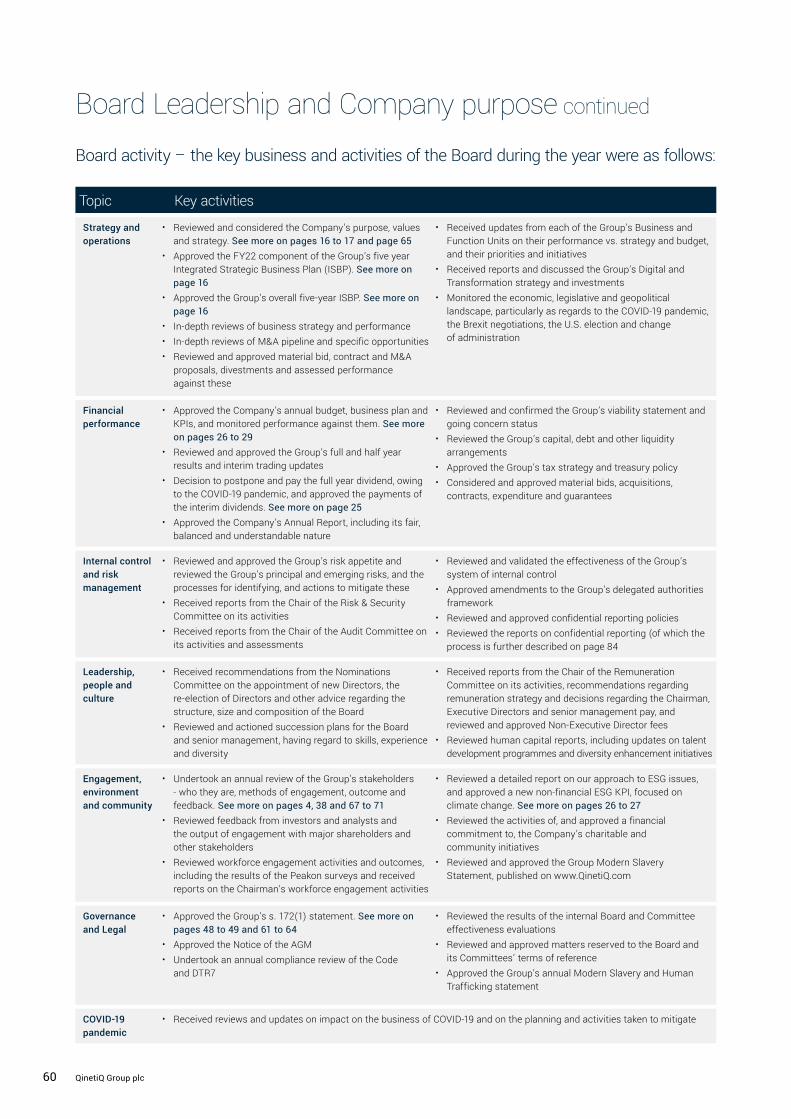
Board activity – the key business and activities of the Board during the year were as follows:
Topic Key activities
Strategy and operations
• Reviewed and considered the Company’s purpose, values and strategy. See more on pages 16 to 17 and page 65
• Approved the FY22 component of the Group’s five year Integrated Strategic Business Plan (ISBP). See more on page 16
• Approved the Group’s overall five-year ISBP. See more on page 16
• In-depth reviews of business strategy and performance• In-depth reviews of M&A pipeline and specific opportunities• Reviewed and approved material bid, contract and M&A
proposals, divestments and assessed performance against these
• Received updates from each of the Group’s Business and Function Units on their performance vs. strategy and budget, and their priorities and initiatives
• Received reports and discussed the Group’s Digital and Transformation strategy and investments
• Monitored the economic, legislative and geopolitical landscape, particularly as regards to the COVID-19 pandemic, the Brexit negotiations, the U.S. election and change of administration
Financial performance
• Approved the Company’s annual budget, business plan and KPIs, and monitored performance against them. See more on pages 26 to 29
• Reviewed and approved the Group’s full and half year results and interim trading updates
• Decision to postpone and pay the full year dividend, owing to the COVID-19 pandemic, and approved the payments of the interim dividends. See more on page 25
• Approved the Company’s Annual Report, including its fair, balanced and understandable nature
• Reviewed and confirmed the Group’s viability statement and going concern status
• Reviewed the Group’s capital, debt and other liquidity arrangements
• Approved the Group’s tax strategy and treasury policy• Considered and approved material bids, acquisitions,
contracts, expenditure and guarantees
Internal control and risk management
• Reviewed and approved the Group’s risk appetite and reviewed the Group’s principal and emerging risks, and the processes for identifying, and actions to mitigate these
• Received reports from the Chair of the Risk & Security Committee on its activities
• Received reports from the Chair of the Audit Committee on its activities and assessments
• Reviewed and validated the effectiveness of the Group’s system of internal control
• Approved amendments to the Group’s delegated authorities framework
• Reviewed and approved confidential reporting policies• Reviewed the reports on confidential reporting (of which the
process is further described on page 84
Leadership, people and culture
• Received recommendations from the Nominations Committee on the appointment of new Directors, the re-election of Directors and other advice regarding the structure, size and composition of the Board
• Reviewed and actioned succession plans for the Board and senior management, having regard to skills, experience and diversity
• Received reports from the Chair of the Remuneration Committee on its activities, recommendations regarding remuneration strategy and decisions regarding the Chairman, Executive Directors and senior management pay, and reviewed and approved Non-Executive Director fees
• Reviewed human capital reports, including updates on talent development programmes and diversity enhancement initiatives
Engagement, environment and community
• Undertook an annual review of the Group’s stakeholders - who they are, methods of engagement, outcome and feedback. See more on pages 4, 38 and 67 to 71
• Reviewed feedback from investors and analysts and the output of engagement with major shareholders and other stakeholders
• Reviewed workforce engagement activities and outcomes, including the results of the Peakon surveys and received reports on the Chairman’s workforce engagement activities
• Reviewed a detailed report on our approach to ESG issues, and approved a new non-financial ESG KPI, focused on climate change. See more on pages 26 to 27
• Reviewed the activities of, and approved a financial commitment to, the Company’s charitable and community initiatives
• Reviewed and approved the Group Modern Slavery Statement, published on www.QinetiQ.com
Governance and Legal
• Approved the Group’s s. 172(1) statement. See more on pages 48 to 49 and 61 to 64
• Approved the Notice of the AGM • Undertook an annual compliance review of the Code
and DTR7
• Reviewed the results of the internal Board and Committee effectiveness evaluations
• Reviewed and approved matters reserved to the Board and its Committees’ terms of reference
• Approved the Group’s annual Modern Slavery and Human Trafficking statement
COVID-19 pandemic
• Received reviews and updates on impact on the business of COVID-19 and on the planning and activities taken to mitigate
Board Leadership and Company purpose continued
60 QinetiQ Group plc

1. Response to COVID-19
At the very beginning of the pandemic, the Board approved a prioritised approach to working through the pandemic, namely: resilience, recovery and renewal – that centred around:• Protecting the health and wellbeing of our employees and their families
• Continuing to deliver critical work for our customers, essential for national defence and security
• Sustaining the strength of our company for the long-term
Throughout the pandemic, the Board has focused its strategic response to the pandemic by way of: • Guidance for Group performance throughout the year
• Robust actions to boost resilience to immediate challenges
• Partnering with our customers to deliver evolving priorities
• Engaging our employees to adapt our ways of working
• Accelerating capabilities to meet the needs of a new world and enable our future growth
• Investing in our core capabilities and connecting our skills globally
Once these priorities were stable, the Company entered into a renewal phase, as part of its evolved corporate strategy. In addition, fair, balanced and proportionate measures taken by the Board increased the resilience of our Company, allowing us to maintain a strong position for future growth while being mindful of the potential risk of further impacts from to the pandemic.
Consideration Outcome/impact
Employees • With an 80% “home” and 20% “site” working environment, the Board focused on supporting the business in accelerating the Group’s digital transformation so that our employees were able to continue to work safely and effectively.
• The Board supported the Company in implementing a range of safeguarding measures including social distancing, additional cleaning services and the provision of PPE, ensuring that our working environments are safe and clean for those employees who need to work on our sites to enable delivery of critical defence and national security programmes.
• Due to the uncertainty that the pandemic brought, the Board initially made some difficult choices which impacted our employees, including leadership salary reductions; cost control measures; the release of contractors; no salary increases; a requirement to use 40% of holiday by June 2020; and FY20 employee incentives paid in shares. When assessing our half-year performance, the Board felt confident to approve the release of the majority of our temporary measures in the second half of the year.
• Our employees rose to the challenge of developing agile ways of working, enabled by our accelerated digital transformation, and improving our skills and processes to enhance business winning, and deliver quality performance.
• The Board continued to focus on supporting the Company’s core capabilities and connect skills globally, ensure that critical skills and capabilities were retained within the Company to drive long-term, profitable growth.
Customers • The Company continued to work closely with customers to enable the delivery of the capabilities of defence, security and critical national infrastructure, including the emergency services.
• The Company collaborated with customers to understand how their long-term needs would evolve and advise on upgrading existing capabilities to respond to the latest threats and changing customer requirements to deliver medium to long-term, profitable growth.
Shareholders • At the outset of the pandemic, the CEO and CFO volunteered a salary reduction of c. 33% and the wider Board volunteered a 25% reduction in fees.
• The Board made the appropriate decision to postpone the final dividend as part of the robust short-term actions to boost resilience and preserve the strength of the balance sheet, however following a strong start to the financial year a deferred dividend was paid in November 2020.
• The continuation of our All Employee Incentive Scheme, paid to each employee in QinetiQ shares, has been a key enabler for growth by aligning employee and shareholder interests.
Suppliers • We have continued to work closely with our suppliers to accelerate our digital transformation strategy and global growth.
• Throughout the pandemic, we have supported our suppliers to help them navigate the challenges of COVID-19, including prompt payment of invoices, in particular to smaller suppliers.
Board decision makingIn making decisions, the Board of Directors are cognisant of all their legal duties, including their duty under s. 172(1), see pages 48 to 49, in the way that is most likely to promote the success of the Company for the benefit of its members as a whole and to have regard (among other matters) to the factors set out therein. Examples of some of the most important decisions taken by the Board during the year of reporting, and an explanation of which factors the Board had regard to when reaching such decisions, are set out below:
61Annual Report & Accounts 2021
Governance

Board Leadership and Company purpose continued
2. Postponed the payment of the full year dividend
The Board decided to reinstate the FY20 final dividend at a level that represented the FY20 total by way of an interim dividend equal to the prior year, as well as an additional dividend of 4.4p per share representing the deferred final dividend from FY20, resulting in a total dividend for the year ended 31 March 2020 of 6.6p per share. The Board intends to honour the progressive dividend policy for FY21, with the interim and final dividend in line with the normal financial calendar.
Consideration Outcome/impact
Shareholders • The postponement of the full year dividend enabled us to emerge from the crisis in a strong position.
• We have restored the confidence of our shareholders in our resilience as a company and our evolved strategy going forwards.
3. Supported a new focus on Environment, Social and Governance issues and approved a new associated non-financial KPI
A key aspect of our evolved strategy is a strong and increasing focus on environmental, social and corporate governance (ESG) factors. The Board seeks to grow the Company in a responsible and sustainable way for the benefit of all stakeholders. Our Corporate Responsibility and Sustainability (CR&S) strategy is designed to meet stakeholder expectations across ESG themes, aligned with our business strategy. During FY21 we have been focusing on improving how CR&S is embedded in the strategic planning process and a review was undertaken during the year, focusing at our core non-financial KPIs.• The Board fully supported this evolution of approach and the designation of more formal leadership sponsorship, with a Global Leadership
Team owner for each of “E”, “S” and G”.
• The Board approved the addition of a new non-financial KPI, which now ensures that we are considering climate change as part of our core indicators.
• The Board also fully supported the company to develop a new net zero strategy to address greenhouse gas emissions to replace our current target.
Consideration Outcome/impact
Employees • Our employees have provided feedback that they welcome our commitment to being a responsible and sustainable business.
• Our employees are continuing to develop services and products to ensure the operational safety of our armed forces, the security of information for our sovereign nations, and the protection of environment through the use of innovative technologies and sustainable solutions.
Customers • We have been working with the UK MOD during FY21 to support the development of their climate change strategy and have taken on new leadership roles in industry (Aerospace Defence and Security and Defence Suppliers Forum) to drive the sustainability agenda within our sector and with our peers and customers.
• We have delivered positive solutions for our customers by protecting our troops; developing novel solutions to improve efficiency and emissions; improving the safety, reliability and accuracy of our solutions; and delivering safe virtual training resulting in cost savings and reduced emissions.
• We have collaborated with our customers to deliver effective solutions, including developing and providing technology to solve policing and security threats quickly and efficiently; and safely managing the multi-national Formidable Shield exercises.
Shareholders • We have communicated our commitment to ESG to our shareholders in one to one meetings and in the March investment webinar, which was positively received.
• We are continuing to embed ESG into our strategy, and improve culture and behaviours to further assure our shareholders that we are building a responsible and sustainable Company.
Suppliers • We are working closely with our suppliers to ensure our supply chain is diverse, responsible and sustainable. We have implemented programmes to ensure we are a responsible customer, including our collaborate programme, delivery of our modern slavery action plan, and being signatories to the prompt payment code.
62 QinetiQ Group plc

4. Environment, Health &, Safety strategy
The Board approved an Environment, Health & Safety strategy three years ago. Since then we have achieved significant progress, however, we recognise that there is still more to be done. Our enhanced strategy is to take a global approach. We intend to share our expertise across the whole of our Company to strengthen the positive impact we can have on health, safety and the environment. By creating a culture focused on a positive commitment to health, safety and environmental matters, we aim to strengthen our brand with employees, improve retention, attract quality talent and secure new business. The Board will continue its commitment to our people, investors and regulators, being a priority for our Company when driving improvement in this area.
Consideration Outcome/impact
Employees • We continue to put an emphasis on leadership, with the Board and our senior leaders paving the way and role modelling the behaviours we expect of ourselves and each other.
• We are committed to create a motivated, flexible and committed workforce through the development of a culture and environment that fosters employee wellbeing and environmental sustainability.
• We continue to build a community of strong, active and visible leaders who have a clear commitment to safety, employee wellbeing and environmental matters.
• The Health, Safety and Environment strategy has significantly reduced the number of safety incidents and contributed towards driving a new level of safety culture within QinetiQ.
Customers • We continue to focus on delivering safely for our customers.
• We continue to be committed to understanding the risks that have the potential to affect customers and visitors and we have measures in place to protect their safety.
Shareholders • We have strengthened our reputation with our people, future employees, customers and investors by demonstrating our commitment to our Health, Safety and Environmental strategy.
Suppliers • We have worked with our suppliers to ensure we embed our strategy, values and behaviours in our supply chain.
5. Portfolio optimisation: divestments of Boldon James Limited, Commerce Decisions Limited and OptaSense Limited; and acquisition of Naimuri Limited
The Board approved the divestments of Boldon James, Commerce Decisions and OptaSense, and the acquisition of Naimuri. These portfolio optimisation decisions were strategy-led choices, generating capital from non-core assets and reinvesting in our core capabilities to drive profitable growth and building an integrated global defence and security company.
Consideration Outcome/impact
Employees • For those businesses which were disposed, the Board considered the interests of employees throughout the sale process, including the smooth transition of those employees once a sale was agreed in principle.
• As part of the acquisition of Naimuri, the Board considered the Group’s ability to attract and retain talent in that area as part of the wider investment programme.
Customers • Following the acquisition of Naimuri, the Board plans to invest and build upon Naimuri’s strong capabilities in data analytics, data intelligence and agile software development to meet customer requirements for more solutions in this area.
• We are continuing to put the mission of our customers first and are developing sustainable and innovative solutions to deliver for our customers’ advantage.
Shareholders • Our evolved strategy to meet the needs of the changing defence and security world, and accelerate our global growth will deliver even greater returns for our shareholders.
• The Board intends to ensure that our capabilities are strategically aligned and highly complementary to support long-term growth and create shareholder value.
63Annual Report & Accounts 2021
Governance

6. Approved the Group’s five-year Integrated Strategic Business Plan (ISBP)
The Board has approved the Group’s five-year ISBP which will inform our investment and business priorities as we seek to grow. Our customer focused growth strategy requires responsible and sustainable investment in three key areas:• Global leverage: build an integrated global defence and security Company
• Distinctive offerings: co-create products and services to offer exceptional value
• Disruptive innovation: focus on disruptive business models, digitisation and advanced technologies
Consideration Outcome/impact
Employees • Our employees will continue to focus on disruptive innovative solutions for our customers.
• We will continue to harness and retain the best talent and skills to maintain quality and efficient performance for our customers’ advantage.
Customers • We are striving for a customer base of c. 50% UK, 25% US and 10% Australia to enable our global growth.
Shareholders • Our evolved strategy to build an integrated global defence and security Company, delivering continued growth, will provide greater benefit to all our stakeholders.
Suppliers • We will work with our supply chain to ensure we obtain the best products and services to enable us to offer distinctive products and services.
Board Leadership and Company purpose continued
Supplementary information The Board has seven scheduled meetings, held over two days, for Board and Committee business throughout the year. Additional Board sub-Committee meetings and conference calls are held between the scheduled meetings as required. The table below sets out the Board and Committee membership and attendance by members at meetings held in FY21.
Board and Committee attendance – 1 April 2020 to 31 March 2021
Members BoardAudit
CommitteeNominations
CommitteeRemuneration
CommitteeRisk & Security
Committee
Lynn Brubaker 7/7 4/4 5/5 4/4 4/4
Admiral Sir James Burnell-Nugent1 5/7 3/4 4/5 3/4 3/4
Michael Harper 7/7 4/4 5/5 4/4 4/4
Shonaid Jemmett-Page 7/7 4/4 5/5 4/4 4/4
Neil Johnson 7/7 – 5/5 4/4 4/4
Ian Mason2 7/7 4/4 5/5 4/4 3/4
General Sir Gordon Messenger3 4/7 2/4 2/5 2/4 2/4
Paul Murray4 2/7 1/4 1/5 2/4 4/4
Susan Searle 7/7 4/4 5/5 4/4 4/4
David Smith 7/7 – – – 4/4
Steve Wadey 7/7 – – – 4/4
1 James Burnell-Nugent stepped down from the Board on 31 December 2020.
2 Ian Mason was unable to attend the Risk & CSR Committee meeting on 9 November owing to the Company making late meeting date changes, resulting in a conflict with a prior commitment.
3 Gordon Messenger was appointed to the Board on 12 October 2020.
4 Paul Murray stepped down from the Board on 14 July 2020.
64 QinetiQ Group plc

The significance of our purpose, values and culture The Board has reviewed and articulated the Company’s purpose to ensure it captures the Board’s current view of the Company and its role in society. Our purpose communicates the Group’s strategic direction and intentions to our employees, occupiers and wider stakeholders. Owing to its importance, it is reconfirmed on an annual basis to ensure it continues to reflect our strategy, values and desired culture.
Our Vision
QinetiQ’s ethos is defined within Our Purpose
This is demonstrated through our dedication and commitment to Our Mission
Underpinned by Our Values
Re-imagined through Our Culture
to be the chosen partner around the world for mission-critical solutions, innovating for our customers’ advantage.
to protect lives, defending sovereign capabilities and securing the vital interests of our customers.
through responsible and ethical leadership we strive to be a good employer and partner, while applying our unique technical expertise across the product lifecycle helping our customer to create, test and use defence and security capabilities.
Integrity, Collaboration and Performance
A high performance and inclusive work environment where employees are engaged, empowered and clear about how they can contribute to Our Purpose.
65Annual Report & Accounts 2021
Governance

Board Leadership and Company purpose continued
Our culture Our Values make clear our priorities and form the foundations of the Company’s culture.
Integrity Trusted to do the right thing at all times, we take pride in our decisions, and work to create a sustainable and responsible business. We are responsible and accountable for all our actions. We take personal responsibility to do the right thing, demonstrating this individually and as an organisation in our decisions, behaviour and day-to-day actions. We actively support each other to meet the highest ethical and professional standards.
Collaboration The chosen partner for customers and industry colleagues, we are a diverse and inclusive community with a common purpose; every contribution is valued. Delivering value through partnership and teamwork, we actively collaborate with our colleagues, customers and industry partners to bring together the best thinking, the smartest talent, breadth and depth in capability to our work. We know that working together is the best way to meet our customers’ needs.
Performance Customer focused and highly responsive, providing operational excellence and assuring safe and secure delivery. Our performance is measured by how we deliver for our customers; meeting their needs through flawless execution and delivery of the mission-critical solutions on which they depend. This includes being accountable for getting things right the first time, safely, securely and in a cost effective way. Taking an innovative and responsive approach to create an outstanding customer experience, we try to go the extra mile and act with courage.
The annual Recognition Gala and Thank Q Awards are strong evidence of how we live by our values:
The Recognition Gala
An annual event where people from across the global business have nominated their colleagues for demonstrating behaviours which exemplify our values. The exceptional number and quality of nominations received each year is a testament to how our people live by our values. The nominations process, award event and publication of awards winners across the Group also serve to remind people of our values and what they mean in practice.
Saying Thank Q Thank Q recognises the efforts of our people that reflect our values, behaviours and capabilities for going above and beyond and making a difference. This can be done by:
• Saying Thank Q via our Global Portal community group• A more personal touch through giving someone a Thank Q card • Nominate someone or a team for a Thank Q award to receive a voucher for going above and beyond
While the Recognition Gala and Thank Q programmes raise awareness of and recognise and reward the behaviours that demonstrate our values, there are many other input actions which contribute to the creation of a healthy corporate culture. These include:
• Our corporate policies, reviewed and approved by the Board, which set a clear expectation, and mandate, for every member of the workforce to perform the Company’s business with integrity and in accordance with applicable laws, including anti-bribery and corruption, anti-slavery and human trafficking, data protection and confidential reporting policies and procedures
• Fair and transparent employee policies and practices which ensure that employees’ rights are respected in accordance with applicable laws and employment contracts, together with a number of programmes and initiatives which support the health and wellbeing of our employees, develop talent and promote diversity
• Supplier protocols and procedures which seek to ensure that our key suppliers operate their businesses and respect their employees’ rights in the same way that we do
• The application and monthly assessment by business and functional executive teams and the Global Leadership Team of safety and operational KPIs to enable management to monitor and drive continually improvements in safety, reliability and efficiency of our services
• The work of Group support functions prepare and advise upon the Group’s policies, procedures and standards at every level and location of the business around the world, including dedicated safety and operational excellence teams, finance, legal and governance team, procurement, HR function, and the Group internal audit function
66 QinetiQ Group plc

In addition, we as a Board, use a number of other methods to understand and monitor the Company’s culture and assess whether our employees reflect our values. These include:
• Reviews, in the Boardroom, of the outcomes of the Peakon surveys, customer satisfaction scores and updates on confidential reporting. These gives us insights into what the Company does well and what could be improved, as well as any particular areas of concern
• The employee interaction with the Global Employee Voice (GEV), discussing the issues which matter most to our employees
• Directors’ attendance at various Company events, such as:
- Quarterly virtual Global Employee Roadshows
- Monthly virtual Global Engagement Network (GEN) events, delivered by the Global Leadership Team
- The Annual Recognition Gala
Through feedback from all of these monitoring activities, the Board is satisfied that the Company’s culture is aligned with our values. Where the Peakon surveys, workforce engagement events or other interactions between Directors and employees or other stakeholders have revealed matters that can be improved upon or have flagged concerns, the Board has discussed these and is content that management is putting action plans in place that are designed to drive improvements or address those concerns.
Safety Always at the forefront, and particularly so during the pandemic, safety continues to be our one priority. This year we updated our Environment, Health and Safety (EHS) strategy, see more on pages 39 to 47, which is aligned to our Company strategy and vision. We, as a Board, believe, through the activities we have undertaken to understand the Company’s culture, that our people are truly living by this and our values.
Stakeholder engagement The Board is aware that its actions impact all stakeholders of the Company and the communities we operate within. Effective engagement strengthens the business and helps to deliver a positive result for all stakeholder groups. The Board is committed to engage closely with the Company’s diverse range of stakeholders and to take their views into account. During the year the Board undertook a rigorous review of the Company’s current stakeholder activities. The review considered:
• Who the Group’s key stakeholders are
• The Board’s engagement activities with each key stakeholder and the appropriateness of this engagement
• The information the Board receives on the Group’s stakeholders, including details on the outcome of the engagement activities
• Whether appropriate stakeholder feedback loops are in place
• Whether there was a need for greater engagement with any stakeholders at Board level
• The outcome and effect of stakeholder engagement
Employee Engagement We have experienced, diverse and dedicated employees which are recognised as a key asset of our business and who drive our success. The Group has a long-standing commitment to the importance and value of employee engagement. See more on pages 42 to 46 and 67 to 69.
The Board recognises the value of engaging directly with employees to ensure an understanding of their views and inform its decision-making in considering employee interests. Under normal circumstances the Board holds a number of its meetings at different Company sites, both in the UK and globally, to take the opportunity to meet with the employees in person. However, this has not been possible during the year due to restrictions associated with the COVID-19 pandemic. The process on page 68 describes how the Board continued to be able to effectively gain the views of the employees throughout the year.
67Annual Report & Accounts 2021
Governance

Board Leadership and Company purpose continued
Dedicated Non-Executive Director
Neil Johnson is the dedicated Non-Executive Director for gathering the views of the employees
• Two meetings (virtually during the pandemic) with the Global Employee Voice (GEV)
• Attends the Global Recognition Gala and also Global Employee Roadshows (both virtual during the pandemic)
• Reports back to the Board
Global Employee Voice (GEV)
The GEV is a global forum that acts as the collective voice of all QinetiQ employees. All businesses and functions each have a member of the GEV, acting as their own representative. Australia, Belgium, Canada, Germany and the US also have their own GEVs, with a direct link to the UKSee more on page 43
• Regular contact with the Chairman
• Two meetings with the Chair of the Remuneration Committee
• Meets with the Group Function Director Human Resources, who reports to the Board on culture, employee and people strategy, and employee engagement
Global Employee Roadshows
Delivered quarterly by the Global Leadership Team, the Global Employee Roadshows give an update on the progress we’re making against our vision and strategy, and provide an understanding of our key priorities for the future
• Employees have the opportunity to ask questions, either in writing, or live during closing Q&A sessions
• Reported back to the Board by the CEO
Monthly virtual Global Engagement Network (GEN) events – delivered by the Global Leadership Team
The GEN includes 400 senior leaders from across the Group, selected for their sphere of influence and critical role within our Company. The sessions provide a monthly leader’s update and the opportunity to discuss employees’ wellbeing and topics critical to driving high performance and growth
• The members of the GEN feed back to their teams by way of Q–Talks, team meetings and one-to-one meetings
Monthly virtual Q–Talks Delivered by Business or Function Global Engagement Network leaders, with the purpose of keeping employees up-to-date with what’s currently important across QinetiQ
• A mechanism accessible for employees to get a thorough understanding of what is happening in the Company and also to provide individual feedback
Peakon Employee Engagement surveys
Quarterly surveys enabling the Board and the Leadership team to immediately assess employees’ engagement throughout the Group
• After each survey, the Director of Organisation Development has a meeting with the CEO where they discuss the results, trends, and any matters for concern
• The CEO feeds back to his fellow Board members at each Board meeting
Global Portal – our intranet
A platform where all employees can access our polices and be kept fully informed of the latest Group news
• Enables employees to ask questions and discuss topics internally
Confidential Reporting Our confidential reporting includes an anonymous reporting line for employees to raise any concerns with escalations to the Board as necessary
• Reported to the Board at each Board meeting
How does it work? • By using a number of different employee engagement mechanism ensuring flexibility
• By having a direct link to the Board via the purposefully designated Non-Executive Director
• By way of a dedicated forum to relay the voice of the employees
• By regularly reporting to the Board on culture, people strategy, and employee engagement
• By drawing on each individual Board member’s unique experience as business leaders
How we engage with our employees
68 QinetiQ Group plc

Statement from William Bowers, GEV Chair: As part of the Group Chairman’s role as the Non-Executive Director designated for employee engagement, he met with members of the Global Employee Voice (GEV) on two occasions during the year. Each time he was accompanied by Susan Searle, the Remuneration Committee Chair, who provided engagement on Executive Director remuneration. The Chairman was interested in how the GEV has become a global network of individuals who represent employees in all home countries. The GEV is concentrating on supporting greater employee engagement through working closely with the leadership to ensure the employee impact and perspective. We explained how the proposed sizeable investment in technology was seen as very positive, in particular for those at the front end of delivery who need the functionality to improve collaboration and increase the customer experience. We talked about the growth targets in the next round of the Integrated Strategic Business Plan, and as part of this process, the GEV have been asked to collaborate with the Group Chairman and the members of the Board, to ensure that the employees are effectively represented in any decisions that are made.
Ensuring our employees’ wellbeing throughout a pandemic• With so many people working from home, keeping our
employees engaged and passionate about the business for the long-term has never been more important
• The Board’s number one priority through the pandemic has been to protect our employees’, and their families, health and wellbeing
• A Group wide COVID-19 SAFETY STOP was introduced, providing a flexible mechanism for how to best support all employees, working from home or at site, regardless of personal circumstances, during the pandemic
• Continuing these important conversations, both at a Company level and an individual level, so that looking after our health and wellbeing, remains the normal way of working
Shareholder EngagementApproachThe Board is committed to communicating in an open and transparent manner with all shareholders, and places a clear importance on shareholder engagement. The Investor Relations programme is managed by the Investor Relations team, who provide day-to-day contact with investors. This is complemented by engagement with the CEO and CFO, who regularly attend meetings with institutional investors. In addition, the Chairman and other Non-Executive Directors make themselves available to discuss matters such as governance, ESG factors, remuneration and other relevant topics. The Board is also kept up to date on shareholders’ views and concerns through regular Board papers, presentations and feedback from the Investor Relations team.
The AGM provides an opportunity for shareholders to engage directly with the Board and receive an update on business performance. The Company’s results presentations and other investor events are also webcast live, and made readily available on the Company’s website, enabling a wider audience to access them.
Activities during the yearDuring FY21 the CEO, CFO and Investor Relations team collectively met with over 50% of the share register and hosted a number of meetings with non-shareholders. This contact was conducted during routine roadshows after results announcements, ad-hoc roadshows and at various conferences. The Group’s Chair, Neil Johnson, engaged with a number of shareholders on governance related matters and the Chair of the Remuneration Committee, Susan Searle, engaged extensively with shareholders ahead of the remuneration policy vote in July 2020.
In March 2021, we hosted a virtual investor seminar, which was well attended. This seminar provided greater clarity around the Group’s ESG credentials, our approach to the US market and the Digital & Data Transformation Programme we are currently pursuing.
Investors met: By type
Investors met: By investor location
ShareholdersNon-shareholders
UKEurope (ex. UK)North America
40.5%
59.5%
79.8%
9.5%
10.7%
69Annual Report & Accounts 2021
Governance

Board Leadership and Company purpose continued
May• Full year results announcement• Analyst briefings• UK Conference (UBS)
June• Full year results roadshow (UK & US)• US conference (Barclays)
July• Governance meetings ahead of AGM• Trading update and analyst briefings• Virtual AGM
August
September• Pre-close trading update
October
November• Interim results announcement• Interim results roadshow (UK & US)
December• Conferences (Goldman Sachs and Credit
Suisse)
January• Trading update and analyst briefings• Conference (Bank of America)
February
March• Investor seminar (virtual)
2020
2021
1.Growth opportunitiesWhere the growth opportunities lie and how we will continue to grow in varying budgetary environments is a key topic of discussion with shareholders.
2.Margin performanceHaving guided to an operating margin of 12–13% over the longer-term, shareholders are keen to understand how this will be achieved and what risks and opportunities may prevent us from meeting this guidance or allow us to exceed it.
3.InvestmentShareholders are often keen to understand more about the currently elevated levels of capital expenditure and what benefits this will deliver, as well as the Digital & Data Transformation Programme.
4.M&AOur approach to M&A and how this supports the wider strategy, as well as the integration and performance of recent acquisitions is commonly discussed.
5.ESG / sustainabilityOur ESG credentials have become increasingly important to investors over the past year and our shareholders are eager to understand more.
Common shareholder topicsSome of the common topics shareholders are asking questions on include:
Timeline
70 QinetiQ Group plc
Customer Engagement One of the Group’s key priorities during the year has been to foster closer relationships with customers at all levels. This helps QinetiQ provide value for money and high performance technical solutions to our customers. Customer engagement is underpinned by related, intelligent and persistent communication through a variety of means, building a position of mutual understanding and genuine trust between the Company and its customers. QinetiQ prides itself on building such relationships, taking the time to understand our customers’ strategic vision and needs in order to provide timely, effective and affordable solutions that tie into their organisational goals. Given that effective engagement is as much about attitude and behaviour as it is about delivering messages, QinetiQ’s customer engagement is affirmed by the timely delivery of programmes, and acting as a genuine, flexible and helpful partner that demonstrates the desire to address customer issues as soon as possible.
Managed by the Strategic Engagement Team, QinetiQ’s engagement matrix nominates a GLT-level sponsor and business relationship lead to each customer. The sponsor and business lead engage with their nominated customer(s) as business dictates or, as a minimum, at the frequency determined by the engagement matrix to gain a full understanding of any business opportunities or issues, and to ensure consistency of the Company’s messaging.
Community Engagement At QinetiQ we recognise that it is important that we interact positively with the wider community and environment in which we operate. See more on pages 38 and 46.
Constructive use of the Annual General Meeting (AGM)The Notice of AGM and related papers will, unless otherwise noted, be sent to shareholders at least 20 working days before the meeting. For those shareholders who have elected to receive communications electronically, notice is given of the availability of the documents via www.QinetiQ.com. This year’s AGM will be held at 10am on Wednesday, 21 July 2021 at Portsmouth Technology Park, Southwick Road, Portsmouth PO6 3RU.
The Board encourages shareholders to participate in the AGM and to ask questions. We are delighted this year to for the first time offer shareholders the opportunity to listen remotely to the AGM. Further details of this can be found in the Notice of AGM or www.QinetiQ.com. Shareholders can still be formally represented at the AGM by appointing the Chairman as their proxy and giving instructions on how they wish the Chairman to vote on the proposed resolution. We strongly encourage shareholders to do this. See your Notice of AGM for further details.
Shareholders can ask questions in advance of the AGM by emailing [email protected] by no later than 5pm on Monday 19 July 2021. Any questions posted via this format will be answered at the AGM.
Any updates to the arrangements for the conduct of the meeting will be communicated via www.QinetiQ.com.
71Annual Report & Accounts 2021
Governance

Role of the BoardUnderpinned by good corporate governance, the Board is focused on delivering an effective and entrepreneurial Board which is:
• Effective in providing challenge, advice and support to management
• Provides checks and balances, and encourages constructive challenge
• Drives informed, collaborative and accountable decision-making
• Creates long-term sustainable success and value for our shareholders, having regard to all interests of our stakeholders
Roles and responsibilities The Board has agreed a clear division of responsibilities between the Chairman and the CEO. Other Directors and the Company Secretary’s roles are also clearly defined to assist in enhancing the effectiveness of the Board. A summary is set out below:
Chairman Neil Johnson
• Provides overall leadership and ensures effectiveness of the Board
• Sets the agenda, character and tone of the Board meetings and discussions
• Maintains an effective working relationship with the CEO
• Leads the annual performance evaluation of the Board, its Committees and ensures that the each Non-Executive Director makes an effective contribution
Deputy ChairmanMichael Harper
• Maintains a close dialogue with the Chairman and CEO
• Supports and deputises for the Chairman as required
CEOSteve Wadey
• Develops the Group’s strategy for consideration and approval by the Board and provides effective leadership of the Global Leadership Team in its delivery of strategy
• Develops the Group’s business model and manages the Group’s operations
• Overseas the development and implementation by the Global Leadership Team’s corporate, safety and environmental policies and standards
• Establishes and services relationships with key stakeholders
• Reinforces the Group’s values and sets expected employee behaviours
• Communicates (with the CFO) the Group’s financial performance and strategic progress to investors and analysts
• Ensure the Board is kept fully appraised of the Group’s operational and safety performance, risks and opportunities that may affect or contribute to the delivery of the strategy
CFODavid Smith
• Responsible for the financial stewardship of the Group’s resources through appropriate accounting, financial and other internal controls
• Directs and manages the Group’s finance, tax, treasury, risk management, legal & governance, insurance and internal audit functions
• Communicates (with the CEO) the Group’s financial performance and strategic progress to investors and analysts
Senior Independent Non-Executive DirectorMichael Harper
• Acts as sounding board for the Chairman and a trusted intermediary for the other Directors
• Available to shareholders to discuss any concerns that cannot be resolved through the normal Chairman or CEO channels
• Leads the Board in the annual performance evaluation of the Chairman and in developing the long-term plans for the Chairman succession
• Meets with the Non-Executive Directors without the Chairman present at least annually, and as required, to discuss Board matters
Division of responsibilities
72 QinetiQ Group plc
Independent Non-Executive DirectorsLynn Brubaker, Michael Harper, Shonaid Jemmett-Page, Gordon Messenger and Susan Searle
• Monitor and scrutinise the Group’s performance against its strategic goals and financial plans
• Provide an objective perspective on the Board’s deliberations and decision-making, drawing on their own collective broad experience and individual expertise and insights
• Monitor and assesses the Group’s culture, use appropriate and effective means to engage with the employees and acquire an understanding of other stakeholders’ views
• Asses the effectiveness, support and constructively challenge the Executive Directors
• Play a lead role in the functioning of the Board’s Committees
Company SecretaryJon Messent
• Provides advice and support to the Board, its Committees, the Chairman and other Directors individually as required, primarily in relation to corporate governance matters, and Non-Executive Directors’ training and development needs
• Responsible with the Chairman for setting the agenda for Board and Committee meetings and for high quality and timely information and communication between the Board and its Committees, and between the Directors and senior management as required
• Ensures that Board and Committee procedures are complied with
Composition of the BoardThe Board considers that its composition reflects the requisite balance of skills, experience, challenge and judgement appropriate for the requirements of the business and full Board effectiveness. The skills and experience of the Board’s individual members, particularly in the areas of UK defence and security, the commercialisation of innovative technologies, corporate finance and governance, international markets and risk management, have brought both support and challenge to the CEO, CFO and the Global Leadership team during the year.
IndependenceA majority of the Board is comprised of independent Non-Executive Directors, as is required by the Code. The independence of the Non-Executive Directors is considered annually by the Nominations Committee, using the independence criteria set out in Provision 10 of the Code. The Chairman was independent upon his appointment in April 2019 and continues to use objective judgement in his Chairmanship.
As part of this process, the Board keeps under review the length of tenure of all Directors, as this is a factor when assessing independence. The independence of Michael Harper and Susan Searle, both of whom have served on the Board for more than six years, was subject to a rigorous review by the Nominations Committee in March 2021. When making this assessment, in particular for Michael, who has served on the Board since November 2011, the Nominations Committee based its decision on the fact that both continue to demonstrate integrity and independence in their advice and challenge. Michael and Susan were not in attendance during the review and the Nominations Committee remains satisfied that the length of their tenures has not impacted on their respective levels of independence or their respective contributions.
Time CommitmentEach Non-Executive Director must be able to devote sufficient time to their role as a member of the Board in order to discharge their responsibilities effectively. Prior to undertaking an additional external role or appointment, the Directors are asked to confirm that they will continue to have sufficient time to fulfil their commitments to the Company. This means not only attending and preparing for formal Board and Committee meetings, but also making time to understand the business of the Company. The Non-Executive Directors’ commitment is reviewed as part of the Board and Director evaluation. See more on pages 80 to 82.
The Chairman is conscious that some shareholders have concerns regarding Directors taking on too many Non-Executive roles. Consequently, he has assessed the ability to meet the commitments required by QinetiQ for those members of the Board who hold more than one other Board position, and he is satisfied that all Board members are able to meet the Company’s time commitment. In addition to their work on the QinetiQ Board and its Committees, the members of the Board also regularly make themselves available for Board calls, sub-Committee meetings and Executive leadership events.
Shonaid Jemmett-Page holds appointments in four other companies, two of which she is the Chair. Three of these, Greencoat UK Wind plc, Cordiant Digital Infrastructure Limited and Caledonia Investments plc, are investment trusts rather than full operating companies, and ClearBank Limited is a non-listed company. Therefore by their nature, the time requirements for these roles are not as significant as at a FTSE 250 operating company such as QinetiQ. The Chairman confirms that during the year Shonaid has contributed considerably to QinetiQ’s Board and Committee meetings, in particular in her role as the Audit Committee Chair, and she has joined all Board interactions between the scheduled meetings. He is therefore confident and satisfied that Shonaid has the time and availability to commit fully to her role on the QinetiQ Board.
73Annual Report & Accounts 2021
Governance

Division of responsibilities continued
Board and Committee processesThe Board has a formal schedule of matters reserved for its approval, which include: strategy; risk appetite and review of Group wide principal and emerging risks; major M&A, contracts and bids; share capital, debt financing and other liquidity matters; financial results and budgets; key policies; Board and Committee membership; and governance. Other matters, responsibilities and authorities have been delegated by the Board to its standing Committees, comprising Nominations, Audit, Risk & Security, Remuneration and Disclosure. Any matters outside of these fall within the responsibility and authority of the CEO and/or CFO. The schedule of matters reserved to the Board and the terms of reference of each Committee, which are reviewed and approved by the Board annually, can be found on the Company’s website at www.QinetiQ.com.
The Chairman and the Company Secretary are responsible, in consultation with the CEO and the Chairs of the Committees, for maintaining a scheduled 12-month programme of business for the Board and its Committees, with flexibility for additional business to be discussed as required. The programme ensures that all necessary matters are covered and appropriate time is given for discussion and, if thought fit, approval of relevant business. At each scheduled Board meeting, the Board rigorously reviews updates from the Executive Directors on Group and divisional safety, operating and financial performance, investor relations and the Group General Counsel & Company Secretary on legal compliance and corporate governance. Other regular Board agenda items include strategic proposals (including those relating to M&A, major contract bids and capital allocation), transformation and digital programme, risk management (including reviews of risk appetite and Group-level risks), tax and treasury updates, pension updates, human capital updates (including on employee relations, talent development and diversity promotion), and stakeholder engagement. Senior management and external advisers regularly attend both Board and Committee meetings, where detailed discussions on specific matters on which their input or advice is needed. The Board also seeks to hear external viewpoints inside and outside the Boardroom, including from customers, suppliers and experts in areas relevant to the Company’s strategy.
In advance of each Board and Committee meeting, Directors receive via a secure web portal high quality briefings, prepared by the Executive Directors, senior management, the Company Secretary and/or external advisers where appropriate, on the agenda items to be discussed. The secure web portal also gives Directors immediate access to a range of other resources, including previous meeting papers, minutes, financial reports, business presentations, investor reports, Company policies and governance guidelines, and details of Board and Committee procedures. If a Director is unable to attend a meeting due to illness or exceptional circumstances, they will still receive all supporting papers in advance of the meeting and are directed to discuss with, and provide input, opinion and voting instructions to, the Chairman or relevant Committee Chair on the business to be considered at that meeting.
The Board has access to the Company Secretary for support and advice as required, and the Company operates a policy which allows Directors to obtain, at the Company’s expense, independent professional advice where required to enable them to fulfil their duties effectively. In addition to Board and Committee meetings, the Non-Executive Directors hold private meetings without the Executive Directors present, including to discuss Executive Director performance. There are also opportunities during the year for Directors to have informal discussions outside the Boardroom, either between themselves or with senior management or external advisers.
Conflict of interestThe Board operates a policy to identify and manage situations declared by the Directors (in accordance with their legal duty to do so) in which they or their connected persons have, or may have, an actual or potential conflict of interest with the Company. In accordance with the Companies Act 2006, and the Articles of Association, the Board has the authority to authorise conflicts of interest. This ensures that the influence of third parties does not compromise the independent judgement of the Board. Directors are required to declare any potential or actual conflicts of interest that could interfere with their ability to act in the best interest of the Group.
The Company Secretary maintains a conflicts register, which is a record of actual and potential conflicts, together with any Board authorisation of the conflict. The authorisations are for an indefinite period and are reviewed annually by the Nominations Committee, which also considers the effectiveness of the process for authorising Directors’ conflicts of interest. The Board reserves the right to vary or terminate these authorisations at any time. No Director conflict of interest currently exists.
74 QinetiQ Group plc

Composition, succession and evaluation
“ QinetiQ aims to have the best people governing our business today and a competitive and diverse talent in the pipeline able to govern the business tomorrow”
Dear fellow shareholderI am pleased to present the Nominations Committee Report. The Committee’s ambition is to ensure we have the best people governing our business today and a competitive diverse talent in the pipeline able to govern the business tomorrow. The best people will have the necessary experience and skills to shape and support the Company’s strategy, including bringing diverse perspectives on strategic decisions in a way that complements and reflects the knowledge and skills of the Company’s business.
This was a busy year for the Committee as we continued implementing the succession plans we have previously developed to maintain the effectiveness of the Board and its Committees, having regard to the Company’s strategic priorities.
You can read more further down in this report about the appointment process of the Directors appointed during the year and also about the development of our talented senior management team.
Michael Harper has served on the Board since November 2011. During the year he has been instrumental to the Board in his roles as Deputy Chairman and Senior Independent Director. Given the recent changes to the Board, and the tragic passing of Ian Mason, I have asked Michael to stay on a little longer to provide consistency while the new Board members are settling in. The Nominations Committee will during the year identify a suitable candidate to succeed Michael. Further information about Michael’s independence assessment review can be found on page 73.
I hope you find the information in this report about the Committee’s work helpful and I will be pleased to answer any questions you have about it at this year’s AGM.
Neil Johnson Committee Chairman
Nominations Committee reportKey responsibilities:• Keep under review the structure, size and composition of
the Board
• Succession planning for Directors and other senior Executives
• Keep under review the leadership needs of the organisation, both Executive and Non-Executive, with a view to ensure the continued ability of the organisation to compete effectively in the marketplace
• Be responsible for identifying and nominating, for the approval of the Board, candidates to fill Board vacancies, as and when they arise
• Review annually the time required from Non-Executive Directors – the performance evaluation is used to assess whether the Non-Executive Directors are spending sufficient time to fulfil their duties
• Review the independence of the Non-Executive Directors and any potential conflict of interest for all Directors
FY21 activity highlights:• Reviewed the structure, size and composition of the Board and
its Committees, including the skills, experience, independence and diversity of its members, in anticipation of Non-Executive Director changes to the Board and its Committees
• Led the process to recruit new Non-Executive Directors with relevant skills and experience to the Board and certain of its Committees, thereby enhancing their strength and diversity
• Reviewed the Board and senior management succession plans, including via a review of potential internal successors and other high potential talent for executive and senior management positions
• Reviewed the Board’s Diversity & Inclusion Policy and the Company’s inclusion initiatives
75Annual Report & Accounts 2021
Governance

Skills and experience
Board
Global Leadership Team
0.0% 20.0% 40.0% 60.0% 80.0% 100.0%
Aerospace & avaition
Armed forces
International business
Emerging markets
eCommerce
Finance and financial reporting
Strategy
Remuneration
Transformation
M&A
Cyber-security
R&D / Technology
Skills and experience
Nationality
Direct reports to GLT members
24%
76%
27%
73%
Composition, succession and evaluation continued
Gender
WomenMen
WomenMen
GenderAge
WomenMen
BritishUS
50–5960–69
70–79
37.5%
62.5%British 7
US 1
38%25%
38%
76 QinetiQ Group plc

Succession PlanningBoard and Committees The Committee annually reviews the composition of the Board and its Committees and the Nominations Committee expects to continue to implement its succession plans for the Board and its Committees in 2021, 2022 and beyond. To ensure that we continue to recruit only the candidates of the highest standard, that we continue to make progress towards our diversity and inclusion targets, and that we have the right mix of an experienced Board, yet with a fresh perspective, we use the process outlined below. Following this year’s review the Committee is satisfied that we have an appropriate mix of skills, knowledge and experience to operate effectively.
Process step Action Outcome/impact
Identifying current and future needs and skills gaps
The Committee maintains and regularly reviews a matrix of the Directors’ experience and skills to ensure that the Board and its Committees are composed of individuals who have the right experience and skills to enable them to shape (and, in the case of the Executive Directors, deliver) the Company’s strategy and to monitor and assess the effectiveness of the Company’s control environment and management of risk.
The matrix considers the following:
• Diversity, including age, gender and ethnicity (see more on pages 79 to 80)
• Background, professional skills and experience (see more on pages 58 to 59 and 76)
• The number and balance of Executive and Non-Executive Directors
• Length of tenure (see more on page 78)
• Independence (see more on page 73)
• The appointment of Shonaid Jemmett-Page maintained the Board’s experience and knowledge in the financial sector
• The appointment of Gordon Messenger has brought fresh knowledge and perspective to the Board’s risk and security thinking
Ensuring that we get access to the best candidates
• Regularly reviewing the recruitment agencies that we use and ensure that they are best placed to find QinetiQ the right mix of candidates capturing the clear benefits of greater diversity
• MWM Consulting Ltd (who has no other connection to the Group) was appointed to assist with the recruitment of the new Audit Committee Chair, which ultimately led to the appointment of Shonaid Jemmett-Page
Ensuring accountability and success of the Board’s performance
• Annual Board effectiveness and performance evaluation, using an external provider every three years. See more on pages 80 to 82
• Annual review of the Chairman’s performance led by the Senior Independent Director. See more on page 82
• Annual independence review of the Non-Executive Directors. See more on page 73
• Continued assessment of the Non-Executive Directors’ time commitment. See more on pages 73
• Policy on Board members’ appointments to other Boards
• Annual performance review of the CEO and CFO, supplemented by the Chairman’s and Non-Executive Directors’ continual assessment of their performance. See more on page 80 - 82
• A thorough induction programme for new Directors. See more on page 82
• Annual training for the Board as a whole and on an individual basis. See more on page 82
• The FY21 Board effectiveness review concluded that the Board has been effective, engaged with and helpful to the organisation
A summary of the Board’s decision making, considering s. 172(1) can be found on pages 61 to 64.
• The effectiveness of the Committee’s succession plans is demonstrated by the new Non-Executive Director appointments in FY21, having filled the potential gaps in experience and skills, and increased the Board’s gender diversity from 22% to 37.5%.
77Annual Report & Accounts 2021
Governance

Composition, succession and evaluation continued
The process that the Committee has established, together with the particular considerations it takes into account, in identifying and nominating Director candidates is set out below.
A sub-Committee of the Nominations Committee is appointed to oversee the recruitment and appointment process
A tender process identifies the most suitable recruitment agency to conduct the search and prepare candidate specifications
The sub-Committee reviews the list of candidates and narrows to a short-list of those who best meet the Company’s requirements, considering the following:
The sub-Committee conducts initial interviews with the candidates on the short-list and identifies preferred candidates
Interviews between other Board members, including the CEO and CFO, and the preferred candidates
Nominations Committee recommends to the Board which of the preferred candidates best fulfils the Board’s and its Committees’ needs
Background, skills and experience
Independence and other commitments
Diversity to complement the Company’s own
diversity
Other individual attributes to widen the Board’s overall knowledge,
providing challenge and further support
Non-Executive Directors length of service Name Appointment date 6-year date 9-year date
Michael Harper 22 Nov 2011 22 Nov 2017 22 Nov 2020
Susan Searle 14 Mar 2014 14 Mar 2020 14 Mar 2023
Lynn Brubaker 27 Jan 2016 27 Jan 2022 27 Jan 2025
Neil Johnson 2 April 2019 2 April 2025 2 April 2028
Shonaid Jemmett–Page 19 May 2020 19 May 2026 19 May 2029
Gordon Messenger 12 October 2020 12 October 2026 12 October 2029
% of Directors 1 – 3 years: 50% 4 – 6 years: 17% 6 – 9 years: 33%
78 QinetiQ Group plc

Senior management succession planning programme During the year, the Board, led by the Committee, has also undertaken its usual programme of senior management succession planning. Senior management for these purposes includes the members of the Global Leadership Team (GLT) who are direct reports to the CEO as well as all those talented individuals who have demonstrated the potential for promotion to higher or broader positions in the Group’s senior management structure.
The programme includes a detailed annual review of such senior managers’ experience and skills and their progress and notable achievements during the year to ascertain their potential for further career progression, including potential succession as Executive Directors. I and my fellow Non-Executive Directors also keep the performance of potential successors to Executive Director roles under regular review throughout the year when they present to the Board and when we visit the Company’s operations. This gives us the opportunity to observe senior managers’ working practices and relationships with their stakeholders first-hand. Our review complements the Executive Directors’ assessment of these individuals’ performance in their employment through a formal process of annual reviews, and continual feedback and support. This programme enables the Board to identify any gaps in the senior management succession pipeline and any requirements for senior managers’ further development.
During the year, the Board’s senior management succession plans were put into action through the promotion of Vicky Weise to Group Functional Director of Business & Transformation. Her promotion was in recognition of her development under the CEO as Chief of Staff and Group Transformation Director. Mary Williams was appointed President QinetiQ U.S., heading up the Company’s North American division, and in addition, Sam Lewis joined QinetiQ in May 2021 as the Group Function Director of Business Development.
Board and company commitment to diversity The Board is committed to ensuring diversity, in all aspects (including as regards to gender, ethnic and social background), both at Board and senior management level, and throughout the Company’s employees. This is because we believe diversity can:
• Improve decision-making at all levels of the business by ensuring diverse perspectives
• Attract and retain the best talent by developing a culture of inclusion where all individuals are respected and supported to reach their full potential
• Better serve our customers, other stakeholders and the communities in which we operate by ensuring that the diversity of our workforce demographic is representative of the diversity of such stakeholders
This commitment is aligned with our values (see more on page 6), which in turn support our strategy of growth by retaining and winning business through having the best talent delivering the best service for our customers. Our commitment is confirmed in the Board’s Diversity & Inclusion Policy, of which the key points are:
• To achieve and then maintain at least 33% female representation on the Board
• To ensure that its membership reflects the diversity of the geographies and customers that the Group serves
• To respect the differences of its members, and value and encourage the diversity of thought that such differences can bring in each case within the context of Board members having, between them, the experience and skills required to support the development, oversight and delivery of the Company’s strategy
These initiatives have resulted in improvements in gender diversity at a number of levels of the business, including:
• Female representation on the Board is currently 37.5%
• Female representation on the GLT has increased from 13% in 2020 to 27% in 2021
• Female representations of the direct reports to the GLT is currently 24%
While we have been successful in achieving the Board’s objective of having at least one third female representation on the Board, we have yet not achieved this for our Global Leadership Team, currently at 27%, and their direct reports, currently at 24%. In addition, the Committee continues to be dedicated to accomplish the targets set by the Parker Review (2024 for FTSE 250 companies) to increase the representation of people from ethnic minorities to our Board, the GLT, the GLT’s direct reports, and the Company as a whole. The Committee will continue to keep this under review and continue to implement our succession plans in 2021, 2022 and beyond. We believe that our established and effective process, as outlined above, will help us achieve and maintain these important targets in the near future.
The Board is committed to progress against the targets as set out in the Board Diversity Policy. The Company’s mandatory requirement for a diverse candidate pool ensures that we continue to have the opportunity to recruit candidates from all gender, cultural and ethnic backgrounds, while we remain focused on recruiting the best candidate for any role based on merit.
79Annual Report & Accounts 2021
Governance

The employee Diversity & Inclusions (D&I) policy Page 45 describes the progress of our Diversity and Inclusion Programme in relation to employees and other diversity policies and procedures of the Company.
QinetiQ’s D&I policy can be found on www.QinetiQ.com and outlines our approach to promoting D&I in the workplace. The effectiveness of the policy is governed via our assurance processes and KPI with monthly oversight by our executive, and is underpinned by our Inclusion Strategy to be delivered by 2025. To help us reach our goals we have put various tools in place, including; global employee mandatory training on inclusion, a collective leadership objective on inclusion, and a D&I champion and network forum. The D&I champions and network leads meet regularly and the aim of the forum is:
• Promoting the core themes as well as the wider aspect of diversity across QinetiQ
• Encouraging education and awareness among our employees
• Providing support for our colleagues
• Creating an environment where we can all be our true selves at work
• Contributing to and influence policy on D&I
The role of the champions is to:
• To be a focal point and leader on D&I for our Businesses and functions
• To actively lead the internal D&I Steering Group in our functions
• To be a role model and to promote and raise awareness of the benefits of D&I in our business or functions
• To promote D&I as an integral element of business planning
• To be the representative from the business or function on the Group D&I Council
• To engage regularly with the CR&S Director (the Group lead on D&I) to discuss progress and agree plans
• To support corporate initiatives, e.g. – communicating notable dates, data gathering and reporting
• To promote the benefits of mandatory and additional D&I training
• To be the contact point for D&I ideas, issues, concerns and to escalate appropriately
• To identify and challenge any barriers and resistance to embracing the D&I programme
• To facilitate sharing of best practice both internally and externally
• To promote and celebrate good behaviours and ideas
During the year we have already seen significant increase in employee activity and engagement around D&I. We are confident that this will continue in 2021 and beyond, and have an overall positive effect on our D&I landscape.
Composition, succession and evaluation continued
Year 1FY19 – External
Evaluation by selected independent consultants (specific basis and approach agreed)
Year 2FY20 – Internal
Evaluation focused on reviewing core effectiveness and areas identified for
development from the Year 1 external evaluation (questionnaire based)
Year 3FY21 Internal
Evaluation focused on reviewing the effectiveness of new initiatives and progress
on areas identified for development from the Year 2 internal evaluation
(questionnaire based)
Director effectiveness A performance evaluation of the Board, its Committees and the individual Directors is conducted annually within a three-year cycle, by an external evaluation in the first year of the cycle, followed by two successive internal evaluations. As illustrated by the chart below, FY21 was the third year of the cycle so a second internal evaluation was undertaken ahead of a planned external evaluation at the commencement of a new cycle in FY22. The external evaluation in 2019 was undertaken by Duncan Reed of Condign Board Consulting. Neither has any other connection to the Group.
80 QinetiQ Group plc

In line with the cycle illustrated, this year’s internal evaluation was conducted by way of the Directors completing anonymous online questionnaires regarding the Board and those Committees of which they are members, and was supplemented by one-to-one discussions between the Chairman and individual Directors. Regular invitees to the Board and the Committees also completed the online questionnaires.
The questionnaires surveyed various topics relating to effectiveness, the leadership and composition of the Board and its Committees, the quality of information and support provided to them, how well the Board and its Committees were considered to have achieved their objectives, how good the opportunity for debate and challenge in Board and Committee meetings was, and how well Directors considered that the Board and its relevant Committees had oversight of the Group’s strategy and its management of risk. In addition, specific questions addressed the approach taken by the Board and its Committees during the year to the 2018 Code, in particular as regards to employee engagement and understanding stakeholder views, and how the Directors had managed their responsibilities throughout the COVID-19 pandemic. Directors’ views were also sought on how well the Board and its Committees had addressed the areas for development identified in the previous year’s internal evaluation.
The Company Secretary, in consultation with the Chairman of the Board and Chairs of the Committees, analysed the results of the evaluation by reference to the scores given and the specific observations made, commendations given or improvements suggested, following which such results were presented to and discussed by the Board and its Committees.
The overall outcomes of the evaluations were positive, demonstrating that the Board and each of its Committees continue to function effectively with a high level of probity, integrity and independence, through the mediums of both open and challenging debate in meetings, and appropriate engagement outside of meetings. The key strengths and areas for further attention identified by the FY21 internal Board and Committee evaluation are shown in below:
Key Strengths Areas for further attention
The Board is focused on the long-term strategy, representing the Company’s shareholders and increasing the Company’s value
New Board members have brought fresh thinking and new perspective to the Board’s thinking and processes
By way of using Board briefing meetings to aid understanding and focus discussion, and constructive challenge during scheduled Board meetings
The ESG strategy
Further support to management in its work on the Digital & Data Transformation Programme
81Annual Report & Accounts 2021
Governance

Background reading material, including previous Board and Committee books, investor and strategy presentations, relevant Company procedures and Board policies
Meetings with the Chairman, Executive Directors and members of senior management
Meetings with the Chair of the Committees, external auditors and external remuneration advisers
Guidance on corporate governance arrangements, including the Board and Committee agendas and procedures, Board succession planning and Board evaluation – provided by the Company Secretary
When safe, visits to Company sites, meeting with senior local management
When comparing the outcome of the FY21 evaluation against the principal areas identified for further attention in the FY20 evaluation, the following progress can be noted:
Areas for further attention Progress during the year
Implementation of the Board’s succession plans and review the composition and membership of the Committees
Committees to ensure they each comprise the right mix of skills and experience
On the recommendation of the Nominations Committee, the Board appointed new independent Non-Executive Directors
Continue to consider and implement the Board’s and Committees’ plans to address the changes introduced by the 2018 Code, particularly regarding employee engagement and taking account of stakeholder views in the Board’s decision-making processes
The Board’s and Committees’ plans to respond to the 2018 Code have been implemented in all areas, particularly regarding employee engagement and taking account of stakeholder views in the Board’s decision-making processes
Composition, succession and evaluation continued
Ongoing Director trainingThe Directors have the opportunity to participate in an ongoing training programme organised by the Company Secretary. This include the Company Secretary keeping the Board briefed on relevant regulatory changes, and external training. During the year PwC briefed the Board twice on forthcoming changes to the external audit and governance environment.
The Chairman’s individual performanceAs part of our annual evaluation process, Michael Harper, as Senior Independent Director, led a review of the Group Chairman’s performance. At a private meeting, the Non-Executive Directors, with input from the Executive Directors, assessed the Chairman ability to fulfil his role as such. It was concluded that the he showed effective leadership of the Board and his actions continued to influence the Board and the wider organisation positively.
The Directors’ individual performancesThe Chairman held performance meetings with each Board member to discuss their individual contribution and performance over the year, and their future training and development needs. Following these meetings, the Chairman confirmed to the Nominations Committee that all Directors, have during the year demonstrated clear commitment to their roles.
Director inductionOn joining the Board, whether in an Executive or Non-Executive role, each Director undertakes an induction programme covering subject areas relevant to the requirements of their role. This programme is designed to fast-track a new Director’s understanding of the Group’s purpose, values, strategy and operations, thereby equipping them to perform their role. Details of the induction programme, organised by the Company Secretary in conjunction with the Chairman, for the two new Non-Executive Directors who joined the Board since the last publication of the last Annual Report, is illustrated by the diagram below:
82 QinetiQ Group plc

AccountabilityThe Board has established processes to ensure that all reports and information, which it is required to present in accordance with regulatory requirements, represent a fair, balanced and understandable assessment of the Company’s performance, position and prospects. Details of the process for ensuring that this is the case, are set out on page 89. The Board considers that the Annual Report 2021, taken as whole, is fair, balanced and understandable and provides the information necessary for shareholders to assess the Company’s position, and performance, business model and strategy.
The going concern statement and viability statement are included on page 37, and a summary of the statements of Directors’ responsibilities in respect of the Annual Report and the financial statements is set out on page 116.
Risk Management and Internal ControlThe Board oversees the systems of risk management and internal control through the Audit Committee and the Risk & Security Committee in conjunction with the risk management and assurance processes detailed in this report. These processes are underpinned by an appropriate mix of techniques used to obtain the level of assurances required by the Board. All Board members attend these Committee meetings, either as a Committee member or as a guest, so as to receive at first-hand the findings of the Committees. Matters of particular concern are escalated for presentation at Board meetings.
The internal audit function, which is independent of the business and has a clear reporting line to the Audit Committee, provides assurance to the Board and its Committees over the effectiveness of the internal control environment. The internal audit function prioritises its work according to risk, including those risks identified by the Group through its risk management processes. Additionally, regular discussions are held between the internal audit function and the external auditor regarding internal audit reports, internal audit plans and the wider control environment.
The Board routinely challenges management to ensure that the systems of internal control are constantly improving in order to maintain their effectiveness. At its meeting in March 2021, the Board reviewed the effectiveness of the systems of internal control that were in operation during the year. Further to this meeting, the Board confirms that it has carried out a robust risk assessment of the principal risks facing the Company, including those that would threaten its business model, future performance, solvency and liquidity.
The Strategic Report contains details of the Company’s principal risks and uncertainties (see pages 1 to 51), their impact on the Company and how they are managed, including the Company’s Three Lines Model (see page 31).
Three Lines Model The Company’s system of internal control is based on a three lines model. The assurance activity under the three lines includes the following activities:
• Regular Board, Audit Committee and Risk & Security Committee meetings throughout the year, to consider a structured programme of agenda items determined by reference to Board reserved matters and the Committees’ Terms of Reference, and the needs of the business
• Annual strategy review by the Board, performed following detailed input from the Group and Business functions, and development and implementation of divisional plans to deliver against Group strategy
• Annual and monthly budget reviews, performed at Group and functional levels
• Bi-monthly Global Leadership Team meetings at which all Group functional Directors report on key successes, challenges, developments in the months and their performance to KPIs
• Approved delegated authorities to ensure that all major decisions relating to business change, M&A and bids, and significant capital and operating expenditure are taken at the appropriate level
• Group policies and procedures regarding tax and treasury compliance, anti-bribery and corruption, modern slavery and human trafficking, and data usage and protection
• Audits by the Group Internal audit function. The Internal Audit function is independent of the business and has a direct link to the Audit Committee
• Group-wide confidential reporting procedures
• Global Safety Policies and Operating Procedures to set high standards of safety and operation across the Group, and achieve safe and efficient operating outcomes
Board risk management responsibilities:• Consider and approve the Group’s risk appetite
• Review and approve the Group’s principal risk register and its processes (upon recommendation by the Audit Committee and the Risk & Security Committee) to identify such risks and actions to manage them appropriately
• Review and approve the Group’s emerging risk register and its processes risks (upon recommendation by the Audit Committee and Risk & Security Committee) to identify such risk and actions to manage them appropriately
Audit, risk and internal control
83Annual Report & Accounts 2021
Governance

Audit, risk and internal control continued
Audit Committee management responsibilities:• Overseeing the control of risk – second line
• Review and approve the financial Group risk register and inform the Board
• Review internal audit reports on the effectiveness of Group risk management controls
Risk & Security Committee management responsibilities:• Review and approve the Group risk register and inform the Board
• Risk deep dives
• Overseeing risks and risk processes – second line
Confidential reporting processQinetiQ has in place a confidential reporting process, which is detailed on the Company’s intranet and in its Code of Conduct. If an individual does not feel that they can resolve any concerns with the Company directly through discussions with their functional manager, they can use an externally provided confidential internet and telephone reporting system. All concerns are passed by the external third party to the Group Head of Internal Audit, who ensures that they are held in strict confidence and properly investigated. Reports on confidential reporting activity and outcome of investigations are reported to the Board at each of its meetings.
In addition, the Board reviewed the effectiveness of the Group’s confidential reporting process. The Board assessed the current process in place, which was presented by the Group CSR Director and Group Head of Internal Audit. The Board provided challenge and advice on the matter, and was satisfied that the process in place is fit for purpose.
84 QinetiQ Group plc

Audit Committee Report
Dear Shareholder,I am pleased to present the report of the Audit Committee on the work carried out by the Committee during FY21, my first as the Chair of the QinetiQ Audit Committee. These pages outline how the Committee discharged the responsibilities delegated to it by the Board over the course of the year, and the key topics it considered in doing so.
The Committee continues to operate on the basis of an open but challenging dialogue with management and with the internal and external auditors, and the application of an appropriate level of scrutiny. The Committee fulfils a vital role in the Company’s governance framework, providing valuable independent challenge and oversight across the Company’s financial reporting and internal control procedures. Ultimately, it ensures that shareholder interests are protected and the Company’s long-term strategy is supported, which is an ever more crucial task as we continue to navigate through and move beyond the COVID-19 pandemic.
I hope you find the information in this report about the Committee’s work helpful and I will be pleased to answer any questions you have about it at this year’s AGM. I am also available for questions in the meantime via [email protected].
Shonaid Jemmett–PageAudit Committee Chair
“ The Committee’s focus on the integrity of the Company’s financial reporting and robustness of its internal controls, has been crucial in giving assurance in the context of the Company’s control environment during the COVID-19 pandemic.”
Primary role To assist the Board in fulfilling its oversight responsibilities by reviewing and monitoring the integrity of the Group’s published financial information, the adequacy and robustness of the Group’s system of internal control and risk management, and the quality and effectiveness of its internal and external audit processes.
Key responsibilities• Monitor the integrity of the Group’s published financial
information and review and challenge where appropriate any significant judgements and estimates made by management
• Evaluate the adequacy, robustness and effectiveness of the Group’s internal financial and other controls
• Support the Board in evaluating the adequacy, robustness and effectiveness of the Group’s risk management systems, for identifying, managing and mitigating principal risk, and identifying and mitigating, where possible, emerging risks
• Review the Group’s policies, processes and controls for the detection and prevention of fraud and for compliance with applicable laws, regulations and codes of conduct
• Approve the activities, review the findings and assess the effectiveness of the Group’s internal audit function
• Monitor the activities, review the findings and assess the independence and effectiveness of the external auditor
• Review the contents of the Company’s Annual Report and Accounts, and advise the Board whether, taken as a whole, it is fair, balanced and understandable and provides the information necessary for shareholders to assess the Company’s position and performance, business model and strategy
85Annual Report & Accounts 2021
Governance

Audit Committee Structure The Audit Committee is comprised entirely of independent Non-Executive Directors and is chaired by Shonaid Jemmett-Page, who is considered by the Board to fulfil the Code requirement of recent and relevant experience from the financial sector. The Board considers the members of the Committee to be independent and, in accordance with the Code, the Board concludes that the Committee as a whole possesses competence relevant to the Company’s sector, having a range of financial and commercial experience in the industry and the commercial environment in which QinetiQ operates. The Group Chairman, CEO, CFO, Group Financial Controller, Group Head of Internal Audit, Group Director Risk & Governance and representatives of PwC attended all Committee meetings by invitation during the year.
The Committee met on four occasions during the year. The Committee also met with PwC and the Group Head of Internal Audit on two separate occasions, without Executive Directors present, to discuss the audit process and assure itself regarding resourcing, auditor independence and objectivity.
Three Lines ModelThe Company’s system of internal control and risk management is based on a three lines model. The Committee’s key roles in the three lines model are:
• To oversee, review and challenge the work of the independent assurance functions, principally internal and external audit, thereby adding assurance that the three lines are well designed and operating effectively
• To review and challenge management in relation to the financial reporting of the Group, ensuring its integrity and completeness
Financial reporting processThe Committee regularly reviews the effectiveness of the financial risk management framework, including reviewing key financial risks and assessing the effectiveness of management’s remedial action plans.
The Company operates a financial management and control framework, comprising a system of targets, reporting (external and internal), and controls, that is embedded throughout the businesses and on which progress is reported to the Audit Committee and to the Board. The finance function consists of various financial reporting teams who report to the CFO. The Group Finance team comprises qualified and experienced accountants, and is responsible for the preparation of the half-year and annual reports, and for internal financial reporting to senior management and the Board. To ensure consistency of approach and accuracy in financial reporting, the team provides advice on accounting and financial reporting issues to QinetiQ’s businesses and sets the Group’s accounting policies, which are contained in the Finance Accounting Manual. The team also liaises with the external auditor.
The internal control and risk management systems described on pages 83 to 84 apply to the Company’s process of financial reporting and the preparation of consolidated accounts. The activities of the internal audit team and auditor, and the reviews by the Audit Committee and the Board, provide a structured approach to the review and challenge of financial information and financial reporting.
Internal controlsThe Committee confirms its view that it has received sufficient, reliable and timely information from management in the last financial year to enable it to fulfil its responsibilities.
The Committee assists the Board in fulfilling its responsibilities relating to the adequacy and effectiveness of the control environment and risk management systems. The Group’s system of internal control has been in place for the year under review and up to the date of approval of the Annual Report.
The Committee, on behalf of the Board, undertakes an annual review of the effectiveness of the Group’s system of internal control and did so again for the year under review. This system is consistent with the FRC’s guidance on the internal control requirements of the Code. The review covered all material controls, including financial, operational and compliance controls, and risk management systems. The Committee and Board receive regular risk management reports and together they ensure that there are adequate internal controls in place and that these are functioning effectively. The Directors consider that the Group’s system of internal financial control provides reasonable, but not absolute, assurance in the following areas: that the assets of the Group are safeguarded; that transactions are authorised and recorded in a correct and timely manner; and that such controls would prevent or detect, within a timely period, material errors or irregularities. The system is designed to mitigate and manage risk, rather than eliminate it, and to address key business and financial risks.
Management of US subsidiariesQinetiQ Inc is a wholly owned company within the QinetiQ Group and manages the Group’s US Global Product business. The US Global Products business contributed approximately £208.1m to the Group’s revenue in FY21.
QinetiQ’s US defence and security business interests, through QinetiQ Inc, are operated in accordance with the terms of a Special Security Agreement (SSA) as required by the US National Industry Security Program. The SSA between QinetiQ Group, QinetiQ Inc. and the US Department of Defence (DoD) (acting through the US Defence Counterintelligence & Security Agency (DCSA)), was entered into in July 2020. The prior QinetiQ North America Proxy agreement, which governed QinetiQ’s US defence and security business interests, was terminated on the same day and superseded by the new SSA.
Audit Committee Report continued
86 QinetiQ Group plc

Specifically, the SSA ensures effective management of main facility security clearances; creates an insulation from undue foreign ownership, control or influence; and sets out how the rest of the QinetiQ Group interfaces, collaborates and works with QinetiQ Inc. Under the SSA, the Board of Directors of QinetiQ Inc is comprised of three types of Directors, all nominated by QinetiQ Group plc, as the ultimate foreign owner of QinetiQ Inc. The three types of Directors are Outside Directors, Inside Directors and an Officer Director. These appointments are approved by the DCSA.
The Inside Directors are the means by which QinetiQ maintains appropriate visibility of the management and operations of QinetiQ Inc. These positions are held by Steve Wadey, as the CEO of QinetiQ Group plc, and David Smith, as the CFO of QinetiQ Group plc. The Inside Directors serve as a minority representative of the foreign owner, i.e. QinetiQ Group plc, to ensure there is no undue control or influence on the actions of QinetiQ Inc. Inside Directors need not be US citizens and are excluded from access to US classified and export-controlled information in possession of QinetiQ Inc.
The Officer Director is responsible for the day-to-day operations of QinetiQ Inc and serves as a liaison between the wider QinetiQ Group and QinetiQ Inc. This position is held by Mary Williams, President of QinetiQ Inc. The Officer Director must ensure that the procedures and requirements of the SSA are effectively implemented, and has an obligation to maintain the security of classified and export-controlled information entrusted to QinetiQ Inc, as well as QinetiQ Inc’s ability to perform on classified contracts and participate in classified programmes. This individual must be a resident US citizen who either has or is eligible to possess personal US security clearance.
Outside Directors must be resident US citizens who are objective individuals, have had no prior relationship with QinetiQ that could cause conflict with their objectivity, and possess personal US security clearance. The appointed Outside Directors are John Hillen, Chair of the QinetiQ Inc Board, Pamela Drew and Tom Mills. The number of Outside Directors must outnumber the number of Inside Directors. The Outside Directors also form the Government Security Committee that is in place to ensure US national security interests are upheld.
During the year, the framework of internal controls in respect of QinetiQ Inc, was realigned with the SSA. The Audit Committee Chair, the Group CEO and the Group CFO regularly communicated with the Audit Committee Chair of QinetiQ Inc, who is also the Chairman of the QinetiQ inc Board. In addition, the internal audit function worked closely with US management to gain assurance that an effective control environment was in place. The Committee was satisfied that the Group’s internal controls were effective and applied as far as possible within the terms of the SSA.
Work of the Audit Committee during FY21 The Audit Committee has assessed whether suitable accounting policies have been adopted and whether management has made appropriate judgements and estimates. Throughout the year, the Finance team has worked to ensure that the business is transparent and provides the required level of disclosure regarding significant issues considered by the Committee in relation to the financial statements, as well as how these issues were addressed, while being mindful of matters that may be business-sensitive.
The preparation of the Consolidated Financial Statements requires the application of certain judgements and estimates. This section outlines the main areas of judgement that have been considered by the Committee, the Committee has reviewed and challenged these items and the Committee’s conclusion.
87Annual Report & Accounts 2021
Governance

Activities during the yearFinancial Reporting: Key uncertainties and judgements/estimatesSpecific issues addressed by the Committee for the year ended 31 March 2021 include the following items of significant judgement.
Items of significant judgement The Committee’s review, challenge and conclusion
Long-term contract accounting The Group has a large number of contracts which span multiple periods and are accounted for on a percentage of completion basis in accordance with IFRS 15. Long-term contract accounting requires a number of judgements and management estimates to be made, particularly in calculating the forecast costs to complete the contract.
Onerous contract provisions are recorded where there is an expectation that a contract will be loss-making, and judgement is applied to determine the magnitude of any provision. Particular focus is given to contracts which are technologically challenging.
The Committee received commentary from both management and the external auditors in respect of the most significant contracts being delivered by the Group and discussed the main financial assumptions (including level of risk reserves).
The Committee concluded that management’s best estimates were reasonable.
Two specific onerous contracts were discussed in Committee meetings and a further contract was challenged as to whether or not it is likely to be loss-making and require a provision to reflect this. Following a robust discussion and review of supporting evidence, it was agreed that while there was a risk of the contract in question being onerous that was not the most likely outcome and does not require to be accounted for as such.
Provisions and contingent liabilities The Group holds provisions in respect of legal, regulatory and environmental issues. Judgement is required in determining whether provisions are required.
Where a provision is not deemed to be required but a contingent liability exists, judgement is also required in respect of appropriate narrative disclosure.
The Committee reviewed a detailed analysis of provisions provided by management and questioned the completeness and adequacy of such provisions.
During the year, the Committee reviewed and assessed management’s disclosures in respect of contingent liabilities generally and considered whether any specific disclosures were required in respect of the incident at the Pendine range (an MOD site managed by the Group under the LTPA contract). The contingent liabilities note (excluding any disclosure of potential liabilities that are merely deemed to be remote) are set out in note 32.
Impairment of goodwill and acquired intangibles The Group has a material amount of goodwill and associated intangible assets relating to acquisitions. There is a risk of impairment where the latest view of future business performance is less optimistic compared to the view as at the time of recognition of the assets.
An impairment charge has been recognised in the QinetiQ Germany CGU during the year.
The Committee reviewed the outputs of management’s annual impairment testing exercise, noting the use of external advisors to prepare the technical assumptions (discount rates, long-term inflation) which have also been verified as appropriate by the external auditors.
The Committee had lengthy discussions with management and the external audit team, specifically challenging the revenue and profit estimated to be delivered from key opportunities not yet under contract. The Committee acknowledged that there was a wide range in outcomes to the impairment test which is very sensitive to outer year cash flows. On challenging management, and review of challenge presented by the external auditors, the Committee concluded that the £25.4m impairment recorded in the year was appropriate.
The Committee also assessed the Group’s disclosures regarding sensitivity of the outcome of the impairment assessment to changes in key assumptions. These were also deemed to be appropriate.
Accounting for tax research and development expenditure credits The Group benefits from significant levels of Research and Development Expenditure Credit (‘RDEC’) in the UK and accounts for these under IAS 12, rather than as a government grant within IAS 20.
The Committee reviewed management’s accounting policy for RDEC (page 170) and disclosure of its impact on the Group’s underlying effective tax rate (page 137). The Group’s external auditors reassessed the continued application of management’s judgement that RDEC should be accounted under IAS 12.
The Committee noted that the external auditors deemed the Group’s accounting to be appropriate (though other companies do adopt an alternative accounting policy).
We have reviewed the disclosures made in respect of tax, in particular around estimates and uncertainties and are satisfied that the disclosures made are appropriate.
Impact of COVID-19 The COVID-19 pandemic has caused significant global disruption and economic uncertainty. This could have potential internal control and financial reporting implications for the Group (e.g. asset impairments, longer-term viability assessments).
The Committee received regular reporting throughout the year on the impact of COVID-19 on the Group and noted the strong resilience shown during the last year (together with the favourable impact of key management actions to mitigate any impact). The Committee monitored the continuing effectiveness of the system of internal control and risk management during this period. The Committee concluded that COVID-19 no longer merited disclosure as a Principal Risk and there was no impact on the Directors’ assessment of the longer-term viability of the Group.
Audit Committee Report continued
88 QinetiQ Group plc

Going concern and viability statementsFollowing review and challenge, the Committee concluded that the Group will be able to continue in operation and meet its liabilities as they become due. The Committee also considered it appropriate that the statement covers a five-year period. In reaching its conclusion the Committee reviewed the five-year forecast, the stress tests applied to it and the mitigating actions available to the Company. The viability statement and the going concern statement can be found in full on page 37, including the process on how the process was conducted.
Fair, balanced and understandableThe Board has established processes to ensure all reports and information, which it is required to present in accordance with regulatory requirements, represents a fair, balanced and understandable assessment of the Company’s performance, position and prospects.
As such, the Audit Committee was requested to provide advice to the Board on whether the FY21 Annual Report & Accounts, taken as a whole, provide a fair, balanced and understandable assessment of the Company’s financial position and future prospects and provide all information necessary to a shareholder to assess the Group’s performance, business model and strategy. Following the process established and reported on in previous years, and in forming its opinion, the Committee reflected on the information it had received and its discussions throughout the year. The review is a well-established and documented process involving senior management and the core reporting team. The assessment was assisted by an internal verification of the factual content by management, a review at different levels of the Group to ensure consistency and overall balance, and a comprehensive review by the senior management team and the external auditors.
Following its review, the Committee was of the opinion that the FY21 Annual Report & Accounts were representative of the year and present a fair, balanced and understandable overview, providing the necessary information for shareholders to assess the Group’s position and performance, business model and strategy.
Prevention and detection of fraudThe Committee reviews the effectiveness of the control environment annually, which includes considering the risk of fraud. In addition, the Committee discuss with the internal and external auditors any findings on the quality of the organisation’s anti-fraud systems and controls. At each Committee meeting during the year, the Committee members individually confirmed that they were not aware of any case of fraud within the Group at that point in time.
Treasury strategy and complianceThe Company maintains a treasury policy which sets the approved level and nature of the Group’s debt and hedging facilities, and the headroom to be maintained under them. The Committee regularly reviews the treasury policy, approved changes to it where appropriate and monitored the Company’s compliance with it.
Tax strategy and complianceThe Committee reviewed and approved the Company’s tax strategy to ensure that it remained appropriate. The Committee also received updates from management about the Group’s tax affairs, including the status of any tax audits and tax compliance matters.
Audit Committee Terms of Reference The Committee reviewed and approved updated Terms of Reference, which are available at www.QinetiQ.com.
Internal auditThe internal audit function is independent of the business and has a clear reporting line to the Audit Committee The Group Head of Internal Audit reported on four occasions to the Committee on the operation of internal control and risk management processes. The Committee approved the annual internal audit plan, providing input to it and ensuring it was focused on key risk areas and provided appropriate coverage across Group. The audit plan was formally reviewed during the year by the Committee to ensure that resources were adequate and that the plan itself remained risk-based. Any changes to the plan are approved by the Committee.
The annual plan is structured to ensure that all significant financial and non-financial risks are reviewed within a rolling three-year period. The audits cover financial systems, programmes and projects, as well as reviews of specific risks identified through the Group’s risk management processes.
During the year, the internal audit function audited the controls in place over a range of key functions across the Group in line with the risk-based internal plan for the year. Specific areas of focus were overseas subsidiaries, internal transformation programmes, contractor management, project management, and payroll.
Significant issues resulting from the audits completed were reported to the Committee, who supported the findings and questioned management over the issues identified. Action plans were put in place and progress of the agreed actions and closures thereof were reviewed by the Committee.
The Board Assurance Map continues to provide further assurance to the Committee, and is based on the three lines model published by the Institute of Internal Auditors (set out on page 31). It is used to identify relevant compliance and assurance providers across the Group, and helps highlight potential gaps in coverage when compared to key business processes and risk areas. As we look ahead, with anticipated changes within UK Corporate Governance on the horizon and global transformation programmes in progress, the Board Assurance Map will be integral to monitoring Group wide assurance and helping to inform future plans within the three lines.
The results of the Internal audit activity in the year continued to indicate that, overall, an effective control environment was in place, with an open culture of continuous improvement being demonstrated by regular management requests for internal audits to be undertaken.
89Annual Report & Accounts 2021
Governance

External auditPwC Audit ScopeReflecting the changing composition of the Group and its expansion in the US , the FY21 Audit Scope was increased to also include QinetiQ Inc. (MTEQ). QinetiQ Inc. contributed £135.5m to the revenue in FY21, as such representing a significant part of the total revenue of the Group, and the Committee viewed it appropriate to extend the audit scope to reflect this.
Non-audit work and auditor independenceThe Audit Committee is responsible for QinetiQ’s policy, the Code of Practice, on non-audit services and the approval of non-audit services. The Code of Practice is applicable to all employees and sets out the principles for regulating the award of non-audit work to the external auditor.
In order to safeguard the auditor’s independence and objectivity, and in accordance with the FRC’s ethical standard, QinetiQ does not engage PwC for any non-audit services except where it is work that they must, or are clearly best-suited to, perform. Accordingly, the Company’s policy for the engagement of the auditor to undertake non-audit services broadly limit these to audit-related services such as reporting to lenders and grant providers, where there is a requirement by law or regulation to perform the work. All other non-audit services are considered on a case-by-case basis in light of the requirements of the ethical standards and in compliance with the Company’s own policy.
The Audit Committee approves the terms of all audit services as well as permitted audit-related and non-audit services in advance. Pursuant to the Code of Practice, any non-audit services conducted by the external auditor require the prior consent of the CFO or the Chair of the Audit Committee, and any services exceeding £50,000 in value require the prior consent of the Audit Committee as a whole. For work that is permissible by type, the Audit Committee will take into consideration the size of the contract in proportion to QinetiQ’s revenue and profit, and also the total size when aggregated with other contracts with PwC, noting that some non-auditing services are subject to an annual regulatory 70% spending cap of the average of the audit fees billed over the last three year period.
It is also QinetiQ’s policy that no former PwC employee may be appointed to a senior position within the QinetiQ Group without the prior approval of the CFO.
Review of non-audit work during the yearThe Committee reviews the cost and nature of non-audit work undertaken by the external auditor at three meetings during the financial year as a standing item, with a fourth meeting considering the auditor’s fees as part of the year-end review.
The Committee had concluded, prior to engaging PwC for the provision of these services, that there had not been any conflict of interest that might compromise the independence of PwC’s audit work.
The following auditors’ remuneration has been charged in arriving at profit before tax:
All figures in £ million 2021 2020
Fees payable to the auditor and its associates
Audit of the Group’s annual accounts 0.6 0.6
Audit of the accounts of subsidiaries of the Company 0.5 0.2
Total audit fees 1.1 0.8
Audit-related assurance services 0.1 0.1
Total non-audit services 0.1 0.1
Total auditor’s remuneration 1.2 0.9
Review of the effectiveness and the independence of the external auditorAt its September meeting the Committee reviewed the results of an effectiveness survey of the previous year’s audit process, which allowed learnings to be fed into the current year’s planning process. This took the form of questionnaires completed by members of the Group and divisional finance teams, and was supplemented by feedback from the Executive Directors and members of the Committee, together with consideration of the FRC’s latest Audit Quality Inspection Report on PwC. The evaluation confirmed that PwC continues to perform its audit work to a high standard, in particular as a result of its comprehension of the Company’s business, control processes and the matters on which significant accounting judgements or estimates are required and its appropriate validation or challenge of management’s views.
Audit appointment and partner successionPwC was appointed as auditor of the Group at the 2018 AGM following a tender process. The current external audit engagement partner is Julian Gray, Senior Statutory Auditor, who has now concluded his fourth year as the Group’s audit lead partner. The time line for the mandatory appointment of a new external audit lead partner is five years, and during FY22, the Committee Chair will be working closely with PwC and Julian to identify the next PwC lead partner to manage the external audit team. The external audit contract will be put out to tender at least every 10 years. The Committee considers that it would be appropriate to conduct an external audit tender by no later than 2028.
The Committee and the Board will be recommending PwC’s reappointment at the 2021 AGM.
Audit Committee Report continued
90 QinetiQ Group plc

Audit Committee effectiveness review The evaluation of the effectiveness of the Committee was conducted alongside the Board effectiveness review and carried out by way of a questionnaire. See more on pages 60 to 62.
The outcome of the evaluation confirmed that the Committee continues to operate highly effectively and determined that Committee members have good oversight of, and are able to raise appropriate challenges in respect of, important financial matters, such as management’s significant accounting judgements and the implementation of new accounting standards.
Looking ahead Looking ahead, the Committee is cognisant of a number of key recommendations from the BEIS consultation “Restoring trust audit and corporate governance for companies, audit committees and auditors”, noting in particular the strengthening of the role and responsibilities of Audit Committees, but also being subject to more regulatory scrutiny and potential inspection and observation of their activities.
From 2022, all premium listed companies must report in line with the Task Force on Climate-related Financial Disclosures (TCFD) Recommended Disclosures on climate-related reporting, on a comply or explain basis, and include a statement in their annual report to that effect. The Audit Committee will during the year, be working closely together with the Board to ensure compliance with these important areas.
91Annual Report & Accounts 2021
Governance

Risk & Security Committee
“ The safety and wellbeing of our employees, customers and partners, have remained the Company’s number one priority throughout the pandemic”.
Dear Shareholder, I am pleased to present our Risk & Security Committee report for FY21, my first as its Chair, which describes our activities and areas of focus during the year.
Risk profile of the Group The Group has been operating through a period of uncertainty further to the COVID-19 pandemic and the role of the Committee during this period has been to assure the Board that management are proactively preparing for all situations that may impact the Group. Despite the uncertain times, the Group has taken several initiatives to reduce its risk profile. The review of the Group Risk Register, which is described further on pages 30 to 36, continues to be fundamental for the Committee to undertake its duties. The Risk Register contains details of the Company’s principal risks and uncertainties, their impact on the Company and how they are managed.
This year the Committee spent further time ensuring that the Group Risk Register remains relevant and accurate. “Red” risks are made the subject of a report to the Committee or become the subject of a deep-dive review as part of the Company’s risk management processes.
Security profile of the Group During the year, the Committee transitioned into a Risk & Security Committee with one of its core responsibilities now being to also oversee the Group’s physical and non-physical security systems. 2020 and 2021 have been extraordinary with numerous security challenges manifesting themselves either directly or indirectly as a result of COVID-19, and the Group has faced an increased number of security challenges as a result.
Now more than ever, the Committee understands that emphasis has to be placed on the need for a robust, international security capability, which leverages our Group wide capability and experience.
The Committee members and I have, together with the Group Functional Director Business Transformation & Services, Group Director Security and Group Director Risk & Governance, developed a schedule of security related agenda items, ensuring that the Committee will be able to oversee this important subject, as well as the risks facing the Group.
FY22 Action plan • Continue to monitor progress of the Company’s wider
technology and cyber security transformation
• Continue to increase focus on risk reporting and accountability for risk throughout the Group, both for its UK businesses as well as its global businesses
• Publish a Global Security Strategy to emphasise the importance of security and to drive a culture of heightened security awareness across the Group
I hope you find the information in this report about the Committee’s work helpful and I will be pleased to answer any questions you have about it at this year’s AGM.
General Sir Gordon Messenger Risk & Security Committee Chair
92 QinetiQ Group plc

Risk & Security reportKey highlights FY21• Reshaping the purpose of the Committee to also focus on
physical and non-physical security
• Approved the updated Terms of Reference and the annual schedule of agenda items
• Received frequent updates on health and safety matters, in particular in relation to COVID-19, and the measures put in place to allow employees’ safe working, from site or at home, and employees’ wellbeing
• Monitored the impact of the COVID-19 pandemic on our business and supply chain
• Focused on the risk management processes in the Group’s international businesses.
Primary role Alongside the Audit Committee, to provide scrutiny, and assurance to the Board, that the required standards in risk management, security, health and safety, within the UK and internationally, are achieved, including driving continuous improvement ensuring that the organisation fulfils its statutory requirements and duty of care.
Key responsibilities The Committee primary functions are:
• To oversee the sound operation of the Group’s risk management systems
• The ongoing review of the Group’s principal and emerging risks (see pages 32 to 36)
• To oversee the Group’s physical and non-physical security systems, including monitoring security exposures and security culture, and considering emerging security issues
• Continue to ensure that health and safety risks are being effectively managed across the Group
• To oversee the Group’s second line assurance activity over the first line compliance activity taking place across the Group’s functions and businesses
• To monitor adherence to the generic MOD compliance system
• To review the Group’s policies, processes and controls for the detection and prevention of bribery and modern slavery and compliance with applicable laws, regulations and codes of conduct
Risk & Security structure All members of the Board are members of the Risk & Security Committee, which is chaired by Gordon Messenger. The Group Functional Director Business Transformation & Services, the Group Director Security, the Group IT Services Director, the Group Director Risk & Governance and the Group Head of Internal Audit attend all Committee meetings by invitation. The Committee met on four occasions during the year.
Risk management The Board assumes ultimate responsibility for the effective management of risk across the Group, determining its risk appetite and ensuring that each business area implements appropriate internal controls. The Group’s risk management systems are designed to manage, rather than eliminate, the risk of failure to achieve business objectives, and can only provide reasonable and not absolute assurance against material misstatement or loss. These systems are also designed to be sufficiently agile to respond to changes in circumstances, such as the impact of COVID-19.
To enable the Committee to get a comprehensive understanding of how risk management processes have been implemented and to ensure that these are fully embedded within the business’s day-to-day work, deep-dives are presented to the Committee by employees who have first-hand knowledge of such matters, i.e. perform the work on a daily basis.
Risk reporting is incorporated into the management of the business through the Global Leadership Team and monthly performance reviews feed into the Group strategy at the Executive and Board level. The risk management and risk monitoring processes are divided as following:
Risk management
• Review risk management structures and reporting lines (i.e. effectiveness of control environment)
• Effectiveness of risk reporting processes
• Review effectiveness of risk identification processes
• Consideration of external auditor recommendations relating to risk management
Risk monitoring
• Review of risk register and key exposures
• Health, Safety & Environmental Performance
• Internal Audit reports
• International business governance
• Anti-bribery and corruption
Security management The Committee is assured by the progress made by the Group in the year, although, with the ever-increasing incidence and sophistication of cyber attacks and the consequent need for the Group to remain vigilant, the Committee expects security to remain one of its key areas of focus. A Security Culture Survey, conducted by the Group Security team covering the whole Group and aimed at understanding the security maturity levels across four areas; information, physical, cyber and personnel security, proved invaluable in identifying areas for focus, both domestically and internationally.
93Annual Report & Accounts 2021
Governance

Risk & Security Committee continued
Cyber – security Our cyber security procedures have been strengthened considerably in recent years in response to the increasing threat this poses to businesses, and it remains an area that we keep under continuous review.
FY21 has seen a number of security challenges manifesting themselves, either directly or indirectly, as result of COVID-19. Numerous threat actors have taken the pandemic as an opportunity to target businesses and employees as they adapt to new ways of working and to exploit the vulnerabilities that working remotely introduce. This has been overlaid by more aggressive physical and technical security threats at a strategic level and increasingly sophisticated cyber attacks. Further emphasis has therefore been placed on the need for a robust international security capability, which leverages Group wide capability and experience, shares global risk and threat information and is capable of proactively managing across the full security spectrum.
The Committee regularly receives reports from the Cyber Security team and the Group IT team on the maintenance of adequate cyber security systems, work undertaken to improve cyber security capabilities and lessons to be learnt from high-profile data breaches.
Our IT team is continuously testing the effectiveness of our ongoing security awareness programme by sending fake phishing emails to employees and monitoring their response. Any employee who clicks on the links contained in the test emails, or enters their credentials, is provided with further training on the dangers and tips on how to identify phishing emails.
All employees have to complete mandatory information security training each year, which focus on our policies and procedures, cyber and personal security. Our Group intranet also includes a “tips and tricks” section for our employees with guidance on issues such as cyber security, social media and general security awareness.
Governance Self-certification processAn annual process of hierarchical self-certification on the effectiveness of internal controls has been established. This process provides a documented and auditable trail of accountability for the operation of the system of internal control. It is informed by a rigorous and structured self-assessment that addresses compliance with Group policy, and provides for successive assurances to be given at increasingly higher levels of management and, finally, to the Board. The self-certification process, which is carried out at the full and half-year, is reported to the Committee by the Group Director Risk & Governance.
The self-certification process continues to be a valuable tool in assessing the effectiveness of internal controls in all functions and business units across the Group.
Generic MOD compliance systemA key aspect of the Committee’s work is the oversight of the UK Ministry of Defence’s (MOD) generic compliance system. This is integral to the work of QinetiQ in its relationship with the UK Government.
The system is designed to give the MOD customer confidence that QinetiQ is able to provide impartial advice during any competitive evaluation of a procurement opportunity where the Group wishes to operate on both the “buy” and the “supply” sides. The aim is to achieve a balance between meeting the needs of the procurement customers in the MOD (principally Defence Equipment & Support) and the need to allow QinetiQ the flexibility to commercialise research into the supply chain and pursue its planned business activities, without compromising the defence or security interests of the UK. The Board nominates two senior managers to act as Compliance Implementation Director (CID) and Compliance Audit Director (CAD).
Health and safety The Group is committed to providing a safe environment at all Company sites for the benefit of our employees, contractors, tenants and visitors. At each Committee meeting, a detailed update is provided on health and safety matters.
In March 2021 there was an incident at the Pendine range, an MOD site managed by the Group under the LTPA contract, which resulted in one of our employees sustaining life-long injuries. Our focus will remain on supporting our colleague and their family over the coming months, as well as those who work at Pendine and anyone across the business who has been affected by what has happened. We are continuing to support the external investigations into the incident and we have launched our own, to better understand what happened and any lessons we can learn and apply.
Anti-bribery and corruptionThe Committee oversees a zero tolerance approach to bribery and corruption, as confirmed by the Company’s anti-bribery and corruption policy and the supporting local policies that apply to members of its Group. The Group also have in place a range of procedures, including regular training targeted at potentially risk exposed roles of the employees, Group and local gifts and hospitality policies, and Group and divisional procurement, contracting and partnering practices, which are designed to prevent bribery. See more on page 47.
Data privacy The Company respects the personal data privacy of its customers, employees and other individuals in respect of whom it and members of its Group process personal information. The Group therefore has in place policies which mandate the lawful processing and protection of such personal information in accordance with applicable laws, and procedures which are designed to achieve the same. A report on GDPR compliance is presented to the Committee at each Committee meeting.
Effectiveness reviewThe evaluation of the effectiveness of the Committee during FY21 was conducted internally, by way of a questionnaire. See more on pages 60 and 62. The performance of the Committee was rated highly overall, and the Committee agreed it would continue to focus on the COVID-19 pandemic, and cyber risk and security in FY22.
94 QinetiQ Group plc

Directors’ remuneration reportDear Shareholder,As the Group Chairman outlined in his statement on page 6, the last year has been like no other, with every aspect of our lives impacted by the COVID-19 pandemic. However, building on a strong first half of the financial year, the Group has continued to perform very strongly throughout FY21, despite the impact of COVID-19. Excellent progress was made by the CEO, Global Leadership Team and our employees to deliver a fifth year of growth and a 6% organic increase in FY21 operating profit.
One of the reasons why the company has weathered the storm so well is the swift and decisive remuneration-related actions taken by leadership in FY21 to contain costs and conserve cash. The CEO and CFO both agreed to a temporary base salary reduction of 34% and 32% respectively, and Non-executive Directors agreed to a 25% reduction in fees, which were in place for six months in FY21 and not repaid. The company also decided to pay all FY20 annual incentive payments (including the Executive Directors’ FY20 Bonus Banking Plan) in shares to be held for one year, and agreed that there would be no base salary increases in FY21.
The annual contribution to the Bonus Banking Plan (BBP) pool for FY21 for the CEO and CFO is 95.7% of the maximum for both, recognising their strong performance and an excellent year for the company.
The FY21 contingent share award under the Deferred Share Plan (DSP) will be made at 97.3% of the maximum available reflecting excellent revenue growth in-year. This DSP award will not vest in full unless the level of underlying operating profit for FY21 (i.e. £150.0m adjusted for in-year acquisitions) is at least matched in FY24; if not, as a minimum, 50% of the initial award will lapse. The Committee has agreed that the FY22 DSP strategic growth performance measure will remain as Group revenue growth (excluding in-year acquisitions) to incentivise the delivery of growth across the whole Group.
The FY21 CEO single figure on page 100 is higher than that for FY20 as it includes the first award under the DSP based on FY18 performance, which I am pleased to confirm has now ceased to be contingent as the performance underpin has been met; that is, our excellent FY21 profit performance of £150.0m exceeded that delivered in FY18 of £122.5m. The FY18 DSP vests as shares which must be retained for a further two years and the value is disclosed in the FY21 single figure.
The business context and incentive out-turn for FY21Five years ago we launched a strategy to deliver sustainable, profitable growth. The strategy focused on leading and modernising UK test and evaluation, becoming a more international company and effectively applying commercial and technological innovation. Since implementing this strategy, we have turned around five years of revenue decline and we continued to deliver strong and sustainable organic growth in FY21.
The FY21 BBP out-turn was 95.7% of the maximum for the CEO and the CFO which reflects excellent financial and operational performance by the Company and the Executive Directors. During the year incentive targets were reviewed in the light of the impact of COVID-19 on the business; however, the Committee and executives determined to retain the original targets set pre-COVID-19, which were considered to be stretching even before the pandemic.
The Committee considered the FY21 BBP out-turn in detail from the perspective of our key stakeholders (shareholders, customers and employees) and agreed that it was appropriate not to exercise the discretion available to amend the outcome; that is, no adjustment was made to FY21 incentive targets or outcomes to reflect the impact of COVID-19 given the exceptional performance delivered. The 50% due in June 2021 will be paid in cash and the other 50% is deferred into the BBP pool, where it will remain at risk of forfeiture. These deferred amounts are reported as remuneration for the year they were earned.
Remuneration
“ Excellent progress was made by the CEO, Global Leadership Team and our employees to deliver a fifth year of growth and a 6% organic increase in FY21 operating profit.”
QinetiQ’s Gender Pay Gap data can be found on our website at www.QinetiQ.com
95Annual Report & Accounts 2021
Governance

The FY21 DSP award will be granted at 97.3% of the maximum based on the achievement of the Group revenue growth target and the achievement of the FY21 margin underpin. The Award will remain contingent based on the achievement of the profit performance underpin. The level of Group profit for FY21 £150.0m must be achieved in FY24 or, at a minimum, 50% of the FY21 DSP award will lapse.
Implementation for FY22The Bonus Banking Plan for FY22 is based on the same financial metrics as in FY21 (orders, profit and cash) with stretch targets set against the delivery of the Integrated Strategic Business Plan (ISBP). Financial metrics have a 75% weighting and non-financial targets have a 25% weighting based on the achievement of collective and personal goals. Payment for target performance is 50% of the maximum.
The Committee considered return on investment as an annual incentive metric and is monitoring it for potential future use. At this time it is not considered appropriate as it may not drive the right behaviours at this point in the company investment cycle.
In support of the ISBP, the FY22 DSP strategic growth performance measure is revenue growth across the Group excluding in-year acquisitions, as per FY21. Underpins ensure that FY22 profit margins are strong and Group operating profitability must be at least equal to FY22 performance in FY25 for full vesting, as detailed on page 104. .
Employee engagement and rewardQinetiQ’s employees are key to the delivery of the growth strategy. Our employees have been outstanding this year, demonstrating extraordinary agility, focus, commitment and drive to continue to deliver to our customers.
The CEO and the Group HR Director have held regular discussions with our Global Employee Voice on reward matters. The people section on page 42 details our employee engagement activity.
I met with the Chair and the Deputy Chair of the Global Employee Voice group during the year and I found the discussions very helpful in terms of understanding employee views. I understand that they have also found the meetings helpful to build their awareness of the Remuneration Committee’s approach to executive remuneration. It is our intention to continue to meet at appropriate intervals.
In FY19 the Company introduced an All Employee Incentive Scheme (AEIS) whereby every eligible employee can earn a fixed amount if the Company achieves a level of operating profit within a predetermined range from target to stretch. For FY21, the maximum payment for stretch performance was increased from £1,000 to £1,250. I am pleased to confirm that the AEIS will pay £1,217 to each employee for FY21, a significant increase from the £740 paid in FY20. The AEIS is an important element of the company’s Rewarding for Performance strategy and aligns employees and shareholder interests by incentivising and rewarding profitable growth. The Company will operate the AEIS again for FY22 and thereafter.
The Directors’ Remuneration Policy and pensionsThe Directors’ Remuneration Policy was presented for the triennial binding vote at the AGM in July 2020 and the Committee noted that we received a 87% vote in favour of the Policy and an 89% vote in favour of the Annual Report on Remuneration for FY20.
The Policy approved at the 2020 AGM confirmed that incumbent Executive Directors’ pension allowances would be reduced to the UK employee level (10.5% of salary) over the three-year life of the 2023 Policy. This reduction from 20% to 10.5% has been brought forward for the CEO and CFO to be effective from 1 January 2023.
The Committee acknowledges that the incentive plans can appear complex as we have had this feedback from shareholders. However, the plans are embedded and well understood by executives; they are delivering alignment, driving the right behaviours and incentivised the delivery of excellent performance in FY21.
ConclusionImplementing the Directors’ Remuneration Policy in the interests of shareholders and considering the Company’s response to the COVID-19 pandemic have been the primary areas of focus of the Remuneration Committee in FY21.
FY21 was an excellent year for QinetiQ delivering growth in a very challenging environment for the company and its leadership. The Remuneration Committee carefully scrutinises financial performance as it relates to incentive payments and is satisfied that FY21 payments are appropriate and fair, reflecting performance in this extraordinary year during which our share price increased by some 5% and our dividend was paid at an enhanced level to the prior year having initially been deferred in response to COVID-19.
As we look to FY22, there is still a great deal of uncertainty as governments manage the impact of the COVID-19 crisis and global economies hopefully recover swiftly. The Remuneration Committee will continue to monitor closely the impact of COVID-19 on the business as it relates to incentives and other elements of remuneration.
I am very grateful for the time shareholders and their representative bodies have given us throughout the year and I hope that we can rely on your vote in support of the Annual Report on Remuneration at the AGM on 21 July 2021.
I would welcome comments and questions from shareholders in relation to this Directors’ Remuneration Report and I can be contacted through [email protected].
Susan SearleRemuneration Committee Chair20 May 2021
Remuneration continued
96 QinetiQ Group plc

Components, alignment, application and changes
Annual fixed pay Link to strategy Application in FY22
Salary Executive Directors’ base salaries are set on appointment and reviewed annually or when there is a change in position or responsibility. Typically, base salaries will be increased by a similar percentage to the average pay increase for all employees of the Group.
Fixed pay is set at a level that enables us to attract and retain high-quality Executive Directors, who are capable of successfully leading and executing our strategy and delivering long-term sustainable growth. Our Policy aims to ensure that fixed pay remains attractive and competitive.
No change to current Policy.
Benefits Benefits include a car allowance, health insurance, life assurance, income protection and taxable expenses.
No change to current Policy.
Pension Existing Executive Directors currently receive 20% of base salary allowance as cash in lieu of pension.
New Executive Directors will receive 10.5%, as will existing ones effective January 2023.
Medium-term variable pay (One to Four Years) Link to strategy Application in FY22
The Bonus Banking Plan (BBP) The BBP is a partially deferred annual bonus scheme where a maximum award of 200% of salary is available. Reward is 75% weighted on financial metrics (for FY21 orders, operating profit and operating cash flow – equally weighted) and 25% weighted on non-financial metrics (key strategic, operational and personal goals).
In the first year of the BBP cycle, 50% of the annual award is paid as cash with the remainder deferred and held as notional shares in a deferred pot. Each year the annual award is added to this notional pot, with 50% of the balance then paid as cash. At the end of the fourth year the entire residual pot is paid as shares and a new three year performance cycle initiated.
The BBP rewards strong financial performance through a 75% weighting to financial metrics. Over the long-term this financial performance is driven by the successful implementation of our strategy. The scheme also rewards non-financial performance in areas such as implementing safety programmes and transforming the culture. The BBP therefore supports our ongoing transformation which is critical to our long-term success.
The partial deferral of the bonus and exposure to share price drives a long-term and sustainable focus, aligning interests with shareholders. Furthermore, 50% of the value of the deferred BBP pot is subject to forfeiture should minimum performance requirements not be met.
No change to current Policy.
Long-term variable pay (One to Six Years) Link to strategy Application in FY22
The Deferred Share Plan (DSP) The DSP is a long-term incentive scheme that provides a contingent share award up to a maximum of 125% of salary for success against an annual metric aligned with QinetiQ’s long-term strategic growth plan.
Initial entry in to the DSP is based on an annual growth measure with a pre-grant margin underpin, to ensure that Executive Directors are not incentivised to pursue low-margin growth.
The award is then held in contingent shares for a period of three years. If at this point the level of profit in the year that gave rise to the award has been maintained, the contingent award is considered ‘vested’ and is included in the single figure. Shares are then subject to a further two year holding period.
The DSP enables us to reward Executive Directors for delivering against key strategic priorities. We retain the flexibility to select an appropriate strategic growth metric on an annual basis ensuring that the DSP is agile and drives the long-term strategic success of the Group.
With a four year vesting period, and a further two year holding requirement, the DSP is inherently long-term in nature with various underpins ensuring growth is both sustainable and profitable over the long-term.
No change to current operation.
Remuneration at a Glance
97Annual Report & Accounts 2021
Governance

Remuneration continued
Illustration of FY22 potential (£’000)
Remuneration in contextOur remuneration principles
Minimum – Fixed Pay (FY22 base salary, plus taxable benefits and pension allowance)
Target – Fixed Pay plus BBP at Target (100% of base salary) and DSP at Target (62.5% of base salary)
Stretch – Fixed Pay plus BBP at Maximum (200% of base salary) and DSP at Maximum (125% of base salary)
+ 50% Share price appreciation – Stretch plus 50% share price appreciation (on 50% of BBP and 100% of DSP)
Single Figure FY21 (£’000)Chief Executive Officer Chief Executive Officer
FY20 FY21
£1,069
£128
£781£703
£1,179
£711
TOTAL £2,593
TOTAL £1,978
TOTAL £834
TOTAL £600
TOTAL £1,376
TOTAL £2,936
TOTAL £1,885
TOTAL £3,664
Chief Financial Officer Chief Financial Officer
FY20 FY21
£590£522
£541
£892
TOTAL £1,955
TOTAL £1,393
£803
Fixed pay
Medium-term variable pay
Long-term variable pay
TimingTo create strong alignment between executive remuneration and the long-term interests of our shareholders, the annual BBP awards remain, in part, subject to forfeiture based on performance for three years after the award was earned. Annual DSP awards also have a similar forfeiture period, after which any vested shares must be retained by the executive for a further two years.
Pay at risk, shares held, subject to certain performance conditions Shares held, not subject to performance conditions
Fixed pay
Year 1 Year 3 Year 5Year 2 Year 4 Year 6
Bonus Banking Plan
Deferred Share Plan
FlexibleThe Committee can select measures and set tough targets each year to ensure that executives are incentivised aligned to the delivery of each stage of our strategy.
StretchingTargets are set by the Committee to ensure executives are incentivised to outperform, while delivering sustainable levels of performance.
AlignedWhile our incentive targets are initially assessed on an annual basis, the BBP has a deferred share-based element with the risk of forfeiture, and the DSP has a “meet or exceed” performance underpin, whereby performance must be met or exceeded pre-grant and in year three, after which any vested shares must be retained for a further two years.
MIN MINTARGET TARGETSTRETCH +50%
TOTAL £2,152
TOTAL £2,690
STRETCH +50%
£834 £834
£647
£404
£834
£1,294
£809
£834
£1,617
£1,213
£600 £600
£478
£299
£600
£955
£597
£600
£1,194
£896
Fixed pay
Medium-term variable pay
Long-term variable pay
98 QinetiQ Group plc

Element Policy summary description Maximum opportunity
Base salary When determining an appropriate level of salary, the Committee considers:– general salary rises to employees– remuneration practices within the Group– any change in scope, role and responsibilities– the general performance of the Group– the experience of the relevant Director– the economic environment– when the Committee determines a benchmarking
exercise is appropriate, salaries within the ranges paid by the companies in the comparator groups used for remuneration benchmarking
Typically, the base salaries of Executive Directors in post at the start of the Policy period and who remain in the same role throughout the Policy period will be increased by a similar percentage to the average annual percentage increase in salaries of all other employees in the Group. The exceptions to this rule may be where:– an individual is below market level and a decision
is taken to increase base pay to reflect proven competence in the role; or
– there is a material increase in scope or responsibility to the Executive Director’s role.
Pension The Company provides a non-consolidated pension contribution allowance in line with practice relative to its comparators.
Any new Executive Directors will have a maximum contribution of 10.5% which is the level available to UK employees. The allowances paid to the CEO and CFO will reduce to 10.5% effective 1 January 2023.
Benefits Benefits include car allowance, health insurance, life assurance, income protection and membership of the Group’s employee Share Incentive Plan which is open to all UK employees.
Benefit values can vary year-on-year depending on premiums and the maximum is the cost of providing the relevant benefits.
Incentive Plan The Incentive Plan supports the Company’s objectives by:– allowing the setting of annual targets based on the
strategic objectives at that time; and– providing substantial deferral in shares and ongoing
adjustment by requiring a threshold level of performance to be achieved during the deferral period.
The Incentive Plan consists of two elements:
Bonus Banking Plan (BBP)Annual contributions are earned based on the satisfaction of the performance conditions. Contributions are made for three years with payments made over four years. Half the value of a participant’s bonus account is paid out annually for three years with 100% of the residual value paid out at the end of year four. Half of the unpaid balance of a participant’s bonus account is at risk of annual forfeiture.
Deferred Share Plan (DSP)Deferred share-based element earned based on the satisfaction of pre-grant annual performance assessment, which is subject to a three-year vesting period and a further two-year holding period. A minimum 50% of the unvested award will lapse after three years if a performance underpin, set annually by the Committee, is not achieved.
Maximum 325% of salary (200% of salary under the Bonus Banking Plan and 125% of salary under the Deferred Share Plan).
Bonus Banking PlanMaximum = 200% of salary.Target = 80%–120% of salary.Threshold = 0% of salary.
Deferred Share PlanMaximum = 125% of salary.Target = 30%–75% of salary.Threshold = 0% of salary.
Shareholding requirements
Executives have five years to accumulate the required shareholding by retaining at least 50% of the post-tax vested shares from Company incentive plans.
300% of base salary for the CEO. 200% of base salary for the CFO.
n/a
Chairman and Non-executive Directors
Fees Fees are reviewed annually based on equivalent roles in the comparator group used to review salaries paid to the Executive Directors.
The fees for Non-executive Directors and the Group Chairman are broadly set at a competitive level against the comparator group.
Summary Directors’ Remuneration PolicyThe Directors’ Remuneration Policy was approved by shareholders at the AGM on 14 July 2020. The full Policy is provided in the Corporate Governance section on the Company’s website, and it will remain in effect until the 2023 AGM. When developing the Policy, the Committee was mindful of the six factors as set out in the Code: clarity, simplicity, proportionality, predictability, alignment of culture and risk. A summary of the Policy is set out below:
99Annual Report & Accounts 2021
Governance

Audited informationExecutive Directors’ single total figure of remuneration
Executive Director Year Salary £’000
Benefits £’000
Pension £’000
Total fixed pay
Bonus Banking Plan
£’000
Deferred Share Plan
£’000
Performance Share Plan
£’000
Total variable
pay
Total remuneration
£’000
Steve Wadey (CEO)2021 512 68 123 703 1,179 711 _ 1,890 2,593
2020 610 49 122 781 1,069 – 128 1,197 1,978
David Smith (CFO)2021 392 37 93 522 892 541 – 1,433 1,955
2020 462 36 92 590 803 – – 803 1,393
Benefits can include travel and subsistence expenses incurred in relation to the execution of their duties with the Company that are considered by HMRC to be taxable.
The following section of this report details how the Directors’ Remuneration Policy has been implemented for the year ended 31 March 2021.
Fixed paySalarySalaries are reviewed effective 1 July, which is the same timing for the rest of the UK employee population. There was no base salary review in FY21 as part of the response to COVID-19 and both the CEO and CFO entered into a voluntary salary waiver for six months of the year of £104,450 and £74,450 respectively.
BenefitsBenefits comprise a car allowance, travel allowance, private medical expenses insurance, life assurance, income protection, and taxable expenses.
Deferred Share PlanThe FY18 Deferred Share Plan award achieved the performance underpin based on FY21 profit exceeding that in FY18 (£122.5m) and, therefore, the shares ceased to be contingent and are disclosed in the single figure for FY21 above. The 100% vesting refers to the shares which have passed the underpin of those initially granted based on FY18 performance, which was 62.5% of the maximum available.
PensionsNeither of the Executive Directors participate in the QinetiQ pension scheme for FY21 or have done so in prior years. The pension figure consists of cash in lieu of pension equating to 20% of full base salary (i.e. not reduced in-line with base salary).
Bonus Banking PlanThe Bonus Banking Plan operates on a three-year performance cycle mirroring the financial year, with a four-year payment cycle, i.e. running from 1 April to 31 March. FY21 represents the first year of cycle 3 as detailed on page 101.
Each year any incentive award earned is added to the total plan balance, with 50% of the total plan balance being paid in cash in June after the FY. The remaining 50% is held in the plan in notional shares. In year four, the total remaining plan balance is paid in shares.
Performance Share Plan (legacy plan)For FY20 the PSP figure represents the actual vesting of the of the 2017 award replacing the estimate provided last year. The share price at vesting was 314.7p and the FY20 figure includes £5,092 paid as income in respect of a dividend equivalent payment.
Salary as at June 2020
£’000Increase in
the year
Salary as at July 2020
£’000
FY21 salary
actually paid £’000
CEO 616 0.0% 616 512
CFO 466 0.0% 466 392
Taxable expenses
£’000
Car allowance
£’000
Insurance benefit
£’000
Total benefits
£’000
CEO 33 19 16 68
CFO 5 13 19 37
FY18 Shares Awarded Vesting %
Shares Vesting
Value at 321.9p per
share £’000
CEO 220,785 100% 220,785 711
CFO 167,975 100% 167,975 541
Cash in lieu of pension
£’000
Total in lieu of pension
£’000
CEO 123 123
CFO 93 93
BBP cycle 3 balance
brought forward
£’000
Dividend equivalent
payment£’000
BBP award in year£’000
June 2021 payment in cash (50%
value) £’000
BBP cycle 3 balance
carried forward
£’000
CEO – – 1,179 589 590
CFO – – 892 446 446
Annual Report on Remuneration
Remuneration continued
100 QinetiQ Group plc

% of base salary (%)
Audited informationFY21 performance outcomes
Weighting (%) Threshold Target Stretch Actual
% of maximum
reward achieved
CEO contribution
CFO contribution
CEO/CFO financial performance measures:
Orders1 25% £855.4m £972.0m £1,088.6m £1,147.2m 100.0% £308,000 £233,000
Underlying operating profit1, 2 25% £127.5m £139.0m £150.5m £150.0m 97.8% £301,260 £227,901
Underlying net cash flow from operations1, 2 25% £129.3m £141.0m £152.7m £182.9m 100.0% £308,000 £233,000
CEO/CFO shared strategic and operational objectives (as detailed on page 102):
Strategy: – Performance against key stretching
objectives relating to the UK business, international and innovation
12.5% 40% 50% 100% 80% 80% £123,200 £93,200
Operational: – Performance against stretching
objectives relating to transformation and organisational development
40% 50% 100%
CEO individual personal objectives: – Performance against stretching objectives
relating to growth and leadership12.5% 40% 50% 100% 90% 90% £138,600
CFO individual personal objectives: – Performance against stretching objectives
relating to business support and operational performance
12.5% 40% 50% 100% 90% 90% £104,850
CEO overall results3, 95.7% £1,179,060
CFO overall results3, 95.7% £891,951
1. Performance measures exclude the contribution from businesses acquired during the year and have been adjusted for disposals during the year.
2. Definition of underlying measures and performance can be found in the glossary on page 182.
3. Based on full FY21 base salary, not actual salary paid.
Bonus Banking PlanFY21 performance measures and operationFor the year ended 31 March 2021 achievement of on-target performance provides a payment equal to 100% of base salary, rising on a linear scale to 200% of base salary for achievement of stretch performance.
The scheme begins to pay out once threshold performance measures have been achieved. For the year ended 31 March 2021, the CEO and CFO were measured against the targets as shown in the chart to the right. The target payment was 50% of maximum for financial and non-financial objectives.
Setting performance targets – the Remuneration Committee takes into account the budget and the Company’s strategy set in relation to the ISBP, shareholder expectations and the external environment. The aim is to set stretching targets which incentivise the Executive Directors to deliver annual results which will exceed the expectations of investors, but which are also sustainable and do not create undue risk. Financial performance measures exclude the contribution from businesses acquired in the year.
OrdersUnderlying operating profitUnderlying net cash flow from operationsCollective objectivesPersonal objectives
25%12.5%
25%
25%12.5%
101Annual Report & Accounts 2021
Governance

Audited informationReconciliation of measures used in determining remuneration to Group KPIsThe difference is the contribution from businesses acquired in the year and an adjustment of £13.7m to FY21 cash flow to reflect the payment of FY20 annual incentives in shares.
Orders
Underlying operating
profitUnderlying cash flow
Per KPIs on page 28/29 £1,151.0m £151.8m £199.0m
Metric used for BBP £1,147.2m £150.0m £182.9m
Difference £3.8m £1.8m £16.1m
Financial performance measures (75% award)The three key measures of orders, underlying operating profit and underlying net cash flow from operations are given an equal 25% weighting.
Shared strategic and operational measures (12.5% award)
Measures FY21 PerformanceOutcome
(% maximum)
Strategic
Safety & Security Culture – 40% weighting
Stretch performance levels were met to improve the Safety First and security culture through increased engagement, high visibility safety and security tours including exchanges between businesses, and leading safety and security engagements. In light of the Pendine incident, management, with the Remuneration Committee’s agreement, reduced the outturn for this element.
Employee Engagement – 30% weighting
Employee engagement improved by 6% in FY21 as measured by the independent Peakon tool, leaders delivered diversity and inclusion events with strong engagement and feedback, Q-talk and Employee Roadshow attendance improved significantly.
Productivity & Efficiency – 30% weighting
Leaders simplified processes and drove innovation to improve productive utilisation of our facilities and resources and reduce our cost base.
Total 80%
Personal objectives (12.5% award)
Objectives FY21 PerformanceOutcome
(% maximum)
CEO
Growth Successfully navigated the impact of COVID-19 to deliver organic profitable growth in FY21. Delivered RLTPA commitments with improved customer satisfaction. Through active management of the portfolio, strategic acquisitions and disposals, drove higher margin businesses and strengthened strategy implementation. Implemented the next phase of the group transformation programme.
Leadership Delivered operational and functional performance targets including the globalisation of the functions. Matured organisation and people development plans with improved customer focus, promoting from within and attracting new leadership talent, enabling a high performance culture.
Total 90%
CFO
Strategic Developed a global integrated governance and internal control structure.
Growth Drove right decisions on investment plans, disposals and acquisitions.
Operational Delivered key financial metrics through consistent operational performance.
Total 90%
Bonus Banking Plan continued
Remuneration continued
102 QinetiQ Group plc

Bonus Banking Plan continuedHow the plan operates• The Plan operates on a fixed three-year performance cycle
with a four-year vesting cycle. FY21 represents year four of Cycle 2 and year one of Cycle 3. Plan years commence on 1 April.
• Performance targets are set at the beginning of each Plan year.
• At the end of each of the first three Plan years the performance against targets is assessed and the level of the incentive earned is determined and paid into the Plan account.
• Each year 50% of the account balance is subject to forfeiture.
• At the end of each of the first three Plan years, 50% of the account balance will be paid and the balance retained and held in the Plan as notional shares.
• At the end of the fourth year, any remaining balance in the Plan account is paid out in shares.
BBP payout mechanism
Cycle 3
Cycle 2
Year 3
FY23
FY20
Year 1
FY21
FY18
Measurement date at the end of each Plan Year
Participant’s plan account
Contribution or deduction*
50% of closing balance paid out at the end of each Plan Year. Unpaid balance deferred
in notional shares.
100% of closing balance in Plan account paid
in shares.
Year 4
FY21
Year 2
FY22
FY19
* Single figure BBP value for a Plan/financial year.
Audited informationOperation during FY21Cycle 2
Notional shares on
account at start of Plan
year 4 (1 April 2020)
30-day average share
price to 31 March 2021
(p)
Share value as at
measurement date (£)
Bonus plan contribution
for Plan year 4 (£)
Dividend equivalent
payment (£)
Bonus pool total
value as at measurement
date (£)
Gross payment in
cash for Plan year 4 (£)
Bonus pool total
value after payment (£)
Notional shares on
account at end of Plan
year 4 (31 March 2021)
CEO 318,006 321.9 1,023,661 – 20,988 1,044,650 – – 324,526
CFO 238,598 321.9 768,047 – 15,747 783,794 – – 243,489
Cycle 3Notional
shares on account at
start of Plan year 1
(1 April 2020)
30-day average share
price to 31 March 2021
(p)
Share value as at
measurement date (£)
Bonus plan contribution
for Plan year 1 (£)
Dividend equivalent
payment (£)
Bonus pool total
value as at measurement
date (£)
Gross payment in
cash for Plan year 1 (£)
Bonus pool total value after cash
payment (£)
Notional shares on
account at end of Plan
year 1 (31 March 2021)
CEO – 321.9 – 1,179,060 – 1,179,060 (589,530) 589,530 183,140
CFO – 321.9 – 891,951 – 891,951 (445,975) 445,976 138,544
ForfeitureFor BBP Cycle 2 the CEO and CFO retained notional shares in their Plan accounts of which 50% were subject to forfeiture. Forfeiture would have been enacted if Group underlying operating profit was less than £110m for FY21. FY21 Group underlying operating profit was £150m (excluding contribution from acquisitions) therefore no notional shares were forfeited and the Cycle 2 notional shares will vest as actual shares on 30 June 2021. For BBP Cycle 3 a forfeiture level of profit has been set for FY22.
DiscretionFor BBP Cycle 3, for the year ended 31 March 2021, targets were achieved or exceeded providing a contribution of 95.7% of the maximum award for both the CEO and the CFO. £1,179,060 and £891,951 has been reported in the single figure table which represents the contributions to the plan related to FY21 performance. No discretion was applied to these contributions as the Committee considers them appropriate reflecting strong performance. In reviewing the BBP outturn the Remuneration Committee was mindful of the wider stakeholder experience across the financial year.
FY24
103Annual Report & Accounts 2021
Governance

Audited informationFY21 performance outcomeThe FY21 Deferred Share Plan award was measured against Group revenue growth with the following calibration.
Measure Weighting Threshold Target Stretch Actual% Max award
achieved% Salary awarded
Total £’000
Group Revenue 100% £1,076m £1,176m £1,276m £1,270.6m 97.3% 121.6%
CEO £749,210
CFO £566,773
The FY21 DSP award was also subject to a pre-grant performance underpin that FY21 profit margins are higher than 10%, which was achieved. Group revenue growth achieved at £1,270.6m was between the Target and Stretch levels of performance resulting in a FY21 DSP contingent award of shares at 97.3% of the maximum available.
The FY21 DSP award will be subject to a further performance underpin before vesting:
• Group underlying profit outturn for FY21 must be maintained at the end of the three-year vesting period. If this is not maintained then, at a minimum, 50% of the award will lapse. For the purposes of the FY21 DSP award, this will be the actual underlying operating profit (£150.0m) for FY21 which must be achieved in FY24
The FY21 DSP award which vests based on the achievement of the FY24 performance underpin must be held as shares for a further two years.
The FY18 DSP award achieved the performance underpin based on FY21 profit exceeding that in FY18 (£122.5m) and, therefore, the shares ceased to be contingent and will be released on 8 June 2021. Had the FY21 profit not been greater than FY18, 50% of the DSP award would have lapsed. The net shares vesting from the FY18 DSP must be retained for a further two years. The value of this award is shown in the single figure table, in line with the reporting regulations, calculated as CEO £710,707 and CFO £540,711 based on the share amounts due to vest of 220,785 and 167,975 respectively and a share price of 321.9p (30 day average to 31 March 2021). Actual share values at vesting and the cash payment in lieu of dividends will be reported in the FY22 single figure.
Deferred Share Plan (DSP)Scheme interests awarded during the financial year ended 31 March 2021The Deferred Share Plan was first approved by shareholders at the 2017 AGM and further approved as a key element of the Directors’ Remuneration Policy at the 2020 AGM. A maximum award of 125% of salary may be made to the CEO and CFO with the amount contingent on meeting a stretching annual performance target based on QinetiQ’s strategic growth plan. Once the award has been made, it is deferred for three years and remains subject to a performance underpin; any vested shares are then subject to a further two-year holding period.
Setting performance targets FY21The FY21 DSP performance measure was group revenue growth excluding in-year acquisitions. Calibration was set with a maximum of 125% of salary available for achieving stretch and 50% of the maximum payable at target performance. The performance targets were set by the Remuneration Committee so as to be stretching.
Remuneration continued
104 QinetiQ Group plc

Audited information Statement of Directors’ shareholding and share interests In relation to the shareholding requirement adopted on 1 April 2017 the Company requires Executive Directors to hold shares equivalent to 300% (CEO) and 200% (CFO) of base salary. Executive Directors have five years from the adoption of the guideline to achieve the required level through, at a minimum, retaining 50% of the after-tax shares vesting from Company incentive plans.
The CEO is building up to his shareholding requirement and currently holds actual shares equivalent to 276% of base salary using a share price of 314.6p (three-month average to 31 March 2021).
The CFO does not currently meet the minimum shareholding requirement; with a current holding of actual shares equivalent to 141% of base salary using a share price of 314.6p (three-month average to 31 March 2021).
In June 2021 the FY18 DSP award will vest as shares, as the performance underpin has been achieved, and the BBP Cycle 2 awards will vest as shares, as the forfeiture level has been passed. The Committee anticipates that these events will increase the shareholdings of the Executive Directors significantly, and in the case of the CEO he will meet his shareholding requirement, as the net of tax shares will be retained.
The Remuneration Committee continues to monitor progress towards the shareholding requirement.
Shares beneficially
owned
Shares subject to performance
conditions
Shares not subject to performance
conditions
Total shares held at
31 Mar 2021
Steve Wadey 540,114 464,435 610 1,005,159
David Smith 208,289 352,376 610 561,275
Michael Harper 40,000 – – 40,000
Admiral Sir James Burnell-Nugent (Resigned 31 December 2020) 15,567 – – 15,567
Paul Murray (Resigned 14 July 2020) 83,214 – – 83,214
Susan Searle 43,300 – – 43,300
Ian Mason 10,000 – – 10,000
Lynn Brubaker 12,000 – – 12,000
Neil Johnson 50,000 – – 50,000
Shonaid Jemmett-Page (Appointed 19 May 2020) 7,000 – – 7,000
General Sir Gordon Messenger (Appointed 12 October 2020) – – – –
Shares beneficially owned comprise shares purchased under the Share Incentive Plan (SIP) and shares owned by the Director and any connected persons. SIP matching shares are identified as shares not subject to performance conditions.
On 9 April 2021 Steve Wadey and David Smith purchased 75 shares each, then on 10 May 2021 they purchased 60 shares each, through their participation in the SIP. There have been no other changes to the shares shown above between 31 March 2021 and 20 May 2021.
Shares subject to performance conditions comprise awards made under the Deferred Share Plan which remain contingent subject to the performance underpin as detailed on page 104.
Notional shares held by the CEO and CFO in the BBP Cycle 2 and Cycle 3 do not appear in the table above as they are not actual shares at 20 May 2021. However, in reviewing compliance with the shareholding requirement, the net of tax value of notional shares (i.e. 53% in the UK) of the 50% of the BBP balance which is not subject to forfeiture is included within the calculation.
105Annual Report & Accounts 2021
Governance

Audited informationTotal scheme interests summaryTotal scheme interests, including those awarded during the financial year ended 31 March 2021, are as follows.
Steve Wadey
Plan name Date of grantNumber
1 April 2020
Granted in year (maximum potential
of awards) Vested in yearLapsed in year
Number 31 March 2021
Share price on date of
grant Vest date
PSP 2017 22 Jun 17 102,136 – 39,169 62,967 – 281.0 22 Jun 20
DSP 2018 8 Jun 18 220,785 – – – 220,785 206.0 8 Jun 21
DSP 2019 28 Jun 19 243,650 – – – 243,650 304.0 28 Jun 22
566,571 – 39,169 62,967 464,435
David Smith
Plan name Date of grantNumber
1 April 2020
Granted in year (maximum potential
of awards) Vested in year
Lapsed in year
Number31 March 2021
Share price on date of
grant Vest date
DSP 2018 8 Jun 18 167,975 – – – 167,975 206.0 8 Jun 21
DSP 2019 28 Jun 19 184,401 – – – 184,401 304.0 28 Jun 22
352,376 – – – 352,376
The contingent share award in relation to the FY21 DSP will be granted in June 2021. The Committee estimates that 232,746 contingent shares will be awarded to Steve Wadey and 176,070 to David Smith. This is calculated based on awards of 97.3% of salary and a share price of 321.9p (based on the 30 day average to 31 March 2021).
The average three month market share price to 31 March 2021 of the FY18 DSP was 314.6p, leading to an estimated gain of £239,773 and £182,421 for the CEO and CFO respectively based on share price appreciation of the shares due to vest on 8 June 2021.
There have been no other changes to the interests shown above between 31 March 2021 and 20 May 2021.
Payments to past Directors and payment for loss of officeNo payments were made to past Directors during the year and no payments were made for loss of office during the year.
Performance reviewThe ten-year and three-year charts show the Company’s Total Shareholder Return over the period from 31 March 2011 to 31 March 2021 and 31 March 2018 to 31 March 2021 compared with the FTSE 250 (excluding investment trusts) over the same period based on spot values. The Committee has chosen to demonstrate the Company’s performance against this index as it is the index in which the Company is listed.
Ten-year comparator chart Three-year comparator chart
0 0
31/03/2011
31/03/2018
31/03/2012
31/03/2019
QinetiQ
Source: Datastream (Thomson Reuters) Source: Datastream (Thomson Reuters)
FTSE 250 (excluding investment trusts)QinetiQ FTSE 250 (excluding investment trusts)
31/03/2013
31/03/2020
31/03/2014
31/03/2015
31/03/2016
31/03/2017
31/03/2018
31/03/2019
31/03/2020
31/03/2021
31/03/2021
250
200
100
150
50
300
350 200
150
100
50
TSR
– Va
lue
of a
100
uni
t inv
estm
ent
mad
e on
31
Mar
ch 2
010
TSR
– Va
lue
of a
100
uni
t inv
estm
ent
mad
e on
31
Mar
ch 2
017
Remuneration continued
106 QinetiQ Group plc

CEO remunerationThe table below shows the CEO’s remuneration over the same performance period as the Total Shareholder Return chart (31 March 2011 to 31 March 2021): Year ended 31 March CEO Salary/fees Single figure
Annual bonus (% of maximum)
Long-term incentives (% of maximum vesting)
2021 Steve Wadey 511,550 2,592,523 95.7% 100.0%
2020 Steve Wadey 610,357 1,978,247 87.5% 38.4%
2019 Steve Wadey 596,422 2,339,474 94.4% 31.7%
2018 Steve Wadey 582,167 1,522,460 66.7% –
2017 (restated) Steve Wadey 568,166 1,829,470 86.4% –
2016 Steve Wadey 520,219 1,654,546 85.4% –
2016 David Mellors 455,885 1,423,382 82.9% –
2015 David Mellors 501,227 1,725,960 88.6% 13.9%
2015 Leo Quinn 469,776 673,979 – –
2014 Leo Quinn 610,844 2,177,742 77.0% 15.4%
2013 Leo Quinn 593,050 3,992,001 100.0% 40.3%
2012 Leo Quinn 580,000 1,495,284 100.0% –
2011 Leo Quinn 580,000 1,327,156 100.0% –
CEO pay ratioThe calculation below is based on the FY21 ‘single figure’ for the CEO of £2,592,523 and similar calculations for the UK workforce (i.e. ‘Option A’ as defined by the Companies (Miscellaneous Reporting) Regulations 2018). The Remuneration Committee chose Option A as it is the approach generally favoured by investors and GC100. The calculations for the UK workforce were performed as at 21 March 2021.
Total remunerationRatio of the CEO’s pay to UK employees
Year 25th Percentile Median 75th Percentile
FY21 70 : 1 52 : 1 39 : 1
FY20 56 : 1 41 : 1 31 : 1
The CEO pay ratios have widened between FY20 and FY21. The primary reason for this is the higher CEO single figure for FY21 which is a result of this being the first year that a DSP award has been included, as well as the higher incentive outturn due to strong financial and operational performance and share price appreciation. Some of the increase to the FY21 CEO single figure was offset by the lower fixed pay following the voluntary waiver of base salary for six months, which was not repaid.
Year on year movements in the CEO pay ratio are likely to be volatile due to the wide range of incentive outcomes for the CEO single figure, but the Remuneration Committee does note the ratio and it will monitor long term trends.
Total pay of UK employees
£ 25th Percentile Median 75th Percentile
Total pay and benefits £36,959 £50,147 £65,685
Salary component. £30,959 £43,537 £53,354
The Remuneration Committee welcomes the opportunity to provide this information to shareholders. The Company aims to reward all employees fairly for the success and growth they create, hence the inception of the All Employee Incentive Scheme in FY19 which paid a minimum of £1,217 to all eligible employees for the excellent performance delivered in FY21.
107Annual Report & Accounts 2021
Governance

Audited informationSingle figure total remuneration for the Chairman and each Non-executive DirectorNon-executive Directors’ remuneration is shown as a single figure to provide an annual comparison between the remuneration awarded during the financial year ended 31 March 2021 and the preceding year. Amounts in brackets were waived in FY21.
Salary/fees £’000
Benefits £’000
Committee Chair fees £’000
US/UK attendance fee £’000
Single figure £’000
Non-executive Director 2021 2020 2021 2020 2021 2020 2021 2020 2021 2020
Lynn Brubaker 46 (7) 51 2 9 – – 3 25 51 85
Admiral Sir James Burnell-Nugent (Resigned 31 December 2020)
33 (7) 51 – 2 6 (1) 10 – – 39 63
Mark Elliott – 77 – 27 – – – – – 104
Michael Harper 46 (7) 51 – – 9 (1) 12 – – 55 63
Shonaid Jemmett-Page (Appointed 19 May 2020)
41 (3) – – – 7 (1) – – – 48 –
Neil Johnson 219 (31) 187 – 1 – – – – 219 188
Ian Mason 46 (7) 51 – 1 – – – – 46 52
General Sir Gordon Messenger (Appointed 12 October 2020)
25 – – – – – – – 25 –
Paul Murray (Resigned 14 July 2020) 17 (5) 51 – – 2 (1) 10 – – 19 61
Susan Searle 46 (7) 51 – 1 9 (1) 8 – – 55 60
Benefits include travel and subsistence expenses incurred in relation to the execution of their duties with the Company that are considered by HMRC to be taxable.
Lynn Brubaker is a US resident and is entitled to receive a $4,000 fee for attending UK meetings. UK-based Non-executive Directors are entitled to receive a £2,500 fee for attending US meetings.
The Committee Chair fees figure for Michael Harper is a payment of £10,000p.a. as Senior Independent Director.
Remuneration policy for all employeesAll employees of QinetiQ are entitled to base salary, benefits and pension. UK and Australia-based employees are entitled to participate in the QinetiQ Share Incentive Plan. The maximum incentive opportunity available is based on the seniority and responsibility of the role. Participation in the DSP is available to Executive Directors, senior leaders and selected employees throughout the organisation.
In FY19 the Company introduced an All Employee Incentive Scheme (AEIS) whereby every employee has the opportunity to earn a cash bonus based on Company and personal performance. For FY21 the Company element of the AEIS achieved a level between Target and Stretch resulting in a payment of £1,217 to every eligible employee, plus the opportunity to earn an additional payment based on personal performance. The AEIS will be operated again in FY22 and thereafter.
The Committee reviews (but does not decide) the general reward policy for all employees and any significant changes proposed. Alignment with the workforce is delivered through the Rewarding for Performance framework, including a transparent and consistent approach to the annual salary review, the AEIS to drive Company and personal performance, recognition schemes and market competitive benefits in our countries.
Remuneration continued
108 QinetiQ Group plc

Percentage change in Directors’ remunerationThe following table compares the percentage change in each of the Director’s salary/fees, bonus and benefits to the average percentage change in salary, bonus and benefits for a comparison group (4,000 employees) in the UK business in service between 1 April 2020 and 31 March 2021.
Salary / Fees Benefits Annual bonus
Steve Wadey -16.2% 35.9% 10.3%
David Smith -15.2% 0% 11.1%
Neil Johnson 17.1% -100% –
Michael Harper -15.9% 0% –
Susan Searle -6.8% -100% –
Ian Mason -9.8% -100% –
Admiral Sir James Burnell-Nugent -36.1% -100% –
Paul Murray -68.9% 0% –
Lynn Brubaker -35.5% -77.8% –
Average UK employee 1.2% -1.2% 62.2%
1 UK employees were chosen in order to avoid the impact of exchange rate movements over the year. QinetiQ Group plc has no employees so QinetiQ Group Ltd employees were used.
The reduction in salary and fees which the Board implemented as a waiver for six months in FY21 impacted the analysis above, as did the reduced travel and physical meeting attendance as the benefits paid to Non-executive Directors are largely travel and subsistence expenses incurred in relation to the execution of their duties with the Company that are considered by HMRC to be taxable.
Relative importance of spend on payThe graph below shows actual spend on all employee remuneration, shareholder dividends and buybacks and any other significant use of profit and cash within the previous two financial years.
Gender related payQinetiQ is subject to gender pay reporting for UK employees and a copy of our 2021 report is available on the Company’s website.
2021
2021 2021
Difference: 12.79%
Difference: 20.4%
Difference: 0.0%
2020
2020 2020
£419.8m
£38.7m £0.0m
£473.5m
£46.6m £0.0m
Total Employee remuneration
Share-based profit distribution Other significant profit distribution
109Annual Report & Accounts 2021
Governance

Service contracts/letters of appointmentThe Company’s policy is that Executive Directors have rolling contracts which are terminable by either party giving 12 months’ notice. The Group Chairman and the Non-executive Directors do not have service contracts but are appointed under letters of appointment. All service contracts and letters of appointment are available for viewing at the Company’s registered office and at the AGM. Non-executive Directors typically serve two three-year terms but may be invited by the Board to serve for an additional period (see table in the Nominations Committee report on page 78).
Director Date appointed ArrangementNotice period
Lynn Brubaker 27 January 2016 Initial term of three years from date of appointment, subject to annual reappointment at the AGM. –
Michael Harper 22 November 2011 Initial term of three years from date of appointment, subject to annual reappointment at the AGM. –
Shonaid Jemmett-Page
19 May 2020 Initial term of three years from date of appointment, subject to annual reappointment at the AGM. –
Neil Johnson 02 April 2019 Initial term of three years from date of appointment, subject to annual reappointment at the AGM. –
General Sir Gordon Messenger
12 October 2020 Initial term of three years from date of appointment, subject to annual reappointment at the AGM. –
Susan Searle 14 March 2014 Initial term of three years from date of appointment, subject to annual reappointment at the AGM. –
David Smith 01 March 2017 Service contract 12 months
Steve Wadey 27 April 2015 Service contract 12 months
Implementation of Policy for the year ended 31 March 2021FeesNon-executive Directors’ fees were last reviewed effective 1 July 2019 and are as follows -
• Basic fee £52,000
• Committee Chair fee £10,000
• Senior Independent Director fee £10,000
The Non-executive Group Chairman receives a fee of £250,000 per annum.
Fees are reviewed in line with Policy. In FY21 a voluntary fee waiver was implemented for six months as detailed on page 108.
Executive Directors are permitted to accept one external Non-executive Director position with the Board’s approval. Any fees received in respect of these appointments may be retained by the Executive Director.
The CEO does not hold any Non-executive Directorships in other companies. David Smith served as a Non-executive Director of Motability Operations Group plc from 1 July 2010 until 30 June 2020. Non-executive Director fees, as reported in the 2020 Motability Operations Group plc annual report, were £38,000 for the part-year he served which were retained.
Fees effective 1 July 2019
£
Group Chairman 250,000
Basic fee for UK Non-executive Director 52,000
Additional fee for chairing a Committee 10,000
Additional fee to Deputy Chairman/Senior Independent Non-executive Director 10,000
Additional fee for attendance at a Board meeting held in US by UK resident Non-executive Director 2,500
Additional fee for attendance at a Board meeting held in UK by US resident Non-executive Director $4,000
Remuneration continued
110 QinetiQ Group plc

Implementation of Policy for the year ending 31 March 2022At the 11 May 2021 meeting of the Remuneration Committee, base salary increases of 5.0% (to £646,800p.a.) and 2.5% (to £477,600p.a.) were approved for the CEO and CFO respectively, effective 1 July 2021. Both salary reviews are aligned with the Rewarding for Performance guidance used for all UK employees and the increase for the CEO reflects the fact that he is low to market when benchmarked to other UK quoted Aerospace & Defence sector CEOs.
Incentives for ExecutivesThe table below shows the measures and relative weighting for the Bonus Banking Plan for the CEO and CFO:
Performance measure (excluding FY22 acquisitions) Relative weighting(%)
Bonus Banking Plan Underlying operating profit 25.0%
Target performance 100% of base salary Underlying net cash flow from operations 25.0%
Stretch performance 200% of base salary Orders 25.0%
Collective goals 12.5%
Personal goals 12.5%
For FY22, the Remuneration Committee set the target level of performance at 50% of stretch for the financial measures, collective and personal goals. Details of specific performance targets for the Bonus Banking Plan have not been provided as they are deemed commercially sensitive. The targets will be disclosed retrospectively in next year’s Annual Report on Remuneration.
The Deferred Share Plan will award a maximum of 125% of base salary for achieving stretch performance. For FY22 the strategic growth performance measure is revenue growth (excluding in-year acquisitions) across the Group to incentivise our senior leaders globally to collaborate across the Group to deliver sustainable profitable growth, as per FY21. There will be a pre-grant margin underpin to ensure that profit performance remains strong in FY22.
The Remuneration Committee will continue to discuss the impact of the COVID-19 crisis on performance and remuneration. Performance metrics have been set for FY22 based on the ISBP FY22. At the end of the year the Committee will look back at the impact on shareholders and the performance of comparators and, if appropriate, will apply discretion. It is important that the rewards overall to executives are balanced and fair in the context of the shareholder journey.
The FY22 DSP award will be subject to a performance underpin before vesting:
• Group underlying profit outturn for FY22 must be maintained at the end of the three-year vesting period. If this is not maintained then, at a minimum, 50% of the award will lapse. For the purposes of the FY22 DSP award, this will be the actual underlying operating profit (£m) for FY22 which must be achieved in FY25
Awards of contingent shares will be made in June 2022 based on FY22 performance. Details of performance targets for the Deferred Share Plan have not been provided as they are deemed commercially sensitive. They will be disclosed retrospectively in next year’s Annual Report on Remuneration.
Remuneration Committee meetings, activities and decisions FY21The following table provides a summary of all the key activities during the year. The attendance at each meeting is detailed on page 64. The membership of the Remuneration Committee in FY21 was Susan Searle (Chair), Michael Harper, Neil Johnson, Lynn Brubaker, Ian Mason, Paul Murray (resigned 14 July 2020), Admiral Sir James Burnell-Nugent (resigned 31 December 2020), General Sir Gordon Messenger (joined 12 October 2020) and Shonaid Jemmett-Page (joined 19 May 2020).
During FY21 a sub-committee reviewed a five-year storyboard looking at company performance delivered versus returns to key stakeholders to review whether targets set were appropriate and returns balanced; it determined this to be the case.
111Annual Report & Accounts 2021
Governance

Remuneration Committee meetings, activities and decisions FY21 continuedBase salary Incentives Share awards Governance Resourcing
May 2020 FY20 final results for BBP and DSP
2017 PSP vesting (CEO only)
2020 DSP awards (not granted)
Directors’ Remuneration Policy preparation for AGM
Approve Directors’ Remuneration Report.
July 2020 Impact of COVID-19 on incentive targets
AGM Preparation
November 2020 Trends in executive remuneration
FY21 half year forecast
FY21 half year forecast Review of Executive Committee shareholdings
Review of Company reward practices
March 2021 FY21 provisional results
FY22 target setting
FY18 DSP provisional vesting Terms of a GLT-level appointment
Effectiveness reviewIn 2021, the effectiveness review was conducted in-house via a questionnaire distributed by the Company Secretary. This process is described further on page 80.
Remuneration consultantsThe Committee has appointed FIT Remuneration Consultants LP, an independent firm of remuneration consultants, to provide advice on market practice, corporate governance and investors’ views. FIT were appointed by the Committee in 2017 after a competitive tendering exercise. Fees paid during the year for services provided were £75,698.
FIT provided the following additional services during the year:
• Implementation support for the Company on paying FY20 incentives in company shares; and
• TSR performance monitoring for Performance Share Plan awards.
The Committee is satisfied the scale and nature of this work does not impact on the objectivity and independence of the advice it receives from FIT.
Statement of voting
Annual Report on Remuneration – 2020
Votes for 419,169,261 (89.3%)
Votes against 50,195,251 (10.7%)
Total votes cast 469,403,409 (82.7% of share capital)
Abstained 2,576,013
Directors’ Remuneration Policy – 2020
Votes for 393,525,108 (87.0%)
Votes against 59,006,721 (13.0%)
Total votes cast 452,570,726 (79.7% of share capital)
Abstained 19,408,696
Details on the voting on all resolutions at the 2021 AGM will be announced via the RNS and posted on the QinetiQ website after the AGM.
Susan SearleRemuneration Committee Chair20 May 2021
89.3%10.7%
Annual Report on Remuneration 2020 % of votes (%)
Directors’ Remuneration Policy 2020 % of votes (%)
Votes forVotes against
87.0%13.0%
Remuneration continued
112 QinetiQ Group plc

Directors’ reportStatutory information contained elsewhere in the Annual ReportInformation required to be part of this Directors’ report can be found elsewhere in the Annual Report as indicated in the table below, and is incorporated into this report by reference:
Information Page
Corporate governance statement 54
Directors’ details 58–59
Directors’ conflicts of interest 74
Directors’ interests in shares 105
Employees 42–46
Financial instruments: Information on the Group’s financial risk management objectives and policies, and its exposure to credit risk, liquidity risk, interest rate risk and foreign currency risk
150
Greenhouse gas emissions 40
Likely future developments in the business of the Company or its subsidiaries
2–51
Results 22–25
Disclosure specifically required pursuant to the Companies (Miscellaneous Reporting) Regulations 2018 can be found on the following pages:
Statement in the Directors’ Report summarising how Directors have engaged with employees and taken account of their interests
114
Statement in the Directors’ Report about the corporate governance arrangements applied by the Company
114
Publication of the ratio of the CEO’s remuneration to the median, 25th and 75th quartile pay remuneration of their UK employees in the Directors’ Remuneration report
107
Illustration of the effect of future share price increases on executive pay outcomes in the Directors’ Remuneration report
100
Management reportThe Strategic report on pages 1 to 51 and the Directors’ report, as detailed on pages 113 to 116, including information which has been incorporated into those sections by reference, comprise the management report specified by rules 4.1.5R (2) and 4.1.8R of the FCA’s Disclosure Guidance and Transparency Rules (DTRs).
Research and developmentOne of the Group’s principal business streams is the provision of funded research and development (R&D) for customers. The Group also invests in the commercialisation of promising technologies across all areas of business.
In the financial year, the Group recorded £300.4m (2020: £292.3m) of total R&D-related expenditure, of which £281.9m (2020: £270.8m) was customer-funded work and £18.5m (2020: £21.5m) was internally funded. Additionally, £2.6m (2020: £1.6m) of late-stage development costs were capitalised and £2.4m (2020: £1.4m) of capitalised development costs were amortised in the year.
Political donationsQinetiQ does not make political donations to parties as that term would be commonly recognised. The legal definition of that term is, however, quite broad and may have the effect of covering a number of normal business activities that would not commonly be perceived to be political donations, such as sponsorship of events.
These may include legitimate interactions in making MPs and others in the political world aware of key industry issues and matters that affect QinetiQ, and that make an important contribution to their understanding of QinetiQ, the markets in which it operates and the work of their constituents.
BranchesThe Company and its subsidiaries have established branches in a number of different countries; their results are, however, not material to the Group’s financial results.
Share capitalAs at 31 March 2021, the Company had an allotted and fully paid up share capital of 574,257,121 ordinary shares of 1p each with an aggregate nominal value of £5.7m and one Special Share with a nominal value of £1. The ordinary share total includes 3,191,431 shares held by employee share trusts.
Details of the shares in issue during the financial year are shown in note 29 on page 160.
Rights of ordinary shareholdersThe holders of ordinary shares are entitled to receive the Company’s Reports and Accounts, to attend and speak at general meetings of the Company, to exercise voting rights in person or by appointing a proxy, and to receive a dividend where declared or paid out of profits available for that purpose.
113Annual Report & Accounts 2021
Governance

Rights of special shareholderThe Special Share is held by HM Government through the Secretary of State for Defence (the Special Shareholder) and it may only be held by and transferred to HM Government. It confers certain rights to protect UK defence and security interests. These include:
• The promotion and reinforcement of the MOD compliance principles which require QinetiQ to be an impartial, ethical and responsible contractor by avoiding conflicts of interest in its dealings with the MOD
• The protection of defined strategic assets of the Group, such as certain testing facilities, by providing the Special Shareholder with an option to purchase those assets in certain circumstances
• The right to require certain persons with a material interest in QinetiQ to dispose of some or all of their ordinary shares on the grounds of national security or conflict of interest
• A provisions whereby at least the Non-executive Chairman or Chief Executive Officer must be a British citizen.
The Special Share carries no financial and economic value and the Special Shareholder is not entitled to vote at a general meeting of the Company. At any time the Special Shareholder may require QinetiQ to redeem the share at par and, if wound up, the Special Shareholder would be entitled to be repaid at its nominal value before other shareholders. Any variation of the rights attached to the Special Share requires the written approval of the MOD. Further details can be found in note 29 on page 160.
Restrictions on the transfer of sharesAs detailed above, the special share requires certain persons with an interest in QinetiQ’s shares that exceed certain prescribed thresholds to dispose of some or all of their ordinary shares on the grounds of national security or conflict of interest.
Employee share schemesThe QinetiQ Group plc Employee Benefit Trust (the Trust) holds shares in connection with QinetiQ’s employee share schemes, excluding the Share Incentive Plan. As at 31 March 2021, the Trust held 3,191,431 ordinary shares of 1p each (the Trust Shares). The Trustees of the Trust have agreed to waive their entitlement to dividends payable on the Trust Shares. The Trust holds further ordinary shares in respect of deferred shares held on behalf of participants in the Company’s Deferred Annual Bonus Plan. Dividends received by the Trust in respect of the deferred shares are paid direct to the Plan participants on receipt and are not retained in the Trust.
Equiniti Share Plan Trustees Limited acts as Trustee in respect of all ordinary shares held by employees under the QinetiQ Group plc Share Incentive Plan (the Plan). Equiniti Share Plan Trustees Limited will vote on all resolutions proposed at general meetings in accordance with voting instructions received from participants in the Plan.
Corporate sponsored nomineeIn circumstances where ordinary shares are held by the corporate sponsored nominee service, Equiniti Corporate Nominees Limited will vote on all resolutions proposed at general meetings in accordance with voting instructions received from shareholders using such corporate nominee service.
Major shareholdingsIn accordance with DTR 5, the Company has been notified of the following from holders representing 3% or more of the issued ordinary share capital of the Company:
Name of shareholder
At 31 March 2021 % of issued
share capital*
At 13 May 2021* % of issued
share capital
Schroders 9.62% 9.62%
BlackRock, Inc 6.67% 6.83%
GLG Partners 6.18% 6.18%
Majedie Asset Management 5.03% 5.03%
Investec 4.95% 4.95%
Standard Life Aberdeen plc 4.81% 4.81%
Norges Bank 3.99% 3.99%
* As notified by the shareholder and based on the issued ordinary share capital at the time of the notification.
EmployeesThe Group is committed to the fair treatment of people with disabilities in relation to applications, training, promotion and career development. If an existing employee becomes disabled, the Company makes every effort to enable them to continue their employment and career development, and to arrange appropriate training, wherever practical.
Directors’ interests in contractsAt the date of this report, there is no contract or arrangement with the Company or any of its subsidiaries that is significant in relation to the business of the Group as a whole in which a Director of the Company is materially interested.
IndemnitiesThe Company has entered into indemnity deeds with all its current Directors containing qualifying indemnity provisions, as defined in Section 234 of the Companies Act 2006, under which the Company has agreed to indemnify each Director in respect of certain liabilities, which may be attached to them as Directors or as former Directors of the Company or any of its subsidiaries. All such indemnity provisions are in force as at the date of this Directors’ report. The Directors of QinetiQ Pension Scheme Trustee Limited, a Group company and the Trustee of the QinetiQ Pension Scheme (the Scheme), benefit from an indemnity contained in the rules of the Scheme. The indemnity would be provided out of the Scheme assets.
Directors’ report continued
114 QinetiQ Group plc

Change of control – significant agreementsThe following significant agreements contain provisions entitling the counterparties to require prior approval, exercise termination, alteration or other similar rights in the event of a change of control of the Company, or if the Company ceases to be a UK company:
• The Combined Aerial Target Service contract is a 20-year contract awarded to QinetiQ by the MOD on 14 December 2006. The terms of this contract require QinetiQ Limited to remain a UK company which is incorporated under the laws of any part of the UK, or an overseas company registered in the UK, and that at least 50% of the Board of Directors are UK nationals. The terms also contain change of control conditions and restricted share transfer conditions which require prior approval from HM Government if there is a material change in the ownership of QinetiQ Limited’s share capital, unless the change relates to shares listed on a regulated market; “material” is defined as being 10% or more of the share capital. In addition, there are restrictions on transfers of shares to persons from countries appearing on the restricted list as issued by HM Government.
• The Long Term Partnering Agreement (LTPA) is a 25-year contract, which QinetiQ Limited signed on 28 February 2003, to provide test, evaluation and training services to the MOD. This contract contains conditions under which the prior approval of HM Government is required if the contractor, QinetiQ Limited, ceases to be a subsidiary of the QinetiQ Group, except where such change in control is permitted under the Shareholders Agreement to which the MOD is a party.
• The Company is party to a £275m multi-currency revolving credit facility, provided by a consortium of banks, of which £65m will mature on 27 September 2024 and £210m will mature on 27 September 2025. Under the terms of the facility, in the event of a change of control of the Company, any lender may give notice to cancel its commitment under the facility and require all outstanding amounts to be repaid.
The Directors’ contracts contain no provisions for compensation for loss of office on a change of control of the Company.
Disclosures in accordance with Listing Rule 9.8.4There are no matters requiring disclosure under the FCA’s Listing Rule 9.8.4, other than details of long-term incentive schemes, which are explained further on page 97.
Articles of AssociationChanges to the Articles must be submitted to shareholders for approval. Save in respect of the rights attaching to the Special Share, the Company has not adopted any special rules relating to the appointment and replacement of Directors or the amendment of the Company’s Articles of Association, other than as provided under UK corporate law.
Appointment and replacement of DirectorsAccording to the Articles of Association, all Directors are subject to election by shareholders at the first AGM following their appointment, and to re-election thereafter at intervals of no more than three years. In line with best practice reflected in the Code, however, the Company requires each serving member of the Board to be put forward for election or re-election on an annual basis at each AGM.
Powers of the Directors: allotment/purchase of own shares At the Company’s AGM held in July 2020, the shareholders passed resolutions which authorised the Directors to allot relevant securities up to an aggregate nominal value of £3,786,037 (£1,893,019 pursuant only to a rights issue), to disapply pre-emption rights (up to 5% of the issued ordinary share capital) and to purchase ordinary shares (up to 10% of the issued ordinary share capital). The authorities will remain valid until the 2021 AGM.
Resolutions in respect of the allotment of relevant securities, the disapplication of pre-exemption rights and the purchase of own shares will be laid before the 2021 AGM.
Annual General MeetingThe Company’s AGM will be held on Wednesday 21 July 2021 at 10:00am at Portsdown Technology Park, Southwick Road, Portsmouth PO6 3RU.
Independent auditorPwC has expressed its willingness to continue in office as independent auditor and a resolution to re-appoint them will be proposed at the AGM.
115Annual Report & Accounts 2021
Governance

Directors’ report continued
Statement of Directors’ responsibilities in respect of the financial statementsThe Directors are responsible for preparing the Annual Report and the Financial Statements in accordance with applicable law and regulation.
Company law requires the Directors to prepare financial statements for each financial year. Under that law the Directors have prepared the Group financial statements in accordance with International Accounting Standards in conformity with the requirements of the Companies Act 2006 and the Company financial statements in accordance with United Kingdom Generally Accepted Accounting Practice (United Kingdom Accounting Standards, comprising FRS 101 “Reduced Disclosure Framework”, and applicable law). Additionally, the Financial Conduct Authority’s Disclosure Guidance and Transparency Rules require the Directors to prepare the Group Financial Statements in accordance with International Financial Reporting Standards adopted pursuant to Regulation (EC) No 1606/2002 as it applies in the European Union.
Under company law, Directors must not approve the Financial Statements unless they are satisfied that they give a true and fair view of the state of affairs of the Group and Company and of the profit or loss of the Group for that period. In preparing the financial statements, the Directors are required to:
• Select suitable accounting policies and then apply them consistently
• State whether applicable international accounting standards in conformity with the requirements of the Companies Act 2006 and international financial reporting standards adopted pursuant to Regulation (EC) No 1606/2002 as it applies in the European Union have been followed for the Group financial statements and United Kingdom Accounting Standards, comprising FRS 101 have been followed for the Company financial statements, subject to any material departures disclosed and explained in the financial statements
• Make judgements and accounting estimates that are reasonable and prudent
• Prepare the financial statements on the going concern basis unless it is inappropriate to presume that the Group and Company will continue in business
The Directors are also responsible for safeguarding the assets of the Group and Company and hence for taking reasonable steps for the prevention and detection of fraud and other irregularities.
The Directors are responsible for keeping adequate accounting records that are sufficient to show and explain the Group’s and Company’s transactions and disclose with reasonable accuracy at any time the financial position of the Group and Company and enable them to ensure that the financial statements and the Directors’ Remuneration Report comply with the Companies Act 2006.
The Directors are responsible for the maintenance and integrity of the Company’s website. Legislation in the United Kingdom governing the preparation and dissemination of financial statements may differ from legislation in other jurisdictions.
Directors’ confirmationsEach of the Directors, whose names and functions are listed on pages 58 and 59 confirm that, to the best of their knowledge:
• The Group financial statements, which have been prepared in accordance with international accounting standards in conformity with the requirements of the Companies Act 2006 and international financial reporting standards adopted pursuant to Regulation (EC) No 1606/2002 as it applies in the European Union, give a true and fair view of the assets, liabilities, financial position and profit of the Group
• The Company Financial Statements, which have been prepared in accordance with United Kingdom Accounting Standards, comprising FRS 101, give a true and fair view of the assets, liabilities, financial position and profit of the Company
• The Going concern statement on page 37 includes a fair review of the development and performance of the business and the position of the Group and Company, together with a description of the principal risks and uncertainties that it faces.
In the case of each Director in office at the date the Directors’ report is approved.
Scope of the reporting in this Annual ReportThe Board has prepared a Strategic report which provides an overview of the development and performance of the Group’s business in the year ended 31 March 2021.
For the purposes of DTR 4.1.5R(2) and DTR 4.1.8 the Directors’ report, the Directors confirm that, so far as they are aware, there is no relevant audit information of which the Company’s auditor is unaware, and that they have taken all steps that they ought to have taken as Directors to make themselves aware of any relevant audit information and to establish that the Company’s auditor is aware of that information.
By order of the Board.
Jon MessentCompany Secretary and Group General Counsel20 May 2021
116 QinetiQ Group plc

Report on the audit of the financial statementsOpinionIn our opinion:
• QinetiQ Group plc’s group financial statements and company financial statements (the “financial statements”) give a true and fair view of the state of the group’s and of the company’s affairs as at 31 March 2021 and of the group’s profit and the group’s cash flows for the year then ended;
• the group financial statements have been properly prepared in accordance with international accounting standards in conformity with the requirements of the Companies Act 2006;
• the company financial statements have been properly prepared in accordance with United Kingdom Generally Accepted Accounting Practice (United Kingdom Accounting Standards, comprising FRS 101 “Reduced Disclosure Framework”, and applicable law); and
• the financial statements have been prepared in accordance with the requirements of the Companies Act 2006.
We have audited the financial statements, included within the Annual Report, which comprise: the Consolidated and Company balance sheets as at 31 March 2021; the Consolidated income statement and Consolidated comprehensive income statement, the Consolidated cash flow statement, and the Consolidated and Company statements of changes in equity for the year then ended; and the notes to the financial statements, which include a description of the significant accounting policies.
Our opinion is consistent with our reporting to the Audit Committee.
Separate opinion in relation to international financial reporting standards adopted pursuant to Regulation (EC) No 1606/2002 as it applies in the European UnionAs explained in note 36 to the financial statements, the group, in addition to applying international accounting standards in conformity with the requirements of the Companies Act 2006, has also applied international financial reporting standards adopted pursuant to Regulation (EC) No 1606/2002 as it applies in the European Union.
In our opinion, the group financial statements have been properly prepared in accordance with international financial reporting standards adopted pursuant to Regulation (EC) No 1606/2002 as it applies in the European Union.
Basis for opinionWe conducted our audit in accordance with International Standards on Auditing (UK) (“ISAs (UK)”) and applicable law. Our responsibilities under ISAs (UK) are further described in the Auditors’ responsibilities for the audit of the financial statements section of our report. We believe that the audit evidence we have obtained is sufficient and appropriate to provide a basis for our opinion.
IndependenceWe remained independent of the group in accordance with the ethical requirements that are relevant to our audit of the financial statements in the UK, which includes the FRC’s Ethical Standard, as applicable to listed public interest entities, and we have fulfilled our other ethical responsibilities in accordance with these requirements.
To the best of our knowledge and belief, we declare that non-audit services prohibited by the FRC’s Ethical Standard were not provided.
Other than those disclosed in 8, we have provided no non-audit services to the company or its controlled undertakings in the period under audit.
Our audit approachOverviewAudit scope• We conducted full scope audit work in the UK over QinetiQ
Limited, and in the US over QinetiQ Inc. (MTEQ). This provides significant coverage over all financial statement balances, except inventory.
• We performed a full scope financial statement line item audit over inventory balances at Foster Miller Inc. (QNA) and QinetiQ Target Systems Limited.
• Additionally in QNA, we performed full scope financial statement line item audits over revenue and associated balances.
• We performed procedures over goodwill, intangible assets, share-based payments, pensions, IFRS 16 lease accounting, taxation and testing of the consolidation at a Group level.
Key audit matters• Long-term contract accounting (group)
• Provisions and contingent liabilities (group)
• Impairment of goodwill and acquired intangibles (group)
• Accounting for tax research and development expenditure credits (group)
• Impact of COVID-19 (group and parent)
• Impairment of investment in subsidiary company (parent)
Materiality• Overall group materiality: £6,400,000 (2020: £6,200,000)
based on 5% of underlying profit before tax.
• Overall company materiality: £5,000,000 (2020: £4,800,000) based on 1% of total assets.
• Performance materiality: £4,800,000 (group) and £3,750,000 (company).
The scope of our auditAs part of designing our audit, we determined materiality and assessed the risks of material misstatement in the financial statements.
Independent auditors’ reportto the members of QinetiQ Group plc
117Annual Report & Accounts 2021
Governance

Our audit approach continuedKey audit mattersKey audit matters are those matters that, in the auditors’ professional judgement, were of most significance in the audit of the financial statements of the current period and include the most significant assessed risks of material misstatement (whether or not due to fraud) identified by the auditors, including those which had the greatest effect on: the overall audit strategy; the allocation of resources in the audit; and directing the efforts of the engagement team. These matters, and any comments we make on the results of our procedures thereon, were addressed in the context of our audit of the financial statements as a whole, and in forming our opinion thereon, and we do not provide a separate opinion on these matters.
This is not a complete list of all risks identified by our audit.
Impairment of investment in subsidiary company (parent) is a new key audit matter this year. Acquisition accounting (Group), which was a key audit matter last year, is no longer included because of reduction in significance and complexity of the acquisitions made in the year ended 31 March 2021. Otherwise, the key audit matters below are consistent with last year.
Key audit matter How our audit addressed the key audit matter
Long-term contract accounting (group)
Refer to page 88 (Report of the Audit Committee) and page 167 (note 36, Significant accounting policies - Revenue from contracts with customers) and page 132 (note 2, Revenue from contracts with customers and other income).
QinetiQ Group plc has a large number of contracts which span multiple periods and are accounted for on a percentage of completion (POC) basis in accordance with IFRS 15.
Long term contract accounting requires a number of judgements and management estimates to be made, particularly in calculating the forecast costs to complete the contract. These judgements drive the revenue and profit recognition, and together with cash paid by the customer, impact the balance sheet position at the year end.
Onerous contract provisions are recorded where there is an expectation that a contract will be loss-making, and judgement is applied to determine the magnitude of any provision. Particular focus is given to contracts which are technologically challenging.
We evaluated the contract governance policies and controls in place within the business and tested the design and operating effectiveness of key controls in place over long-term contracts.
We performed risk assessment procedures over the portfolio of contracts to identify higher-risk contracts. These higher risk contracts were selected for detailed contract audits. These detailed contract audits involved meeting with key financial and non-financial personnel through the year and at year end to discuss contract performance, as well as obtaining evidence to support contract financials. Specifically, our procedures included the following:
• We assessed the basis of revenue recognition to ensure it is in line with applicable accounting standards.
• We agreed overall anticipated revenue to the underlying contract and validated a sample of customer invoices through to cash receipt.
• We recalculated revenue recognised and agreed both revenue, costs and associated balance sheet positions to the underlying general ledger.
• We obtained evidence to corroborate management estimates and judgements, particularly around forecast costs to complete and risk contingencies. Where necessary, we obtained correspondence with the customer to evidence progress made on the contract during the year and remaining obligations.
• We validated costs incurred and allocated to contracts during the year to supporting documentation on a company-wide basis.
For remaining untested contracts, we selected a sample and performed testing over revenue, agreeing to supporting documentation including customer contracts and validating a sample of customer invoices to cash receipts.
We agreed contract loss provisions recorded based on the overall outcome anticipated on the contract through a combination of the procedures above.
Additional testing was performed, where not sufficiently covered by the above, over contract asset and liability balance sheet positions. These have been sample tested and agreed to supporting documentation.
No material exceptions were found.
Independent auditors’ report continuedto the members of QinetiQ Group plc
118 QinetiQ Group plc

Key audit matter How our audit addressed the key audit matter
Provisions and contingent liabilities (group)
Refer to page 88 (Report of the Audit Committee) and page 167 (note 36, Significant accounting policies - Provisions), page 147 (note 23, Provisions) and page 164 (note 32, Contingent liabilities and assets).
QinetiQ Group plc holds provisions in respect of legal, contractual, regulatory and environmental issues. (Note: Long-term contract related provisions are covered within the ‘long-term contract accounting’ matter above).
The Group operates in regulated environments and failure to comply with particular regulations could result in fines and/or penalties. There is judgement required in determining the significance of any instances of potential non-compliance and potential liability based on management’s assessment of the most likely outcome.
The financial statements should disclose any contingent liabilities in respect of contractual, regulatory or legal issues which have not been provided for on the basis that they are not considered to qualify for recognition as provisions.
We have assessed management’s processes and controls over legal regulatory claims and contractual disputes and made enquiries with in-house legal counsel.
We tested the appropriateness of management’s assumptions by reference to third party evidence for key provisions recorded at the year end and movements in the year. In certain cases, we have also discussed matters directly with external legal counsel. In doing this, we concluded on whether our understanding of the facts and circumstances gained throughout the audit process corroborated the provision recorded.
We challenged management’s estimate of the most likely outcomes by critically evaluating the range of possible outcomes to determine if the amounts provided are appropriate.
We have considered the completeness of provisions and contingent liabilities recorded by management with reference to other information obtained during the course of audit procedures, including the review of board minutes.
We assessed the adequacy of the Group’s financial statement disclosures and adherence to accounting standards. We found that the judgements formed by management were within an acceptable range and disclosures made in the financial statements are materially correct.
Impairment of goodwill and acquired intangibles (group)
Refer to page 88 (Report of the Audit Committee), page 167 (note 36, Significant accounting policies - Impairment of goodwill and tangible, intangible and held for sale assets, page 140 (note 14, Goodwill) and page 142 (note 15, intangible assets).
The Group has a material amount of acquired intangible assets and goodwill, including from recent acquisitions. There is a risk of impairment where the post-acquisition performance of businesses acquired is behind expectations from the time of the original acquisition.
Management performed a discounted cash flow analysis based on the Board-approved five-year budget to assess whether the goodwill and intangible assets are supported by future cash flow projections.
An impairment charge of £25.4m has been recognised in the QinetiQ Germany CGU during the year.
We have tested the principles and mathematical integrity of the Group’s discounted cash flow model used to assess goodwill and indefinite-lived intangibles assets for potential impairment. With the assistance of our valuation specialists, we assessed the growth and discount rates used in the impairment calculation, by comparing the Group’s assumptions to external data. We concluded that the Group’s assumptions were appropriate.
We have understood the rationale for the model used, the term of which is consistent with the internal budgeting and forecasting process and the long-term viability assessment, and agreed that this has been appropriately approved by the Board.
We challenged the cash flow projections used within the model by reference to current level of sales and analysis of management’s historic forecasting accuracy. We have held discussions with financial and non-financial personnel, corroborating explanations to supporting documentation, including third party evidence, where possible.
We tested the sensitivity of the impairment calculation to changes in the underlying assumptions and concluded that no further impairments are required, and that the sensitivity to key assumptions is sufficiently disclosed.
Where impairment charges have been recognised, we have challenged the basis and accuracy of the impairment, and have ensured that sufficient and appropriate disclosure is made within the financial statements.
We assessed whether the Group’s disclosures regarding sensitivity of the outcome of the impairment assessment to changes in key assumptions properly reflected the risks inherent in the valuation of goodwill.
Through review of the impairment assessments performed by management and the disclosure made, we identified revenue cash flows in the forecasts of the Germany CGU that were reliant on future capital expenditure, which were revised by management to comply with IAS 36. As a result of the audit challenge, the impairment recognised against the Germany CGU was increased from £17.5m to the £25.4m disclosed on page 140.
119Annual Report & Accounts 2021
Governance

Key audit matter How our audit addressed the key audit matter
Accounting for tax research and development expenditure credits (group)
Refer to page 167 (note 36, Significant accounting policies - Taxation), page 137 (note 9, Taxation).
The Group has determined that it is appropriate to account for the UK’s Research and Development Expenditure Credit (‘RDEC’) under IAS 12, rather than as a government grant within IAS 20.
Measurement of current tax includes RDEC and requires judgements as to the probable amount of tax payable after the preparation of tax filings and potential challenge by relevant tax authorities.
We have reviewed management’s accounting policy for RDEC and disclosure of its impact on the Group’s underlying effective tax rate. Management has made a judgement as to whether RDEC should be accounted for under IAS 12 or IAS 20 and we consider the disclosures made are sufficient to enable the user of the accounts to identify and understand the impact of management’s accounting policy.
We have used our tax specialists to challenge the appropriateness of management’s assumptions and estimates in relation to tax positions, including RDEC, by critically assessing the range of possible outcomes. We obtained the latest correspondence with the relevant tax authorities to corroborate management’s conclusions.
We found that judgements made by management in regard to RDEC were within an acceptable range.
We have reviewed the disclosures made in respect of tax, in particular around estimates and uncertainties and are satisfied that the disclosures made are appropriate.
Impact of COVID-19 (group and parent)
Refer to page 88 (Report of the Audit Committee) and page 8 (Chief Executive Officer’s review) and page 30 (Principal risks).
The COVID-19 pandemic has caused significant global disruption and economic uncertainty.
Management has assessed the impact of COVID-19 on the group, including any potential financial reporting implications. The group has proved resilient throughout the pandemic with no significant adverse impact on financial performance. Management implemented a series of temporary measures to respond to the fast evolving situation, including the temporary closure of sites and personnel working remotely, a reduction in international travel and a temporary reduction in senior salaries and Board fees during the initial outbreak.
The pandemic has resulted in the year end financial close process, as well as the external audit, having to take place largely remotely.
We have independently assessed the impact of COVID-19 on the group and parent through inquiries performed of management at multiple levels across the group, review of Board minutes, discussions with our component audit team and consideration of financial performance and evaluation of the overall audit findings.
Our audit work over long-term contracts described above included obtaining an understanding of COVID-19 implications on each contract and agreeing that risk assumptions with the contract accounting were supportable to corroboratory evidence.
We have assessed the financial performance of the group as a whole and the performance of individual CGU’s for impairment analysis to respond to any heightened risk surrounding the going concern of the group or impairment analysis of assets. We have found that management forecasts appear reasonable and support management’s conclusion that the going concern basis is appropriate, and there is no indication of any material impairment in assets as a result of COVID-19.
Whilst we have undertaken much of our year end audit work remotely, we did not encounter any significant difficulties in performing our audit testing or in obtaining the required evidence to support our audit conclusions.
Impairment of investment in subsidiary company (parent)
Refer to page 178 (Accounting policies and note 2, Investments in subsidiary undertakings).
The Company has an investment of £507.4 million in its subsidiary. Annually, the Directors consider whether any events or circumstances have occurred that could indicate that the carrying amount of the investment in subsidiaries may not be recoverable. If such circumstances are identified, an impairment review is undertaken to establish whether the carrying amount of the investment exceeds its recoverable amount, being the higher of fair value less costs to sell or value in use.
Impairment assessments of this nature require significant judgement and there is a risk that a potential impairment trigger may not be identified by management and in the event that there is an impairment trigger identified, there is a risk that the calculation of the recoverable amount of the investment is incorrect and therefore the value of the investment may be misstated.
No such indicators of impairment have been identified.
We have evaluated management’s consideration of impairment triggers through performing our own independent assessment which has included:
• Assessing the overall financial performance of the group to identify any indicators of impairment as a result of poor financial performance.
• Considering other information gathered during the course of our audits of components and assessing whether there are any other indicators of impairment, as well as considering other factors that could indicate increased impairment risk such as regulatory change.
• Considering the market capitalisation of the group at year end and comparing this to the carrying value of the investment.
We found that management’s conclusion that there are no impairment triggers in the investment carrying value was reasonable.
Our audit approach continued
Independent auditors’ report continuedto the members of QinetiQ Group plc
120 QinetiQ Group plc

How we tailored the audit scopeWe tailored the scope of our audit to ensure that we performed enough work to be able to give an opinion on the financial statements as a whole, taking into account the structure of the group and the company, the accounting processes and controls, and the industry in which they operate.
We conducted full scope audit work over QinetiQ Limited and MTEQ, both components being considered as financially significant to the group. The audit of QinetiQ Limited is performed in the UK and the audit of MTEQ is performed in the US by our local PwC component audit team. This provides sufficient coverage over all financial statement balances, except inventory and central balances audited by the Group team.
We performed additional procedures over inventory balances at two further entities to ensure sufficient coverage over that financial statement line item. QinetiQ Target Systems Limited is located within the UK and work was performed by the Group audit team. QNA is located in the US and work was performed by our local PwC component audit team.
We performed additional procedures over revenue and associated financial statement balances at QNA, located in the US, which was performed by our local PwC component team.
In addition to the above, we performed analytical procedures on the remaining entities to understand key balances and transactions in the year and performed additional procedures on any unusual balances identified.
The audit procedures performed over the financial information of both full scope components, QinetiQ Limited and MTEQ, accounted for 77% of total Group revenue and 91% of underlying profit before taxation.
These full scope audits plus the additional audit procedures over inventory in two other locations and revenue and associated balance sheet accounts within QNA, resulted in coverage of 83% of total Group Revenue and 90% of total Group assets.
The combination of the work referred to above, together with additional procedures performed at Group level, including testing of significant journals posted within the consolidation, significant adjustments made to the financial statements, goodwill, intangible assets, share based-payments, pensions, IFRS 16 lease accounting and the taxation, gave us the evidence required for our opinion on the financial statements as a whole.
Only one component auditor, located in the US, was involved in the audit as all other procedures were performed by the Group audit team. The US business operates under a Special Security Agreement (SSA), with this being required to carry out business with the US Department of Defence. The SSA places certain restrictions on access to, and communication of, information outside of US borders. We planned our audit to ensure US personnel completed the audit work within the US and obtained approvals for transfer of information in advance of undertaking the audit work. The Group engagement leader discussed and agreed the audit plan with our US component audit team, in addition to agreeing the format and content of communications. We determined the level of involvement we needed to have in the audit work at these reporting entities to be able to conclude whether sufficient appropriate evidence had been obtained as a basis for our opinion on the financial statements as a whole. We maintained regular dialogue throughout the audit process with our US audit team, through the use of video conferencing. We also supervised the work performed through a review of the US team’s working papers and we are comfortable that sufficient and appropriate procedures have been performed.
The Company audit was performed by the Group audit team. The parent company is principally a holding company and there are no branches or other locations to be considered when scoping the audit. There are no financial statement line items in scope for the group audit. The company is audited on a stand-alone basis, and hence, testing has been performed on all material financial statement line items.
MaterialityThe scope of our audit was influenced by our application of materiality. We set certain quantitative thresholds for materiality. These, together with qualitative considerations, helped us to determine the scope of our audit and the nature, timing and extent of our audit procedures on the individual financial statement line items and disclosures and in evaluating the effect of misstatements, both individually and in aggregate on the financial statements as a whole.
Based on our professional judgement, we determined materiality for the financial statements as a whole as follows:
Financial statements - group Financial statements - company
Overall materiality £6,400,000 (2020: £6,200,000). £5,000,000 (2020: £4,800,000).
How we determined it 5% of underlying profit before tax 1% of total assets.
Rationale for benchmark applied
Based on the benchmarks used in the Annual Report and Accounts, underlying profit before tax is one of the primary measures used by the shareholders in assessing the performance of the Group, and is a generally accepted auditing benchmark. It is considered appropriate to exclude specific adjusting items due to the nature of these balances as disclosed in note 4 to the Financial Statements.
We believe that total assets is the primary measure used by shareholders in assessing the performance of this entity, and is a generally accepted auditing benchmark for non-trading entities. This materiality relates to the audit of the Parent Company only, as the Company was not in scope for the Group audit.
121Annual Report & Accounts 2021
Governance

Our audit approach continuedFor each component in the scope of our group audit, we allocated a materiality that is less than our overall group materiality. The range of materiality allocated across components was between £6,080,000 and £4,900,000. Certain components were audited to a local statutory audit materiality that was also less than our overall group materiality.
We use performance materiality to reduce to an appropriately low level the probability that the aggregate of uncorrected and undetected misstatements exceeds overall materiality. Specifically, we use performance materiality in determining the scope of our audit and the nature and extent of our testing of account balances, classes of transactions and disclosures, for example in determining sample sizes. Our performance materiality was 75% of overall materiality, amounting to £4,800,000 for the group financial statements and £3,750,000 for the company financial statements.
In determining the performance materiality, we considered a number of factors - the history of misstatements, risk assessment and aggregation risk and the effectiveness of controls - and concluded that an amount at the upper end of our normal range was appropriate.
We agreed with the Audit Committee that we would report to them misstatements identified during our audit above £320,000 (group audit) (2020: £300,000) and £250,000 (company audit) (2020: £244,000) as well as misstatements below those amounts that, in our view, warranted reporting for qualitative reasons.
Conclusions relating to going concernOur evaluation of the Directors’ assessment of the group’s and the company’s ability to continue to adopt the going concern basis of accounting included:
• We have obtained management’s strategic plan and detailed FY22 budget. We have held discussions with management to understand the budgeting process and the key assumptions made in the forecasting process;
• Performed a comparison of the going concern assessment to Board-approved forecasts and, where applicable, compared these forecasts for consistency to those used elsewhere in the business, including for long-term contact accounting and impairment assessments;
• Assessing whether the stress testing performed by management appropriately considered the principal risks facing the business, and were adequate;
• Using our own knowledge from the audit and assessment of previous forecasting accuracy we calculated sensitivities to apply to management’s cash flow forecasts. These procedures confirmed significant head room in management’s forecasts.
• Evaluating the feasibility of management’s mitigating actions in response to the severe stress testing scenarios; and
• We assessed the adequacy of disclosures in the Going Concern statement on page 37, the audit committee report on page 89 and statements in note 36 of the Financial Statements and found these appropriately reflect our understanding of the process undertaken and the conclusion reached.
Based on the work we have performed, we have not identified any material uncertainties relating to events or conditions that, individually or collectively, may cast significant doubt on the group’s and the company’s ability to continue as a going concern for a period of at least twelve months from when the financial statements are authorised for issue.
In auditing the financial statements, we have concluded that the Directors’ use of the going concern basis of accounting in the preparation of the financial statements is appropriate.
However, because not all future events or conditions can be predicted, this conclusion is not a guarantee as to the group’s and the company’s ability to continue as a going concern.
In relation to the Directors’ reporting on how they have applied the UK Corporate Governance Code, we have nothing material to add or draw attention to in relation to the Directors’ statement in the financial statements about whether the Directors considered it appropriate to adopt the going concern basis of accounting.
Our responsibilities and the responsibilities of the Directors with respect to going concern are described in the relevant sections of this report.
Independent auditors’ report continuedto the members of QinetiQ Group plc
122 QinetiQ Group plc

Reporting on other informationThe other information comprises all of the information in the Annual Report other than the financial statements and our auditors’ report thereon. The Directors are responsible for the other information. Our opinion on the financial statements does not cover the other information and, accordingly, we do not express an audit opinion or, except to the extent otherwise explicitly stated in this report, any form of assurance thereon.
In connection with our audit of the financial statements, our responsibility is to read the other information and, in doing so, consider whether the other information is materially inconsistent with the financial statements or our knowledge obtained in the audit, or otherwise appears to be materially misstated. If we identify an apparent material inconsistency or material misstatement, we are required to perform procedures to conclude whether there is a material misstatement of the financial statements or a material misstatement of the other information. If, based on the work we have performed, we conclude that there is a material misstatement of this other information, we are required to report that fact. We have nothing to report based on these responsibilities.
With respect to the Strategic report and Directors’ Report, we also considered whether the disclosures required by the UK Companies Act 2006 have been included.
Based on our work undertaken in the course of the audit, the Companies Act 2006 requires us also to report certain opinions and matters as described below.
Strategic report and Directors’ ReportIn our opinion, based on the work undertaken in the course of the audit, the information given in the Strategic report and Directors’ Report for the year ended 31 March 2021 is consistent with the financial statements and has been prepared in accordance with applicable legal requirements.
In light of the knowledge and understanding of the group and company and their environment obtained in the course of the audit, we did not identify any material misstatements in the Strategic report and Directors’ Report.
Directors’ RemunerationIn our opinion, the part of the Directors’ Remuneration Report to be audited has been properly prepared in accordance with the Companies Act 2006.
Corporate governance statementThe Listing Rules require us to review the Directors’ statements in relation to going concern, longer-term viability and that part of the corporate governance statement relating to the company’s compliance with the provisions of the UK Corporate Governance Code specified for our review. Our additional responsibilities with respect to the corporate governance statement as other information are described in the Reporting on other information section of this report.
Based on the work undertaken as part of our audit, we have concluded that each of the following elements of the corporate governance statement is materially consistent with the financial statements and our knowledge obtained during the audit, and we have nothing material to add or draw attention to in relation to:
• The Directors’ confirmation that they have carried out a robust assessment of the emerging and principal risks;
• The disclosures in the Annual Report that describe those principal risks, what procedures are in place to identify emerging risks and an explanation of how these are being managed or mitigated;
• The Directors’ statement in the financial statements about whether they considered it appropriate to adopt the going concern basis of accounting in preparing them, and their identification of any material uncertainties to the group’s and company’s ability to continue to do so over a period of at least twelve months from the date of approval of the financial statements;
• The Directors’ explanation as to their assessment of the group’s and company’s prospects, the period this assessment covers and why the period is appropriate; and
• The Directors’ statement as to whether they have a reasonable expectation that the company will be able to continue in operation and meet its liabilities as they fall due over the period of its assessment, including any related disclosures drawing attention to any necessary qualifications or assumptions.
Our review of the Directors’ statement regarding the longer-term viability of the group was substantially less in scope than an audit and only consisted of making inquiries and considering the Directors’ process supporting their statement; checking that the statement is in alignment with the relevant provisions of the UK Corporate Governance Code; and considering whether the statement is consistent with the financial statements and our knowledge and understanding of the group and company and their environment obtained in the course of the audit.
123Annual Report & Accounts 2021
Governance

Corporate governance statement continuedIn addition, based on the work undertaken as part of our audit, we have concluded that each of the following elements of the corporate governance statement is materially consistent with the financial statements and our knowledge obtained during the audit:
• The Directors’ statement that they consider the Annual Report, taken as a whole, is fair, balanced and understandable, and provides the information necessary for the members to assess the group’s and company’s position, performance, business model and strategy;
• The section of the Annual Report that describes the review of effectiveness of risk management and internal control systems; and
• The section of the Annual Report describing the work of the Audit Committee.
We have nothing to report in respect of our responsibility to report when the Directors’ statement relating to the company’s compliance with the Code does not properly disclose a departure from a relevant provision of the Code specified under the Listing Rules for review by the auditors.
Responsibilities for the financial statements and the auditResponsibilities of the Directors for the financial statementsAs explained more fully in the Statement of Directors’ responsibilities, the Directors are responsible for the preparation of the financial statements in accordance with the applicable framework and for being satisfied that they give a true and fair view. The Directors are also responsible for such internal control as they determine is necessary to enable the preparation of financial statements that are free from material misstatement, whether due to fraud or error.
In preparing the financial statements, the Directors are responsible for assessing the group’s and the company’s ability to continue as a going concern, disclosing, as applicable, matters related to going concern and using the going concern basis of accounting unless the Directors either intend to liquidate the group or the company or to cease operations, or have no realistic alternative but to do so.
Auditors’ responsibilities for the audit of the financial statementsOur objectives are to obtain reasonable assurance about whether the financial statements as a whole are free from material misstatement, whether due to fraud or error, and to issue an auditors’ report that includes our opinion. Reasonable assurance is a high level of assurance, but is not a guarantee that an audit conducted in accordance with ISAs (UK) will always detect a material misstatement when it exists. Misstatements can arise from fraud or error and are considered material if, individually or in the aggregate, they could reasonably be expected to influence the economic decisions of users taken on the basis of these financial statements.
Irregularities, including fraud, are instances of non-compliance with laws and regulations. We design procedures in line with our responsibilities, outlined above, to detect material misstatements in respect of irregularities, including fraud. The extent to which our procedures are capable of detecting irregularities, including fraud, is detailed below.
Based on our understanding of the group and industry, we identified that the principal risks of non-compliance with laws and regulations related to relevant tax legislation, Single Source Contracting Regulations, the Health and Safety Executive and anti-bribery and corruption legislation, and we considered the extent to which non-compliance might have a material effect on the financial statements. We also considered those laws and regulations that have a direct impact on the financial statements such as the Companies Act 2006. We evaluated management’s incentives and opportunities for fraudulent manipulation of the financial statements (including the risk of override of controls), and determined that the principal risks were related to posting inappropriate journal entries to increase revenue or reduce expenditure, and management bias in accounting estimates. The group engagement team shared this risk assessment with the component auditors so that they could include appropriate audit procedures in response to such risks in their work. Audit procedures performed by the group engagement team and/or component auditors included:
• Discussions with management at multiple levels across the business, internal audit and the Group’s legal counsel throughout the year, as well as at year end. These discussions have included consideration of known or suspected instances of non-compliance with laws and regulations and fraud;
• Evaluation of management’s controls designed to prevent and detect irregularities, in particular their anti-bribery controls;
• Understanding and evaluating changes in processes and controls as a result of the COVID-19 pandemic;
• Assessment of matters reported on the Group’s whistleblowing helpline and the results of management’s investigation of such matters;
Independent auditors’ report continuedto the members of QinetiQ Group plc
124 QinetiQ Group plc

• Reviewing correspondence with and reports to relevant regulatory authorities;
• Challenging assumptions and judgements made by management in their significant accounting estimates, in particular in relation to long-term contract accounting and the impairment of goodwill and acquired intangible fixed assets (see related key audit matters below);
• Identifying and testing journal entries, in particular any journal entries posted with unusual account combinations or posted by senior management; and
• Incorporating elements of unpredictability into the audit procedures performed.
There are inherent limitations in the audit procedures described above. We are less likely to become aware of instances of non-compliance with laws and regulations that are not closely related to events and transactions reflected in the financial statements. Also, the risk of not detecting a material misstatement due to fraud is higher than the risk of not detecting one resulting from error, as fraud may involve deliberate concealment by, for example, forgery or intentional misrepresentations, or through collusion.
Our audit testing might include testing complete populations of certain transactions and balances, possibly using data auditing techniques. However, it typically involves selecting a limited number of items for testing, rather than testing complete populations. We will often seek to target particular items for testing based on their size or risk characteristics. In other cases, we will use audit sampling to enable us to draw a conclusion about the population from which the sample is selected.
A further description of our responsibilities for the audit of the financial statements is located on the FRC’s website at: www.frc.org.uk/auditorsresponsibilities. This description forms part of our auditors’ report.
Use of this reportThis report, including the opinions, has been prepared for and only for the company’s members as a body in accordance with Chapter 3 of Part 16 of the Companies Act 2006 and for no other purpose. We do not, in giving these opinions, accept or assume responsibility for any other purpose or to any other person to whom this report is shown or into whose hands it may come save where expressly agreed by our prior consent in writing.
Other required reportingCompanies Act 2006 exception reportingUnder the Companies Act 2006 we are required to report to you if, in our opinion:
• we have not obtained all the information and explanations we require for our audit; or
• adequate accounting records have not been kept by the company, or returns adequate for our audit have not been received from branches not visited by us; or
• certain disclosures of Directors’ remuneration specified by law are not made; or
• the company financial statements and the part of the Directors’ Remuneration Report to be audited are not in agreement with the accounting records and returns.
We have no exceptions to report arising from this responsibility.
AppointmentFollowing the recommendation of the Audit Committee, we were appointed by the members on 22 June 2017 to audit the financial statements for the year ended 31 March 2018 and subsequent financial periods. The period of total uninterrupted engagement is 4 years, covering the years ended 31 March 2018 to 31 March 2021.
Julian Gray Senior Statutory Auditor for and on behalf of PricewaterhouseCoopers LLP Chartered Accountants and Statutory Auditors Southampton
20 May 2021
125Annual Report & Accounts 2021
Governance

Financial statements
126 QinetiQ Group plc

Consolidated income statement 128
Consolidated comprehensive income statement 129
Consolidated statement of changes in equity 129
Consolidated balance sheet 130
Consolidated cash flow statement 131
Reconciliation of movements in net cash 131
Notes to the financial statements 132
Company balance sheet 176
Company statement of changes in equity 177
Notes to the Company financial statements 178
127Annual Report & Accounts 2021
Financial Statements

Consolidated income statement For the year ended 31 March
QinetiQ Group plc Annual Report and Accounts 2021 128
* Alternative performance measures are used to supplement the statutory figures. These are additional financial indicators used by management internally to assess the underlying performance of the Group. Definitions can be found on page 183. Also refer to notes 4 and 36 for details of ‘specific adjusting items’.
2021 2020
All figures in £ million Note Underlying*
Specific adjusting
Items* Total Underlying*
Specific adjusting
Items* Total
Revenue 2, 3 1,278.2 – 1,278.2 1,072.9 – 1,072.9
Other operating costs excluding depreciation and amortisation (1,086.0) (2.8) (1,088.8) (903.6) (8.0) (911.6)
Other income 2 9.9 0.1 10.0 9.2 14.0 23.2
EBITDA (earnings before interest, tax, depreciation
and amortisation) 202.1 ((22..77)) 199.4 178.5 66..00 184.5
Depreciation and impairment of property, plant and equipment 3, 4, 16 (45.6) (0.5) (46.1) (41.0) – (41.0)
Impairment of goodwill 4, 14 – (25.4) (25.4) – (14.1) (14.1)
Amortisation and impairment of intangible assets 3, 4, 15 (4.7) (10.9) (15.6) (4.3) (7.5) (11.8)
Operating profit 3 151.8 ((3399..55)) 112.3 133.2 (15.6) 117.6
Gain on business divestments 13 – 28.4 28.4 – – –
Gain on sale of investments – 0.3 0.3 – – –
Finance income 7 0.3 7.1 7.4 1.1 6.5 7.6
Finance expense 7 (2.2) – (2.2) (2.1) – (2.1)
Profit/(loss) before tax 8 149.9 (3.7) 146.2 132.2 (9.1) 123.1
Taxation (charge)/income 9 (23.8) 2.3 (21.5) (18.5) 1.9 (16.6)
Profit for the year 126.1 (1.4) 124.7 113.7 (7.2) 106.5
Profit is attributable to Owners of the parent company 125.9 (1.4) 124.5 113.5 (7.2) 106.3
Non-controlling interests 0.2 – 0.2 0.2 – 0.2
Profit for the year 126.1 (1.4) 124.7 113.7 (7.2) 106.5
Earnings per share for profit attributable to
the owners of the parent company 2021 2020
All figures in pence Note Underlying* Total Underlying* Total
Basic 10 22.1p 21.9p 20.0p 18.7p
Diluted 10 21.9p 21.6p 19.8p 18.6p
128 QinetiQ Group plc

Consolidated comprehensive income statement For the year ended 31 March
QinetiQ Group plc Annual Report and Accounts 2021 129
Financial Statements
Consolidated statement of changes in equity For the year ended 31 March
All figures in £ million Share
capital
Capital redemption
reserve Share
premium Hedge
reserve Translation
reserve Retained earnings Total
Non-controlling
interest Total
equity
At 1 April 2020 5.7 40.8 147.6 0.4 8.3 681.9 884.7 2.4 887.1
Profit for the year – – – – – 124.5 124.5 0.2 124.7
Other comprehensive expense for the year, net of tax – – – (0.8) (11.2) (84.3) (96.3) – (96.3)
Purchase of own shares – – – – – (9.0) (9.0) – (9.0)
Share settled liabilities – – – – – 13.7 13.7 – 13.7
Share-based payments – – – – – 10.6 10.6 – 10.6
Deferred tax on share options – – – – – 0.5 0.5 – 0.5
Transactions with NCI (note 12) – – – – – (1.6) (1.6) (2.3) (3.9)
Dividends – – – – – (37.7) (37.7) – (37.7)
At 31 March 2021 5.7 40.8 147.6 (0.4) (2.9) 698.6 889.4 0.3 889.7
At 31 March 2019 – previously reported 5.7 40.8 147.6 (0.2) 3.8 581.1 778.8 2.2 781.0
Restatement in respect of IFRS 16 – – – – – (2.0) (2.0) – (2.0)
At 31 March 2019 – restated 5.7 40.8 147.6 (0.2) 3.8 579.1 776.8 2.2 779.0
Change in accounting policy – IFRIC 23 – – – – – 2.1 2.1 – 2.1
At 1 April 2019 5.7 40.8 147.6 (0.2) 3.8 581.2 778.9 2.2 781.1
Profit for the year – – – – – 106.3 106.3 0.2 106.5
Other comprehensive income for the year, net of tax – – – 0.6 4.5 27.1 32.2 – 32.2
Purchase of own shares – – – – – (0.7) (0.7) – (0.7)
Share-based payments – – – – – 6.8 6.8 – 6.8
Deferred tax on share options – – – – – (0.8) (0.8) – (0.8)
Dividends – – – – – (38.0) (38.0) – (38.0)
At 31 March 2020 5.7 40.8 147.6 0.4 8.3 681.9 884.7 2.4 887.1 .
All figures in £ million 2021 2020
Profit for the year 124.7 106.5
Items that will not be reclassified to profit or loss:
Actuarial (loss)/gain recognised in defined benefit pension schemes (104.1) 39.8
Tax on items that will not be reclassified to profit and loss 19.8 (12.7)
Total items that will not be reclassified to profit or loss (84.3) 27.1
Items that may be reclassified to profit or loss:
Foreign currency translation (losses)/gains on foreign operations (12.0) 5.1
Movement in deferred tax on foreign currency translation 0.8 (0.6)
(Decrease)/Increase in the fair value of hedging derivatives (1.0) 0.8
Movement in deferred tax on hedging derivatives 0.2 (0.2)
Total items that may be reclassified to profit or loss (12.0) 5.1
Other comprehensive (expense)/income for the year, net of tax (96.3) 32.2
Total comprehensive income for the year 28.4 138.7
Total comprehensive income is attributable to:
Owners of the parent company 28.2 138.5
Non-controlling interests 0.2 0.2
Total comprehensive income for the year 28.4 138.7
129Annual Report & Accounts 2021
Financial Statements

Consolidated balance sheet As at 31 March
QinetiQ Group plc Annual Report and Accounts 2021 130
The financial statements on pages 132 to 179 were approved by the Board of Directors and authorised for issue on 20 May 2021 and were signed on its behalf by:
Steve Wadey David Smith
Chief Executive Officer Chief Financial Officer
All figures in £ million Note 2021 2020
Non-current assets
Goodwill 14 145.5 180.8
Intangible assets 15 139.2 138.9
Property, plant and equipment 16 397.2 375.6
Other financial assets 24 0.8 1.0
Financial assets at fair value through profit and loss 13 0.9 –
Equity accounted investments 17 4.2 3.6
Retirement benefit surplus 28 214.3 309.7
Deferred tax asset 18 11.7 13.3
913.8 1,022.9
Current assets
Inventories 20 54.4 52.3
Other financial assets 24 0.9 6.7
Trade and other receivables 21 326.7 250.0
Current tax asset 19 0.7 0.2
Cash and cash equivalents 24 190.1 105.8
572.8 415.0
Total assets 1,486.6 1,437.9
Current liabilities
Trade and other payables 22 (411.7) (379.8)
Current tax payable 19 (3.8) (4.1)
Provisions 23 (4.2) (1.8)
Other financial liabilities 24 (7.0) (8.9)
(426.7) (394.6)
Non-current liabilities
Deferred tax liability 18 (89.7) (101.3)
Provisions 23 (7.8) (9.7)
Other financial liabilities 24 (20.7) (19.9)
Other payables 22 (52.0) (25.3)
(170.2) (156.2)
Total liabilities (596.9) (550.8)
Net assets 889.7 887.1
Equity
Ordinary shares 29 5.7 5.7
Capital redemption reserve 40.8 40.8
Share premium account 147.6 147.6
Hedging reserve (0.4) 0.4
Translation reserve (2.9) 8.3
Retained earnings 698.6 681.9
Capital and reserves attributable to shareholders of the parent company 889.4 884.7
Non-controlling interest 0.3 2.4
Total equity 889.7 887.1
130 QinetiQ Group plc

Consolidated cash flow statement For the year ended 31 March
QinetiQ Group plc Annual Report and Accounts 2021 131
Financial Statements
Reconciliation of movement in net cash for the year ended 31 March
All figures in £ million Note 2021 2020
Underlying net cash inflow from operations 25 199.0 177.8
Less: specific adjusting items 25 (1.0) (11.3)
Net cash inflow from operations 25 198.0 166.5
Tax paid 9 (15.0) (10.0)
Interest received 0.3 1.2
Interest paid (1.7) (1.7)
Net cash inflow from operating activities 181.6 156.0
Purchases of intangible assets 15 (14.5) (16.7)
Purchases of property, plant and equipment 16 (65.0) (92.7)
Proceeds from disposals of plant and equipment – 1.6
Proceeds from sale of property 0.1 12.5
Proceeds from disposal of businesses 13 54.4 –
Proceeds from disposal of investment 0.3 –
Acquisition of businesses 12 (28.5) (90.2)
Net cash outflow from investing activities (53.2) (185.5)
Purchase of own shares (9.0) (0.7)
Dividends paid to shareholders 11 (37.7) (38.0)
Payment of bank facility arrangement fee (0.4) (0.3)
Capital element of finance lease payments (8.5) (9.7)
Net cash outflow from financing activities (55.6) (48.7)
Increase/(decrease) in cash and cash equivalents 72.8 (78.2)
Effect of foreign exchange changes on cash and cash equivalents 11.5 (6.8)
Cash and cash equivalents at beginning of the year 105.8 190.8
Cash and cash equivalents at end of the year 24 190.1 105.8
All figures in £ million Note 2021 2020
Increase/(decrease) in cash and cash equivalents in the year 72.8 (78.2)
Add back net cash flows not impacting net cash 8.9 10.0
Change in net cash resulting from cash flows 81.7 (68.2)
Lease liabilities derecognised on disposal of subsidiaries 1.9 –
Leases and debt recognised on acquisition (1.3) (2.7)
Increase in lease obligation (9.1) (4.0)
Other movements including foreign exchange 6.2 (0.9)
Increase/(decrease) in net cash as defined by the Group 79.4 (75.8)
Net cash as defined by Group at the beginning of the year 84.7 160.5
Net cash as defined by Group at the end of the year 24 164.1 84.7
Less: non-cash net financial liabilities 24 26.0 21.1
Total cash and cash equivalents 24 190.1 105.8
131Annual Report & Accounts 2021
Financial Statements

Notes to the Financial Statements For the year ended 31 March
QinetiQ Group plc Annual Report and Accounts 2021 132
1. Significant changes in the current reporting period
The financial position and performance of the Group was particularly affected by the following events and transactions during the reporting period:
1) The acquisition of Naimuri Limited (see note 12) which resulted in an increase in goodwill (note 14) and other intangible assets (note 15);
2) The divestment of the Boldon James, Commerce Decisions and OptaSense businesses (see note 13); 3) An impairment of goodwill in respect of the Germany business (see note 14).
For a detailed discussion of the Group’s performance and financial position refer to the Strategic Report on pages 2 to 51.
2. Revenue from contracts with customers and other income
Revenue and other income is analysed as follows:
Revenue by category and other income For the year ended 31 March
1 For the period of which there was no contribution in the equivalent period in the comparator year which was pre-ownership (for acquisitions) or post-ownership (for disposals) by the Group
2 Alternative performance measures are used to supplement the statutory figures. See page 183.
Other income
Revenue and profit after tax of associates and joint ventures was £12.6m and £1.1m respectively (2020: revenue of £18.1m and loss after tax of £1.5m). The figures in the table above represent the Group share of this profit after tax.
Other income is in respect of property rentals and the recovery of other related property costs.
Revenue by customer geographic location For the year ended 31 March
All figures in £ million 2021 2020
Services contracts with customers 1,189.4 945.6
Sale of goods contracts with customers 83.0 116.8
Royalties and licences 5.8 10.5
Total revenue 1,278.2 1,072.9
Less: adjust current year for acquired businesses1 (117.2) –
Less: adjust prior year for disposed businesses1 – (17.2)
Adjust to constant prior year exchange rates 2.2 –
Total revenue on an organic, constant currency basis2 1,163.2 1,055.7
Organic revenue growth at constant currency2 10% 10%
All figures in £ million 2021 2020
Share of associates’ and joint ventures’ profit/(loss) after tax 0.7 (0.7)
Other income 9.2 9.9
Other income – underlying 9.9 9.2
Specific adjusting item: gain on sale of property (note 4) 0.1 14.0
Total other income 10.0 23.2
All figures in £ million 2021 2020
US 215.6 136.0
Australia 77.9 60.7
Europe 88.2 75.9
Middle east 9.8 16.3
Rest of world 28.9 44.5
International 420.4 333.4
United Kingdom 857.8 739.5
Total revenue 1,278.2 1,072.9
International revenue % 33% 31%
Revenue from ‘home countries’ (UK, US and Australia) 1,151.3 936.2
Home countries revenue % 90% 87%
132 QinetiQ Group plc

Notes to the Financial Statements continued
QinetiQ Group plc Annual Report and Accounts 2021 133
Financial Statements
Revenue by major customer type For the year ended 31 March
‘Other’ does not contain any customers with revenue in excess of 10% of total Group revenue.
The following table shows the aggregate amount of revenue allocated to performance obligations that are unsatisfied (or partially satisfied) as at the end of the reporting period:
Management expects that 27% (£800.5m) of revenue allocated to unsatisfied contracts as of 31 March 2021 will be recognised as revenue during the next reporting period.
The following table shows the aggregate amount of revenue allocated to performance obligations that were unsatisfied (or partially satisfied) as at the end of the prior reporting period:
Revenue of £144m was recognised during the year that was previously unrecognised as at the previous year end and reported as a contract liability.
3. Segmental analysis
The analysis by business segment is presented in accordance with IFRS 8 Operating Segments, on the basis of those reportable segments whose operating results are regularly reviewed by the Board (the Chief Operating Decision Maker as defined by IFRS 8) and are aligned with the Group’s strategic direction, determined with reference to the products and services they provide, as follows:
EMEA Services provides technical assurance, test and evaluation and training services, underpinned by long-term contracts. EMEA Services comprises the following business units which are not considered reportable segments as defined by IFRS 8: Maritime & Land; Air & Space, Cyber & Information and the International business.
Global Products combines all other business units not aggregated within EMEA Services, including the QinetiQ US business, Space Products and EMEA Products (which includes QinetiQ Target Systems). Generally these business units (which are not considered reportable segments as defined by IFRS 8) deliver innovative solutions and products which includes contract-funded research and development and developing intellectual property in partnership with key customers and through internal funding with potential for new revenue streams.
Operating segments
1 The measure of profit presented to the Chief Operating Decision Maker is operating profit stated before specific adjusting items (‘underlying operating profit’). The specific adjusting items are detailed in note 4.
2 Definitions of the Group’s ‘Alternative performance measures’ can be found in the glossary on page 183.
No measure of segmental assets and liabilities is reported as this information is not regularly provided to the Chief Operating Decision Maker.
All figures in £ million 2021 2020
UK government 794.6 667.2
US government 140.8 116.2
Other 342.8 289.5
Total revenue 1,278.2 1,072.9
All figures in £ million 2022 2023 2024 2025+ Total
Total forecast revenue allocated to unsatisfied performance obligations 800.5 523.9 395.9 1,223.8 2,944.1
All figures in £ million 2021 2022 2023 2024+ Total
Total forecast revenue allocated to unsatisfied performance obligations 849.3 484.9 375.5 1,395.2 3,104.9
2021 2020
All figures in £ million
Revenue from
external customers
Underlying operating
profit1
Revenue from
external customers
Underlying operating
profit1
EMEA Services 939.9 118.6 797.4 100.6
Global Products 338.3 33.2 275.5 32.6
Total operating segments 1,278.2 151.8 1,072.9 133.2
Underlying operating margin2 11.9% 12.4%
133Annual Report & Accounts 2021
Financial Statements

Notes to the Financial Statements For the year ended 31 March
QinetiQ Group plc Annual Report and Accounts 2021 132
1. Significant changes in the current reporting period
The financial position and performance of the Group was particularly affected by the following events and transactions during the reporting period:
1) The acquisition of Naimuri Limited (see note 12) which resulted in an increase in goodwill (note 14) and other intangible assets (note 15);
2) The divestment of the Boldon James, Commerce Decisions and OptaSense businesses (see note 13); 3) An impairment of goodwill in respect of the Germany business (see note 14).
For a detailed discussion of the Group’s performance and financial position refer to the Strategic Report on pages 2 to 51.
2. Revenue from contracts with customers and other income
Revenue and other income is analysed as follows:
Revenue by category and other income For the year ended 31 March
1 For the period of which there was no contribution in the equivalent period in the comparator year which was pre-ownership (for acquisitions) or post-ownership (for disposals) by the Group
2 Alternative performance measures are used to supplement the statutory figures. See page 183.
Other income
Revenue and profit after tax of associates and joint ventures was £12.6m and £1.1m respectively (2020: revenue of £18.1m and loss after tax of £1.5m). The figures in the table above represent the Group share of this profit after tax.
Other income is in respect of property rentals and the recovery of other related property costs.
Revenue by customer geographic location For the year ended 31 March
All figures in £ million 2021 2020
Services contracts with customers 1,189.4 945.6
Sale of goods contracts with customers 83.0 116.8
Royalties and licences 5.8 10.5
Total revenue 1,278.2 1,072.9
Less: adjust current year for acquired businesses1 (117.2) –
Less: adjust prior year for disposed businesses1 – (17.2)
Adjust to constant prior year exchange rates 2.2 –
Total revenue on an organic, constant currency basis2 1,163.2 1,055.7
Organic revenue growth at constant currency2 10% 10%
All figures in £ million 2021 2020
Share of associates’ and joint ventures’ profit/(loss) after tax 0.7 (0.7)
Other income 9.2 9.9
Other income – underlying 9.9 9.2
Specific adjusting item: gain on sale of property (note 4) 0.1 14.0
Total other income 10.0 23.2
All figures in £ million 2021 2020
US 215.6 136.0
Australia 77.9 60.7
Europe 88.2 75.9
Middle east 9.8 16.3
Rest of world 28.9 44.5
International 420.4 333.4
United Kingdom 857.8 739.5
Total revenue 1,278.2 1,072.9
International revenue % 33% 31%
Revenue from ‘home countries’ (UK, US and Australia) 1,151.3 936.2
Home countries revenue % 90% 87%
Notes to the Financial Statements For the year ended 31 March
QinetiQ Group plc Annual Report and Accounts 2021 134
3. Segmental analysis (continued)
Reconciliation of segmental results to total profit
Non-current assets* by geographic location
*Excluding deferred tax, financial instruments and retirement benefit surplus.
Depreciation, impairment and amortisation by business segment – excluding specific adjusting items For the year ended 31 March 2021
For the year ended 31 March 2020
All figures in £ million Note 2021 2020
Underlying operating profit 151.8 133.2
Specific adjusting items operating loss 4 (39.5) (15.6)
Operating profit 112.3 117.6
Gain on business divestments 13 28.4 –
Gain on sale of investments 0.3 –
Net finance income 7 5.2 5.5
Profit before tax 146.2 123.1
Taxation expense 9 (21.5) (16.6)
Profit for the year 124.7 106.5
All figures in £ million UK USA Germany Rest of
world Total
Year ended 31 March 2021 468.6 132.2 41.6 39.5 681.9
Year ended 31 March 2020 442.3 144.1 67.7 41.2 695.3
All figures in £ million EMEA
Services Global
Products Total
Depreciation and impairment of property, plant and equipment 38.7 6.9 45.6
Amortisation of purchased or internally developed intangible assets 3.3 1.4 4.7
42.0 8.3 50.3
All figures in £ million EMEA
Services Global
Products Total
Depreciation and impairment of property, plant and equipment 35.5 5.5 41.0
Amortisation of purchased or internally developed intangible assets 3.4 0.9 4.3
38.9 6.4 45.3
134 QinetiQ Group plc

Notes to the Financial Statements continued
QinetiQ Group plc Annual Report and Accounts 2021 133
Financial Statements
Revenue by major customer type For the year ended 31 March
‘Other’ does not contain any customers with revenue in excess of 10% of total Group revenue.
The following table shows the aggregate amount of revenue allocated to performance obligations that are unsatisfied (or partially satisfied) as at the end of the reporting period:
Management expects that 27% (£800.5m) of revenue allocated to unsatisfied contracts as of 31 March 2021 will be recognised as revenue during the next reporting period.
The following table shows the aggregate amount of revenue allocated to performance obligations that were unsatisfied (or partially satisfied) as at the end of the prior reporting period:
Revenue of £144m was recognised during the year that was previously unrecognised as at the previous year end and reported as a contract liability.
3. Segmental analysis
The analysis by business segment is presented in accordance with IFRS 8 Operating Segments, on the basis of those reportable segments whose operating results are regularly reviewed by the Board (the Chief Operating Decision Maker as defined by IFRS 8) and are aligned with the Group’s strategic direction, determined with reference to the products and services they provide, as follows:
EMEA Services provides technical assurance, test and evaluation and training services, underpinned by long-term contracts. EMEA Services comprises the following business units which are not considered reportable segments as defined by IFRS 8: Maritime & Land; Air & Space, Cyber & Information and the International business.
Global Products combines all other business units not aggregated within EMEA Services, including the QinetiQ US business, Space Products and EMEA Products (which includes QinetiQ Target Systems). Generally these business units (which are not considered reportable segments as defined by IFRS 8) deliver innovative solutions and products which includes contract-funded research and development and developing intellectual property in partnership with key customers and through internal funding with potential for new revenue streams.
Operating segments
1 The measure of profit presented to the Chief Operating Decision Maker is operating profit stated before specific adjusting items (‘underlying operating profit’). The specific adjusting items are detailed in note 4.
2 Definitions of the Group’s ‘Alternative performance measures’ can be found in the glossary on page 183.
No measure of segmental assets and liabilities is reported as this information is not regularly provided to the Chief Operating Decision Maker.
All figures in £ million 2021 2020
UK government 794.6 667.2
US government 140.8 116.2
Other 342.8 289.5
Total revenue 1,278.2 1,072.9
All figures in £ million 2022 2023 2024 2025+ Total
Total forecast revenue allocated to unsatisfied performance obligations 800.5 523.9 395.9 1,223.8 2,944.1
All figures in £ million 2021 2022 2023 2024+ Total
Total forecast revenue allocated to unsatisfied performance obligations 849.3 484.9 375.5 1,395.2 3,104.9
2021 2020
All figures in £ million
Revenue from
external customers
Underlying operating
profit1
Revenue from
external customers
Underlying operating
profit1
EMEA Services 939.9 118.6 797.4 100.6
Global Products 338.3 33.2 275.5 32.6
Total operating segments 1,278.2 151.8 1,072.9 133.2
Underlying operating margin2 11.9% 12.4%
Notes to the Financial Statements continued
QinetiQ Group plc Annual Report and Accounts 2021 135
Financial Statements
4. Specific adjusting items
In the income statement, the Group presents specific adjusting items separately. In the judgement of the Directors, for the reader to obtain a proper understanding of the financial information, specific adjusting items need to be disclosed separately because of their size and nature. Further explanation of this rationale is provided in note 36 (Accounting Policies). Underlying measures of performance exclude specific adjusting items. The following specific adjusting items have been (charged)/credited in the consolidated income statement:
Reconciliation of underlying profit for the year to total profit for the year
* Bonuses awarded, on acquisition, to key employees within the MTEQ business acquired in December 2019 are charged to the income statement over a 24-month
retention period.
5. Analysis of employee costs and numbers
The largest component of operating expenses is employee costs. The year-end and average monthly number of persons employed by the Group, including Executive Directors, analysed by business segment, were:
The aggregate payroll costs of these persons were as follows:
All figures in £ million Note 2021 2020
Gain on sale of property 0.1 14.0
Acquisition transaction costs 12 (1.0) (7.4)
Acquisition integration costs – (0.1)
Acquisition related remuneration costs* (1.8) (0.5)
Specific adjusting items (loss)/profit before interest, tax, depreciation and amortisation (2.7) 6.0
Impairment of property (0.5) –
Impairment of goodwill 14 (25.4) (14.1)
Amortisation of intangible assets arising from acquisitions (10.9) (7.5)
Specific adjusting items operating loss (39.5) (15.6)
Gain on disposal of businesses 13 28.4 –
Gain on disposal of investment 17 0.3 –
Defined benefit pension scheme net finance income 28 7.1 6.5
Specific adjusting items loss before tax (3.7) (9.1)
Specific adjusting items – tax 9 2.3 1.9
Total specific adjusting items loss after tax (1.4) (7.2)
All figures in £ million 2021 2020
Underlying profit after tax – total Group 126.1 113.7
Total specific adjusting items loss after tax (1.4) (7.2)
Total profit for the year 124.7 106.5
As at 31 March Monthly average
2021 Number
2020 Number
2021 Number
2020 Number
EMEA Services 5,867 5,456 5,673 5,335
Global Products 1,023 1,331 1,201 932
Total employees 6,890 6,787 6,874 6,267
All figures in £ million Note 2021 2020
Wages and salaries 381.7 335.9
Social security costs 35.1 33.5
Pension costs 45.5 42.9
Share-based payments costs 30 11.2 7.5
Total employee costs 473.5 419.8
135Annual Report & Accounts 2021
Financial Statements

Notes to the Financial Statements For the year ended 31 March
QinetiQ Group plc Annual Report and Accounts 2021 132
1. Significant changes in the current reporting period
The financial position and performance of the Group was particularly affected by the following events and transactions during the reporting period:
1) The acquisition of Naimuri Limited (see note 12) which resulted in an increase in goodwill (note 14) and other intangible assets (note 15);
2) The divestment of the Boldon James, Commerce Decisions and OptaSense businesses (see note 13); 3) An impairment of goodwill in respect of the Germany business (see note 14).
For a detailed discussion of the Group’s performance and financial position refer to the Strategic Report on pages 2 to 51.
2. Revenue from contracts with customers and other income
Revenue and other income is analysed as follows:
Revenue by category and other income For the year ended 31 March
1 For the period of which there was no contribution in the equivalent period in the comparator year which was pre-ownership (for acquisitions) or post-ownership (for disposals) by the Group
2 Alternative performance measures are used to supplement the statutory figures. See page 183.
Other income
Revenue and profit after tax of associates and joint ventures was £12.6m and £1.1m respectively (2020: revenue of £18.1m and loss after tax of £1.5m). The figures in the table above represent the Group share of this profit after tax.
Other income is in respect of property rentals and the recovery of other related property costs.
Revenue by customer geographic location For the year ended 31 March
All figures in £ million 2021 2020
Services contracts with customers 1,189.4 945.6
Sale of goods contracts with customers 83.0 116.8
Royalties and licences 5.8 10.5
Total revenue 1,278.2 1,072.9
Less: adjust current year for acquired businesses1 (117.2) –
Less: adjust prior year for disposed businesses1 – (17.2)
Adjust to constant prior year exchange rates 2.2 –
Total revenue on an organic, constant currency basis2 1,163.2 1,055.7
Organic revenue growth at constant currency2 10% 10%
All figures in £ million 2021 2020
Share of associates’ and joint ventures’ profit/(loss) after tax 0.7 (0.7)
Other income 9.2 9.9
Other income – underlying 9.9 9.2
Specific adjusting item: gain on sale of property (note 4) 0.1 14.0
Total other income 10.0 23.2
All figures in £ million 2021 2020
US 215.6 136.0
Australia 77.9 60.7
Europe 88.2 75.9
Middle east 9.8 16.3
Rest of world 28.9 44.5
International 420.4 333.4
United Kingdom 857.8 739.5
Total revenue 1,278.2 1,072.9
International revenue % 33% 31%
Revenue from ‘home countries’ (UK, US and Australia) 1,151.3 936.2
Home countries revenue % 90% 87%
Notes to the Financial Statements For the year ended 31 March
QinetiQ Group plc Annual Report and Accounts 2021 136
6. Directors and other senior management personnel
The Directors and other senior management personnel of the Group during the year to 31 March 2021 comprise the Board of Directors and the Executive Committee. The remuneration and benefits provided to Directors and the Executive Committee are summarised below:
Short-term employee remuneration and benefits include salary, bonus and benefits. Post-employment benefits relate to pension amounts.
The highest paid director is the Chief Executive Officer, details of whose remuneration is provided in the Directors’ Remuneration Report.
7. Finance income and expense
For the year ended 31 March
8. Profit before tax
The following auditors’ remuneration has been charged in arriving at profit before tax:
The following items have also been charged in arriving at profit before tax:
All figures in £ million 2021 2020
Cost of inventories expensed 10.2 32.6
Owned assets: depreciation 37.2 31.7
Leased assets: depreciation 8.4 9.7
Foreign exchange loss 0.5 1.4
Research and development expenditure – customer funded contracts 281.9 270.8
Research and development expenditure – Group funded 18.5 21.5
All figures in £ million 2021 2020
Short-term employee remuneration including benefits 9.4 9.8
Post-employment benefits 0.1 0.1
Share-based payments costs 2.1 1.4
Termination benefits - 0.2
Total 11.6 11.5
All figures in £ million 2021 2020
Receivable on bank deposits 0.3 1.1
Finance income before specific adjusting items 0.3 1.1
Amortisation of deferred financing costs (0.4) (0.4)
Bank interest and commitment fees (0.6) (0.6)
Lease expense (1.0) (1.0)
Unwinding of discount on financial liabilities (0.2) (0.1)
Finance expense before specific adjusting items (2.2) (2.1)
Underlying net finance expense (1.9) (1.0)
Plus: specific adjusting items – defined benefit pension scheme net finance income 7.1 6.5
Net finance income 5.2 5.5
All figures in £ million 2021 2020
Fees payable to the auditor and its associates:
Audit of the Group’s annual accounts 0.6 0.6
Audit of the accounts of subsidiaries of the Company 0.5 0.2
Total audit fees 1.1 0.8
Audit-related assurance services 0.1 0.1
Total non-audit fees 0.1 0.1
Total auditors’ remuneration 1.2 0.9
136 QinetiQ Group plc

Notes to the Financial Statements continued
QinetiQ Group plc Annual Report and Accounts 2021 133
Financial Statements
Revenue by major customer type For the year ended 31 March
‘Other’ does not contain any customers with revenue in excess of 10% of total Group revenue.
The following table shows the aggregate amount of revenue allocated to performance obligations that are unsatisfied (or partially satisfied) as at the end of the reporting period:
Management expects that 27% (£800.5m) of revenue allocated to unsatisfied contracts as of 31 March 2021 will be recognised as revenue during the next reporting period.
The following table shows the aggregate amount of revenue allocated to performance obligations that were unsatisfied (or partially satisfied) as at the end of the prior reporting period:
Revenue of £144m was recognised during the year that was previously unrecognised as at the previous year end and reported as a contract liability.
3. Segmental analysis
The analysis by business segment is presented in accordance with IFRS 8 Operating Segments, on the basis of those reportable segments whose operating results are regularly reviewed by the Board (the Chief Operating Decision Maker as defined by IFRS 8) and are aligned with the Group’s strategic direction, determined with reference to the products and services they provide, as follows:
EMEA Services provides technical assurance, test and evaluation and training services, underpinned by long-term contracts. EMEA Services comprises the following business units which are not considered reportable segments as defined by IFRS 8: Maritime & Land; Air & Space, Cyber & Information and the International business.
Global Products combines all other business units not aggregated within EMEA Services, including the QinetiQ US business, Space Products and EMEA Products (which includes QinetiQ Target Systems). Generally these business units (which are not considered reportable segments as defined by IFRS 8) deliver innovative solutions and products which includes contract-funded research and development and developing intellectual property in partnership with key customers and through internal funding with potential for new revenue streams.
Operating segments
1 The measure of profit presented to the Chief Operating Decision Maker is operating profit stated before specific adjusting items (‘underlying operating profit’). The specific adjusting items are detailed in note 4.
2 Definitions of the Group’s ‘Alternative performance measures’ can be found in the glossary on page 183.
No measure of segmental assets and liabilities is reported as this information is not regularly provided to the Chief Operating Decision Maker.
All figures in £ million 2021 2020
UK government 794.6 667.2
US government 140.8 116.2
Other 342.8 289.5
Total revenue 1,278.2 1,072.9
All figures in £ million 2022 2023 2024 2025+ Total
Total forecast revenue allocated to unsatisfied performance obligations 800.5 523.9 395.9 1,223.8 2,944.1
All figures in £ million 2021 2022 2023 2024+ Total
Total forecast revenue allocated to unsatisfied performance obligations 849.3 484.9 375.5 1,395.2 3,104.9
2021 2020
All figures in £ million
Revenue from
external customers
Underlying operating
profit1
Revenue from
external customers
Underlying operating
profit1
EMEA Services 939.9 118.6 797.4 100.6
Global Products 338.3 33.2 275.5 32.6
Total operating segments 1,278.2 151.8 1,072.9 133.2
Underlying operating margin2 11.9% 12.4%
Notes to the Financial Statements continued
QinetiQ Group plc Annual Report and Accounts 2021 137
Financial Statements
9. Taxation
The total tax charge was £21.5m (2020: £16.6m). Deferred tax (see note 18) has been calculated at the rate at which the timing difference is expected to reverse. The underlying tax charge was £23.8m (2020: £18.5m) with an underlying effective tax rate of 15.9% for the year ending 31 March 2021 (2020: 14.0%). The effective tax rate continues to be below the UK statutory rate, primarily as a result of the benefit of research and development expenditure credits (‘RDEC’) in the UK which are accounted under IAS 12 within the tax line. An adjusted effective tax rate before the impact of RDEC would be 19.4%. The impact of RDEC is shown net of £10.6m (2020: £9.8m) appropriated by the MOD (see note 36 for details).The effective tax rate is expected to remain below the UK statutory rate in the medium term, subject to any tax legislation changes, the geographic mix of profits, the recognition of deferred tax assets and while the benefit of net RDEC retained by the Group remains in the tax line.
In the Spring Budget 2021 the Government announced that from 1 April 2023 the corporation tax rate will increase to 25%. Since the proposal to increase the rate to 25% had not been substantively enacted at the balance sheet date, its effects are not included in these financial statements. However, it is likely that the overall effect of the change, had it been substantively enacted by the balance sheet date, would be to increase the tax expense for the period by £11.0m and to increase the deferred tax liability by £25.8m.
Tax on specific adjusting items The tax in respect of the pre-tax specific adjusting items of £3.7m (note 4) was a £2.3m net income. The prior year tax in respect of the pre-tax specific adjusting items of £9.1m was a £1.4m net expense. Together with a £3.3m credit in respect of recognition of tax losses in the US the total specific adjusting items tax income in the prior year was £1.9m. Factors affecting future tax charges The effective tax rate is expected to remain below the UK statutory rate in the medium term, subject to the impact of any tax legislation changes, the geographic mix of profits and the assumption that the benefits of net R&D expenditure credits retained by the Group remain in the tax line. Future recognition of deferred tax assets will also affect future tax charges.
Tax risk management and tax cash For details of the Group’s approach to tax risk management and discussion of tax cash paid in the year see ‘Additional Financial Information’ on page 181.
2021 2020
All figures in £ million Underlying
Specific adjusting
items Total Underlying
Specific adjusting
items Total
Analysis of charge
Current UK tax expense/(income) 12.3 – 12.3 7.9 (0.8) 7.1
Current UK tax in respect of prior years (1.6) – (1.6) (0.3) – (0.3)
Overseas corporation tax
Current year 3.7 – 3.7 2.9 – 2.9
In respect of prior years (0.4) – (0.4) – – –
Current tax expense/(income) 14.0 – 14.0 10.5 (0.8) 9.7
Deferred tax expense/(income) 8.7 (1.9) 6.8 6.5 (1.8) 4.7
Deferred tax impact of change in rates – – – 2.0 0.7 2.7
Deferred tax in respect of prior years 1.1 (0.4) 0.7 (0.5) – (0.5)
Deferred tax expense/(income) 9.8 (2.3) 7.5 8.0 (1.1) 6.9
Taxation expense/(income) 23.8 (2.3) 21.5 18.5 (1.9) 16.6
Factors affecting tax charge/(credit) in year
Principal factors reducing the Group’s current year tax charge below the UK statutory rate are explained below:
Profit before tax 149.9 (3.7) 146.2 132.2 (9.1) 123.1
Tax on profit before tax at 19% (2020: 19%) 28.5 (0.7) 27.8 25.1 (1.7) 23.4
Effect of:
Expenses not deductible for tax purposes and non-taxable items 0.6 (0.4) 0.2 (0.4) 3.1 2.7
Current tax in respect of prior years (2.0) – (2.0) (0.3) – (0.3)
Research and development expenditure credits (5.1) – (5.1) (7.8) – (7.8)
Recognition of deferred tax asset (1.1) – (1.1) (1.6) (3.3) (4.9)
Deferred tax impact of change in rates – – – 2.0 0.7 2.7
Deferred tax in respect of prior years 1.1 (0.4) 0.7 (0.5) – (0.5)
Different tax rates in overseas jurisdictions 1.8 (0.8) 1.0 2.0 (0.7) 1.3
Taxation expense/(income) 23.8 (2.3) 21.5 18.5 (1.9) 16.6
Effective tax rate 15.9% 14.7% 14.0% 13.5%
137Annual Report & Accounts 2021
Financial Statements

Notes to the Financial Statements For the year ended 31 March
QinetiQ Group plc Annual Report and Accounts 2021 132
1. Significant changes in the current reporting period
The financial position and performance of the Group was particularly affected by the following events and transactions during the reporting period:
1) The acquisition of Naimuri Limited (see note 12) which resulted in an increase in goodwill (note 14) and other intangible assets (note 15);
2) The divestment of the Boldon James, Commerce Decisions and OptaSense businesses (see note 13); 3) An impairment of goodwill in respect of the Germany business (see note 14).
For a detailed discussion of the Group’s performance and financial position refer to the Strategic Report on pages 2 to 51.
2. Revenue from contracts with customers and other income
Revenue and other income is analysed as follows:
Revenue by category and other income For the year ended 31 March
1 For the period of which there was no contribution in the equivalent period in the comparator year which was pre-ownership (for acquisitions) or post-ownership (for disposals) by the Group
2 Alternative performance measures are used to supplement the statutory figures. See page 183.
Other income
Revenue and profit after tax of associates and joint ventures was £12.6m and £1.1m respectively (2020: revenue of £18.1m and loss after tax of £1.5m). The figures in the table above represent the Group share of this profit after tax.
Other income is in respect of property rentals and the recovery of other related property costs.
Revenue by customer geographic location For the year ended 31 March
All figures in £ million 2021 2020
Services contracts with customers 1,189.4 945.6
Sale of goods contracts with customers 83.0 116.8
Royalties and licences 5.8 10.5
Total revenue 1,278.2 1,072.9
Less: adjust current year for acquired businesses1 (117.2) –
Less: adjust prior year for disposed businesses1 – (17.2)
Adjust to constant prior year exchange rates 2.2 –
Total revenue on an organic, constant currency basis2 1,163.2 1,055.7
Organic revenue growth at constant currency2 10% 10%
All figures in £ million 2021 2020
Share of associates’ and joint ventures’ profit/(loss) after tax 0.7 (0.7)
Other income 9.2 9.9
Other income – underlying 9.9 9.2
Specific adjusting item: gain on sale of property (note 4) 0.1 14.0
Total other income 10.0 23.2
All figures in £ million 2021 2020
US 215.6 136.0
Australia 77.9 60.7
Europe 88.2 75.9
Middle east 9.8 16.3
Rest of world 28.9 44.5
International 420.4 333.4
United Kingdom 857.8 739.5
Total revenue 1,278.2 1,072.9
International revenue % 33% 31%
Revenue from ‘home countries’ (UK, US and Australia) 1,151.3 936.2
Home countries revenue % 90% 87%
Notes to the Financial Statements For the year ended 31 March
QinetiQ Group plc Annual Report and Accounts 2021 138
10. Earnings per share
Basic earnings per share is calculated by dividing the profit attributable to equity shareholders by the weighted average number of ordinary shares in issue during the year. The weighted average number of shares used excludes those shares bought by the Group and held as own shares (see note 29). For diluted earnings per share the weighted average number of shares in issue is adjusted to assume conversion of all potentially dilutive ordinary shares arising from unvested share-based awards including share options.
Weighted average and diluted number of shares For the year ended 31 March
Underlying basic earnings per share figures are presented below, in addition to the basic and diluted earnings per share, because the Directors consider this gives a more relevant indication of underlying business performance and reflects the adjustments to basic earnings per share for the impact of specific adjusting items (see note 4) and tax thereon.
Underlying EPS For the year ended 31 March
Basic and diluted EPS For the year ended 31 March
11. Dividends
An analysis of the dividends paid and proposed in respect of the years ended 31 March 2021 and 31 March 2020 is provided below:
The proposed final dividend in respect of the year ending 31 March 2021 will be paid on 26 August 2021. The ex-dividend date is 29 July 2021 and the record date is 30 July 2021.
2021 2020
Weighted average number of shares Million 569.7 567.0
Effect of dilutive securities Million 6.1 5.4
Diluted number of shares Million 575.8 572.4
2021 2020
Profit attributable to the owners of the Company £ million 124.5 106.3
Remove loss after tax in respect of specific adjusting items £ million 1.4 7.2
Underlying profit after taxation £ million 125.9 113.5
Weighted average number of shares Million 569.7 567.0
Underlying basic EPS Pence 22.1 20.0
Diluted number of shares Million 575.8 572.4
Underlying diluted EPS Pence 21.9 19.8
2021 2020
Profit attributable to the owners of the Company £ million 124.5 106.3
Weighted average number of shares Million 569.7 567.0
Basic EPS – total Group Pence 21.9 18.7
Diluted number of shares Million 575.8 572.4
Diluted EPS – total Group Pence 21.6 18.6
Pence
per share £m Date paid/
payable
Interim 2021 2.2 12.6 Feb 2021
Final 2021 (proposed) 4.7 26.8 Aug 2021
Total for the year ended 31 March 2021 6.9 39.4
Interim 2020 2.2 12.5 Feb 2020
Final 2020 4.4 25.1 Nov 2020
Total for the year ended 31 March 2020 6.6 37.6
138 QinetiQ Group plc

Notes to the Financial Statements continued
QinetiQ Group plc Annual Report and Accounts 2021 133
Financial Statements
Revenue by major customer type For the year ended 31 March
‘Other’ does not contain any customers with revenue in excess of 10% of total Group revenue.
The following table shows the aggregate amount of revenue allocated to performance obligations that are unsatisfied (or partially satisfied) as at the end of the reporting period:
Management expects that 27% (£800.5m) of revenue allocated to unsatisfied contracts as of 31 March 2021 will be recognised as revenue during the next reporting period.
The following table shows the aggregate amount of revenue allocated to performance obligations that were unsatisfied (or partially satisfied) as at the end of the prior reporting period:
Revenue of £144m was recognised during the year that was previously unrecognised as at the previous year end and reported as a contract liability.
3. Segmental analysis
The analysis by business segment is presented in accordance with IFRS 8 Operating Segments, on the basis of those reportable segments whose operating results are regularly reviewed by the Board (the Chief Operating Decision Maker as defined by IFRS 8) and are aligned with the Group’s strategic direction, determined with reference to the products and services they provide, as follows:
EMEA Services provides technical assurance, test and evaluation and training services, underpinned by long-term contracts. EMEA Services comprises the following business units which are not considered reportable segments as defined by IFRS 8: Maritime & Land; Air & Space, Cyber & Information and the International business.
Global Products combines all other business units not aggregated within EMEA Services, including the QinetiQ US business, Space Products and EMEA Products (which includes QinetiQ Target Systems). Generally these business units (which are not considered reportable segments as defined by IFRS 8) deliver innovative solutions and products which includes contract-funded research and development and developing intellectual property in partnership with key customers and through internal funding with potential for new revenue streams.
Operating segments
1 The measure of profit presented to the Chief Operating Decision Maker is operating profit stated before specific adjusting items (‘underlying operating profit’). The specific adjusting items are detailed in note 4.
2 Definitions of the Group’s ‘Alternative performance measures’ can be found in the glossary on page 183.
No measure of segmental assets and liabilities is reported as this information is not regularly provided to the Chief Operating Decision Maker.
All figures in £ million 2021 2020
UK government 794.6 667.2
US government 140.8 116.2
Other 342.8 289.5
Total revenue 1,278.2 1,072.9
All figures in £ million 2022 2023 2024 2025+ Total
Total forecast revenue allocated to unsatisfied performance obligations 800.5 523.9 395.9 1,223.8 2,944.1
All figures in £ million 2021 2022 2023 2024+ Total
Total forecast revenue allocated to unsatisfied performance obligations 849.3 484.9 375.5 1,395.2 3,104.9
2021 2020
All figures in £ million
Revenue from
external customers
Underlying operating
profit1
Revenue from
external customers
Underlying operating
profit1
EMEA Services 939.9 118.6 797.4 100.6
Global Products 338.3 33.2 275.5 32.6
Total operating segments 1,278.2 151.8 1,072.9 133.2
Underlying operating margin2 11.9% 12.4%
Notes to the Financial Statements continued
QinetiQ Group plc Annual Report and Accounts 2021 139
Financial Statements
12. Business combinations
Acquisitions in the year to 31 March 2021
1 Acquisition of remaining 15% of Inzpire Group Limited. An 85% shareholding was obtained in a prior year. 2 Additional consideration paid, due to final working capital adjustments, in respect of the prior year acquisition of Newman & Spurr Consultancy Limited. 3 Acquisition-related costs of £1.0m that were not directly attributable to the issue of shares are included as part of the specific adjusting items in other operating costs excluding depreciation and amortisation in the statement of comprehensive income and in operating cash flows in the statement of cash flows (note 4).
Naimuri Limited (‘Naimuri’) On 13 July 2020 the Group acquired 100% of the issued share capital of Naimuri for £28.4m (£24.4m net of cash acquired). Naimuri is a leading software development and data analytics company, providing agile cloud-based services and technology to the UK Intelligence and Law Enforcement communities. QinetiQ partners with Naimuri on several critical programmes and delivering mission-led innovation around data-intensive challenges and will invest and build upon Naimuri’s strong capabilities in data analytics, data intelligence and agile software development to meet customer needs and drive growth in both the security and defence sectors. Naimuri is reported in EMEA Services, within the Cyber & Information business. If the acquisition had occurred on the first day of the financial year, Group revenue for the period would have been £1,281.1m and the Group profit before tax would have been £146.8m.
Identifiable assets acquired and liabilities assumed The following table summarises the recognised amounts of assets acquired and liabilities assumed at the date of acquisition and the adjustments required to the book values of the assets and liabilities in order to present the net assets of these businesses at fair value and in accordance with Group accounting policies. The fair values remain provisional, but will be finalised within 12 months of acquisition.
The consideration of £28.4m was satisfied entirely in cash in the financial period, with no deferred consideration. The fair value adjustments include £11.2m in relation to the recognition of acquired intangible assets of which £9.3m relates to customer relationships and £1.9m relates to existing technology. The goodwill is attributable mainly to the skills and technical talent of the Naimuri work force and the synergies expected to be achieved from integrating the company into the Group’s existing business.
13. Gain on business divestments
The gain on business divestments relates to the sale of the Boldon James, Commerce Decisions and OptaSense businesses for an aggregate consideration of £60.5m. Proceeds received in the period, net of transaction costs and £14.7m of cash divested, were £54.4m. Deferred consideration of £1.5m, contingent on performance of the disposed business in the year to 31 March 2022, is receivable as at 31 March 2021 in respect of the Commerce Decisions disposal, the fair value of which has been estimated at £0.9m. All consideration is settled in cash.
Contribution post-acquisition
All figures in £ million Date
acquired Cash
consideration Goodwill
Fair value of net assets
acquired Revenue Operating
profit
Naimuri Limited 13 July 2020 28.4 (14.8) 13.6 7.6 1.8
Inzpire Group Limited1 3.9
Less: cash acquired within Naimuri Limited (4.0)
Total current year acquisitions 28.3 (14.8) 13.6 7.6 1.8
Prior year acquisitions
Newman & Spurr Consultancy Limited2 0.2
Net cash outflow in the year3 28.5
All figures in £ million Note
Book
value Fair value
adjustment Fair value at
acquisition
Intangible assets 15 – 11.2 11.2
Property, plant and equipment 16 1.6 – 1.6
Trade and other receivables 2.0 – 2.0
Cash and cash equivalents 4.0 – 4.0
Trade and other payables (1.3) – (1.3)
Lease liabilities (1.3) – (1.3)
Corporation tax (0.5) – (0.5)
Deferred tax liabilities 18 – (2.1) (2.1)
Net assets acquired 4.5 9.1 13.6
Goodwill 14 14.8
Total consideration 28.4
All figures in £ million 2021 2020
Boldon James business (comprising Boldon James Limited) 19.3 –
Commerce Decisions business (comprising Commerce Decisions Limited and Commerce Decisions Pty Ltd) 1.6 –
OptaSense business (comprising OptaSense Holdings Limited and subsidiary companies) 7.5 –
Gain on business divestments 28.4 ––
139Annual Report & Accounts 2021
Financial Statements

Notes to the Financial Statements For the year ended 31 March
QinetiQ Group plc Annual Report and Accounts 2021 132
1. Significant changes in the current reporting period
The financial position and performance of the Group was particularly affected by the following events and transactions during the reporting period:
1) The acquisition of Naimuri Limited (see note 12) which resulted in an increase in goodwill (note 14) and other intangible assets (note 15);
2) The divestment of the Boldon James, Commerce Decisions and OptaSense businesses (see note 13); 3) An impairment of goodwill in respect of the Germany business (see note 14).
For a detailed discussion of the Group’s performance and financial position refer to the Strategic Report on pages 2 to 51.
2. Revenue from contracts with customers and other income
Revenue and other income is analysed as follows:
Revenue by category and other income For the year ended 31 March
1 For the period of which there was no contribution in the equivalent period in the comparator year which was pre-ownership (for acquisitions) or post-ownership (for disposals) by the Group
2 Alternative performance measures are used to supplement the statutory figures. See page 183.
Other income
Revenue and profit after tax of associates and joint ventures was £12.6m and £1.1m respectively (2020: revenue of £18.1m and loss after tax of £1.5m). The figures in the table above represent the Group share of this profit after tax.
Other income is in respect of property rentals and the recovery of other related property costs.
Revenue by customer geographic location For the year ended 31 March
All figures in £ million 2021 2020
Services contracts with customers 1,189.4 945.6
Sale of goods contracts with customers 83.0 116.8
Royalties and licences 5.8 10.5
Total revenue 1,278.2 1,072.9
Less: adjust current year for acquired businesses1 (117.2) –
Less: adjust prior year for disposed businesses1 – (17.2)
Adjust to constant prior year exchange rates 2.2 –
Total revenue on an organic, constant currency basis2 1,163.2 1,055.7
Organic revenue growth at constant currency2 10% 10%
All figures in £ million 2021 2020
Share of associates’ and joint ventures’ profit/(loss) after tax 0.7 (0.7)
Other income 9.2 9.9
Other income – underlying 9.9 9.2
Specific adjusting item: gain on sale of property (note 4) 0.1 14.0
Total other income 10.0 23.2
All figures in £ million 2021 2020
US 215.6 136.0
Australia 77.9 60.7
Europe 88.2 75.9
Middle east 9.8 16.3
Rest of world 28.9 44.5
International 420.4 333.4
United Kingdom 857.8 739.5
Total revenue 1,278.2 1,072.9
International revenue % 33% 31%
Revenue from ‘home countries’ (UK, US and Australia) 1,151.3 936.2
Home countries revenue % 90% 87%
Notes to the Financial Statements For the year ended 31 March
QinetiQ Group plc Annual Report and Accounts 2021 132
1. Significant changes in the current reporting period
The financial position and performance of the Group was particularly affected by the following events and transactions during the reporting period:
1) The acquisition of Naimuri Limited (see note 12) which resulted in an increase in goodwill (note 14) and other intangible assets (note 15);
2) The divestment of the Boldon James, Commerce Decisions and OptaSense businesses (see note 13); 3) An impairment of goodwill in respect of the Germany business (see note 14).
For a detailed discussion of the Group’s performance and financial position refer to the Strategic Report on pages 2 to 51.
2. Revenue from contracts with customers and other income
Revenue and other income is analysed as follows:
Revenue by category and other income For the year ended 31 March
1 For the period of which there was no contribution in the equivalent period in the comparator year which was pre-ownership (for acquisitions) or post-ownership (for disposals) by the Group
2 Alternative performance measures are used to supplement the statutory figures. See page 183.
Other income
Revenue and profit after tax of associates and joint ventures was £12.6m and £1.1m respectively (2020: revenue of £18.1m and loss after tax of £1.5m). The figures in the table above represent the Group share of this profit after tax.
Other income is in respect of property rentals and the recovery of other related property costs.
Revenue by customer geographic location For the year ended 31 March
All figures in £ million 2021 2020
Services contracts with customers 1,189.4 945.6
Sale of goods contracts with customers 83.0 116.8
Royalties and licences 5.8 10.5
Total revenue 1,278.2 1,072.9
Less: adjust current year for acquired businesses1 (117.2) –
Less: adjust prior year for disposed businesses1 – (17.2)
Adjust to constant prior year exchange rates 2.2 –
Total revenue on an organic, constant currency basis2 1,163.2 1,055.7
Organic revenue growth at constant currency2 10% 10%
All figures in £ million 2021 2020
Share of associates’ and joint ventures’ profit/(loss) after tax 0.7 (0.7)
Other income 9.2 9.9
Other income – underlying 9.9 9.2
Specific adjusting item: gain on sale of property (note 4) 0.1 14.0
Total other income 10.0 23.2
All figures in £ million 2021 2020
US 215.6 136.0
Australia 77.9 60.7
Europe 88.2 75.9
Middle east 9.8 16.3
Rest of world 28.9 44.5
International 420.4 333.4
United Kingdom 857.8 739.5
Total revenue 1,278.2 1,072.9
International revenue % 33% 31%
Revenue from ‘home countries’ (UK, US and Australia) 1,151.3 936.2
Home countries revenue % 90% 87%
140 QinetiQ Group plc

Notes to the Financial Statements continued
QinetiQ Group plc Annual Report and Accounts 2021 133
Financial Statements
Revenue by major customer type For the year ended 31 March
‘Other’ does not contain any customers with revenue in excess of 10% of total Group revenue.
The following table shows the aggregate amount of revenue allocated to performance obligations that are unsatisfied (or partially satisfied) as at the end of the reporting period:
Management expects that 27% (£800.5m) of revenue allocated to unsatisfied contracts as of 31 March 2021 will be recognised as revenue during the next reporting period.
The following table shows the aggregate amount of revenue allocated to performance obligations that were unsatisfied (or partially satisfied) as at the end of the prior reporting period:
Revenue of £144m was recognised during the year that was previously unrecognised as at the previous year end and reported as a contract liability.
3. Segmental analysis
The analysis by business segment is presented in accordance with IFRS 8 Operating Segments, on the basis of those reportable segments whose operating results are regularly reviewed by the Board (the Chief Operating Decision Maker as defined by IFRS 8) and are aligned with the Group’s strategic direction, determined with reference to the products and services they provide, as follows:
EMEA Services provides technical assurance, test and evaluation and training services, underpinned by long-term contracts. EMEA Services comprises the following business units which are not considered reportable segments as defined by IFRS 8: Maritime & Land; Air & Space, Cyber & Information and the International business.
Global Products combines all other business units not aggregated within EMEA Services, including the QinetiQ US business, Space Products and EMEA Products (which includes QinetiQ Target Systems). Generally these business units (which are not considered reportable segments as defined by IFRS 8) deliver innovative solutions and products which includes contract-funded research and development and developing intellectual property in partnership with key customers and through internal funding with potential for new revenue streams.
Operating segments
1 The measure of profit presented to the Chief Operating Decision Maker is operating profit stated before specific adjusting items (‘underlying operating profit’). The specific adjusting items are detailed in note 4.
2 Definitions of the Group’s ‘Alternative performance measures’ can be found in the glossary on page 183.
No measure of segmental assets and liabilities is reported as this information is not regularly provided to the Chief Operating Decision Maker.
All figures in £ million 2021 2020
UK government 794.6 667.2
US government 140.8 116.2
Other 342.8 289.5
Total revenue 1,278.2 1,072.9
All figures in £ million 2022 2023 2024 2025+ Total
Total forecast revenue allocated to unsatisfied performance obligations 800.5 523.9 395.9 1,223.8 2,944.1
All figures in £ million 2021 2022 2023 2024+ Total
Total forecast revenue allocated to unsatisfied performance obligations 849.3 484.9 375.5 1,395.2 3,104.9
2021 2020
All figures in £ million
Revenue from
external customers
Underlying operating
profit1
Revenue from
external customers
Underlying operating
profit1
EMEA Services 939.9 118.6 797.4 100.6
Global Products 338.3 33.2 275.5 32.6
Total operating segments 1,278.2 151.8 1,072.9 133.2
Underlying operating margin2 11.9% 12.4%
Notes to the Financial Statements continued
QinetiQ Group plc Annual Report and Accounts 2021 141
Financial Statements
Terminal growth rates and discount rates The specific plans for each of the CGUs have been extrapolated using the terminal growth rates as detailed below. Growth rates are based on management’s estimates which take into consideration the long-term nature of the industry in which the CGUs operate and external forecasts as to the likely growth of the industry in the longer term. The Group’s weighted average cost of capital was used as a basis in determining the discount rate to be applied, adjusted for risks specific to the market characteristics of CGUs, as appropriate on a pre-tax basis. This is considered an appropriate estimate of a market participant discount rate.
The value of the terminal year cash flow, the discount rate and the terminal growth rates have a significant impact on the value of the discounted cash flow. Sensitivities are provided below for each of the significant CGUs.
Significant CGUs QinetiQ North America (QNA) The carrying value of the goodwill for the QNA CGU was £39.6m as at 31 March 2021 (2020: £43.9m). The recoverable amount of this CGU as at 31 March 2021, based on value in use and calculated using the assumptions noted above, is higher than the carrying value of net operating assets (of £94.3m). The key sensitivity impacting on the value in use calculations is the terminal year cash flows. These cash flows include certain assumptions around growth of new product lines and the success of winning certain government contracts. An increase in the discount rate by 1%, a decrease in the terminal growth rate by 1% or a decrease in the terminal year cash flows of £2.0m would not cause the net operating assets to exceed their recoverable amount.
MTEQ The carrying value of the goodwill for the MTEQ CGU as at 31 March 2021 was £33.0m (2020: £36.6m). The recoverable amount of this CGU as at 31 March 2021, based on value in use and calculated using the assumptions noted above, is higher than the carrying value of net operating assets (of £92.7m). The key sensitivity impacting on the value in use calculations is the terminal year cash flows. An increase in the discount rate by 1%, a decrease in the terminal growth rate by 1% or a decrease in the terminal year cash flows of £2.0m would not cause the net operating assets to exceed their recoverable amount. Target Systems The carrying value of the goodwill for the Target Systems CGU as at 31 March 2021 was £24.3m (2020: £24.2m). The recoverable amount of this CGU as at 31 March 2021, based on value in use and calculated using the assumptions noted above, is higher than the carrying value of net operating assets (of £100.2m). The key sensitivity impacting on the value in use calculations is the terminal year cash flows. An increase in the discount rate by 1%, a decrease in the terminal growth rate by 1% or a decrease in the terminal year cash flows of £2.0m would not cause the net operating assets to exceed their recoverable amount. COVID-19 had resulted in temporary closure of this businesses’ manufacturing site. This short-term impact on trading is not considered to have a significant impact on the long-term cash flows of this CGU.
Germany The carrying value of the goodwill for the Germany CGU as at 31 March 2021 was £2.7m (2020: £28.7m). The reduction results from an impairment of £25.4m in the year following a reduction in the value in use, calculated using the assumptions noted above. Our German operations performed below expectations for orders, revenue, profit and cash flow in the year with some key contract losses during the year. These contract losses have a knock-on impact for future years’ profitability and cash flow and hence a further impairment (following on from a £4.3m impairment in the prior year) was required. Following a detailed review of the business’s current pipeline and assessing numerous other variables, an impairment of £25.4m has been recognised in the current year. The key sensitivity impacting on the value in use calculations is the terminal year cash flows. An increase in the discount rate by 1%, a decrease in the terminal growth rate by 1% or a decrease in the terminal year cash flows of £2.0m would have increased the impairment charge by £5.1m, £3.9m and £20.4m respectively. Such a level of incremental impairment would fully erode the residual carrying value of goodwill and require impairment of an element of the Germany CGU’s £29.5m carrying value of acquisition-related intangible assets. Inzpire The carrying value of the goodwill for the Inzpire CGU as at 31 March 2021 was £11.7m (2020: £11.7m). The key sensitivity impacting on the value in use calculations is the terminal year cash flows. An increase in the discount rate by 1%, a decrease in the terminal growth rate by 1% or a decrease in the terminal year cash flows of £1.0m would not cause the net operating assets to exceed their recoverable amount. Naimuri The carrying value of the goodwill for the Naimuri CGU as at 31 March 2021 was £14.8m (2020: nil). The key sensitivity impacting on the
value in use calculations is the terminal year cash flows. An increase in the discount rate by 1%, a decrease in the terminal growth rate by
1% or a decrease in the terminal year cash flows of £2.0m would not cause the net operating assets to exceed their recoverable amount.
All figures %
2021: (2020)
QNA Target Systems
Space NV MTEQ Inzpire Australia QinetiQ Germany
NSC Naimuri
Terminal growth rate 2.1 (2.1) 1.7 (1.8) 1.7 (1.8) 2.1 (2.1) 1.7 (1.8) 2.3 (2.3) 1.5 (1.5) 1.7 (1.8) 1.7 (N/A)
Pre-tax discount rate 11.3 (11.3) 12.2 (10.2) 11.9 (9.8) 11.3 (11.3) 12.8 (11.3) 10.0 (10.0) 9.3 (8.7) 12.3 (10.3) 12.2 (N/A)
141Annual Report & Accounts 2021
Financial Statements

Notes to the Financial Statements For the year ended 31 March
QinetiQ Group plc Annual Report and Accounts 2021 132
1. Significant changes in the current reporting period
The financial position and performance of the Group was particularly affected by the following events and transactions during the reporting period:
1) The acquisition of Naimuri Limited (see note 12) which resulted in an increase in goodwill (note 14) and other intangible assets (note 15);
2) The divestment of the Boldon James, Commerce Decisions and OptaSense businesses (see note 13); 3) An impairment of goodwill in respect of the Germany business (see note 14).
For a detailed discussion of the Group’s performance and financial position refer to the Strategic Report on pages 2 to 51.
2. Revenue from contracts with customers and other income
Revenue and other income is analysed as follows:
Revenue by category and other income For the year ended 31 March
1 For the period of which there was no contribution in the equivalent period in the comparator year which was pre-ownership (for acquisitions) or post-ownership (for disposals) by the Group
2 Alternative performance measures are used to supplement the statutory figures. See page 183.
Other income
Revenue and profit after tax of associates and joint ventures was £12.6m and £1.1m respectively (2020: revenue of £18.1m and loss after tax of £1.5m). The figures in the table above represent the Group share of this profit after tax.
Other income is in respect of property rentals and the recovery of other related property costs.
Revenue by customer geographic location For the year ended 31 March
All figures in £ million 2021 2020
Services contracts with customers 1,189.4 945.6
Sale of goods contracts with customers 83.0 116.8
Royalties and licences 5.8 10.5
Total revenue 1,278.2 1,072.9
Less: adjust current year for acquired businesses1 (117.2) –
Less: adjust prior year for disposed businesses1 – (17.2)
Adjust to constant prior year exchange rates 2.2 –
Total revenue on an organic, constant currency basis2 1,163.2 1,055.7
Organic revenue growth at constant currency2 10% 10%
All figures in £ million 2021 2020
Share of associates’ and joint ventures’ profit/(loss) after tax 0.7 (0.7)
Other income 9.2 9.9
Other income – underlying 9.9 9.2
Specific adjusting item: gain on sale of property (note 4) 0.1 14.0
Total other income 10.0 23.2
All figures in £ million 2021 2020
US 215.6 136.0
Australia 77.9 60.7
Europe 88.2 75.9
Middle east 9.8 16.3
Rest of world 28.9 44.5
International 420.4 333.4
United Kingdom 857.8 739.5
Total revenue 1,278.2 1,072.9
International revenue % 33% 31%
Revenue from ‘home countries’ (UK, US and Australia) 1,151.3 936.2
Home countries revenue % 90% 87%
Notes to the Financial Statements For the year ended 31 March
QinetiQ Group plc Annual Report and Accounts 2021 142
15. Intangible assets
For the year ended 31 March 2021
^ Includes Assets In Course Of Construction of closing net book value of £12.1m (2020: £14.4m) * Additions per the table above are lower than the capital expenditure included in the cash flow statement due to the relative timing of cash payments compared to the
recognition of balance sheet assets
‘Other’ consists primarily of intellectual property and existing technology arising on acquisition of businesses. Significant individual assets include: customer relationships associated with MTEQ, Germany and NSC (£16.6m; £25.5m; £3.7m respectively) with remaining amortisation period of approximately 8.8 years, 11.2 years, 9.8 years respectively and acquired technology associated with MTEQ, Germany, and NSC (£14.3m; £4.3m; £2.3m respectively) with remaining amortisation period of approximately 8.8 years, 8.5 years and 8.8 years respectively.
For the year ended 31 March 2020
^ Includes Assets In Course Of Construction with net book value at 31 March 2020 of £14.4m.
Acquired intangibles
All figures in £ million Customer
relationships Other Development
costs Other
intangibles^ Total
Cost
At 1 April 2020 117.5 98.7 27.4 68.2 311.8
Reclassifications from PPE – – – 0.1 0.1
Reclassifications – (2.5) 8.5 (6.0) –
Additions – internally developed* – – 2.5 5.3 7.8
Additions – purchased* – – 0.1 6.4 6.5
Additions – recognised on acquisition 9.3 1.9 – – 11.2
Business divestments (8.9) (9.0) (10.3) (12.1) (40.3)
Foreign exchange (5.4) (6.3) – (0.9) (12.6)
At 31 March 2021 112.5 82.8 28.2 61.0 284.5
Accumulated amortisation and impairment
At 1 April 2020 (44.4) (63.8) (21.6) (43.1) (172.9)
Amortisation charge for year (7.7) (3.2) (2.4) (2.3) (15.6)
Reclassifications – 0.7 (0.9) 0.2 –
Business divestments 8.9 7.7 8.1 10.9 35.6
Foreign exchange 3.1 4.2 – 0.3 7.6
At 31 March 2021 (40.1) (54.4) (16.8) (34.0) (145.3)
Net book value at 31 March 2021 72.4 28.4 11.4 27.0 139.2
Acquired intangibles
All figures in £ million Customer
relationships Other Development
costs Other
intangibles^ Total
Cost
At 1 April 2019 90.2 76.0 25.8 52.3 244.3
Reclassifications from PPE – – 0.1 0.2 0.3
Reclassifications – – 0.4 (0.4) –
Additions – internally developed – – 0.7 8.0 8.7
Additions – purchased – – 0.2 5.2 5.4
Additions – recognised on acquisition 24.5 20.3 0.7 – 45.5
Foreign exchange 2.8 2.4 (0.5) 2.9 7.6
At 31 March 2020 117.5 98.7 27.4 68.2 311.8
Accumulated amortisation and impairment
At 1 April 2019 (38.4) (59.5) (20.6) (37.3) (155.8)
Amortisation charge for year (5.3) (2.2) (1.4) (2.9) (11.8)
Foreign exchange (0.7) (2.1) 0.4 (2.9) (5.3)
At 31 March 2020 (44.4) (63.8) (21.6) (43.1) (172.9)
Net book value at 31 March 2020 73.1 34.9 5.8 25.1 138.9
142 QinetiQ Group plc

Notes to the Financial Statements continued
QinetiQ Group plc Annual Report and Accounts 2021 133
Financial Statements
Revenue by major customer type For the year ended 31 March
‘Other’ does not contain any customers with revenue in excess of 10% of total Group revenue.
The following table shows the aggregate amount of revenue allocated to performance obligations that are unsatisfied (or partially satisfied) as at the end of the reporting period:
Management expects that 27% (£800.5m) of revenue allocated to unsatisfied contracts as of 31 March 2021 will be recognised as revenue during the next reporting period.
The following table shows the aggregate amount of revenue allocated to performance obligations that were unsatisfied (or partially satisfied) as at the end of the prior reporting period:
Revenue of £144m was recognised during the year that was previously unrecognised as at the previous year end and reported as a contract liability.
3. Segmental analysis
The analysis by business segment is presented in accordance with IFRS 8 Operating Segments, on the basis of those reportable segments whose operating results are regularly reviewed by the Board (the Chief Operating Decision Maker as defined by IFRS 8) and are aligned with the Group’s strategic direction, determined with reference to the products and services they provide, as follows:
EMEA Services provides technical assurance, test and evaluation and training services, underpinned by long-term contracts. EMEA Services comprises the following business units which are not considered reportable segments as defined by IFRS 8: Maritime & Land; Air & Space, Cyber & Information and the International business.
Global Products combines all other business units not aggregated within EMEA Services, including the QinetiQ US business, Space Products and EMEA Products (which includes QinetiQ Target Systems). Generally these business units (which are not considered reportable segments as defined by IFRS 8) deliver innovative solutions and products which includes contract-funded research and development and developing intellectual property in partnership with key customers and through internal funding with potential for new revenue streams.
Operating segments
1 The measure of profit presented to the Chief Operating Decision Maker is operating profit stated before specific adjusting items (‘underlying operating profit’). The specific adjusting items are detailed in note 4.
2 Definitions of the Group’s ‘Alternative performance measures’ can be found in the glossary on page 183.
No measure of segmental assets and liabilities is reported as this information is not regularly provided to the Chief Operating Decision Maker.
All figures in £ million 2021 2020
UK government 794.6 667.2
US government 140.8 116.2
Other 342.8 289.5
Total revenue 1,278.2 1,072.9
All figures in £ million 2022 2023 2024 2025+ Total
Total forecast revenue allocated to unsatisfied performance obligations 800.5 523.9 395.9 1,223.8 2,944.1
All figures in £ million 2021 2022 2023 2024+ Total
Total forecast revenue allocated to unsatisfied performance obligations 849.3 484.9 375.5 1,395.2 3,104.9
2021 2020
All figures in £ million
Revenue from
external customers
Underlying operating
profit1
Revenue from
external customers
Underlying operating
profit1
EMEA Services 939.9 118.6 797.4 100.6
Global Products 338.3 33.2 275.5 32.6
Total operating segments 1,278.2 151.8 1,072.9 133.2
Underlying operating margin2 11.9% 12.4%
QinetiQ Group plc Annual Report and Accounts 2021 143
Financial Statements
Notes to the Financial Statements continued
16. Property, plant and equipmentFor the year ended 31 March 2021
* Additions per the table above are higher than the capital expenditure included in the cash flow statement due to the relative timing of cash payments compared to therecognition of balance sheet assets
For the year ended 31 March 2020 Owned assets Right of use assets
All figures in £ million Land and buildings
Plant, machinery
and vehicles
Computers and office equipment
Assets under construction
Land and buildings
Plant, machinery
and vehicles
Computers and office equipment Total
Cost At 1 April 2019 306.9 237.2 62.9 53.4 56.6 15.7 0.4 733.1 Additions – purchased 8.1 16.6 2.1 58.6 1.0 3.0 – 89.4 Additions – recognised on acquisition 0.8 0.7 – – 2.5 – – 4.0 Reclassifications to intangibles – – – (0.3) – – – (0.3) Reclassifications/transfers 9.6 10.3 7.2 (27.1) – – – – Disposals – (1.4) (1.8) – (4.2) (1.2) – (8.6) Foreign exchange 0.2 0.8 0.1 – 0.2 0.1 – 1.4 At 31 March 2020 325.6 264.2 70.5 84.6 56.1 17.6 0.4 819.0
Accumulated depreciation and impairment At 1 April 2019 (174.0) (155.6) (35.3) – (35.7) (9.1) (0.2) (409.9) Charge for year (9.7) (13.2) (8.8) – (5.1) (4.5) (0.1) (41.4) Impairment reversal – 0.4 – – – – – 0.4 Disposals – 1.4 1.8 – 4.2 1.2 – 8.6 Foreign exchange (0.2) (0.8) (0.1) – – – – (1.1) At 31 March 2020 (183.9) (167.8) (42.4) – (36.6) (12.4) (0.3) (443.4)
Net book value at 31 March 2020 141.7 96.4 28.1 84.6 19.5 5.2 0.1 375.6
Owned assets Right of use assets
All figures in £ million Land and buildings
Plant, machinery
and vehicles
Computers and office equipment
Assets under construction
Land and buildings
Plant, machinery
and vehicles
Computers and office equipment Total
Cost At 1 April 2020 325.6 264.2 70.5 84.6 56.1 17.6 0.4 819.0 Reclassifications to intangibles – – – (0.1) – – – (0.1) Reclassifications/transfers 19.8 10.0 13.9 (43.7) – – – – Additions – purchased* 11.0 8.9 5.8 36.7 11.1 – – 73.5 Additions - recognised on acquisition 0.1 0.2 0.1 – 1.2 – – 1.6 Disposals (1.7) (26.7) (5.0) (0.3) (5.5) (0.3) – (39.5) Business divestments (0.3) (5.6) (3.1) – (4.8) – – (13.8) Foreign exchange (0.7) (2.1) (0.3) (0.3) (3.3) (0.4) – (7.1) At 31 March 2021 353.8 248.9 81.9 76.9 54.8 16.9 0.4 833.6
Accumulated depreciation and impairment At 1 April 2020 (183.9) (167.8) (42.4) – (36.6) (12.4) (0.3) (443.4) Charge (12.0) (15.5) (9.7) – (5.6) (2.7) (0.1) (45.6) Disposals 1.7 26.2 4.9 – 4.1 0.2 – 37.1 Business divestments 0.3 4.7 2.9 – 3.1 – – 11.0 Impairment (0.5) – – – – – – (0.5) Foreign exchange 0.6 1.6 0.3 – 2.0 0.5 – 5.0 At 31 March 2021 (193.8) (150.8) (44.0) – (33.0) (14.4) (0.4) (436.4)
Opening net book value 141.7 96.4 28.1 84.6 19.5 5.2 0.1 375.6
Closing Net Book value 160.0 98.1 37.9 76.9 21.8 2.5 –– 397.2
143Annual Report & Accounts 2021
Financial Statements

Notes to the Financial Statements For the year ended 31 March
QinetiQ Group plc Annual Report and Accounts 2021 132
1. Significant changes in the current reporting period
The financial position and performance of the Group was particularly affected by the following events and transactions during the reporting period:
1) The acquisition of Naimuri Limited (see note 12) which resulted in an increase in goodwill (note 14) and other intangible assets (note 15);
2) The divestment of the Boldon James, Commerce Decisions and OptaSense businesses (see note 13); 3) An impairment of goodwill in respect of the Germany business (see note 14).
For a detailed discussion of the Group’s performance and financial position refer to the Strategic Report on pages 2 to 51.
2. Revenue from contracts with customers and other income
Revenue and other income is analysed as follows:
Revenue by category and other income For the year ended 31 March
1 For the period of which there was no contribution in the equivalent period in the comparator year which was pre-ownership (for acquisitions) or post-ownership (for disposals) by the Group
2 Alternative performance measures are used to supplement the statutory figures. See page 183.
Other income
Revenue and profit after tax of associates and joint ventures was £12.6m and £1.1m respectively (2020: revenue of £18.1m and loss after tax of £1.5m). The figures in the table above represent the Group share of this profit after tax.
Other income is in respect of property rentals and the recovery of other related property costs.
Revenue by customer geographic location For the year ended 31 March
All figures in £ million 2021 2020
Services contracts with customers 1,189.4 945.6
Sale of goods contracts with customers 83.0 116.8
Royalties and licences 5.8 10.5
Total revenue 1,278.2 1,072.9
Less: adjust current year for acquired businesses1 (117.2) –
Less: adjust prior year for disposed businesses1 – (17.2)
Adjust to constant prior year exchange rates 2.2 –
Total revenue on an organic, constant currency basis2 1,163.2 1,055.7
Organic revenue growth at constant currency2 10% 10%
All figures in £ million 2021 2020
Share of associates’ and joint ventures’ profit/(loss) after tax 0.7 (0.7)
Other income 9.2 9.9
Other income – underlying 9.9 9.2
Specific adjusting item: gain on sale of property (note 4) 0.1 14.0
Total other income 10.0 23.2
All figures in £ million 2021 2020
US 215.6 136.0
Australia 77.9 60.7
Europe 88.2 75.9
Middle east 9.8 16.3
Rest of world 28.9 44.5
International 420.4 333.4
United Kingdom 857.8 739.5
Total revenue 1,278.2 1,072.9
International revenue % 33% 31%
Revenue from ‘home countries’ (UK, US and Australia) 1,151.3 936.2
Home countries revenue % 90% 87%
Notes to the Financial Statements For the year ended 31 March
QinetiQ Group plc Annual Report and Accounts 2021 144
17. Equity accounted investments
As at 31 March
During the year the Group sold a share of an investment in a middle-east joint venture for a gain of £0.3m.
18. Deferred tax
For the year ended 31 March 2021 Deferred tax asset
Deferred tax liability
Deferred tax has been calculated at the rate at which the timing difference is expected to reverse using the enacted future statutory rates.
Deferred tax assets and liabilities are offset where there is a legally enforceable right to offset current tax assets and liabilities and where the deferred tax balances relate to the same taxation authority. Deferred tax has been calculated using the enacted future statutory tax rates. To provide additional information at the end of the period, various items have been reclassified out of short term timing differences as shown above. At 31 March 2021 the Group had unused tax losses and US carried forward interest expense of £73.2m (2020: £90.3m) which are available for offset against future taxable profits. Deferred tax assets are recognised on the balance sheet of £8.4m (2020: £7.8m) in respect of £35.9m (2020: £37.3m) of US net operating losses, £0.1m in respect of £0.5m of Canadian net operating losses and £1.4m (2020: £1.5m) in respect
2021 2020
All figures in £ million
JV’s and associates
financial results
Group net share of
JV’s and associates
JV’s and associates
financial results
Group net share of
JV’s and associates
Non-current assets 0.7 0.3 1.4 0.7
Current assets 12.9 6.5 23.3 11.3
13.6 6.8 24.7 12.0
Current liabilities (4.1) (2.0) (15.9) (7.4)
Non-current liabilities (1.3) (0.6) (2.0) (1.0)
(5.4) (2.6) (17.9) (8.4)
Net assets of joint ventures and associates 8.2 4.2 6.8 3.6
Net assets of joint ventures 1.0 0.8
Net assets of associate 3.2 2.8
Net assets of joint ventures and associates 4.2 3.6
All figures in £ million Intellectual
property
Short-term timing
differences
Carried forward interest
expense Lease
liabilities
Tax
losses Total
At 1 April 2020 0.3 15.6 – – 7.8 23.7
(Charged)/credited to income statement (0.1) (1.2) – – 1.3 –
Credited to other comprehensive income – 1.0 – – – 1.0
Credited to equity – 0.5 – – – 0.5
Transferred to current tax – (0.3) – – – (0.3)
Eliminated on disposal of businesses (0.2) – – – – (0.2)
Reclassification – (1.8) 1.4 5.1 – 4.7
Foreign exchange – (1.1) – – (0.6) (1.7)
Gross deferred tax asset at 31 March 2021 – 12.7 1.4 5.1 8.5 27.7
Less: liability available for offset (16.0)
Net deferred tax asset at 31 March 2021 11.7
All figures in £ million Pension surplus
Owned property,
plant & equipment
Right of use assets
Acquisition intangibles Total
At 1 April 2020 (63.8) (26.8) – (21.1) (111.7)
(Charged)/credited to income statement (1.5) (6.8) – 0.8 (7.5)
Credited to other comprehensive income 19.8 – – – 19.8
Acquired in business combination – – – (2.1) (2.1)
Reclassification – – (4.7) – (4.7)
Foreign exchange – 0.1 – 0.4 0.5
Gross deferred tax liability at 31 March 2021 (45.5) (33.5) (4.7) (22.0) (105.7)
Less: asset available for offset 16.0
Net deferred tax liability at 31 March 2021 (89.7)
144 QinetiQ Group plc

Notes to the Financial Statements continued
QinetiQ Group plc Annual Report and Accounts 2021 133
Financial Statements
Revenue by major customer type For the year ended 31 March
‘Other’ does not contain any customers with revenue in excess of 10% of total Group revenue.
The following table shows the aggregate amount of revenue allocated to performance obligations that are unsatisfied (or partially satisfied) as at the end of the reporting period:
Management expects that 27% (£800.5m) of revenue allocated to unsatisfied contracts as of 31 March 2021 will be recognised as revenue during the next reporting period.
The following table shows the aggregate amount of revenue allocated to performance obligations that were unsatisfied (or partially satisfied) as at the end of the prior reporting period:
Revenue of £144m was recognised during the year that was previously unrecognised as at the previous year end and reported as a contract liability.
3. Segmental analysis
The analysis by business segment is presented in accordance with IFRS 8 Operating Segments, on the basis of those reportable segments whose operating results are regularly reviewed by the Board (the Chief Operating Decision Maker as defined by IFRS 8) and are aligned with the Group’s strategic direction, determined with reference to the products and services they provide, as follows:
EMEA Services provides technical assurance, test and evaluation and training services, underpinned by long-term contracts. EMEA Services comprises the following business units which are not considered reportable segments as defined by IFRS 8: Maritime & Land; Air & Space, Cyber & Information and the International business.
Global Products combines all other business units not aggregated within EMEA Services, including the QinetiQ US business, Space Products and EMEA Products (which includes QinetiQ Target Systems). Generally these business units (which are not considered reportable segments as defined by IFRS 8) deliver innovative solutions and products which includes contract-funded research and development and developing intellectual property in partnership with key customers and through internal funding with potential for new revenue streams.
Operating segments
1 The measure of profit presented to the Chief Operating Decision Maker is operating profit stated before specific adjusting items (‘underlying operating profit’). The specific adjusting items are detailed in note 4.
2 Definitions of the Group’s ‘Alternative performance measures’ can be found in the glossary on page 183.
No measure of segmental assets and liabilities is reported as this information is not regularly provided to the Chief Operating Decision Maker.
All figures in £ million 2021 2020
UK government 794.6 667.2
US government 140.8 116.2
Other 342.8 289.5
Total revenue 1,278.2 1,072.9
All figures in £ million 2022 2023 2024 2025+ Total
Total forecast revenue allocated to unsatisfied performance obligations 800.5 523.9 395.9 1,223.8 2,944.1
All figures in £ million 2021 2022 2023 2024+ Total
Total forecast revenue allocated to unsatisfied performance obligations 849.3 484.9 375.5 1,395.2 3,104.9
2021 2020
All figures in £ million
Revenue from
external customers
Underlying operating
profit1
Revenue from
external customers
Underlying operating
profit1
EMEA Services 939.9 118.6 797.4 100.6
Global Products 338.3 33.2 275.5 32.6
Total operating segments 1,278.2 151.8 1,072.9 133.2
Underlying operating margin2 11.9% 12.4%
Notes to the Financial Statements continued
QinetiQ Group plc Annual Report and Accounts 2021 145
Financial Statements
of £5.2m (2020: £5.8m) of US carried forward interest expense. No deferred tax asset is recognised in respect of the remaining £31.6m (2020: £47.2m) of losses/carried forward interest expense due to uncertainty over the timing and extent of their utilisation. Full recognition of the remaining losses/interest would increase the deferred tax asset by £8.4m (2020: £12.2m). The Group has £29.1m (2020: £33.8m) of time-limited US net operating losses of which £20.5m (2020: £22.8m) will expire in 2035, £8.6m (2020: £9.5m) in 2036 and £nil (2020: £1.5m) in 2038.
There are no material temporary differences associated with investments in subsidiaries or interests in joint ventures for which deferred tax liabilities have not been recognised.
For the year ended 31 March 2020 Deferred tax asset
Deferred tax liability
19. Current tax As at 31 March
20. Inventories As at 31 March
The Naimuri business acquired in the year and the three businesses disposed in the year contributed a net £9.4m decrease in inventory compared to prior year, with organic performance contributing to a more than offsetting increase.
All figures in £ million Intellectual
property
Short-term timing
differences Tax
losses Total
At 1 April 2019 0.4 14.0 4.9 19.3 Adjustment for change in accounting policy – 0.4 – 0.4 Restated opening balance 0.4 14.4 4.9 19.7 (Charged)/credited to income statement (0.1) 3.7 2.8 6.4 Charged to equity – (0.8) – (0.8) Charged to other comprehensive income – (0.8) – (0.8) Transferred to current tax – (1.2) – (1.2) Acquired in business combinations – 0.1 – 0.1 Foreign exchange – 0.2 0.1 0.3 Gross deferred tax asset at 31 March 2020 0.3 15.6 7.8 23.7 Less: liability available for offset (10.4) Net deferred tax asset at 31 March 2020 13.3
All figures in £ million Pension surplus
Owned property,
plant and equipment
Acquired intangibles Total
At 1 April 2019 (48.6) (16.1) (19.9) (84.6) (Charged)/credited to income statement (2.5) (11.0) 0.2 (13.3) Charged to other comprehensive income (12.7) – – (12.7) Acquired in business combination – – (1.3) (1.3) Foreign exchange – 0.3 (0.1) 0.2 Gross deferred tax liability at 31 March 2020 (63.8) (26.8) (21.1) (111.7) Less: asset available for offset 10.4 Net deferred tax liability at 31 March 2020 (101.3)
All figures in £ million 2021 2020
Current tax receivable 0.7 0.2 Current tax payable (3.8) (4.1) Net current tax payable (3.1) (3.9)
All figures in £ million 2021 2020
Raw materials 36.0 27.7 Work in progress 5.6 9.0 Finished goods 12.8 15.6 Total inventory 54.4 52.3
145Annual Report & Accounts 2021
Financial Statements

Notes to the Financial Statements For the year ended 31 March
QinetiQ Group plc Annual Report and Accounts 2021 132
1. Significant changes in the current reporting period
The financial position and performance of the Group was particularly affected by the following events and transactions during the reporting period:
1) The acquisition of Naimuri Limited (see note 12) which resulted in an increase in goodwill (note 14) and other intangible assets (note 15);
2) The divestment of the Boldon James, Commerce Decisions and OptaSense businesses (see note 13); 3) An impairment of goodwill in respect of the Germany business (see note 14).
For a detailed discussion of the Group’s performance and financial position refer to the Strategic Report on pages 2 to 51.
2. Revenue from contracts with customers and other income
Revenue and other income is analysed as follows:
Revenue by category and other income For the year ended 31 March
1 For the period of which there was no contribution in the equivalent period in the comparator year which was pre-ownership (for acquisitions) or post-ownership (for disposals) by the Group
2 Alternative performance measures are used to supplement the statutory figures. See page 183.
Other income
Revenue and profit after tax of associates and joint ventures was £12.6m and £1.1m respectively (2020: revenue of £18.1m and loss after tax of £1.5m). The figures in the table above represent the Group share of this profit after tax.
Other income is in respect of property rentals and the recovery of other related property costs.
Revenue by customer geographic location For the year ended 31 March
All figures in £ million 2021 2020
Services contracts with customers 1,189.4 945.6
Sale of goods contracts with customers 83.0 116.8
Royalties and licences 5.8 10.5
Total revenue 1,278.2 1,072.9
Less: adjust current year for acquired businesses1 (117.2) –
Less: adjust prior year for disposed businesses1 – (17.2)
Adjust to constant prior year exchange rates 2.2 –
Total revenue on an organic, constant currency basis2 1,163.2 1,055.7
Organic revenue growth at constant currency2 10% 10%
All figures in £ million 2021 2020
Share of associates’ and joint ventures’ profit/(loss) after tax 0.7 (0.7)
Other income 9.2 9.9
Other income – underlying 9.9 9.2
Specific adjusting item: gain on sale of property (note 4) 0.1 14.0
Total other income 10.0 23.2
All figures in £ million 2021 2020
US 215.6 136.0
Australia 77.9 60.7
Europe 88.2 75.9
Middle east 9.8 16.3
Rest of world 28.9 44.5
International 420.4 333.4
United Kingdom 857.8 739.5
Total revenue 1,278.2 1,072.9
International revenue % 33% 31%
Revenue from ‘home countries’ (UK, US and Australia) 1,151.3 936.2
Home countries revenue % 90% 87%
Notes to the Financial Statements For the year ended 31 March
QinetiQ Group plc Annual Report and Accounts 2021 132
1. Significant changes in the current reporting period
The financial position and performance of the Group was particularly affected by the following events and transactions during the reporting period:
1) The acquisition of Naimuri Limited (see note 12) which resulted in an increase in goodwill (note 14) and other intangible assets (note 15);
2) The divestment of the Boldon James, Commerce Decisions and OptaSense businesses (see note 13); 3) An impairment of goodwill in respect of the Germany business (see note 14).
For a detailed discussion of the Group’s performance and financial position refer to the Strategic Report on pages 2 to 51.
2. Revenue from contracts with customers and other income
Revenue and other income is analysed as follows:
Revenue by category and other income For the year ended 31 March
1 For the period of which there was no contribution in the equivalent period in the comparator year which was pre-ownership (for acquisitions) or post-ownership (for disposals) by the Group
2 Alternative performance measures are used to supplement the statutory figures. See page 183.
Other income
Revenue and profit after tax of associates and joint ventures was £12.6m and £1.1m respectively (2020: revenue of £18.1m and loss after tax of £1.5m). The figures in the table above represent the Group share of this profit after tax.
Other income is in respect of property rentals and the recovery of other related property costs.
Revenue by customer geographic location For the year ended 31 March
All figures in £ million 2021 2020
Services contracts with customers 1,189.4 945.6
Sale of goods contracts with customers 83.0 116.8
Royalties and licences 5.8 10.5
Total revenue 1,278.2 1,072.9
Less: adjust current year for acquired businesses1 (117.2) –
Less: adjust prior year for disposed businesses1 – (17.2)
Adjust to constant prior year exchange rates 2.2 –
Total revenue on an organic, constant currency basis2 1,163.2 1,055.7
Organic revenue growth at constant currency2 10% 10%
All figures in £ million 2021 2020
Share of associates’ and joint ventures’ profit/(loss) after tax 0.7 (0.7)
Other income 9.2 9.9
Other income – underlying 9.9 9.2
Specific adjusting item: gain on sale of property (note 4) 0.1 14.0
Total other income 10.0 23.2
All figures in £ million 2021 2020
US 215.6 136.0
Australia 77.9 60.7
Europe 88.2 75.9
Middle east 9.8 16.3
Rest of world 28.9 44.5
International 420.4 333.4
United Kingdom 857.8 739.5
Total revenue 1,278.2 1,072.9
International revenue % 33% 31%
Revenue from ‘home countries’ (UK, US and Australia) 1,151.3 936.2
Home countries revenue % 90% 87%
QinetiQ Group plc Annual Report and Accounts 2021 146
Trade and other receivables includes assets that are realised as part of the business’s normal operating cycle, including amounts of £11.2m that are not expected to be realised within 12 months of the year end. In determining the recoverability of trade receivables, the Group considers any change in the credit quality of the trade receivable from the date credit was granted to the reporting date. Credit risk is limited as a result of the high percentage of revenue derived from UK and US government agencies. Accordingly, the Directors believe that no credit provision in excess of the allowance for doubtful debts is required. As at 31 March 2021 the Group carried a loss allowance in respect of expected credit risk of £3.6m (2020: £3.1m).
Contract assets represents unbilled amounts recoverable under customer contracts (refer to accounting policies note 36). The Naimuri business acquired in the year and the three businesses disposed in the year contributed a net £8.1m decrease in trade and other receivables compared to prior year, with organic performance contributing to a more than offsetting increase.
Ageing of receivables and associated loss allowance for expected credit risk
As at 31 March 2021
Movements in the provision for expected credit loss
The maximum exposure to credit risk in relation to trade and other receivables at the reporting date is the fair value of trade and other receivables. The Group does not hold any collateral as security.
22. Trade and other payablesAs at 31 March
Notes to the Financial Statements For the year ended 31 March
21. Trade and other receivablesAs at 31 March
All figures in £ million 2021 2020
Trade receivables 120.5 105.0 Contract assets 161.1 103.8 Other receivables 7.8 11.3 Prepayments 37.3 29.9 Total trade and other receivables 326.7 250.0
Current Up to 30 days past due
30-120 days past due
>120 days past due
Total
Gross carrying amount - trade receivables (£m) 98.5 10.7 11.9 3.0 124.1 Gross carrying amount - contract assets (£m) 161.1 – – – 161.1 Expected loss rate (%) 0.7% – 0.8% 53.3% 1.3% Loss allowance (£m) 1.9 – 0.1 1.6 3.6
All figures in £ million 2021 2020
Trade receivables
Contract assets
Trade receivables
Contract assets
At 1 April 3.1 – 1.2 – Increase in loss allowance recognised in income statement 1.4 1.8 2.2 – Unutilised amount reversed through income statement (2.3) – (0.3) – Utilised (receivables written off) (0.1) – – – Divestments (0.2) – – – Foreign exchange (0.1) – – – At 31 March 1.8 1.8 3.1 –
All figures in £ million 2021 2020
Trade payables 77.3 65.0 Other tax and social security 43.7 37.6 Contract liabilities 157.3 143.9 Accrued expenses and other payables 133.4 133.3 Total current trade and other payables 411.7 379.8 Contract liabilities 36.3 2.7 Other payables 15.7 22.6 Total non-current trade and other payables 52.0 25.3 Total trade and other payables 463.7 405.1
146 QinetiQ Group plc

Notes to the Financial Statements continued
QinetiQ Group plc Annual Report and Accounts 2021 133
Financial Statements
Revenue by major customer type For the year ended 31 March
‘Other’ does not contain any customers with revenue in excess of 10% of total Group revenue.
The following table shows the aggregate amount of revenue allocated to performance obligations that are unsatisfied (or partially satisfied) as at the end of the reporting period:
Management expects that 27% (£800.5m) of revenue allocated to unsatisfied contracts as of 31 March 2021 will be recognised as revenue during the next reporting period.
The following table shows the aggregate amount of revenue allocated to performance obligations that were unsatisfied (or partially satisfied) as at the end of the prior reporting period:
Revenue of £144m was recognised during the year that was previously unrecognised as at the previous year end and reported as a contract liability.
3. Segmental analysis
The analysis by business segment is presented in accordance with IFRS 8 Operating Segments, on the basis of those reportable segments whose operating results are regularly reviewed by the Board (the Chief Operating Decision Maker as defined by IFRS 8) and are aligned with the Group’s strategic direction, determined with reference to the products and services they provide, as follows:
EMEA Services provides technical assurance, test and evaluation and training services, underpinned by long-term contracts. EMEA Services comprises the following business units which are not considered reportable segments as defined by IFRS 8: Maritime & Land; Air & Space, Cyber & Information and the International business.
Global Products combines all other business units not aggregated within EMEA Services, including the QinetiQ US business, Space Products and EMEA Products (which includes QinetiQ Target Systems). Generally these business units (which are not considered reportable segments as defined by IFRS 8) deliver innovative solutions and products which includes contract-funded research and development and developing intellectual property in partnership with key customers and through internal funding with potential for new revenue streams.
Operating segments
1 The measure of profit presented to the Chief Operating Decision Maker is operating profit stated before specific adjusting items (‘underlying operating profit’). The specific adjusting items are detailed in note 4.
2 Definitions of the Group’s ‘Alternative performance measures’ can be found in the glossary on page 183.
No measure of segmental assets and liabilities is reported as this information is not regularly provided to the Chief Operating Decision Maker.
All figures in £ million 2021 2020
UK government 794.6 667.2
US government 140.8 116.2
Other 342.8 289.5
Total revenue 1,278.2 1,072.9
All figures in £ million 2022 2023 2024 2025+ Total
Total forecast revenue allocated to unsatisfied performance obligations 800.5 523.9 395.9 1,223.8 2,944.1
All figures in £ million 2021 2022 2023 2024+ Total
Total forecast revenue allocated to unsatisfied performance obligations 849.3 484.9 375.5 1,395.2 3,104.9
2021 2020
All figures in £ million
Revenue from
external customers
Underlying operating
profit1
Revenue from
external customers
Underlying operating
profit1
EMEA Services 939.9 118.6 797.4 100.6
Global Products 338.3 33.2 275.5 32.6
Total operating segments 1,278.2 151.8 1,072.9 133.2
Underlying operating margin2 11.9% 12.4%
Notes to the Financial Statements continued
QinetiQ Group plc Annual Report and Accounts 2021 147
Financial Statements
The Naimuri business acquired in the year and the three businesses disposed in the year contributed a net £13.4m decrease in trade and other payables compared to prior year, with organic performance contributing to a more than offsetting increase.
23. Provisions
For the year ended 31 March 2021
Property provisions relate to under-utilised properties in the UK. The extent of the provision is affected by the timing of when properties can be sub-let and the proportion of space that can be sub-let. Based on current assessment the provision will be utilised within 7 years.
Other provisions relate to a variety of liabilities, the magnitude and timing of utilisation of which are determined by a variety of factors.
24. Net cash
As at 31 March
At 31 March 2021 the Group held £5.6m (2020: £3.7m) of cash which is restricted in its use.
All figures in £ million Property Other Total
At 1 April 2020 8.1 3.4 11.5
Created in year 1.8 2.1 3.9
Released in year (0.7) (1.4) (2.1)
Unwind of discount 0.2 – 0.2
Utilised in year (1.4) (0.1) (1.5)
At 31 March 2021 8.0 4.0 12.0
Current liability 1.6 2.6 4.2
Non-current liability 6.4 1.4 7.8
At 31 March 2021 8.0 4.0 12.0
2021 2020
All figures in £ million Assets Liabilities Net Assets Liabilities Net
Current financial assets/(liabilities)
Deferred financing costs 0.4 – 0.4 0.4 – 0.4
Lease liabilities – (6.9) (6.9) – (8.6) (8.6)
Derivative financial instruments 0.5 (0.1) 0.4 6.3 (0.3) 6.0
Total current financial assets/(liabilities) 0.9 (7.0) (6.1) 6.7 (8.9) (2.2)
Non-current assets/(liabilities)
Deferred financing costs 0.8 – 0.8 0.9 – 0.9
Lease liabilities – (19.8) (19.8) – (19.3) (19.3)
Derivative financial instruments – (0.9) (0.9) 0.1 (0.6) (0.5)
Total non-current financial assets/(liabilities) 0.8 (20.7) (19.9) 1.0 (19.9) (18.9)
Total financial assets/(liabilities) 1.7 (27.7) (26.0) 7.7 (28.8) (21.1)
Cash 57.0 – 57.0 48.8 – 48.8
Cash equivalents 133.1 – 133.1 57.0 – 57.0
Total cash and cash equivalents 190.1 – 190.1 105.8 – 105.8
Total net cash as defined by the Group 164.1 84.7
147Annual Report & Accounts 2021
Financial Statements

Notes to the Financial Statements For the year ended 31 March
QinetiQ Group plc Annual Report and Accounts 2021 132
1. Significant changes in the current reporting period
The financial position and performance of the Group was particularly affected by the following events and transactions during the reporting period:
1) The acquisition of Naimuri Limited (see note 12) which resulted in an increase in goodwill (note 14) and other intangible assets (note 15);
2) The divestment of the Boldon James, Commerce Decisions and OptaSense businesses (see note 13); 3) An impairment of goodwill in respect of the Germany business (see note 14).
For a detailed discussion of the Group’s performance and financial position refer to the Strategic Report on pages 2 to 51.
2. Revenue from contracts with customers and other income
Revenue and other income is analysed as follows:
Revenue by category and other income For the year ended 31 March
1 For the period of which there was no contribution in the equivalent period in the comparator year which was pre-ownership (for acquisitions) or post-ownership (for disposals) by the Group
2 Alternative performance measures are used to supplement the statutory figures. See page 183.
Other income
Revenue and profit after tax of associates and joint ventures was £12.6m and £1.1m respectively (2020: revenue of £18.1m and loss after tax of £1.5m). The figures in the table above represent the Group share of this profit after tax.
Other income is in respect of property rentals and the recovery of other related property costs.
Revenue by customer geographic location For the year ended 31 March
All figures in £ million 2021 2020
Services contracts with customers 1,189.4 945.6
Sale of goods contracts with customers 83.0 116.8
Royalties and licences 5.8 10.5
Total revenue 1,278.2 1,072.9
Less: adjust current year for acquired businesses1 (117.2) –
Less: adjust prior year for disposed businesses1 – (17.2)
Adjust to constant prior year exchange rates 2.2 –
Total revenue on an organic, constant currency basis2 1,163.2 1,055.7
Organic revenue growth at constant currency2 10% 10%
All figures in £ million 2021 2020
Share of associates’ and joint ventures’ profit/(loss) after tax 0.7 (0.7)
Other income 9.2 9.9
Other income – underlying 9.9 9.2
Specific adjusting item: gain on sale of property (note 4) 0.1 14.0
Total other income 10.0 23.2
All figures in £ million 2021 2020
US 215.6 136.0
Australia 77.9 60.7
Europe 88.2 75.9
Middle east 9.8 16.3
Rest of world 28.9 44.5
International 420.4 333.4
United Kingdom 857.8 739.5
Total revenue 1,278.2 1,072.9
International revenue % 33% 31%
Revenue from ‘home countries’ (UK, US and Australia) 1,151.3 936.2
Home countries revenue % 90% 87%
Notes to the Financial Statements For the year ended 31 March
QinetiQ Group plc Annual Report and Accounts 2021 148
25. Cash flows from operations
For the year ended 31 March
Reconciliation of net cash flow from operations to underlying net cash flow from operations to free cash flow
Underlying cash conversion ratio All figures in £ million 2021 2020
Underlying operating profit – £ million 151.8 133.2
Underlying net cash flow from operations – £ million 199.0 177.8
Underlying cash conversion ratio – % 131% 133%
All figures in £ million 2021 2020
Profit after tax for the year 124.7 106.5
Adjustments for:
Taxation expense 21.5 16.6
Net finance income (5.2) (5.5)
Gain on disposal of businesses (28.4) –
Gain on disposal of investment (0.3) –
Gain on sale of property (0.1) (14.0)
Impairment charge/(reversal) in respect of property, plant and equipment 0.5 (0.4)
Impairment of goodwill 25.4 14.1
Acquisition related remuneration costs not paid as at year end 1.8 0.5
Amortisation of purchased or internally developed intangible assets 4.7 4.3
Amortisation of intangible assets arising from acquisitions 10.9 7.5
Depreciation of property, plant and equipment 45.6 41.4
Loss/(profit) on disposal of plant and equipment 1.0 (1.6)
Share of post-tax (profit)/loss of equity accounted entities (0.7) 0.7
Share-based payments charge 10.6 7.4
Retirement benefit contributions in excess of income statement expense (1.6) (4.3)
Net movement in provisions 0.3 (5.4)
210.7 167.8
Increase in inventories (4.6) (11.3)
Increase in receivables (97.3) (25.5)
Increase in payables 89.2 35.5
Changes in working capital ((1122..77)) ((11..33))
Net cash flow from operations 198.0 166.5
All figures in £ million 2021 2020
Net cash flow from operations 198.0 166.5
Add back specific adjusting item: acquisition integration costs – 3.8
Add back specific adjusting item: acquisition transaction costs 1.0 7.5
Underlying net cash flow from operations 199.0 177.8
Add: proceeds from disposal of plant and equipment – 1.6
Less: tax and net interest payments (16.4) (10.5)
Less: purchases of intangible assets and property, plant and equipment (79.5) (109.4)
Free cash flow 103.1 59.5
148 QinetiQ Group plc

Notes to the Financial Statements continued
QinetiQ Group plc Annual Report and Accounts 2021 133
Financial Statements
Revenue by major customer type For the year ended 31 March
‘Other’ does not contain any customers with revenue in excess of 10% of total Group revenue.
The following table shows the aggregate amount of revenue allocated to performance obligations that are unsatisfied (or partially satisfied) as at the end of the reporting period:
Management expects that 27% (£800.5m) of revenue allocated to unsatisfied contracts as of 31 March 2021 will be recognised as revenue during the next reporting period.
The following table shows the aggregate amount of revenue allocated to performance obligations that were unsatisfied (or partially satisfied) as at the end of the prior reporting period:
Revenue of £144m was recognised during the year that was previously unrecognised as at the previous year end and reported as a contract liability.
3. Segmental analysis
The analysis by business segment is presented in accordance with IFRS 8 Operating Segments, on the basis of those reportable segments whose operating results are regularly reviewed by the Board (the Chief Operating Decision Maker as defined by IFRS 8) and are aligned with the Group’s strategic direction, determined with reference to the products and services they provide, as follows:
EMEA Services provides technical assurance, test and evaluation and training services, underpinned by long-term contracts. EMEA Services comprises the following business units which are not considered reportable segments as defined by IFRS 8: Maritime & Land; Air & Space, Cyber & Information and the International business.
Global Products combines all other business units not aggregated within EMEA Services, including the QinetiQ US business, Space Products and EMEA Products (which includes QinetiQ Target Systems). Generally these business units (which are not considered reportable segments as defined by IFRS 8) deliver innovative solutions and products which includes contract-funded research and development and developing intellectual property in partnership with key customers and through internal funding with potential for new revenue streams.
Operating segments
1 The measure of profit presented to the Chief Operating Decision Maker is operating profit stated before specific adjusting items (‘underlying operating profit’). The specific adjusting items are detailed in note 4.
2 Definitions of the Group’s ‘Alternative performance measures’ can be found in the glossary on page 183.
No measure of segmental assets and liabilities is reported as this information is not regularly provided to the Chief Operating Decision Maker.
All figures in £ million 2021 2020
UK government 794.6 667.2
US government 140.8 116.2
Other 342.8 289.5
Total revenue 1,278.2 1,072.9
All figures in £ million 2022 2023 2024 2025+ Total
Total forecast revenue allocated to unsatisfied performance obligations 800.5 523.9 395.9 1,223.8 2,944.1
All figures in £ million 2021 2022 2023 2024+ Total
Total forecast revenue allocated to unsatisfied performance obligations 849.3 484.9 375.5 1,395.2 3,104.9
2021 2020
All figures in £ million
Revenue from
external customers
Underlying operating
profit1
Revenue from
external customers
Underlying operating
profit1
EMEA Services 939.9 118.6 797.4 100.6
Global Products 338.3 33.2 275.5 32.6
Total operating segments 1,278.2 151.8 1,072.9 133.2
Underlying operating margin2 11.9% 12.4%
Notes to the Financial Statements continued
QinetiQ Group plc Annual Report and Accounts 2021 149
Financial Statements
26. Leases
Group as a lessor The Group receives rental income on certain properties. Primarily these are properties partially occupied by Group companies, with vacant space sub-let to third-party tenants. The Group had contracted with tenants for the following future minimum lease payments:
Group as a lessee Amounts recognised in the balance sheet The balance sheet shows the following amounts relating to leases:
Right-of-use assets (included within Property, Plant & Equipment – see note 16)
Lease liabilities (included within Net cash – see note 24)
Additions to the right-of-use assets during the 2021 financial year were £12.3m, including assets recognised on acquisition of £1.2m. The total cash outflow for leases in 2021 was £9.5m.
Amounts recognised in the consolidated income statement The consolidated income statement includes the following amounts relating to leases:
Minimum lease payment commitments The Group has the following total future minimum lease payment commitments:
Lease payments represent capital and interest payable by the Group on certain property, plant and equipment. Principal leases are negotiated for a term of approximately 10 years.
All figures in £ million 2021 2020
Within one year 5.7 5.2
In the second to fifth years inclusive 9.3 10.2
Greater than five years 2.4 2.7
Total future minimum lease payments 17.4 18.1
All figures in £ million 2021 2020
Land and buildings 21.8 19.5
Plant, machinery and vehicles 2.5 5.2
Computers and office equipment – 0.1
Total right of use assets net book value 24.3 24.8
All figures in £ million 2021 2020
Current 6.9 8.6
Non-current 19.8 19.3
Total lease liabilities 2266..77 27.9
All figures in £ million 2021 2020
Depreciation charge
Land and buildings 5.6 5.1
Plant, machinery and vehicles 2.7 4.5
Computers and office equipment 0.1 0.1
Total depreciation charge 8.4 9.7
Interest expense (included in finance cost) 1.0 1.0
Expense relating to short-term leases (included in operating costs) 1.1 1.6
Expense relating to low value leases (included in operating costs) 0.2 –
Total lease and sub-lease expense charged to profit before tax 10.7 12.3
All figures in £ million 2021 2020
Within one year 6.9 8.6
In the second to fifth years inclusive 15.6 17.8
Greater than five years 4.2 1.5
Total future minimum lease payment commitments 26.7 27.9
149Annual Report & Accounts 2021
Financial Statements

Notes to the Financial Statements For the year ended 31 March
QinetiQ Group plc Annual Report and Accounts 2021 132
1. Significant changes in the current reporting period
The financial position and performance of the Group was particularly affected by the following events and transactions during the reporting period:
1) The acquisition of Naimuri Limited (see note 12) which resulted in an increase in goodwill (note 14) and other intangible assets (note 15);
2) The divestment of the Boldon James, Commerce Decisions and OptaSense businesses (see note 13); 3) An impairment of goodwill in respect of the Germany business (see note 14).
For a detailed discussion of the Group’s performance and financial position refer to the Strategic Report on pages 2 to 51.
2. Revenue from contracts with customers and other income
Revenue and other income is analysed as follows:
Revenue by category and other income For the year ended 31 March
1 For the period of which there was no contribution in the equivalent period in the comparator year which was pre-ownership (for acquisitions) or post-ownership (for disposals) by the Group
2 Alternative performance measures are used to supplement the statutory figures. See page 183.
Other income
Revenue and profit after tax of associates and joint ventures was £12.6m and £1.1m respectively (2020: revenue of £18.1m and loss after tax of £1.5m). The figures in the table above represent the Group share of this profit after tax.
Other income is in respect of property rentals and the recovery of other related property costs.
Revenue by customer geographic location For the year ended 31 March
All figures in £ million 2021 2020
Services contracts with customers 1,189.4 945.6
Sale of goods contracts with customers 83.0 116.8
Royalties and licences 5.8 10.5
Total revenue 1,278.2 1,072.9
Less: adjust current year for acquired businesses1 (117.2) –
Less: adjust prior year for disposed businesses1 – (17.2)
Adjust to constant prior year exchange rates 2.2 –
Total revenue on an organic, constant currency basis2 1,163.2 1,055.7
Organic revenue growth at constant currency2 10% 10%
All figures in £ million 2021 2020
Share of associates’ and joint ventures’ profit/(loss) after tax 0.7 (0.7)
Other income 9.2 9.9
Other income – underlying 9.9 9.2
Specific adjusting item: gain on sale of property (note 4) 0.1 14.0
Total other income 10.0 23.2
All figures in £ million 2021 2020
US 215.6 136.0
Australia 77.9 60.7
Europe 88.2 75.9
Middle east 9.8 16.3
Rest of world 28.9 44.5
International 420.4 333.4
United Kingdom 857.8 739.5
Total revenue 1,278.2 1,072.9
International revenue % 33% 31%
Revenue from ‘home countries’ (UK, US and Australia) 1,151.3 936.2
Home countries revenue % 90% 87%
Notes to the Financial Statements For the year ended 31 March
QinetiQ Group plc Annual Report and Accounts 2021 150
27. Financial risk management
The Group’s international operations expose it to financial risks that include the effects of changes in foreign exchange rates, interest rates, credit risks and liquidity risks.
Treasury and risk management policies, which are set by the Board, specify guidelines on financial risks and the use of financial instruments to manage risk. The instruments and techniques used to manage exposures include foreign currency derivatives. Group treasury monitors financial risks and compliance with risk management policies during the year. There have been no changes in any risk management policies during the year or since the year end. For details of the Group’s Treasury policy and management of financial instruments see ‘Additional Financial Information’ on page 181.
A) Fair values of financial instruments The table below analyses financial instruments carried at fair value, by valuation method. The different levels have been defined as follows:
Level 1 – measured using quoted prices (unadjusted) in active markets for identical assets or liabilities;
Level 2 – measured using inputs other than quoted prices included within Level 1 that are observable for the asset or liability, either directly (i.e. as prices) or indirectly (i.e. derived from prices). Level 2 derivatives comprise forward foreign exchange contracts which have been fair valued using forward exchange rates that are quoted in an active market;
Level 3 – measured using inputs for the assets or liability that are not based on observable market data (i.e. unobservable inputs).
The following table presents the Group’s assets and liabilities that are measured at fair value as at 31 March 2021:
The following table presents the Group’s assets and liabilities that are measured at fair value as at 31 March 2020:
For cash and cash equivalents, trade and other receivables and bank and current borrowings, the fair value of the financial instruments approximate to their carrying value as a result of the short maturity periods of these financial instruments. For trade and other receivables, allowances are made within the carrying value for credit risk. For other financial instruments, the fair value is based on market value, where available. Where market values are not available, the fair values have been calculated by discounting cash flows to net present value using prevailing market-based interest rates translated at the year-end rates, except for unlisted fixed asset investments where fair value equals carrying value. There have been no transfers between levels.
All figures in £ million Note Level 1 Level 2 Level 3 Total
Assets
Current derivative financial instruments 24 – 0.5 – 0.5
Non-current derivative financial instruments 24 – – – –
Financial instruments at fair value through profit or loss 13 – – 0.9 0.9
Liabilities
Current derivative financial instruments 24 – (0.1) – (0.1)
Non-current derivative financial instruments 24 – (0.9) – (0.9)
Total – (0.5) 0.9 0.4
All figures in £ million Note Level 1 Level 2 Level 3 Total
Assets
Current derivative financial instruments 24 – 6.3 – 6.3
Non-current derivative financial instruments 24 – 0.1 – 0.1
Financial instruments at fair value through profit or loss 13 – – – –
Liabilities
Current derivative financial instruments 24 – (0.3) – (0.3)
Non-current derivative financial instruments 24 – (0.6) – (0.6)
Total – 5.5 – 5.5
150 QinetiQ Group plc

Notes to the Financial Statements continued
QinetiQ Group plc Annual Report and Accounts 2021 133
Financial Statements
Revenue by major customer type For the year ended 31 March
‘Other’ does not contain any customers with revenue in excess of 10% of total Group revenue.
The following table shows the aggregate amount of revenue allocated to performance obligations that are unsatisfied (or partially satisfied) as at the end of the reporting period:
Management expects that 27% (£800.5m) of revenue allocated to unsatisfied contracts as of 31 March 2021 will be recognised as revenue during the next reporting period.
The following table shows the aggregate amount of revenue allocated to performance obligations that were unsatisfied (or partially satisfied) as at the end of the prior reporting period:
Revenue of £144m was recognised during the year that was previously unrecognised as at the previous year end and reported as a contract liability.
3. Segmental analysis
The analysis by business segment is presented in accordance with IFRS 8 Operating Segments, on the basis of those reportable segments whose operating results are regularly reviewed by the Board (the Chief Operating Decision Maker as defined by IFRS 8) and are aligned with the Group’s strategic direction, determined with reference to the products and services they provide, as follows:
EMEA Services provides technical assurance, test and evaluation and training services, underpinned by long-term contracts. EMEA Services comprises the following business units which are not considered reportable segments as defined by IFRS 8: Maritime & Land; Air & Space, Cyber & Information and the International business.
Global Products combines all other business units not aggregated within EMEA Services, including the QinetiQ US business, Space Products and EMEA Products (which includes QinetiQ Target Systems). Generally these business units (which are not considered reportable segments as defined by IFRS 8) deliver innovative solutions and products which includes contract-funded research and development and developing intellectual property in partnership with key customers and through internal funding with potential for new revenue streams.
Operating segments
1 The measure of profit presented to the Chief Operating Decision Maker is operating profit stated before specific adjusting items (‘underlying operating profit’). The specific adjusting items are detailed in note 4.
2 Definitions of the Group’s ‘Alternative performance measures’ can be found in the glossary on page 183.
No measure of segmental assets and liabilities is reported as this information is not regularly provided to the Chief Operating Decision Maker.
All figures in £ million 2021 2020
UK government 794.6 667.2
US government 140.8 116.2
Other 342.8 289.5
Total revenue 1,278.2 1,072.9
All figures in £ million 2022 2023 2024 2025+ Total
Total forecast revenue allocated to unsatisfied performance obligations 800.5 523.9 395.9 1,223.8 2,944.1
All figures in £ million 2021 2022 2023 2024+ Total
Total forecast revenue allocated to unsatisfied performance obligations 849.3 484.9 375.5 1,395.2 3,104.9
2021 2020
All figures in £ million
Revenue from
external customers
Underlying operating
profit1
Revenue from
external customers
Underlying operating
profit1
EMEA Services 939.9 118.6 797.4 100.6
Global Products 338.3 33.2 275.5 32.6
Total operating segments 1,278.2 151.8 1,072.9 133.2
Underlying operating margin2 11.9% 12.4%
Notes to the Financial Statements continued
QinetiQ Group plc Annual Report and Accounts 2021 151
Financial Statements
All financial assets and liabilities had a fair value that is identical to book value at 31 March 2021 and 31 March 2020. Detailed analysis is provided in the following tables:
As at 31 March 2021
As at 31 March 2020
All figures in £ million Note
Financial assets at fair
value profit and loss
Financial assets at
amortised cost
Financial liabilities at
amortised cost
Derivatives used as hedges
Total carrying
value Total fair
value
Financial assets
Non-current
Derivative financial instruments 24 – – – 0.1 0.1 0.1
Deferred financing costs 24 – 0.9 – – 0.9 0.9
Current
Trade and other receivables (excluding prepayments) 21 – 220.1 – – 220.1 220.1
Derivative financial instruments 24 – – – 6.3 6.3 6.3
Deferred financing costs 24 – 0.4 – – 0.4 0.4
Cash and cash equivalents 24 105.8 – – – 105.8 105.8
Total financial assets 105.8 221.4 – 6.4 333.6 333.6
Financial liabilities
Non-current
Trade and other payables (excluding contract liabilities) 22 – – (22.6) – (22.6) (22.6)
Derivative financial instruments 24 – – – (0.6) (0.6) (0.6)
Lease liabilities – – (19.3) – (19.3) (19.3)
Current
Trade and other payables (excluding contract liabilities) 22 – – (235.9) – (235.9) (235.9)
Derivative financial instruments 24 – – – (0.3) (0.3) (0.3)
Lease liabilities – – (8.6) – (8.6) (8.6)
Total financial liabilities – – (286.4) (0.9) (287.3) (287.3)
Total 105.8 221.4 (286.4) 5.5 46.3 46.3
All figures in £ million Note
Financial assets at fair
value profit and loss
Financial assets at
amortised cost
Financial liabilities at
amortised cost
Derivatives used as hedges
Total carrying
value Total fair
value
Financial assets
Non-current
Derivative financial instruments 24 – – – – – –
Deferred financing costs 24 – 0.8 – – 0.8 0.8
Current
Trade and other receivables (excluding prepayments) 21 – 289.4 – – 289.4 289.4
Derivative financial instruments 24 – – – 0.5 0.5 0.5
Deferred financing costs 24 – 0.4 – – 0.4 0.4
Cash and cash equivalents 24 190.1 – – – 190.1 190.1
Total financial assets 190.1 290.6 –– 0.5 481.2 481.2
Financial liabilities
Non-current
Trade and other payables (excluding contract liabilities) 22 – – (15.7) – (15.7) (15.7)
Derivative financial instruments 24 – – – (0.9) (0.9) (0.9)
Lease liabilities – – (19.8) – (19.8) (19.8)
Current
Trade and other payables (excluding contract liabilities) 22 – – (254.4) – (254.4) (254.4)
Derivative financial instruments 24 – – – (0.1) (0.1) (0.1)
Lease liabilities – – (6.9) – (6.9) (6.9)
Total financial liabilities – – (296.8) (1.0) (297.8) (297.8)
Total 190.1 290.6 (296.8) (0.5) 183.4 183.4
151Annual Report & Accounts 2021
Financial Statements

Notes to the Financial Statements For the year ended 31 March
QinetiQ Group plc Annual Report and Accounts 2021 132
1. Significant changes in the current reporting period
The financial position and performance of the Group was particularly affected by the following events and transactions during the reporting period:
1) The acquisition of Naimuri Limited (see note 12) which resulted in an increase in goodwill (note 14) and other intangible assets (note 15);
2) The divestment of the Boldon James, Commerce Decisions and OptaSense businesses (see note 13); 3) An impairment of goodwill in respect of the Germany business (see note 14).
For a detailed discussion of the Group’s performance and financial position refer to the Strategic Report on pages 2 to 51.
2. Revenue from contracts with customers and other income
Revenue and other income is analysed as follows:
Revenue by category and other income For the year ended 31 March
1 For the period of which there was no contribution in the equivalent period in the comparator year which was pre-ownership (for acquisitions) or post-ownership (for disposals) by the Group
2 Alternative performance measures are used to supplement the statutory figures. See page 183.
Other income
Revenue and profit after tax of associates and joint ventures was £12.6m and £1.1m respectively (2020: revenue of £18.1m and loss after tax of £1.5m). The figures in the table above represent the Group share of this profit after tax.
Other income is in respect of property rentals and the recovery of other related property costs.
Revenue by customer geographic location For the year ended 31 March
All figures in £ million 2021 2020
Services contracts with customers 1,189.4 945.6
Sale of goods contracts with customers 83.0 116.8
Royalties and licences 5.8 10.5
Total revenue 1,278.2 1,072.9
Less: adjust current year for acquired businesses1 (117.2) –
Less: adjust prior year for disposed businesses1 – (17.2)
Adjust to constant prior year exchange rates 2.2 –
Total revenue on an organic, constant currency basis2 1,163.2 1,055.7
Organic revenue growth at constant currency2 10% 10%
All figures in £ million 2021 2020
Share of associates’ and joint ventures’ profit/(loss) after tax 0.7 (0.7)
Other income 9.2 9.9
Other income – underlying 9.9 9.2
Specific adjusting item: gain on sale of property (note 4) 0.1 14.0
Total other income 10.0 23.2
All figures in £ million 2021 2020
US 215.6 136.0
Australia 77.9 60.7
Europe 88.2 75.9
Middle east 9.8 16.3
Rest of world 28.9 44.5
International 420.4 333.4
United Kingdom 857.8 739.5
Total revenue 1,278.2 1,072.9
International revenue % 33% 31%
Revenue from ‘home countries’ (UK, US and Australia) 1,151.3 936.2
Home countries revenue % 90% 87%
Notes to the Financial Statements For the year ended 31 March
QinetiQ Group plc Annual Report and Accounts 2021 152
27. Financial risk management (continued)
B) Interest rate risk The Group operates an interest rate policy designed to optimise interest costs and to reduce volatility in reported earnings. The Group’s current policy is to require rates to be fixed for 30%–80% of the level of borrowings, which is achieved primarily through fixed-rate borrowings. Where there are significant changes in the level and/or structure of debt, policy permits borrowings to be 100% fixed, with regular Board reviews of the appropriateness of this fixed percentage. At 31 March 2021 and 31 March 2020 the Group had no borrowings.
Financial assets/(liabilities)
As at 31 March 2021
As at 31 March 2020
* Amounts categorised under fixed or capped financial liabilities as Euro only has been restated to show a revised split across the currencies.
Floating-rate financial assets attract interest based on the relevant national LIBID equivalent. Floating-rate financial liabilities bear interest at the relevant national LIBOR equivalent. Trade and other receivables/payables and deferred finance costs are excluded from this analysis.
Interest rate risk management The revolving credit facility (note 27E) is floating-rate and undrawn as at 31 March 2021.
C) Currency risk Transactional currency exposure The Group is exposed to foreign currency risks arising from sales or purchases by businesses in currencies other than their functional currency. It is Group policy that when such a sale or purchase is certain, the net foreign exchange exposure is hedged using forward foreign exchange contracts. Hedge accounting documentation and effectiveness testing are undertaken for all the Group’s transactional hedge contracts.
The table below shows the Group’s currency exposures, being exposures on currency transactions that give rise to net currency gains and losses recognised in the income statement. Such exposures comprise the monetary assets and liabilities of the Group that are not denominated in the functional currency of the operating company involved.
Functional currency of the operating company
The amounts shown in the table take into account the effect of the forward contracts entered into to manage these currency exposures. The Group enters into forward foreign currency contracts to hedge the currency exposures that arise on sales and purchases denominated in foreign currencies, as the transaction occurs. The principal contract amounts of the outstanding forward currency contracts as at 31 March 2021 against Sterling are net US dollars sold of £67.3m (US$92.2m), net Euros bought £4.5m (€4.2m), net Canadian dollars sold £21.3m (C$36.6m), net United Arab Emirate dirhams sold £3.4m (AED 17.0m), net Swiss Francs bought of £1.4m (CHF 1.7m), net Swedish Krona bought of £6.0m (SEK 68.9m), net Norwegian Krona bought £0.2m (NOK 2.8m) and net Australian dollars bought £1.0m (A$ 1.8m).
Financial assets Financial liabilities
All figures in £ million Floating Non-interest
bearing Fixed or capped
Non-interest bearing
Sterling 155.4 0.5 (7.8) (1.0)
US dollar 14.7 – (15.2) –
Euro 6.6 – (2.1) –
Australian dollar 9.3 – (1.3) –
Other 4.1 – (0.3) –
Total 190.1 0.5 (26.7) (1.0)
Financial assets Financial liabilities
All figures in £ million Floating Non-interest
bearing
Fixed or capped
(restated)* Non-interest
bearing
Sterling 70.5 6.4 (9.6) (0.8)
US dollar 21.4 – (12.3) –
Euro 4.0 – (3.7) –
Australian dollar 4.6 – (1.7) –
Other 5.3 – (0.6) –
Total 105.8 6.4 (27.9) (0.8)
Net foreign currency monetary assets/(liabilities)
All figures in £ millions US$ Euro A$ Other Total
31 March 2021 – Sterling 7.1 3.3 00..88 23.8 35.0
31 March 2020– Sterling (52.8) (8.3) 00..33 (58.5) (119.3)
152 QinetiQ Group plc

Notes to the Financial Statements continued
QinetiQ Group plc Annual Report and Accounts 2021 133
Financial Statements
Revenue by major customer type For the year ended 31 March
‘Other’ does not contain any customers with revenue in excess of 10% of total Group revenue.
The following table shows the aggregate amount of revenue allocated to performance obligations that are unsatisfied (or partially satisfied) as at the end of the reporting period:
Management expects that 27% (£800.5m) of revenue allocated to unsatisfied contracts as of 31 March 2021 will be recognised as revenue during the next reporting period.
The following table shows the aggregate amount of revenue allocated to performance obligations that were unsatisfied (or partially satisfied) as at the end of the prior reporting period:
Revenue of £144m was recognised during the year that was previously unrecognised as at the previous year end and reported as a contract liability.
3. Segmental analysis
The analysis by business segment is presented in accordance with IFRS 8 Operating Segments, on the basis of those reportable segments whose operating results are regularly reviewed by the Board (the Chief Operating Decision Maker as defined by IFRS 8) and are aligned with the Group’s strategic direction, determined with reference to the products and services they provide, as follows:
EMEA Services provides technical assurance, test and evaluation and training services, underpinned by long-term contracts. EMEA Services comprises the following business units which are not considered reportable segments as defined by IFRS 8: Maritime & Land; Air & Space, Cyber & Information and the International business.
Global Products combines all other business units not aggregated within EMEA Services, including the QinetiQ US business, Space Products and EMEA Products (which includes QinetiQ Target Systems). Generally these business units (which are not considered reportable segments as defined by IFRS 8) deliver innovative solutions and products which includes contract-funded research and development and developing intellectual property in partnership with key customers and through internal funding with potential for new revenue streams.
Operating segments
1 The measure of profit presented to the Chief Operating Decision Maker is operating profit stated before specific adjusting items (‘underlying operating profit’). The specific adjusting items are detailed in note 4.
2 Definitions of the Group’s ‘Alternative performance measures’ can be found in the glossary on page 183.
No measure of segmental assets and liabilities is reported as this information is not regularly provided to the Chief Operating Decision Maker.
All figures in £ million 2021 2020
UK government 794.6 667.2
US government 140.8 116.2
Other 342.8 289.5
Total revenue 1,278.2 1,072.9
All figures in £ million 2022 2023 2024 2025+ Total
Total forecast revenue allocated to unsatisfied performance obligations 800.5 523.9 395.9 1,223.8 2,944.1
All figures in £ million 2021 2022 2023 2024+ Total
Total forecast revenue allocated to unsatisfied performance obligations 849.3 484.9 375.5 1,395.2 3,104.9
2021 2020
All figures in £ million
Revenue from
external customers
Underlying operating
profit1
Revenue from
external customers
Underlying operating
profit1
EMEA Services 939.9 118.6 797.4 100.6
Global Products 338.3 33.2 275.5 32.6
Total operating segments 1,278.2 151.8 1,072.9 133.2
Underlying operating margin2 11.9% 12.4%
Notes to the Financial Statements continued
QinetiQ Group plc Annual Report and Accounts 2021 153
Financial Statements
Translational currency exposure The Group has significant investments in overseas operations, particularly in the US. As a result, the Sterling value of the Group’s balance sheet can be affected by movement in exchange rates. The Group does not hedge against translational currency exposure to overseas net assets.
D) Financial credit risk The Group is exposed to credit-related losses in the event of non-performance by counterparties to financial instruments, but does not currently expect any counterparties to fail to meet their obligations. Credit risk is mitigated by a Board-approved policy of only selecting counterparties with a strong investment grade long-term credit rating for cash deposits. In the normal course of business the Group operates notional cash pooling systems, where a legal right of set-off applies.
The maximum credit-risk exposure in the event of other parties failing to perform their obligations under financial assets, excluding trade and other receivables, totals £163.9m (2020: £112.2m). The Group held cash and cash equivalents of £190.1m at 31 March 2021 (2020: £105.8m), which represents the maximum credit exposure on these assets. The cash and cash equivalents were held with different financial institutions which were rated single A or better. Cash equivalents comprise £133.1m (2020: £56.9m) invested in AAA-rated money market funds.
E) Liquidity risk Borrowing facilities As at 31 March 2021 the Group had a revolving credit facility (RCF) of £275.0m (2020: £275.0m). This facility, which is unutilised, has an initial term of five years of which £65.0m will mature on 27 September 2024 and £210.0m will mature on 27 September 2025. Total available funds, comprising the RCF and the Group’s freely available cash and cash equivalents, are shown in the table below:
Gross contractual cash flows for borrowings and other financial liabilities The following are the contractual maturities of financial liabilities, including interest payments. The cash flows associated with derivatives that are cash flow hedges are expected to have an impact on profit or loss in the periods shown.
As at 31 March 2021
As at 31 March 2020
All figures in £ million Book value Contractual cash flows
1 year or less 1–2 years 2–5 years
More than 5 years
Non-derivative financial liabilities
Trade and other payables (excluding contract liabilities) (258.5) (258.5) (235.9) (22.6) – –
Leases (27.9) (29.9) (9.2) (7.2) (11.7) (1.8)
Derivative financial liabilities
Forward foreign currency contracts – cash flow hedges (0.9) (0.9) (0.3) (0.3) (0.3) –
Total (287.3) (289.3) (245.4) (30.1) (12.0) (1.8)
Interest rate:
LIBOR plus Total
£m Drawn
£m Undrawn
£m
As at 31 March 2021
Committed facilities 0.53% 275.0 – 275.0
Freely available cash and cash equivalents 184.5
Available funds 31 March 2021 459.5
As at 31 March 2020
Committed facilities 0.53% 275.0 – 275.0
Freely available cash and cash equivalents 102.1
Available funds 31 March 2020 377.1
All figures in £ million Book value Contractual cash flows
1 year or less 1–2 years 2–5 years
More than 5 years
Non-derivative financial liabilities
Trade and other payables (excluding contract liabilities) (270.1) (270.1) (254.4) (15.7) – –
Leases (26.7) (30.7) (7.9) (6.1) (11.5) (5.2)
Derivative financial liabilities
Forward foreign currency contracts – cash flow hedges (1.0) (1.0) (0.1) (0.3) (0.6) –
Total (297.8) (301.8) (262.4) (22.1) (12.1) (5.2)
153Annual Report & Accounts 2021
Financial Statements

Notes to the Financial Statements For the year ended 31 March
QinetiQ Group plc Annual Report and Accounts 2021 132
1. Significant changes in the current reporting period
The financial position and performance of the Group was particularly affected by the following events and transactions during the reporting period:
1) The acquisition of Naimuri Limited (see note 12) which resulted in an increase in goodwill (note 14) and other intangible assets (note 15);
2) The divestment of the Boldon James, Commerce Decisions and OptaSense businesses (see note 13); 3) An impairment of goodwill in respect of the Germany business (see note 14).
For a detailed discussion of the Group’s performance and financial position refer to the Strategic Report on pages 2 to 51.
2. Revenue from contracts with customers and other income
Revenue and other income is analysed as follows:
Revenue by category and other income For the year ended 31 March
1 For the period of which there was no contribution in the equivalent period in the comparator year which was pre-ownership (for acquisitions) or post-ownership (for disposals) by the Group
2 Alternative performance measures are used to supplement the statutory figures. See page 183.
Other income
Revenue and profit after tax of associates and joint ventures was £12.6m and £1.1m respectively (2020: revenue of £18.1m and loss after tax of £1.5m). The figures in the table above represent the Group share of this profit after tax.
Other income is in respect of property rentals and the recovery of other related property costs.
Revenue by customer geographic location For the year ended 31 March
All figures in £ million 2021 2020
Services contracts with customers 1,189.4 945.6
Sale of goods contracts with customers 83.0 116.8
Royalties and licences 5.8 10.5
Total revenue 1,278.2 1,072.9
Less: adjust current year for acquired businesses1 (117.2) –
Less: adjust prior year for disposed businesses1 – (17.2)
Adjust to constant prior year exchange rates 2.2 –
Total revenue on an organic, constant currency basis2 1,163.2 1,055.7
Organic revenue growth at constant currency2 10% 10%
All figures in £ million 2021 2020
Share of associates’ and joint ventures’ profit/(loss) after tax 0.7 (0.7)
Other income 9.2 9.9
Other income – underlying 9.9 9.2
Specific adjusting item: gain on sale of property (note 4) 0.1 14.0
Total other income 10.0 23.2
All figures in £ million 2021 2020
US 215.6 136.0
Australia 77.9 60.7
Europe 88.2 75.9
Middle east 9.8 16.3
Rest of world 28.9 44.5
International 420.4 333.4
United Kingdom 857.8 739.5
Total revenue 1,278.2 1,072.9
International revenue % 33% 31%
Revenue from ‘home countries’ (UK, US and Australia) 1,151.3 936.2
Home countries revenue % 90% 87%
Notes to the Financial Statements For the year ended 31 March
QinetiQ Group plc Annual Report and Accounts 2021 154
27. Financial risk management (continued) F) Derivative financial instruments The Group has the following derivative financial instruments on the balance sheet, reported within the ‘Other financial assets’ line items. As at 31 March
The maturity of these derivative financial instruments is as follows:
As at 31 March
G) Maturity of financial liabilities The contractual maturity of the Group’s financial liabilities is shown below:
As at 31 March 2021
1 Excluding contract liabilities
As at 31 March 2020
1 Excluding contract liabilities ^ The lease liabilities have been restated to reflect an amended maturity split whereby £11.0m has been reclassified from the 1-2yrs category into the 2-5yrs category and
>5yrs category.
2021 2020
All figures in £ million Asset gains
Liability losses Net
Asset gains
Liability losses Net
Forward foreign currency contracts – cash flow hedges 0.5 (1.0) (0.5) 6.4 (0.9) 5.5 Derivative assets/(liabilities) at the end of the year 0.5 (1.0) (0.5) 6.4 (0.9) 5.5
2021 2020
All figures in £ million Asset gains
Liability losses Net
Asset gains
Liability losses Net
Expected to be recognised: In one year or less 0.5 (0.1) 0.4 6.3 (0.3) 6.0 Between one and two years – (0.3) (0.3) 0.1 (0.3) (0.2) More than two years – (0.6) (0.6) – (0.3) (0.3) Derivative assets/(liabilities) at the end of the year 0.5 (1.0) (0.5) 6.4 (0.9) 5.5
All figures in £ million
Trade and other
payables1
Derivative financial
instruments and lease liabilities Total
Due in one year or less 254.4 7.0 261.4 Due in more than one year but not more than two years 15.7 5.7 21.4 Due in more than two years but not more than five years – 10.8 10.8 Due in five years or more – 4.1 4.1 Total 270.1 27.6 297.7
All figures in £ million
Trade and other
payables1
Derivative financial
instruments and lease liabilities
(restated)^ Total
(restated)^
Due in one year or less 235.9 8.9 244.8 Due in more than one year but not more than two years 22.6 7.0 29.6 Due in more than two years but not more than five years – 11.3 11.3 Due in five years or more – 1.5 1.5 Total 258.5 28.7 287.2
154 QinetiQ Group plc

Notes to the Financial Statements continued
QinetiQ Group plc Annual Report and Accounts 2021 133
Financial Statements
Revenue by major customer type For the year ended 31 March
‘Other’ does not contain any customers with revenue in excess of 10% of total Group revenue.
The following table shows the aggregate amount of revenue allocated to performance obligations that are unsatisfied (or partially satisfied) as at the end of the reporting period:
Management expects that 27% (£800.5m) of revenue allocated to unsatisfied contracts as of 31 March 2021 will be recognised as revenue during the next reporting period.
The following table shows the aggregate amount of revenue allocated to performance obligations that were unsatisfied (or partially satisfied) as at the end of the prior reporting period:
Revenue of £144m was recognised during the year that was previously unrecognised as at the previous year end and reported as a contract liability.
3. Segmental analysis
The analysis by business segment is presented in accordance with IFRS 8 Operating Segments, on the basis of those reportable segments whose operating results are regularly reviewed by the Board (the Chief Operating Decision Maker as defined by IFRS 8) and are aligned with the Group’s strategic direction, determined with reference to the products and services they provide, as follows:
EMEA Services provides technical assurance, test and evaluation and training services, underpinned by long-term contracts. EMEA Services comprises the following business units which are not considered reportable segments as defined by IFRS 8: Maritime & Land; Air & Space, Cyber & Information and the International business.
Global Products combines all other business units not aggregated within EMEA Services, including the QinetiQ US business, Space Products and EMEA Products (which includes QinetiQ Target Systems). Generally these business units (which are not considered reportable segments as defined by IFRS 8) deliver innovative solutions and products which includes contract-funded research and development and developing intellectual property in partnership with key customers and through internal funding with potential for new revenue streams.
Operating segments
1 The measure of profit presented to the Chief Operating Decision Maker is operating profit stated before specific adjusting items (‘underlying operating profit’). The specific adjusting items are detailed in note 4.
2 Definitions of the Group’s ‘Alternative performance measures’ can be found in the glossary on page 183.
No measure of segmental assets and liabilities is reported as this information is not regularly provided to the Chief Operating Decision Maker.
All figures in £ million 2021 2020
UK government 794.6 667.2
US government 140.8 116.2
Other 342.8 289.5
Total revenue 1,278.2 1,072.9
All figures in £ million 2022 2023 2024 2025+ Total
Total forecast revenue allocated to unsatisfied performance obligations 800.5 523.9 395.9 1,223.8 2,944.1
All figures in £ million 2021 2022 2023 2024+ Total
Total forecast revenue allocated to unsatisfied performance obligations 849.3 484.9 375.5 1,395.2 3,104.9
2021 2020
All figures in £ million
Revenue from
external customers
Underlying operating
profit1
Revenue from
external customers
Underlying operating
profit1
EMEA Services 939.9 118.6 797.4 100.6
Global Products 338.3 33.2 275.5 32.6
Total operating segments 1,278.2 151.8 1,072.9 133.2
Underlying operating margin2 11.9% 12.4%
Notes to the Financial Statements continued
QinetiQ Group plc Annual Report and Accounts 2021 155
Financial Statements
H) Sensitivity analysis The Group’s sensitivity to changes in foreign exchange rates and interest rates on financial assets and liabilities as at 31 March 2021 is set out in the following table. The impact of a weakening in Sterling on the Group’s financial assets and liabilities would be more than offset in equity and income by its impact on the Group’s overseas net assets and earnings respectively. Sensitivity on Group’s assets other than financial assets and liabilities is not included in this analysis.
As at 31 March 2021
1 This relates to the impact on items charged directly to equity and excludes the impact on profit/loss for the year flowing into equity.
As at 31 March 2020
1 This relates to the impact on items charged directly to equity and excludes the impact on profit/loss for the year flowing into equity.
The amounts generated from the sensitivity analysis are forward-looking estimates of market risk assuming that certain market conditions occur. Actual results in the future may differ materially from those projected as a result of developments in global financial markets that may cause fluctuations in interest and exchange rates to vary from the hypothetical amounts disclosed in the previous tables, which should not, therefore, be considered to be a projection of likely future events and losses.
The estimated changes for interest rate movements are based on an instantaneous decrease or increase of 1% (100 basis points) in the specific rate of interest applicable to each class of financial instruments from the levels effective at 31 March 2021, with all other variables remaining constant. The estimated changes for foreign exchange rates are based on an instantaneous 10% weakening or strengthening in Sterling against all other currencies from the levels applicable at 31 March 2021, with all other variables remaining constant. Such analysis is for illustrative purposes only – in practice market rates rarely change in isolation.
The impact of transactional risk on the Group’s monetary assets/liabilities that are not held in the functional currency of the entity holding those assets/liabilities is minimal.
1% decrease in
interest rates 10% weakening
in Sterling
All figures in £ million Equity1 Profit before
tax Equity Profit before
tax
Sterling – (1.6) – –
US dollar – (0.1) 4.4 –
Other – (0.2) 10.2 –
1% increase in interest rates
10% strengthening in Sterling
All figures in £ million Equity1 Profit before
tax Equity Profit before
tax
Sterling – 1.6 – –
US dollar – 0.1 (3.7) –
Other – 0.2 5.8 –
1% decrease in
interest rates 10% weakening
in Sterling
All figures in £ million Equity1 Profit before
tax Equity Profit before
tax
Sterling – (0.7) – –
US dollar – (0.2) 2.9 –
Other – (0.1) 11.6 –
1% increase in interest rates
10% strengthening in Sterling
All figures in £ million Equity1 Profit before
tax Equity Profit before
tax
Sterling – 0.7 – –
US dollar – 0.2 (2.4) –
Other – 0.1 8.6 –
155Annual Report & Accounts 2021
Financial Statements

Notes to the Financial Statements For the year ended 31 March
QinetiQ Group plc Annual Report and Accounts 2021 132
1. Significant changes in the current reporting period
The financial position and performance of the Group was particularly affected by the following events and transactions during the reporting period:
1) The acquisition of Naimuri Limited (see note 12) which resulted in an increase in goodwill (note 14) and other intangible assets (note 15);
2) The divestment of the Boldon James, Commerce Decisions and OptaSense businesses (see note 13); 3) An impairment of goodwill in respect of the Germany business (see note 14).
For a detailed discussion of the Group’s performance and financial position refer to the Strategic Report on pages 2 to 51.
2. Revenue from contracts with customers and other income
Revenue and other income is analysed as follows:
Revenue by category and other income For the year ended 31 March
1 For the period of which there was no contribution in the equivalent period in the comparator year which was pre-ownership (for acquisitions) or post-ownership (for disposals) by the Group
2 Alternative performance measures are used to supplement the statutory figures. See page 183.
Other income
Revenue and profit after tax of associates and joint ventures was £12.6m and £1.1m respectively (2020: revenue of £18.1m and loss after tax of £1.5m). The figures in the table above represent the Group share of this profit after tax.
Other income is in respect of property rentals and the recovery of other related property costs.
Revenue by customer geographic location For the year ended 31 March
All figures in £ million 2021 2020
Services contracts with customers 1,189.4 945.6
Sale of goods contracts with customers 83.0 116.8
Royalties and licences 5.8 10.5
Total revenue 1,278.2 1,072.9
Less: adjust current year for acquired businesses1 (117.2) –
Less: adjust prior year for disposed businesses1 – (17.2)
Adjust to constant prior year exchange rates 2.2 –
Total revenue on an organic, constant currency basis2 1,163.2 1,055.7
Organic revenue growth at constant currency2 10% 10%
All figures in £ million 2021 2020
Share of associates’ and joint ventures’ profit/(loss) after tax 0.7 (0.7)
Other income 9.2 9.9
Other income – underlying 9.9 9.2
Specific adjusting item: gain on sale of property (note 4) 0.1 14.0
Total other income 10.0 23.2
All figures in £ million 2021 2020
US 215.6 136.0
Australia 77.9 60.7
Europe 88.2 75.9
Middle east 9.8 16.3
Rest of world 28.9 44.5
International 420.4 333.4
United Kingdom 857.8 739.5
Total revenue 1,278.2 1,072.9
International revenue % 33% 31%
Revenue from ‘home countries’ (UK, US and Australia) 1,151.3 936.2
Home countries revenue % 90% 87%
Notes to the Financial Statements For the year ended 31 March
QinetiQ Group plc Annual Report and Accounts 2021 156
28. Post-retirement benefits
Defined contribution plans In the UK the Group operates two defined contribution pension plans for the majority of its UK employees: a Group Personal Pension Plan (GPP) and a defined contribution section of the QinetiQ Pension Scheme in accordance with auto-enrolment regulations. These are both defined contribution schemes managed by Scottish Widows. With effect from 1st March 2021 contributions for both plans have been directed to a new DC arrangement provided by the Mercer Master Trust. A defined contribution plan is a pension plan under which the Group and employees pay fixed contributions to a third-party financial provider. The Group has no legal or constructive obligations to pay further contributions if the fund does not hold sufficient assets to pay all employees the benefits relating to employee service in the current and prior periods. The contributions are recognised as an employee benefit expense when they are due. The expense incurred during the year was £45.5m (2020: £42.9m). Prepaid contributions are recognised as an asset to the extent that a cash refund or a reduction in the future payments is available.
Defined benefit pension plan In the UK the Group operates the QinetiQ Pension Scheme (the Scheme) for approximately one quarter of its UK employees. The Scheme closed to future accrual on 31 October 2013 and there is no on-going service cost. After this date, defined benefit members transferred to a defined contribution section of the Scheme. The Scheme is a final salary plan, which provides benefits to members in the form of a guaranteed level of pension payable for life.
The level of benefits provided depends on the members’ length of service and their final pensionable earnings at closure to future accrual. In the Scheme, pensions in payment are generally updated in line with the Consumer Price Index (CPI). The benefit payments are made from Trustee-administered funds.
Plan assets held in trusts are governed by UK regulations as is the nature of the relationship between the Group and the Trustees and their composition. Responsibility for the governance of the Scheme – including investment decisions and contribution schedules – lies jointly with the Company and the Board of Trustees. The Board of Trustees must be composed of representatives of the Company and plan participants in accordance with the Scheme’s rules.
The asset recognised in the balance sheet in respect of the defined benefit pension plan is the fair value of plan assets less the present value of the defined benefit obligation at the end of the reporting period. The defined benefit obligation is calculated bi-annually by independent actuaries using the projected unit credit method. Future cash flows of the Scheme which are subject to inflation are calculated using a CPI inflation assumption for the majority of the cash flows, with a small proportion of cash flows linked to RPI. IAS 19 requires the inflation assumptions to be market-based assumptions, as opposed to being based on economic forecasts. A logical approach to setting the CPI inflation assumption would be to simply use the Bank of England long-term CPI inflation target of 2.0%. However, this is not acceptable under accounting standards and the current market data suggests that long-term CPI is significantly in excess of the Bank of England long-term target. Hence, the liability calculated for recording on the balance sheet at year end is based on a higher market expectation of CPI. Additional disclosure is provided (see following pages) to highlight the value of the liability (and the net surplus) if calculated using the Bank of England long term target rate of inflation.
The present value of the defined benefit obligation is determined by discounting the estimated, inflated future cash outflows using interest rates of high quality corporate bonds and that have terms to maturity approximating to the terms of the related pension obligation.
Actuarial gains and losses arising from experience adjustments and changes in actuarial assumptions are charged or credited to equity in other comprehensive income in the period in which they arise.
The Group has no further payment obligations once the agreed contributions have been paid. The expected employer cash contribution to the Scheme for the year ending 31 March 2022 is £2.9m.
Triennial funding valuation The most recent completed full actuarial valuation of the Scheme was undertaken as at 30 June 2020 and resulted in an actuarially assessed surplus of £176.5m (relative to the technical provisions i.e. the level of assets agreed by the Trustee and the Company as being appropriate to meet member benefits, assuming the Scheme continues as a going concern). The next triennial valuation will be performed as at 30 June 2023. The agreed recovery plan requires £2.8m per annum (at 2021 prices) distributions to the Scheme until 31 March 2032, indexed by reference to CPI. Such distributions are from the Group’s Pension Funding Limited Partnership.
QinetiQ’s Pension Funding Partnership (PFP) structure On 26 March 2012 QinetiQ established the QinetiQ PFP Limited Partnership (the ‘Partnership’) with the Scheme. Under this arrangement, properties to the capitalised value of £32.3m were transferred to the Partnership. The transfers were effected through a 20-year sale and leaseback agreement. The Scheme’s interest in the Partnership entitles it to an annual distribution of approximately £2.5m (from 2012) for 20 years, indexed with reference to CPI. The Scheme’s interest in the Partnership will revert back to QinetiQ Limited in 2032.
The Partnership is controlled by QinetiQ and its results are consolidated by the Group. Under IAS 19, the interest held by the Scheme in the Partnership does not qualify as a plan asset for the purposes of the Group’s consolidated financial statements and is, therefore, not included within the fair value of plan assets. As a result, the Group’s consolidated financial statements are unchanged by the Partnership. In addition, the value of the property transferred to the Partnership and leased back to QinetiQ remains on the balance sheet. QinetiQ retains the operational
156 QinetiQ Group plc

Notes to the Financial Statements continued
QinetiQ Group plc Annual Report and Accounts 2021 133
Financial Statements
Revenue by major customer type For the year ended 31 March
‘Other’ does not contain any customers with revenue in excess of 10% of total Group revenue.
The following table shows the aggregate amount of revenue allocated to performance obligations that are unsatisfied (or partially satisfied) as at the end of the reporting period:
Management expects that 27% (£800.5m) of revenue allocated to unsatisfied contracts as of 31 March 2021 will be recognised as revenue during the next reporting period.
The following table shows the aggregate amount of revenue allocated to performance obligations that were unsatisfied (or partially satisfied) as at the end of the prior reporting period:
Revenue of £144m was recognised during the year that was previously unrecognised as at the previous year end and reported as a contract liability.
3. Segmental analysis
The analysis by business segment is presented in accordance with IFRS 8 Operating Segments, on the basis of those reportable segments whose operating results are regularly reviewed by the Board (the Chief Operating Decision Maker as defined by IFRS 8) and are aligned with the Group’s strategic direction, determined with reference to the products and services they provide, as follows:
EMEA Services provides technical assurance, test and evaluation and training services, underpinned by long-term contracts. EMEA Services comprises the following business units which are not considered reportable segments as defined by IFRS 8: Maritime & Land; Air & Space, Cyber & Information and the International business.
Global Products combines all other business units not aggregated within EMEA Services, including the QinetiQ US business, Space Products and EMEA Products (which includes QinetiQ Target Systems). Generally these business units (which are not considered reportable segments as defined by IFRS 8) deliver innovative solutions and products which includes contract-funded research and development and developing intellectual property in partnership with key customers and through internal funding with potential for new revenue streams.
Operating segments
1 The measure of profit presented to the Chief Operating Decision Maker is operating profit stated before specific adjusting items (‘underlying operating profit’). The specific adjusting items are detailed in note 4.
2 Definitions of the Group’s ‘Alternative performance measures’ can be found in the glossary on page 183.
No measure of segmental assets and liabilities is reported as this information is not regularly provided to the Chief Operating Decision Maker.
All figures in £ million 2021 2020
UK government 794.6 667.2
US government 140.8 116.2
Other 342.8 289.5
Total revenue 1,278.2 1,072.9
All figures in £ million 2022 2023 2024 2025+ Total
Total forecast revenue allocated to unsatisfied performance obligations 800.5 523.9 395.9 1,223.8 2,944.1
All figures in £ million 2021 2022 2023 2024+ Total
Total forecast revenue allocated to unsatisfied performance obligations 849.3 484.9 375.5 1,395.2 3,104.9
2021 2020
All figures in £ million
Revenue from
external customers
Underlying operating
profit1
Revenue from
external customers
Underlying operating
profit1
EMEA Services 939.9 118.6 797.4 100.6
Global Products 338.3 33.2 275.5 32.6
Total operating segments 1,278.2 151.8 1,072.9 133.2
Underlying operating margin2 11.9% 12.4%
Notes to the Financial Statements continued
QinetiQ Group plc Annual Report and Accounts 2021 157
Financial Statements
flexibility to substitute properties of equivalent value within the Partnership and has the option to settle outstanding amounts due under the interest before 2032 if it so chooses.
Other UK schemes In the UK the Group has a small number of employees for whom benefits are secured through the Prudential Platinum Scheme (‘PPS’). The PPS scheme is always fully funded and has a very small surplus at year end. QinetiQ also offers employees access to a Group Self Invested Personal Pension Plan, but no Company contributions are paid to this arrangement.
Defined benefit pension plan (‘Scheme’) net pension asset The Scheme is in a net asset position with the market value of assets in excess of the present value of Scheme liabilities. These have the values set out below as at 31 March of each year end.
The balance sheet net pension asset is a snapshot view which can be significantly influenced by short-term market factors. The calculation of the net asset depends on factors which are beyond the control of the Group – principally the value at the balance sheet date of the various categories of assets in which the Scheme has invested and long-term interest rates and inflation rates used to value the Scheme’s liabilities. This is particularly pertinent during the COVID-19 pandemic whilst markets are extremely volatile. Sensitivities and risks are described on pages 159 and 160.
Post year end pension buy-in transaction Post year end (effective 30 April) the Scheme completed a bulk annuity insurance buy-in at a cost of £132.3m. This transaction has removed longevity risk, interest rate risk, and inflation risk for approximately 8% of the Scheme and is in line with the Group's strategy of de-risking the pension liabilities. This buy-in follows the Scheme’s first buy-in in 2019 which had already removed risk for approximately one-third of the Scheme. As a result of the transaction, the accounting pension surplus recorded on the Group's balance sheet will reduce by an estimated £25m with no related cash impact.
Total expense recognised in the income statement
Movement in the net pension asset The movement in the net pension asset (before deferred tax) is set out below:
All figures in £ million 2021 2020
Total market value of assets – see table below for analysis by category of asset 2,071.8 1,912.3
Present value of Scheme liabilities (1,857.5) (1,602.6)
Net pension asset before deferred tax 214.3 309.7
Deferred tax liability (45.5) (63.8)
Net pension asset after deferred tax 168.8 245.9
All figures in £ million 2021 2020
Net finance income 7.1 6.5
Administrative expenses (1.3) (1.2)
Total net income recognised in the income statement (gross of deferred tax) 5.8 5.3
All figures in £ million 2021 2020
Opening net pension asset 309.7 259.1
Net finance income 7.1 6.5
Net actuarial (loss)/gain (104.1) 39.8
Administrative expenses (1.3) (1.2)
Contributions by the employer 2.9 5.5
Closing net pension asset 214.3 309.7
157Annual Report & Accounts 2021
Financial Statements

Notes to the Financial Statements For the year ended 31 March
QinetiQ Group plc Annual Report and Accounts 2021 132
1. Significant changes in the current reporting period
The financial position and performance of the Group was particularly affected by the following events and transactions during the reporting period:
1) The acquisition of Naimuri Limited (see note 12) which resulted in an increase in goodwill (note 14) and other intangible assets (note 15);
2) The divestment of the Boldon James, Commerce Decisions and OptaSense businesses (see note 13); 3) An impairment of goodwill in respect of the Germany business (see note 14).
For a detailed discussion of the Group’s performance and financial position refer to the Strategic Report on pages 2 to 51.
2. Revenue from contracts with customers and other income
Revenue and other income is analysed as follows:
Revenue by category and other income For the year ended 31 March
1 For the period of which there was no contribution in the equivalent period in the comparator year which was pre-ownership (for acquisitions) or post-ownership (for disposals) by the Group
2 Alternative performance measures are used to supplement the statutory figures. See page 183.
Other income
Revenue and profit after tax of associates and joint ventures was £12.6m and £1.1m respectively (2020: revenue of £18.1m and loss after tax of £1.5m). The figures in the table above represent the Group share of this profit after tax.
Other income is in respect of property rentals and the recovery of other related property costs.
Revenue by customer geographic location For the year ended 31 March
All figures in £ million 2021 2020
Services contracts with customers 1,189.4 945.6
Sale of goods contracts with customers 83.0 116.8
Royalties and licences 5.8 10.5
Total revenue 1,278.2 1,072.9
Less: adjust current year for acquired businesses1 (117.2) –
Less: adjust prior year for disposed businesses1 – (17.2)
Adjust to constant prior year exchange rates 2.2 –
Total revenue on an organic, constant currency basis2 1,163.2 1,055.7
Organic revenue growth at constant currency2 10% 10%
All figures in £ million 2021 2020
Share of associates’ and joint ventures’ profit/(loss) after tax 0.7 (0.7)
Other income 9.2 9.9
Other income – underlying 9.9 9.2
Specific adjusting item: gain on sale of property (note 4) 0.1 14.0
Total other income 10.0 23.2
All figures in £ million 2021 2020
US 215.6 136.0
Australia 77.9 60.7
Europe 88.2 75.9
Middle east 9.8 16.3
Rest of world 28.9 44.5
International 420.4 333.4
United Kingdom 857.8 739.5
Total revenue 1,278.2 1,072.9
International revenue % 33% 31%
Revenue from ‘home countries’ (UK, US and Australia) 1,151.3 936.2
Home countries revenue % 90% 87%
Notes to the Financial Statements For the year ended 31 March
QinetiQ Group plc Annual Report and Accounts 2021 132
1. Significant changes in the current reporting period
The financial position and performance of the Group was particularly affected by the following events and transactions during the reporting period:
1) The acquisition of Naimuri Limited (see note 12) which resulted in an increase in goodwill (note 14) and other intangible assets (note 15);
2) The divestment of the Boldon James, Commerce Decisions and OptaSense businesses (see note 13); 3) An impairment of goodwill in respect of the Germany business (see note 14).
For a detailed discussion of the Group’s performance and financial position refer to the Strategic Report on pages 2 to 51.
2. Revenue from contracts with customers and other income
Revenue and other income is analysed as follows:
Revenue by category and other income For the year ended 31 March
1 For the period of which there was no contribution in the equivalent period in the comparator year which was pre-ownership (for acquisitions) or post-ownership (for disposals) by the Group
2 Alternative performance measures are used to supplement the statutory figures. See page 183.
Other income
Revenue and profit after tax of associates and joint ventures was £12.6m and £1.1m respectively (2020: revenue of £18.1m and loss after tax of £1.5m). The figures in the table above represent the Group share of this profit after tax.
Other income is in respect of property rentals and the recovery of other related property costs.
Revenue by customer geographic location For the year ended 31 March
All figures in £ million 2021 2020
Services contracts with customers 1,189.4 945.6
Sale of goods contracts with customers 83.0 116.8
Royalties and licences 5.8 10.5
Total revenue 1,278.2 1,072.9
Less: adjust current year for acquired businesses1 (117.2) –
Less: adjust prior year for disposed businesses1 – (17.2)
Adjust to constant prior year exchange rates 2.2 –
Total revenue on an organic, constant currency basis2 1,163.2 1,055.7
Organic revenue growth at constant currency2 10% 10%
All figures in £ million 2021 2020
Share of associates’ and joint ventures’ profit/(loss) after tax 0.7 (0.7)
Other income 9.2 9.9
Other income – underlying 9.9 9.2
Specific adjusting item: gain on sale of property (note 4) 0.1 14.0
Total other income 10.0 23.2
All figures in £ million 2021 2020
US 215.6 136.0
Australia 77.9 60.7
Europe 88.2 75.9
Middle east 9.8 16.3
Rest of world 28.9 44.5
International 420.4 333.4
United Kingdom 857.8 739.5
Total revenue 1,278.2 1,072.9
International revenue % 33% 31%
Revenue from ‘home countries’ (UK, US and Australia) 1,151.3 936.2
Home countries revenue % 90% 87%
QinetiQ Group plc Annual Report and Accounts 2021 158
Notes to the Financial Statements For the year ended 31 March
28. Post-retirement benefits (continued)Fair value of Scheme assets by type of asset The fair value of the QinetiQ Pension Scheme assets, which are not intended to be realised in the short term and may be subject to significant changes before they are realised, were:
1 Primarily private market debt investments 2 Unlisted corporate bonds with commercial property held as security 3 Valued by comparing with equivalent properties that have recently been transacted in the market
The Scheme’s assets do not include any of the Group’s own transferable financial instruments, property occupied by, or other assets used by the Group.
The insurance policy obtained by the pension scheme can only be used to pay or fund employee benefits under the Company’s defined benefit plan. It is not available to the Company’s own creditors and cannot be paid to another entity. These are the requirements of IAS 19 paragraph 7 and hence our determination is that the insurance policy is a qualifying insurance policy and requires classification as a plan asset. The policy was issued by an insurer that is not a related party.
Per the Scheme rules the Company has an unconditional right to a refund of any surplus, assuming gradual settlement of all liabilities over time. Such surplus may arise on cessation of the Scheme in the context of IFRIC 14 paragraphs 11(b) and 12 and therefore the full net pension asset can be recognised on the Group’s balance sheet and the Group’s minimum funding commitments to the Scheme do not give rise to an additional balance sheet liability.
Changes to the fair value of Scheme assets
Changes to the present value of Scheme liabilities The present value of the Scheme’s liabilities, which are derived from cash flow projections over long periods, and thus inherently uncertain, were:
All figures in £ million 2021 2020
Opening present value of Scheme liabilities (1,602.6) (1,704.5) Interest cost (36.4) (41.2) Actuarial gain/(loss) on Scheme liabilities based on:
Change in demographic assumptions 30.0 (2.3) Change in financial assumptions (269.6) 97.2 Experience (losses)/gains (23.3) 6.1
Net benefits paid out and transfers 44.4 42.1 Closing present value of Scheme liabilities (1,857.5) (1,602.6)
The net actuarial losses are primarily due to an increase in value of the financial assumption for inflation (see Assumptions section on the following page).
2021 2020
All figures in £ million Quoted
Not quoted in an active
market Total Quoted
Not quoted in an active
market Total
Equities 140.2 47.4 187.6 113.5 47.3 160.8 LDI investment 362.3 – 362.3 347.5 – 347.5 Asset backed security investments 455.6 – 455.6 465.0 – 465.0 Alternative bonds1 254.8 – 254.8 215.3 – 215.3 Corporate bonds2 – 98.0 98.0 – 40.5 40.5 Property funds3 – 76.6 76.6 – 126.5 126.5 Cash and cash equivalents – 49.3 49.3 – 15.8 15.8 Insurance buy-in policy – 588.0 588.0 – 546.0 546.0 Derivatives – (0.4) (0.4) – (5.1) (5.1) Total market value of assets 1,212.9 858.9 2,071.8 1,141.3 771.0 1,912.3
All figures in £ million 2021 2020
Opening fair value of Scheme assets 1,912.3 1,963.6 Interest income on Scheme assets 43.5 47.7 Re-measurement gain/(loss) on Scheme assets 158.8 (61.2) Contributions by the employer 2.9 5.5 Net benefits paid out and transfers (44.4) (42.1) Administrative expenses (1.3) (1.2) Closing fair value of Scheme assets 2,071.8 1,912.3
158 QinetiQ Group plc

Notes to the Financial Statements continued
QinetiQ Group plc Annual Report and Accounts 2021 133
Financial Statements
Revenue by major customer type For the year ended 31 March
‘Other’ does not contain any customers with revenue in excess of 10% of total Group revenue.
The following table shows the aggregate amount of revenue allocated to performance obligations that are unsatisfied (or partially satisfied) as at the end of the reporting period:
Management expects that 27% (£800.5m) of revenue allocated to unsatisfied contracts as of 31 March 2021 will be recognised as revenue during the next reporting period.
The following table shows the aggregate amount of revenue allocated to performance obligations that were unsatisfied (or partially satisfied) as at the end of the prior reporting period:
Revenue of £144m was recognised during the year that was previously unrecognised as at the previous year end and reported as a contract liability.
3. Segmental analysis
The analysis by business segment is presented in accordance with IFRS 8 Operating Segments, on the basis of those reportable segments whose operating results are regularly reviewed by the Board (the Chief Operating Decision Maker as defined by IFRS 8) and are aligned with the Group’s strategic direction, determined with reference to the products and services they provide, as follows:
EMEA Services provides technical assurance, test and evaluation and training services, underpinned by long-term contracts. EMEA Services comprises the following business units which are not considered reportable segments as defined by IFRS 8: Maritime & Land; Air & Space, Cyber & Information and the International business.
Global Products combines all other business units not aggregated within EMEA Services, including the QinetiQ US business, Space Products and EMEA Products (which includes QinetiQ Target Systems). Generally these business units (which are not considered reportable segments as defined by IFRS 8) deliver innovative solutions and products which includes contract-funded research and development and developing intellectual property in partnership with key customers and through internal funding with potential for new revenue streams.
Operating segments
1 The measure of profit presented to the Chief Operating Decision Maker is operating profit stated before specific adjusting items (‘underlying operating profit’). The specific adjusting items are detailed in note 4.
2 Definitions of the Group’s ‘Alternative performance measures’ can be found in the glossary on page 183.
No measure of segmental assets and liabilities is reported as this information is not regularly provided to the Chief Operating Decision Maker.
All figures in £ million 2021 2020
UK government 794.6 667.2
US government 140.8 116.2
Other 342.8 289.5
Total revenue 1,278.2 1,072.9
All figures in £ million 2022 2023 2024 2025+ Total
Total forecast revenue allocated to unsatisfied performance obligations 800.5 523.9 395.9 1,223.8 2,944.1
All figures in £ million 2021 2022 2023 2024+ Total
Total forecast revenue allocated to unsatisfied performance obligations 849.3 484.9 375.5 1,395.2 3,104.9
2021 2020
All figures in £ million
Revenue from
external customers
Underlying operating
profit1
Revenue from
external customers
Underlying operating
profit1
EMEA Services 939.9 118.6 797.4 100.6
Global Products 338.3 33.2 275.5 32.6
Total operating segments 1,278.2 151.8 1,072.9 133.2
Underlying operating margin2 11.9% 12.4%
Notes to the Financial Statements continued
QinetiQ Group plc Annual Report and Accounts 2021 159
Financial Statements
Assumptions The major assumptions used in the IAS 19 valuation of the Scheme’s liabilities were:
The assumptions used by the actuary are the best estimates chosen from a range of possible actuarial assumptions which, because of the timescale covered, may not necessarily be borne out in practice. It is important to note that these assumptions are long term and, in the case of the discount rate and the inflation rate, are measured by reference to external market indicators. The discount rate is based on observable yields on corporate bonds but there is no direct, observable market rate for CPI. A ‘market approach’ to deriving CPI involves adjusting a market-based RPI rate downward by an ‘inflation risk premium’ and an RPI-CPI adjustment factor (determined from relevant market yield curves). This market-based approach is required by IAS 19 and results in a CPI inflation rate significantly in excess of the Bank of England long term target and also in excess of a consensus view of CPI (based on surveys of economists). However, adopting an economic consensus approach to setting CPI inflation is not acceptable under accounting standards. Noting that an economic consensus view may be a more likely outcome than a market-based approach (which is currently impacted by significant uncertainty in respect of the UK Government’s RPI reform) the table below sets out what the Scheme liability and net surplus would be if calculated using CPI inflation rates of 2.0% and 2.2%.
Present value of Scheme liabilities and net pension asset if calculated using different CPI inflation assumptions
The sensitivity of the Scheme liabilities to higher or lower inflation rate assumptions, along with sensitivities to the discount rate and life expectancy assumptions is shown below.
The mortality assumptions as at 31 March 2021 were based on the S3 Normal Lives base tables, with various scaling factors based on sex and status. Allowance was made for improvements in mortality in line with CMI_2020 Core Projections and a long-term rate of improvement of 1.25% per annum.
The mortality assumptions as at 31 March 2020 were 90% of S2PMA for males and 90% of S2PFA for females, based on year of birth making allowance for improvements in mortality in line with CMI_2019 Core Projections and a long-term rate of improvement of 1.5% per annum.
The funding of the Scheme is based on long-term trends and assumptions relating to market growth, as advised by qualified actuaries and investment advisors. The weighted average duration of the defined benefit obligation is approximately 20 years.
Sensitivity analysis of the principal assumptions
The impact of movements in Scheme liabilities will, to an extent, be offset by movements in the value of Scheme assets as the Scheme has assets invested in a Liability Driven Investment portfolio. As at 31 March 2021 this hedges against approximately 90% of the interest rate risk and also 90% of the inflation rate risk, as measured on the Trustees’ gilt-funded basis.
The above sensitivity analyses are based on a change in an assumption while holding all other assumptions constant. In practice, this is unlikely to occur, and changes in some of the assumptions may be correlated. When calculating the sensitivity of the defined benefit obligation to significant actuarial assumptions the same method (projected unit credit method) has been applied as when calculating the pension liability recognised within the statement of financial position. The methods and types of assumption did not change.
All figures in £ million 2021 2020
Discount rate applied to Scheme liabilities 2.10% 2.30%
CPI inflation assumption 2.60% 1.90%
Assumed life expectancies in years:
Future male pensioners (currently aged 60) 86.7 87.4
Future female pensioners (currently aged 60) 88.6 89.5
Future male pensioners (currently aged 40) 88.4 88.9
Future female pensioners (currently aged 40) 90.7 91.0
All figures in £ million CPI of 2.0% CPI of 2.2%
Total market value of assets 2,071.8 2,071.8
Present value of Scheme liabilities (1,662.6) (1,726.6)
Net pension asset (before deferred tax) 409.2 345.2
Assumption Change in assumption Indicative impact on Scheme
liabilities (before deferred tax) Indicative impact on
net pension asset
Discount rate Increase/decrease by 0.1% Decrease/increase by £33m Decrease/increase by £11m
Rate of inflation Increase/decrease by 0.1% Increase/decrease by £32m Increase/decrease by £8m
Life expectancy Increase by 1 year Increase by £62m Decrease by £42m
159Annual Report & Accounts 2021
Financial Statements

Notes to the Financial Statements For the year ended 31 March
QinetiQ Group plc Annual Report and Accounts 2021 132
1. Significant changes in the current reporting period
The financial position and performance of the Group was particularly affected by the following events and transactions during the reporting period:
1) The acquisition of Naimuri Limited (see note 12) which resulted in an increase in goodwill (note 14) and other intangible assets (note 15);
2) The divestment of the Boldon James, Commerce Decisions and OptaSense businesses (see note 13); 3) An impairment of goodwill in respect of the Germany business (see note 14).
For a detailed discussion of the Group’s performance and financial position refer to the Strategic Report on pages 2 to 51.
2. Revenue from contracts with customers and other income
Revenue and other income is analysed as follows:
Revenue by category and other income For the year ended 31 March
1 For the period of which there was no contribution in the equivalent period in the comparator year which was pre-ownership (for acquisitions) or post-ownership (for disposals) by the Group
2 Alternative performance measures are used to supplement the statutory figures. See page 183.
Other income
Revenue and profit after tax of associates and joint ventures was £12.6m and £1.1m respectively (2020: revenue of £18.1m and loss after tax of £1.5m). The figures in the table above represent the Group share of this profit after tax.
Other income is in respect of property rentals and the recovery of other related property costs.
Revenue by customer geographic location For the year ended 31 March
All figures in £ million 2021 2020
Services contracts with customers 1,189.4 945.6
Sale of goods contracts with customers 83.0 116.8
Royalties and licences 5.8 10.5
Total revenue 1,278.2 1,072.9
Less: adjust current year for acquired businesses1 (117.2) –
Less: adjust prior year for disposed businesses1 – (17.2)
Adjust to constant prior year exchange rates 2.2 –
Total revenue on an organic, constant currency basis2 1,163.2 1,055.7
Organic revenue growth at constant currency2 10% 10%
All figures in £ million 2021 2020
Share of associates’ and joint ventures’ profit/(loss) after tax 0.7 (0.7)
Other income 9.2 9.9
Other income – underlying 9.9 9.2
Specific adjusting item: gain on sale of property (note 4) 0.1 14.0
Total other income 10.0 23.2
All figures in £ million 2021 2020
US 215.6 136.0
Australia 77.9 60.7
Europe 88.2 75.9
Middle east 9.8 16.3
Rest of world 28.9 44.5
International 420.4 333.4
United Kingdom 857.8 739.5
Total revenue 1,278.2 1,072.9
International revenue % 33% 31%
Revenue from ‘home countries’ (UK, US and Australia) 1,151.3 936.2
Home countries revenue % 90% 87%
Notes to the Financial Statements For the year ended 31 March
QinetiQ Group plc Annual Report and Accounts 2021 160
28. Post-retirement benefits (continued)
In addition to the sensitivity of the liability side of the net pension asset (which will impact the value of the net pension asset) the net pension asset is also exposed to significant variation due to changes in the fair value of Scheme assets. A specific sensitivity on assets has not been included in the above table but any change in valuation of assets flows straight through to the value of the net pension asset e.g. if equities fall by £10m then the net pension asset falls by £10m. The values of unquoted assets assume that an available buyer is willing to purchase those assets at that value. For the Group’s portfolio of assets, the property portfolio of £76.6m, the unquoted corporate bonds of £98.0m and the unquoted equities of £47.4m are the assets with most uncertainty as to valuation as at 31 March 2021.
Risks Through its defined benefit pension plan, the Group is exposed to a number of risks, the most significant of which are detailed below:
The accounting assumptions noted above are used to calculate the year end net pension asset in accordance with the relevant accounting standard, IAS 19 (revised) ‘Employee Benefits’. Changes in these assumptions have no impact on the Group’s cash payments into the Scheme. The payments into the Scheme are reassessed after every triennial valuation. The triennial valuations are calculated on a funding basis and use a different set of assumptions, as agreed with the pension Trustees. The key assumption that varies between the two methods of valuation is the discount rate. The funding basis valuation uses the risk-free rate from UK gilts as the base for calculating the discount rate, whilst the IAS 19 accounting basis valuation uses corporate bond yields as the base.
29. Share capital and other reserves
Shares allotted, called up and fully paid:
Except as noted below all shares in issue at 31 March 2021 rank pari-passu in all respects.
Rights attaching to the Special Share QinetiQ carries out activities which are important to UK defence and security interests. To protect these interests in the context of the ongoing commercial relationship between the MOD and QinetiQ, and to promote and reinforce the Compliance Principles, the MOD holds a Special Share in QinetiQ. QinetiQ obtained MOD consent to changes in its Special Shareholder rights, which were approved by shareholders at the 2012 AGM. The changes to the Special Share were disclosed in the 2012 Annual Report. Subsequent to the changes approved at the 2012 AGM the Special Share confers certain rights on the holder:
a) to require the Group to implement and maintain the Compliance System (as defined in the Articles of Association) so as to make at all times effective its and each member of QinetiQ Controlled Group’s application of the Compliance Principles, in a manner acceptable to the Special Shareholder
b) to refer matters to the Board for its consideration in relation to the application of the Compliance Principles c) to require the Board to obtain Special Shareholder’s consent: i) if at any time when the chairman is not a British citizen, it is proposed to appoint any person to the office of chief executive, who is
not a British citizen ii) if at any time when the chief executive is not a British citizen, it is proposed to appoint any person to the office of chairman, who is
not a British citizen d) to require the Board to take action to rectify any omission in the application of the Compliance Principles, if the Special Shareholder is of
the opinion that such steps are necessary to protect the defence or security interests of the United Kingdom e) to demand a poll at any of QinetiQ’s meetings (even though it may have no voting rights except those specifically set out in the Articles).
The Special Shareholder has an option to purchase defined Strategic Assets of the Group in certain circumstances. The Special Shareholder has, inter alia, the right to purchase any Strategic Assets which the Group wishes to sell. Strategic Assets are normally testing and research facilities (see note 31 for further details).
Volatility in market conditions Results under IAS 19 can change dramatically depending on market conditions. The present value of Scheme liabilities is linked to yields on AA-rated corporate bonds, while many of the assets of the Scheme are invested in various forms of assets subject to fluctuating valuations. Changing markets in conjunction with discount rate volatility will lead to volatility in the net pension asset on the Group’s balance sheet and in other comprehensive income. To a lesser extent this will also lead to volatility in the IAS 19 pension net finance income in the Group’s income statement.
Choice of accounting assumptions
The calculation of the present value of Scheme liabilities involves projecting future cash flows from the Scheme many years into the future. This means that the assumptions used can have a material impact on the balance sheet position and profit and loss charge. In practice future experience within the Scheme may not be in line with the assumptions adopted. For example, members could live longer than foreseen or inflation could be higher or lower than allowed for in the calculation of the liabilities.
Ordinary shares
of 1p each (equity) Special Share
of £1 (non-equity) Total
£ Number £ Number £ Number
As at 1 April 2020 5,717,571 571,757,121 1 1 5,717,572 571,757,122
Issue of new shares 25,000 2,500,000 – – 25,000 2,500,000
At 31 March 2021 5,742,571 574,257,121 1 1 5,742,572 574,257,122
160 QinetiQ Group plc

Notes to the Financial Statements continued
QinetiQ Group plc Annual Report and Accounts 2021 133
Financial Statements
Revenue by major customer type For the year ended 31 March
‘Other’ does not contain any customers with revenue in excess of 10% of total Group revenue.
The following table shows the aggregate amount of revenue allocated to performance obligations that are unsatisfied (or partially satisfied) as at the end of the reporting period:
Management expects that 27% (£800.5m) of revenue allocated to unsatisfied contracts as of 31 March 2021 will be recognised as revenue during the next reporting period.
The following table shows the aggregate amount of revenue allocated to performance obligations that were unsatisfied (or partially satisfied) as at the end of the prior reporting period:
Revenue of £144m was recognised during the year that was previously unrecognised as at the previous year end and reported as a contract liability.
3. Segmental analysis
The analysis by business segment is presented in accordance with IFRS 8 Operating Segments, on the basis of those reportable segments whose operating results are regularly reviewed by the Board (the Chief Operating Decision Maker as defined by IFRS 8) and are aligned with the Group’s strategic direction, determined with reference to the products and services they provide, as follows:
EMEA Services provides technical assurance, test and evaluation and training services, underpinned by long-term contracts. EMEA Services comprises the following business units which are not considered reportable segments as defined by IFRS 8: Maritime & Land; Air & Space, Cyber & Information and the International business.
Global Products combines all other business units not aggregated within EMEA Services, including the QinetiQ US business, Space Products and EMEA Products (which includes QinetiQ Target Systems). Generally these business units (which are not considered reportable segments as defined by IFRS 8) deliver innovative solutions and products which includes contract-funded research and development and developing intellectual property in partnership with key customers and through internal funding with potential for new revenue streams.
Operating segments
1 The measure of profit presented to the Chief Operating Decision Maker is operating profit stated before specific adjusting items (‘underlying operating profit’). The specific adjusting items are detailed in note 4.
2 Definitions of the Group’s ‘Alternative performance measures’ can be found in the glossary on page 183.
No measure of segmental assets and liabilities is reported as this information is not regularly provided to the Chief Operating Decision Maker.
All figures in £ million 2021 2020
UK government 794.6 667.2
US government 140.8 116.2
Other 342.8 289.5
Total revenue 1,278.2 1,072.9
All figures in £ million 2022 2023 2024 2025+ Total
Total forecast revenue allocated to unsatisfied performance obligations 800.5 523.9 395.9 1,223.8 2,944.1
All figures in £ million 2021 2022 2023 2024+ Total
Total forecast revenue allocated to unsatisfied performance obligations 849.3 484.9 375.5 1,395.2 3,104.9
2021 2020
All figures in £ million
Revenue from
external customers
Underlying operating
profit1
Revenue from
external customers
Underlying operating
profit1
EMEA Services 939.9 118.6 797.4 100.6
Global Products 338.3 33.2 275.5 32.6
Total operating segments 1,278.2 151.8 1,072.9 133.2
Underlying operating margin2 11.9% 12.4%
Notes to the Financial Statements continued
QinetiQ Group plc Annual Report and Accounts 2021 161
Financial Statements
The Special Share may only be issued to, held by and transferred to HM Government (or as it directs). At any time the Special Shareholder may require QinetiQ to redeem the Special Share at par. If QinetiQ is wound up the Special Shareholder will be entitled to be repaid the capital paid up on the Special Share before other shareholders receive any payment. The Special Shareholder has no other right to share in the capital or profits of QinetiQ.
The Special Shareholder must give consent to a general meeting held on short notice.
The Special Share entitles the Special Shareholder to require certain persons who hold (together with any person acting in concert with them) a material interest in QinetiQ to dispose of some or all of their ordinary shares in certain prescribed circumstances on the grounds of national security or conflict of interest.
The Directors must register any transfer of the Special Share within seven days.
Other reserves The translation reserve includes the cumulative foreign exchange difference arising on translation since the Group transitioned to IFRS. Movements on hedge instruments, where the hedge is effective, are recorded in the hedge reserve until the hedge ceases.
The capital redemption reserve, which was created following the redemption of preference share capital and the bonus issue of shares, cannot be distributed.
Own shares Own shares represent shares in the Company that are held by independent trusts and include treasury shares and shares held by the employee share ownership plan. Included in retained earnings at 31 March 2021 are 5,020,832 shares (2020: 6,123,406 shares).
30. Share-based payments
The Group operates a number of share-based payment plans for employees. The total share-based payment expense in the year was £11.2m, of which £11.2m related to equity-settled schemes and nil related to cash-settled schemes (2020: £7.5m, of which £7.5m related to equity-settled schemes and nil to cash-settled schemes). The share-based payment charged to equity is £10.6m consisting of the £11.2m charge to the income statement offset by a £0.4m charge to equity in respect of dividends accruing on unvested awards and £0.2m in respect of cash payment of the Bonus Banking Plan (BBP).
Performance Share Plan (PSP) During the year there were no further grants of PSP awards to employees as this scheme has been phased out. The awards vest after three years with 50% of the awards subject to TSR conditions and 50% subject to EPS conditions as detailed in the Report from the Remuneration Committee.
PSP awards are equity-settled awards and have vested on 22 June 2020. There is no exercise price for these PSP awards. Monte Carlo modelling was used to fair value the TSR element of the awards at grant date.
Group Share Incentive Plan (SIP) Under the QinetiQ SIP the Group offers UK employees the opportunity of purchasing up to £150 worth of shares a month at the prevailing market rate. The Group will make a matching share award of a third of the employee’s payment. The Group’s matching shares may be forfeited if the employee ceases to be employed by QinetiQ within three years of the award of the shares. There is no exercise price for these SIP awards.
SIP matching shares are equity-settled awards; those outstanding at 31 March 2021 had an average remaining life of 1.5 years (2020: 1.5 years). There is no exercise price for these SIP awards. Of the shares outstanding at the end of the year nil were exercisable (2020: nil).
2021 Number
of shares
2020 Number
of shares
Outstanding at start of the year 103,314 2,915,111
Exercised during the year (40,347) (800,356)
Forfeited/lapsed during the year (62,967) (2,011,441)
Outstanding at end of the year – 103,314
2021 Number of matching
shares
2020 Number of matching
shares
Outstanding at start of the year 746,645 782,362
Awarded during the year 300,420 259,317
Exercised during the year (291,851) (251,278)
Forfeited during the year (20,812) (43,756)
Outstanding at end of the year 734,402 746,645
161Annual Report & Accounts 2021
Financial Statements

Notes to the Financial Statements For the year ended 31 March
QinetiQ Group plc Annual Report and Accounts 2021 132
1. Significant changes in the current reporting period
The financial position and performance of the Group was particularly affected by the following events and transactions during the reporting period:
1) The acquisition of Naimuri Limited (see note 12) which resulted in an increase in goodwill (note 14) and other intangible assets (note 15);
2) The divestment of the Boldon James, Commerce Decisions and OptaSense businesses (see note 13); 3) An impairment of goodwill in respect of the Germany business (see note 14).
For a detailed discussion of the Group’s performance and financial position refer to the Strategic Report on pages 2 to 51.
2. Revenue from contracts with customers and other income
Revenue and other income is analysed as follows:
Revenue by category and other income For the year ended 31 March
1 For the period of which there was no contribution in the equivalent period in the comparator year which was pre-ownership (for acquisitions) or post-ownership (for disposals) by the Group
2 Alternative performance measures are used to supplement the statutory figures. See page 183.
Other income
Revenue and profit after tax of associates and joint ventures was £12.6m and £1.1m respectively (2020: revenue of £18.1m and loss after tax of £1.5m). The figures in the table above represent the Group share of this profit after tax.
Other income is in respect of property rentals and the recovery of other related property costs.
Revenue by customer geographic location For the year ended 31 March
All figures in £ million 2021 2020
Services contracts with customers 1,189.4 945.6
Sale of goods contracts with customers 83.0 116.8
Royalties and licences 5.8 10.5
Total revenue 1,278.2 1,072.9
Less: adjust current year for acquired businesses1 (117.2) –
Less: adjust prior year for disposed businesses1 – (17.2)
Adjust to constant prior year exchange rates 2.2 –
Total revenue on an organic, constant currency basis2 1,163.2 1,055.7
Organic revenue growth at constant currency2 10% 10%
All figures in £ million 2021 2020
Share of associates’ and joint ventures’ profit/(loss) after tax 0.7 (0.7)
Other income 9.2 9.9
Other income – underlying 9.9 9.2
Specific adjusting item: gain on sale of property (note 4) 0.1 14.0
Total other income 10.0 23.2
All figures in £ million 2021 2020
US 215.6 136.0
Australia 77.9 60.7
Europe 88.2 75.9
Middle east 9.8 16.3
Rest of world 28.9 44.5
International 420.4 333.4
United Kingdom 857.8 739.5
Total revenue 1,278.2 1,072.9
International revenue % 33% 31%
Revenue from ‘home countries’ (UK, US and Australia) 1,151.3 936.2
Home countries revenue % 90% 87%
Notes to the Financial Statements For the year ended 31 March
QinetiQ Group plc Annual Report and Accounts 2021 162
30. Share-based payments (continued) Bonus Banking Plan (BBP) During the year the Group granted BBP awards to certain senior executives in the UK and US.
The BBP is a remuneration scheme that runs in three-year performance cycles, with each cycle vesting over a four-year period. Under the BBP a contribution will be made by the Company into the participant’s Plan account following the end of each Plan year. 50% of the value of a participant’s Plan account will be paid out annually for three years with 100% of the residual value paid out at the end of year four. 50% of the unpaid balance of a participant’s bonus account will be at risk of forfeiture. Refer to the Directors’ Remuneration Report for further details.
At 31 March 2021 the awards had an average remaining life of 1.2 years (2020: 1.2 years). There is no exercise price for these awards. The fair value of the awards at 31 March 2021 was £3.22 (2020: £3.22) being the Group’s 30 day average on 31 March. Of the awards outstanding at the end of the year nil were exercisable.
Deferred Share Plan (DSP) During the year the Group granted DSP awards to certain employees.
Early in the financial year QinetiQ’s top 200 leaders are provisionally awarded contingent shares in the Company. The number of awards is dependent on the Group’s performance during the year (specifically with respect to the level of non-UK revenue growth). This is provisionally quantified at year end based on Group performance and also the number of eligible employees in employment as at 31 March. Actual awards are made in the following June and the final number awarded will be slightly different to the number provisionally calculated. Awards are then subject to a three-year vesting period and a further two-year holding period. Vesting of the awards is contingent upon Group operating profit in the year prior to vesting being maintained at the level reported during the year prior to award. Refer to the Directors’ Remuneration Report for further details.
At 31 March 2021 the awards had an average remaining life of 1.8 years (2020: 1.7 years). There is no exercise price for these awards. The fair value of the DSP’s provisionally awarded at 31 March 2021 was £3.22 being the Group’s 30 day average on 31 March. The weighted average share price at date of exercise was £3.09 (2020: nil). Of the awards outstanding at the end of the year nil were exercisable.
Restricted share plan (RSP) During the year the Group granted RSP awards to certain senior executives in the UK.
At 31 March 2021 the awards had an average remaining life of 1.4 years (2020: 0.7 years). There is no exercise price for these awards. The weighted average fair value of grants made during the year was £2.60 (2020: £3.03). The weighted average share price at date of exercise was £2.90 (2020: £2.86). Of the options outstanding at the end of the year nil were exercisable (2020: nil).
2021 Number of matching
shares
2020 Number of matching
shares
Outstanding at start of the year 1,811,792 1,431,672
Granted during the year 764,822 679,920
Exercised during the year (595,978) (299,800)
Forfeited/lapsed during the year (37,781) –
Outstanding at end of the year 1,942,855 1,811,792
2021
Number of awards
2020 Number of
awards
Outstanding at start of the year 4,881,077 4,758,085
Difference between actual awards in year and amount provisionally awarded in prior year – 368,558
Lapsed during the year (275,534) (245,566)
Exercised during the year (545,582) –
Provisionally awarded during the year 2,701,401 –
Outstanding at end of the year 6,761,362 4,881,077
Provisional awards outstanding 2,701,401 –
Awards outstanding 4,059,961 4,881,077
Outstanding at end of the year 6,761,362 4,881,077
2021 Number of
awards
2020 Number of
awards
Outstanding at start of the year 71,355 44,014
Granted during the year 145,257 47,291
Exercised during the year (47,424) (14,908)
Lapsed during the year (20,331) (5,042)
Outstanding at end of the year 148,857 71,355
162 QinetiQ Group plc

Notes to the Financial Statements continued
QinetiQ Group plc Annual Report and Accounts 2021 133
Financial Statements
Revenue by major customer type For the year ended 31 March
‘Other’ does not contain any customers with revenue in excess of 10% of total Group revenue.
The following table shows the aggregate amount of revenue allocated to performance obligations that are unsatisfied (or partially satisfied) as at the end of the reporting period:
Management expects that 27% (£800.5m) of revenue allocated to unsatisfied contracts as of 31 March 2021 will be recognised as revenue during the next reporting period.
The following table shows the aggregate amount of revenue allocated to performance obligations that were unsatisfied (or partially satisfied) as at the end of the prior reporting period:
Revenue of £144m was recognised during the year that was previously unrecognised as at the previous year end and reported as a contract liability.
3. Segmental analysis
The analysis by business segment is presented in accordance with IFRS 8 Operating Segments, on the basis of those reportable segments whose operating results are regularly reviewed by the Board (the Chief Operating Decision Maker as defined by IFRS 8) and are aligned with the Group’s strategic direction, determined with reference to the products and services they provide, as follows:
EMEA Services provides technical assurance, test and evaluation and training services, underpinned by long-term contracts. EMEA Services comprises the following business units which are not considered reportable segments as defined by IFRS 8: Maritime & Land; Air & Space, Cyber & Information and the International business.
Global Products combines all other business units not aggregated within EMEA Services, including the QinetiQ US business, Space Products and EMEA Products (which includes QinetiQ Target Systems). Generally these business units (which are not considered reportable segments as defined by IFRS 8) deliver innovative solutions and products which includes contract-funded research and development and developing intellectual property in partnership with key customers and through internal funding with potential for new revenue streams.
Operating segments
1 The measure of profit presented to the Chief Operating Decision Maker is operating profit stated before specific adjusting items (‘underlying operating profit’). The specific adjusting items are detailed in note 4.
2 Definitions of the Group’s ‘Alternative performance measures’ can be found in the glossary on page 183.
No measure of segmental assets and liabilities is reported as this information is not regularly provided to the Chief Operating Decision Maker.
All figures in £ million 2021 2020
UK government 794.6 667.2
US government 140.8 116.2
Other 342.8 289.5
Total revenue 1,278.2 1,072.9
All figures in £ million 2022 2023 2024 2025+ Total
Total forecast revenue allocated to unsatisfied performance obligations 800.5 523.9 395.9 1,223.8 2,944.1
All figures in £ million 2021 2022 2023 2024+ Total
Total forecast revenue allocated to unsatisfied performance obligations 849.3 484.9 375.5 1,395.2 3,104.9
2021 2020
All figures in £ million
Revenue from
external customers
Underlying operating
profit1
Revenue from
external customers
Underlying operating
profit1
EMEA Services 939.9 118.6 797.4 100.6
Global Products 338.3 33.2 275.5 32.6
Total operating segments 1,278.2 151.8 1,072.9 133.2
Underlying operating margin2 11.9% 12.4%
Notes to the Financial Statements continued
QinetiQ Group plc Annual Report and Accounts 2021 163
Financial Statements
Value Creation Plan (VCP) During the year the Group granted awards under a new Value Creation Plan to certain senior executives in the US.
At 31 March 2021 the awards had an average remaining life of 2.2 years. There is no exercise price for these awards. The weighted average fair value of grants made during the year was £2.99. Of the options outstanding at the end of the year nil were exercisable.
High Performance Share Award (HPSA) During the year, as one of eight initial measures in response to the COVID-19 pandemic, the senior leaders agreed to, on average, a temporary base salary reduction of 15%. To both recognise the senior leaders for their sacrifice and to incentivise them to lead the Group through the crisis as quickly and effectively as possible, the Group adopted a new award called High Performance Share Award (HPSA). The HPSA was awarded in November 2020 as a ‘Thank Q’ to senior leaders for their sacrifice and enormous efforts to lead their teams out of unprecedented crisis. The fair value of QinetiQ shares on grant date was £2.70 and the awards vest in June 2023. At 31 March 2021 the awards had an average remaining life of 2.3 years. Of the awards outstanding at the end of the year nil were exercisable.
Inzpire acquisition incentives During the year ended 31 March 2019, the Group granted 399,708 shares to 136 employees of Inzpire Limited as part of the acquisition deal. The Group issued share-based payment awards to all Inzpire employees on 30 November 2018 which is the grant date. The fair value of QinetiQ shares on grant date was £2.97 and the awards vested after two years on 30 November 2020 subject to continued employment at the date of vesting.
Other performance incentives During the year, as part of the Group’s COVID-19 response measures, the Group elected to settle the prior year outstanding bonuses via an award of shares rather than the previously anticipated cash settlement. The fair value of QinetiQ shares on grant date was £3.07 and the awards vested immediately on award.
Valuation of share-based awards Share-based awards that vest based on non-market performance conditions have been valued at the share price at grant date and are equity-settled.
2021 Number of
awards
2020 Number of
awards
Outstanding at start of the year – –
Granted during the year 335,848 –
Exercised during the year – –
Lapsed during the year – –
Outstanding at end of the year 335,848 ––
2021 Number of
awards
2020 Number of
awards
Outstanding at start of the year – –
Granted during the year 1,336,372 –
Exercised during the year – –
Lapsed during the year – –
Outstanding at end of the year 1,336,372 –
2021 Number of
awards
2020 Number of
awards
Outstanding at start of the year 343,265 399,708
Granted during the year – –
Lapsed during the year (25,701) (56,443)
Exercised during the year (317,564) –
Outstanding at end of the year – 343,265
2021 Number of
awards
2020 Number of
awards
Outstanding at start of the year – –
Granted during the year 4,796,981 –
Exercised during the year (4,796,981) –
Outstanding at end of the year – –
163Annual Report & Accounts 2021
Financial Statements

Notes to the Financial Statements For the year ended 31 March
QinetiQ Group plc Annual Report and Accounts 2021 132
1. Significant changes in the current reporting period
The financial position and performance of the Group was particularly affected by the following events and transactions during the reporting period:
1) The acquisition of Naimuri Limited (see note 12) which resulted in an increase in goodwill (note 14) and other intangible assets (note 15);
2) The divestment of the Boldon James, Commerce Decisions and OptaSense businesses (see note 13); 3) An impairment of goodwill in respect of the Germany business (see note 14).
For a detailed discussion of the Group’s performance and financial position refer to the Strategic Report on pages 2 to 51.
2. Revenue from contracts with customers and other income
Revenue and other income is analysed as follows:
Revenue by category and other income For the year ended 31 March
1 For the period of which there was no contribution in the equivalent period in the comparator year which was pre-ownership (for acquisitions) or post-ownership (for disposals) by the Group
2 Alternative performance measures are used to supplement the statutory figures. See page 183.
Other income
Revenue and profit after tax of associates and joint ventures was £12.6m and £1.1m respectively (2020: revenue of £18.1m and loss after tax of £1.5m). The figures in the table above represent the Group share of this profit after tax.
Other income is in respect of property rentals and the recovery of other related property costs.
Revenue by customer geographic location For the year ended 31 March
All figures in £ million 2021 2020
Services contracts with customers 1,189.4 945.6
Sale of goods contracts with customers 83.0 116.8
Royalties and licences 5.8 10.5
Total revenue 1,278.2 1,072.9
Less: adjust current year for acquired businesses1 (117.2) –
Less: adjust prior year for disposed businesses1 – (17.2)
Adjust to constant prior year exchange rates 2.2 –
Total revenue on an organic, constant currency basis2 1,163.2 1,055.7
Organic revenue growth at constant currency2 10% 10%
All figures in £ million 2021 2020
Share of associates’ and joint ventures’ profit/(loss) after tax 0.7 (0.7)
Other income 9.2 9.9
Other income – underlying 9.9 9.2
Specific adjusting item: gain on sale of property (note 4) 0.1 14.0
Total other income 10.0 23.2
All figures in £ million 2021 2020
US 215.6 136.0
Australia 77.9 60.7
Europe 88.2 75.9
Middle east 9.8 16.3
Rest of world 28.9 44.5
International 420.4 333.4
United Kingdom 857.8 739.5
Total revenue 1,278.2 1,072.9
International revenue % 33% 31%
Revenue from ‘home countries’ (UK, US and Australia) 1,151.3 936.2
Home countries revenue % 90% 87%
Notes to the Financial Statements For the year ended 31 March
QinetiQ Group plc Annual Report and Accounts 2021 164
31. Transactions with the Ministry of Defence (MOD)
The MOD continues to own its Special Share in QinetiQ which conveys certain rights as set out in note 29. Transactions between the Group and the MOD are disclosed as follows:
Freehold land and buildings and surplus properties Under the terms of the Group’s acquisition of part of the business and certain assets of DERA from the MOD on 1 July 2001, the MOD retained certain rights in respect of the freehold land and buildings transferred.
Restrictions on transfer of title The title deeds of those properties with strategic assets (see below) include a clause that prevents their transfer without the approval of the MOD. The MOD also has the right to purchase any strategic assets in certain circumstances.
MOD’s generic compliance regime Adherence to the generic compliance system is monitored by the Risk & Security Committee. Refer to the Committee’s report within the Corporate Governance Statement on page 94.
Strategic assets Under the Principal Agreement with the MOD, the QinetiQ controlled Group is not permitted without the written consent of the MOD, to:
i) dispose of or destroy all or any part of a strategic asset; or ii) voluntarily undertake any closure of, or cease to provide a strategic capability by means of, all or any part of a strategic asset.
The net book value of assets identified as being strategic assets as at 31 March 2021 was £3.0m (2020: £3.8m).
Long Term Partnering Agreement On 27 February 2003 QinetiQ Limited entered into a Long Term Partnering Agreement (LTPA) to provide test and evaluation (T&E) facilities and training support services to the MOD. This is a 25-year contract with a total revenue value of up to £5.6bn, dependent on the level of usage by the MOD, under which QinetiQ Limited is committed to providing T&E services with increasing efficiencies through cost saving and innovative service delivery. Following an amendment to the LTPA contract on 5 April 2019 this contract is no longer subject to re-pricing every five years and is now contracted at a fixed price to 31 March 2028.
Other contracts with MOD The LTPA is the most significant contract QinetiQ has with the MOD. In total approximately 57% (2020: 57%) of the Group’s revenue comes directly from contracts with the MOD.
32. Contingent liabilities and assets
Subsidiary undertakings within the Group have given unsecured guarantees of £31.6m at 31 March 2021 (2020: £40.4m) in the ordinary course of business, typically in respect of performance bonds and rental guarantees.
The Company has on occasion been required to take legal action to protect its intellectual property rights, to enforce commercial contracts or otherwise and similarly to defend itself against proceedings brought by other parties, including in respect of environmental and regulatory issues. Provisions are made for the expected costs associated with such matters, based on past experience of similar items and other known factors, taking into account professional advice received, and represent management’s best estimate of the likely outcome. The timing of utilisation of these provisions is uncertain pending the outcome of various court proceedings, ongoing investigations and negotiations. However, no provision is made for proceedings which have been or might be brought by other parties unless management, taking into account professional advice received, assesses that it is more likely than not that such proceedings may be successful. Contingent liabilities associated with such proceedings have been identified but the Directors are of the opinion that any associated claims that might be brought can be resisted successfully and therefore the possibility of any outflow in settlement is assessed as remote.
33. Capital commitments
The Group had the following capital commitments for which no provision has been made:
Capital commitments at 31 March 2021 include £25.3m (2020: £19.1m) in relation to property, plant and equipment that will be wholly funded by a third-party customer under long-term contract arrangements. These primarily relate to investments under the LTPA contract.
34. Related parties
During the year ended 31 March 2021 there were sales to associates and joint ventures of £6.0m (2020: £5.7m). At the year-end there were outstanding receivables from associates and joint ventures of £1.4m (2020: £2.1m).
All figures in £ million 2021 2020
Total contracted 33.0 32.0
164 QinetiQ Group plc

Notes to the Financial Statements continued
QinetiQ Group plc Annual Report and Accounts 2021 133
Financial Statements
Revenue by major customer type For the year ended 31 March
‘Other’ does not contain any customers with revenue in excess of 10% of total Group revenue.
The following table shows the aggregate amount of revenue allocated to performance obligations that are unsatisfied (or partially satisfied) as at the end of the reporting period:
Management expects that 27% (£800.5m) of revenue allocated to unsatisfied contracts as of 31 March 2021 will be recognised as revenue during the next reporting period.
The following table shows the aggregate amount of revenue allocated to performance obligations that were unsatisfied (or partially satisfied) as at the end of the prior reporting period:
Revenue of £144m was recognised during the year that was previously unrecognised as at the previous year end and reported as a contract liability.
3. Segmental analysis
The analysis by business segment is presented in accordance with IFRS 8 Operating Segments, on the basis of those reportable segments whose operating results are regularly reviewed by the Board (the Chief Operating Decision Maker as defined by IFRS 8) and are aligned with the Group’s strategic direction, determined with reference to the products and services they provide, as follows:
EMEA Services provides technical assurance, test and evaluation and training services, underpinned by long-term contracts. EMEA Services comprises the following business units which are not considered reportable segments as defined by IFRS 8: Maritime & Land; Air & Space, Cyber & Information and the International business.
Global Products combines all other business units not aggregated within EMEA Services, including the QinetiQ US business, Space Products and EMEA Products (which includes QinetiQ Target Systems). Generally these business units (which are not considered reportable segments as defined by IFRS 8) deliver innovative solutions and products which includes contract-funded research and development and developing intellectual property in partnership with key customers and through internal funding with potential for new revenue streams.
Operating segments
1 The measure of profit presented to the Chief Operating Decision Maker is operating profit stated before specific adjusting items (‘underlying operating profit’). The specific adjusting items are detailed in note 4.
2 Definitions of the Group’s ‘Alternative performance measures’ can be found in the glossary on page 183.
No measure of segmental assets and liabilities is reported as this information is not regularly provided to the Chief Operating Decision Maker.
All figures in £ million 2021 2020
UK government 794.6 667.2
US government 140.8 116.2
Other 342.8 289.5
Total revenue 1,278.2 1,072.9
All figures in £ million 2022 2023 2024 2025+ Total
Total forecast revenue allocated to unsatisfied performance obligations 800.5 523.9 395.9 1,223.8 2,944.1
All figures in £ million 2021 2022 2023 2024+ Total
Total forecast revenue allocated to unsatisfied performance obligations 849.3 484.9 375.5 1,395.2 3,104.9
2021 2020
All figures in £ million
Revenue from
external customers
Underlying operating
profit1
Revenue from
external customers
Underlying operating
profit1
EMEA Services 939.9 118.6 797.4 100.6
Global Products 338.3 33.2 275.5 32.6
Total operating segments 1,278.2 151.8 1,072.9 133.2
Underlying operating margin2 11.9% 12.4%
Notes to the Financial Statements continued
QinetiQ Group plc Annual Report and Accounts 2021 165
Financial Statements
35. Subsidiaries and other related undertakings
In accordance with section 409 of the Companies Act 2006, a full list of subsidiaries and other related undertakings as at 31 March 2021 is detailed below. Unless stated otherwise, the Group’s holding comprises ordinary shares which are held indirectly by QinetiQ Group plc, with the exception of QinetiQ Group Holdings Limited which is held directly by QinetiQ Group plc.
Name of company Country of incorporation Registered office
Subsidiaries1
BJ Trustee Limited England & Wales Farnborough4
cueSim Limited England & Wales Farnborough4
Foster-Miller Canada Limited Canada 318 Roxton Drive, Waterloo, Ontario, N2T 1R6, Canada
Foster-Miller Inc2 US 350 2nd Avenue, Waltham, Massachusetts, MA 02451, USA
Graphics Research Corporation Limited England & Wales Farnborough4
Gyldan 11 Limited England & Wales Farnborough4
Inzpire Group Limited1 England & Wales Farnborough4
Inzpire Holdings Limited1 England & Wales Landmark House West, Unit 1b, Alpha Court, Kingsley Road, Lincoln, Lincolnshire, LN6 3TA
Inzpire Limited1 England & Wales Landmark House West, Unit 1b, Alpha Court, Kingsley Road, Lincoln, Lincolnshire, LN6 3TA
Leading Technology Limited England & Wales Farnborough4
Metrix UK Limited England & Wales Farnborough4
Naimuri Limited England & Wales Farnborough4
Newman & Spurr Consultancy Ltd England & Wales 2 Meadows Business Park, Station Approach, Blackwater, Camberley, Surrey GU17 9AB
Precis (2187) Limited England & Wales Farnborough4
Precis (2188) Limited England & Wales Farnborough4
Qinetic Limited England & Wales Farnborough4
QinetiQ Aerostructures Pty Ltd Australia Level 3, 210 Kings Way, South Melbourne, VIC 3205, Australia
QinetiQ Australia Pty Ltd Australia Level 3, 210 Kings Way, South Melbourne, VIC 3205, Australia
QinetiQ Consulting Pty Ltd Australia Level 3, 12 Brindabella Court, Brindabella Business Park, Majura ACT 2609.
QinetiQ Estates Limited England & Wales Farnborough4
QinetiQ GmbH Germany Flughafenstraße 65, 41066, Mönchengladbach, Germany
QinetiQ GP Limited Scotland 50 Lothian Road, Festival Square, Edinburgh, EH3 9WJ, Scotland
QinetiQ Group Canada Inc.2 Canada 5300 Commerce Court West, 199 Bay Street, Toronto ON M5L 1A9, Canada
QinetiQ Group Holdings Limited England & Wales Farnborough4
QinetiQ Holdings Limited England & Wales Farnborough4
QinetiQ Inc2, US 10440 Furnace Road, Suite 204, Lorton, VA 22079,, USA
QinetiQ Insurance PCC Limited Guernsey Mill Court, La Charroterie, St Peter Port, GY1 4ET Guernsey
QinetiQ Limited England & Wales Farnborough4
QinetiQ Novare Pty Ltd Australia Petrie House, level 6, 80 Petrie Terrace, Brisbane QLD 400, Australia
QinetiQ Overseas Holdings Limited England & Wales Farnborough4
QinetiQ Overseas Trading Limited England & Wales Farnborough4
QinetiQ Pension Scheme Trustee Limited England & Wales Farnborough4
QinetiQ PFP Limited Partnership5 Scotland 50 Lothian Road, Festival Square, Edinburgh, EH3 9WJ, Scotland
QinetiQ Philippines Company, Inc Philippines 22nd Floor Corporate Centre, 139 Valero Street, Salcedo Village, Makati City, Philippines
QinetiQ Pty Ltd Australia Level 33, 101 Collins Street, Melbourne, VIC 3000, Australia
QinetiQ Services Holdings Pty Ltd Australia Level 33, 101 Collins Street, Melbourne, Victoria 3000, Australia
QinetiQ Solutions Sdn. Bhd. Malaysia Suite 6.01, 6th Floor, Plaza See Hoy Chan, Jalan Raja Chulan 50200, Kuala Lumpur, W.P. Kuala Lumpur, Malaysia
QinetiQ Space N.V. Belgium Hogenakkerhoekstraat, 9, 9150 Kruibeke, Belgium
QinetiQ Special Projects Inc US 5885 Trinity Parkway, Suite 130, Centreville, Virginia 20120-1969, USA
QinetiQ Sweden AB Sweden Advokatfirman Delphi, Box 1432, Stockholm, Sweden
QinetiQ Target Services Limited England & Wales Farnborough4
QinetiQ Target Systems Limited England & Wales Farnborough4
QinetiQ US Holdings, Inc. US 5885 Trinity Parkway, Suite 130, Centreville, Virginia 20120-1969, USA
Redu Operational Services S.A1 Belgium Rue Devant les Hetres, 2B, 6890 Transinne, Belgium
RubiKon Group Pty Limited Australia Level 33, 101 Collins Street, Melbourne, Victoria 3000, Australia
Sensoptics Limited England & Wales Farnborough4
TSG International LLC US 350 2nd Avenue, Waltham, Massachusetts 02451, USA
Associates3
Redu Space Services S.A Belgium Rue Devant les Hetres, 2B, 6890 Transinne, Belgium
165Annual Report & Accounts 2021
Financial Statements

Notes to the Financial Statements For the year ended 31 March
QinetiQ Group plc Annual Report and Accounts 2021 132
1. Significant changes in the current reporting period
The financial position and performance of the Group was particularly affected by the following events and transactions during the reporting period:
1) The acquisition of Naimuri Limited (see note 12) which resulted in an increase in goodwill (note 14) and other intangible assets (note 15);
2) The divestment of the Boldon James, Commerce Decisions and OptaSense businesses (see note 13); 3) An impairment of goodwill in respect of the Germany business (see note 14).
For a detailed discussion of the Group’s performance and financial position refer to the Strategic Report on pages 2 to 51.
2. Revenue from contracts with customers and other income
Revenue and other income is analysed as follows:
Revenue by category and other income For the year ended 31 March
1 For the period of which there was no contribution in the equivalent period in the comparator year which was pre-ownership (for acquisitions) or post-ownership (for disposals) by the Group
2 Alternative performance measures are used to supplement the statutory figures. See page 183.
Other income
Revenue and profit after tax of associates and joint ventures was £12.6m and £1.1m respectively (2020: revenue of £18.1m and loss after tax of £1.5m). The figures in the table above represent the Group share of this profit after tax.
Other income is in respect of property rentals and the recovery of other related property costs.
Revenue by customer geographic location For the year ended 31 March
All figures in £ million 2021 2020
Services contracts with customers 1,189.4 945.6
Sale of goods contracts with customers 83.0 116.8
Royalties and licences 5.8 10.5
Total revenue 1,278.2 1,072.9
Less: adjust current year for acquired businesses1 (117.2) –
Less: adjust prior year for disposed businesses1 – (17.2)
Adjust to constant prior year exchange rates 2.2 –
Total revenue on an organic, constant currency basis2 1,163.2 1,055.7
Organic revenue growth at constant currency2 10% 10%
All figures in £ million 2021 2020
Share of associates’ and joint ventures’ profit/(loss) after tax 0.7 (0.7)
Other income 9.2 9.9
Other income – underlying 9.9 9.2
Specific adjusting item: gain on sale of property (note 4) 0.1 14.0
Total other income 10.0 23.2
All figures in £ million 2021 2020
US 215.6 136.0
Australia 77.9 60.7
Europe 88.2 75.9
Middle east 9.8 16.3
Rest of world 28.9 44.5
International 420.4 333.4
United Kingdom 857.8 739.5
Total revenue 1,278.2 1,072.9
International revenue % 33% 31%
Revenue from ‘home countries’ (UK, US and Australia) 1,151.3 936.2
Home countries revenue % 90% 87%
Notes to the Financial Statements For the year ended 31 March
QinetiQ Group plc Annual Report and Accounts 2021 166
35. Subsidiaries and other related undertakings (continued)
1 As at 31 March 2021 the Group owned 100% of the ordinary shares of these subsidiary undertakings except for Redu Operational Services S.A. (52%) 2 The class of shares is ‘common share’ 3 As at 31 March 2021 the Group owned 48% of Redu Space Services S.A. 4 Cody Technology Park, Ively Road, Farnborough, Hampshire, GU14 OLX 5 Limited partnership. The partners are all wholly-owned Group companies 6 As at 31 March 2021 the Group owned 49% of Houbara Defence & Security LLC and 49% of QinetiQ Dar Massader QDM Limited. 7 The financial year end of each undertaking is 31 March other than Houbara Defence & Security LLC (31 December) and QinetiQ Dar Massader QDM Limited
(31 December)
36. Basis of preparation and significant accounting policies QinetiQ Group plc (‘the Company’) is a public limited company, which is listed on the London Stock Exchange and is incorporated and domiciled in United Kingdom. The consolidated financial statements of the Group comprise statements for the Company and its subsidiaries, together referred to as ‘the Group’.
Accounting policies The following accounting policies have been applied consistently to all periods presented in dealing with items that are considered material in relation to the Group’s financial statements. In the income statement, the Group presents ‘specific adjusting items’ separately. In the judgement of the Directors, for the reader to obtain a proper understanding of business performance, specific adjusting items need to be disclosed separately. Underlying measures of performance exclude specific adjusting items.
Specific adjusting items Specific adjusting items include the following:
The financial impact of each item is reported in note 4 to these financial statements.
These ‘specific adjusting items’ are of a ‘non-operational’ nature and do not include all significant, irregular items that are of an operational nature, for example contract risk provisions, cost of redundancy exercises and gains/losses on disposal of plant and equipment.
Basis of preparation The Group’s financial statements, approved by the Directors, have been prepared on a going concern basis as discussed in the Directors’ report on page 113. In accordance with the Companies Act 2006 and European Union (EU) regulations, the Consolidated Financial Statements have been prepared in accordance with International Accounting Standards in conformity with the requirements of the Companies Act 2006 and International Financial Reporting Standards adopted pursuant to Regulation (EC) No 1606/2002 as it applies in the EU. The Company has elected to prepare its parent company financial statements in accordance with UK GAAP (FRS 101); these are presented on page 176. The financial statements have been prepared under the historical cost convention, as modified by the revaluation of relevant financial assets and liabilities. The Group’s reporting currency is Sterling and unless otherwise stated the financial statements are rounded to the nearest £100,000.
Basis of consolidation The consolidated financial statements comprise the financial statements of the Company and its subsidiary undertakings to 31 March 2021. The purchase method of accounting has been adopted. Those subsidiary undertakings acquired or disposed of in the period are included in the consolidated income statement from the date control is obtained to the date that control is lost (usually on acquisition and disposal respectively). An investor controls an investee when it is exposed, or has rights, to variable returns from its involvement with the investee and has the ability to affect those returns through its power over the investee. This is the IFRS 10 definition of ‘control’.
Name of company Country of incorporation Registered office
Joint ventures6 Houbara Defence & Security LLC6 United Arab Emirates Unit 3, Zone 4, Tawazun Industrial Park, Abu Dhabi, United Arab
Emirates, PO Box 128220 QinetiQ Dar Massader QDM Limited6 Saudi Arabia Al Nakhla Tower, 3026-Prince Saud Bin Mohamed Bin Muqin Road, PO
Box 2985, Riyadh 13321, Kingdom of Saudi Arabia
Item
Distorting due to irregular nature
year on year
Distorting due to fluctuating nature
(size and sign)
Does not reflect in-year operational performance
of continuing business
Amortisation of intangible assets arising from acquisitions P
Pension net finance income P P
Gains/losses on disposal of property and investments P P P
Transaction & integration costs in respect of business acquisitions P P
Impairment of property and goodwill P The tax impact of the above P P P
Other significant non-recurring deferred tax movements P P P
166 QinetiQ Group plc

Notes to the Financial Statements continued
QinetiQ Group plc Annual Report and Accounts 2021 133
Financial Statements
Revenue by major customer type For the year ended 31 March
‘Other’ does not contain any customers with revenue in excess of 10% of total Group revenue.
The following table shows the aggregate amount of revenue allocated to performance obligations that are unsatisfied (or partially satisfied) as at the end of the reporting period:
Management expects that 27% (£800.5m) of revenue allocated to unsatisfied contracts as of 31 March 2021 will be recognised as revenue during the next reporting period.
The following table shows the aggregate amount of revenue allocated to performance obligations that were unsatisfied (or partially satisfied) as at the end of the prior reporting period:
Revenue of £144m was recognised during the year that was previously unrecognised as at the previous year end and reported as a contract liability.
3. Segmental analysis
The analysis by business segment is presented in accordance with IFRS 8 Operating Segments, on the basis of those reportable segments whose operating results are regularly reviewed by the Board (the Chief Operating Decision Maker as defined by IFRS 8) and are aligned with the Group’s strategic direction, determined with reference to the products and services they provide, as follows:
EMEA Services provides technical assurance, test and evaluation and training services, underpinned by long-term contracts. EMEA Services comprises the following business units which are not considered reportable segments as defined by IFRS 8: Maritime & Land; Air & Space, Cyber & Information and the International business.
Global Products combines all other business units not aggregated within EMEA Services, including the QinetiQ US business, Space Products and EMEA Products (which includes QinetiQ Target Systems). Generally these business units (which are not considered reportable segments as defined by IFRS 8) deliver innovative solutions and products which includes contract-funded research and development and developing intellectual property in partnership with key customers and through internal funding with potential for new revenue streams.
Operating segments
1 The measure of profit presented to the Chief Operating Decision Maker is operating profit stated before specific adjusting items (‘underlying operating profit’). The specific adjusting items are detailed in note 4.
2 Definitions of the Group’s ‘Alternative performance measures’ can be found in the glossary on page 183.
No measure of segmental assets and liabilities is reported as this information is not regularly provided to the Chief Operating Decision Maker.
All figures in £ million 2021 2020
UK government 794.6 667.2
US government 140.8 116.2
Other 342.8 289.5
Total revenue 1,278.2 1,072.9
All figures in £ million 2022 2023 2024 2025+ Total
Total forecast revenue allocated to unsatisfied performance obligations 800.5 523.9 395.9 1,223.8 2,944.1
All figures in £ million 2021 2022 2023 2024+ Total
Total forecast revenue allocated to unsatisfied performance obligations 849.3 484.9 375.5 1,395.2 3,104.9
2021 2020
All figures in £ million
Revenue from
external customers
Underlying operating
profit1
Revenue from
external customers
Underlying operating
profit1
EMEA Services 939.9 118.6 797.4 100.6
Global Products 338.3 33.2 275.5 32.6
Total operating segments 1,278.2 151.8 1,072.9 133.2
Underlying operating margin2 11.9% 12.4%
Notes to the Financial Statements continued
QinetiQ Group plc Annual Report and Accounts 2021 167
Financial Statements
The Group comprises certain entities that are operated within the terms of a Special Security Arrangement (‘SSA’). Details of the SSA and QinetiQ’s management of US subsidiaries are set out in the Corporate Governance section of this Annual Report. IFRS 10 is the accounting standard applicable in respect of consolidation of entities. This does not specifically deal with SSA’s. However, having considered the terms of the SSA, the Directors consider that the Group meets the requirements of IFRS 10 in respect of control over such affected entities and, therefore, consolidates these entities in the consolidated accounts. The impact of this specific judgement is full consolidation as opposed to treatment as a 100% associated undertaking.
An associate is an undertaking over which the Group exercises significant influence, usually from 20%–50% of the equity voting rights, in respect of financial and operating policy. A joint venture is an undertaking over which the Group exercises joint control. Associates and joint ventures are accounted for using the equity method from the date of acquisition to the date of disposal. The Group’s investments in associates and joint ventures are held at cost including goodwill on acquisition and any post-acquisition changes in the Group’s share of the net assets of the associate less any impairment to the recoverable amount. Where an associate or joint venture has net liabilities, full provision is made for the Group’s share of liabilities where there is a constructive or legal obligation to provide additional funding to the associate or joint venture.
The financial statements of subsidiaries, joint ventures and associates are adjusted where necessary to ensure compliance with Group accounting policies.
Recent accounting developments Developments adopted by the Group in 2021 with no material impact on the Group’s financial statements The following IFRS and endorsed standards and amendments, improvements and interpretations of published standards are effective for accounting periods beginning on or after 1 January 2020 and have been adopted with no material impact on the Group’s financial statements:
– Amendment to IFRS 3 ‘Business combinations’ (definition of a business): The amendment will help improve the definition of a business and help companies determine whether an acquisition made is of a business or a group of assets. The amended definition emphasises that the output of a business is to provide goods and services to customers, whereas the previous definition focused on returns in form of dividends, lower costs or other economic benefits to investors and others.
– Amendments to IFRS 9, IAS 39 and IFRS 7 ‘Interest rate benchmark reform phase 1’: These amendments considers reliefs to hedge accounting in the period before the reform. The reliefs have the effect that IBOR reform should not generally cause hedge accounting to terminate. The relief provided by the amendments requires an entity to assume that the interest rate on which the hedge cash flows are based does not change as a result of the reform.
– Amendments to IFRS 16 ‘Leases’ COVID-19 related rent concessions: The amendment will make it easier for lessees to account for COVID-19 related rent concessions such as rent holidays and temporary rent reductions. The amendment exempts lessees from having to consider individual lease contracts to determine whether rent concessions occurring as a direct consequence of the COVID-19 related rent concessions that reduce lease payments due on or before 30 June 2021.
Developments expected in future periods of which the impact on the Group’s financial statements is still being assessed The Directors anticipate that the adoption of the following new, revised, amended and improved published standards and interpretations, which were in issue at the date of authorisation of these financial statements, will have no material impact on the financial statements of the Group when they become applicable in future periods:
– Amendments to IFRS 3 ‘Business combinations’, on clarifying whether an acquisition is that of a business or a group of assets; – Amendments to IFRS 9, IAS 39 and IFRS 7, all in respect of interest rate benchmark reform.
Significant accounting policies Revenue from contracts with customers The Group recognises revenue primarily from the following major sources:
– Through combining world-leading expertise with unique facilities to provide technical assurance, test and evaluation and training services underpinned by long-term contracts;
– Through delivering innovative solutions and products to meet customer requirements by undertaking contract-funded research and development, developing intellectual property and by internal funding with potential for new revenue streams.
Revenue is measured based on the consideration specified in a contract with a customer and excludes amounts collected on behalf of third parties. The Group recognises revenue when it transfers control of a product or service to a customer. The Group’s revenue contracts are accounted for under IFRS 15 ‘Revenue from Contracts with Customers’ taking into account the requirement to distinguish between the various performance obligations within a contract and treating these separately. The Group’s methodology applies IFRS 15 on a contract-by-contract basis which includes considerations for contract modifications, variable consideration, the determination of distinct performance obligations, determination of agency and principal relationships and licences.
167Annual Report & Accounts 2021
Financial Statements

Notes to the Financial Statements For the year ended 31 March
QinetiQ Group plc Annual Report and Accounts 2021 132
1. Significant changes in the current reporting period
The financial position and performance of the Group was particularly affected by the following events and transactions during the reporting period:
1) The acquisition of Naimuri Limited (see note 12) which resulted in an increase in goodwill (note 14) and other intangible assets (note 15);
2) The divestment of the Boldon James, Commerce Decisions and OptaSense businesses (see note 13); 3) An impairment of goodwill in respect of the Germany business (see note 14).
For a detailed discussion of the Group’s performance and financial position refer to the Strategic Report on pages 2 to 51.
2. Revenue from contracts with customers and other income
Revenue and other income is analysed as follows:
Revenue by category and other income For the year ended 31 March
1 For the period of which there was no contribution in the equivalent period in the comparator year which was pre-ownership (for acquisitions) or post-ownership (for disposals) by the Group
2 Alternative performance measures are used to supplement the statutory figures. See page 183.
Other income
Revenue and profit after tax of associates and joint ventures was £12.6m and £1.1m respectively (2020: revenue of £18.1m and loss after tax of £1.5m). The figures in the table above represent the Group share of this profit after tax.
Other income is in respect of property rentals and the recovery of other related property costs.
Revenue by customer geographic location For the year ended 31 March
All figures in £ million 2021 2020
Services contracts with customers 1,189.4 945.6
Sale of goods contracts with customers 83.0 116.8
Royalties and licences 5.8 10.5
Total revenue 1,278.2 1,072.9
Less: adjust current year for acquired businesses1 (117.2) –
Less: adjust prior year for disposed businesses1 – (17.2)
Adjust to constant prior year exchange rates 2.2 –
Total revenue on an organic, constant currency basis2 1,163.2 1,055.7
Organic revenue growth at constant currency2 10% 10%
All figures in £ million 2021 2020
Share of associates’ and joint ventures’ profit/(loss) after tax 0.7 (0.7)
Other income 9.2 9.9
Other income – underlying 9.9 9.2
Specific adjusting item: gain on sale of property (note 4) 0.1 14.0
Total other income 10.0 23.2
All figures in £ million 2021 2020
US 215.6 136.0
Australia 77.9 60.7
Europe 88.2 75.9
Middle east 9.8 16.3
Rest of world 28.9 44.5
International 420.4 333.4
United Kingdom 857.8 739.5
Total revenue 1,278.2 1,072.9
International revenue % 33% 31%
Revenue from ‘home countries’ (UK, US and Australia) 1,151.3 936.2
Home countries revenue % 90% 87%
Notes to the Financial Statements For the year ended 31 March
QinetiQ Group plc Annual Report and Accounts 2021 168
36. Basis of preparation and significant accounting policies (continued)
Service contracts The Group’s long-term service contracts are generally ‘test and evaluation’ or advice-based contracts where control of the service is transferred over a period of time as the Group performs. At contract inception the Group undertakes an assessment to determine how many distinct performance obligations exists within a contract. As part of the assessment the Group obtains an understanding of the overall deliverable to the customer through discussions with business units and project leads. Each individual deliverable in the contract is then assessed to determine if it is an input into the overall deliverable, and therefore part of a single performance obligation, or if it is a stand-alone separable deliverable with its own transaction price and therefore a distinct performance obligation in its own right. Each distinct performance obligation identified within a contract is accounted for separately.
Certain service contracts have a similar pattern of transfer of control to the customer where each year is effectively the same from a performance obligation perspective. The Group has applied the series guidance as permitted within the Standard to these contracts and accounts for these as a series of distinct service performance obligations satisfied annually over the contract term. The transaction price for a contract is determined at contract inception based on a fixed-margin applied to the total forecast costs to complete the deliverable. Some long-term contracts include an excess profit clause which is a variable consideration factor that could impact the transaction price. Excess profits are estimated at contract inception and at the end of each reporting period to ensure that the transaction price is not under or over stated. Any required adjustment will be made against the transaction price in the period in which it occurred. The Group does not offer any right of return or refunds which could impact transaction price at inception. Certain contracts attract bonuses and/or penalties which are variable and will have an impact on transaction price at contract inception. The Group assesses variable consideration in relation to bonuses and penalties at contract inception using the most-likely method and this forms part of the transaction price and recognised over time as costs are incurred. The Group only includes bonuses and penalties into the transaction price to the extent that it is highly probable that a significant reversal of revenue will not occur in future periods. Historical evidence and experience shows that even where a reduction has been required, that reduction has been immaterial to the Group.
The transaction price is allocated between each distinct performance obligation identified in a contract based on the stand-alone selling price of each performance obligation. Each performance obligation will be costed and the transaction price will be cost plus margin. This amount would be the stand-alone selling price of each performance obligation if contracted with a customer separately.
Long-term service contracts allow for modifications to the original order. If a contract modification is determined to be distinct and the price of the contract increases by an amount of consideration that reflects the entity's stand-alone selling prices for the additional promised goods or services, the Group accounts for this as a separate contract. If a contract modification is not distinct, the Group accounts for this as if it were part of the existing contract. A cumulative catch-up adjustment to revenue is then recognised to disclose the effect that the contract modification has on the transaction price and the Group’s measure of progress towards complete satisfaction of the performance obligation.
Long-term service contracts also sometimes allow for extensions to the original order. A contract extension is determined to include either additional goods or services or no additional goods or service. If a contract extension with additional goods or services is determined to be distinct and the price of the contract increases by an amount of consideration that reflects the entity’s stand-alone selling prices for the additional promised goods or services, the Group accounts for this as a separate performance obligation.
If a contract extension with additional goods or services is not distinct, the Group accounts for this as if it were part of the existing contract. A cumulative catch-up adjustment to revenue is then recognised to disclose the effect that the contract extension has on the transaction price and the Group’s measure of progress towards complete satisfaction of the performance obligation.
When the outcome of a distinct performance obligation in delivering services can be reliably estimated, revenue associated with the performance obligation is recognised over time using the input method. The input method recognises revenue over time on the basis of costs incurred to date to the satisfaction of a performance obligation relative to the total forecast costs to complete the performance obligation. The Group has determined the input method to be appropriate as it best depicts the Group’s performance in transferring control of the service to the customer as it incurs costs on a particular contract.
No profit is recognised on contracts until the outcome of the contract can be reliably estimated. When it is probable that total contract costs will exceed total contract revenue, the expected loss is recognised immediately as an expense.
Goods sold The Group recognises revenue on the sale of products at a point in time once control has been transferred to the customer. Control is generally transferred to customers on delivery of products or when the customer has the significant risks and rewards of ownership of the product. Payment is typically due within 30 days of invoice (within the UK) and customers typically do not have a right of return or refund. The transaction price for sale of products is agreed at contract inception. When the Group develops a bespoke product for a customer with no alternative use to the Group, revenue is recognised over time using the input method.
Licence revenue Licence revenue is attributed to either ‘right to use’ or ‘right to access’ licences. ‘Right to use’ licence revenue is recognised at a point in time when the Group sells a licence to a customer and does not undertake significant further activities or involvement in developing the licence after the sale. ‘Right to access’ licence revenue is recognised over time when the Group maintains a significant level of involvement in
168 QinetiQ Group plc

Notes to the Financial Statements continued
QinetiQ Group plc Annual Report and Accounts 2021 133
Financial Statements
Revenue by major customer type For the year ended 31 March
‘Other’ does not contain any customers with revenue in excess of 10% of total Group revenue.
The following table shows the aggregate amount of revenue allocated to performance obligations that are unsatisfied (or partially satisfied) as at the end of the reporting period:
Management expects that 27% (£800.5m) of revenue allocated to unsatisfied contracts as of 31 March 2021 will be recognised as revenue during the next reporting period.
The following table shows the aggregate amount of revenue allocated to performance obligations that were unsatisfied (or partially satisfied) as at the end of the prior reporting period:
Revenue of £144m was recognised during the year that was previously unrecognised as at the previous year end and reported as a contract liability.
3. Segmental analysis
The analysis by business segment is presented in accordance with IFRS 8 Operating Segments, on the basis of those reportable segments whose operating results are regularly reviewed by the Board (the Chief Operating Decision Maker as defined by IFRS 8) and are aligned with the Group’s strategic direction, determined with reference to the products and services they provide, as follows:
EMEA Services provides technical assurance, test and evaluation and training services, underpinned by long-term contracts. EMEA Services comprises the following business units which are not considered reportable segments as defined by IFRS 8: Maritime & Land; Air & Space, Cyber & Information and the International business.
Global Products combines all other business units not aggregated within EMEA Services, including the QinetiQ US business, Space Products and EMEA Products (which includes QinetiQ Target Systems). Generally these business units (which are not considered reportable segments as defined by IFRS 8) deliver innovative solutions and products which includes contract-funded research and development and developing intellectual property in partnership with key customers and through internal funding with potential for new revenue streams.
Operating segments
1 The measure of profit presented to the Chief Operating Decision Maker is operating profit stated before specific adjusting items (‘underlying operating profit’). The specific adjusting items are detailed in note 4.
2 Definitions of the Group’s ‘Alternative performance measures’ can be found in the glossary on page 183.
No measure of segmental assets and liabilities is reported as this information is not regularly provided to the Chief Operating Decision Maker.
All figures in £ million 2021 2020
UK government 794.6 667.2
US government 140.8 116.2
Other 342.8 289.5
Total revenue 1,278.2 1,072.9
All figures in £ million 2022 2023 2024 2025+ Total
Total forecast revenue allocated to unsatisfied performance obligations 800.5 523.9 395.9 1,223.8 2,944.1
All figures in £ million 2021 2022 2023 2024+ Total
Total forecast revenue allocated to unsatisfied performance obligations 849.3 484.9 375.5 1,395.2 3,104.9
2021 2020
All figures in £ million
Revenue from
external customers
Underlying operating
profit1
Revenue from
external customers
Underlying operating
profit1
EMEA Services 939.9 118.6 797.4 100.6
Global Products 338.3 33.2 275.5 32.6
Total operating segments 1,278.2 151.8 1,072.9 133.2
Underlying operating margin2 11.9% 12.4%
Notes to the Financial Statements continued
QinetiQ Group plc Annual Report and Accounts 2021 169
Financial Statements
developing and enhancing the licence after the sale. The level of involvement goes beyond general support, bug-fixing and upgrades which generally only maintain the current operating level. The transaction price for intellectual property is agreed at contract inception. The Group does not offer any right of return or refunds which could impact transaction price at inception.
The Group recognises licence revenue through the supply of a range of security, messaging and connectivity software products. A licence fee is paid for each computer that uses the software and the customer can also purchase a support service contract for a fixed period. The sale of these types of licences is recognised at a point in time as a distinct performance obligation because the Group does not undertake any further activities in developing the licence after the sale. The support service contract is recognised over time as a separate performance obligation as this is an optional extra and is not integral into the functionality of the licence. The support service contract offers general support and maintenance of the licence to the customer over a fixed period.
Contract assets Contract assets is a term used in adopting IFRS 15 and effectively represents amounts recoverable under contracts as previously reported. Contract assets represent revenue recognised in excess of amounts invoiced. Revenue is recognised on service contracts by using a ‘percentage complete’ method, applying the proportion of contract costs incurred for work performed to date relative to the estimated total contract cost, after making suitable allowances for technical and other risks related to performance milestones yet to be achieved, and applying that proportion to total contract price. Payment for service contracts are not always due from the customer until certain milestones have been reached and, therefore, a contract asset is recognised over the period in which the services are performed representing the Group’s right to consideration for services performed to date, to the extent that the customer has not yet been invoiced for those services.
Contract liabilities Contract liabilities is a term used in adopting IFRS 15 and effectively represents deferred income as previously reported. The Group, on occasion, bills customers in advance of performing certain types of work which results in the Group recognising contract liabilities. Once the work has been performed these amounts will be reduced and recognised as revenue. For sale of goods, revenue is recognised in the income statement when control of the goods has been transferred to the customer; being at the point when the goods are delivered. Any transaction price received by the Group prior to that point is recognised as a contract liability.
Principal-agent arrangements The Group enters into certain arrangements which involve a consortium of service providers. The Group acts as a ‘Prime’ contractor in certain contracts with customers and utilises sub-contractors to undertake the work. Under these contracts the Group is considered to be primarily responsible for fulfilling the service to the customer. The Group performs a technical assessment of the work before it is delivered to the customer and is responsible for quality and performance of the sub-contractor. As such the Group is considered to be the principal to the arrangement with the customer and includes sub-contractor costs within revenue. However, where the Group is merely acting as an agent of a sub-contractor then no revenue is recognised in respect of sub-contractor costs.
All consortium arrangements are assessed by the Group to determine if it is the principal or agent.
Contract bidding costs The Group recognises the ‘incremental costs of obtaining a contract’ with a customer as an asset if the Group expects to recover those costs. The ‘incremental costs of obtaining a contract’ are those costs that the Group incurs to obtain a contract with a customer that it would not have incurred if the contract had not been won. Costs to obtain a contract that would have been incurred regardless of whether the contract was won or lost shall be recognised as an expense when incurred, unless those costs are explicitly chargeable to the customer.
Segmental information Segmental information is presented according to the Group’s internal management reporting structure and the markets in which it operates. Segmental results represent the contribution of the different segments to the profit of the Group. Corporate expenses are allocated to the corresponding segments. Unallocated items mainly comprise specific adjusting items. Specific adjusting items are referred to in note 4. Segmental assets and liabilities information is not regularly provided to the Chief Operating Decision Maker.
Research and development expenditure R&D costs incurred in respect of specific contracts placed by customers are recognised within operating costs and revenue is recognised in respect of the R&D services performed. Internally funded development expenditure is capitalised in the balance sheet where there is a clearly defined project, the expenditures are separately identifiable, the project is technically and commercially feasible, all costs are recoverable by future revenue and the resources are committed to complete the project. Such capitalised costs are amortised over the forecast period of sales resulting from the development. All other R&D costs are expensed to the income statement in the period in which they are incurred. If the research phase cannot be clearly distinguished from the development phase, the respective project-related costs are treated as if they were incurred in the research phase only and expensed.
169Annual Report & Accounts 2021
Financial Statements

Notes to the Financial Statements For the year ended 31 March
QinetiQ Group plc Annual Report and Accounts 2021 132
1. Significant changes in the current reporting period
The financial position and performance of the Group was particularly affected by the following events and transactions during the reporting period:
1) The acquisition of Naimuri Limited (see note 12) which resulted in an increase in goodwill (note 14) and other intangible assets (note 15);
2) The divestment of the Boldon James, Commerce Decisions and OptaSense businesses (see note 13); 3) An impairment of goodwill in respect of the Germany business (see note 14).
For a detailed discussion of the Group’s performance and financial position refer to the Strategic Report on pages 2 to 51.
2. Revenue from contracts with customers and other income
Revenue and other income is analysed as follows:
Revenue by category and other income For the year ended 31 March
1 For the period of which there was no contribution in the equivalent period in the comparator year which was pre-ownership (for acquisitions) or post-ownership (for disposals) by the Group
2 Alternative performance measures are used to supplement the statutory figures. See page 183.
Other income
Revenue and profit after tax of associates and joint ventures was £12.6m and £1.1m respectively (2020: revenue of £18.1m and loss after tax of £1.5m). The figures in the table above represent the Group share of this profit after tax.
Other income is in respect of property rentals and the recovery of other related property costs.
Revenue by customer geographic location For the year ended 31 March
All figures in £ million 2021 2020
Services contracts with customers 1,189.4 945.6
Sale of goods contracts with customers 83.0 116.8
Royalties and licences 5.8 10.5
Total revenue 1,278.2 1,072.9
Less: adjust current year for acquired businesses1 (117.2) –
Less: adjust prior year for disposed businesses1 – (17.2)
Adjust to constant prior year exchange rates 2.2 –
Total revenue on an organic, constant currency basis2 1,163.2 1,055.7
Organic revenue growth at constant currency2 10% 10%
All figures in £ million 2021 2020
Share of associates’ and joint ventures’ profit/(loss) after tax 0.7 (0.7)
Other income 9.2 9.9
Other income – underlying 9.9 9.2
Specific adjusting item: gain on sale of property (note 4) 0.1 14.0
Total other income 10.0 23.2
All figures in £ million 2021 2020
US 215.6 136.0
Australia 77.9 60.7
Europe 88.2 75.9
Middle east 9.8 16.3
Rest of world 28.9 44.5
International 420.4 333.4
United Kingdom 857.8 739.5
Total revenue 1,278.2 1,072.9
International revenue % 33% 31%
Revenue from ‘home countries’ (UK, US and Australia) 1,151.3 936.2
Home countries revenue % 90% 87%
Notes to the Financial Statements For the year ended 31 March
QinetiQ Group plc Annual Report and Accounts 2021 170
36. Basis of preparation and significant accounting policies (continued)
Financing The Group holds no external borrowings but does have access to a revolving credit facility, fees for which are reported within finance costs. Costs of letters of credit are also charged to finance expense. Income earned on funds invested is reported within finance income. Exchange differences on financial assets and liabilities and the income or expense from interest hedging instruments that are recognised in the income statement are included within finance income and finance expense. Financing also includes the net finance income or expense in respect of defined benefit pension schemes. The Group pays in advance finance costs in relation to the multi-currency facility which are recognised as a deferred finance cost asset.
Taxation The income tax expense or credit for the period is the tax payable on the current period’s taxable income, based on the applicable income tax rate for each jurisdiction, adjusted by changes in deferred tax assets and liabilities attributable to temporary differences and to unused tax losses. The current income tax charge is calculated on the basis of the tax laws enacted or substantively enacted at the end of the reporting period in the countries where the company and its subsidiaries and associates operate and generate taxable income.
Management periodically evaluates positions taken in tax returns with respect to situations in which applicable tax regulation is subject to interpretation and considers whether it is probable that a taxation authority will accept an uncertain tax treatment. The Group measures its tax balances either based on the most likely amount or the expected value, depending on which method provides a better prediction of the resolution of the uncertainty.
The Group’s accounting policy is to include the impact of research and development expenditure credits (‘RDEC’) within the tax charge. An element of the Group’s RDEC claim relates to activities on MOD contracts. Commercial negotiations with the MOD do not take RDEC into consideration; instead both parties have agreed that the amount collected by QinetiQ on certain contracts will be passed through as a lump sum to the MOD, akin to QinetiQ collecting the RDEC on behalf of the MOD. As such, the MOD-appropriated element of the RDEC receivable from HMRC is netted off against the gross receivable within the tax line, as opposed to being recognised as a reduction to revenue or as an expense above the tax line.
Deferred income tax is provided in full, using the liability method, on temporary differences arising between the tax bases of assets and liabilities and their carrying amounts in the consolidated financial statements. However, deferred tax liabilities are not recognised if they arise from the initial recognition of goodwill. Deferred income tax is also not accounted for if it arises from initial recognition of an asset or liability in a transaction other than a business combination that, at the time of the transaction, affects neither accounting nor taxable profit or loss. Deferred income tax is determined using tax rates (and laws) that have been enacted or substantively enacted by the end of the reporting period and are expected to apply when the related deferred income tax asset is realised or the deferred income tax liability is settled.
Deferred tax assets are recognised only if it is probable that future taxable amounts will be available to utilise those temporary differences and losses. Deferred tax liabilities and assets are not recognised for temporary differences between the carrying amount and tax bases of investments in foreign operations where the company is able to control the timing of the reversal of the temporary differences and it is probable that the differences will not reverse in the foreseeable future. Deferred tax assets and liabilities are offset where there is a legally enforceable right to offset current tax assets and liabilities and where the deferred tax balances relate to the same taxation authority. Current tax assets and tax liabilities are offset where the entity has a legally enforceable right to offset and intends either to settle on a net basis, or to realise the asset and settle the liability simultaneously.
Current and deferred tax is recognised in profit or loss, except to the extent that it relates to items recognised in other comprehensive income or directly in equity. In this case, the tax is also recognised in other comprehensive income or directly in equity, respectively.
Non-current assets held for sale Non-current assets are classified as held for sale if their carrying amount will be recovered primarily through a sales transaction rather than through continuing use. This condition is regarded as met only when the sale is highly probable and expected to be completed within a year of the balance sheet date. The assets should be available for immediate sale in their present condition and actively marketed at a price that is reasonable in relation to their current fair value.
Non-current assets classified as held for sale are measured at the lower of carrying amount and fair value less costs to sell. Any write-down to fair value less costs to sell shall be recognised directly through profit and loss as an impairment loss. No further depreciation is charged in respect of assets classified as held for sale.
Goodwill Goodwill on acquisitions of subsidiaries is included in non-current assets. Goodwill on acquisitions of joint ventures and associates is included in the carrying value of equity accounted investments. Goodwill is tested annually for impairment and carried at cost less accumulated impairment losses. Gains and losses on the disposal of an entity include the carrying amount of goodwill related to the entity sold.
Intangible assets Intangible assets arising from business combinations are recognised at fair value and are amortised over their expected useful lives, typically between 1 and 16 years. Internally generated intangible assets are recorded at cost, including labour, directly attributable costs and any third-party expenses.
170 QinetiQ Group plc

Notes to the Financial Statements continued
QinetiQ Group plc Annual Report and Accounts 2021 133
Financial Statements
Revenue by major customer type For the year ended 31 March
‘Other’ does not contain any customers with revenue in excess of 10% of total Group revenue.
The following table shows the aggregate amount of revenue allocated to performance obligations that are unsatisfied (or partially satisfied) as at the end of the reporting period:
Management expects that 27% (£800.5m) of revenue allocated to unsatisfied contracts as of 31 March 2021 will be recognised as revenue during the next reporting period.
The following table shows the aggregate amount of revenue allocated to performance obligations that were unsatisfied (or partially satisfied) as at the end of the prior reporting period:
Revenue of £144m was recognised during the year that was previously unrecognised as at the previous year end and reported as a contract liability.
3. Segmental analysis
The analysis by business segment is presented in accordance with IFRS 8 Operating Segments, on the basis of those reportable segments whose operating results are regularly reviewed by the Board (the Chief Operating Decision Maker as defined by IFRS 8) and are aligned with the Group’s strategic direction, determined with reference to the products and services they provide, as follows:
EMEA Services provides technical assurance, test and evaluation and training services, underpinned by long-term contracts. EMEA Services comprises the following business units which are not considered reportable segments as defined by IFRS 8: Maritime & Land; Air & Space, Cyber & Information and the International business.
Global Products combines all other business units not aggregated within EMEA Services, including the QinetiQ US business, Space Products and EMEA Products (which includes QinetiQ Target Systems). Generally these business units (which are not considered reportable segments as defined by IFRS 8) deliver innovative solutions and products which includes contract-funded research and development and developing intellectual property in partnership with key customers and through internal funding with potential for new revenue streams.
Operating segments
1 The measure of profit presented to the Chief Operating Decision Maker is operating profit stated before specific adjusting items (‘underlying operating profit’). The specific adjusting items are detailed in note 4.
2 Definitions of the Group’s ‘Alternative performance measures’ can be found in the glossary on page 183.
No measure of segmental assets and liabilities is reported as this information is not regularly provided to the Chief Operating Decision Maker.
All figures in £ million 2021 2020
UK government 794.6 667.2
US government 140.8 116.2
Other 342.8 289.5
Total revenue 1,278.2 1,072.9
All figures in £ million 2022 2023 2024 2025+ Total
Total forecast revenue allocated to unsatisfied performance obligations 800.5 523.9 395.9 1,223.8 2,944.1
All figures in £ million 2021 2022 2023 2024+ Total
Total forecast revenue allocated to unsatisfied performance obligations 849.3 484.9 375.5 1,395.2 3,104.9
2021 2020
All figures in £ million
Revenue from
external customers
Underlying operating
profit1
Revenue from
external customers
Underlying operating
profit1
EMEA Services 939.9 118.6 797.4 100.6
Global Products 338.3 33.2 275.5 32.6
Total operating segments 1,278.2 151.8 1,072.9 133.2
Underlying operating margin2 11.9% 12.4%
Notes to the Financial Statements continued
QinetiQ Group plc Annual Report and Accounts 2021 171
Financial Statements
The ‘multi-period excess earnings’ method and the ‘relief-from-royalty’ method are both used for fair valuing intangible assets arising from acquisitions. The multi-period excess earnings method considers the present value of net cash flows expected to be generated by customer relationships, by excluding any cash flows related to contributory assets. The relief-from-royalty method considers the discounted estimated royalty payments that are expected to be avoided as a result of the patents or trademarks being owned.
Purchased intangible assets are recognised at cost less amortisation. Intangible assets are amortised over their respective useful lives on a straight-line basis as follows:
Intellectual property rights 2–10 years Customer relationships 1–16 years Development costs 1–4 years Other 1–14 years
Property, plant and equipment Property, plant and equipment are stated at cost less depreciation. Freehold land is not depreciated. Other tangible non-current assets are depreciated on a straight-line basis over their useful economic lives to their estimated residual value as follows:
Freehold buildings 20–25 years Leasehold land and buildings Shorter of useful economic life and the period of the lease Plant and machinery 3–15 years Fixtures and fittings / office equipment 5–10 years Computers 3–5 years Motor vehicles 3–5 years
Assets under construction are included in property, plant and equipment on the basis of expenditure incurred at the balance sheet date. In the case of assets constructed by the Group, the value includes the cost of own work completed, including directly attributable costs and interest.
The useful lives, depreciation methods and residual values applied to property, plant and equipment are reviewed annually and, if appropriate, adjusted accordingly.
Impairment of goodwill and tangible, intangible and held for sale assets At each reporting date the Group assesses whether there is an indication that an asset may be impaired. If the carrying amount of any asset exceeds its recoverable amount an impairment loss is recognised immediately in the income statement. In addition, goodwill is tested for impairment annually irrespective of any indication of impairment. If the carrying amount exceeds the recoverable amount, the respective asset or the assets in the cash-generating unit (CGU) are written down to their recoverable amounts. The recoverable amount of an asset or CGU is the higher of its fair value less costs to sell and its value in use. The value in use is the present value of the future cash flows expected to be derived from an asset or CGU calculated using an appropriate pre-tax discount rate. Impairment losses are expensed to the income statement.
Leases Leases – as a lessor Lease income from operating leases where the Group is a lessor is recognised in income on a straight-line basis over the lease term (note 26). Initial direct costs incurred in obtaining an operating leases are added to the carrying amount of the underlying asset and recognised as expense over the lease term on the same basis as lease income. The respective leased assets are included in the balance sheet based on their nature. The Group did not need to make any adjustments to the accounting for assets held as lessor as a result of adopting the new leasing standard.
Leases – as a lessee The Group leases various offices, aircrafts, forklifts, equipment and vehicles. Rental contracts are typically made for fixed periods of 6 months to 25 years, but may have extension options as described below.
Contracts may contain both lease and non-lease components. The Group allocates the consideration in the contract to the lease and non-lease components based on their relative stand-alone process. Lease terms are negotiated on an individual basis and contain a wide range of different terms and conditions. The lease agreements do not impose any covenants other than the security interests in the leases assets that are held by the lessor. Leased assets may not be used as security for borrowing purposes.
Leases are recognised as a right-of-use asset and corresponding liability at the date at which the leases asset is available for use by the Group.
Assets and liabilities arising from a lease are initially measured on a present value basis. Lease liabilities include the net present value of the following lease payments:
fixed payments (including in-substance fixed payments), less any lease incentives receivable; variable lease payments based on an index or a rate, initially measured using the index or rate as at the commencement date; amounts expected to be payable by the Group under residual value guarantees; the exercise price of a purchase option if the Group is reasonably certain to exercise that option, and payments of penalties for terminating the lease, if the lease term reflects the Group exercising that option.
171Annual Report & Accounts 2021
Financial Statements

Notes to the Financial Statements For the year ended 31 March
QinetiQ Group plc Annual Report and Accounts 2021 132
1. Significant changes in the current reporting period
The financial position and performance of the Group was particularly affected by the following events and transactions during the reporting period:
1) The acquisition of Naimuri Limited (see note 12) which resulted in an increase in goodwill (note 14) and other intangible assets (note 15);
2) The divestment of the Boldon James, Commerce Decisions and OptaSense businesses (see note 13); 3) An impairment of goodwill in respect of the Germany business (see note 14).
For a detailed discussion of the Group’s performance and financial position refer to the Strategic Report on pages 2 to 51.
2. Revenue from contracts with customers and other income
Revenue and other income is analysed as follows:
Revenue by category and other income For the year ended 31 March
1 For the period of which there was no contribution in the equivalent period in the comparator year which was pre-ownership (for acquisitions) or post-ownership (for disposals) by the Group
2 Alternative performance measures are used to supplement the statutory figures. See page 183.
Other income
Revenue and profit after tax of associates and joint ventures was £12.6m and £1.1m respectively (2020: revenue of £18.1m and loss after tax of £1.5m). The figures in the table above represent the Group share of this profit after tax.
Other income is in respect of property rentals and the recovery of other related property costs.
Revenue by customer geographic location For the year ended 31 March
All figures in £ million 2021 2020
Services contracts with customers 1,189.4 945.6
Sale of goods contracts with customers 83.0 116.8
Royalties and licences 5.8 10.5
Total revenue 1,278.2 1,072.9
Less: adjust current year for acquired businesses1 (117.2) –
Less: adjust prior year for disposed businesses1 – (17.2)
Adjust to constant prior year exchange rates 2.2 –
Total revenue on an organic, constant currency basis2 1,163.2 1,055.7
Organic revenue growth at constant currency2 10% 10%
All figures in £ million 2021 2020
Share of associates’ and joint ventures’ profit/(loss) after tax 0.7 (0.7)
Other income 9.2 9.9
Other income – underlying 9.9 9.2
Specific adjusting item: gain on sale of property (note 4) 0.1 14.0
Total other income 10.0 23.2
All figures in £ million 2021 2020
US 215.6 136.0
Australia 77.9 60.7
Europe 88.2 75.9
Middle east 9.8 16.3
Rest of world 28.9 44.5
International 420.4 333.4
United Kingdom 857.8 739.5
Total revenue 1,278.2 1,072.9
International revenue % 33% 31%
Revenue from ‘home countries’ (UK, US and Australia) 1,151.3 936.2
Home countries revenue % 90% 87%
Notes to the Financial Statements For the year ended 31 March
QinetiQ Group plc Annual Report and Accounts 2021 172
36. Basis of preparation and significant accounting policies (continued)
Lease payments to be made under reasonably certain options are also included in the measurement of the liability.
The lease payments are discounted using the interest rate implicit in the lease. If the rate cannot be readily determined, which is generally the case for leases in the Group, the lessee’s incremental borrowing rate is used, being the rate the individual lessee would have to pay to borrow the funds necessary to obtain an asset of similar value to the right-of-use asset in a similar economic environment with similar terms, security and conditions.
To determine the incremental borrowing rate, the Group:
where possible, uses recent third-party financing received by the individual lessee as a starting point, adjusted to reflect changes in financing conditions since third party financing was received;
uses a build-up approach that starts with a risk-free interest rate adjusted for credit risk for leases held by QinetiQ Plc, which does not have recent third party financing, and
makes adjustments specific to the lease, example, term country, currency and security.
The Group is not exposed to potential future increases in variable lease payments based on an index or rate, which are not included in the lease liability until they take effect. When adjustments to lease payments based on an index or rate take effect, the lease liability is reassessed and adjusted against the right-of-use asset. Lease payments are allocated between principal and finance cost. The finance cost is charged to profit or loss over the lease period so as to produce a constant periodic rate of interest on the remaining balance of the liability for each period.
Right-of-use assets are measured at cost comprising the following:
the amount of the initial measurement of lease liability; any lease payments made at or before the commencement date less any lease incentives received; any initial direct costs, and restoration costs.
Right-of-use assets are generally depreciated over the shorter of the asset’s useful life and lease term on a straight-line basis. If the Group is reasonably certain to exercise a purchase option, the right-of-use asset is depreciated over the underlying asset’s useful life. The Group does not revalue its land and buildings that are presented within property, plant and equipment and has chosen to do same for right-of-use buildings by the Group. Payments associated with short-term leases of offices, equipment and vehicles and all leases of low-value assets are recognised on a straight-line basis as an expense in profit or loss. Short-term leases are leases with a lease term of 12 months or less. Low-value assets comprise lease assets under £5,000.
Lease extension and termination options Extension and termination options are included in a number of property and equipment leases across the Group. These are used to maximise operational flexibility in terms of managing the assets used in the Group’s operations. The majority of extension and termination options held are exercisable only by the Group and not by the respective lessor.
Judgements in determining the lease term In determining the lease term, management considers all facts and circumstances that create an economic incentive to exercise an extension option or not exercise a termination option. Extension options (or periods after termination options) are only included in the lease term if the lease is reasonably certain to be extended (or not terminated).
For leases of offices and equipment, the following factors are normally the most relevant:
if there are significant penalties to terminate (or extend), the group is typically reasonably certain to end (or not to terminate); if any leasehold improvements are expected to have a significant remaining value, the Group is typically reasonably certain to extend
(or not terminate); Otherwise, the Group considers other factors including historical lease durations and the costs and business disruptions required
to replace the leased asset.
Most extension options in office and vehicles leases have not been included in the lease liability, because the Group could replace the assets without significant cost or business disruption.
As at 31 March 2021 no (undiscounted) potential future cash outflows have been included in the lease liability for extension or termination.
The lease term is reassessed if an option is actually exercised (or not exercised) or the Group becomes obliged to exercise (or not exercise) it. The assessment of reasonable certainty is only revised if a significant event of significant change in circumstance occurs, which affects this assessment, and that is within the control of the lessee. During the current financial year, the financial effect of revising lease terms to reflect the effect of exercising extension or termination options was nil (2020: £0.1m increase) in recognised lease liabilities and right-of-use assets.
172 QinetiQ Group plc

Notes to the Financial Statements continued
QinetiQ Group plc Annual Report and Accounts 2021 133
Financial Statements
Revenue by major customer type For the year ended 31 March
‘Other’ does not contain any customers with revenue in excess of 10% of total Group revenue.
The following table shows the aggregate amount of revenue allocated to performance obligations that are unsatisfied (or partially satisfied) as at the end of the reporting period:
Management expects that 27% (£800.5m) of revenue allocated to unsatisfied contracts as of 31 March 2021 will be recognised as revenue during the next reporting period.
The following table shows the aggregate amount of revenue allocated to performance obligations that were unsatisfied (or partially satisfied) as at the end of the prior reporting period:
Revenue of £144m was recognised during the year that was previously unrecognised as at the previous year end and reported as a contract liability.
3. Segmental analysis
The analysis by business segment is presented in accordance with IFRS 8 Operating Segments, on the basis of those reportable segments whose operating results are regularly reviewed by the Board (the Chief Operating Decision Maker as defined by IFRS 8) and are aligned with the Group’s strategic direction, determined with reference to the products and services they provide, as follows:
EMEA Services provides technical assurance, test and evaluation and training services, underpinned by long-term contracts. EMEA Services comprises the following business units which are not considered reportable segments as defined by IFRS 8: Maritime & Land; Air & Space, Cyber & Information and the International business.
Global Products combines all other business units not aggregated within EMEA Services, including the QinetiQ US business, Space Products and EMEA Products (which includes QinetiQ Target Systems). Generally these business units (which are not considered reportable segments as defined by IFRS 8) deliver innovative solutions and products which includes contract-funded research and development and developing intellectual property in partnership with key customers and through internal funding with potential for new revenue streams.
Operating segments
1 The measure of profit presented to the Chief Operating Decision Maker is operating profit stated before specific adjusting items (‘underlying operating profit’). The specific adjusting items are detailed in note 4.
2 Definitions of the Group’s ‘Alternative performance measures’ can be found in the glossary on page 183.
No measure of segmental assets and liabilities is reported as this information is not regularly provided to the Chief Operating Decision Maker.
All figures in £ million 2021 2020
UK government 794.6 667.2
US government 140.8 116.2
Other 342.8 289.5
Total revenue 1,278.2 1,072.9
All figures in £ million 2022 2023 2024 2025+ Total
Total forecast revenue allocated to unsatisfied performance obligations 800.5 523.9 395.9 1,223.8 2,944.1
All figures in £ million 2021 2022 2023 2024+ Total
Total forecast revenue allocated to unsatisfied performance obligations 849.3 484.9 375.5 1,395.2 3,104.9
2021 2020
All figures in £ million
Revenue from
external customers
Underlying operating
profit1
Revenue from
external customers
Underlying operating
profit1
EMEA Services 939.9 118.6 797.4 100.6
Global Products 338.3 33.2 275.5 32.6
Total operating segments 1,278.2 151.8 1,072.9 133.2
Underlying operating margin2 11.9% 12.4%
Notes to the Financial Statements continued
QinetiQ Group plc Annual Report and Accounts 2021 173
Financial Statements
Investments in debt and equity securities Investments held by the Group are classified as either a current asset or as a non-current asset. These are investments in debt and equity instruments that are classified as at fair value through other comprehensive income. When these investments are derecognised, the cumulative gain or loss previously recognised directly in equity is recognised in the income statement.
The fair value of quoted financial instruments is their bid price at the balance sheet date. The fair value of unquoted equity investments is based on the price of the most recent investment by the Group or a third party, if available, or derived from the present value of forecast future cash flows.
Inventories Inventory and work-in-progress are stated at the lower of cost and net realisable value. Work-in-progress and manufactured finished goods are valued at production cost. Production cost includes direct production costs and an appropriate proportion of production overheads. A provision is established when the net realisable value of any inventory item is lower than its cost. A ‘market comparison’ technique is used to fair value inventories acquired through a business combination. The fair value is determined based on the estimated selling price in the ordinary course of business less the estimated costs of completion and sale, and a reasonable profit margin based on the effort required to complete and sell the inventories.
Trade and other receivables Trade and other receivables are measured at amortised cost less any impairment losses. Amounts recoverable on contracts are included in trade and other receivables and represent revenue recognised in excess of amounts invoiced. Other receivables will also include insurance recoveries where we are virtually certain of recovery.
Impairment of trade and other receivables The Group applies the simplified approach when using the expected credit loss (ECL) impairment model for trade and other receivables. Under the simplified approach the Group always measures the loss allowance at an amount equal to the lifetime expected credit losses for trade receivables. The Group measures the expected credit losses of trade and other receivables in a way that reflects a probability-weighted amount that is determined by evaluating a range of possible outcomes, the time value of money and supportable information that is readily available at each reporting date about past events, current condition and forecasts of future economic conditions. The ECL’s are updated each reporting period to reflect changes in credit risk since initial recognition.
Cash and cash equivalents Cash and cash equivalents comprise cash at bank and short-term, highly liquid investments that are readily convertible into a known amount of cash and which are subject to an insignificant risk of changes in value. The Group holds various short-maturity money market funds (see note 24) across numerous financial institutions which meet the IAS 7 criteria to be classified as cash equivalents. In the cash flow statement overdraft balances are included in cash and equivalents. Cash and cash equivalents includes an element that is restricted in use (note 24).
Current and non-current liabilities Current liabilities include amounts due within the normal operating cycle of the Group. Deferred income, or ‘contract liabilities’, is included in trade and other payables and represents amounts invoiced in excess of revenue recognised. Interest-bearing current and non-current liabilities are initially recognised at fair value and then stated at amortised cost with any difference between the cost and redemption value being recognised in the income statement over the period of the borrowings on an effective interest rate basis. Costs associated with the arrangement of bank facilities or the issue of loans are held net of the associated liability presented in the balance sheet. Capitalised issue costs are released over the estimated life of the facility or instrument to which they relate using the effective interest rate method. If it becomes clear that the facility or instrument will be redeemed early, the amortisation of the issue costs will be accelerated.
Provisions A provision is recognised in the balance sheet when the Group has a present legal or constructive obligation as a result of a past event which can be reliably estimated, and it is probable that an outflow of economic benefits will be required to settle the obligation. Where appropriate, provisions are determined by discounting the expected cash flows at an appropriate discount rate reflecting the level of risk and the time value of money. Where an exposure is highly likely to be covered by insurance no provision is recorded.
Financial instruments Financial assets and financial liabilities are recognised on the Group’s balance sheet when the Group becomes a party to the contractual provisions of the instrument. The de-recognition of a financial instrument takes place when the Group no longer controls the contractual right that comprise the financial instrument, when the instrument expires, or when the instrument is sold, terminated or exercised.
Financial assets Financial assets are classified on the Group’s balance sheet as subsequently measured at amortised cost, fair value through other comprehensive income or fair value through profit or loss. This classification is made on the basis of both the Group’s business model for managing the financial assets and the contractual cash flow characteristics of the financial asset.
Financial liabilities Financial liabilities are classified on the Group’s balance sheet as subsequently measured at amortised cost except for financial liabilities at fair value through profit and loss. The Group may at initial recognition irrevocably designate a financial liability as measured at fair value through profit or loss if a contract contains one or more embedded derivatives and the host is not an asset within the scope of IFRS 9, or when doing so results in more relevant information.
173Annual Report & Accounts 2021
Financial Statements

Notes to the Financial Statements For the year ended 31 March
QinetiQ Group plc Annual Report and Accounts 2021 132
1. Significant changes in the current reporting period
The financial position and performance of the Group was particularly affected by the following events and transactions during the reporting period:
1) The acquisition of Naimuri Limited (see note 12) which resulted in an increase in goodwill (note 14) and other intangible assets (note 15);
2) The divestment of the Boldon James, Commerce Decisions and OptaSense businesses (see note 13); 3) An impairment of goodwill in respect of the Germany business (see note 14).
For a detailed discussion of the Group’s performance and financial position refer to the Strategic Report on pages 2 to 51.
2. Revenue from contracts with customers and other income
Revenue and other income is analysed as follows:
Revenue by category and other income For the year ended 31 March
1 For the period of which there was no contribution in the equivalent period in the comparator year which was pre-ownership (for acquisitions) or post-ownership (for disposals) by the Group
2 Alternative performance measures are used to supplement the statutory figures. See page 183.
Other income
Revenue and profit after tax of associates and joint ventures was £12.6m and £1.1m respectively (2020: revenue of £18.1m and loss after tax of £1.5m). The figures in the table above represent the Group share of this profit after tax.
Other income is in respect of property rentals and the recovery of other related property costs.
Revenue by customer geographic location For the year ended 31 March
All figures in £ million 2021 2020
Services contracts with customers 1,189.4 945.6
Sale of goods contracts with customers 83.0 116.8
Royalties and licences 5.8 10.5
Total revenue 1,278.2 1,072.9
Less: adjust current year for acquired businesses1 (117.2) –
Less: adjust prior year for disposed businesses1 – (17.2)
Adjust to constant prior year exchange rates 2.2 –
Total revenue on an organic, constant currency basis2 1,163.2 1,055.7
Organic revenue growth at constant currency2 10% 10%
All figures in £ million 2021 2020
Share of associates’ and joint ventures’ profit/(loss) after tax 0.7 (0.7)
Other income 9.2 9.9
Other income – underlying 9.9 9.2
Specific adjusting item: gain on sale of property (note 4) 0.1 14.0
Total other income 10.0 23.2
All figures in £ million 2021 2020
US 215.6 136.0
Australia 77.9 60.7
Europe 88.2 75.9
Middle east 9.8 16.3
Rest of world 28.9 44.5
International 420.4 333.4
United Kingdom 857.8 739.5
Total revenue 1,278.2 1,072.9
International revenue % 33% 31%
Revenue from ‘home countries’ (UK, US and Australia) 1,151.3 936.2
Home countries revenue % 90% 87%
Notes to the Financial Statements For the year ended 31 March
QinetiQ Group plc Annual Report and Accounts 2021 174
36. Basis of preparation and significant accounting policies (continued)
Derivative financial instruments Derivative financial instruments are initially recognised and thereafter held at fair value, being the market value for quoted instruments or valuation based on models and discounted cash flow calculations for unlisted instruments.
Fair value hedging Changes in the fair value of derivatives designated as fair value hedges of currency risk or interest rate risk are recognised in the income statement. The hedged item is held at fair value with respect to the hedged risk with any gain or loss recognised in the income statement.
Cash flow hedging Changes in the fair value of derivatives designated as a cash flow hedge that are regarded as highly effective are recognised in equity. The ineffective portion is recognised immediately in the income statement. Where a hedged item results in an asset or a liability, gains and losses previously recognised in equity are included in the cost of the asset or liability. Gains and losses previously recognised in equity are removed and recognised in the income statement at the same time as the hedged transaction.
Foreign currencies Transactions in foreign currencies are recorded using the rate of exchange ruling at the date of the transaction. Monetary assets and liabilities in foreign currencies are translated at period-end rates. Any resulting exchange differences are taken to the income statement. Gains and losses on designated forward foreign exchange hedging contracts are matched against the foreign exchange movements on the underlying transaction.
The individual financial statements of each Group company are presented in its functional currency. On consolidation, assets and liabilities of overseas subsidiaries, associated undertakings and joint ventures, including any related goodwill, are translated to Sterling at the rate of exchange at the balance sheet date. The results and cash flows of overseas subsidiaries, associated undertakings and joint ventures are translated to Sterling using the average rates of exchange during the period. Exchange adjustments arising from the re-translation of the opening net investment and the results for the period to the period-end rate are taken directly to equity and reported in the statement of comprehensive income.
Post-retirement benefits The Group provides both defined contribution and defined benefit pension arrangements. The liabilities of the Group arising from defined benefit obligations are determined using the projected unit credit method. Valuations for accounting purposes are carried out bi-annually. Actuarial advice is provided by external consultants. For the funded defined benefit plans, the excess or deficit of the fair value of plan assets less the present value of the defined benefit obligation are recognised as an asset or a liability respectively.
Per the Scheme rules, the Company has an unconditional right to a refund of any surplus that may arise on cessation of the Scheme in the context of IFRIC 14 paragraphs 11(b) and 12 and therefore the full net pension asset can be recognised on the Group’s balance sheet and the Group’s minimum funding commitments to the Scheme do not give rise to an additional balance sheet liability.
For defined benefit plans, the cost charged to the income statement consists of administrative expenses and the net interest income. There is no service cost due to the fact the plans are closed to future accrual. The net interest income is reported within finance income and the administration cost element is charged as a component of operating costs in the income statement. Actuarial gains and losses and re-measurement gains and losses are recognised immediately in full through the statement of comprehensive income. Contributions to defined contribution plans are charged to the income statement as incurred.
Share-based payments The Group operates share-based payment arrangements with employees. The fair value of equity-settled awards for share-based payments is determined on grant and expensed straight line over the period from grant to the date of earliest unconditional exercise. The valuation methodology for TSR awards is based on Monte Carlo model to allow for the impact of market related performance criteria and taking into account all non-vesting conditions. The value is expensed straight line over the period from grant to the date of earliest unconditional exercise. The charges for equity settled share-based payments are updated annually for non-market-based vesting conditions.
Share capital Ordinary share capital of the Company is recorded as the proceeds received, less issue costs. Company shares held by the employee benefit trusts are held at the consideration paid. They are classified as own shares within equity. Any gain or loss on the purchase, sale or issue of Company shares is recorded in equity.
Non-controlling interests The Group recognises non-controlling interest in an acquired entity either at fair value or at the non-controlling interest’s proportionate share of the acquired entity’s net identifiable assets. This decision is made on an acquisition-by-acquisition basis. For non-controlling interests that the Group holds, the Group elected to recognise the non-controlling interests at its proportionate share of the acquired net identifiable assets.
174 QinetiQ Group plc

Notes to the Financial Statements continued
QinetiQ Group plc Annual Report and Accounts 2021 133
Financial Statements
Revenue by major customer type For the year ended 31 March
‘Other’ does not contain any customers with revenue in excess of 10% of total Group revenue.
The following table shows the aggregate amount of revenue allocated to performance obligations that are unsatisfied (or partially satisfied) as at the end of the reporting period:
Management expects that 27% (£800.5m) of revenue allocated to unsatisfied contracts as of 31 March 2021 will be recognised as revenue during the next reporting period.
The following table shows the aggregate amount of revenue allocated to performance obligations that were unsatisfied (or partially satisfied) as at the end of the prior reporting period:
Revenue of £144m was recognised during the year that was previously unrecognised as at the previous year end and reported as a contract liability.
3. Segmental analysis
The analysis by business segment is presented in accordance with IFRS 8 Operating Segments, on the basis of those reportable segments whose operating results are regularly reviewed by the Board (the Chief Operating Decision Maker as defined by IFRS 8) and are aligned with the Group’s strategic direction, determined with reference to the products and services they provide, as follows:
EMEA Services provides technical assurance, test and evaluation and training services, underpinned by long-term contracts. EMEA Services comprises the following business units which are not considered reportable segments as defined by IFRS 8: Maritime & Land; Air & Space, Cyber & Information and the International business.
Global Products combines all other business units not aggregated within EMEA Services, including the QinetiQ US business, Space Products and EMEA Products (which includes QinetiQ Target Systems). Generally these business units (which are not considered reportable segments as defined by IFRS 8) deliver innovative solutions and products which includes contract-funded research and development and developing intellectual property in partnership with key customers and through internal funding with potential for new revenue streams.
Operating segments
1 The measure of profit presented to the Chief Operating Decision Maker is operating profit stated before specific adjusting items (‘underlying operating profit’). The specific adjusting items are detailed in note 4.
2 Definitions of the Group’s ‘Alternative performance measures’ can be found in the glossary on page 183.
No measure of segmental assets and liabilities is reported as this information is not regularly provided to the Chief Operating Decision Maker.
All figures in £ million 2021 2020
UK government 794.6 667.2
US government 140.8 116.2
Other 342.8 289.5
Total revenue 1,278.2 1,072.9
All figures in £ million 2022 2023 2024 2025+ Total
Total forecast revenue allocated to unsatisfied performance obligations 800.5 523.9 395.9 1,223.8 2,944.1
All figures in £ million 2021 2022 2023 2024+ Total
Total forecast revenue allocated to unsatisfied performance obligations 849.3 484.9 375.5 1,395.2 3,104.9
2021 2020
All figures in £ million
Revenue from
external customers
Underlying operating
profit1
Revenue from
external customers
Underlying operating
profit1
EMEA Services 939.9 118.6 797.4 100.6
Global Products 338.3 33.2 275.5 32.6
Total operating segments 1,278.2 151.8 1,072.9 133.2
Underlying operating margin2 11.9% 12.4%
Notes to the Financial Statements continued
QinetiQ Group plc Annual Report and Accounts 2021 175
Financial Statements
37. Critical accounting estimates and judgements in applying accounting policies
Critical accounting estimates The following commentary is intended to highlight key sources of estimation uncertainty that have a significant risk of resulting in a material adjustment to the financial statements in the next financial year.
Estimated goodwill impairment The Group tests annually whether goodwill has suffered any impairment. This process relies on the use of estimates of the future profitability and cash flows of its cash generating units which may differ from the actual results delivered. In addition, the Group reviews whether identified intangible assets have suffered any impairment. Further details on the sensitivity of the carrying value of goodwill to changes in the key assumptions are set out in note 14.
Estimation of the Group’s defined benefit pension net surplus The Group’s defined benefit pension obligations (and hence the net surplus) are based on key assumptions, including discount rates, mortality and inflation. Management exercises its best judgement, in consultation with actuarial advisors, in selecting the values for these assumptions that are the most appropriate to the Group. Small changes in these assumptions at the balance sheet date, individually or collectively, may result in significant changes in the size of the net surplus/deficit. Further details of these assumptions and the sensitivity of the net pension surplus to changes in these assumptions are set out in note 28.
In addition to the sensitivity of the liability side of the net pension surplus (which will impact the value of the net pension surplus) the net pension surplus is also exposed to significant variation due to changes in the fair value of Scheme assets. A specific sensitivity on assets has not been included in note 28 but any change in valuation of assets flows straight through to the value of the net pension surplus e.g. if equities fall by £10m then the net pension surplus falls by £10m. The values of unquoted assets assume that an available buyer is willing to purchase those assets at that value. For the Group’s portfolio of assets, the property portfolio of £76.6m, the unquoted corporate bonds of £98.0m and the unquoted equities of £47.4m are the assets with most uncertainty as to valuation as at 31 March 2021 as a consequence of the economic uncertainty caused by the COVID-19 pandemic.
Estimated value of tax assets and liabilities The Group has significant levels of unused tax losses and US carried forward interest expense, of which £1.4m has been recognised as a deferred tax asset at 31 March 2021, as set out in note 18. When estimating the appropriate amount that should be recognised, management consider sources of taxable profits including the reversal of deferred tax liabilities and forecast future profits. This estimate is sensitive to similar factors as goodwill, as set out in note 14. Within the current tax payable of £3.8m as at 31 March 2021, management include an estimate of the impact of technical uncertainties associated with tax positions. To the extent that the outcome of a tax audit differs from the tax that has been provided, a material adjustment could arise in a future period. Considering reasonably possible changes in forecast taxable profits and developments with tax authorities, management consider the potential impact of changes in these tax estimates over the next 12 months could range between a £9m increase to a £1m decrease in net assets.
Critical accounting judgements Specific, material judgements made by the Directors in applying the Group’s accounting policies are set out below:
Basis of consolidation The Group comprises certain entities that are operated within the terms of a Special Security Arrangement (‘SSA’). Details of the SSA and QinetiQ’s management of US subsidiaries are set out in the Corporate Governance section of this Annual Report. IFRS 10 is the accounting standard applicable in respect of consolidation of entities. This does not specifically deal with SSA’s. However, having considered the terms of the SSA, the Directors consider that the Group meets the requirements of IFRS 10 in respect of control over such affected entities and, therefore, consolidates these entities in the consolidated accounts. The impact of this specific judgement is full consolidation as opposed to treatment as a 100% associated undertaking. This would reduce Group revenue by a material amount (~£100m per annum) but would have no impact on reported profit, which would include an equivalent amount of profit reported within Other Income as ‘Share of profits of joint ventures and associates’.
Service delivery on a long-term contract The Group is currently party to a specific contract with a customer that required certain activities to be performed within a specified duration. Due to technical issues such activities can no longer reasonably be expected to complete within the currently contracted duration and QinetiQ management have made the judgement that an extra period of one year will be granted by the customer to enable delivery of the currently estimated volume of operations. Should such extension not be granted (and there are no indications that it won’t) and/or the expected level of services not be delivered then a reduction in contract value would be expected. This could have a material revenue impact although the profit impact would be partly mitigated by recourse to insurers and suppliers.
175Annual Report & Accounts 2021
Financial Statements

Company balance sheet As at 31 March
QinetiQ Group plc Annual Report and Accounts 2021 176
The profit for the year ended 31 March 2021 was £45.0m (2020: profit of £47.4m).
The financial statements of QinetiQ Group plc (company number 4586941) were approved by the Board of Directors and authorised for issue on 20 May 2021 and were signed on its behalf by:
Steve Wadey David Smith
Chief Executive Officer Chief Financial Officer
All figures in £ million Note 2021 2020
Fixed assets
Investments in subsidiary undertaking 2 507.4 482.5
507.4 482.5
Current liabilities
Creditors: amounts falling due within one year 3 (72.9) (70.6)
Net current liabilities (72.9) (70.6)
Total assets less current liabilities 434.5 411.9
Net assets 434.5 411.9
Equity
Share capital 4 5.7 5.7
Capital redemption reserve 40.8 40.8
Share premium 147.6 147.6
Retained earnings 240.4 217.8
Total equity 434.5 411.9
176 QinetiQ Group plc

Company statement of changes in equity For the year ended 31 March
QinetiQ Group plc Annual Report and Accounts 2020 177
Financial Statements
The capital redemption reserve is not distributable and was created following redemption of preference share capital.
All figures in £ million Share
capital
Capital redemption
reserve Share
premium Retained earnings
Total equity
At 1 April 2020 5.7 40.8 147.6 217.8 411.9
Profit for the year – – – 45.0 45.0
Purchase of own shares – – – (9.0) (9.0)
Shares settled liabilities – – – 13.7 13.7
Dividend paid – – – (37.7) (37.7)
Share-based payments – – – 10.6 10.6
At 31 March 2021 55..77 4400..88 114477..66 240.4 434.5
At 1 April 2019 5.7 40.8 147.6 202.3 396.4
Profit for the year – – – 47.4 47.4
Purchase of own shares – – – (0.7) (0.7)
Dividend paid – – – (38.0) (38.0)
Share-based payments – – – 6.8 6.8
At 31 March 2020 5.7 40.8 147.6 217.8 411.9
177Annual Report & Accounts 2021
Financial Statements

Notes to the Company Financial Statements
QinetiQ Group plc Annual Report and Accounts 2021 178
1. Accounting policies
The Company is a public limited company and is incorporated and domiciled in United Kingdom.
The following accounting policies have been applied consistently in dealing with items which are considered material in relation to the Company’s financial statements.
Basis of preparation The financial statements have been prepared on a going concern basis under the historical cost convention and in accordance with applicable UK Accounting Standards. As permitted by section 408(4) of the Companies Act 2006, a separate profit and loss account dealing with the results of the Company has not been presented.
These financial statements were prepared in accordance with Financial Reporting Standard 101 Reduced Disclosure Framework. In preparing these financial statements, the Company is in accordance with International Accounting Standards in conformity with the requirements of the Companies Ace 2006 and the International Financial Reporting Standards adopted pursuant to Regulation (EC) No 1606/2002 as it applies in the EU but makes amendments where necessary in order to comply with Companies Act 2006 and has set out below where advantage of the FRS 101 disclosure exemptions has been taken.
– A cash flow statement and related notes – Disclosures in respect of capital management – The effects of new but not yet effective IFRSs – Disclosures in respect of the compensation of key management personnel – IAS 24 in respect of related party transactions entered into between two or more members of a group – IFRS 2 Share Based Payments in respect of Group-settled share-based payments – Certain disclosures required by IFRS 13 Fair Value Measurement and the disclosures required by IFRS 7.
Investments In the Company’s financial statements, investments in subsidiary undertakings are stated at cost less any impairment in value.
Share-based payments The cost of share-based payments in respect of employees of Group subsidiaries is charged to those subsidiary undertakings. In the Company financial statements the recoverable from subsidiaries is credited directly to equity as a capital contribution. The fair value of equity-settled awards for share-based payments is determined on grant and expensed in subsidiary undertakings (and credited to equity in the Company) on a straight line basis over the period from grant to the date of earliest unconditional exercise. The charges for equity-settled share-based payments are updated annually for non-market-based vesting conditions. Further details of the Group’s share-based payment charge are disclosed in note 30 to the Group financial statements.
2. Investments in subsidiary undertakings
As at 31 March
The increase in investments in subsidiary undertakings in 2021 relates to £11.2m of equity-settled schemes during the year and share settled liabilities of £13.7m in relation to 2020 settlement of bonus incentives in shares.
A list of all subsidiary undertakings of QinetiQ Group plc is disclosed in note 35 to the Group financial statements.
3. Creditors: amounts falling due within one year
As at 31 March
Amounts owed to Group undertakings are unsecured, repayable on demand and bear no interest.
All figures in £ million 2021 2020
Subsidiary undertaking – 100% of ordinary share capital of QinetiQ Group Holdings Limited 424.3 424.3
Capital contributions arising from share-based payments to employees of subsidiaries 69.4 58.2
Capital contributions arising from share-settled liabilities 13.7 –
Total investment in subsidiary undertakings 507.4 482.5
All figures in £ million 2021 2020
Amounts owed to Group undertakings 72.9 70.6
178 QinetiQ Group plc

Notes to the Company Financial Statements
QinetiQ Group plc Annual Report and Accounts 2020 179
Financial Statements
4. Share capital
The Company’s share capital is disclosed in note 29 to the Group financial statements.
5. Share-based payments
The Company’s share-based payment arrangements are set out in note 30 to the Group financial statements.
6. Parent company guarantees
The Company has provided guarantees to various customers of subsidiaries to the value of £21.0m (2020: £21.0m) in the ordinary course of business.
7. Other information
Directors’ emoluments, excluding Company pension contributions, were £5.9m (2020: £4.4m). These emoluments were all in relation to services provided on behalf of the QinetiQ Group with no amount specifically relating to their work for the Company. Details of the Directors’ emoluments, share schemes and entitlements under money purchase pension schemes are disclosed on page 99 in the Remuneration Report.
The remuneration of the Company’s auditor for the year to 31 March 2021 was £0.4m (2020: £0.4m), which was for audit of the Group financial statements and Company financial statements and audit related assurance services. No other services were provided by the auditors to the Company.
The monthly average number of employees for the year to 31 March 2021 was nil (2020: nil).
179Annual Report & Accounts 2021
Financial Statements

Five Year Record
QinetiQ Group plc Annual Report and Accounts 2021 180
1 Underlying measures are stated before specific adjusting items. Definitions of underlying measures of performance are provided on page 183. Underlying financial measures are presented because the Board believes these provide a better representation of the Group’s long-term performance trend. For details of specific adjusting items refer to note 4 and note 36 of the financial statements.
For the years ended 31 March (unaudited) 2021 2020 2019 2018 2017
EMEA Services £m 939.9 797.4 687.7 651.4 613.5
Global Products £m 338.3 275.5 223.4 181.6 169.6
Revenue £m 1,278.2 1,072.9 911.1 833.0 783.1
EMEA Services £m 118.6 100.6 96.8 94.3 92.7
Global Products £m 33.2 32.6 28.1 28.2 23.6
Underlying operating profit1 £m 151.8 133.2 124.9 122.5 116.3
Underlying operating margin1 % 11.9 12.4 13.7 14.7 14.9
Operating profit £m 112.3 117.6 114.8 141.0 132.7
Underlying profit before tax1 £m 149.9 132.2 124.0 122.1 116.1
Profit before tax £m 146.2 123.1 123.2 144.8 131.5
Profit attributable to owners of the Company £m 124.5 106.3 113.9 138.1 123.3
Underlying basic EPS1 attributable to owners of the Company Pence 22.1 20.0 19.7 19.3 18.1
Basic EPS attributable to owners of the Company Pence 21.9 18.7 20.1 24.4 21.5
Diluted EPS attributable to owners of the Company Pence 21.6 18.6 20.0 24.3 21.3
Dividend per share Pence 6.9 6.6 6.6 6.3 6.0
Underlying net cash flow from operations 1 £m 199.0 177.8 135.3 126.5 111.9
Net cash as defined by the Group £m 164.1 84.7 160.5 266.8 221.9
Average number of employees 6,874 6,267 5,994 6,143 6,114
Orders excluding LTPA amendments £m 1,151.0 972.1 776.4 587.2 675.3
180 QinetiQ Group plc

Foreign exchangeThe principal exchange rates affecting the Group were the Sterling to US Dollar exchange rate and the Sterling to Australian Dollar rate.
12 months to
31 March 202112 months to
31 March 2020
£/US$ – opening 1.24 1.30
£/US$ – average 1.31 1.27
£/US$ – closing 1.38 1.24
£/A$ – opening 2.03 1.83
£/A$ – average 1.84 1.86
£/A$ – closing 1.81 2.03
Treasury policyThe Group treasury department works within a framework of policies and procedures approved by the Audit Committee. There is a structured approach to financial risk management, mitigating exposures to currency, liquidity, counterparty and credit risks as outlined in note 27. The policy supports the use of financial instruments to manage and hedge business operations risks that arise on movements in financial, credit or money markets. As part of these policies and procedures, there is strict control on the use of financial instruments. Speculative trading in financial instruments is not permitted.
• Currency risk – The Group’s income and expenditure is largely settled in the functional currency of the relevant Group entity. However, where cash flows are denominated in currencies other than the functional currency of the relevant trading entity, the Group has a policy in place to hedge all material transaction exposure at the point of commitment to the underlying transaction. Uncommitted future transactions are not routinely hedged. Where the timing of cash flows differ from the original expectation, the Group will enter into currency swaps to realign the hedge maturity. The maximum permitted hedge period is 5 years. The Group does not hedge translation exposures arising from the consolidation of overseas subsidiaries in foreign currencies.
• Financial credit and liquidity risk – The Group manages liquidity risk to ensure funds are available to meet business needs and maximise return while managing counterparty and credit risks. Investments are permitted with institutions on an Approved Counterparty list and not to exceed the counterparty credit limit. Investments must be held in the currency of the reporting entity except currency deposits or borrowings specifically placed to hedge assets or liabilities with related hedge documentation. Group funding is established to meet the Group’s medium and long-term financing requirements. Facilities are agreed with a number of financial institutions such that no single institution exerts undue influence on the Group. At the year end the Group had an undrawn revolving credit facility of £275m of which £65m matures on 27 September 2024 and £210m matures on 27 September 2025.
The policies are established to manage and control risk in the treasury environment and to align the treasury goals, objectives and philosophy of the Group.
Tax risk managementQinetiQ’s tax strategy, as published on its corporate website, is to
ensure compliance with all relevant tax legislation, wherever we do business, whilst managing our effective tax rates and tax cash flows. Tax is managed in alignment with our corporate responsibility strategy in that we strive to be responsible in all our business dealings with a zero tolerance of tax evasion. These principles are applied in a consistent and transparent manner in pursuing the tax strategy and in all dealings with tax authorities around the world.
• Tax planning – QinetiQ manages both effective tax rate (ETR) and cash tax impacts in line with the Board-endorsed tax strategy. External advice and consultation are sought on potential changes in tax legislation in the UK, the US and elsewhere as necessary, enabling the Group to plan for and mitigate potential changes. QinetiQ does not make use of ‘off-shore’ entities or tax structures to focus taxable profits in jurisdictions that legislate for low tax rates.
• Relationships with tax authorities – QinetiQ is committed to building constructive working relationships with tax authorities based on a policy of full disclosure in order to remove uncertainty in its business transactions and allow the authorities to review possible risks. In the UK, QinetiQ seeks to be open and transparent in its engagement with the tax authorities by sharing with HMRC the methodologies adopted in its tax returns.
• Transfer pricing – QinetiQ does not have a significant level of cross-border activity but this will increase as it pursues its policy of expanding around the globe. Where there is cross-border activity, controls are in place to ensure pricing reflects ‘arm’s length’ principles in compliance with the OECD Transfer Pricing Guidelines and the laws of the relevant jurisdictions. The Group does not, therefore, have a significant exposure to transfer pricing legislation. QinetiQ submits its ‘Country by Country’ report to the UK tax authorities in line with the OECD rules providing insight for tax authorities into its global tax affairs.
• Governance – The Board has approved this approach. The Audit Committee oversees the tax affairs and risks through periodic reviews. The governance framework is used to manage tax risks, establish controls and monitor their effectiveness. The Head of Tax is responsible for ensuring that appropriate policies, processes and systems are in place and that the tax team has the required skills and support to implement this approach.
QinetiQ’s corporate tax contribution – QinetiQ is liable to pay tax in the countries in which it operates, principally the UK, the US, Australia, Canada, Germany and Belgium. Changes in tax legislation in these countries could have an adverse impact on the level of tax paid on profits generated by the Group. A significant majority of the Group’s profit before tax is generated in the UK. This reflects the fact that the majority of the Group’s business is undertaken, and employees are based, in the UK. Total corporation tax payments in the year to 31 March 2021 were £15.0m (2020: £10.0m).
The differential between the taxation expense and the tax paid in the year relates primarily to the timing of the recovery of research and development expenditure credits for which the cash is recovered in the year following the year of account. There is also an impact of deferred tax movements, whereby the income statement bears charges and credits (e.g. in respect of property, plant and equipment) but for which there is no corporation tax paid in the year. Together, these result in the cash paid being £6.5m less than the total expense charged to the income statement.
Additional Financial Information
181Annual Report & Accounts 2021
Other Information

AGM Annual General Meeting
BBP Bonus Banking Plan
CAGR Compound Annual Growth Rate
C4ISR Command, control, communications, computers, intelligence, surveillance and reconnaissance
COTS Commercial off the shelf
CPI Consumer Price Index
CR Corporate Responsibility
CRC Carbon Reduction Commitment
CSR Corporate Social Responsibility
DE&S MOD’s Defence, Equipment and Support organisation
DHS US Department of Homeland Security
DSP Deferred Share Plan
DoD US Department of Defense
EBITDA Earnings before interest, tax, depreciation and amortisation
ED&I Equality, diversity and inclusion
EDP Engineering Delivery Partner
EMEA Europe, Middle East and Australasia
EPS Earnings per share
ESA European Space Agency
ESOS Energy Savings Opportunity Scheme
EST Engineering, Science and Technical
FAR Federal Acquisition Regulations
FCA Financial Conduct Authority
FMI Foster-Miller, Inc. – the legal entity through which the QNA business operates
Funded order backlog The expected future value of revenue from
contractually committed and funded customer orders
GEV Global Employee Voice
GHG Greenhouse gas
IAS International Accounting Standards
IBDM International Berthing and Docking Mechanism
IFRS International Financial Reporting Standards
IRAD Internal research and development
KPI Key Performance Indicator
LDP Leadership development programme
LIBID London inter-bank bid rate
LIBOR London inter-bank offered rate
LTI Lost time incident
LTPA Long Term Partnering Agreement – 25-year contract established in 2003 to manage the MOD’s Test and Evaluation ranges
MDP Modernising Defence Programme
MOD UK Ministry of Defence
MSCA Maritime Strategic Capability Agreement
NCSISS Naval Combat System Integration Support Services
OHSAS Occupational Health and Safety Advisory Services
PDR Performance development review
PBT Profit before tax
PSP Performance Share Plan
QNA QinetiQ North America
QSOS QinetiQ Share Option Scheme
QTS QinetiQ Target Systems
R&D Research and development
RDEC Research and development expenditure credit
SE Strategic Enterprise
SPA Special protection area
SSRO Single Source Regulations Office
SSSI Site of Special Scientific Interest
STEM Science, Technology, Engineering and Maths
T&E Test and Evaluation
T&R Training and Rehearsal
TSR Total shareholder return
UAV Unmanned aerial vehicle
UK Corporate Governance Code Guidelines of the Financial Reporting Council to
address the principal aspects of corporate governance in the UK
UK GAAP UK Generally Accepted Accounting Practice
Glossary
182 QinetiQ Group plc

Alternative performance measures (APMs)The Group uses various non-statutory measures of performance, or APMs. Such APMs are used by management internally to monitor and manage the Group’s performance and also allow the reader to obtain a proper understanding of performance (in conjunction with statutory financial measures of performance). The APMs used by QinetiQ are set out below:
Measure Explanation Note
Organic growth The level of year-on-year growth, expressed as a percentage, calculated at constant prior year foreign exchange rates, adjusting for business acquisitions and disposals to reflect equivalent composition of the Group
Note 2
Underlying operating profit
Operating profit as adjusted to exclude ‘specific adjusting items’ Note 3
Underlying operating margin
Underlying operating profit expressed as a percentage of revenue Note 3
Underlying net finance income/expense
Net finance income/expense as adjusted to exclude ‘specific adjusting items’ Note 7
Underlying profit before/after tax
Profit before/after tax as adjusted to exclude ‘specific adjusting items’ Note 4
Underlying effective tax rate
The tax charge for the year excluding the tax impact of ‘specific adjusting items’ expressed as a percentage of underlying profit before tax
Note 9
Underlying basic and diluted EPS
Basic and diluted earnings per share as adjusted to exclude ‘specific adjusting items’ Note 10
Orders The level of new orders (and amendments to existing orders) booked in the year. Includes share of orders won by joint ventures.
N/A
Backlog, funded backlog or order book
The expected future value of revenue from contractually committed and funded customer orders N/A
Book to bill ratio Ratio of funded orders received in the year to revenue for the year, adjusted to exclude revenue from the 25-year LTPA contract due to significant size and timing differences of LTPA order and revenue recognition which may distort the ratio calculation
N/A
Underlying net cash flow from operations
Net cash flow from operations before cash flows of specific adjusting items. Note 25
Underlying operating cash conversion or cash conversion ratio
The ratio of underlying net cash from operations to underlying operating profit Note 25
Free cash flow Underlying net cash flow from operations less net tax and interest payments less purchases of intangible assets and property, plant and equipment. Plus proceeds from disposal of plant and equipment.
Note 25
Net cash Net cash as defined by the Group combines cash and cash equivalents with other financial assets and liabilities, primarily available for sale investments, derivative financial instruments and finance lease assets/liabilities.
Note 24
Specific adjusting items Amortisation of intangible assets arising from acquisitions; impairment of property; gains/losses on disposal of property and investments; net pension finance income; transaction and integration costs in respect of business acquisitions; tax impact of the preceding items and significant non-recurring deferred tax movements.
Note 4
183Annual Report & Accounts 2021
Other Information

Registrar: Equiniti Limited www.shareview.co.uk Tel: 0371 384 2021
Shareholding enquiriesThe Company’s registrar is Equiniti. Enquiries regarding your shareholding, including the following administrative matters, should be addressed to Equiniti:
• Change of personal details such as change of name or address
• Lost share certificates
• Dividend payment enquiries
• Direct dividend payments. You can have your dividends paid directly into a UK bank or building society account by completing a dividend mandate form. The associated dividend confirmation will still be sent to your registered address. If you live outside the UK, Equiniti offers a global payments service which is available in certain countries and could enable you to receive your dividends direct into your bank account in your local currency
Contact details for registrarBy post:Equiniti Limited, Aspect House, Spencer Road Lancing, West Sussex BN99 6DA
By telephone:0371 384 2021* for UK calls, +44 (0)121 415 7576 for calls from outside the UK.
* Lines are open 8.30am to 5.30pm (UK time), Monday to Friday (excluding public holidays in England and Wales).
By email:You can send an email enquiry securely from Equiniti’s website, at help.shareview.co.uk
Online:Equiniti’s website at help.shareview.co.uk (Shareview) includes answers to frequently asked questions and provides key forms for download. Shareview also offers online access to your shareholding where you can manage your account, register for electronic communications, see details of balance movements and complete certain amendments online, such as changes to dividend mandate instructions. You can register at www.shareview.co.uk, click on ‘Register’ and follow the steps.
Electronic communicationsFollowing the latest guidance from the Department for Business, Energy & Industrial Strategy (BEIS) in assisting companies to meet their statutory obligations during the COVID-19 pandemic, the Company will this year only make documentation and communication available electronically via the Company’s website. In addition, communications electronically, via the wider use of electronic communications enables fast receipt of documents, reduces the Company’s printing, paper and postal costs and reduces the Company’s environmental impact. Shareholders can register for electronic communications at www.shareview.co.uk and may also cast their vote for the 2021 Annual General Meeting online quickly and easily using the Sharevote service by visiting www.sharevote.co.uk
Donating shares to charity – ShareGiftSmall parcels of shares, which may be uneconomic to sell on their own, can be donated to ShareGift, the share donation charity (registered charity no. 1052686). ShareGift transfers these holdings into their name, aggregates them, and uses the proceeds to support a wide range of UK charities based on donor suggestion. If you would like further details about ShareGift, please visit www.sharegift.org, email [email protected] or telephone them on 020 7930 3737.
Share priceDetails of current and historical share prices can be found on the Company’s website at www.QinetiQ.com/investors
Analysis of share register at 31 March 2021
By type of holder Total number of holdings Percentage of holders Total number of sharesPercentage issued
capital
Individual 5,299 88.41% 5,262,650 0.92%
Institutions and others 695 11.59% 568,994,471 99.08%
Total 5,994 100% 574,257,121 100%
By size of holding
1–500 3,915 65.32% 760,907 0.13%
501–1,000 528 8.81% 423,993 0.07%
1,001–2,500 606 10.11% 1,058,364 0.18%
2,501–5,000 343 5.72% 1,241,341 0.22%
5,001–10,000 171 2.85% 1,259,368 0.22%
10,001–100,000 213 3.55% 7,239,900 1.26%
Over 100,000 218 3.64% 562,273,248 97.92%
Total 5,994 100% 574,257,121 100%
Shareholder Information
184 QinetiQ Group plc

Share fraud reporting: www.fca.org.uk/scams FCA Consumer Helpline: 0800 111 6768
Beware of share fraudFraudsters use persuasive and high-pressure tactics to lure investors into scams. They may offer to sell shares that turn out to be worthless or non-existent, or to buy shares at an inflated price in return for an upfront payment. While high profits are promised, if you buy or sell shares in this way you will probably lose your money.
How to avoid share fraud1. Keep in mind that firms authorised by the FCA are unlikely
to contact you out of the blue with an offer to buy or sell shares.
2. Do not get into a conversation, note the name of the person and firm contacting you and then end the call.
3. Check the Financial Services Register from www.fca.org.uk to see if the person and firm contacting you is authorised by the FCA.
4. Beware of fraudsters claiming to be from an authorised firm, copying its website or giving you false contact details.
5. Use the firm’s contact details listed on the Register if you want to call it back.
6. Call the FCA on 0800 111 6768 if the firm does not have contact details on the Register or you are told they are out of date.
7. Search the list of unauthorised firms to avoid at www.fca.org.uk/scams.
8. Consider that if you buy or sell shares from an unauthorised firm you will not have access to the Financial Ombudsman Service or Financial Services Compensation Scheme.
9. Think about getting independent financial and professional advice before you hand over any money.
10. Remember: if it sounds too good to be true, it probably is!
Report a scamIf you are approached by fraudsters please tell the FCA using the share fraud reporting form at www.fca.org.uk/scams, where you can find out more about investment scams. You can also call the FCA Consumer Helpline on 0800 111 6768.
If you have already paid money to share fraudsters you should contact Action Fraud on 0300 123 2040.
Key dates
21 July 2021 Trading update
21 July 2021 Annual General Meeting
30 September 2021 Half-year financial period end
11 November 2021 Half-year results announcement
January 2022 Trading update (provisional date)
31 March 2022 Financial year end
19 May 2022 Preliminary results announcement
Cautionary statementAll statements other than statements of historical fact included in this Annual Report, including, without limitation, those regarding the financial condition, results, operations and businesses of QinetiQ and its strategy, plans and objectives and the markets and economies in which it operates, are forward-looking statements. Such forward-looking statements, which reflect management’s assumptions made on the basis of information available to it at this time, involve known and unknown risks, uncertainties and other important factors which could cause the actual results, performance or achievements of QinetiQ or the markets and economies in which QinetiQ operates to be materially different from future results, performance or achievements expressed or implied by such forward-looking statements. Nothing in this Annual Report should be regarded as a profit forecast.
This Annual Report is intended to provide information to shareholders and is not designed to be relied upon by any other party. The Company and its Directors accept no liability to any other person other than under English law.
Company Information and Advisors
Corporate brokersBarclays, 1 Churchill Place, London, EC14 5HP
Numis, 10 Paternoster Square London, EC4M 7LT
Registered officeCody Technology Park, Ively Road, Farnborough, Hampshire, GU14 0LX Tel: +44 (0) 1252 392000 Company Registration Number: 4586941
Principal legal advisorAshurst LLP, London Fruit and Wool Exchange, 1 Duval Square, London, E1 6PW
Independent auditorsPricewaterhouseCoopers LLP, Savannah House, 3 Ocean Way, Southampton, SO14 3TJ
RegistrarEquiniti, Aspect House, Spencer Road, Lancing, West Sussex, BN99 6DA
185Annual Report & Accounts 2021
Other Information
Printer paper stock detail: Printed to the EMAS standard and its Environmental Management System is certified to ISO 14001. This publication has been manufactured using 100% offshore wind electricity sourced from UK wind. 100% of the inks used are vegetable oil based, 95% of press chemicals are recycled for further use and, on average 99% of any waste associated with this production will be recycled and the remaining 1% used to generate energy. This document is printed on Revive 100% Offset paper containing 100% recycled fibre. The FSC® label on this product ensures responsible use of the world’s forest resources.

Annual Report & Accounts 2021QinetiQ Group plc
Cody Technology Park Ively Road Farnborough Hampshire GU14 0LX
Tel: +44 (0) 1252 392000 Company Registration Number: 4586941