accelerating economic development - cdfa economic development: ... a list of summit participants is...
TRANSCRIPT
Accelerating Economic Development:The Area-Wide Approach of the Brownfield Opportunity Areas Program
Accelerating Economic Development:The Area-Wide Approach of the Brownfield Opportunity Areas Program
F A L L 2 0 1 1
Authors: Jody Kass, Laura Truettner, John Fleming, and Jeff Jones.

Accelerating Economic Development:The Area-Wide Approach of the Brownfield Opportunity Areas Program
F A L L 2 0 1 1
Executive SummaryJob creation and economic revitalization are at the top of the agenda of nearly every decision-maker in the country — local, state and federal. Recovery from the economic recession and financial crisis has been slow, with New York’s unemployment rate stuck at 8%. While the search for effective economic revitalization strategies continues, fiscal constraints limit the range of policy options. New Yorkers must do more with less while simultaneously pursuing creative, cost efficient economic revitalization strategies that create new businesses and jobs.
Complicating economic development initiatives are the thousands of brownfield sites that exist in every community across the state — eyesores that mar the landscape and place a drag on revitalization efforts. The state’s low — and moderate — income neighborhoods and communities of color are disproportionately impacted by multiple brownfield sites, as well as the associated decay and environmental degradation that typically accompany the existence of these sites — broken and dilapidated transportation infrastructure, illegal dumping, outdated sewer and water systems, broken streetlights and sidewalks, and housing stock in disrepair that is suffering from foreclosures and abandonment. Many are in historic downtown areas, the polluted legacy of sprawling development and urban neglect; others are in waterfront communities, where crumbling piers and bulkheads present further challenges to redevelopment.
Cleaning up one or two brownfields at a time is not going to address the larger problems that are stifling economic development in these communities. In fact, the cleanup of brownfields on a site-by-site basis, without a strategy to address adjacent land use and proximate infrastructure problems, often invites noxious or stigmatizing uses such as junkyards, garbage transfer stations, power plants and unlicensed auto repair shops.
The good news is that New York already has a tool specifically designed to reverse the cycle of disinvestment and decay — the Brownfield Opportunity Areas (BOA) program. Through the BOA area-wide approach, municipalities and community based organizations (CBOs) are using state funds to conduct feasibility studies, planning, market and infrastructure analyses, site investigations and other studies needed to create and carry out informed revitalization strategies. BOA is based not on what is there now, or what the real estate market might otherwise attract or resist, but on what the community wants and needs, grounded by what is feasible. By looking at the area as a whole, the most productive, innovative and appropriately scaled end uses will be planned, creating new economic anchors and helping put properties back on the tax rolls. At its heart, the BOA area-wide approach is about creating value. Already, hundreds of sites identified by community leaders as ripe for development — some shovel ready — are emerging from the pre-development, planning and feasibility studies that are now laying the groundwork and attracting developers and investment.
New York’s BOA program should not be confused with the state Brownfield Cleanup/Tax Credit Program, which has been much criticized as being fiscally irresponsible and inefficient. Rather, BOA is a successful model that is now being replicated nationally, with 23 communities piloting the area-wide approach across the country. Those are in addition to the 110
BOA communities already involved in New York. Nationally, BOA is also viewed as a potential new tool to address the intractable problems facing the nation’s auto cities — particularly those communities that are reeling from the contraction in the automobile industry.
New York’s BOA program is making a significant contribution to job creation and economic development across the state, with the potential to provide an even greater boost. Governor Andrew Cuomo affirmed his support of the BOA approach in April when he announced a new round of grant awards, bringing the state’s investment in the BOA program to $32.4 million. Using national multipliers and estimates of the impacts of leveraging public investments, the job generating prospects of the BOA program in New York are estimated at 30,000 - 50,000 new jobs. The program is also projected to generate an annual wage-related tax flow of $165 million and to leverage an estimated $440 million in additional investment. (See NPCR’s report, Smart Investments Laying the Groundwork for Economic Development, June 2011). In addition to job generated tax revenue, the state gains from the additional creation of local tax revenue as property values increase, from private and public funds leveraged in BOA areas, through mass transit expansion, infrastructure investments, and the preservation of open space and greenfields, among other environmental and social benefits.
The BOA area-wide approach also has enormous potential to strengthen the new regional economic development strategy being implemented by Gov. Andrew Cuomo and his administration. Ten Regional Economic Development Councils (REDCs) have been created — coterminous with the 10 regions of the Empire State Development Corporation. Just getting underway now, the REDCs are competing for economic development funds through regional strategic plans and are soliciting competitive ideas for development projects to be funded by the state. In addition, many existing state-funded programs will be accessed through a new application process, the Consolidated Funding Application (CFA), that includes evaluation by the regional bodies. According to the Governor, “the Regional Councils represent a fundamental shift in the state’s approach to economic development, from a top-down development model to a community-based approach that emphasizes regions’ unique assets, harnesses local expertise, and empowers each region to set plans and priorities.” BOA offers a tremendous boost to REDC strategic planning because market analyses, feasibility studies, infrastructure assessments are well underway with BOA resources and because BOA is already spearheading the engagement of communities about their revitalized future. Such data and bottom-up strategic planning should inform REDC economic development priorities.
This report, “Accelerating Economic Development: The Area-Wide Approach of the Brownfield Opportunity Areas program,” is based on extensive discussions with BOA grantees across the state, both through a formal questionnaire, and through follow-up phone and in-person interviews. It addition, it reflects issues and concerns raised at NPCR’s Brownfields Summit this past Spring in Albany. Over 120 people, including representatives from 50 BOA communities, participated in the Summit. (For a list of participants, see Appendix 2).
The material presented in this report was informed by NPCR’s June 2011 Albany Brownfields Summit, as well as NPCR’s ongoing policy and program work. A list of Summit participants is included in Appendix 2. While NPCR’s analysis benefitted greatly from the discussions at the Summit, the recommendations included herein are solely those of NPCR.
i
Accelerating Economic Development:The Area-Wide Approach of the Brownfield Opportunity Areas Program
F A L L 2 0 1 1
The Economic Benefits of BOA The New York State Brownfields Law, passed in 2003 following years of planning and advocacy, created the landmark Brownfield Opportunity Areas (BOA) program. The BOA program’s area-wide approach was conceived as a tool to achieve sustainable, economic development and environmental justice by addressing clusters of brownfields and the associated environmental degradation that are fueling disinvestment and decay in neighborhoods and communities across the state.
A brownfield is real property that is difficult to reuse or redevelop because of the presence or potential presence of contamination. Brownfields create environmental, legal, and financial burdens. Communities with multiple brownfield sites are often trapped in a downward spiral of disinvestment and decay. Conversely, many New York communities are finding that brownfield remediation and redevelopment is a powerful driver for economic growth and stability. Brownfield investments are creating commercial anchors and vital new urban and downtown places, adding jobs, increasing property values and strengthening local tax bases. The BOA program, administered by the New York State Department of State (DOS), is laying the groundwork for this boost in economic growth by providing the necessary guidance, expertise and funding to transform over 100,000 acres of property affected by over 4,900 brownfields (see Appendix #5).
Site revitalization efforts create economic benefits and these same benefits accrue to and catalyze additional paybacks to communities that are implementing area-wide brownfield redevelopment initiatives. The area-wide approach also creates highly favorable conditions for “the linchpin” effect in which brownfield revitalization is the catalyst that leads to the transformation of whole neighborhoods and districts.1 The transforming of proximate abandoned or underused properties creates a chain-reaction of positive events, and when several properties within a defined area are redeveloped, the chain reaction is that much more powerful. While the linchpin effect of the BOA area-wide program has not been quantified, conservative conclusions about the impacts of brownfield development via area-wide planning can be drawn based on existing studies of the benefits of individual site redevelopment. To date, 149 BOA grants have been awarded, totaling $32.4 million, to 110 communities. Because the BOA program is relatively new and revitalization efforts take time, an analysis of the program benefits is necessarily preliminary and will need refinement as the program matures. Nonetheless, a review of national data suggests that the benefits of BOA are wide-ranging and significant. Summarized below are several
important economic development indicators that verify the significant value of the public dollars invested.
Jobs: Revitalization efforts create pre-development jobs associated with redevelopment and community revitalization planning; site investigation, remediation and construction jobs, and post-development commercial and industrial jobs associated with the new land use.
• Pre-development Job Cre-ation: The DOS investment of $32.4 million in the BOA program is projected to create and/or maintain 1,080 pre-development jobs.2 These include jobs for local community based organizations, urban designers and planners, environmental scientists, economic con-sultants, and other personnel involved in BOA planning and site investigation.3 Such additional jobs may include architects, landscape archi-
tects, transportation and infrastructure engineers, marketing and real estate consultants and archaeologists.
• Post-developmentJobCreation: It is projected that each BOA study area has the potential to create between 275 and 455 jobs.4, 5 There are currently 110 BOA study areas, using two different job creation statistics. this translates to between 30,000 and 50,000 jobs in BOAs across New York State.6, 7 These numbers are conservative because they do not take into account the “linchpin” or synergistic effects that redevelopment of strategic sites will have on the larger BOA study area.
1 Northeast Midwest Institure (NEMW), 2008. The Environmental and Economic Impacts of Brownfields Redevelopment available at: http://www.nemw.org/index.php/policy-areas/brownfields/environmental-and-economic-impacts-of-brownfields-redevelopment and EPA, 2003. For EPA’s Brownfields Programs, “Green” Refers to More than the Environment available at: http://www.epa.gov/swerosps/bf/success/Green_Money.pdf 2 New York City commissioned The Louis Berger group to conduct an analysis of job creation associated with PlaNYC. The report provides an estimate of the pre-development jobs created in connection with the Local Brownfields Cleanup Program (LBCP) (such as conducting investigative and remedial activities). It does not consider jobs created after redevelopment. Berger estimates that NYC’s investment of s $15 million in the LBCP leveraged 500 jobs, by a simple ratio, DOS’s $32.4 million would leverage 1,080 jobs. While the analysis is not directly comparable because some of NYC’s money is set aside for incentive bonuses, both grants provide funds for the hiring of consultants to conduct work on behalf of the developer/grantee and so were deemed similar for the intent of this report. The report, entitled “Analysis of Job Creation in PlaNYC Final Report” is available at http://www.nyc.gov/html/om/pdf/2008/pr110_planyc_job_creation_analysis.pdf. 3“Louis Berger Group, March 2008, Analysis of Job Creation in PlaNYC Final Report, available at http://www.nyc.gov/html/om/pdf/2008/pr110_planyc_job_creation_analysis.pdf 4It may be conservatively assumed that five brownfield sites per BOA study area will be strategic sites that may be eligible for direct local, state or federal funds, and assuming that each of the five brownfields in each study area is close to the national average of 5 acres, 25 acres could be developed per BOA study area. With that assumption, and the statistic developed by
Howland (2007), that on a national basis, 10 to 11 jobs are created per developed acre, up to 275 jobs are projected for each BOA Study area. (Howland, Marie, 2007. Employment Effects of Brownfields Redevelopment, What Do We Know from the Literature? Journal of Planning Literature, 2007, vol. 22, p. 91 available at http://jpl.sagepub.com/cgi/reprint/22/2/91)5Again, it may conservatively be assumed that five brownfield sites per BOA study area will become strategic sites that may be eligible for direct local, state or federal funds. With that assumption, and the Northeast-Midwest Institute (NEMW) statistic that, on average, each brownfield site has the potential to create 91 jobs, the five sites within each BOA Study area have the potential to create 455 jobs. (NEMW, 2008. The Environmental and Economic Impacts of Brownfields Redevelopment available at: http://www.nemw.org/index.php/policy-areas/brownfields/enviornmental-and-economic-impacts-ofbrownfields-redevelopment). 6See footnote 4 above that each BOA Study Area has the potential to create 275 jobs. As of May 2011, there are 110 BOA Study areas in NYS, and at 275 jobs per study area, this translates to 30,250 jobs (Howland, Marie, 2007. Employment Effects of Brownfields Redevelopment, What Do We Know from the Literature? Journal of Planning Literature, 2007, vol. 22, p. 91 available at http://jpl.sagepub.com/cgi/reprint/22/2/91)7See footnote 5 above that each BOA Study area has the potential to create 455 jobs. As of May 2011, there are 110 BOA study areas in NYS, which translates to the creation of 50,050 new jobs. (NEMW, 2008. The Environmental and Economic Impacts of Brownfields Redevelopment available at: http://www.nemw.org/index.php/policy-areas/brownfields/enviornmental-and-economic-impacts-ofbrownfields-redevelopment).
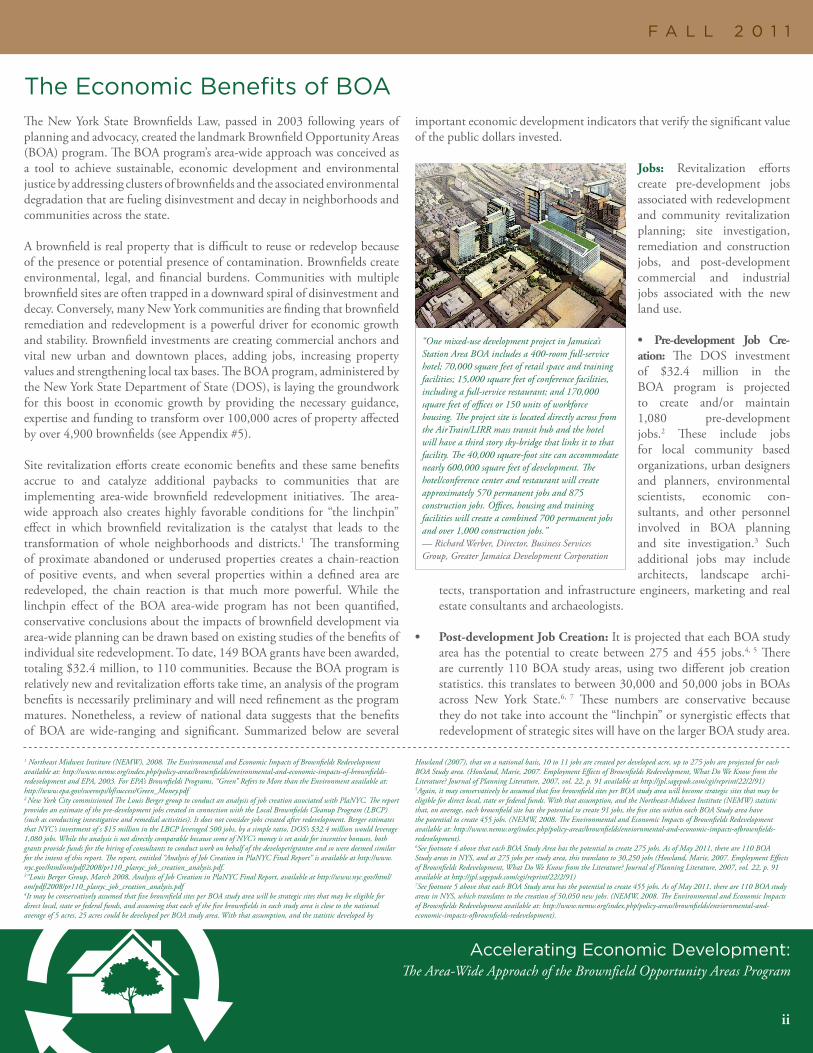
“One mixed-use development project in Jamaica’s Station Area BOA includes a 400-room full-service hotel; 70,000 square feet of retail space and training facilities; 15,000 square feet of conference facilities, including a full-service restaurant; and 170,000 square feet of offices or 150 units of workforce housing. The project site is located directly across from the AirTrain/LIRR mass transit hub and the hotel will have a third story sky-bridge that links it to that facility. The 40,000 square-foot site can accommodate nearly 600,000 square feet of development. The hotel/conference center and restaurant will create approximately 570 permanent jobs and 875 construction jobs. Offices, housing and training facilities will create a combined 700 permanent jobs and over 1,000 construction jobs.” — Richard Werber, Director, Business Services Group, Greater Jamaica Development Corporation
ii

Accelerating Economic Development:The Area-Wide Approach of the Brownfield Opportunity Areas Program
F A L L 2 0 1 1
The Economic Benefits of BOA (continued)
8Howland’s research shows that economic benefits estimated using a dynamic simulation model predict that on a national basis, 10 to 11 jobs are created per developed acre with an annual tax flow of $5,470 per job. In this case, assuming that each of the five brownfields in each BOA study area is close to the national average of 5 acres, 25 acres would be developed per BOA study area creating 275 jobs and an annual tax flow of $1.5 million per BOA study area for a total of $165 million from 110 BOA study areas. (Howland, Marie, 2007. Employment Effects of Brownfields Redevelopment, What Do We Know from the Literature? Journal of Planning Literature, 2007, vol. 22, p. 91 available at http://jpl.sagepub.com/cgi/reprint/22/2/91) 9Based on a review of brownfield projects in the 2007 USCM survey, NEMW estimated an average local tax generation of $626,000 per site (NEMW, 2008. The Environmental and Economic Impacts of Brownfields Redevelopment available at: http://www.nemw.org/index.php/policy-areas/brownfields/environmental-and-economicimpacts-of-brownfields-redevelopment) 10NEMW, 2008. The Environmental and Economic Impacts of Brownfields Redevelopment available at: http://www.nemw.org/index.php/policy-areas/brownfields/environmental-and-economic-impacts-of-brownfieldsredevelopment. 11NEMW estimates that every $1 of public brownfields funds leverages between $8 and $20 of total investments. Therefore, if each BOA study area were, conservatively, to receive $100,000 in public funds for each of five sites, the total investment of $500,000 in public funds could leverage between $4,000,000 and $10,000,000 for each study area. Using the low end of this
Generation of Wage-Related Tax Revenue: As employment increases, additional tax revenue will be generated. The creation of jobs is anticipated to produce an annual wage-related tax flow of up to $165 million.8
GenerationofLocalTaxRevenue: As property values increase, both on the redeveloped properties and on adjacent properties, so will local tax revenues. With the conservative assumption that local tax revenues only increase on the five strategic sites in a BOA study area, local tax revenues within a typical BOA study area are estimated to increase by about $3 million annually.9
Property Value Increases: Studies show that brownfield redevelopment leads to a 5 percent to 15 percent increase in property values within one-quarter mile of the site.10 An increase in BOA study area property values is an important economic benefit that increases homeownership values and also increases tax revenues. However, it is also important to note that redevelopment can have the unintended consequence of raising rents and causing displacement, which is a critical issue in low — and moderate — income neighborhoods, and underscores the need for authentic community engagement in the area-wide approach.
Public Investment Leverages New Investment: The BOA program is laying the groundwork for leveraging between $4 million and $10 million in private and public investment in each study area.11 With 110 BOA study areas, this could conservatively lead to an estimated $440 million in investments across the state.
Savings in Transportation Related Externalities: It is projected that each BOA study area will save about $675,000 in transportation-related indirect costs or up to $74 million in savings across New York’s 110 BOA communities.12 Redevelopment on denser urban brownfields where public transit options are available means less vehicle usage and fewer vehicle miles traveled relative to new development on greenfields. Therefore the indirect costs — externalities — related to transportation, such as parking, accidents, and pollution related health costs, are lower on brownfields redevelopment projects than on greenfields development.
Savings in Infrastructure Investment: Brownfields typically have some infrastructure, such as sewers and water lines, in place, whereas greenfields have none. As a result, redevelopment of brownfields yields substantial savings in infrastructure investment. Recent efforts to quantify the difference suggest that the ability to reuse infrastructure on brownfield sites may save 10 to 35 percent on the infrastructure costs associated with development.13
PreservationofOpenSpace/Greenfields: The BOA program is preserving valuable open space by preventing new development on an estimated 12,375 acres of greenfields.14 Preservation of greenfields provides a host of benefits including improvements to air quality and maintenance of open space, both of which contribute to a community’s overall health and quality of life.
EnvironmentalandSocialBenefits: It is also important to recognize the social and environmental benefits of the brownfields area-wide approach and how these benefits can indirectly translate into economic benefits. For example, building a park on the waterfront provides waterfront access and additional green/open space, which can improve a community’s health and quality of life and reduce medical expenses. These benefits are difficult to quantify, but they are an important factor that should not be overlooked in assessing the total value of area-wide redevelopment activities and determining the value of public investment.
EnvironmentalBenefits• Contamination removed/site remediated • Protection of adjacent natural resources • Green/more sustainable redevelopment • Incorporation of new parks and other amenities • Improve/protect public health • Improvement to air quality • Improvements in storm water management/quality
SocialBenefits• Improvement to neighboring properties and businesses • Improve/increase waterfront access • Overall quality of life improvement • Preserve and increase green space • Additional/improved public space and facilities • Downtown improvement • New market rate housing • Affordable and special use housing • Reuse of existing infrastructure • Blight mitigation • Sprawl reduction
range, $440 million in total investments would be leveraged across 110 BOA study areas. (NEMW, 2008. The Environmental and Economic Impacts of Brownfields Redevelopment available at: http://www.nemw.org/index.php/policy-areas/brownfields/environmental-and-economic-impacts-of-brownfieldsredevelopment). 12According to NEMW, research by De Sousa in Toronto, Canada, determined that the external costs associated with transportation (i.e., parking, accident, air pollution and health costs) were about $27,000/acre lower for brownfields redevelopment in the city than for greenfields development. Assuming there are five five-acre strategic sites within each BOA study area, or a total of 25 acres, that equates to $675,000 in savings per study area and $74 million in savings across 110 study areas. (NEMW, 2008. The Environmental and Economic Impacts of Brownfields Redevelopment available at: http://www.nemw.org/index.php/policy-areas/brownfields/environmental-and-economicimpacts-of-brownfields-redevelopment) 13NEMW, 2008. The Environmental and Economic Impacts of Brownfields Redevelopment available at: http://www.nemw.org/index.php/policy-areas/brownfields/environmental-and-economic-impacts-of-brownfieldsredevelopment) 14According to NEMW, 4.5 acres of greenfields are preserved for every acre of brownfields redeveloped. If 5 five-acre sites in each of 110 BOA Study Areas in NYS are redeveloped, then the BOA Program has or will preserve 112.5 acres of greenfields per BOA study area or 12,375 acres statewide.
iii

Accelerating Economic Development:The Area-Wide Approach of the Brownfield Opportunity Areas Program
F A L L 2 0 1 1
RECOMMENDATIONS TO ACCELERATE ECONOMIC DEVELOPMENTThis past June, representatives from over 50 BOA communities participated in NPCR’s fifth Albany Brownfields Summit, which focused on accelerating economic development in BOAs. What emerged from this two-day event was the identification of specific recommendations that will spur the implementation of each community’s revitalization plans:
BROWNFIELDOPPORTUNITYAREAS(BOA)PROGRAM
1.SupportandimplementBOArevitalizationstrategies.Project consistency with BOA plans should be an important factor as the state’s Regional Economic Development Councils (REDCs) establish project selection criteria for their funding recommendations. Central to the BOA area-wide approach is authentic community engagement, which has evolved to mean the ongoing, meaningful participation by neighborhood residents in decision-making. The REDCs should establish project selection criteria that give considerable weight to whether a project/action is consistent with the community’s BOA strategy.
2.AdvancetheawardofBOAfunds. The timely awarding of BOA funds is crucial to maintain the momentum built by local leaders working to revitalize their neighborhoods. Unlike the last two rounds of BOA awards, which were funded by unrestricted dollars, the next round of BOA awards will require a Legislative Memorandum of Understanding (MOU) signed by the Governor, Senate Majority Leader, and Assembly Speaker. Unfortunately, the last time a legislative MOU was required to advance BOA funding awards, in 2008, it took 3 years. There are now 38 communities, including six in NYC, eager to advance their economic development strategies, that have been waiting 8 months for these previously appropriated, but unawarded funds. These projects are shovel-ready job creators. It is important that our Albany leaders execute the legislative MOU amendment required for these BOA projects forthwith.
3.AppropriateBOAfundsinthe2012-13statebudgetthatarenotrestrictedbyaLegislativeMOUandregularizeBOAfundingawards. Early this year, the NYS Division of the Budget (DOB) advised that the reason there were no new appropriations for the BOA program in the Governor’s proposed 2011-2012 budget — funds that would have been unrestricted by a legislative MOU — was because there were sufficient funds remaining from old appropriations. Given the delay in securing legislative MOUs and the fact that there are 38 projects waiting for Albany to act, it is critical that new non-MOU-restricted funds be appropriated.
4. Implement inter-agency cooperation and cross-government collaboration. The myriad government agencies that have a hand in community revitalization are necessarily organized according to sectors, such as housing, transportation, environment, economic development, parks, and planning. As a result, very few projects can occur without involving multiple agencies. The challenge presents itself both in terms of securing inter-agency coordination across sectors; and also on city, state and federal cross-government collaboration. The recently created REDC Consolidated Funding Application (CFA) is a good first step, but it does not go far enough to get agencies out of their silos. Experience with the BOA Spotlight Communities Initiative reveals that in-person meetings between multiple senior agency representatives and the community are a cornerstone of collaboration. Agency representatives that are able to converse about up-to-date opportunities and resources available via different programs, as well as provide tips on agency discretionary practices that are not readily discernable from a web site or guidebook, can be invaluable. This sharing of information and advice is integral to problem solving as agencies look at projects from different angles. In addition, having the agencies in one room together, listening to each other and the community’s priorities, often results in synergistic areas of collaboration.
5.EmpowertheDepartmentofStatetocoordinatestateagencyactivitiestoadvanceBOAimplementation. There is the opportunity to increase efficiency and break down silos by statutorily empowering the DOS to coordinate the myriad state agencies needed to advance multi-disciplinary economic development projects. DOS, together with ESDC, is already playing an important coordinating role on the REDCs. This role can be enhanced by:
1

Accelerating Economic Development:The Area-Wide Approach of the Brownfield Opportunity Areas Program
F A L L 2 0 1 1
RECOMMENDATIONS TO ACCELERATE ECONOMIC DEVELOPMENT (continued)
• Requiring the DOS to notify and request information from state agencies that is pertinent to BOAs to assist communities in the information gathering process; and
• Requiring the DOS to produce an annual brownfield ‘preference and priority’ report as a way of strengthening the DOS’s ability to engage other state agencies around the prioritization of public resources for BOA implementation.
BROWNFIELDREGULATORYANDLIABILITYISSUES
6. Provide statutory liability protection for volunteers that conduct cleanups under the NewYork City Local Brownfield CleanupProgram(LBCP). In August 2010, the state Department of Environmental Conservation signed a Memorandum of Agreement (MOA) with the city that empowers the Office of Environmental Remediation to review and sign-off on lightly to moderately contaminated sites. The MOA liability protection is not as effective (or valuable to developers) as a statutorily based liability release would be. The USEPA has just officially acknowledged the LCBP. It is time for the state to fully delegate this regulatory responsibility to the city. It is also worth noting that this would save the state money.
7.Evaluateandapplyanalternativeregulatoryframeworktositesthatarerelativelylesscomplicated. Under the 2003 state Brownfields Law, New York has generally applied a one-size-fits-all approach to cleanups in the Brownfield Cleanup Program (BCP). However, alternatives should be available for smaller, historic fill or lightly to moderately contaminated sites that can be remediated via relatively straightforward or presumptive/proven technologies. The length of time it takes to get sites through the BCP has been a major concern particularly as state resources have declined and Department of Environmental Conservation (DEC) staff has been reduced. One option suggested is the administrative Voluntary Cleanup Program (VCP). Another option worth evaluating is a Licensed Site Professional program, similar to ones in Massachusetts, Connecticut and, most recently, New Jersey.
BROWNFIELDFINANCIALINCENTIVES
8.ReplacestateBrownfieldTaxCredits(BTCs)withbrownfieldsubsidiestargetedtoprojectsthatmeetregionaleconomicdevelopmentgoalsand link these subsidies to implementationofBOAeconomicdevelopmentstrategies.Robust financial incentives are needed to encourage the cleanup and re-use of brownfield sites and to make these sites at least as attractive as greenfields. The BTCs, which were capped in 2008 and deferred in 2010, have proven to be ineffective to spur redevelopment in communities hardest hit by decay and disinvestment. The incentives, as currently structured, also have the potential to encourage development that is incompatible with community and economic development strategies. Moreover, because the BTCs sunset in the year 2015, few new projects will be able to secure the requisite regulatory sign-off in time, rendering the BTC program as essentially terminated for new projects. This effectively leaves the state with no financial incentive program for brownfields redevelopment, (but a hefty bill to pay as the deferred BTC pay-outs begin to come due in 2013). Financial incentives should encourage developers to build projects that are consistent with area-wide community and economic development plans. Among other advantages, linking new financial incentives to BOA plan consistency will enhance the effectiveness of the state’s resources to achieve local economic development goals. The ability to achieve these local economic development goals will be further strengthened if a portion of the new incentives are set aside for projects in BOAs; and if eligibility is reserved only for those projects that are not inconsistent with a BOA plan.
There is an existing 2% BTC bonus for projects built consistent with a BOA plan. Created in the 2008 amendments to the Brownfields Law, the BOA Bonus provides a tax credit bump up for projects that are consistent with a local BOA plan. Not only should this be carried over from the old program into the new, but it should be strengthened. Linking brownfields financial incentives to BOA plan implementation will help leverage private investment and stimulate local economic development while simultaneously re-directing development pressure away from greenfields.
2
Accelerating Economic Development:The Area-Wide Approach of the Brownfield Opportunity Areas Program
F A L L 2 0 1 1
RECOMMENDATIONS TO ACCELERATE ECONOMIC DEVELOPMENT (continued)
9.Thestateshouldcreateasiteassessmentandremediationfundingprogramandmakethosefundsavailableonaprioritybasistoprojects thatareconsistentwithaBOA. There is universal agreement that funds for assessment and cleanup are crucial for redeveloping brownfield sites in urban, suburban and rural communities. These dollars are particularly critical in weak market areas and in low- and moderate-income neighborhoods where public resources are often required to leverage private investment even where the site is not complicated by brownfield conditions. Site assessment is an important part of brownfields redevelopment because it generates the data needed to evaluate the risks posed by the site: the cleanup-costs, third party liability, impacts on construction schedule and cost, and long term stewardship requirements. Funding for remediation is needed to eliminate public health risks and close the financing gap between greenfields and brownfields. Brownfield redevelopment projects take several years to materialize even in strong real estate markets. Providing government resources to conduct high quality site assessments and cleanups now will help to build a pipeline of developable properties and ensure that sites are ready for development or expansion when the market strengthens.
The 1996 Environmental Bond Act created the Environmental Restoration Program (ERP), funded at $200 million. ERP has supported 131 site assessments, 44 remedial designs, 25 completed remedial actions and 34 interim remedial measures across the state. Unfortunately, it is now fully committed. New funds should be administered in a manner similar to the successful ERP so that localities, and municipalities acting in partnership with CBOs, are eligible for site assessment and remediation funds and reimbursed for 90% of the eligible costs. Upon completion of assessment and remediation, the state should provide very strong liability protection for any past contamination at the site, in the form of an indemnification. And, similar to ERP, these funds should be made available on a preferential basis for projects that are consistent with a BOA plan.
DEMOLITION
10.Provideflexiblefundsfordemolitionandmakethosefundsavailable,onaprioritybasis,forprojectsthatareconsistentwithaBOAplan. Before a brownfield site can be cleaned up and re-used, there is often the need to undertake fairly extensive and expensive demolition. To address the vacant, abandoned, condemned and/or surplus properties that blight so many neighborhoods, funds that are specifically targeted for this purpose are needed. Abandoned and dilapidated structures pose significant obstacles to redevelopment both from a visual/aesthetic perspective and a time and cost perspective. It is difficult to attract developers to properties that require significant time and upfront expenditures to remove or rehabilitate old structures. In addition, the blighted structure adds yet an additional level of uncertainty, on top of the brownfield conditions. Eliminating or rehabilitating blighted structures catalyzes redevelopment because it mitigates uncertainty as well as financial and visual obstacles to re-use.
In recognition of the catalyzing effect of removing blighted structures from properties, the state created the Restore NY program with a $300 million appropriation in the 2006-2007 budget. It was rolled out in three rounds — $50 million appropriated in 2006 with 54 grants awarded; $100 million appropriated in 2008 with 64 grants awarded; and $150 million appropriated in 2009 with 79 grants awarded — and has been one of the most successful programs in the state’s toolbox for abandoned and dilapidated neighborhood eyesores. Unfortunately, Restore NY has exhausted all appropriated funding. Using a similar framework, new funds should be made available on a priority basis to projects that are consistent with a BOA.
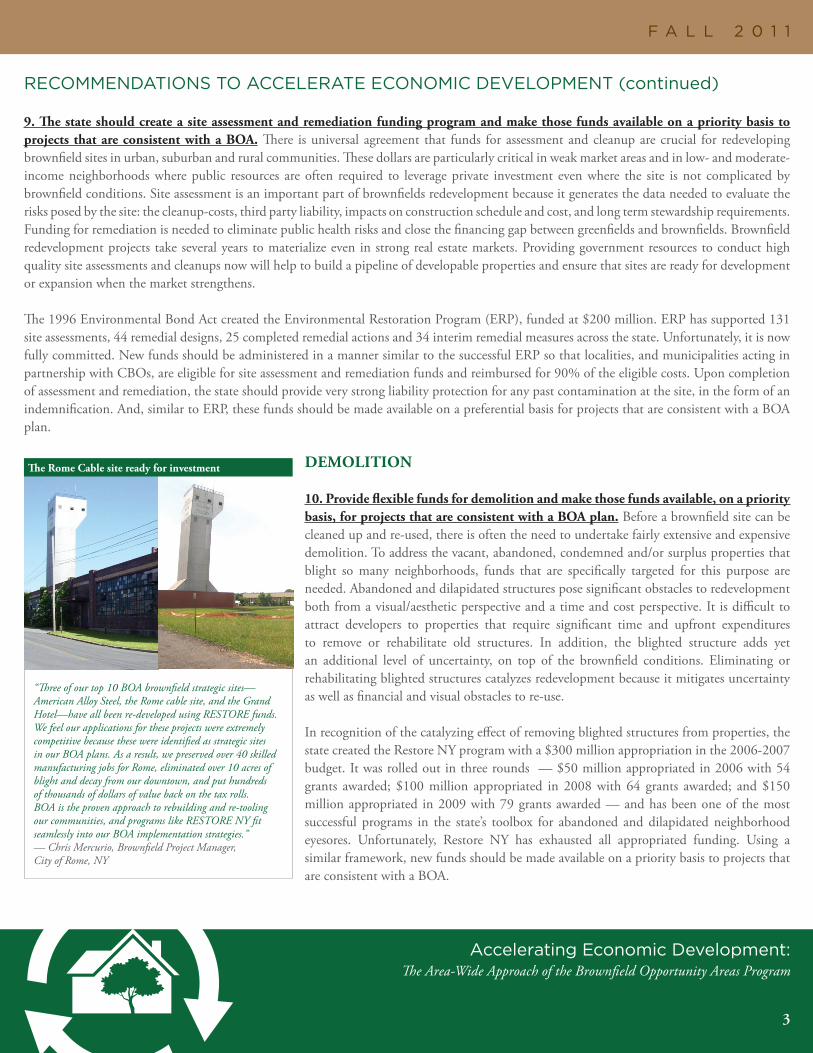
“Three of our top 10 BOA brownfield strategic sites—American Alloy Steel, the Rome cable site, and the Grand Hotel—have all been re-developed using RESTORE funds. We feel our applications for these projects were extremely competitive because these were identified as strategic sites in our BOA plans. As a result, we preserved over 40 skilled manufacturing jobs for Rome, eliminated over 10 acres of blight and decay from our downtown, and put hundreds of thousands of dollars of value back on the tax rolls. BOA is the proven approach to rebuilding and re-tooling our communities, and programs like RESTORE NY fit seamlessly into our BOA implementation strategies.”— Chris Mercurio, Brownfield Project Manager, City of Rome, NY
TheRomeCablesitereadyforinvestment
3

Accelerating Economic Development:The Area-Wide Approach of the Brownfield Opportunity Areas Program
F A L L 2 0 1 1
RECOMMENDATIONS TO ACCELERATE ECONOMIC DEVELOPMENT (continued)
WORKINGWATERFRONTNew York’s working waterfront not only includes major ports that are gateways to global trade, but also, at a smaller scale, facilitates the movement of goods and waste to and from local waterfront industrial areas. But the waterfront’s long industrial history has left a legacy of multiple brownfield properties, often accompanied by dilapidated piers and crumbling bulkheads, which now obstruct new business development and expansion and impede the movement of goods and trade.
11.Committopublicinfrastructureupgrades. Many maritime industrial areas in New York lack the basic infrastructure necessary to support modern productive businesses. Creating 21st Century industrial dist-ricts will require a concerted public effort to invest in new infrastructure that can catalyze business development and make better use of New York’s working waterfront. Improvements should include repair or replacement of dil-apidated piers, bulkhead imp-rovements, and dredging to accommodate barges. This is in addition to other infrastructure needs common to New York’s aged industrial districts (see Infrastructure section below).
12. Streamline the maritime permitting process. Rebuilding bulkheads is an important step toward activating industrial maritime uses, but the process for obtaining a permit is exceptionally complex and lacks clear guidelines. NYSDEC and the US Army Corps of Engineers should streamline the process to ensure that the application process is transparent and decisions are made in a timely and efficient manner. As an example, the work of the city’s Maritime Infrastructure Working Group, which includes representatives of multiple city and state agencies and local nonprofits, represents an important effort toward rationalizing this process.
13.Provideflexiblefundsfordemolition/removalofsubmergedstructuresinwaterwaysonaprioritybasisforprojectsthatareconsistentwithaBOA.Revitalizing the waterfront is the cornerstone of many BOA plans. Removing sunken boats and other submerged structures to create access for recreational and commercial boating and to promote use of the waterfront by improving the aesthetic experience is needed, but funding for such purposes is difficult to secure since Army Corps money is highly competitive. The funding could be administered by the state using the Restore NY model with a focus on demolition and removal of blighted structures from waterways.
REVENUE-NEUTRALTOOLSIn this climate of prolonged economic recovery and fiscal retrenchment, new off-budget, revenue-neutral tools which have little or no impact on already strained government budgets are especially attractive to help jump-start economic revitalization.
14. Lift the cap on the creation of Land Banksin New York. NYS recently passed Land Bank legislation and regulations are expected in late 2011. The purpose of a land bank is to efficiently acquire, hold, manage and develop tax-foreclosed properties with the long-term interest of the community in
“One of the central goals of our BOA is to position Newtown Creek as a 21st century maritime industrial district. We used BOA funds to conduct a survey of every business in the Newtown Creek study area to understand how existing local businesses thought we could achieve this goal. Through this process we identified 5 to 7 businesses that would expand their current operations to incorporate maritime transport of materials, provided they could negotiate the regulatory and financial hurdles to fixing their bulkheads. The prospective upsides to these repairs include improved infrastructure, cleaner sites, new jobs, and fewer trucks on the road. Without a greater public sector commitment to improving industrial and maritime infrastructure, however, it is hard to envision how new or existing businesses will be able to afford future investment in sustainable practices and blue-collar jobs.”— Paul Parkhill, Director of Planning and Development, Greenpoint Manufacturing and Design Center, Brooklyn
“The recently passed Land Bank law is important for Syracuse and Onondaga County. It will allow us to convert abandoned, blighted properties into community assets. With a land bank in place for Syracuse and Onondaga County, we will generate millions more in delinquent tax revenues and will be able to create community control over our most vulnerable properties.” — Dominic Robinson, Deputy-Director, CenterState CEO, Syracuse
4

Accelerating Economic Development:The Area-Wide Approach of the Brownfield Opportunity Areas Program
F A L L 2 0 1 1
RECOMMENDATIONS TO ACCELERATE ECONOMIC DEVELOPMENT (continued)
mind. The legislation auth-orizes municipalities to assign tax claims to a land bank, operated and governed locally, as an alternative to selling tax liens. This framework frees up strategic brownfield sites and provides for local involvement in the disposition and re-use of these sites. The Land Bank legislation caps the number of land banks that can be created statewide at the seemingly arbitrary number of ten. This cap should be lifted.
15.AmendtheNYSTaxIncrementFinancing(TIF)law. A municipality may designate an area characterized by blight and disinvestment as a TIF district and prepare a plan for its redevelopment. The taxable value of property in the TIF district is frozen at the point of designation, thus establishing the baseline. TIF bonds are then issued to finance the improvements identified in the TIF district redevelopment plan. The incremental value of the increase in taxes over the baseline is used to pay off the TIF bonds. Once the TIF bonds have been paid off, the incremental portion of the TIF district’s taxes reverts to basic revenue. New York’s TIF law should be amended:
• To broaden the revenue basis of TIF bonds to create a backstop for property tax revenues. This will build investor confidence and allow municipalities to float TIF bonds at lower interest rates;
• To include remediation and redevelopment of brownfield sites as eligible uses of TIF funds; and• To restrict the use of TIF funds to downtown and urban areas to avoid contributing to sprawl development and reduce pressure on New
York’s open space and greenfields.
16.ProvidemunicipalitieswiththeoptionofconductingcleanupsunderthestateEnvironmentalRestorationProgram(ERP)regulations,evenwithoutfunding,toallowthemtosecurethesameliabilityrelease/indemnification. Environmental statutes and regulations impose liabilities on municipal property owners and operators and future owners for remediation of contaminated sites. Since remediation can be very expensive, both current and future property owners are anxious to be released from these liabilities after assessment and remediation activities are complete. The liability protection provided to municipalities that assess or remediate sites under the ERP is extraordinarily strong, and therefore particularly valuable. In fact it is so valuable that several municipalities have expressed a desire to conduct assessments/cleanups under the ERP framework even if no funds are provided. A municipality that cleans up a site under the ERP, and all its successors in title, lessees and lenders, is entitled to a release from remedial liability for hazardous substances present on the property prior to the cleanup. The state also indemnifies these same persons in the amount of any settlements/judgments obtained regarding an action relating to hazardous substances that were on the property prior to the cleanup and persons subject to an action are entitled to representation by the State Attorney General.15 Given the unfunded status of ERP, it is not clear whether DEC can proceed to oversee cleanups under the ERP through administrative action, or whether such action requires statutory authority.
INFRASTRUCTURE
17.Dedicatefundstoadvancecatalyticinfra-structureprojects. Central to the revitalization plans emerging from BOAs across the state is the need for relatively small, targeted public investments in a variety of infrastructure im-provements such as new green and grey sewer and stormwater infrastructure, electrical service upgrades, access to T1 lines, roadway reconstruction, and street and bridge repair. Significant delays associated with securing such infrastructure funds — which can be upwards of 6 to 8 years — bog down the community’s implementation strategies.
Another obstacle is the lack of a single-point public investment program able to coordinate multiple small scale needs. New York’s public investment is not place-based but system based: consider the transportation system, the sewer system, the electrical power system, etc. Moreover,
“We are seriously considering the use of TIF to implement BOA plans here in Rochester, and we are completing our nomination studies with the potential for TIF in mind. Given the fiscal pressures on the City, TIF is looking like an important capital financing option for the City. The South Genesee River Corridor BOA will require significant cleanup and infrastructure so there is potentially a big benefit to a TIF in the BOA. With a TIF in place, we think we can leverage tens of millions in private investment and create jobs and businesses in the neighborhoods that need them the most. However, for TIF to be effective we need improvements to New York’s TIF law.” — Mark Gregor, Manager, Division of Environmental Quality, City of Rochester
15http://www.dec.ny.gov/chemical/8444.html
5

Accelerating Economic Development:The Area-Wide Approach of the Brownfield Opportunity Areas Program
F A L L 2 0 1 1
RECOMMENDATIONS TO ACCELERATE ECONOMIC DEVELOPMENT (continued)
communities are routinely forced to the back of what is typically a very long line of big public investment programs, competing for resources with established constituencies. As a result, local economic development plans must be either delayed or scaled back, unless another source of funds can be found.
There are some innovative grant programs, such as the Environmental Facilities Corporation’s Green Innovation Grant Program (GIGP), but these funds are not available on a regular annual schedule, which
makes planning difficult. What is needed to implement local economic development plans is a reliable place-based, dedicated stream of public investment funds to support the construction of infrastructure. Decision-making on priority expenditures should be made locally so that the timing can be coordinated with larger revitalization plans. This is the concept behind tax increment financing which has generated flexible resources for infrastructure improvements in communities across the country. Or, it could be achieved through other bond proceeds. The Governors’ new Regional Economic Development Councils have some discretionary funding available, all or a portion of which might be used in this way.
18. Instituteplace-based,BOA-to-BOAcooperation incorridors toprioritize infrastructure investments. Building on lessons learned from the NYC BOA Community Resilience Initiative at the East River Industrial Corridor Pilot (which is anchored by the Newtown Creek and Sunset Park BOAs), apply a cooperative approach that encourages collaboration across communities within a corridor. This would involve the programmatic engagement of city, state and federal agencies in a corridor-wide planning and implementation process. As similar problems emerge in proximate communities that are conducting individual area-wide community plans, research and analysis can be shared across the corridor and more efficient and coordinated implementation strategies, particularly with respect to common infrastructure, can be developed.
19.StrengthenBOAasanurbansmartgrowthstrategybydisallowingpublicfundingforinfrastructureprojectsthatareinconsistentwithaBOAplan.The recently enacted Smart Growth Public Infrastructure Policy Act creates a negative screen so that state infrastructure investments may only be made if they are in accordance with “smart growth criteria.” Since BOA is one of the criteria, this new law recognizes BOA as a smart growth strategy. Unfortunately, there is nothing in the Law that would prevent infrastructure funds from being awarded to projects that are inconsistent with a BOA plan.
PREFERENCEANDPRIORITY
20.Implementandstrengthenthepreferenceandpriorityprovisiontoadvancearea-widecommunitystrategies. The 2003 Brownfields Law provides broad authority for projects in BOAs to receive preference and priority when considered for financial and other assistance but little in the way of specific benefits. Through the BOA program, extraordinary partnerships have been created. This has raised the expectations of thousands of people who have been participating in BOA steering committees, planning and visioning efforts. To support place-based economic development objectives that are reflected in these collaborative community revitalization strategies, it is important that government resources be prioritized for projects that are built consistent with the local community-supported plan.
“The biggest issue with revitalizing large brownfield areas — bigger even than the remediation costs — is infrastructure. It is hard to do long term planning when the public investment mechanisms are unreliable and unpredictable. In Buffalo we created the Brownfield Redevelopment Fund (BRF) to help with this on the Lakeside Commerce Park in the South Buffalo BOA. The BRF uses money from payment-in-lieu-of-taxes (PILOTS) agreements with the park’s tenants to pay for installing roads and other infrastructure in the industrial park. We are just completing the fourth and final phase of road and infrastructure improvements. This public investment has leveraged substantial private sector activity — CertainTeed Corp., Cobey, Inc. and Sonwil Distribution have made multi-million dollar investments in the park, employing approximately 400 workers.” — David Stebbins, Vice-President, Buffalo Urban Development Corporation
6

Accelerating Economic Development:The Area-Wide Approach of the Brownfield Opportunity Areas Program
F A L L 2 0 1 1
RECOMMENDATIONS TO ACCELERATE ECONOMIC DEVELOPMENT (continued)
TRANSPORTATIONRESOURCES
21.Createandstrengtheninstitutional linksbetweenMetropolitanPlanningOrganizations(MPOs)andBOAs. As more of the 110 communities participating in the BOA program advance toward implementation, a wide range of DOT-eligible projects is emerging as central to their economic development initiatives. This includes pedestrian walkways, bikeways, commuter train station improvements, expansion of mass transit, highway re-configuration, etc. Unfortunately, there is no formal coordination between BOA planning and MPOs, which are charged with developing regional plans to invest federal transportation dollars. Each of New York’s 13 MPOs prepares a short term Transportation Improvement Program (TIP) for its region consisting of projects to be implemented using available federal funds. The state DOT prepares the Statewide Transportation Improvement Program (STIP), which begins essentially as a compilation of regional TIPs submitted by the MPOs. The STIP can be amended, as happened when new federal funds became available under the American Recovery and Reinvestment Act (ARRA). Transportation funding is emerging as an important resource for BOA plan implementation, and increasingly there is the need and opportunity for earlier and better coordination. Planning by MPOs and BOAs should be more coordinated via regularized institutional and programmatic connections.
22.PrioritizeFixitFirstprojects.In the context of improved coordination with local BOA initiatives, MPOs should also give preference to fix it first projects, rather than funding new construction. And, the needs of all users should be emphasized, not just those who drive cars.
23.InstitutionallyalignthestateDOTwiththeBOAprogram.Transportation re-sources could play an enormous role in jump-starting community revitalization initiatives. But there are challenges that arise from government requirements in connection with securing and utilizing transportation funds in a timely way. Moreover, there is an alphabet soup of agencies that govern transportation at the federal, state and local levels. As a first step, the goal should be to improve communications and create a more synchronized working relationship between state transportation officials and state officials administering the BOA program. The Department of State should take the lead by inviting state DOT officials to help identify ways to programmatically integrate BOA planning and implementation with transportation planning; and early and regularized communication should be institutionalized between local community and municipal leaders participating in the BOA program and state DOT representatives. One area ripe for innovative cooperation is in connection with the Complete Streets Law that passed this legislative session. DOT and DOS should work together to encourage communities to adopt their own complete streets policies.
UNITEDSTATESDEPARTMENTOFAGRICULTURE(USDA)
24.ProvidepreferenceandpriorityforUSDAFundstoprojectsconsistentwithaBOAPlan. The USDA administers several valuable economic development grant/loan programs for rural communities (depending on the program, defined as between 10,000 and 100,000 people). Municipalities are using these grants and loans to construct affordable housing, commercial/business enterprises, renewable energy and water and wastewater infrastructure
and such funds could provide significant resources to advance community based plans in BOA study areas. The criteria used to award these grants and loans should be modified to provide preference to BOA grantees implementing BOA plans.
Providing such preference should be relatively simple. According to the presentation by USDA officials at NPCR’s summit, the USDA director has 50 discretionary points. A portion of those points could be redirected to BOA grantees submitting applications for funds that are consistent
“The success of Wyandanch’s BOA revitalization strategy is the integration of planning and implementation for transportation, infrastructure improvements, and sustainability measures. This investment leveraged will result in an estimated 3000 construction jobs and approximately 800 permanent jobs. Governor Andrew Cuomo’s Regional Economic Development Councils and the Consolidated Funding Application (CFA) process present a unique opportunity for a streamlined and efficient coordination of transportation planning with local revitalization strategies. The opportunity for regional targeted funding to spur economic development, and area-wide community revitalization is an exciting new model.” — Vanessa Pugh, Director, Community Development and Downtown Revitalization, Town of Babylon, Long Island
7
Accelerating Economic Development:The Area-Wide Approach of the Brownfield Opportunity Areas Program
F A L L 2 0 1 1
RECOMMENDATIONS TO ACCELERATE ECONOMIC DEVELOPMENT (continued)
with a BOA plan. Such an approach would be aligned with the USDA’s current process of awarding points to applicants who are working in conjunction with comprehensive plans.
ENVIRONMENTALINSURANCEEnvironmental insurance is a risk transfer mechanism that has been used successfully to protect owners and developers during the redevelopment of large, complex brownfield sites and could be particularly valuable on projects in weak market areas that have little room for unexpected cost increases. Unfortunately, policies are expensive, take time and resources to underwrite and some, like Cost Cap Coverage, are not as widely available as in the past. Government funds could play a role in enhancing the use of environmental insurance as an effective tool to advance deal flow.
25.SubsidizeCleanupCostCap(CCC)policypremiums. The policy premium is the simplest element of the policy to subsidize. Such subsidy could induce environmental insurance carriers to provide CCC policies for cleanups, by allowing them to charge a higher premium.
26.SubsidizeCleanupCostCap(CCC)policyunderwritingcosts. Underwriting cost cap policies requires detailed technical analysis and carriers are often reluctant to commit the time and resources to underwriting for cleanups, especially smaller ones. Subsidizing the engineering costs could induce more carriers to underwrite policies for cleanups.
27.SubsidizePollutionLiability(PL)PolicyPremiums. PL policies are frequently used in contaminated property transactions because they provide broader coverage, including protection against third party claims and legal defense costs as well as coverage for unknowns that arise after the remediation is complete. As a result, not only is this policy beneficial for the owner but it can make permanent lenders more comfortable with the deal. Subsidizing the premium would make PL policies more available and enable some developers to procure longer-term policies. Premium subsidies can also be used to reduce the deductible amount, thereby making the policy more comprehensive.
28.CreateandsubsidizeanadditionalbufferbetweentheSelfInsuredRetention(SIR)andtheinsurancepolicy. A subsidy could be used to create an additional buffer layer above the cost cap policy attachment point or SIR when limits become available. From the perspective of the insurance carrier, this effectively increases the amount of the SIR because, in the event of cost overruns, both the SIR and the buffer would be accessed before the carrier’s money. Such a buffer would reduce the carrier’s risk and thereby induce the carrier to reduce the premium and increase the flexibility of the policy terms. Additionally, this structure could be programmatically sustainable. While the subsidy dollars must be committed upfront, they will not necessarily be spent. Therefore, once the policy period is over, the money will be available for other projects.
8

Accelerating Economic Development:The Area-Wide Approach of the Brownfield Opportunity Areas Program
F A L L 2 0 1 1
About NPCRNew Partners for Community Revitalization, Inc. (NPCR) is a 501(c)3 nonprofit organization formed to advance the revitalization of New York’s communities with a particular focus on brownfield sites in and proximate to low — and moderate — income neighborhoods and communities of color.
The mission of New Partners for Community Revitalization is to advance the renewal of New York’s low- and moderate-income neighborhoods and communities of color through the redevelopment of brownfield sites. In collaboration with community, commercial, government and nonprofit partners, NPCR develops policies, programs and projects aimed at achieving the remediation and sustainable reuse of brownfield sites in New York.
The creation of NPCR as an independent nonprofit organization emerged out of a stakeholder process that began in 2001. Amid the multi-year policy debate that surrounded the passage of state brownfields legislation, it was recognized that low — and moderate — income (LMI) areas could be left behind without an organization devoted to developing programs and policies specific to LMI communities. NPCR Co-founder Jody Kass brought experience and contacts in affordable housing development; and Co-founder Mathy Stanislaus brought experience and contacts in environmental justice, environmental law and engineering. Together they became Co-Directors and invited a variety of people and organizations from different sectors to serve on the NPCR board of directors. On April 1, 2009, President Obama announced the nomination of NPCR Co-Director Mathy Stanislaus to Assistant Administrator for the Office of Solid Waste and Emergency Response at the US Environmental Protection Agency. Mathy was confirmed by the U.S. Senate in mid-May and began his position at the USEPA on June 8, 2009. In June 2009, Jody Kass was made Executive Director of NPCR.
NPCRProgramOverviewNPCR is carrying out a multi-pronged initiative which was developed through on-the-ground work with community leaders, nonprofit and for profit developers, environmental justice organizations, lenders, and nationwide research on innovative programs that is designed to provide the tools and capacity necessary to promote community-based productive re-use of brownfields. NPCR’s activities occur in two general areas: the provision of technical and financial assistance to brownfield redevelopment projects and to Brownfield Opportunity Area Program grantees; and efforts to create and improve city, state and federal programs and policies that comprise the infrastructure for the brownfield redevelopment arena. In addition, NPCR is widely recognized as being instrumental in the conceptualization and creation of New York’s area-wide Brownfields Opportunity Areas program. Since 2003, when the NYS Brownfields Law was passed, NPCR has worked to secure resources for communities, including $32.4 million awarded by NYS to 110 communities; and to strengthen government policies to
provide preference and priority for the implementation of area-wide plans. For more information about NPCR financing, technical assistance, training and policy work, please see our web site at www.npcr.net
RecentNPCRReports (available at www.npcr.net)• The Brownfield Opportunity Areas Program: Smart Investments Laying the
Groundwork for Economic Development, June 2011• Smart Growth Outlook 2011: Challenges and Opportunities in
Brownfields, Area-wide Planning & Implementation, January 2011• May 2010 Update: Excerpt from NPCR’s White Paper on Using Public
Dollars for Brownfield Site Assessment • Fixing the NYS Brownfield Tax Credits, March 2010• November 2009 Update to Addressing the Risk: Making Environmental
Insurance Available for Brownfield Sites in New York City, December 2009
• Using Public Dollars for Brownfield Site Assessment, June 2009• Analysis on the Use of Brownfield Tax Credits by Not-for-Profit
Organizations, February 2009 • Addressing the Risk: Making Environmental Insurance Available for
Brownfield Sites in New York City, November 2008 • Missing the Target: Making the Brownfields Tax Credit Work For
Communities, May 2007 • Brownfields Breakthrough: A Report on New York’s Revitalization Tool for
the Future, January 2007
NPCRProgramStaff
JodyKass,PresidentandExecutiveDirector – Jody co-founded NPCR after 12 years at the nonprofit NYC Housing Partnership and stints on Capitol Hill and in Mayor Koch’s housing office, bringing a wealth of public policy expertise and affordable housing development to NPCR. As Executive Director, Jody manages the overall organization and the day-to-day activities of NPCR, including fund raising, operations of the board of directors, and conceiving and implementing a broad range of program activities.
LauraTruettner,DeputyDirector – Laura is a geologist with over 20 years experience in the brownfields investigation and remediation arena. Laura has been an integral member of NPCR’s staff for many years and has had a strong hand in the development of NPCR’s programs and activities. Laura provides the technical expertise and support to link the issues extraordinary to contamination with the more traditional pre-development issues.
JohnFleming,PolicyDirector – John has worked in the field of community development, environmental justice and planning for over 15 years and has the lead responsibility for managing NPCR’s policy efforts in Albany, for
A P P E N D I X # 1
9
Accelerating Economic Development:The Area-Wide Approach of the Brownfield Opportunity Areas Program
F A L L 2 0 1 1
About NPCR (continued)
A P P E N D I X # 1
coordinating with BOA grantees on a statewide basis, community outreach and for building NPCR’s coalition.
Tawkiyah Jordan, BOA Technical Assistance Director/CommunityLiaison– Tawkiyah is an expert in on-the-ground BOA applications and contract management. She has been a planner for 10 years and was most recently, the Director of Community Development and Planning at a South Bronx nonprofit.
JeffJones,Media/PolicyAdvisor – Jeff has been an integral part of NPCR and NPCR’s successes since it was founded. Jeff is based in Albany and
significantly strengthens NPCR’s ability and capacity in connection with the media, environmental organizations and government officials.
Jessica Snyder, NPCR Senior Program Coordinator – Jessica manages program and logistical support for the full range of NPCR’s project and policy activities. This includes assisting with budget matters, the third party audit, special events, policy reports, payroll, web maintenance, office management and benefits.
10

Accelerating Economic Development:The Area-Wide Approach of the Brownfield Opportunity Areas Program
F A L L 2 0 1 1
Summary Report on NPCR’s Albany Brownfields Summit V
A P P E N D I X # 2
NPCR held its Fifth Annual Albany Brownfields Summit on June 6 - 7, 2011. Over 120 participants, including representatives of 50 BOA communities from around the state participated in the two-day event, which included a series of roundtable discussions and a networking dinner. The focus of this year’s Summit was tools and resources for implementation of the area–wide revitalization strategies that are emerging from the 110 communities participating in the BOA program. Roundtable discussions were held about Land Banking and Tax Increment Financing as new revenue neutral tools, USDA resources, transportation planning and resources, economic development and climate adaption. The Summit also included a discussion with Senator Mark Grisanti, the newly elected Chair of the Senate Committee on Environmental Conservation, where he heard directly from BOA representatives across the state about the importance of BOA in achieving neighborhood revitalization goals.
While this report was informed by the comments of and discussion among the attendees at the Summit, the conclusions and recommendations presented herein are solely those of NPCR.
SummitVPresenters/SpeakersGeorge Stafford, DOSKenneth Kamlet, Hinman, Howard & Kattell, LLPElaine Miller, DOSPeter Fleischer, Empire State FutureBen Walsh, City of SyracuseEugene Leff, NYSDECDale Desnoyers. NYSDECElizabeth Yeampierre, UPROSENY Senator Mark GrisantiDavid Shuffler, YMPJLinda McQuinn, Town of Canton Tom DeSantis, Niagara Falls Nadine Lemmon, Tri-State Transportation Campaign Eddie Bautista, NYCEJAFred Anders, DOSBrian T. Coleman, GMDCChris Mercurio, City of RomeRichard Werber, GJDCJill Harvey, USDADarlene DeVoe, Fort EdwardJ. Justin Woods, OgdensburgPeter Walsh, DOS
SummitVParticipantListGreg Albert, Genesee/Finger Lakes Reg. Planning CouncilNicole Allen, Laberge Group
Richard Allman, John E. Osborn P.C. Fred Anders, NYSDEC David Ashton, NYSDEC Darryl Banks, The Nature Conservancy Eddie Bautista, New York City Environmental Justice AllianceTania Beaubrun, St. Nicks Alliance Philip Bousquet, Green & Seifter, Attorneys, PLLCGary Bowitch, Law Office of Gary S. Bowitch Donna Boyce, Sustainable Long Island Teshanna Brunner, NYS Department of State John Buckholz, City of Ogdensburg David Button, Town of CantonSusan Caruvana, Saratoga Associates Shaminder Chawla, NYC MOER Philip Clappin, EPA Region 2 Brian Coleman, Greenpoint Manufacturing and Design CenterTom DeSantis, Niagara Falls Dale Desnoyers, NYSDECDarlene DeVoe, Village of Fort Edward Ronda Falkena, US Department of Agriculture Peter Fleischer, Empire State Future John Fleming, NPCR Andrew Foley, NYU Schack Center for the Sustainable Built EnvironmentDave Gahl, Environmental Advocates Liz Gordon, Gruskin Gordon Mark Grisanti, NYS Senate Stu Gruskin, Gruskin Gordon Shelli Hamilton, Great American Insurance Company Greg Hart, Workforce Development InstituteStephen Holley, AKRF Joseph Hyland, C.T. Male Associates, P.C. Lee Ilan, NYC MOERAlison Jenkins, Environmental Advocates Jeff Jones, NPCR Tawkiyah Jordan, NPCR Kenneth Kamlet, Hinman, Howard & Kattell, LLP Jody Kass, NPCROwen Kerney, City of Syracuse Kevin Kleaka, Impact Environmental Scott LaMountain, Shelter Planning & Development, Inc.Grace Lee, Gannet Fleming Eugene Leff, NYS Department of Environmental ConservationNadine Lemmon, Tri-State Transportation CampaignMark Lowery, NYC DEC Ian MacDougall, City of Newburgh
11
Accelerating Economic Development:The Area-Wide Approach of the Brownfield Opportunity Areas Program
F A L L 2 0 1 1
Summary Report on NPCR’s Albany Brownfields Summit V (continued)
A P P E N D I X # 2
SummitVParticipantList(continued)Dave MacLeod, New York Department of StateMark McIntyre, NYC MOERJames McIver Jr., C.T. Male Associates, P.C.Linda McQuinn, Town of Canton Chris Mercurio, City of Rome Christian Michel, AKRF Elaine Miller, NYS Department of State Dennis Minceli, AKRF Lisa Nagle, Elan Planning, Design & Landscape Architecture, PLLC Mark Pennington, John E. Osborn P.C. Gretchen Pinkel, USDA - Rural Development Vincent Pitruzzello, US Environmental Protection Agency, Region II Charles Rich, CA Rich, Inc. Katherine RobertsonCraig Marti, City of Newburgh Kevin McCarty, ELM Group Axel Schwendt, AKRF Mark Seber, City of Mechanicville Jane Semple, Town of Canton Josslyn Shapiro, NYC MOER Dan Shearer, Saratoga Associates David Shuffler, Youth Ministries for Peace and JusticeAndrea Smith, City of Ogdensburg Jessica Snyder, NPCR Bill Spizuoco, Plumley Engineering Sam Stamps, C&S Companies Robert Stout, Jr., Whiteman, Osterman & Hanna, LLPBen Syden, Laberge Group Jim Thatcher, Avalon Associates, Inc. Julie Tighe, NYS DECHoward Tollin, Aon Environmental Laura Truettner, NPCR Carolynn Venti, Galli Engineering Chuck Voss, Barton & Loguidice, PC Ben Walsh, City of Syracuse Peter Walsh, New York Department of StateDan Walsh, NYC MOERVal WashingtonRichard Werber, GJDC J. Justin Woods, City of Ogdensburg Elizabeth Yeampierre, UPROSE
WithThankstoNPCR’sBrownfieldsSummitVSponsorsChampionsAKRF
LeadersAON EnvironmentalEnvironmental Defense FundJohn Osborn, P.C.Greenpoint Manufacturing and Design Center
SupportersAvalon AssociatesC&S CompaniesC.T. Male Associates, P.C.C.A. RichElan Planning, Design & Landscape Architecture, PLLCELM GroupEmpire State FutureEnvironmental AdvocatesGalli EngineeringGannet FlemingGreat American Insurance CompanyGreen & Seifter, Attorneys, PLLCGruskin GordonHinman, Howard & Kattell, LLPImpact EnvironmentalLaberge GroupLaw Office of Gary BowitchNew York Lawyers for the Public InterestPlumley EngineeringPratt CenterRobertson AssociatesSaratoga AssociatesWhiteman, Osterman & Hanna, LLPWorkforce Development Institute
12

Accelerating Economic Development:The Area-Wide Approach of the Brownfield Opportunity Areas Program
F A L L 2 0 1 1
Acknowledgements
A P P E N D I X # 3
This Report would not be possible without the philanthropic support from our past and present funders:
Alpern Family FoundationBooth Ferris FoundationBrooklyn Community FoundationCitigroup FoundationDeutsche Bank FoundationFord FoundationGarfield FoundationHorace and Amy Hagedorn Long Island FundHSBC Bank USA, NAIndependence Community FoundationMertz Gilmore FoundationMizuho USA Foundation, Inc. Robert Sterling Clark FoundationRockefeller Brothers FundSurdna FoundationThe New York Community Trust
NPCRBoardofDirectorsEve Baron, Pratt Center for Community DevelopmentJoan Bartolomeo, Brooklyn Economic Development Corporation Eric Bluestone, NYS Builders Association Brian T. Coleman, Greenpoint Manufacturing and Design CenterRamon Cruz, Partnership for NYC (formerly)Alexie Torres Fleming, Youth Ministries for Peace and Justice (formerly)Barry Hersh, SCPS Real Estate Institute, New York University Jody Kass, New Partners for Community Revitalization, Inc.Gavin Kearney, NY Lawyers for the Public InterestKevin McCarty, The Elm Group Jeff Nixon, Wells Fargo BankMark Pennington, John E. Osborn P.C.Katherine Robertson, Robertson ConsultingBrian Segel, NYS Housing Finance Agency Howard Tollin, Aon EnvironmentalJim Tripp, Environmental Defense FundMichelle de la Uz, Fifth Avenue Committee Val WashingtonLynn Wright, Edwards Angell Palmer & Dodge LLPElizabeth Yeampierre, United Puerto Rican Organization of Sunset Park (UPROSE)
13

Accelerating Economic Development:The Area-Wide Approach of the Brownfield Opportunity Areas Program
F A L L 2 0 1 1
Summary Report on Survey of Implementation Resources for BOA
A P P E N D I X # 4
As a community sets out to plan for its future, it is important that government programs and funding criteria be structured so that they are programmatically available on a priority basis for projects that are built consistent with an authentic community plan. This would result in an important shift in the community planning dynamic, as it would encourage wider and more enthusiastic participation in the planning process by local developers, property owners, and government. The 2003 Brownfields Law provides broad authority for projects in BOAs to receive preference and priority during consideration for financial and other assistance but little in the way of specific benefits. In the spring of 2011, NPCR launched an initiative aimed at advancing the understanding and opportunities associated with preference and priority that would also shape the Agenda and inform the discussion at NPCR’s June 2011 Albany Summit. The following objectives were established:
1. Identify key government programs and resources important to BOA communities that, if made available on a preferential basis, would strengthen communities’ ability to implement BOA plans;
2. Identify and assess the viability of administrative and statutory changes that would increase the availability of such resources;
3. Develop a strategy for advancing such changes that leverages work currently being conducted by BOA grantees; and
4. Begin implementation of strategies to secure changes.
The analysis began with research into available programs, the results of which laid the foundation for developing a detailed survey. What we found
during the research was that there were some programs that BOA grantees used with greater frequency than others and so the survey was divided into two parts- Part I focused on soliciting feedback on specific programs such as the BCP, Restore NY, EPA Brownfields Grants Programs, NYS Clean Water Revolving Loan Fund, and affordable housing programs and Part II of the survey gave participants the opportunity to identify additional programs that they believed were key for implementing their BOA. In both parts of the survey, participants were asked to respond to specific questions about their use of the program, its importance to their BOA and to provide recommendations for changes that would make the program more useable or effective. Prior to distribution of the survey, it was submitted to the DOS for their review and comment. A copy of the final survey is included at the end of this appendix. (The survey was distributed to all 100 BOA grantees in early spring before the April 2011 round of BOA awards.)
Several weeks after the survey was distributed, NPCR, in concert with the DOS, identified approximately 20 BOA grantees as candidates for detailed follow-up interviews (the target number was 10, but additional candidates were identified to account for scheduling difficulties). Both organizations thought it important to identify grantees that had been in the BOA program for a number of years and were at Step 2 or 3 so that they were in the position to be considering implementation resources. There was also an interest in having a mix of municipalities and community based organizations and geographic diversity. NPCR and DOS decided to conduct the interviews jointly to ensure that the information collected was as comprehensive as possible. The list of 14 interviewees and interviewers is provided below.
BOAGrantee/StudyArea Interviewee NPCRStaffLead DOSStaffLead*
Town of Babylon /Wyandanch BOA Vanessa Pugh Jody Kass Dave Ashton
City of New York/City-wide BOA Grant Dan Walsh & Lee Ilan Jody Kass Curtis Cravens
YMPJ/South Bronx Waterfront BOA David Shuffler John Fleming
City of Kingston /Roundout Creek BOA Steve Finkle Laura Truettner Dave Ashton
SoBRO/Eastchester and Port Morris BOAs Shira Gidding John Fleming Curtis Cravens
GJDC/Jamaica BOA Richard Werber John Fleming
GMDC/Newtown Creek BOA Paul Parkhill John Fleming Curtis Cravens
Buffalo Urban Development Corporation (BUDC)/South Bufflao BOA David Stebbins John Fleming Elaine Miller
City of Rochester/Gennessee River Corridor & Lyell Lake State Street Area BOA
Mark Gregor Laura Truettner Elaine Miller
Fort Edward/Downtown & Industrial Park BOAs Darlene DeVoe Jody Kass Dave Mcleod
City of Ogdensburg/City of Ogdensburg BOA J. Justin Woods Laura Truettner Dave McLeod
City of Rome/Downtown BOA Diane Shoemaker, Chris J. Mercurio John Fleming Dave McLeod
Niagara/Buffalo Avenue Corridor BOA Tom DeSantis Jody Kass Julie Sweet
Town of Canton/Town of Canton BOA David Button & Linda McQuinn Jody Kass Dave McLeod
City of Jamestown/Chadakoin West Riverfront and Downtown Riverfront BOAs
Steve Centi Tawkiyah Jordan Julie Sweet
City of Lackawanna/City of Lackawanna BOA Lou Zicari Tawkiyah Jordan Juile Sweet
*In some cases, DOS staff were not available because of scheduling conflicts.
14

Accelerating Economic Development:The Area-Wide Approach of the Brownfield Opportunity Areas Program
than CBOs, which underscores the importance of participation by municipalities in CBO administered BOA grants.
The materials that emerged from the surveys and interviews were used to inform the agenda and discussion at the June 2011 Albany Summit. The roundtable discussion provided clarifications and also generated additional issues/solutions. Together, the survey, interviews and Summit discussions form the basis for this report.
F A L L 2 0 1 1
Summary Report on Survey of Implementation Resources for BOA (continued)
A P P E N D I X # 4
The survey formed the basis for the interviews and interviewers also used the opportunity to gain further insight into specific programs that grantees were using. One of the lessons learned was that while funding decisions for some programs were managed at one level, such as the state level, other programs, such as transportation, involved many layers of decision-makers (federal, state and regional) which had the potential to greatly complicate efforts to provide preference and priority. Another lesson learned was that municipalities have more experience with the state resources and programs
15

Accelerating Economic Development:The Area-Wide Approach of the Brownfield Opportunity Areas Program
F A L L 2 0 1 1
BOA Implementation Resources & New Tools InitiativeSurvey of BOA Program Participants
S U R V E Y
Over 100 communities are participating in the NYS Brownfield Opportunity Areas (BOA) program and there is a growing recognition of the need to put in place mechanisms, resources and programs to implement the emerging area-wide revitalization strategies. NPCR is launching an initiative to identify key programs/resources that, if made available on a preferential basis, would strengthen the ability of communities to implement their area-wide plans. As part of this Initiative, NPCR is also evaluating both administrative and statutory changes that would make these resources more readily available programmatically.
We appreciate your time in filling out this survey and ask that you email it to [email protected] by April26th.
Name of BOA/Step
Date & Amount of BOA Grant Award
Approximate Size of Study Area
Anticipated completion date of current Step
Name, title and contact information for person filling out survey
SurveyDirectionsThis is a two-part survey. For Part I respond only to those questions that apply to your BOA, i.e., programs or funding sources that you have used, tried to use, currently use or plan to use in the future. Skip questions that do not apply. You may respond Yes or No by placing an X next to the appropriate word. Larger boxes are for written responses. Part II asks you to identify and discuss the 3 - 5 most important programs/resources to advance implementation of your BOA.
SURVEY – Part I
1.WhatisthemostimportantprogramorfundingresourceneededtoimplementyourBOAplan(andwhy)?
a. State Program:
b. Federal Program:
16
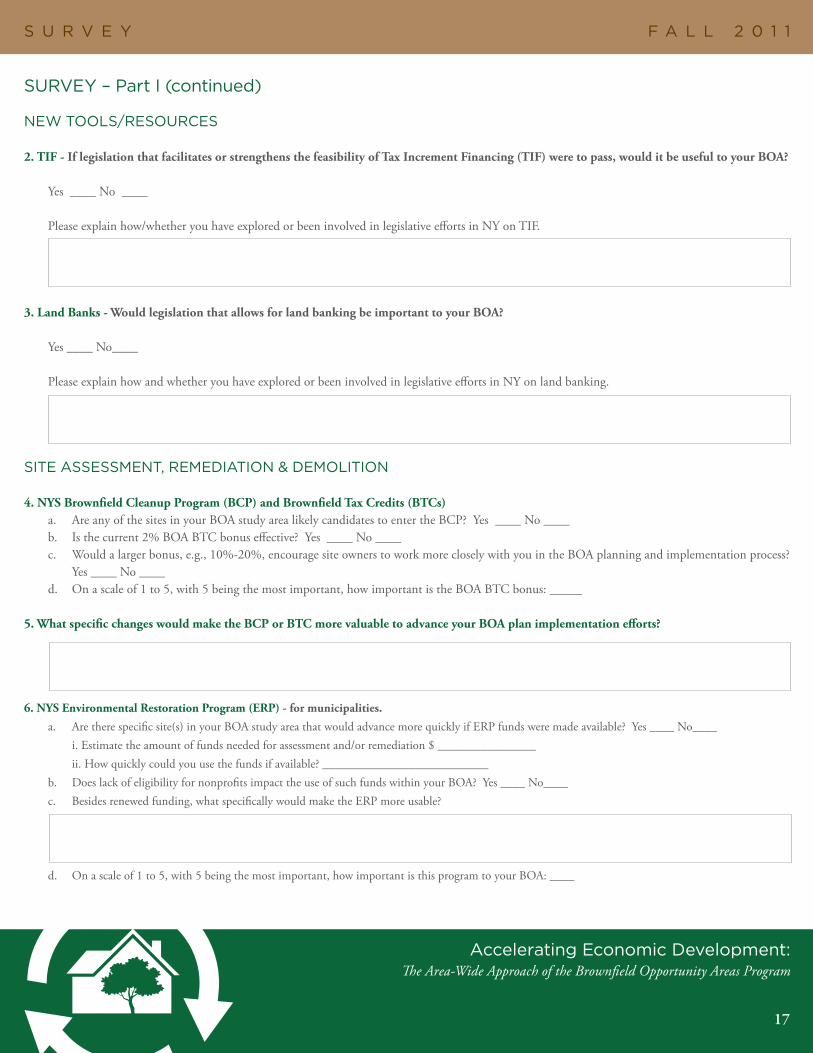
Accelerating Economic Development:The Area-Wide Approach of the Brownfield Opportunity Areas Program
F A L L 2 0 1 1S U R V E Y
SURVEY – Part I (continued)
NEW TOOLS/RESOURCES
2.TIF-IflegislationthatfacilitatesorstrengthensthefeasibilityofTaxIncrementFinancing(TIF)weretopass,woulditbeusefultoyourBOA?
Yes ____ No ____
Please explain how/whether you have explored or been involved in legislative efforts in NY on TIF.
3.LandBanks-WouldlegislationthatallowsforlandbankingbeimportanttoyourBOA?
Yes ____ No____
Please explain how and whether you have explored or been involved in legislative efforts in NY on land banking.
SITE ASSESSMENT, REMEDIATION & DEMOLITION
4.NYSBrownfieldCleanupProgram(BCP)andBrownfieldTaxCredits(BTCs)a. Are any of the sites in your BOA study area likely candidates to enter the BCP? Yes ____ No ____b. Is the current 2% BOA BTC bonus effective? Yes ____ No ____ c. Would a larger bonus, e.g., 10%-20%, encourage site owners to work more closely with you in the BOA planning and implementation process? Yes ____ No ____d. On a scale of 1 to 5, with 5 being the most important, how important is the BOA BTC bonus: _____
5.WhatspecificchangeswouldmaketheBCPorBTCmorevaluabletoadvanceyourBOAplanimplementationefforts?
6.NYSEnvironmentalRestorationProgram(ERP)-formunicipalities.
a. Are there specific site(s) in your BOA study area that would advance more quickly if ERP funds were made available? Yes ____ No____ i. Estimate the amount of funds needed for assessment and/or remediation $ ________________ ii. How quickly could you use the funds if available? ___________________________b. Does lack of eligibility for nonprofits impact the use of such funds within your BOA? Yes ____ No____c. Besides renewed funding, what specifically would make the ERP more usable?
d. On a scale of 1 to 5, with 5 being the most important, how important is this program to your BOA: ____
17
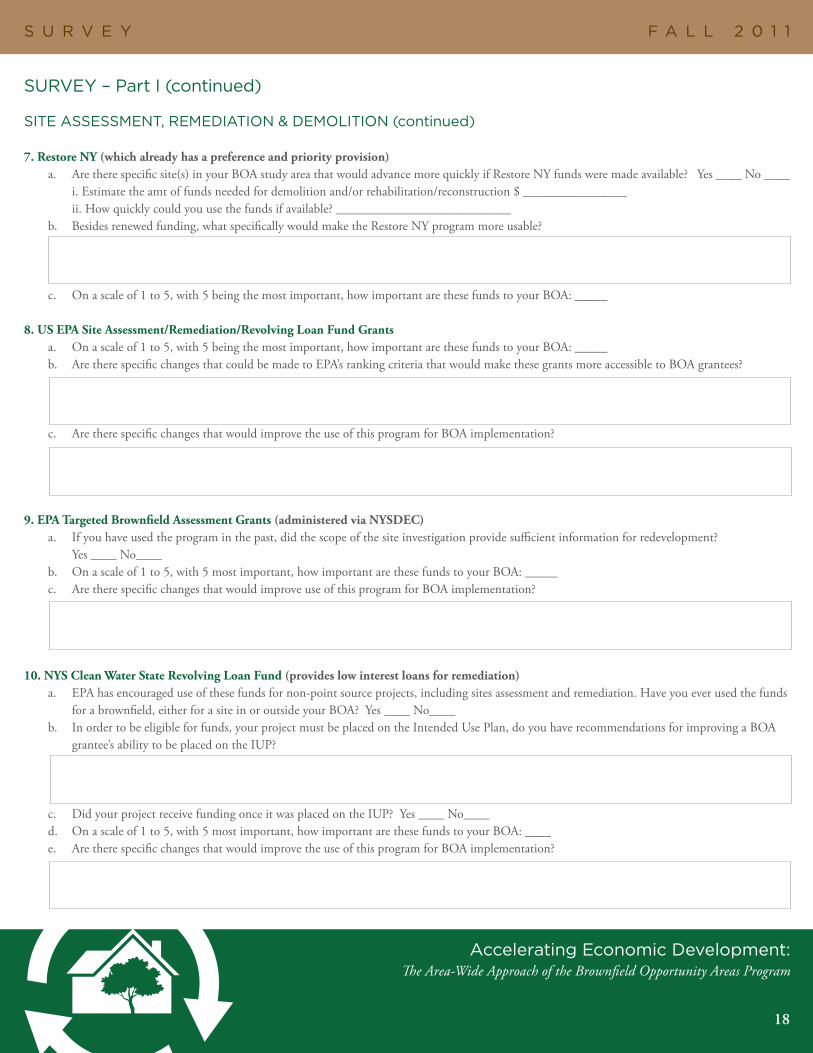
Accelerating Economic Development:The Area-Wide Approach of the Brownfield Opportunity Areas Program
F A L L 2 0 1 1S U R V E Y
SURVEY – Part I (continued)
SITE ASSESSMENT, REMEDIATION & DEMOLITION (continued)
7.RestoreNY(whichalreadyhasapreferenceandpriorityprovision)a. Are there specific site(s) in your BOA study area that would advance more quickly if Restore NY funds were made available? Yes ____ No ____ i. Estimate the amt of funds needed for demolition and/or rehabilitation/reconstruction $ ________________ ii. How quickly could you use the funds if available? ___________________________b. Besides renewed funding, what specifically would make the Restore NY program more usable?
c. On a scale of 1 to 5, with 5 being the most important, how important are these funds to your BOA: _____
8.USEPASiteAssessment/Remediation/RevolvingLoanFundGrantsa. On a scale of 1 to 5, with 5 being the most important, how important are these funds to your BOA: _____b. Are there specific changes that could be made to EPA’s ranking criteria that would make these grants more accessible to BOA grantees?
c. Are there specific changes that would improve the use of this program for BOA implementation?
9.EPATargetedBrownfieldAssessmentGrants(administeredviaNYSDEC)a. If you have used the program in the past, did the scope of the site investigation provide sufficient information for redevelopment? Yes ____ No____b. On a scale of 1 to 5, with 5 most important, how important are these funds to your BOA: _____c. Are there specific changes that would improve use of this program for BOA implementation?
10.NYSCleanWaterStateRevolvingLoanFund(provideslowinterestloansforremediation)a. EPA has encouraged use of these funds for non-point source projects, including sites assessment and remediation. Have you ever used the funds for a brownfield, either for a site in or outside your BOA? Yes ____ No____b. In order to be eligible for funds, your project must be placed on the Intended Use Plan, do you have recommendations for improving a BOA grantee’s ability to be placed on the IUP?
c. Did your project receive funding once it was placed on the IUP? Yes ____ No____d. On a scale of 1 to 5, with 5 most important, how important are these funds to your BOA: ____e. Are there specific changes that would improve the use of this program for BOA implementation?
18

Accelerating Economic Development:The Area-Wide Approach of the Brownfield Opportunity Areas Program
F A L L 2 0 1 1S U R V E Y
SURVEY – Part I (continued)
HOUSING
11.NewYorkStateHousingProgramsa. If housing projects being built consistent with a BOA plan were given preference and priority in the competitive ranking criteria, which NYS housing program(s) would be most important to advance your BOA?
b. Are there other specific changes that would improve the use of this program for BOA implementation?
12.FederalHousingPrograma. If housing projects being built consistent with a BOA plan were given preference and priority in the competitive ranking criteria, which federal housing program(s) would be most important to advance your BOA?
b. Are there other specific changes that would improve the use of this program for BOA implementation?
INFRASTRUCTURE
13.Whatspecificresources/programsaremostneededinyourBOAtonewlyconstructorenhanceexisting,road,rail,water,sewer,bulkheads,stormwatermanagement,telecommunications,orotherinfrastructureprojectsthatwouldsupportstrategicsiteredevelopmentandcommunityrevitalization?
14.TheNYSCleanWaterStateRevolvingLoanFundfinanceswaterqualityprojects.a. On a scale of 1 to 5, with 5 most important, how important are these water infrastructure funds to your BOA: ____b. In order to be eligible for funds, your project must be placed on the Intended Use Plan—do you have recommendations for improving a BOA grantee’s ability to be placed on the IUP?
c. Did your project receive funding once it was placed on the IUP? Yes ____ No ____d. Are there specific changes that would improve the use of this program for BOA implementation?
19
Accelerating Economic Development:The Area-Wide Approach of the Brownfield Opportunity Areas Program
F A L L 2 0 1 1S U R V E Y
SURVEY – Part I (continued)
INFRASTRUCTURE (continued)
15.TheNYSDrinkingWaterStateRevolvingLoanFundfinancesdrinkingwaterqualityprojects.a. On a scale of 1 to 5, with 5 most important, how important are these water infrastructure funds to your BOA: ____b. In order to be eligible for funds, your project must be placed on the Intended Use Plan - do you have recommendations for improving a BOA grantee’s ability to be placed on the IUP?
c. Did your project receive funding once it was placed on the IUP? Yes ____ No ____d. Are there specific changes that would improve the use of this program for BOA implementation?
16.NYSDEC’sEnvironmentalProtectionFundprovidesfundsforseveraltypesofwaterqualityimprovementprojects.a. On a scale of 1 to 5, with 5 most important, how important are these water infrastructure funds to your BOA: ____b. Did your project receive funding from the Environmental Protection Fund: Yes ____ No ____c. Are there specific changes that would improve the use of this program for BOA plan implementation?
17.TheNYSEnvironmentalFacilitiesCorporation’sIndustrialFinanceProgrammakesavailablefinancingtoprivatecompaniestoundertakeinfrastructureimprovements.
a. Have private companies used this financing to make improvements in your BOA? Yes ____ No ____b. Are there specific changes that would improve the use of this program for BOA plan implementation?
18.NYSDepartmentofTransportation(DOT)Fundsa. Which specific DOT funding program(s) do you plan to utilize to implement your BOA plan?
b. On a scale of 1 to 5, with 5 being the most important, how important are these funds to your BOA:_____c. Are there specific changes that would improve the use of this program for BOA plan implementation?
20
Accelerating Economic Development:The Area-Wide Approach of the Brownfield Opportunity Areas Program
F A L L 2 0 1 1S U R V E Y
SURVEY – Part I (continued)
AMENITIES & OPEN SPACE
19.PublicAmenities-Whatspecificresourcesorprogramsareneededtoconstructorenhanceexisting,parks,playgrounds,walkwaysortrails,esplanades,othercommunityfacilities,orthepreservationorenhancementofopenspaceandculturalorhistoricalsites,areasorfeatures.
20.NYSEnvironmentalProtectionFund:ParksProgramsa. Sites in BOAs are supposed to receive funding preference and priority. Do you expect to utilize this program in connection with your BOA: Yes ____ No_____b. On a scale of 1 to 5, with 5 most important, how important are these funds to your BOA: _____c. Are there specific changes that would improve the use of this program for BOA implementation?
21.NaturalResourceRestorationorEnhancements- Whatspecificresourcesorprogramsareneededtoundertakewetlandpreservation,habitatrestoration,waterqualityimprovements,orotherprojectstopreserve,protectorenhancenaturalresourcesinyourBOA?
21

Accelerating Economic Development:The Area-Wide Approach of the Brownfield Opportunity Areas Program
F A L L 2 0 1 1S U R V E Y
SURVEY – Part II
Please identify the 3 - 5 programs or funding sources at the State or federal level that are most important to implement your BOA plan and fill out the survey table below for each program. To stimulate your thinking, we have compiled a list of potential programs, which is on the next page. Feel free to respond with programs/resources not included in the list.
NAMEOFPROGRAM: NYSorFederal:
Have site(s) in or adjacent to your BOA been submitted for the program? Y/N:
Was the project accepted into the program? Y/N:
On a scale of 1 to 5, with 5 most important, how important are these funds to your BOA?
Are there specific changes that would improve the use of this program for BOA plan implementation?
NAMEOFPROGRAM: NYSorFederal:
Have site(s) in or adjacent to your BOA been submitted for the program? Y/N:
Was the project accepted into the program? Y/N;
On a scale of 1 to 5, with 5 most important, how important are these funds to your BOA?
Are there specific changes that would improve the use of this program for BOA plan implementation?
NAMEOFPROGRAM: NYSorFederal:
Have site(s) in or adjacent to your BOA been submitted for the program? Y/N:
Was the project accepted into the program? Y/N:
On a scale of 1 to 5, with 5 most important, how important are these funds to your BOA?
Are there specific changes that would improve the use of this program for BOA plan implementation?
NAMEOFPROGRAM: NYSorFederal:
Have site in or adjacent to your BOA been submitted for the program? Y/N:
Was the project accepted into the program? Y/N:
On a scale of 1 to 5, with 5 most important, how important are these funds to your BOA?
Are there specific changes that would improve the use of this program for BOA plan implementation?
22
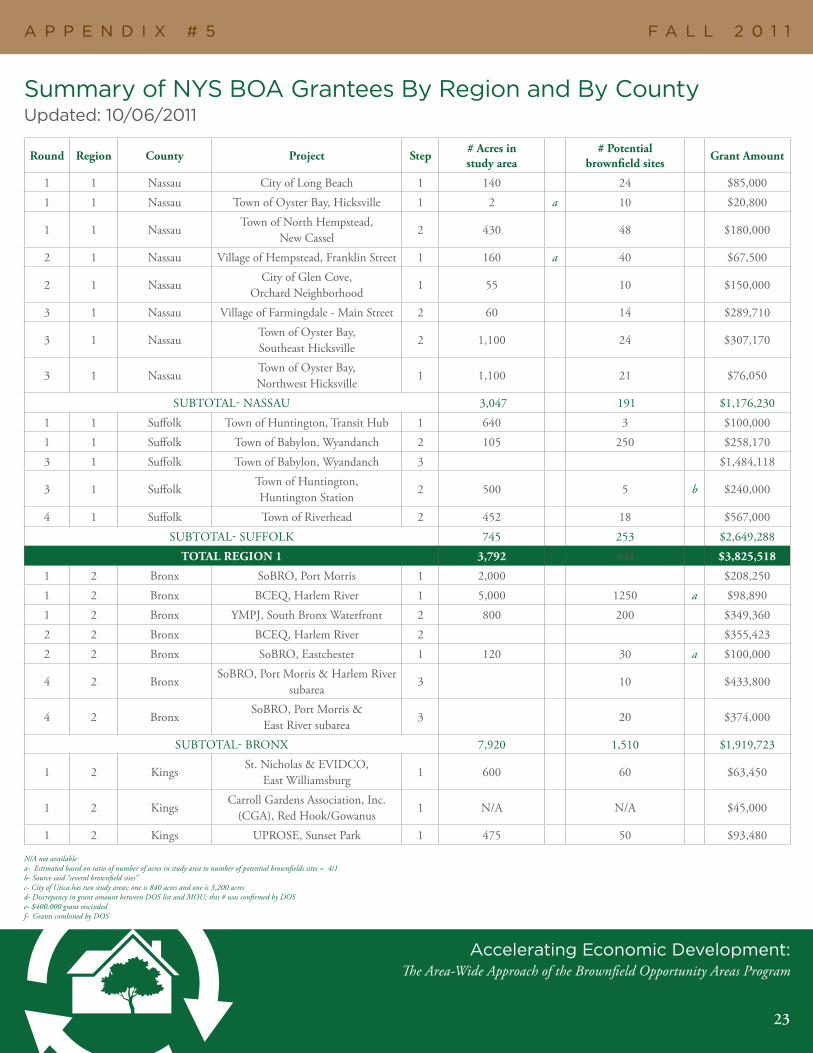
Accelerating Economic Development:The Area-Wide Approach of the Brownfield Opportunity Areas Program
F A L L 2 0 1 1A P P E N D I X # 5
Summary of NYS BOA Grantees By Region and By CountyUpdated: 10/06/2011
Round Region County Project Step#Acresinstudyarea
#Potentialbrownfieldsites
GrantAmount
1 1 Nassau City of Long Beach 1 140 24 $85,000
1 1 Nassau Town of Oyster Bay, Hicksville 1 2 a 10 $20,800
1 1 NassauTown of North Hempstead,
New Cassel2 430 48 $180,000
2 1 Nassau Village of Hempstead, Franklin Street 1 160 a 40 $67,500
2 1 NassauCity of Glen Cove,
Orchard Neighborhood1 55 10 $150,000
3 1 Nassau Village of Farmingdale - Main Street 2 60 14 $289,710
3 1 NassauTown of Oyster Bay, Southeast Hicksville
2 1,100 24 $307,170
3 1 NassauTown of Oyster Bay, Northwest Hicksville
1 1,100 21 $76,050
SUBTOTAL- NASSAU 3,047 191 $1,176,230
1 1 Suffolk Town of Huntington, Transit Hub 1 640 3 $100,000
1 1 Suffolk Town of Babylon, Wyandanch 2 105 250 $258,170
3 1 Suffolk Town of Babylon, Wyandanch 3 $1,484,118
3 1 SuffolkTown of Huntington, Huntington Station
2 500 5 b $240,000
4 1 Suffolk Town of Riverhead 2 452 18 $567,000
SUBTOTAL- SUFFOLK 745 253 $2,649,288
TOTALREGION1 3,792 444 $3,825,518
1 2 Bronx SoBRO, Port Morris 1 2,000 $208,250
1 2 Bronx BCEQ, Harlem River 1 5,000 1250 a $98,890
1 2 Bronx YMPJ, South Bronx Waterfront 2 800 200 $349,360
2 2 Bronx BCEQ, Harlem River 2 $355,423
2 2 Bronx SoBRO, Eastchester 1 120 30 a $100,000
4 2 BronxSoBRO, Port Morris & Harlem River
subarea3 10 $433,800
4 2 BronxSoBRO, Port Morris &
East River subarea3 20 $374,000
SUBTOTAL- BRONX 7,920 1,510 $1,919,723
1 2 KingsSt. Nicholas & EVIDCO,
East Williamsburg1 600 60 $63,450
1 2 KingsCarroll Gardens Association, Inc.
(CGA), Red Hook/Gowanus1 N/A N/A $45,000
1 2 Kings UPROSE, Sunset Park 1 475 50 $93,480
N/A not available a- Estimated based on ratio of number of acres in study area to number of potential brownfields sites = 4/1b- Source said “several brownfield sites”c- City of Utica has two study areas; one is 840 acres and one is 3,200 acresd- Discrepancy in grant amount between DOS list and MOU; this # was confirmed by DOSe- $400,000 grant rescindedf- Grants combined by DOS
23

Accelerating Economic Development:The Area-Wide Approach of the Brownfield Opportunity Areas Program
F A L L 2 0 1 1A P P E N D I X # 5
Summary of NYS BOA Grantees By Region and By County (continued)
N/A not available a- Estimated based on ratio of number of acres in study area to number of potential brownfields sites = 4/1b- Source said “several brownfield sites”c- City of Utica has two study areas; one is 840 acres and one is 3,200 acresd- Discrepancy in grant amount between DOS list and MOU; this # was confirmed by DOSe- $400,000 grant rescindedf- Grants combined by DOS
Round Region County Project Step#Acresinstudyarea
#Potentialbrownfieldsites
GrantAmount
1 2 KingsLocal Development Corp. of
East New York2 588 115 $117,084
2 2 Kings GMDC, Newtown Creek 2 994 248 a $625,454
2 2 KingsCoalition for Comm. Improvement
in Bushwick c/o Family Services Network of NY
1 606 133 $136,263
2 2 Kings Broadway Triangle Collaborative 2 117 48 $400,000
2 2 Kings CB-6, Gowanus Canal Corridor 1 402 5 $150,937
2 2 KingsGowanus Canal CDC,
Gowanus Canal Corridor1 100 25 a $124,200
3 2 Kings UPROSE, Sunset Park 2 $214,596
4 2 Kings Cypress Hills 2 275 30 a $412,743
SUBTOTAL - KINGS 4,157 714 $2,383,207
1 2 ManhattanAudubon Partnership for ED,
Sherman Creek2 190 5 b $400,000
2 2 Manhattan NYC OEC, HCCI and HCDC 1 210 5 $138,879
3 2 Manhattan City of New York 1 $1,230,000
SUBTOTAL - MANHATTAN 400 10 $1,768,879
1 2 RichmondWest Brighton Community LDC,
West Brighton1 N/A N/A $50,000
2 2 RichmondNorthfield Community LDC,
Port Richmond1 433 108 a $150,000
2 2 RichmondWest Brighton Community LDC,
Richmond Terrace2 120 30 a $339,300
SUBTOTAL - RICHMOND 553 138 $539,300
1 2 QueensGreater Jamaica Development
Corporation (GJDC)2 40 70 $420,000
3 2 QueensF/WP/C LDC,
Flushing River Waterfront2 60 32 $1,505,700
4 2 Queens GJDC- Station subarea 3 $1,241,312
SUBTOTAL - QUEENS 100 102 $3,167,012
TOTALREGION2 13,130 2,474 $9,778,121
1 3 Duchess City of Poughkeepsie 1 640 11 $50,000
1 3 OrangeCity of Newburgh,
Hudson River waterfront2 370 140 $197,500
3 3 OrangeNewburgh Community Action Committee, NW Newburgh
2 137 2 $491,000
SUBTOTAL- ORANGE 507 142 $688,500
24

Accelerating Economic Development:The Area-Wide Approach of the Brownfield Opportunity Areas Program
F A L L 2 0 1 1A P P E N D I X # 5
Summary of NYS BOA Grantees By Region and By County (continued)
N/A not available a- Estimated based on ratio of number of acres in study area to number of potential brownfields sites = 4/1b- Source said “several brownfield sites”c- City of Utica has two study areas; one is 840 acres and one is 3,200 acresd- Discrepancy in grant amount between DOS list and MOU; this # was confirmed by DOSe- $400,000 grant rescindedf- Grants combined by DOS
Round Region County Project Step#Acresinstudyarea
#Potentialbrownfieldsites
GrantAmount
2 3 Putnam Cornerstone Parks of New York 1 N/A N/A $171,050
1 3 Ulster City of Kingston, Hudson River WF 2 108 a 27 $72,000
2 3 Ulster City of Kingston, Rondout 3 70 25 $402,300
SUBTOTAL - ULSTER 178 52 $474,300
1 3 WestchesterYonkers Brownfield Solutions, Inc.
(YBSI), Lower West Side1 N/A N/A $150,000
1 3 Westchester YBSI, Nepperhan Valley 2 N/A N/A $375,000
1 3 Westchester YBSI, Alexander Street 2 N/A N/A $270,000
4 3 Westchester City of Mt Vernon, Canal Village 2 231 20 $435,160
SUBTOTAL - WESTCHESTER 231 20 $1,230,160
TOTAL-REGION3 1,556 225 $2,614,010
1 4 Albany City of Cohoes 1 3,700 925 a $22,260
1 4 Albany City of Albany 1 2,800 700 a $46,370
2 4 Albany City of Cohoes, Delaware Avenue 1 505 15 $39,604
2 4 Albany City of Cohoes, 1-787 Corridor 2 413 5 b $75,031
2 4 Albany City of Albany, Arbor Hill 1 319 75 $67,809
2 4 Albany City of Albany, South End 1 273 75 $67,809
2 4 Albany City of Albany, Riverfront 1 576 100 $80,363
4 4 Albany City of Cohoes, 1-787 Corridor 2 $150,015
SUBTOTAL - ALBANY 8,586 1,895 $549,261
2 4 Columbia City of Hudson, Hudson Riverfront 1 320 15 $37,800
2 4 Greene Village of Catskill, Catskill Creek 1 108 7 $36,000
1 4 Montgomery City of Amsterdam 2 30 15 $85,000
2 4 MontgomeryCity of Amsterdam, NE neighborhoods
1 50 5 $58,500
4 4 Montgomery City of Amsterdam, Downtown 2 381 28 $87,982
SUBTOTAL - MONTGOMERY 461 48 $231,482
2 4 Otsego City of Oneonta, D&H Railyard 2 460 5 b $85,754
2 4 Otsego City of Oneonta, Factory Street 1 378 5 b $35,551
SUBTOTAL - OTSEGO 838 10 $121,305
1 4 Rensselaer City of Troy, North-Central 1 600 17 $50,000
1 4 Rensselaer City of Troy, South Troy 2 208 54 $86,750
2 4 RensselaerTown of North Greenbush,
Wynantskill Street1 51 3 $36,000
2 4 Rensselaer City of Rensselaer, Urban Core 1 430 108 a $48,654
2 4 Rensselaer City of Rensselaer, Port of Rensselaer 1 340 85 a $40,406
25

Accelerating Economic Development:The Area-Wide Approach of the Brownfield Opportunity Areas Program
F A L L 2 0 1 1A P P E N D I X # 5
Summary of NYS BOA Grantees By Region and By County (continued)
N/A not available a- Estimated based on ratio of number of acres in study area to number of potential brownfields sites = 4/1b- Source said “several brownfield sites”c- City of Utica has two study areas; one is 840 acres and one is 3,200 acresd- Discrepancy in grant amount between DOS list and MOU; this # was confirmed by DOSe- $400,000 grant rescindedf- Grants combined by DOS
Round Region County Project Step#Acresinstudyarea
#Potentialbrownfieldsites
GrantAmount
2 4 Rensselaer City of Troy, South Troy 3 $49,500
SUBTOTAL - RENSSELAER 1,629 267 $311,310
1 4 Schenectady City of Schenectady 1 4,000 8 $53,720
1 4 Schenectady Town of Glenville 1 100 25 a $59,190
2 4 Schenectady Town of Rotterdam 2 570 7 $150,000
SUBTOTAL - SCHENECTADY 4,670 40 $262,910
TOTAL-REGION4 16,612 2,282 $1,550,068
1 5 Clinton City of Plattsburgh 1 1,300 60 $63,000
2 5 FranklinTown/Village of Malone,
Salmon Corridor1 300 30 $37,995
4 5 Franklin Village of Tupper Lake 2 290 7 $63,000
SUBTOTAL - FRANKLIN 590 37 $100,995
1 5 Fulton City of Johnstown 1 4,000 24 $35,940
1 5 Saratoga Town/Village of Stillwater 1 2,650 13 $50,714
1 5 Saratoga Village of Victory 1 14 4 a $19,570
3 5 SaratogaCity of Mechanicville,
WF/Urban Core2 561 28 $211,500
SUBTOTAL - SARATOGA 3,225 45 $281,784
1 5 Warren City of Glens Falls 1 1,300 45 $43,200
2 5 WarrenTown of Queensbury,
South Queensbury1 400 20 $42,500
SUBTOTAL - WARREN 1,700 65 $85,700
1 5 Washington Town of Fort Edward 1 4,800 $100,000
1 5 Washington Village of Hudson Falls 1 500 $38,800
3 5 WashingtonTown of Fort Edward,
Northeast Village2 4 $180,000
3 5 Washington Town of Fort Edward, Downtown 2 9 $180,000
4 5 WashingtonVillage of Hudson Falls, Downtown & Wtrfrnt
2 20 $54,000
SUBTOTAL - WASHINGTON 5,300 33 $552,800
TOTAL-REGION5 16,115 264 $1,120,219
4 6 Herkimer Village of Frankfurt 1 470 5 $56,700
1 6 JeffersonCity of Watertown,
Black River Corridor1 2,300 100 $50,400
1 6 OneidaCity of Rome- Mohawk River &
Erie Canal2 $225,000
1 6 Oneida City of Utica UBRC 2 4,000 c 212 a $475,000
26
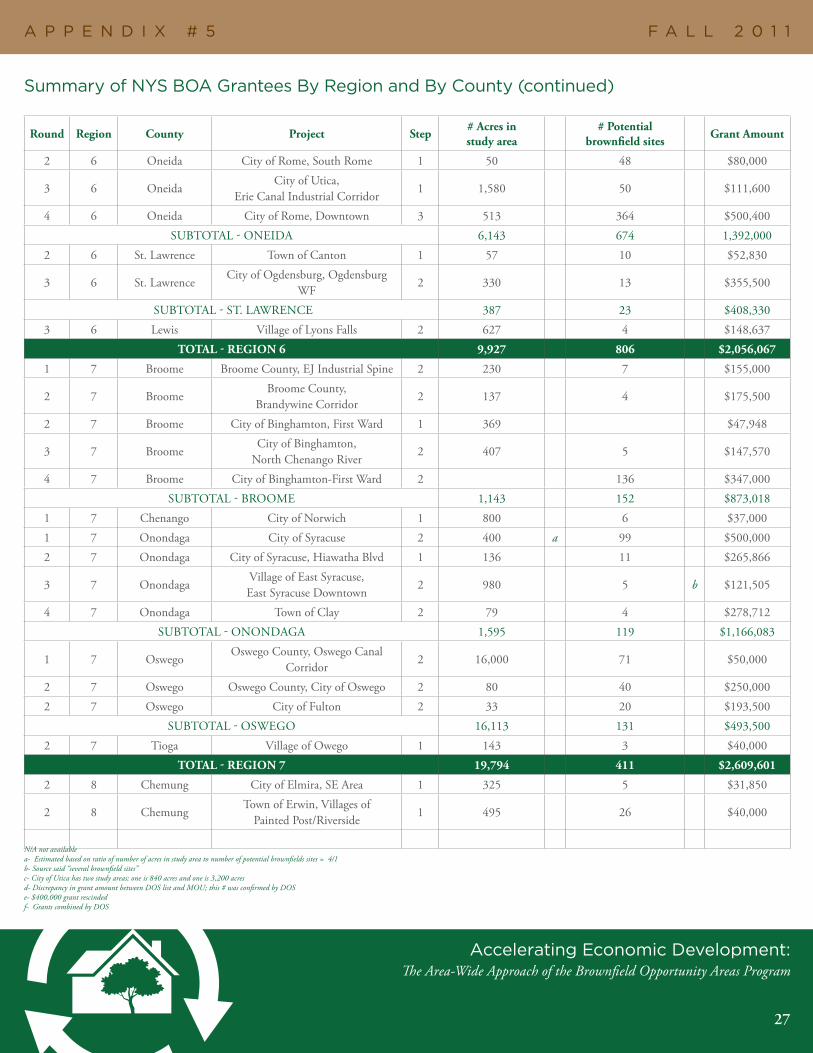
Accelerating Economic Development:The Area-Wide Approach of the Brownfield Opportunity Areas Program
F A L L 2 0 1 1A P P E N D I X # 5
Summary of NYS BOA Grantees By Region and By County (continued)
N/A not available a- Estimated based on ratio of number of acres in study area to number of potential brownfields sites = 4/1b- Source said “several brownfield sites”c- City of Utica has two study areas; one is 840 acres and one is 3,200 acresd- Discrepancy in grant amount between DOS list and MOU; this # was confirmed by DOSe- $400,000 grant rescindedf- Grants combined by DOS
Round Region County Project Step#Acresinstudyarea
#Potentialbrownfieldsites
GrantAmount
2 6 Oneida City of Rome, South Rome 1 50 48 $80,000
3 6 OneidaCity of Utica,
Erie Canal Industrial Corridor1 1,580 50 $111,600
4 6 Oneida City of Rome, Downtown 3 513 364 $500,400
SUBTOTAL - ONEIDA 6,143 674 1,392,000
2 6 St. Lawrence Town of Canton 1 57 10 $52,830
3 6 St. LawrenceCity of Ogdensburg, Ogdensburg
WF2 330 13 $355,500
SUBTOTAL - ST. LAWRENCE 387 23 $408,330
3 6 Lewis Village of Lyons Falls 2 627 4 $148,637
TOTAL-REGION6 9,927 806 $2,056,067
1 7 Broome Broome County, EJ Industrial Spine 2 230 7 $155,000
2 7 BroomeBroome County,
Brandywine Corridor2 137 4 $175,500
2 7 Broome City of Binghamton, First Ward 1 369 $47,948
3 7 BroomeCity of Binghamton,
North Chenango River2 407 5 $147,570
4 7 Broome City of Binghamton-First Ward 2 136 $347,000
SUBTOTAL - BROOME 1,143 152 $873,018
1 7 Chenango City of Norwich 1 800 6 $37,000
1 7 Onondaga City of Syracuse 2 400 a 99 $500,000
2 7 Onondaga City of Syracuse, Hiawatha Blvd 1 136 11 $265,866
3 7 OnondagaVillage of East Syracuse, East Syracuse Downtown
2 980 5 b $121,505
4 7 Onondaga Town of Clay 2 79 4 $278,712
SUBTOTAL - ONONDAGA 1,595 119 $1,166,083
1 7 OswegoOswego County, Oswego Canal
Corridor2 16,000 71 $50,000
2 7 Oswego Oswego County, City of Oswego 2 80 40 $250,000
2 7 Oswego City of Fulton 2 33 20 $193,500
SUBTOTAL - OSWEGO 16,113 131 $493,500
2 7 Tioga Village of Owego 1 143 3 $40,000
TOTAL-REGION7 19,794 411 $2,609,601
2 8 Chemung City of Elmira, SE Area 1 325 5 $31,850
2 8 ChemungTown of Erwin, Villages of
Painted Post/Riverside1 495 26 $40,000
27
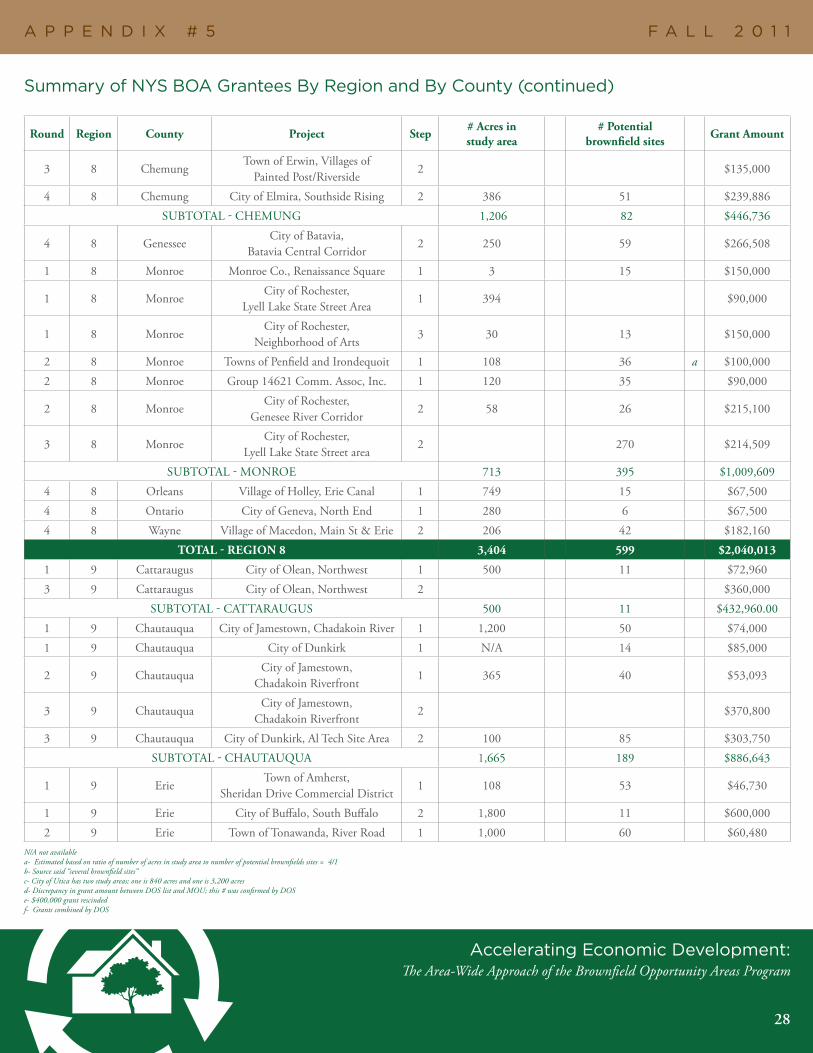
Accelerating Economic Development:The Area-Wide Approach of the Brownfield Opportunity Areas Program
F A L L 2 0 1 1A P P E N D I X # 5
Summary of NYS BOA Grantees By Region and By County (continued)
N/A not available a- Estimated based on ratio of number of acres in study area to number of potential brownfields sites = 4/1b- Source said “several brownfield sites”c- City of Utica has two study areas; one is 840 acres and one is 3,200 acresd- Discrepancy in grant amount between DOS list and MOU; this # was confirmed by DOSe- $400,000 grant rescindedf- Grants combined by DOS
Round Region County Project Step#Acresinstudyarea
#Potentialbrownfieldsites
GrantAmount
3 8 ChemungTown of Erwin, Villages of
Painted Post/Riverside2 $135,000
4 8 Chemung City of Elmira, Southside Rising 2 386 51 $239,886
SUBTOTAL - CHEMUNG 1,206 82 $446,736
4 8 GenesseeCity of Batavia,
Batavia Central Corridor2 250 59 $266,508
1 8 Monroe Monroe Co., Renaissance Square 1 3 15 $150,000
1 8 MonroeCity of Rochester,
Lyell Lake State Street Area1 394 $90,000
1 8 MonroeCity of Rochester,
Neighborhood of Arts3 30 13 $150,000
2 8 Monroe Towns of Penfield and Irondequoit 1 108 36 a $100,000
2 8 Monroe Group 14621 Comm. Assoc, Inc. 1 120 35 $90,000
2 8 MonroeCity of Rochester,
Genesee River Corridor2 58 26 $215,100
3 8 MonroeCity of Rochester,
Lyell Lake State Street area2 270 $214,509
SUBTOTAL - MONROE 713 395 $1,009,609
4 8 Orleans Village of Holley, Erie Canal 1 749 15 $67,500
4 8 Ontario City of Geneva, North End 1 280 6 $67,500
4 8 Wayne Village of Macedon, Main St & Erie 2 206 42 $182,160
TOTAL-REGION8 3,404 599 $2,040,013
1 9 Cattaraugus City of Olean, Northwest 1 500 11 $72,960
3 9 Cattaraugus City of Olean, Northwest 2 $360,000
SUBTOTAL - CATTARAUGUS 500 11 $432,960.00
1 9 Chautauqua City of Jamestown, Chadakoin River 1 1,200 50 $74,000
1 9 Chautauqua City of Dunkirk 1 N/A 14 $85,000
2 9 ChautauquaCity of Jamestown,
Chadakoin Riverfront1 365 40 $53,093
3 9 ChautauquaCity of Jamestown,
Chadakoin Riverfront2 $370,800
3 9 Chautauqua City of Dunkirk, Al Tech Site Area 2 100 85 $303,750
SUBTOTAL - CHAUTAUQUA 1,665 189 $886,643
1 9 ErieTown of Amherst,
Sheridan Drive Commercial District1 108 53 $46,730
1 9 Erie City of Buffalo, South Buffalo 2 1,800 11 $600,000
2 9 Erie Town of Tonawanda, River Road 1 1,000 60 $60,480
28
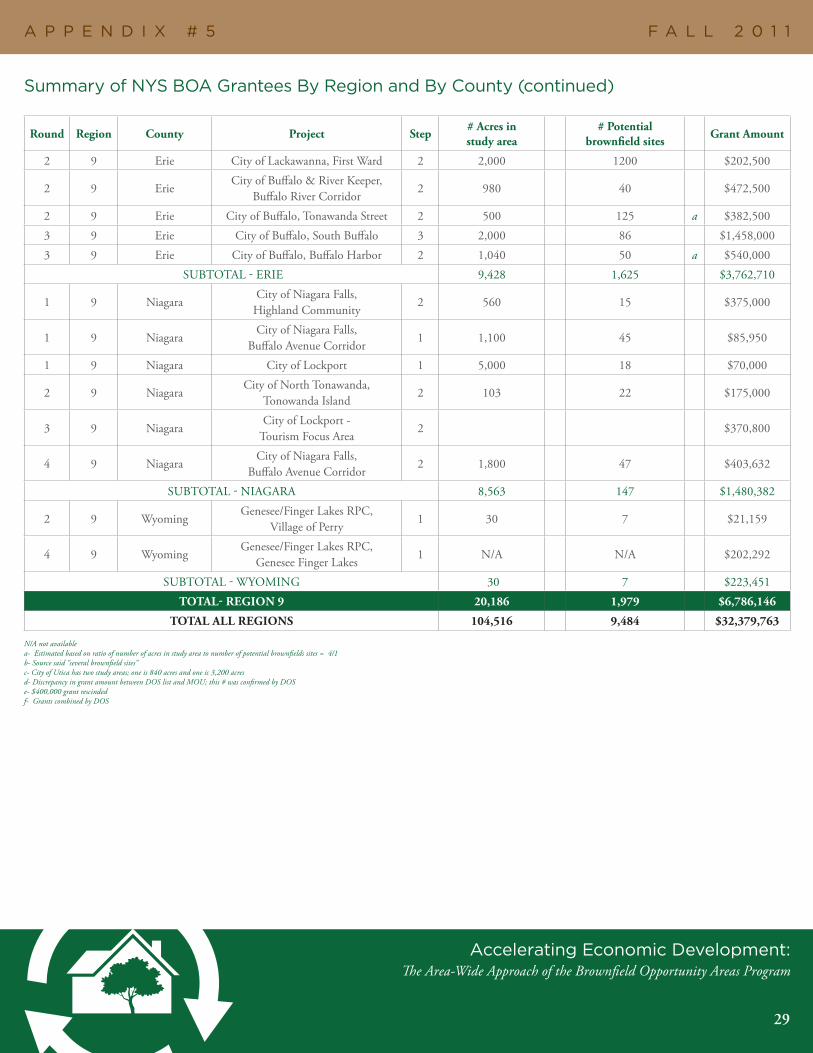
Accelerating Economic Development:The Area-Wide Approach of the Brownfield Opportunity Areas Program
F A L L 2 0 1 1A P P E N D I X # 5
Summary of NYS BOA Grantees By Region and By County (continued)
Round Region County Project Step#Acresinstudyarea
#Potentialbrownfieldsites
GrantAmount
2 9 Erie City of Lackawanna, First Ward 2 2,000 1200 $202,500
2 9 ErieCity of Buffalo & River Keeper,
Buffalo River Corridor2 980 40 $472,500
2 9 Erie City of Buffalo, Tonawanda Street 2 500 125 a $382,500
3 9 Erie City of Buffalo, South Buffalo 3 2,000 86 $1,458,000
3 9 Erie City of Buffalo, Buffalo Harbor 2 1,040 50 a $540,000
SUBTOTAL - ERIE 9,428 1,625 $3,762,710
1 9 NiagaraCity of Niagara Falls,
Highland Community2 560 15 $375,000
1 9 NiagaraCity of Niagara Falls,
Buffalo Avenue Corridor1 1,100 45 $85,950
1 9 Niagara City of Lockport 1 5,000 18 $70,000
2 9 NiagaraCity of North Tonawanda,
Tonowanda Island2 103 22 $175,000
3 9 NiagaraCity of Lockport -
Tourism Focus Area2 $370,800
4 9 NiagaraCity of Niagara Falls,
Buffalo Avenue Corridor2 1,800 47 $403,632
SUBTOTAL - NIAGARA 8,563 147 $1,480,382
2 9 WyomingGenesee/Finger Lakes RPC,
Village of Perry1 30 7 $21,159
4 9 WyomingGenesee/Finger Lakes RPC,
Genesee Finger Lakes1 N/A N/A $202,292
SUBTOTAL - WYOMING 30 7 $223,451
TOTAL-REGION9 20,186 1,979 $6,786,146
TOTALALLREGIONS 104,516 9,484 $32,379,763
N/A not available a- Estimated based on ratio of number of acres in study area to number of potential brownfields sites = 4/1b- Source said “several brownfield sites”c- City of Utica has two study areas; one is 840 acres and one is 3,200 acresd- Discrepancy in grant amount between DOS list and MOU; this # was confirmed by DOSe- $400,000 grant rescindedf- Grants combined by DOS
29