accelerated grade 8 table of contents module 2, …...accelerated grade 8 table of contents module...
TRANSCRIPT

Middle School Math Solution: Accelerated Grade 8 Table of Contents | 1
Accelerated Grade 8Table of Contents
Module 2, Topic 2: Linear RelationshipsStudents develop fluency with analyzing linear relationships, writing equations of lines, and graphing lines. They determine and interpret rates of change and initial values from contexts, tables, graphs, and equations. They derive and use the slope-intercept and point-slope forms of linear equations. Students learn to graph lines given the three common forms of a linear equation, including standard form.
Standard: 8.F.4
Lesson Title / Subtitle Standards Lesson Summary
1U.S. Shirts
Using Tables, Graphs, and Equations8.F.4
Students create equations, tables, and graphs to analyze linear relationships. They compare two t-shirt company pricing rates algebraically and graphically. They then write a response that compares the pricing plans for the two companies and predict how the pricing affects business.
2At the Arcade
Linear Relationships in Tables8.F.4 Students use the formula (y2 – y1)/(x2 – x1) to determine the rate of change for a table of values (or two points). They
determine whether a given table of values represents a linear relationship, including the by examining first differences.
3Dining, Dancing, and Driving
Linear Relationships in Contexts8.F.4
Students analyze a context that represents linear relationships among distance, cost, and gallons of gas. They represent the same context using different independent and dependent quantities, each time calculating the rate in order to connect processes and representations.
4Derby Day
Slope-Intercept Form of a Line8.F.4
Students learn about the y-intercept of a linear graph and the slope-intercept form of a linear equation. They use the slope formula in their calculations and to derive the slope-intercept form. Students practice writing equations in slope-intercept form.
5What's the Point?
Point-Slope Form of a Line8.F.4
Students use the slope formula to derive the point-slope form of a linear equation. They practice writing equations in point-slope and slope-intercept forms when given a variety of information. Students write equations for horizontal and vertical lines.
6The Arts Are Alive
Using Linear Equations8.F.4
Students graph lines using each of the three forms of linear equations: slope-intercept, point-slope, and standard form. They compare the advantages and disadvantages of each form.

Middle School Math Solution: Accelerated Grade 8 Table of Contents | 2
Accelerated Grade 8Table of Contents
Module 2, Topic 3: Introduction to FunctionsStudents begin to formalize the concept of function. They explore functions in terms of sequences, mappings, sets of ordered pairs, graphs, tables, verbal descriptions, and equations. Because students have a strong foundation in writing equations of lines, they can construct equations for linear functions. To build flexibility with their understanding of function, students analyze linear and nonlinear functions in terms of qualitative descriptions and compare functions represented in different ways. Then, they connect geometric transformations, slope and y-intercept of graphs of linear functions, and equations of linear functions as they transform and compare linear functions with either the same slope.
Standards: 8.F.1, 8.F.2, 8.F.3, 8.F.4, 8.F.5, 8.G.1.a, 8.G.1.c
Lesson Title / Subtitle Standards Lesson Summary
1Patterns, Sequences, Rules …
Analyzing Sequences as Rules8.F.1
Students analyze sequences that decrease, increase, and alternate between decreasing and increasing. They generate the next terms, describe the patterns in the sequences, and compare the sequences.
2Once Upon a Graph
Analyzing the Characteristics of Graphs of Relationships
8.F.5Students complete a sorting activity to distinguish the graphs that are discrete or continuous; linear or nonlinear; increasing, decreasing, neither increasing nor decreasing, or both increasing and decreasing. They use these terms to qualitatively describe numberless piecewise linear graphs.
3One or More Xs to One Y
Defining Functional Relationships8.F.1 The terms relation and function are defined. Students analyze mappings, sets of ordered pairs, sequences, tables, graphs,
equations, and contexts and determine which are functions.
4Over the River and Through the Woods
Describing Functions
8.F.38.F.48.F.5
Students analyze the graphical behavior of linear and nonlinear functions. They conclude that non-vertical linear relationships are linear functions. Then students learn about and apply intervals of increase and decrease and constant intervals to descriptions of a day and to specific nonlinear functions (absolute value, quadratic, cubic).
5Comparing Apples to Oranges
Comparing Functions using Different Representations
8.F.2Students compare the rate of change associated with functions represented by equations, tables of values, graphs, and verbal descriptions. They also order rates of change associated with various representations.

Middle School Math Solution: Accelerated Grade 8 Table of Contents | 3
Accelerated Grade 8Table of Contents
Chapter 1: Quantities and RelationshipsThis chapter introduces students to the concept of functions. Lessons provide opportunities for students to explore functions, including linear, exponential, quadratic, linear absolute value functions, and linear piecewise functions through problem situations, graphs, and equations. Students will classify each function family using graphs, equations, and graphing calculators. Each function family is then defined and students will create graphic organizers that represent the graphical behavior and examples of each.
Standards: A.CED.2, A.REI.10, F.IF.1, F.IF.2, F.IF.4, F.IF.5, F.IF.7.a, F.LE.1.b, F.LE.2
Lesson Title / Subtitle Standards Lesson Summary
1.2A Sort of Sorts
Analyzing and Sorting Graphs
F.IF.1F.IF.5
This lesson provides twenty-two different graphs (18 functions and 4 non-functions) for students to analyze and compare.
Questions asks students to sort the graphs into different groups based on their own rationale, and then students will identify the grouping rationale of others. Finally, they distinguish between graphs of functions and non-functions.
1.3
There Are Many Ways to Represent Functions
Recognize Algebraic and Graphical Representations of Functions
F.IF.5F.IF.9
A.REI.10F.IF.1F.IF.2
F.IF.7.a
This lesson provides opportunities for students to explore graphical behavior and the form of the equation for different functions.
Students will sort the 18 graphs of functions identified in the previous lesson according to specific graphical behaviors and use a graphing calculator to match an equation to each graph.
Questions then ask students to sort the graphs based on the form of the equations. This leads students to identifying one of five different functions: linear, exponential, quadratic, linear absolute value, and linear piecewise. Finally, students paste each graph with its corresponding equation into the appropriate graphic organizer and describe the graphical behavior of each function.
1.4Function Families for 200, Alex …
Recognizing Functions by Characteristics
F.IF.1F.IF.4
F.IF.7.aF.IF.9
F.LE.1.bF.LE.2
A.CED.2
This lesson revisits the eight scenarios presented in the first lesson of this chapter.
Questions ask students to complete a table by identifying the function family represented by the scenario and the attributes of the function with respect to graphical behavior.

Middle School Math Solution: Accelerated Grade 8 Table of Contents | 4
Accelerated Grade 8Table of Contents
Chapter 2: Graphs, Equations, and InequalitiesThis chapter reviews solving linear equations and inequalities with an emphasis towards connecting the numeric, graphic, and algebraic methods for solving linear functions. Students explore the advantages and limitations of using tables, functions, and graphs to solve problems. A graphical method for solving linear equations, which involves graphing the left and right side of a linear equation, is introduced. Upon student understanding of solving and graphing equations by hand, the chapter introduces the use of a graphing calculator. Finally, the graphical method for solving problems is extended to include non-linear equations and inequalities.
Standards: N.Q.1, N.Q.3, A.SSE.1.a, A.CED.3, A.CED.1, A.CED.2, A.REI.1, A.REI.3, A.REI.10, F.IF.2, F.IF.6, F.LE.1.b, F.LE.1.c
Lesson Title / Subtitle Standards Lesson Summary
2.1The Plane!
Modeling Linear Situations
A.REI.1A.REI.3A.REI.10A.CED.1A.CED.2
N.Q.1A.SSE.1.a
F.IF.2F.IF.6
This lesson explores the connections of linear functions represented in a table, as a graph, or in function notation.
Questions ask students to compare the contextual meaning of different parts of a linear function to the corresponding mathematical meanings. Students will solve linear functions using function notation and graphs. The concept of graphing both sides of an equation and interpreting the intersection point is introduced as a method to determine solutions to various problem situations.
2.2What Goes Up Must Come Down
Analyzing Linear Functions
A.REI.3A.CED.1A.CED.2
N.Q.1A.SSE.1.aA.REI.10N.Q.3F.IF.2F.IF.6
This lesson provides opportunities for students to explore the use of tables, graphs, and equations to determine solutions.
Questions ask students to consider how each representation is used to determine an exact value versus an approximate value. Once students have performed calculations by hand they explore the use of a graphing calculator. The lesson provides graphing calculator instructions to demonstrate how to use technology strategically in determining solutions using various methods.
2.3Scouting for Prizes!
Modeling Linear Inequalities
A.CED.1A.CED.2A.CED.3A.REI.3A.REI.10N.Q.3
This lesson explores how a negative rate affects solving an inequality.
Questions focus students to make connections between graphs on a coordinate plane and solutions represented on a number line.
2.4We're Shipping Out!
Solving and Graphing Compound Inequalities
A.CED.1A.CED.2A.REI.3
This lesson introduces the concept of writing, solving, and graphing compound inequalities.

Middle School Math Solution: Accelerated Grade 8 Table of Contents | 5
Accelerated Grade 8Table of ContentsLesson Title / Subtitle Standards Lesson Summary
2.5Play Ball!
Absolute Value Equations and Inequalities
A.CED.1A.CED.2A.CED.3A.REI.3A.REI.10
This lesson provides a review of absolute value as the foundation for solving linear absolute value equations. The lesson then extends the given problem situation to inequalities. Questions focus on the connections between solving linear absolute value inequalities to solving compound inequalities. Students will graph linear absolute value equations on a coordinate plane, use those graphs to answer questions, and then make connections to the algebraic solutions they determined when they solved compound inequalities.
2.6Choose Wisely!
Understanding Non-Linear Graphs and Inequalities
N.Q.1N.Q.2
A.CED.2A.CED.3A.REI.10
F.IF.2F.LE.1.bF.LE.1.c
This lesson provides opportunities for students to solve non-linear problems using technology. Several problem situations are presented and students will choose the correct function to represent each. Questions then guide students to complete a table of values and use a graphing calculator to determine solutions. As a culminating activity, students will describe the advantages and limitations of solving problems numerically, graphically, and algebraically with and without the use of technology.

Middle School Math Solution: Accelerated Grade 8 Table of Contents | 6
Accelerated Grade 8Table of Contents
Chapter 4: SequencesThis chapter introduces students to sequences, and then focuses student attention on arithmetic and geometric sequences. Students then use recursive and explicit formulas to determine subsequent terms of a sequence. The relationship between arithmetic sequences and linear functions and some geometric sequences and exponential functions is developed.
Standards: A.SSE.1.a, F.IF.1, F.IF.2, F.IF.3, F.IF.4, F.BF.1, F.BF.1.a, F.BF.2, F.LE.1.b, F.LE.1.c, F.LE.2, F.LE.5
Lesson Title / Subtitle Standards Lesson Summary
4.2The Password Is … Operations!
Arithmetic and Geometric Sequences
F.BF.1.aF.LE.2
F.LE.1.bF.LE.1.c
This lesson provides a sorting activity where students must generate the next terms for sixteen different sequences, and then sort these sequences based on common characteristics. Students then explore the definitions of arithmetic and geometric sequences. Questions ask students to re-sort the given sequences based on the type of sequence.
4.3The Power of Algebra Is a Curious Thing
Using Formulas to Determine Terms of a Sequence
F.BF.1.aF.BF.2
A.SSE.1.aF.LE.1.bF.LE.1.cF.LE.2
This lesson develops the explicit and then the recursive formulas for arithmetic and geometric sequences.
4.4
Thank Goodness Descartes Didn't Drink Some Warm Milk!
Graphs of Sequences
F.IF.1F.IF.4F.LE.2
This lesson provides the opportunity for students to analyze the graphical behavior of various sequences. Students will complete twelve graphic organizers using the sequences from lesson 4.2 and the corresponding graph for each. They will also write the explicit and recursive formulas that represent each sequence.
4.5Well, Maybe It Is a Function!
Sequences and Functions
F.IF.1 F.IF.2 F.IF.3 F.BF.1 F.BF.2 F.LE.1
F.LE.1.a F.LE.1.b F.LE.1.c F.LE.2 F.LE.5
This lesson develops the understanding that all arithmetic sequences are linear and that some geometric sequences are exponential. The connection that explicit formulas for arithmetic sequences can be rewritten as linear functions, and the explicit formulas for some geometric sequences can be rewritten as exponential function is presented. Questions provide students opportunities to show mastery and comprehension between functions and sequences.

Middle School Math Solution: Accelerated Grade 8 Table of Contents | 7
Accelerated Grade 8Table of Contents
Chapter 5: Exponential FunctionsThis chapter examines the graphical behavior of exponential functions, including intercepts, domain and range, intervals of increase or decrease, and asymptotes. Students also explore the transformations of exponential functions. The chapter then introduces students to the relationship between rational exponents and radical form. Students will learn the strategy to use common bases to solve simple exponential equations algebraically.
Standards: N.RN.1, N.RN.2, N.Q.2, A.SSE.1.a, A.SSE.1.b, A.CED.1, A.CED.2, A.REI.3, A.REI.10, A.REI.11, F.IF.3, F.IF.4, F.IF.6, F.IF.7.e, F.BF.1.a, F.BF.2, F.BF.3, F.LE.1.a, F.LE.1.b, F.LE.1.c, F.LE.2, F.LE.3, F.LE.5
Lesson Title / Subtitle Standards Lesson Summary
5.1Go for the Curve!
Comparing Linear and Exponential Functions
A.SSE.1.a A.SSE.1.b A.CED.1
F.IF.3 F.IF.6
F.IF.7.e F.BF.1.a F.BF.2
F.LE.1.a F.LE.1.b F.LE.1.c F.LE.2 F.LE.3 F.LE.5
This lesson continues development of the concept that arithmetic sequences can be represented as linear functions and that some geometric sequences can be represented as exponential functions. Two given different scenarios illustrate how simple interest and compound interest formulas are derived. Questions ask students to compare the average rates of change and graphical behavior for each.
5.2Downtown and Uptown
Graphs of Exponential Functions
A.SSE.1.a A.SSE.1.b A.CED.1 A.REI.11
F.IF.4 F.IF.7.e F.LE.5 F.LE.2
This lesson explores the graphical behavior of exponential functions including intercepts, asymptotes, domain and range, and intervals of increase and decrease. Questions lead students to conclude that when the common ratio is greater than 1, the exponential function is increasing; and when it is less than 1, the exponential function is decreasing.
5.3Let the Transformations Begin!
Translations off Linear and Exponential Functions
F.BF.3 A.REI.10
F.LE.2
This lesson focuses on the affects that horizontal and vertical translations have on linear and exponential functions. Questions ask students to consider the operations performed on a function in comparison to the operations performed on x, or the argument of the function.
5.4Take Some Time to Reflect
Reflections of Linear and Exponential Functions
F.IF.4 A.REI.10
F.LE.2
This lesson focuses on the affects horizontal and vertical reflections have on linear and exponential functions. Questions ask students to consider the operations that are performed on a function in comparison to operations performed on x, or the argument of the function.
5.5Radical! Because It's Cliché!
Properties of Rational Exponents
N.RN.1N.RN.2
This lesson introduces students to rational exponents. Questions ask students to rewrite radicals as expressions containing exponential numbers, and exponential numbers as expressions containing radicals.

Middle School Math Solution: Accelerated Grade 8 Table of Contents | 8
Accelerated Grade 8Table of ContentsLesson Title / Subtitle Standards Lesson Summary
5.6Checkmate!
Solving Exponential Functions
A.REI.3A.CED.1A.CED.2
N.Q.2A.REI.10A.REI.11N.RN.2F.LE.2
This lesson provides opportunities to write, graph, and solve exponential equations with and without technology.
The strategy to solve exponential equations using common bases is introduced.
Middle School Math Solution: Accelerated Grade 8 Table of Contents | 9
Accelerated Grade 8Table of Contents
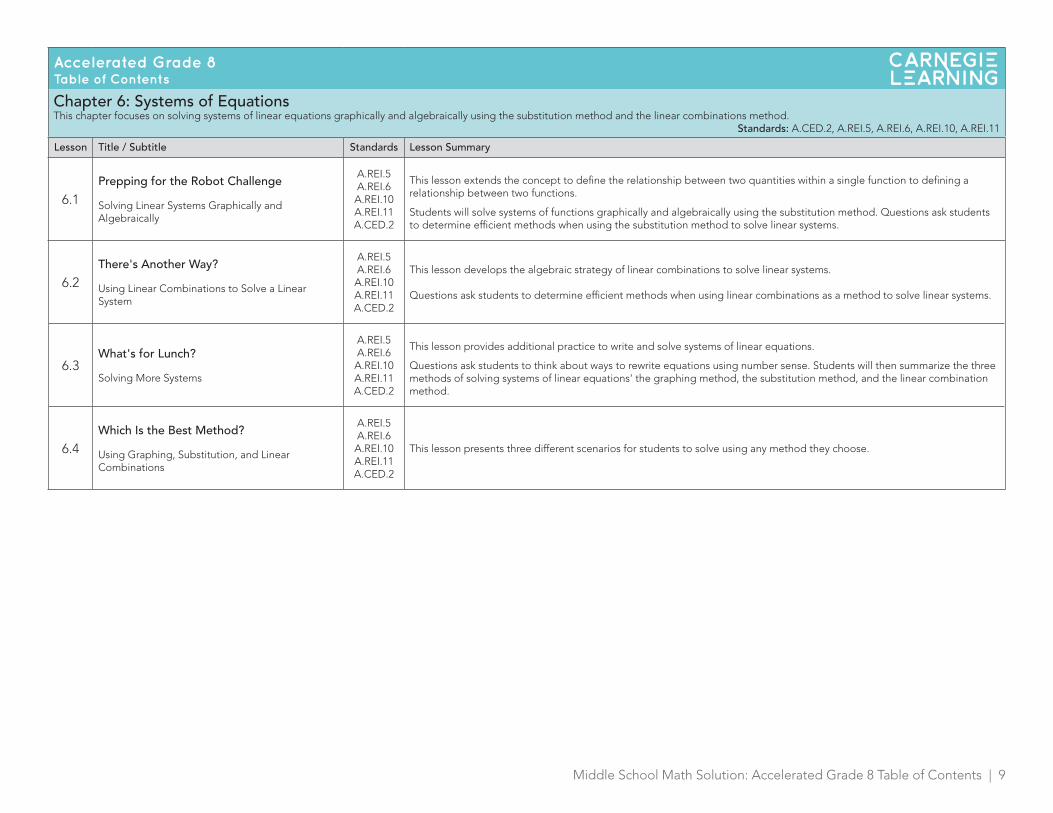
Chapter 6: Systems of EquationsThis chapter focuses on solving systems of linear equations graphically and algebraically using the substitution method and the linear combinations method.
Standards: A.CED.2, A.REI.5, A.REI.6, A.REI.10, A.REI.11
Lesson Title / Subtitle Standards Lesson Summary
6.1Prepping for the Robot Challenge
Solving Linear Systems Graphically and Algebraically
A.REI.5A.REI.6A.REI.10A.REI.11A.CED.2
This lesson extends the concept to define the relationship between two quantities within a single function to defining a relationship between two functions.
Students will solve systems of functions graphically and algebraically using the substitution method. Questions ask students to determine efficient methods when using the substitution method to solve linear systems.
6.2There's Another Way?
Using Linear Combinations to Solve a Linear System
A.REI.5A.REI.6A.REI.10A.REI.11A.CED.2
This lesson develops the algebraic strategy of linear combinations to solve linear systems.
Questions ask students to determine efficient methods when using linear combinations as a method to solve linear systems.
6.3What's for Lunch?
Solving More Systems
A.REI.5A.REI.6A.REI.10A.REI.11A.CED.2
This lesson provides additional practice to write and solve systems of linear equations.
Questions ask students to think about ways to rewrite equations using number sense. Students will then summarize the three methods of solving systems of linear equations' the graphing method, the substitution method, and the linear combination method.
6.4Which Is the Best Method?
Using Graphing, Substitution, and Linear Combinations
A.REI.5A.REI.6A.REI.10A.REI.11A.CED.2
This lesson presents three different scenarios for students to solve using any method they choose.

Middle School Math Solution: Accelerated Grade 8 Table of Contents | 10
Accelerated Grade 8Table of Contents
Chapter 7: Systems of InequalitiesThis chapter focuses on graphing linear inequalities in two variables and on solving systems of linear inequalities.
Standards: A.CED.3, A.REI.12
Lesson Title / Subtitle Standards Lesson Summary
7.1The Playoffs
Graphing Inequalities
A.REI.12A.CED.3
This lesson extends student comprehension of graphing linear equations to include graphing and solving linear inequalities.
Questions to ask students to use multiple representations to represent inequalities and their solutions.
7.2Working the System
Systems of Linear Inequalities
A.REI.12A.CED.3
This lesson instructs the solving systems of linear inequalities.
Questions focus student thinking toward the constraints defined by the system. Graphing calculator instructions are provided as another way to graph systems of linear inequalities.
7.3Our Biggest Sale of the Season!
Systems with More Than Two Linear Inequalities
A.REI.12A.CED.3
This lesson presents problem situations that extend linear systems to include four constraints.
Questions ask students to write the system of linear inequalities, label all the points of intersection of the boundary lines, and then determine the solution.
7.4Take It to the Max … or Min
Linear Programming
A.REI.12A.CED.3
This lesson introduces linear programming.
Students encounter problem situations with questions that ask students to write systems of linear inequalities, graph, and label all points of intersections. They then answer questions and write a function to represent profit.

Middle School Math Solution: Accelerated Grade 8 Table of Contents | 11
Accelerated Grade 8Table of Contents
Chapter 8: Analyzing Data Sets for One VariableThis chapter reviews data analysis of data sets with one variable. Students first learn to represent data graphically through dot plots, histograms, and box-and-whisker plots. The chapter leads students to determining measures of center for a data set, determining any outliers in a data set, and determining the interquartile range (IQR) and standard deviation for data sets.
Standards: S.ID.1, S.ID.2, S.ID.3
Lesson Title / Subtitle Standards Lesson Summary
8.1Start Your Day the Right Way
Graphically Representing DataS.ID.1
This lesson reviews various graphical displays of data sets; specifically dots plots, box-and-whisker plots and histograms. Students also learn about symmetric, skewed left, and skewed right data distribution.
Questions ask students to represent a data set from a table on a dot plots and on a box-and-whisker plot. They then describe the advantages and limitations of each type of graphical representation highlighted in the lesson.
8.2Which Measure Is Better?
Determining the Best Measure of Center for a Data Set
S.ID.1S.ID.2S.ID.3
This lesson provides instructions to determine the most appropriate measure of central tendency based upon a given data set.
Questions ask students to determine the mean and median of various data sets. They then use graphing calculator instructions to determine the mean and to construct a box-and-whisker plot.
8.3You Are Too Far Away!
Calculating IQR and Identifying Outliers
S.ID.1S.ID.2S.ID.3
This lesson reviews the interquartile range of a data set and provides instruction on how to determine outliers in a data set.
Questions ask students to compare two data sets and represent each data set graphically as box-and-whisker plots. They then determine the effects outliers have on the mean and median of a data set.
8.4Whose Scores Are Better?
Calculating and Interpreting Standard Deviation
S.ID.1S.ID.2S.ID.3
This lesson introduces standard deviation and normal distribution of data sets.
Questions ask students to determine the standard deviation of three data sets. They then compare the standard deviations in context of a problem situation. Finally, students learn how to graphically represent the standard deviation of two data sets.
8.5Putting the Pieces Together
Analyzing and Interpreting Data
S.ID.1S.ID.2S.ID.3
This lesson introduces stem-and-leaf plots and side-by-side stem-and-leaf plots. Then students analyze various data sets represented by various graphical displays.

Middle School Math Solution: Accelerated Grade 8 Table of Contents | 12
Accelerated Grade 8Table of Contents
Module 2, Topic 4: Patterns in Bivariate DataStudents investigate associations in bivariate data, both quantitative and categorical. They construct scatter plots and determine if scatter plots exhibit linear relationships and describe other patterns of association, including clustering, outliers, or a positive or negative association. Students informally fit lines of best fit, determine the equations of those lines, interpret the slopes and y-intercepts of the lines, and use the equations to make and judge the reasonableness of predictions about the data. Finally, students construct and interpret two-way frequency and relative frequency tables to describe possible associations between two categorical variables.
Standards: 8.SP.1, 8.SP.2, 8.SP.3, 8.SP.4
Lesson Title / Subtitle Standards Lesson Summary
1Pass the Squeeze
Analyzing Patterns in Scatter Plots8.SP.1
Students construct and analyze scatter plots of bivariate data to explore patterns in the data. They analyze scatter plots as they learn the terms bivariate data, explanatory variable, response variable, linear association, positive association, negative association, cluster, and outlier.
2Where Do You Buy Your Books?
Drawing Lines of Best Fit
8.SP.28.SP.3
Students analyze two scatter plots to show percent of book sales from bookstores and the internet for time from 2004 to 2010. They write an equation of the line of best fit for each scatter plot and draw it on their plot. Using their line of best fit, students predict the percent of book sales.
3Mia Is Growing Like a Weed
Analyzing Lines of Best Fit
8.SP.28.SP.3
Students create a scatter plot for age and height and a scatter plot for age and weight. They draw the line of best fit and determine the equation of the line of best fit for each scatter plot. Students then make predictions for height and for weight based on age using the equation of each line of best fit.
4The Stroop Test
Comparing Slopes and Intercepts of Data from Experiments
8.SP.3Students conduct the Stroop Test experiment, calculate the mean time for various matching and non-matching lists of words, and create scatter plots of the list length versus the amount of time. They then draw the line of best fit for each scatter plot and make predictions for the amount of time based on the list length using the equations of the lines of best fit.

Middle School Math Solution: Accelerated Grade 8 Table of Contents | 13
Accelerated Grade 8Table of Contents
Chapter 9: Correlation and ResidualsThis chapter introduces the method of least squares to determine a linear regression line of a data set. The chapter then progresses to provide opportunities to determine the correlation coefficient of a data set by both pencil-and paper and by using a graphing calculator. Then the chapter exposes students to residuals of a data set in which they will make determinations about which function type might be represent a data set. Finally, the chapter introduces students to causation and correlation.
Standards: S.ID.6.a, S.ID.6.c, S.ID.7, S.ID.8, S.ID.9
Lesson Title / Subtitle Standards Lesson Summary
9.1Like a Glove
Least Squares Regression
S.ID.6.aS.ID.6.cS.ID.7
The lesson introduces the concept of interpolation and extrapolation. The lesson then guides students to use the least squares method to determine the linear regression line of a data set.
9.2Gotta Keep It Correlatin'
Correlation
S.ID.6.aS.ID.6.cS.ID.7S.ID.8
This lesson reviews negative positive, and no association of a data set. The lesson then guides students through determining the correlation coefficient of a data set.
Questions ask students to determine the correlation coefficient for a data set using pencil-and-paper calculations and a graphing calculator.
9.3The Residual Effect
Creating Residual Plots
S.ID.6.aS.ID.6.bS.ID.7S.ID.8
This lesson introduces and defines residuals.
Questions ask students to determine the residuals of a data set by subtracting the actual values of data set from the predicted values from the regression equation.
9.4To Fit or Not to Fit? That Is the Question!
Using Residual Plots
S.ID.6.aS.ID.6.bS.ID.7S.ID.8
This lesson extends the concept of residuals by enabling students to create residual plots.
Questions direct students to construct residual plots using step by step graphing calculator instructions. Students then must determine whether a linear model might be a good fit for a data set based upon the residual plot.
9.5Who Are You? Who? Who?
Causation vs. CorrelationS.ID.9
This lesson introduces the concept of causation and correlation.
Questions ask students to determine whether the claimed result of an experiment is supported by given information. Students then will research web blogs, news agency websites that report correlational studies to identify possible confounding variables or common responses.

Middle School Math Solution: Accelerated Grade 8 Table of Contents | 14
Accelerated Grade 8Table of Contents
Chapter 10: Analyzing Data Sets for Two Categorical VariablesThis chapter introduces categorical data as opposed to numerical data students have encountered in the previous two chapters. Students learn how to organize data from a data table, determine the relative frequency distributions of a data set, determine the relative frequency conditional distribution, and finally to analyze categorical data to problem solve and make decisions.
Standards: S.ID.5
Lesson Title / Subtitle Standards Lesson Summary
10.1Could You Participate in Our Survey?
Interpreting Frequency DistributionsS.ID.5
This lesson introduces categorical data and enables students to explore frequency distributions of data sets. Questions ask students to organize data from a table into a two-way frequency table. Students learn and interpret the meanings of frequency distribution and joint frequency. Students then represent data as a bar graph or a double bar graph.
10.2It's So Hot Outside!
Relative Frequency DistributionS.ID.5
This lesson extends the concept of two-way frequency tables by introducing relative frequency marginal distributions. Questions ask students to determine the relative frequency distribution of a given data set. Students then must represent their data graphically.
10.3She Blinded Me with Science!
Relative Frequency Conditional DistributionS.ID.5
The lesson continues the instruction categorical data and other ways it can be represented; specifically by introducing relative frequency conditional distribution.
10.4Oh! Switch the Station!
Drawing Conclusions from DataS.ID.5
This lesson connects the previous three lesson concepts to guide students through data analysis and conclusions. Questions ask students to organize data from a data table, represent the data graphically, draw conclusions, and make decisions based upon the data.
Middle School Math Solution: Accelerated Grade 8 Table of Contents | 15
Accelerated Grade 8Table of Contents
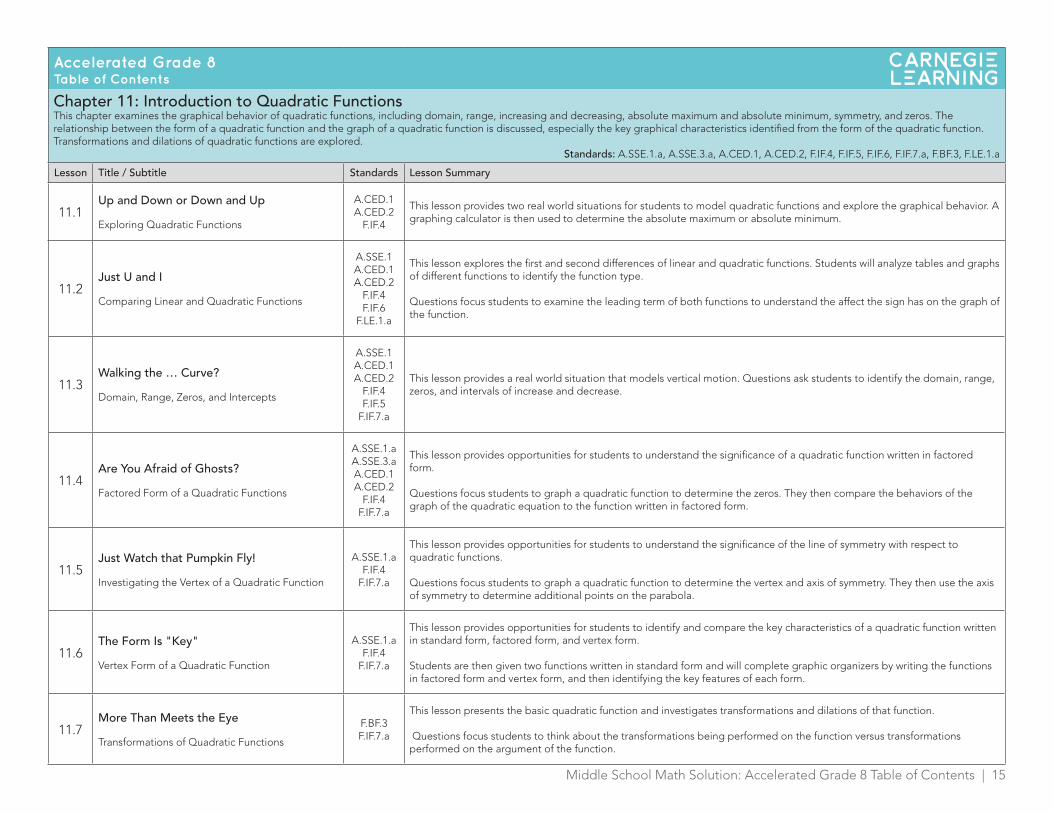
Chapter 11: Introduction to Quadratic FunctionsThis chapter examines the graphical behavior of quadratic functions, including domain, range, increasing and decreasing, absolute maximum and absolute minimum, symmetry, and zeros. The relationship between the form of a quadratic function and the graph of a quadratic function is discussed, especially the key graphical characteristics identified from the form of the quadratic function. Transformations and dilations of quadratic functions are explored.
Standards: A.SSE.1.a, A.SSE.3.a, A.CED.1, A.CED.2, F.IF.4, F.IF.5, F.IF.6, F.IF.7.a, F.BF.3, F.LE.1.a
Lesson Title / Subtitle Standards Lesson Summary
11.1Up and Down or Down and Up
Exploring Quadratic Functions
A.CED.1A.CED.2
F.IF.4
This lesson provides two real world situations for students to model quadratic functions and explore the graphical behavior. A graphing calculator is then used to determine the absolute maximum or absolute minimum.
11.2Just U and I
Comparing Linear and Quadratic Functions
A.SSE.1A.CED.1A.CED.2
F.IF.4F.IF.6
F.LE.1.a
This lesson explores the first and second differences of linear and quadratic functions. Students will analyze tables and graphs of different functions to identify the function type. Questions focus students to examine the leading term of both functions to understand the affect the sign has on the graph of the function.
11.3Walking the … Curve?
Domain, Range, Zeros, and Intercepts
A.SSE.1A.CED.1A.CED.2
F.IF.4F.IF.5
F.IF.7.a
This lesson provides a real world situation that models vertical motion. Questions ask students to identify the domain, range, zeros, and intervals of increase and decrease.
11.4Are You Afraid of Ghosts?
Factored Form of a Quadratic Functions
A.SSE.1.aA.SSE.3.aA.CED.1A.CED.2
F.IF.4F.IF.7.a
This lesson provides opportunities for students to understand the significance of a quadratic function written in factored form. Questions focus students to graph a quadratic function to determine the zeros. They then compare the behaviors of the graph of the quadratic equation to the function written in factored form.
11.5Just Watch that Pumpkin Fly!
Investigating the Vertex of a Quadratic Function
A.SSE.1.aF.IF.4
F.IF.7.a
This lesson provides opportunities for students to understand the significance of the line of symmetry with respect to quadratic functions. Questions focus students to graph a quadratic function to determine the vertex and axis of symmetry. They then use the axis of symmetry to determine additional points on the parabola.
11.6The Form Is "Key"
Vertex Form of a Quadratic Function
A.SSE.1.aF.IF.4
F.IF.7.a
This lesson provides opportunities for students to identify and compare the key characteristics of a quadratic function written in standard form, factored form, and vertex form. Students are then given two functions written in standard form and will complete graphic organizers by writing the functions in factored form and vertex form, and then identifying the key features of each form.
11.7More Than Meets the Eye
Transformations of Quadratic Functions
F.BF.3F.IF.7.a
This lesson presents the basic quadratic function and investigates transformations and dilations of that function. Questions focus students to think about the transformations being performed on the function versus transformations performed on the argument of the function.

Middle School Math Solution: Accelerated Grade 8 Table of Contents | 16
Accelerated Grade 8Table of Contents
Chapter 12: Polynomials and QuadraticsThis chapter introduces operations with polynomials, including factoring quadratic trinomials. Quadratic equations are solved graphically, by factoring, and by completing the square.
Standards: N.RN.2, A.SSE.1.a, A.SSE.2, A.SSE.3.a, A.SSE.3.b, A.APR.1, A.CED.1, A.CED.2, A.REI.4.b, F.BF.1.b
Lesson Title / Subtitle Standards Lesson Summary
12.1Controlling the Population
Adding and Subtracting Polynomials
A.SSE.1.aA.APR.1F.BF.1.bA.CED.2
This lesson introduces polynomials and uses a sorting activity for students to classify monomials, binomials, and trinomials. A problem situation presents a linear and a quadratic function. Questions ask students to model the sum of the functions using function notation, a graph, a table, and finally, using algebra.
12.2They're Multiplying—Like Polynomials!
Multiplying PolynomialsA.APR.1
This lesson introduces how to the multiply two binomials using algebra tiles, multiplication tables, and the Distributive Property. A graphing calculator is used to verify the product of the two polynomials. Questions then ask students to extend their understanding of multiplying two binomials to include multiplying a binomial by a trinomial.
12.3What Factored Into It?
Factoring Polynomials
A.SSE.3.aA.APR.1
This lesson focuses on writing quadratic expressions as products of factors. Students will use an area model, a multiplication table, and consider the factors of the leading coefficient and the constant term to rewrite expressions in factored form.
12.4Zeroing In
Solving Quadratics by Factoring
A.SSE.3.aA.REI.4.b
This lesson introduces the Zero Product Property as a strategy to calculate the roots of a quadratic equation. Questions focus students to make the connection between the solutions to a quadratic equation using factoring to the x-intercepts of the equation on the graph.
12.5What Makes You So Special?
Special Products
A.SSE.2A.SSE.3.a
This lesson explores the difference of two squares, perfect square trinomials, the difference of two cubes, and the sum of two cubes. Students will continue to practice solving quadratic equations and functions.
12.6Could It Be Groovy to Be a Square?
Approximating and Rewriting Radicals
N.RN.2A.CED.1A.REI.4.b
This lesson focuses on determining square roots and extracting perfect square roots from radical expressions. Questions then ask students to solve equations containing radical expressions.
12.7Another Method
Completing the Square
A.SSE.3.bA.REI.4.b
This lesson uses the knowledge of perfect square trinomials to construct a process to solve any quadratic equation that is not factorable. Questions ask students to geometrically complete a square, and then connect that skill to determining the roots of quadratic equations. Students then practice solving quadratic equations by completing the square. A worked example demonstrates how to rewrite a quadratic equation written in standard form to vertex form by completing the square.

Middle School Math Solution: Accelerated Grade 8 Table of Contents | 17
Accelerated Grade 8Table of Contents
Chapter 13: Solving Quadratic Equations and InequalitiesThis chapter introduces the quadratic formula and emphasizes choosing an appropriate method to solve quadratic equations. Quadratic inequalities are solved using a coordinate plane, and then an algebraic strategy is introduced. Systems of equations involving one or more quadratic equations are solved.
Standards: A.CED.1, A.CED.2, A.REI.4.a, A.REI.4.b, A.REI.7, F.IF.7.a
Lesson Title / Subtitle Standards Lesson Summary
13.1
Ladies and Gentlemen: Please Welcome the Quadratic Formula!
The Quadratic Formula
A.CED.1A.CED.2A.REI.4.aA.REI.4.b
This lesson introduces the Quadratic Formula as a strategy to solve any quadratic equation. Questions ask students to solve quadratic equations using the Quadratic Formula. They then analyze the discriminant to predict the number of real zeros of a quadratic function or the number of real roots of a quadratic equation.
13.2It's Watching and Tracking!
Using a Calculating-Based Ranger to Model Quadratic Motion
A.REI.4.bF.IF.7.a
This lesson provides an opportunity for students to use a calculator-based ranger to model the trajectory of a ball. Questions ask students to gather data, sketch a graph, determine a quadratic regression, and then analyze the coefficient of determination.
13.3They're a Lot More Than Just Sparklers!
Solving Quadratic Inequalities
A.CED.1A.CED.2A.REI.4.b
This lesson extends solving quadratic equations to include quadratic inequalities. Questions ask students to write a quadratic function to represent a problem situation. They then graph the quadratic function on a coordinate plane and consider different intervals that satisfy the quadratic inequality. An algebraic strategy for solving quadratic inequalities is then presented.
13.4You Must Have a System
Systems of Quadratic Equations
A.REI.7A.CED.1A.CED.2
This lesson extends the understanding of solving systems to include systems of quadratic equations. Questions ask students to solve systems algebraically and verify their solutions graphically.

Middle School Math Solution: Accelerated Grade 8 Table of Contents | 18
Accelerated Grade 8Table of Contents
Module 4, Topic 2: Pythagorean TheoremStudents investigate associations in bivariate data, both quantitative and categorical. They construct scatter plots and determine if scatter plots exhibit linear relationships and describe other patterns of association, including clustering, outliers, or a positive or negative association. Students informally fit lines of best fit, determine the equations of those lines, interpret the slopes and y-intercepts of the lines, and use the equations to make and judge the reasonableness of predictions about the data. Finally, students construct and interpret two-way frequency and relative frequency tables to describe possible associations between two categorical variables.
Standards: 8.EE.2, 8.G.6, 8.G.7, 8.G.8
Lesson Title / Subtitle Standards Lesson Summary
1The Right Triangle Connection
The Pythagorean Theorem
8.EE.28.G.68.G.7
Students learn about and prove the Pythagorean Theorem using area models. They practice using the Pythagorean Theorem to solve for unknown side lengths in mathematical and contextual problems.
2Can That Be Right?
The Converse of the Pythagorean Theorem
8.EE.28.G.68.G.7
Students begin by determining if triangles are right triangles by using a protractor, then they determine if three side lengths form a right triangle by whether or not the side lengths satisfy the Pythagorean Theorem. Students are given a definition of Pythagorean triple and complete tables composed of multiples of Pythagorean triples. Then they provide the rationale for a proof of the Converse of the Pythagorean Theorem. Finally, students use either the Pythagorean Theorem or the Converse of the Pythagorean Theorem to solve problems.
3Pythagoras Meets Descartes
Distances in a Coordinate System8.G.8
Students apply the Pythagorean Theorem to a map context on a grid. They calculate various distances of points aligned either horizontally or vertically using subtraction and aligned diagonally using the Pythagorean Theorem. Students then plot pairs of points on the coordinate plane and use the Pythagorean Theorem to determine the distance between the two given points.
4Catty Corner
Side Lengths in Two and Three Dimensions
8.EE.28.G.7
Students apply the Pythagorean Theorem to determine the lengths of the diagonals of a rectangle, square, trapezoid and isosceles trapezoid. They determine the areas of complex figures requiring the use of the Pythagorean Theorem. Students use the Pythagorean Theorem to determine the lengths of diagonals in three-dimensional rectangular prisms.

Middle School Math Solution: Accelerated Grade 8 Table of Contents | 19
Accelerated Grade 8Table of Contents
Chapter 14: Real Number SystemThis chapter begins by reviewing the real number system and then move to introducing the imaginary and ultimately the complex number system. Using the powers of exponents rules, students discover the necessity of the number i. This discovery leads to students exploring whether quadratic functions have one, two, or no real roots.
Standards: N.RN.1, N.RN.2, N.RN.3, N.CN.1, N.CN.7, A.REI.4.b
Lesson Title / Subtitle Standards Lesson Summary
14.1The Real Numbers … For Realsies!
The Numbers of the Real Number SystemN.RN.3
This lesson reviews real number system. Questions ask students to compare natural and whole numbers, and integers, rational, and irrational numbers by completing a Venn diagram.
14.2Getting Real, and Knowing How
Real Number PropertiesN.RN.3
This lesson introduces the concept of closure under an operation. Questions then lead students to simplify expressions and provide rationale for each step performed.
14.3Imagine the Possibilities
Imaginary and Complex Numbers
N.RN.1N.RN.2N.CN.1
This lesson introduces students to imaginary numbers. Questions ask students to use properties of exponent rules to discover the imaginary number i. Students then learn and interpret the complex number system.
14.4
It's Not Complex—Just Its Solutions Are Complex!
Solving Quadratics with Complex Solutions
A.REI.4.bN.CN.1N.CN.7
This lesson connects imaginary numbers to the concept of imaginary roots and imaginary zeros. Questions lead students to determine whether a quadratic function has one, two, or no real roots by examining the discriminant of the quadratic function.

Middle School Math Solution: Accelerated Grade 8 Table of Contents | 20
Accelerated Grade 8Table of Contents
Chapter 15: Other Functions and InversesThis chapter focuses on piecewise functions, absolute value functions, and step functions. Inverses of linear functions are introduced graphically, numerically, and algebraically, which is then extended to include non-linear functions.
Standards: A.CED.1, A.CED.4, F.IF.1, F.IF.2, F.IF.4, F.IF.5, F.IF.7, F.IF.7.b, F.BF.1.a, F.BF.4.a, F.BF.4.b
Lesson Title / Subtitle Standards Lesson Summary
15.1I Graph in Pieces
Linear Piecewise Functions
F.IF.4F.IF.5
F.IF.7.b
This lesson presents problem situations that can be modeled using linear piecewise functions. Students will write and graph piecewise functions. Questions then help students make a connection between a linear absolute value function and a piecewise function.
15.2Step By Step
Step Functions
F.IF.4F.IF.5
F.IF.7.b
This lesson presents problem situations that can be modeled using step functions. The greatest integer function and least integer function are introduced as special types of step functions. Graphing calculator instructions are included.
15.3The Inverse Undoes What a Function Does
Inverses of Linear Functions
A.CED.1A.CED.4
F.IF.1F.IF.2
F.BF.1.aF.BF.4.aF.BF.4.b
This lesson presents problem situations to introduce inverses of functions. Questions ask students to determine the inverse of a function using tables and algebra. They then determine the inverse of function can be determined graphically by reflecting the original function over the line y=x. Students then use the composition of functions to determine whether functions are inverses.
15.4Taking the Egg Plunge!
Inverses of Non-Linear Functions
A.CED.4F.IF.1F.IF.2F.IF.5F.IF.7
F.BF.4.a
This lesson extends the understanding of inverses to include non-linear functions. The term one-to-one function is introduced and questions explore whether linear, exponential, linear absolute value, and quadratic functions are always, sometimes, or never one-to-one.

Middle School Math Solution: Accelerated Grade 8 Table of Contents | 21
Accelerated Grade 8Table of Contents
Chapter 16: Mathematical ModelingThis chapter presents opportunities to model real-world data using linear, exponential, quadratic, and piecewise functions. The focus is on determining the appropriate function or functions for a given data set.
Standards: F.IF.4, F.IF.5, F.IF.7, F.BF.1, F.BF.4, F.LE.1, F.LE.2
Lesson Title / Subtitle Standards Lesson Summary
16.1People, Tea, and Carbon Dioxide
Modeling Using Exponential Functions
F.IF.4F.IF.5F.IF.7F.BF.1F.BF.4F.LE.1F.LE.2
This lesson presents problem situations that are best modeled by exponential functions. Questions ask students to use a graphing calculator to determine the regression equation and then use the function to make predictions about each situation.
16.2Stop! What Is Your Reaction?
Modeling Stopping Distances and Reaction Times
F.IF.4F.IF.5F.IF.7F.BF.1F.BF.4F.LE.1F.LE.2
This lesson focuses on choosing the best regression equation to model a problem situation. Questions ask students to consider a linear, exponential, and quadratic regression, and to analyze the correlation coefficients of each to determine best fit. Questions ask students to then consider the inverse of the function in regards to the problem situation.
16.3Modeling Data Helps Us Make Predictions
Using Quadratic Functions to Model Data
F.IF.4F.IF.5F.IF.7F.BF.1F.BF.4F.LE.1 F.LE.2
This lesson provides more practice in choosing the best regression function to model problem situations. Questions ask students to analyze the correlation coefficients to verify their choice. Questions also ask students to consider additional data values in terms of a problem situation. They will re-evaluate regression equations and correlation coefficients to determine if the function chosen originally is still the function that best fits the situation.
16.4BAC Is BAD News
Choosing a Function to Model BAC
F.IF.4F.IF.5F.IF.7F.BF.1F.BF.4F.LE.1F.LE.2
This lesson provides opportunities for students to determine the type of regression function that best fits a graph. Questions ask students to analyze the results and then write a report about their conclusions.
16.5
Cell Phone Batteries, Gas Prices, and Single Family Homes
Modeling with Piecewise Functions
F.IF.4F.IF.5F.IF.7F.BF.1F.LE.1F.LE.2
This lesson presents problem situations that can be modeled using linear and non-linear piecewise functions. Questions ask students to interpret the various parts of each piecewise function in terms of problem situations. Students then list the advantages and disadvantages of using piecewise functions instead of a single function to model data.