ac 2012 ar appendix a ex5
DESCRIPTION
MASTRANSCRIPT

Appendix A, Exhibit 5: BSBA Goals Assessed in Accounting based on Spring 2011 Data
Department: Accounting
Goal: BSBA-1-Accounting - Mastery of Business Knowledge: Each functional area (Accounting, Finance, Law, Management, Marketing and MIS) identifies the performance objectives of its respective discipline.
Section One – Learning Outcome and Numeric Result.
Learning OutcomesCourse(s)
Where Measured
Number Of
Students Measured
Number Of
Sections Measured
Number of StudentsAbove
Acceptable
Number of Students
Acceptable
Number of Students
BelowAcceptable`
1) Apply business research skills AC211 241 9 68 (28%) 137 (57%) 36 (15%)
_________________________________________________________________________
Section Two – FindingsThe financial statement analysis project is used to assess each student’s analytical skills, critical thinking and team-building skills. Each student was assigned to analyze the financial statements of a company. Each individual professor selected different companies so that students in different sections would not be working together and/or copying each other’s work. After calculating and interpreting the financial ratios, they were asked if they would invest and lend to the company they were analyzing. Each class was assigned five to six companies to analyze. The project included industry ratios provided by the professor.
Due to a misunderstanding, the accounting department had assumed that the BSBA data collection was being collected in the Fall Semester and the Major level data collection was being collected in the Spring semester. By the time the department became aware that the School wanted BSBA level data for Goal 1 for the Spring 2010 semester as well as for the Fall 2009 semester, some of the assignments that we use for assessment had already been completed, graded and returned to the students. We were unable to provide assess learning outcome one for the Spring 2010 semester.
As noted in the table above 85% of the students performed at an acceptable level or above in Spring 2011. The results were almost identical to what we found in In Fall 2009. Bothe Spring 2011 and Fall 2009 represented a slight improvement over the Spring 2009 semester results when, 81% of the students’ responses were acceptable or above. The students rated above acceptable were 28% in Spring 2011, up from 21% in Spring 2009.
Section Three – Analysis
Performance on this learning objective exceeds our goal of at least 75% performing at an acceptable level or better. The improved performance of Fall 2009 over Spring 2009 was sustained in Spring 2011, but performance has leveled off. We instituted a pre-semester co-
1

Appendix A, Exhibit 5: BSBA Goals Assessed in Accounting based on Spring 2011 Data
ordination meeting and also discussed course challenges and shared ideas. This did not result in measurable improvement on this learning goal over Fall 2009.
Section Four – Use of Results
The performance of students on this learning goal is stable at a reasonably high level, exceeding our target for this learning goal. We are currently devoting our improvement efforts to other learning goals where performance is poorer.
Action items:1. No new action items on this goal.
AppendixAssessment instrument: AC 211 Introduction to Financial Accounting Spring 2011
FINANCIAL REPORTING & ANALYSIS TEAM PROJECT(The individual portion of the project is used for assessing learning objective 1)
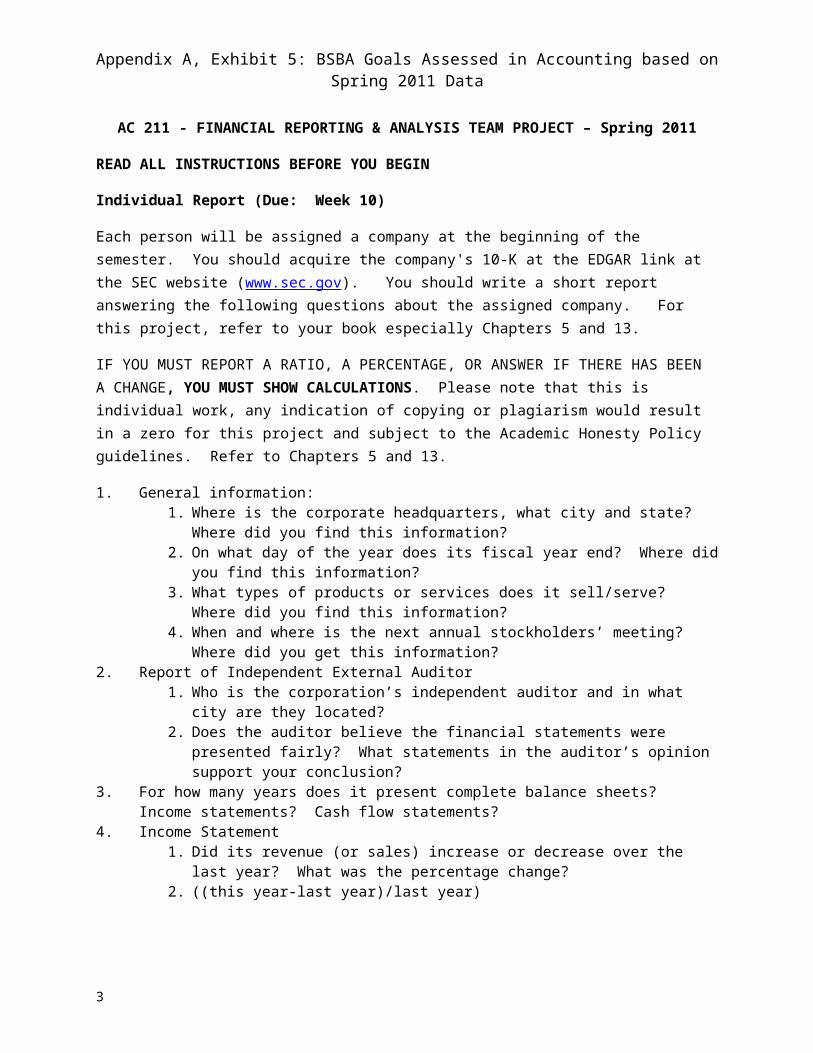
AC 211 - FINANCIAL REPORTING & ANALYSIS TEAM PROJECT – Spring 2011
READ ALL INSTRUCTIONS BEFORE YOU BEGIN
Individual Report (Due: Week 10)
Each person will be assigned a company at the beginning of the semester. You should acquire the company's 10-K at the EDGAR link at the SEC website (www.sec.gov). You should write a short report answering the following questions about the assigned company. For this project, refer to your book especially Chapters 5 and 13.
IF YOU MUST REPORT A RATIO, A PERCENTAGE, OR ANSWER IF THERE HAS BEEN A CHANGE, YOU MUST SHOW CALCULATIONS. Please note that this is individual work, any indication of copying or plagiarism would result in a zero for this project and subject to the Academic Honesty Policy guidelines. Refer to Chapters 5 and 13.
1. General information:1. Where is the corporate headquarters, what city and state? Where did you find this
information?2. On what day of the year does its fiscal year end? Where did you find this
information?3. What types of products or services does it sell/serve? Where did you find this
information?4. When and where is the next annual stockholders’ meeting? Where did you get this
information?2. Report of Independent External Auditor
1. Who is the corporation’s independent auditor and in what city are they located?2. Does the auditor believe the financial statements were presented fairly? What
statements in the auditor’s opinion support your conclusion?
2
Appendix A, Exhibit 5: BSBA Goals Assessed in Accounting based on Spring 2011 Data
3. For how many years does it present complete balance sheets? Income statements? Cash flow statements?
4. Income Statement1. Did its revenue (or sales) increase or decrease over the last year? What was the
percentage change?2. ((this year-last year)/last year)
3. Describe the company's revenue recognition policy. Where did you find this? What are you some factors that the company used in determining its revenue recognition policy?
4. Did its cost of goods sold increase or decrease over the last year? What was the percentage change? What are some ways to decrease cost of goods sold and what effect would this have on gross profit?
5. Compare the percentage change in revenue to the change in cost of goods sold. Are they similar? If they are not, does Management say anything about revenues and costs that might explain a difference? If they do, what reasons did management give for the change? (Look in Management Discussion & Analysis—MD&A)
6. Did its net income increase or decrease over the last year? What was the percentage change?
7. What method of depreciation does the company use? Where did you find this? What are some reasons that a Company would use one method of depreciation over another?
8. What amount is reported as depreciation expense for the current year? Where did you find this? How much cash was used to pay for this expense?
5. Balance Sheet1. Did its total assets increase or decrease over the last year? What was the
percentage change? What was the largest asset?2. Identify the balance sheet accounts that were most significant in explaining the
changes in total assets for the corporation? What events might explain the reasons for the changes in these accounts? Where did you get this information?
6. Cash Flow Statement1. Did the company have a cash inflow or outflow from operating activities? Which
statement did you use to find this? What item(s) caused it to be an inflow or outflow?
2. Did the company have a cash inflow or outflow from investing activities? What was the largest item in investing activities (either a use of cash or source of cash—report the largest)?
3. Did the company have a cash inflow or outflow from financing activities? What was the largest item in financing activities (either a use of cash or source of cash—report the largest)?
7. Profitability ratios1. Compute the asset turnover ratio and explain its meaning.2. Compute the net profit margin ratio for the latest three years and explain its
meaning. Do you see any trend?3. Compute the company's gross profit percentage for the latest three years; is there a
trend over the three years?4. Compute the return on equity (ROE) for the last three years. Explain its meaning. Is
there a trend indicated?5. In comparison to the previous year, has the corporation improved its ability to
generate a profit? Justify your answer with the ratios you calculated in b, c and d.
3

Appendix A, Exhibit 5: BSBA Goals Assessed in Accounting based on Spring 2011 Data
Does management offer an explanation for any changes or stability in the profitability of the corporation?
6. What is the basic earnings per share for continuing operations as it appears in the income statement for the past two years? Was the change in EPS a result of changes in the numerator or denominator?
8. Liquidity1. Compute the company's current ratio for the last two years and explain its meaning.
Is the current ratio adequate? 2. Compute the company’s receivable turnover for the last two years and explain its
meaning. 3. What amount of inventory does the company have at the end of the year? Did it
increase or decrease over the last year? Where did you find this? 4. Compute the inventory turnover ratio. How is a low or high turnover ratio
significant?5. What inventory costing method does the company use? Where did you find this?
9. Solvency ratios1. Compute the debt-to-asset ratio for the last two years and explain its meaning. How
did the debt position change over the last year? What were the sources of these changes? Would potential lenders prefer the debt to total assets ratio to be larger or smaller? Why?
2. Compute the times interest earned for the past two years and explain its meaning. 10. Would you invest in this company? Why or why not? Support your answer.11. Would you lend this company money? Why or why not? Support your answer.
Submit: the following on Week 10
1. Your answers to the all questions 1-11. Label and number the answers to the questions. 2. A copy of the four financial statements (do not include the notes).3. Just staple your project, do not put in a folder. Please note:
1. Make two copies of your report, one to be handed in to the professor, the second to be used in the Team Project. The Individual report will not be returned to you.
2. Late projects will not be accepted. To be assigned to a group, you must submit your project on the due date.
Team Project: (Due: Week 14)
After you submit your Individual Report, you will be assigned to a group. Each member of the group would have worked on a different company for their individual report.
1. Prepare a table with columns used for the companies (latest year) and industry, and rows for each of the following items you calculated:
4a Percentage change in revenues
4c Percentage change in cost of goods sold
4e Percentage change in income
4

Appendix A, Exhibit 5: BSBA Goals Assessed in Accounting based on Spring 2011 Data
5a Percentage change in assets
7a Asset turnover
7b Net profit margin
7c Gross profit percentage
7d Return on equity
8a Current ratio
8b Receivable turnover
8c Inventory turnover
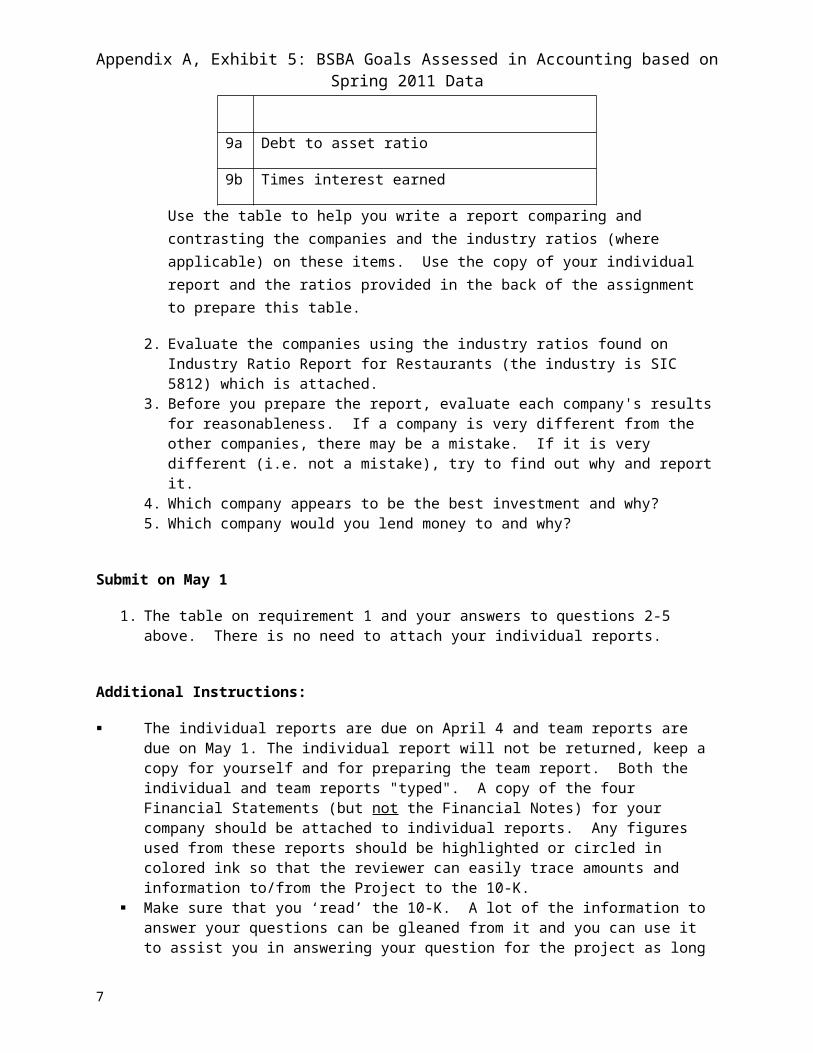
9a Debt to asset ratio
9b Times interest earned
Use the table to help you write a report comparing and contrasting the companies and the industry ratios (where applicable) on these items. Use the copy of your individual report and the ratios provided in the back of the assignment to prepare this table.
2. Evaluate the companies using the industry ratios found on Industry Ratio Report for Restaurants (the industry is SIC 5812) which is attached.
3. Before you prepare the report, evaluate each company's results for reasonableness. If a company is very different from the other companies, there may be a mistake. If it is very different (i.e. not a mistake), try to find out why and report it.
4. Which company appears to be the best investment and why? 5. Which company would you lend money to and why?
Submit on May 1
1. The table on requirement 1 and your answers to questions 2-5 above. There is no need to attach your individual reports.
Additional Instructions:
The individual reports are due on April 4 and team reports are due on May 1. The individual report will not be returned, keep a copy for yourself and for preparing the team report. Both the individual and team reports "typed". A copy of the four Financial Statements (but not the Financial Notes) for your company should be attached to individual reports. Any figures used from these reports should be highlighted or circled in colored ink so that the reviewer can easily trace amounts and information to/from the Project to the 10-K.
5

Appendix A, Exhibit 5: BSBA Goals Assessed in Accounting based on Spring 2011 Data
Make sure that you ‘read’ the 10-K. A lot of the information to answer your questions can be gleaned from it and you can use it to assist you in answering your question for the project as long as you cite it properly. If you attempt to hunt and peck for the answers (or use “Ctrl F”) and not use the information presented in the 10-K, such as management’s discussion and analysis, your project will be adversely affected.
Any ideas, paraphrasing or quoting needs to be cited and footnoted!! Using thoughts, words or phrases that are not your own without citing the proper source is plagiarism.
Individual reports count 70% and the team report 30% toward each student’s overall grade for the project.
Each student will evaluate his/her team member contribution to the project and must be submitted with the group project on the due date. The professor may use this evaluation to reduce the team member's "team" grade.
Use the Form 10-K from the latest year (should have been submitted in 2007 or 2008). Please use properly constructed sentences, grammar (i.e. spelling, punctuation and use of $
signs), and logical reasoning. Do not use circular reasoning. Make sure that you answer the questions as to "why" the numbers have changed. While it is ok to define something, please do not think that is an answer. Put the time, thought and effort into answering the questions. If you go for the minimum answer, you grade will reflect the minimum effort. Make sure that you have your team members read your project as sometimes you will not see something obvious as you are the author.
Presentation does count.
AC 211 Assessment Rubric: Demonstrated Business Research Skills
Above Acceptable: Research exceeded requirements; all of the “Acceptable” criteria accomplished; researched additional information about the company or industry.
Acceptable: Research met requirements; 10-K retrieved; financial statements utilized for most of the calculations; MD&A utilized and cited; footnotes cited; audit report date provided.
Below Acceptable: Research did not meet requirements; financial summaries (rather than financial statements) used for significant amount of the data; MD&A not utilized nor cited; footnotes rarely cited, if at all.
6
Appendix A, Exhibit 5: BSBA Goals Assessed in Accounting based on Spring 2011 Data
Department: Accounting
Goal: BSBA-1-Accounting - Mastery of Business Knowledge: Each functional area (Accounting, Finance, Law, Management, Marketing and MIS) identifies the performance objectives of its respective discipline.
Section One – Learning Outcome and Numeric Result.
Learning OutcomesCourse(s)
Where Measured
Number Of
Students Measured
Number Of
Sections Measured
Number of StudentsAbove
Acceptable
Number of Students
Acceptable
Number of Students
BelowAcceptable`
2) Apply proper accounting standards and proper cost accounting concepts to solve problems
AC 211AC 212
218168
97
46 (21%)25 (15%)
83 (38%)93 (55%)
89 (41%)50 (30%)
______________________________________________________________________________Section Two – Findings
All nine sections of AC 211 (Introduction to Financial Accounting) and seven sections of AC 212 (Introduction to Managerial Accounting) were required to include a common (to the respective courses) set of twenty multiple-choice questions as part of their final examination. These questions were weighted 30-40% of each instructor’s final examination.
The median score for AC 211 was 13, and only 37% of the students achieved an acceptable score (at least of 14 questions answered correctly) or better. This is well below the goal of 80% of students achieving an acceptable or better score, and a decrease from Spring 2010, when 41% of students in a smaller sample were above acceptable.
The median score for AC 212 was 13, and only 70% of the students achieved an acceptable score (at least of 12 questions answered correctly) or better. The median score is virtually unchanged from Spring 2010 and well below the goal of 80% of students achieving an acceptable or better score.
Section Three – Analysis
The median score for AC 211 was 13 out of the 20 questions answered correctly, one lower than in Spring 2009. Two revisions were made to the test in Spring 2010. Two easy questions answered correctly by nearly every student were replaced by questions that required a better understanding of the course material. There was a misunderstanding about gathering data for AC 211 in Spring 2010. Initially it was thought that data would be collected in the Fall semester only for AC 211 and AC 212. When it was discovered that the School of Business wanted data for the Spring Semester as well, a lack of cooperation from some AC 211 instructors resulted in data being gathered in only four of nine course sections. Data were collected for all sections in Spring 2009 and Spring 2011. The distribution of student scores for AC 211 is shown in the
7

Appendix A, Exhibit 5: BSBA Goals Assessed in Accounting based on Spring 2011 Data
table below:AC 211: Introduction to Financial Accounting Percentage of Total Students
Spring 2010
Fall2010
Spring 2011
Excellent (90% or more of the questions answered correctly)
7% 5% 7%
Good (80-89% of the questions answered correctly) 9% 12% 14%Acceptable (70-79% of the questions answered correctly) 25% 21% 16%Marginally acceptable (60-69% of the questions answered correctly)
*22% 29% 22%
Unacceptable (59% and below of the questions answered correctly)
*37% 33% 41%
*based on an estimated 22% - 20% breakdown of the 42% of students scoring 50-69%.
The data shows more students were able to improve their performance at the high end, but the overall number of students achieving an acceptable level of performance dropped by 4%. The coordinating meetings at the beginning of each semester and the sharing of active learning exercises and techniques have not resulted in an overall improvement in performance from Spring 2010 to Spring 2011.
For AC 212, the median score was 13 out of the 20 questions answered correctly, one better than in Spring 2009. The distribution of student scores for AC 211 is shown in the table below:
AC 212: Introduction to Managerial Accounting Percentage of Total StudentsSpring2010
Fall 2010
Spring 2011
Above Expectations(80% or more of the questions answered correctly)
19% 18% 15%
Meeting Expectations(60-89% of the questions answered correctly)
53% 46% 55%
Below Expectations(59% or less of the questions answered correctly)
28% 36% 30%
Forty-four percent of the students achieved an acceptable score or better. The increased performance achieved in 2010 was sustained, but the coordinating meetings at the beginning of each semester and the sharing of active learning exercises and techniques have not resulted in an overall improvement in performance from Spring 2010 to Spring 2011.
The students’ responses to each question were also analyzed. The students were assessed in the following areas:
Cost management (Questions 1,2,5,6 & 9-12) 73% correct responses versus 76% in Spring 2009. Students performed much better on the job-costing question, 78% to 9%. Student performance on a conceptual question the difference between financial and managerial accounting improved to 76% from 51%. The poorest performance was 54% on a computational question on cost behavior that had been answered correctly by 63% of
8

Appendix A, Exhibit 5: BSBA Goals Assessed in Accounting based on Spring 2011 Data
students in Spring 2010.
Decision analysis (Questions 7,8,17 & 18) 50% correct responses, down from 51% in Spring 2009. As in Spring 2010, students did much better using the cost-volume-profit model than using relevant cost analysis. However there was a 75 decline in performance on a conceptual question on CVP (down to 67% from 74%) while students performed better on the relevant cost analysis computation (13% versus 7%). This was still by far the lowest performance on any question. Some of this may be the wording of the problem in the compressed time frame of a comprehensive examination, where the student may have only a minute or two to devote to this question.
Financial reporting (Questions 3,4,19 & 20). 56% correct responses compared to 60% in Spring 2010. Only 48% of students could correctly compute cost of goods manufactured, down from 55% in Spring 2010, and their response to a conceptual reporting question was down to 58% from 69%. The students did very well on a conceptual question on cash flows, but they had a great deal of trouble applying the concept. Only 25% (down from 30% in 2010) were able to correctly determine cash flow from operations.
Budgeting (Questions 13 & 14). 48% correct responses, essentially unchanged from 47% in Spring 2010. Only 22% of students correctly computed budgeted purchases, down slightly from the 25% in Spring 2010. This was very disappointing given the amount of time we spend on budgeting. Students are not moving very well from creating budgeting spreadsheets to creating the same computations by hand. 74% correctly answered a question on budgetary slack, down from 77% in spring 2010.
Performance measurement (Questions 15 & 16). 82% correct responses compared to 85% in Spring 2009.
Computational questions - applying concepts to solve problems (Questions 4,6,7,10,12, 14,18 & 20). 44% correct responses compared to 48% in Spring 2010. Not surprisingly, students are having more difficulty applying concepts in computational problems than they are in remembering and identifying basic concepts.
We are not satisfied that the results of twenty multiple-choice questions is a valid indicator of student knowledge. Our AC 211 team was more inclined to stay with the multiple-choice questions, and they believe that some of the poor performance is due to misreading or misunderstanding the questions. They note that the majority of the CPA and CMA exams are multiple-choice questions, and introductory students who aspire to careers in accounting need to be prepared to be successful on those tests.
Our AC 212 team is seeking alternative means to assess students’ ability to apply proper accounting concepts to solve problems. We also noted that many students have difficulty moving from concept to application and at least some students seem to have difficulty moving from working with spreadsheets to performing computations by hand.
9

Appendix A, Exhibit 5: BSBA Goals Assessed in Accounting based on Spring 2011 Data
Section Four – Use of Results
While results improved for both AC 211 and AC 212, there is still a long way to go. AC 211 performance declined, in part due to a more difficult question set, particularly for AC 212.
We need to get students to be more successful in applying concepts to solve problems. In AC 211, the team wants to retain the 20 multiple-choice question format for assessment for the time being, but they plan to work on improving performance in the following two ways:
1. Review the questions used to ensure that they cover understanding and application of core concepts, and that the questions are not misleading. We will take advantage of the scanner purchased by the school of business that provides more detailed item analysis of student responses than was previously available.
2. Work to improve student’s ability to understand and analyze the content of the questions.
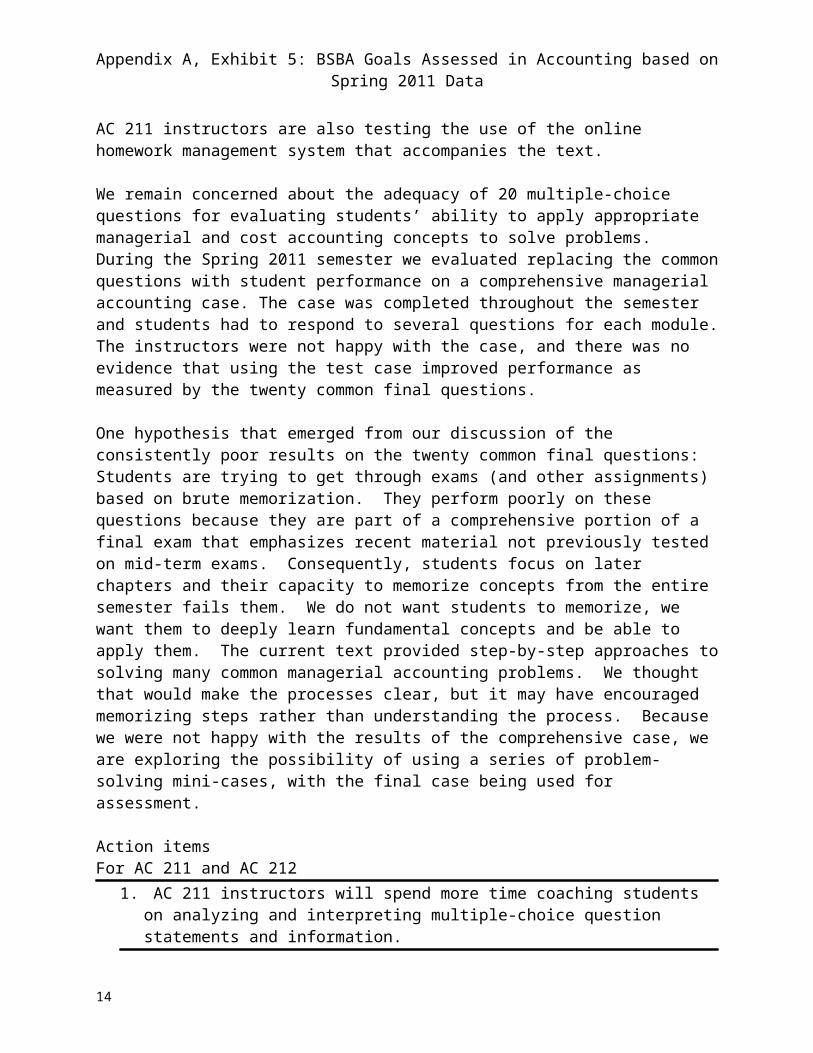
AC 211 instructors are also testing the use of the online homework management system that accompanies the text.
We remain concerned about the adequacy of 20 multiple-choice questions for evaluating students’ ability to apply appropriate managerial and cost accounting concepts to solve problems. During the Spring 2011 semester we evaluated replacing the common questions with student performance on a comprehensive managerial accounting case. The case was completed throughout the semester and students had to respond to several questions for each module. The instructors were not happy with the case, and there was no evidence that using the test case improved performance as measured by the twenty common final questions.
One hypothesis that emerged from our discussion of the consistently poor results on the twenty common final questions: Students are trying to get through exams (and other assignments) based on brute memorization. They perform poorly on these questions because they are part of a comprehensive portion of a final exam that emphasizes recent material not previously tested on mid-term exams. Consequently, students focus on later chapters and their capacity to memorize concepts from the entire semester fails them. We do not want students to memorize, we want them to deeply learn fundamental concepts and be able to apply them. The current text provided step-by-step approaches to solving many common managerial accounting problems. We thought that would make the processes clear, but it may have encouraged memorizing steps rather than understanding the process. Because we were not happy with the results of the comprehensive case, we are exploring the possibility of using a series of problem-solving mini-cases, with the final case being used for assessment.
Action itemsFor AC 211 and AC 212
1. AC 211 instructors will spend more time coaching students on analyzing and
10

Appendix A, Exhibit 5: BSBA Goals Assessed in Accounting based on Spring 2011 Data
interpreting multiple-choice question statements and information.2. AC 211 instructors will conduct an item analysis of the common twenty multiple-choice
questions, reviewing them for adequacy of covering the core concepts and checking for misleading wording or other problems based on Fall 2011 semester student results.
3. AC 212 instructors will change the text. The new text includes an online homework manager as well as a LearnSmart practice tool that adjusts the difficulty of questions based on student responses.
4. AC 212 instructors will develop a series of four to six mini-cases requiring students to analyze a managerial problem and write a memorandum summarizing their analysis and making a recommendation.
Appendix
AC 211 Question Set.1. When the future benefits of existing assets are used up in the ordinary course of business:
A) a loss is recorded.B) a credit to a liability is recorded.C) a debit to assets is recorded.D) an expense is recorded.
2. The separate entity assumption means:A) each separate owner's finances must be revealed in the financial statements.B) each separate entity that has a claim on a company's assets must be shown in the
financial statements.C) a company's financial statements reflect only the business activities of that company.D) All of these.
3. On July 1, 2005, Icespresso Inc. signed a two-year $8,000 note receivable with 9 percent interest. At its due date, July 1, 2007, the principal and interest will be received in full. Interest revenue should be reported on Icepresso's income statement for the year ended December 31, 2005, in the amount of:A) $420.B) $1,440.C) $360.D) $720.
4. A company's balance sheet contained the following information:
Assuming Notes Payable is the only other item on the balance sheet, Notes Payable must equal toA) $72,000.B) $200,000.C) $344,000.D) $8,000.
11

Appendix A, Exhibit 5: BSBA Goals Assessed in Accounting based on Spring 2011 Data
5. If an expense has been incurred but will be paid later, then:A) an asset account is decreased or eliminated and an expense is recorded.B) a revenue and an expense are recorded.C) a liability account is created or increased and an expense is recorded.D) nothing is recorded on the financial statements.
6. The primary goals of inventory management include:A) minimizing the costs associated with maintaining inventories.B) maintaining a sufficient quantity of inventory to keep customers satisfied.C) maintaining sufficient quality of inventory to keep customers satisfied.D) all of these.
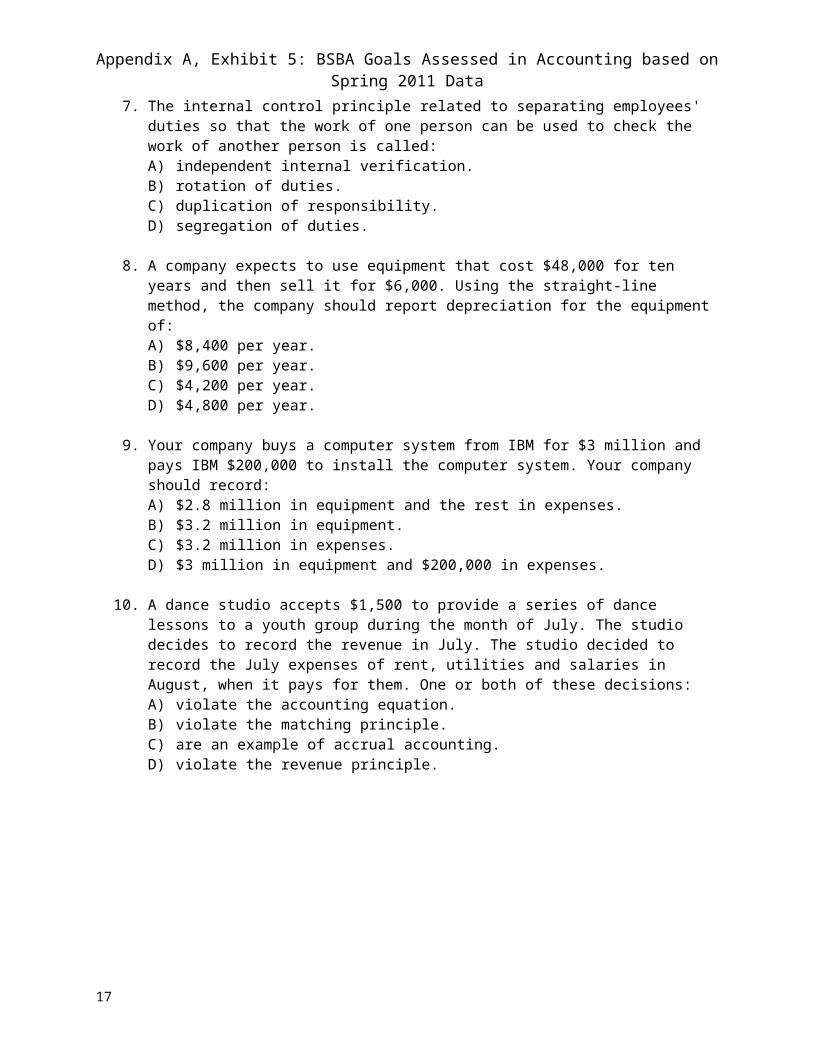
7. The internal control principle related to separating employees' duties so that the work of one person can be used to check the work of another person is called:A) independent internal verification.B) rotation of duties.C) duplication of responsibility.D) segregation of duties.
8. A company expects to use equipment that cost $48,000 for ten years and then sell it for $6,000. Using the straight-line method, the company should report depreciation for the equipment of:A) $8,400 per year.B) $9,600 per year.C) $4,200 per year.D) $4,800 per year.
9. Your company buys a computer system from IBM for $3 million and pays IBM $200,000 to install the computer system. Your company should record:A) $2.8 million in equipment and the rest in expenses.B) $3.2 million in equipment.C) $3.2 million in expenses.D) $3 million in equipment and $200,000 in expenses.
10. A dance studio accepts $1,500 to provide a series of dance lessons to a youth group during the month of July. The studio decides to record the revenue in July. The studio decided to record the July expenses of rent, utilities and salaries in August, when it pays for them. One or both of these decisions:A) violate the accounting equation.B) violate the matching principle.C) are an example of accrual accounting.D) violate the revenue principle.
12

Appendix A, Exhibit 5: BSBA Goals Assessed in Accounting based on Spring 2011 Data
11. All other things equal, in which of the following cases would an analyst rank the company most favorably?A) The company has the lowest debt-to-assets ratio in the industry as well as the lowest
asset turnover ratio while its profit margin is the highest.B) The company has the lowest debt-to-assets ratio in the industry as well as the highest
profit margin and asset turnover ratio.C) The company has the highest debt-to-assets ratio in the industry as well as the highest
profit margin while its asset turnover ratio is the lowest.D) The company has the highest debt-to-assets ratio in the industry as well as the highest
profit margin and asset turnover ratio.
12. Over a two-year period, Coca-Cola's gross profit percentage went from 70.4% to 69.7%. Which of the following could have been the cause this change?A) Increased competition from Pepsi.B) Reduced selling prices.C) Rising product cost as a percentage of sales.D) All of these may have caused the change.
13. A company files a Form 10-K with the SEC to submit its:A) report of current events of financial importance.B) press releases.C) quarterly report.D) annual report.
14. The LIFO inventory costing method assumes that the cost of the units most recently purchased are:A) not assigned to cost of goods sold or ending inventory.B) the first to be assigned to cost of goods sold.C) the last to be assigned to cost of goods sold.D) the first to be assigned to ending inventory.
15. Cinno Company reported net income of $20,000 for the year ended December 31, 2005. During the year, inventories decreased by $7,000, accounts payable decreased by $8,000, depreciation expense was $10,000, and accounts receivable increased by $6,500. Net cash provided by operations in 2005, computed using the indirect method, was:A) $22,500.B) $38,500.C) $51,500.D) $10,500.
16. Cash flows from investing activities include cash:A) inflows from the sale of long-term investments.B) cash inflows from the sale of a company's own stock to its stockholders.C) outflows from the sale of long-term investments.D) inflows and outflows reflecting revenues and expenses.
13
Appendix A, Exhibit 5: BSBA Goals Assessed in Accounting based on Spring 2011 Data
17. If XYZ Company had $12 million in revenue and net income of $3 million then its:A) assets must have been $3 million.B) expenses must have been $15 million.C) expenses must have been $9 million.D) assets must have been $12 million.
18. Which of the following would a company be most likely to overstate if the company was trying to mislead potential external investors or creditors?A) Salaries Expense.B) Accounts Receivable.C) Accounts Payable.D) Notes Payable.
19. A corporate charter specifies that the company may sell up to 20 million shares of stock. The company sells 12 million shares to investors and later buys back 3 million shares. The current number of outstanding shares after these transactions have been accounted for is:A) 9 million shares.B) 8 million shares.C) 20 million shares.D) 10 million shares.
20. On average, 5% of total accounts receivable has been uncollectible in the past. At the end of the year, balance of accounts receivable is $100,000 and the allowance for doubtful accounts has a credit balance of $500. Credit sales during the year were $150,000. Using the aging of accounts receivable method, the estimated bad debt expense would be:A) $5,500.B) indeterminable; the aging of accounts receivable method cannot be used, because,
based on this information, the percentage of credit sales method should be used.C) $5,000.D) $4,500.
AC 212 Question set
1. Management accounting
a. provides objective financial information
b. must adhere to GAAP
c. has no mandatory rules
d. none of the other statements are true
2. Which of the following is not an objective of Management accounting?
a. To prepare external reports for investors, creditors, government agencies, and other outside users
b. To provide information for costing of services, products, and other objects of interest to management.
14

Appendix A, Exhibit 5: BSBA Goals Assessed in Accounting based on Spring 2011 Data
c. To provide information for planning, controlling, evaluating and continuous improvement.
d. To provide information for decision-making.3. Product costs
a. are inventoriable costs.
b. are manufacturing costs.
c. include direct materials, direct labor, and overhead.
d. are all of these.
4. In July, Econo Company purchased raw materials costing $21,000 and incurred direct labor cost of $18,000. Overhead totaled $32,000 for the month. Information on inventories was as follows:
July 1 July 31
Raw Materials $ 6,200 $ 7,100
Work in Process $ 700 $ 1,200
Finished Goods $ 3,300 $ 2,700
What was the amount of Cost of Goods Sold for July for Econo Company?
a. $69,600
b. $70,200
c. $71,100
d. $71,300
5. Variable costs within the relevant range
a. stay constant on a per unit basis as output changes
b. increase in total as output increases
c. decrease in total as output decreases
d. answers a, b, and c are all correct
6. Maxwell Company makes treadmills. The company controller wants to calculate the fixed and variable costs associated with the janitorial costs incurred in the factory. Data for the past four months were collected.
Month Lease cost Machine hours
September $ 11,000 575
October 11,400 610
November 10,200 510
December 10,725 550
15

Appendix A, Exhibit 5: BSBA Goals Assessed in Accounting based on Spring 2011 Data
Using the high-low method, what would Maxwell Company’s estimated total janitorial cost be at a level of 625 machine hours?
a. $11,580
b. $ 7,500
c. $ 4,080
d. $ 6,120
7. Paney Company makes calendars. Information on cost per unit is as follows:
Direct materials $1.50
Direct labor 1.20
Variable manufacturing overhead
0.90
Variable marketing expense 0.40During 2009 fixed marketing expense totaled $13,000 and fixed manufacturing overhead expense totaled $35,000. The selling price was $10 per calendar. How many calendars did Paney Company have to sell to breakeven during 2009?
a. 2,167
b. 5,833
c. 8,000
d. 12,000
8. Assume in 2010, the contribution margin per calendar decreases for Paney Company (and items that do not affect the contribution margin remain unchanged from 2009). Compared to 2009, the break-even point in calendars sold for Paney Company in 2010 will …
a. be higher (more calendars will have to be sold in 2010 to breakeven).
b. be lower (fewer calendars will have to be sold in 2010 to breakeven).
c. be unchanged (the same number of calendars will have to be sold in 2010 as in 2009 to breakeven).
d. be a number that cannot be determined from the information given
9. The predetermined overhead rate is calculated by:
a. Estimated annual overhead/Estimated manufacturing cost
b. Estimated annual overhead /Estimated annual activity level
16
Appendix A, Exhibit 5: BSBA Goals Assessed in Accounting based on Spring 2011 Data
c. Estimated annual overhead/Actual Annual activity level
d. Actual annual overhead/Actual annual activity level
10.Stutz, Inc. designs and builds basketball gymnasiums. Each gymnasium is custom-built to individual customer’s specifications. Stutz uses job-order costing to keep track of its costs. In February it worked on three jobs. Data for these jobs are as follows: Job 175 Job 178 Job 179 Balance 2/1 $ 13,790 $ 0 $ 0Direct Materials 16,200 8,500 30,500Direct Labor Cost 23,300 7,600 45,000Machine Hours 400 300 2,000
Overhead is applied to jobs at the rate of $25 per machine hour. By February 28, Job 178 is the only one unfinished. The balance of Finished Goods on February 1 is $94,000 (consisting of Job 177). Jobs 175, and 179 are sold during February. Calculate the balance in Work-in-Process Inventory on February 28.
a. $23,600
b. $16,100
c. $212,390
d. $0
11.Using only unit-based activity drivers to assign non-unit-related overhead costs can cause:
a. efficiency
b. product diversity
c. activity sharing
d. distorted product costs
12.Producing 10,000 cell phones requires $300,000 of prime costs, uses 2,000 machine hours, and takes 1,200 setup hours. The activity rates are $40 per machine hour and $100 per setup hour. Using activity-based costing, what is the total production cost per unit for the cell phones?
a. $ 40
b. $ 50
c. $ 60
d. $ 100
13._______ occurs when a manager deliberately underestimates revenues or overestimates costs.
a. Goal congruence
17

Appendix A, Exhibit 5: BSBA Goals Assessed in Accounting based on Spring 2011 Data
b. Pseudoparticipation
c. Budgetary slack
d. Setting standards too high
14. Gentry Company produces speaker systems for trucks. Estimated sales (in units) in January are 20,000; in February 25,000; and in March 22,000. Each unit is priced at $45. Gentry wants to have 25% of the estimated unit sales for the month on hand in inventory at the beginning of each month. That requirement was met on January 1 with 5,000 speaker systems in beginning inventory.
Each speaker system requires 2 boxes. Boxes cost $5 each. Gentry wants to have 30% of the month’s estimated production needs in raw materials inventory at the beginning of each month. On January 1, Gentry had 9,000 boxes in inventory. How many boxes does Gentry expect to purchase in January?
a. 42,500
b. 48,050
c. 48,500
d. 57,050
15.The practice of delegating decision-making authority to the lower levels of management in a company is
a. centralization.
b. performance evaluation.
c. decentralization.
d. authorization.
16. Bobick Company provided the following information for last year:
Operating income $ 64,000
Sales $ 200,000
Beginning operating assets$ 387,000
Ending operating assets $ 413,000
Bobick’s return on investment for last year was
a. 2.00 or 200%.
b. 0.50 or 50%.
c. 0.32 or 32%.
d. 0.16 or 16%.
18

Appendix A, Exhibit 5: BSBA Goals Assessed in Accounting based on Spring 2011 Data
17.Future costs that will differ depending upon which alternative future course of action is chosen are
a. product costs.
b. sunk costs.
c. relevant costs.
d. variable costs.
18. Stein Company makes carpets. A customer wants to place a special order for 1,000 carpets in navy blue with the company logo woven in the middle, to be priced at $30 each. Normally, Stein would charge $60 per carpet for this type of order. Stein figures that yarn and backing will cost $12 per carpet, variable overhead (machining, electricity) is $5 per carpet, direct labor is $10 per carpet, and one setup will be required at $800 per setup. The set-up charge costs are 100% labor. Currently, the workers needed to set up for and make the carpets are working at Stein. Their wages will be paid whether or not the special order is accepted. Stein’s policy is to avoid layoffs to the extent possible. If Stein accepts the special order, by how much will operating income increase or decrease?
a. $13,000 increase
b. $ 3,000 increase
c. $ 2,200 increase
d. $13,000 decrease
19.The primary purpose of the statement of cash flows is to
a. show how much cash is due from customers and how much cash is owed to vendors.
b. provide information about the sources and uses of cash during a period.
c. prove that revenues exceed expenses if there is a net income.
d. reconcile the cash balance shown on the bank statement to the balance shown on the company’sbooks.
20.Stacy Company’s net income last year was $27,000. No equipment was purchased or sold during the year. Depreciation expense was $12,000. Changes for the year in current asset and current liability accounts from the balance sheet appear below:
Beginning Balance
Ending Balance
Increases (Decrease
s)
Current Assets (debit balances):
Accounts receivable $ 50,000 $ 42,000 $( 8000)
19

Appendix A, Exhibit 5: BSBA Goals Assessed in Accounting based on Spring 2011 Data
Inventory 180,000 185,000 5,000
Prepaid expenses 10,000 6,000 (4,000)
Current Liabilities (credit balances):
Accounts payable 49,000 60,000 11,000
Accrued liabilities 12,000 5,000 ( 7,000)
Taxes payable 14,000 16,000 2,000
Based solely on this information, the net cash flows from operating activities under the indirect method on the statement of cash flows would be:
a. $2,000.
b. $38,000.
c. $39,000.
d. $52,000.
Assessment Rubric: Learning objective 1.2 – AC 211 & AC 212
Above acceptable: 16-20 correct.
Acceptable: 12-15 correct.
Below Acceptable: 11 or fewer correct.
20

Appendix A, Exhibit 5: BSBA Goals Assessed in Accounting based on Spring 2011 Data
Department: Accounting
Goal: BSBA-1-Accounting - Mastery of Business Knowledge: Each functional area (Accounting, Finance, Law, Management, Marketing and MIS) identifies the performance objectives of its respective discipline.
Section One – Learning Outcome and Numeric Result.
Learning OutcomesCourse(s)
Where Measured
Number Of
Students Measured
Number Of
Sections Measured
Number of StudentsAbove
Acceptable
Number of Students
Acceptable
Number of Students
BelowAcceptable`
3) Interpret external financial statements
AC211 241 9 54 (22%) 136 (57%) 51 (21%)
Section Two – Findings
Students must demonstrate the technical knowledge and analytical ability to correctly compute financial ratios and show that they understand their meaning. They must demonstrate critical thinking skills by making decisions on whether or not they would invest in or lend to the company. In other words, they must adopt two different perspectives and defend and explain the decision they make in each perspective.
There was a misunderstanding about gathering data for AC 211. Initially it was thought that data would be collected only in the Fall semester for AC 211. When it was discovered that the School of Business wanted data for the Spring Semester as well, a lack of cooperation from some AC 211 instructors resulted in data being gathered in only four of nine course sections. All nine sections were assessed in Spring 2011. The numbers for Spring 2011 reported above are an average of the results for two decisions, an investing decision and a lending decision. In the past, including Spring 2010, students have performed better on the investing decision than on ending decision than on the lending decision. In the Spring 2011, aggregate student performance was nearly identical on both decisions. This semester the percentage of students with an acceptable or better response declined slightly from the same semester last year: 79% percent of the students had valid reasons on whether to invest and 77% percent had valid reasons on whether to lend to the company they are analyzing versus 86% and 80% respectively last year. However, more students performed at the above acceptable level, 22% in Spring 2011 compared to 9% in Spring 2010. As was the case with the problem-solving assessment, we see more students above acceptable and more below acceptable. The results exceed the goal of 70% of students achieving at least acceptable performance.
Section Three – Analysis
Critical Thinking: Some students seemed unable to connect the individual questions on the financial statements and financial ratios they calculated to the lending and investing decision.
21

Appendix A, Exhibit 5: BSBA Goals Assessed in Accounting based on Spring 2011 Data
We believe that the students should be using other references (such as trends, industry ratios, and competitive companies) and other information available when making their decision. They should also be including their own common sense and their knowledge of the company/industry.
Analytical skills: The majority of students were able to calculate the financial statement ratios appropriately. Most often, their interpretation was just the meaning of the ratio taken from the textbook. They did not connect the ratio to the company they were analyzing.
Team building skills: Each student was assigned to a group which required the groups to compare each student’s company to the other companies in the group on certain ratios. Most teams worked well together.
These results are essentially unchanged from the previous semester. The problems encountered by the weaker students persist.
Section Four – Use of Results
Each semester different instructors teach this course so we would advise that each instructor go over the project when covering Chapter 5 in the textbook. We would also recommend that each instructor go through Chapter 13 briefly to introduce this chapter and its relevance to the project. Each instructor is allowed to use an industry of their own choosing. Some industries may be easier to analyze or easier for the students (largely sophomores) to relate to.
Action items:1. Remind instructors, especially new instructors, to go over the financial statement
analysis project when covering chapters 5 and 13 during the coordinating meeting at the beginning of the semester.
2. Discuss industry selection with instructors at the coordination meeting at the beginning of the semester. Try to choose industries that will resonate with students while also providing reasonable ratios for analysis.
3. Encourage instructors to discuss the meanings of ratios using company examples to provide context.
Appendix
Assessment instrument: AC 211 Introduction to Financial Accounting Spring 2011FINANCIAL REPORTING & ANALYSIS TEAM PROJECT (See BSBA Objective 1.1)
(The responses to items 10 & 11 on the individual portion of the project are used for assessing learning objective 1.3)
Assessment Rubric: AC 211 Introduction to Financial Accounting Spring 2011
Criteria
22

Appendix A, Exhibit 5: BSBA Goals Assessed in Accounting based on Spring 2011 Data
Above acceptable: reasons for investing/lending are above and beyond Satisfactory; included comparisons to industry AND prior years
Acceptable: reasons for investing/lending are backed up by references to appropriate ratios;
Below acceptable: reasons for investing/lending are incorrect (inconsistent with ratios) or reasons are not given.
23

Appendix A, Exhibit 5: BSBA Goals Assessed in Accounting based on Spring 2011 Data
Department: Accounting
Goal: BSBA-1-Accounting - Mastery of Business Knowledge: Each functional area (Accounting, Finance, Law, Management, Marketing and MIS) identifies the performance objectives of its respective discipline.
Section One – Learning Outcome and Numeric Result.
Learning OutcomesCourse(s)
Where Measured
Number Of
Students Measured
Number Of
Sections Measured
Number of StudentsAbove
Acceptable
Number of Students
Acceptable
Number of Students
BelowAcceptable`
4) Apply spreadsheet skills AC212 168 7 78 (46%) 62 (37%) 28 (17%)
Section Two – Findings
Students were assigned a budgeting project requiring each student to build a complete set of master budget schedules for four quarters including annual totals for a manufacturing company. Students demonstrated their spreadsheet skills by developing appropriate cell formulae, using cell referencing to link budget schedules to avoid duplicate entry of data and provide automatic updating for changes in assumptions, and by modifying display settings for readability and professional appearance.
As shown in the table in section 1, 83% of students performed at an acceptable level or above compared to 81% during the Spring 2010 semester, exceeding the 70% goal.
Section Three – Analysis
In Spring 2010, a supplementary Excel textbook was added to the required materials. The two sections that gave course credit for the Excel Quick assignments did not have higher scores on Excel competency on the project. We decided the cost of the supplementary Excel book exceeded the benefit. The School of Business has instituted a SPA (student professional advancement program) that includes some sessions on basic Excel concepts and techniques early in the semester and more advanced topics later in the semester. Rather than requiring the additional Excel text and assignments, we decided to use early assignments to identify students needing extra help in Excel, and to direct those students to sources for Excel help, including the supplemental text, on-line help, or workshops.
Section Four – Use of Results
We need to continue to monitor the performance of the weaker students, and determine whether or not the students identified as weak in Excel early in the semester are taking advantage of the workshops offered through the SPA program.
24

Appendix A, Exhibit 5: BSBA Goals Assessed in Accounting based on Spring 2011 Data
We have decided against using a comprehensive business case for the AC 212 assessment, but we are exploring whether one or more smaller Excel assignments may be better than the budgeting project to assess Excel skills. A change in the assessment tool would necessitate a change in the assessment rubric.
Action Items:1. Identify weak performers and see if they were identified as weak Excel users early in the
semester, and if so, did they take advantage of the Spa workshops or avail themselves of other help building Excel skills outside class.
2. Evaluate use of smaller Excel assignments as an assessment tool
Budgeting Project Spring 2011
AC 212 Introduction to Managerial Accounting
Hard copy due April 22, 2011 No late submissions will be accepted.
Student Name: ________________________________________________________________________
I understand that this assignment is open book and open notes and is to be completed individually. I certify that I have not used the assistance of any other individual(s) in any form (verbally, written notes specific to this assignment, email, IM, cell phone etc.) other than my Professor. I have read the Academic Honesty Policy included in the AC 212 syllabus and have completed this assignment in accordance with University Policies and the policies noted above.
Student Signature ______________________________________________________________________
Your name should be typed on all sheets turned in for evaluation. Staple all budget work sheets to this cover sheet.
After I review the Master Budget and Pro Forma Financial Statements, I may require changes if new information is available. Please design the Master Budget and Pro Forma Financial Statements to allow changes to be incorporated easily and quickly with the formulas you will be using. Also, as this will be distributed to various levels of management within the organization, ensure that proper business written communication and Excel formatting is utilized (print in landscape using dollar signs, commas, underlining, proper lining-up of amounts, correct spelling, etc.)
Additional information pertaining to these tasks follows in the attached memo.
25

Appendix A, Exhibit 5: BSBA Goals Assessed in Accounting based on Spring 2011 Data
DATE: March 28, 2011TO: CCSU ConsultingFROM: Brian Henry, President, Current Designs KayaksSUBJECT: Master Budget for the fiscal year April 1, 2011 – March 31, 2012----------------------------------------------------------------------------------------------------------------------------------Our controller, Barry Buchanan, has not yet returned from his trip kayaking the Lewis and Clark Expedition trail. We need the British Touring Division’s Master Budget for the fiscal year ending March 31, 2012 for our corporate strategic planning process, and we cannot wait for Barry’s re-appearance. We would like you to prepare the British Touring Division’s Master Budget for the fiscal year ending March 31, 2012.
The deliverables are as follows:
1. Sales budget.2. Production budget.3. Direct materials purchases budget.4. Direct labor budget.5. Manufacturing overhead budget.6. A schedule calculating the expected value of the finished goods inventory as of March 31,
2012.*7. Budgeted statement of cost of goods manufactured and sold for the fiscal year ended March 31,
2012.*8. Selling and administrative expense budget.9. Budgeted income statement for the fiscal year ended March 31, 2012.*10. An accounts receivable aging schedule (schedule of collections from accounts receivable).11. Schedule of cash payments on accounts payable12. Cash budget.
All the Master Budget schedules except those marked with an asterisk for the British Touring Division should include a column for each quarter and a total column for the fiscal year. We need only annual totals for the budgeted financial statements (schedules 7 and 9) and we need only the fiscal year-end amount for the value of finished goods inventory (schedule 6).
The hard copies of these budget schedules should be delivered by April 22, 2011. You can print more than one schedule per page, but do not have a page break in the middle of a budget schedule. I like to be able to view an entire budget schedule without flipping back and forth between pages. Please also use a type font of between 10-12 points for printing. We also need you to send us the Excel spreadsheet you use to create the budget so we can use the spreadsheet to explore the effect of changes in our assumptions about prices and volumes of activity. We need that spreadsheet file by April 22, 2011 as well.
I’ve attached a brief description of the British Touring Division to the budget data Barry gave me before he left to follow the Lewis & Clark Expedition’s Trail. We eagerly await your results.
Sincerely,
Brian HenryBrian Henry, President
26

Appendix A, Exhibit 5: BSBA Goals Assessed in Accounting based on Spring 2011 Data
Brian Henry founded Current Designs in 1982 out of a deep passion for kayaking. Brian's creative talents really emerged when he decided to design a new wave of kayaks for today's paddler. In 1999, Current Designs was acquired by Wenonah Canoe and now operates as a wholly owned subsidiary. In 2004, kayak production was moved to a new 45,000 square foot state-of-the-art manufacturing facility in Winona, Minnesota. Current Designs is organized into divisions, each specializing in different types of kayaks. Many Current Designs’ kayaks are made using of fiberglass and kevlar using traditional composite construction or Current Designs’ new Thermoformed Composite System (TCS™). However, the British Touring Division produces polyethylene kayaks using a rotational molding process. Rotational molding uses high temperature to melt polyethylene powder in a closed rotating metal mold to produce a complete kayak hull and deck in a fraction of the time required for other construction methods. This allows the British Touring Division to produce high quality kayaks that can be sold profitably at a much lower price. Current Designs employs proprietary process controls to produce the lightest possible roto-molded kayaks. They use linear high-density polyethylene to maximize stiffness without sacrificing impact strength. The high-density polyethylene maintains its integrity over a broad temperature range and has added stabilizers giving it increased protection from harmful ultraviolet rays.
British Touring kayaks have a low profile and a snug cockpit. They are designed for stability and tracking in rough waters and high winds, but are less maneuverable than recreational models and have limited cargo capacity. British Touring designs are also good for back rolling and surfing. The Squamish pictured below is a typical British Touring kayak.1
Kayak sales are strongest in the spring (April – June), the first quarter of Current Design’s fiscal year and weakest during the winter (January – March), the last quarter of the fiscal year. The average selling price for British Touring kayaks is expected to be $1,280 per kayak during the 2011-2012 fiscal year. The British Touring Division of Current Designs forecasts the following number kayak sales.
Quarter First Second Third Fourth Kayak sales 700 640 520 480
The collection pattern for Accounts Receivable is as follows:
o 60 percent of all sales are collected within the quarter in which they are sold o 40 percent of all sales are collected in the following quarter.
1 The company and the products depicted are real. Further information can be found at Current Designs Kayaks http://www.cdkayak.com. The financial information is fictitious.
27

Appendix A, Exhibit 5: BSBA Goals Assessed in Accounting based on Spring 2011 Data
o There are no bad debts/uncollectibles.
Due to production delays caused by the installation of new equipment during the past few weeks, the British Touring Division expects to have no finished kayaks in inventory on April 1, 2011, the beginning of the first quarter of the new fiscal year. To avoid having that problem in the coming fiscal year, the British Touring Division would like to have the ending inventory of kayaks at the end of each of the first three quarters equal to 45% of the budgeted sales for the next quarter. They would like to have 320 finished kayaks on hand on March 31, 2012.
Quarter First Second Third Fourth Ending FG inventory in kayaks as a % of the next quarter’s budgeted sales 45% 45% 45% ?Ending FG inventory in kayaks ? ? ? 320
Each kayak requires an average of 55 pounds of polyethylene. The British Touring Division buys polyethylene for $8.00 per pound and they expect the price to remain constant throughout the year. They expect to have 14,000 pounds of polyethylene on hand as of April 1, 2011, the beginning of the first quarter of the fiscal year. At the end of each of the first three quarters, the British Touring Division would like to have their direct materials inventory quantity to equal 50% of the amount required for the following quarter’s planned production. On March 31, 2012, the end of the fiscal year, British Touring Division would like to have 19,000 pounds of polyethylene on hand.
Quarter First Second Third Fourth Ending DM inventory as a % of the next quarter’s production requirement 50% 50% 50% ?Ending DM inventory in pounds ? ? ? 19,000
The British Touring Division buys its polyethylene on account. It pays for 75% of its purchases of direct materials in the quarter in which they were purchased and 25% in the quarter after they were purchased.
Each kayak requires 12 hours of direct labor. Employees engaged in direct labor will be paid an estimated $23.00 per labor hour. Wages and salaries are paid on the 15th and 30th of each month.
Variable manufacturing overhead is estimated to be $11.00 per direct labor hour for the coming fiscal year. All variable manufacturing overhead expenses are paid for in the quarter incurred.
Fixed manufacturing overhead is estimated to total $60,000 each quarter, with $24,000 out of the total amount of $60,000 representing depreciation on equipment, molds, and the factory. All other fixed manufacturing overhead expenses are paid in cash in the quarter they occur. The fixed manufacturing overhead rate will be computed by dividing the year’s total fixed manufacturing overhead by the year’s budgeted direct labor hours. Round the fixed overhead rate to the nearest penny.
Variable selling and administrative expenses are estimated to be $256.00 per kayak sold. Fixed selling and administrative expenses are expected to total $30,000 each quarter, with $8,000 out of the total amount of $30,000 representing depreciation on the office space, furniture and equipment. Other than depreciation, all selling and administrative expenses are paid for in the quarter they occur.
28

Appendix A, Exhibit 5: BSBA Goals Assessed in Accounting based on Spring 2011 Data
On March 31, 2012 the British Touring Division plans to buy new equipment for $240,000. The new equipment will be acquired at the very end of the year, so it will not be used in production and sales during the coming year and it will not be depreciated until the following year. The British Touring Division expects to pay 20% down and finance the remaining 80% of the equipment cost with a note payable. No interest payable will accrue on the equipment note payable until after March 31, 2012.
The British Touring Division must maintain a positive cash balance. Because it is planning to re-build finished goods inventory over the course of the year, the British Touring Division plans to borrow $400,000 arranging a five-year bank note on April 1, 2011, the first day of the new fiscal year. The note will carry an annual interest rate of 6%, payable in quarterly installments of 1.5% paid on the last day of each quarter. The British Touring Division will repay $100,000 of the principal balance on the note on March 31, 2012, the end of the last quarter.
The above borrowing should be sufficient to maintain a positive cash balance for the British Touring Division. If the cash budget shows a negative balance for any quarter, the British Touring Division will have to borrow on its line of credit in an amount sufficient to bring cash to a positive balance. Borrowing must be in even $1,000 increments. To be conservative, assume the borrowing takes place on the first day of the quarter. They also will have to pay interest on the last day of each quarter of 1.5% of the total amount outstanding on the line-of-credit note (new borrowing, plus any borrowings from prior quarters not yet repaid). They must borrow enough to pay this interest payment and maintain a positive cash balance for the month. Surpluses in the cash budget for any quarter should be used to repay any outstanding line-of-credit notes in thousand dollar increments until the note is completely paid or a further $1,000 payment will create a negative cash balance. To be conservative, assume the repayments occur on the last day of each quarter.
So, for example, if the British Touring Division had to borrow $20,000 on their line of credit to maintain a positive cash balance in the second quarter and they had sufficient cash to repay the loan in the third quarter, they would have to pay interest at a rate of 1.5% in the second quarter (because borrowing is assumed to take place at the beginning of the quarter) and they would also have to pay interest at a rate of 1.5% on the $20,000 in the third quarter (because the repayment is assumed to take place at the very end of the quarter).
As a division of Current Designs Kayaks, the British Touring Division does not pay income taxes. All income taxes are charged to the parent company. The British Touring Division will pay dividends of $2,500 each quarter to its corporate parent, Current Designs Kayaks. The dividends must be paid, even if the British Touring Division has to borrow on its line of credit to make the payment
The budgeted balance sheet for the British Touring Division at the close of business on March 31, 2011 (which is the same as the budgeted balance sheet at the beginning of business April 1, 2011) is presented below. Current Designs Kayaks owns 100% of the Capital Stock of the British Touring Division.
BRITISH TOURING DIVISION – CURRENT DESIGNS KAYAKSBUDGETED BALANCE SHEET
29

Appendix A, Exhibit 5: BSBA Goals Assessed in Accounting based on Spring 2011 Data
MARCH 31, 20011ASSETS LIABILITIES & EQUITY
Cash $120,000Accounts Payable $50,000
Accounts Receivable 250,000 Notes Payable 0Raw Material Inventory 112,000 Capital Stock 3,000,000
Plant and Equipment 2,800,000Retained Earnings 232,000
TOTAL ASSETS $3,282,000 TTL LIAB. & SE $3,282,000
Assessment Rubric – AC 212, Introduction to Managerial Accounting, Spring 2010Apply Spreadsheet Skills
Above acceptable: Includes all of acceptable; given data are entered once and only once in the model and are incorporated by cell reference thereafter; all computations are built into cell formulae; numbers are aligned and formats are appropriate.
Acceptable: Budget schedules are well constructed but there are instances where initial data are re-entered rather than linked to prior schedules; budget schedules are mostly well presented but there are a few instances where formats are inappropriate or labeling is unclear.
Below acceptable: Spreadsheet cells are mostly typed rather than the budgeting model built into the spreadsheet; minimal cell referencing and cell formulae; schedules not well presented with unprofessional labeling and formatting.
30

Appendix A, Exhibit 5: BSBA Goals Assessed in Accounting based on Spring 2011 Data
Department: AccountingGoal: BSBA-1-Accounting - Mastery of Business Knowledge: Each functional area (Accounting, Finance, Law, Management, Marketing and MIS) identifies the performance objectives of its respective discipline.
Section One – Learning Outcome and Numeric Result.
Learning OutcomesCourse(s)
Where Measured
Number Of
Students Measured
Number Of
Sections Measured
Number of StudentsAbove
Acceptable
Number of Students
Acceptable
Number of Students
BelowAcceptable`
5) Solve problems using managerial models
AC212 168 7 70 (42%) 75 (44%) 23 (14%)
Section Two – Findings
The same budgeting project used to assess spreadsheet skills in learning outcome 4 allows students to demonstrate their ability to solve problems using managerial models. In this case, the students build a resource acquisition and consumption (master budget) model in Excel, modeling the interrelationships between the firm’s activities to project resource availability and resource needs for a year of activity. Students’ ability to model the firm’s activity was assessed using a rubric.
As shown in the table in section 1, 86% of students performed at an acceptable level or above, compared to 82% in Spring 2010, above the 70% goal.
Section Three – Analysis
The results are slightly below the Spring 2010 results, although the percentage of students performing above acceptable was lower in Spring 2011 than in Spring 2010. Student performance was disappointing on the budgeting questions on the common final.
Some students have difficulty dealing with the differences caused by physical inventory in a production setting. For many this is their first exposure to accounting for manufacturing rather than a merchandising or service environment.
While we anticipate continuing to assign a comprehensive budgeting problem, we are considering moving to mini-cases requiring the application of different managerial models to assess this learning outcome. Section Four – Use of Results
We evaluated using a comprehensive business case in Spring 2011 to assess this learning outcome and decided against adopting the comprehensive business case. We will explore using
31

Appendix A, Exhibit 5: BSBA Goals Assessed in Accounting based on Spring 2011 Data
mini-cases involving other managerial models to evaluate this learning outcome.
Action Items:1. Evaluate use of problem solving mini-cases as an assessment tool.2. Identify exercises to help students better relate to manufacturing/production settings.3. See if the budgeting presentation and exercises in the new textbook lead to better
internalization and success applying the budget model outside the case assignment.
Appendix
Assessment Instrument – AC 212, Introduction to Managerial Accounting, Spring 2011
Budgeting Project Spring 2011 (See BSBA Goal 1, Learning outcome 4)
Assessment Rubric – AC 212, Introduction to Managerial Accounting, Spring 2011
Solve Problems Using Managerial Models
Above acceptable: Includes all of acceptable; the budget schedules are completely accurate, or accurate except for a few minor errors (errors not involving a misconception about the company’s cost and revenue structure).
Acceptable: All the budget schedules are presented and are mostly correct, but there are one or two significant errors and some minor errors. The cash budget and pro forma statements contain some errors.
Below acceptable: One or more budget schedules are missing. Overall, the budget schedules do not reflect the company’s cost and revenue structure and expected results. The cash budget and/or pro forma statements have several significant errors.
32

Appendix A, Exhibit 5: BSBA Goals Assessed in Accounting based on Spring 2011 Data
Department: Accounting
Goal: BSBA-2 - Critical Thinking: A graduate will be able to evaluate, analyze, and interpret information to solve problems and make business decisions.
Section One – Learning Outcome and Numeric Result.
Learning OutcomesCourse Where
Measured
Number Of
Students Measured
Number Of
Sections Measured
Number of StudentsAbove
Acceptable
Number of Students
Acceptable
Number of Students
BelowAcceptable`
1) Use information to support analysis
AC212 131 7 61 (47%) 41 (31%) 29 (22%)
Section Two – Findings
We use an ethics essay assignment to evaluate students’ critical thinking. In the past we, had used mini-cases from the text for this assignment. In the Spring 2011, we tried to incorporate more coverage of ethics into the managerial accounting curriculum using the Ethics Game, an online ethics training module. Students completed an ethical lens inventory and two cases involving ethical dilemmas in accounting. Students demonstrate their ability to draw on relevant information to support their analysis. Information included information on the four ethical lenses, other information from the Ethics Game exercises, relevant sections of the IMA code of ethics, and values frameworks, including one presented in the text. Students’ ability to draw on relevant information to support their analyses of the ethical dilemma was evaluated using the same rubric we used in evaluating the mini-case assignments from the text.
As shown in the table in Section one, 80% of the students evaluated demonstrated acceptable performance or better, exceeding our goal of at least 70%. The performance of almost 47% of the students was rated above acceptable.
Section Three – Analysis
The same percentage of students performing at an acceptable level or better was about the same this semester (80%) as in Fall 2010 (79%). (Data were not collected and assessed on this goal in Spring 2010.) However, the 47% of students performing at an above acceptable level was a marked increase over Fall 2010, when 29% of students performed at an above acceptable level. This level of performance was particularly gratifying given that it was the first semester using the Ethics Game, and we had some issues with the assignment that will be discussed under Goal three below. We attribute the stronger performance to an effort add more assignments requiring students to express their ethical reasoning in writing, and a reduction in the variability in the amount of preparation the students have (for example, having previously responded to a similar case, being shown an example of an excellent response to a similar case, class discussion of critical analysis and presentation of analysis, etc.).
33

Appendix A, Exhibit 5: BSBA Goals Assessed in Accounting based on Spring 2011 Data
Section Four – Use of ResultsWe are going to document differing class coverage of the ethics essay and related assignments and compare results to determine most successful practices.
Action items:1. Add more mini-cases requiring students to express their reasoning in writing.
Appendix
Assessment Rubric – AC 212, Introduction to Managerial Accounting, Spring 2011
Critical Thinking – Use Information to Support Analysis
Above acceptable – All of acceptable; Identifies and focuses on the most important information. Key facts are identified, discussed, and very well linked to relevant legal and ethical standards. Argues convincingly in a coherent discussion. Any uncertainties are acknowledged and appropriately addressed. Assumptions are reasonable and well explained.
Acceptable – Facts are discussed and linked to relevant legal and ethical standards. Argument is consistent with and refers to the discussion of the facts.
Below Acceptable – Very limited discussion of facts with little or no link to relevant ethical and legal standards. Argument is disorganized, or contains some contradictory or unsupported assertions.
34

Appendix A, Exhibit 5: BSBA Goals Assessed in Accounting based on Spring 2011 Data
Department: Accounting
Goal: BSBA-3 - Ethics and Global Perspective: A graduate will be able to apply ethical reasoning in domestic and global business situations.
Section One – Learning Outcome and Numeric Result.
Learning OutcomesCourse(S)
Where Measured
Number Of
Students Measured
Number Of
Sections Measured
Number of StudentsAbove
Acceptable
Number of Students
Acceptable
Number of Students
BelowAcceptable`
1) Students will display a willingness to adhere to ethical obligations and disclosures of pertinent information.
AC212 131 7 59 (45%) 50 (38%) 22 (17%)
Section Two – Findings
In the past we had used mini-cases presenting an ethical dilemma in the text as the assignment for evaluating this goal. Each instructor selects one of the cases and has the students either: write an essay addressing the ethical issues presented in the case, write a memorandum from the perspective of one of the actors in the case, or write a memorandum advising one of the actors in the case. Students demonstrate their willingness to adopt an ethical perspective appropriate for a management or accounting professional in a global economy through their analysis and recommendations for resolving the dilemma. Student responses were evaluated using a rubric.
In the Spring 2011, we tried to incorporate more coverage of ethics into the managerial accounting curriculum using the Ethics Game, an online ethics training module. Students completed an ethical lens inventory and two cases involving ethical dilemmas in accounting. The Ethics Game requires students to respond to a series of questions on the ethical dilemma and provides a structured approach to the process of evaluating the ethical dilemma. The student are also asked to provide an open-ended response explaining their reasoning for the recommendations they provide to one of the actors in the case. The on-line game also provides a grade for the student that incorporates time spent on task, and times accessing the supporting online resources as well as the student responses to the questions. We were hoping this scoring would provide an unbiased measure we could use in assessment, but for this semester we asked the students to write a memorandum similar to those we had been using with the mini-cases in the text. We evaluated the ethical content of that memorandum using our existing rubric.
As shown in the table in Section one, over 83% of the students evaluated demonstrated acceptable performance or better, above our goal of at least 70%. Forty-five percent of the students performed at an above acceptable level.
35

Appendix A, Exhibit 5: BSBA Goals Assessed in Accounting based on Spring 2011 Data
Section Three – Analysis
Student performance was approximately the same this semester as it was during the Fall 2010 semester (83% vs. 81% at acceptable level or above and 45% vs. 47% at an above acceptable level).
Overall the faculty were pleased with the Ethical Lens exercise provided by the Ethics Game. They felt the exercises generated good class discussion, provided the students with more context for evaluating ethical dilemmas, and made them take a more nuanced view of ethical decision-making. The faculty were less pleased with the on-line case assignments. Some students had problems with the interface, and the space and structure of the open-ended responses did not yield the quality of writing we were looking for. More distressing, a significant number of students (37) did not complete the on line assignment, taking a zero on the assignment (5-10% of their grade) rather than paying the $29 fee to complete the module.The $29 was a reduced price we negotiated to use the Ethical Lens Inventory and the Ethics Game cases on a trial basis. On a regular basis the Ethical Lens Inventory model alone costs $29.
Overall we liked the Ethical Lens Inventory felt the cost exceeded the benefits to the students. We preferred having the students work on Ethical Dilemmas off line.
Section Four – Use of Results
At the Spring 2011 assessment retreat, AC 212 faculty reported on their experiences to date during the Spring 2011 semester. At that retreat we decided to discontinue use of the Ethics Game. Instead we would return to a series of 2 – 3 mini-cases, using the final case for our assessment. We would select cases from the new text we were adopting if suitable cases were available, or draw on cases from professional accounting organizations such as the IMA. We also decided to explore using a similar series of mini-case assignments to replace our twenty multiple-choice questions to assess students’ ability to apply proper cost/managerial accounting concepts. We believed that would give us a richer assessment than the multiple-choice questions as well as providing more practice applying analytical reasoning to more complex problems and explaining their reasoning in writing.
Action items:1. Find or create 2 -3 mini-cases involving ethical dilemmas in a managerial accounting
context for use as common assignments in the managerial accounting course.
36

Appendix A, Exhibit 5: BSBA Goals Assessed in Accounting based on Spring 2011 Data
Appendix
Assessment Rubric – AC 212, Introduction to Managerial Accounting, Spring 2011
Ethics and Global Perspective – Students Display a Willingness to Adhere toEthical Obligations and Disclosures of Pertinent Information
Above acceptable – All of acceptable applicable legal requirements and codes of ethics are recognized and well discussed. Legal and ethical ramifications (compliance or noncompliance) of their choice or recommendation are completely addressed. The choice or recommendation fully satisfies relevant legal and ethical obligations.
Acceptable – Basic recognition of applicable legal requirements and codes of ethics. Legal and ethical ramifications (compliance or noncompliance) of their choice or recommendation are at least briefly addressed. The choice or recommendation shows intent to fulfill legal and ethical obligations.
Below acceptable – Failure to recognize applicable legal requirements or codes of ethics. Choice or recommendation fails to fulfill legal and ethical obligations.
37