ac 20-100 - general guidelines for measuring fire ... · pdf filegeneral guidelines for...
TRANSCRIPT

~ AC NO: 20.100
DATE: 9;21111NOVll 1977
LIBRARYADVISORY CIRCULAR
DEPARTMENT OF TRANSPORTATION FEDERAL AVIATION ADMINISTRATION
SUBJECT• GENERAL GUIDELINES FOR MEASURING FIRE-EXTINGUISHING AGENT • CONCENTRATIONS IN POWERPLANT COMPAR'IMENTS
1. PURPOSE. The purpose of this Advisory Circular is to describe the installation and use of a model GA-2A fire extinguisher agent concentration recorder in determining the distribution and concentration of fire-extinguishing agents when discharged in an aircraf1; powerplant compartment.
2. REFERENCE.
a. Report No. F.AA-DS-70-3, "Criteria for Aircraft Installation.and Utilization of an Extinguishing Agent Concentration Recorder," is available from the National Technical Information Service, 5285 Port Royal Road, Springfield, Virginia 22151, under Accession No. AD 712 191.
b. FAR Sections 25.1195(b), 29.1195(b), and 29.1195(c).
c. FAR 21.2l(b)(2) as·it affects powerplant fire-extinguisher installations accomplished on an optional basis.
3. BACKGROUND. From 1959 to 1968, the Federal Aviation Administration (F.AA) was actively engaged in the evaluation of aircraft powerplant fire-extinguishing systems. During this period, the F.AA provided, without charge, specialized fire-extinguishing agent concentration recorder equipment ~d lmowledgeable personnel to organizations requesting assistance in the evaluation of aircraft fire-extinguishing systems. Testing was conducted and data was obtained for STOL, VTOL, helicopters, large transport category aircraft, military aircraft, executive aircraft, turbojet, turbopropellers, and reciprocating engine-powered aircraft. This evaluation program provided information helpful in establishing criteria for the installation and utilization of the fire-extinguishing agent concentration recorder. The F.AA no longer makes evaluations. This type of work is now being performed by private compa.nies for a fee. The F.AA
Initiated by: AFS-140

AC No. 20-100 9/21/77
believes that some of the procedures developed during the evaluation period should be preserved and made available to others as advisory material. This document is intended to accomplish this objective.
INTRODUCTION. Measuring fire extinguishing agent concentration and distributions in aircraft powerplant compartments could be a timeconsuming procedure if it were not for the fact that the fireextinguishing agent concentration recorder was designed and constructed for this purpose. Use of the recorder requires familiarity with both the recorder and the powerplant being evaluated. The following test will aid in gaining familiarity with the equipment and procedures. A more comprehensive familiarization may be obtained by reviewing Report No. FAA-DS-70-J.
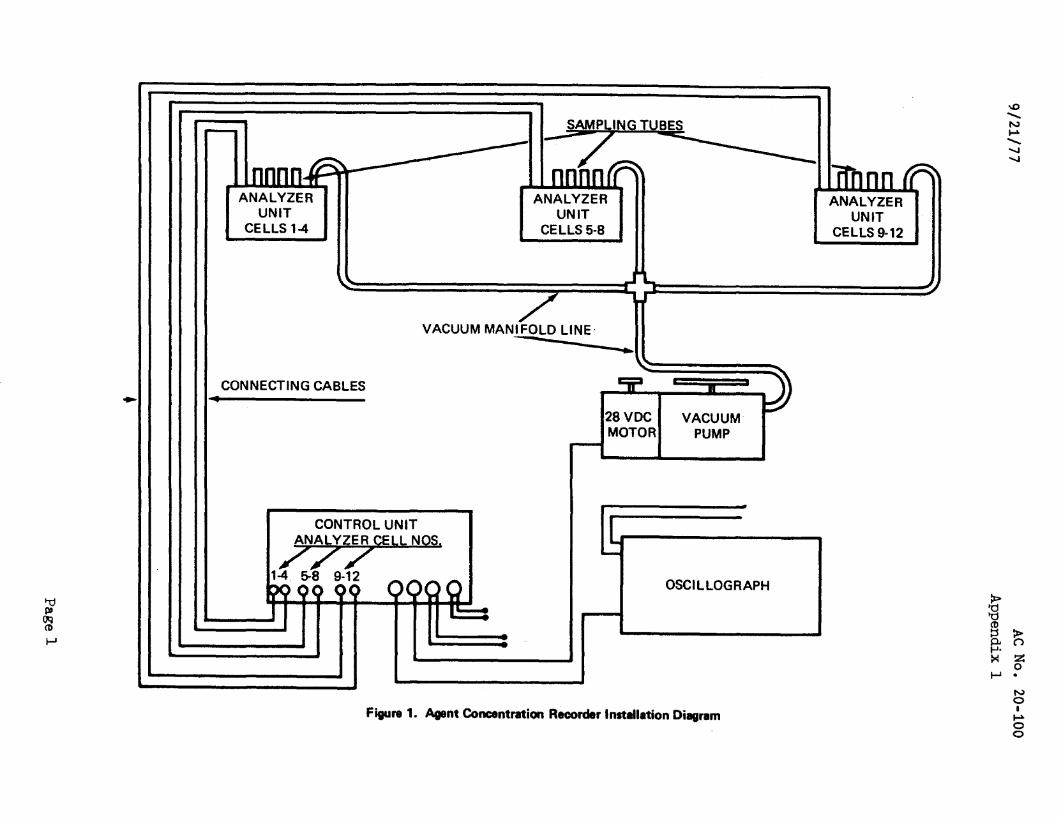
FUNCTIONAL DESCRIPTION OF EgJIPMENT. The agent concentration recorder equipment consists of a recording oscillograph, a vacuum pump, a control unit, gas analyzer units, and sampling probes. An event indicator is an integral part of the oscillograph. Schematic views of this equipment are shown in Figures 1 and 2. The equipment is supplied as a system to assure proper matching of components.
a. The vacuum pump is used to draw gas samples from the area being evaluated through the sampling probes to the analyzer units. The sampling probes are equal lengths of tubing of uniform diameter (¾-inch O.D. with .030-inch wall) designed to convey samples at a uniform flow rate from the sampling area to the analyzer units. For applications where the boiling point of the extinguishing agent is higher than the ambient air temperature, a special set of sampling probes equipped with heaters and insulating jackets is needed. These sampling probes must be fabricated. None of the commonly used agents, however, need heated s~ling probes.
b. The anaJ,.yzer units are used to measure a pressure drop across a porous metal plug within the units. The drop is a function of the viscosity and flow rate of the gas. The analyzer units consist of four analyzer cells each. A transducer assembly contained within each analyzer cell produces a signal which is a function of the pressure drop and transmits the signal to the recording oscillograph. The event indicator provides an input to the recording oscillograph which indicates the time span from initiation of agent discharge to termination of the test.
6. INSTALLATION AND LOCATION OF EQUIPMENT.
a. Location of SM!Pling Probes. The proper installation and location of the agent sampling probes are essential for a meaningful test program. Since the existing concentration recorders use a maxinum of 12 probes, careful consideration nust be given to the selection of areas to be sampled in order to provide an optinum amount of data per test.
Page 2 Par 3

9/21/77 AC No. 20-100
(1) Usually, no attempt is made to position the probes symmetrically or uniformly within the nacelle. Instead, the probes are located in areas where both a source of fuel and ignition exist, areas where component or accessory location or airflow might prohibit adequate extinguiBhing agent coverage, areas near hot air ducts, and the lower portion of the nacelle where flammables might collect.
(2) However, a preliminary survey can be made using either of two general methods to obtain overall pictures of agent concentration. Results from such a survey can then be used to determine the locations where further investigation is required, or if the agent discharge nozzles need repositioning. Figures J and 4 are typical installation schematic diagrams for such preliminary surveys.
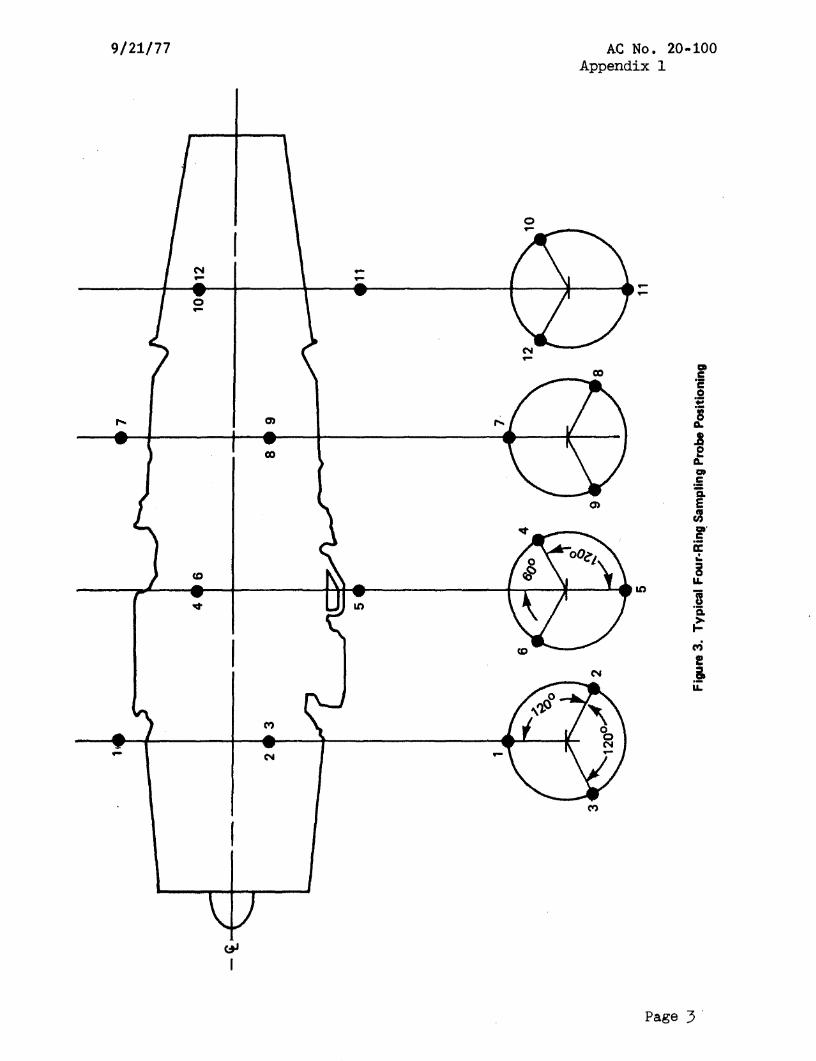
(3) For a relatively long nacelle, probes can be positioned in four rings of three probes each. The probes in each ring should be spaced at 120° intervals radially about the engine. The probes in each succeeding ring should be rotated 60° with respect to the preceding ring.
(4) For a shorter nacelle, three rings of four probes will establish a good sampling. The probes in each ring should be 90° apart and each succeeding ring should be phased 45°.
(5) Ma.n;y variations of these positions are possible. The positioning may start with a.n;y ring or any angular: location. Also, by deviating from the ring station -location (or the suggested angular positioning) or by varying the radial distance, many specific fire hazard areas (or areas of suspected low agent concentratiory may be investigated without disrupting the overall coverage.
b. Probe Installation.
(1) All probes must be the same length to allow identical flow times from the sampling point to the analyzer cells. Therefore, the length of the longest probe should be determined first, and then all other probes should be cut to this length. Coiling of the excess lengths of tubing will then be required for the majority of the probes. The excess tubing should be coiled such that the coiled portion is located where airflow and agent distribution will not be disrupted. The coiling preferably should be outside the area being sampled. The coils should be as large a diameter as practical to minimize line losses, and extreme care should be taken while coiling to assure that there will be no collapsing of the tubing•
. Par 6 Page 3

AC No. 20-100 9/21/77
(2) Within the nacelle, the probes should be clamped securely to structure or to the engine at a sufficient number of points to prevent shifting. It is extremely important to assure that shifting does not occur. Misinterpretation of the data, interference with engine controls, or chafing of electrical or fuel lines could result from such a situation. The probe should be firmly secured as closely as possible to the free end. The open ends of the probes should be several inches from any object that might cause blockage or now obstruction. Probe clearances and position should be checked at intervals throughout the test program.
(3) The open ends of the probes should be positioned normal to the expected local airflow. Probes should not be located close to the agent discharge nozzles because the probes would pick up agent samples which may be greater than the actual concentration in these areas.
(4) When installing the probes, and throughout testing, line obstructions and contamination must be avoided. Prior to connecting the probes to the analyzer cells, the open ends of the probes must be deburred, and the entire line must be cleared with high pressure dry air or nitrogen. The clearing process must be repeated whenever there is a possibility that contaminants have entered the probes during the course of testing. THE PROBE LINES MUST BE DISCONNECTED FROM THE ANALYZER CELLS BEFORE CLEARING TO PREVENT DAMAGE TO THE ANALYZER FROM THE HIGH :PRESSURE GAS.
c. Installation of Analyzer Units.
(1) The analyzer units may be mounted in any position, but they mu.st be shock mounted to eliminate shock damage to the transducer assemblies. Each unit should be mounted outside the nacelle where samples from four of the locations selected can be drawn conveniently. The analyzer cell number and corresponding sam....
pling location should be noted for each of the four cells of the analyzer units as the units are installed.
(2) After the analyzer units are mounted, the vacuum manifold fit ting may be located so that the vacuum lines from the manifold to the analyzer units are as short as possible. These lines may be seamless copper or aluminum tubing.
d. Installation of Vacuum Pump.
(1) The vacuum pump is usually located in the cabin. It is not necessary to shock mount the pump. The line connecting the vacuum pump to the vacuum manifold may be of seamless copper or aluminum tubing.
Page 4 Par 6

9/21/77 AC No. 20-100
(2) If the ambient temperature of the region in which the pump is installed is expected to be below 40°F, a means of heating the pump must be provided. Heating can be accomplished with a heater-blower system.
(3) The pressure side of the pump may be vented overboard if desired. However, if the pump is vented overboard, care must be taken that the location of the venting system does not cause a flow to be induced through the sampling system with the pump off.
e. Installation of Recording Oscillograph and Contr~l Unit. The recording oscillograph and control unit should be located in the cabin where they will be accessible to the operator at all times during a test. The electrical cables must be fabricated during installation. Wiring diagrams are furnished with the equipment. For certain type oscillographs, the event indicator is connected through a relay to the aircraft fire-extinguishing discharge switch.
7. OPERATING PROCEIXJRE. After the components of the agent concentration recorder have been installed in the aircraft, a thorough ground check of the operation of the equipment should be made. Specific operating instructions must be obtained from the instruction manual for the equipment being used. The general operating procedure will require that the analyzer units be stabilized at operating temperature. If the preheated sampling tubes are to be used, the sampling tube heater switch should not be turned on until operating temperature has been attained in all three analyzer units. Because of their small thermal mass, the sampling tubes should come up to operating temperature in a few mimtes. After the instrument has been brought up to operating temperature, the galvanometers are zeroed by aligning all 12 galvanometer. traces manually so that they are spaced equally. This should be done in accordance with the procedure outlined in the operations mamal which accompanies the oscillograph. The vacuum pump is turned on. While it is in operation, the traces again are examined and readjusted as necessary for correct spacing and to insure that none fall outside the chart range. The procedure should be repeated several times to insure that all galvanometer traces are aligned and identified properly. With the vacuum pump in operation, a check is made in each galvanometer in regard to the location of each sampling pickup in its circuit. This may be done by directing a small jet of carbon dioxide (CO2) from a small hand fire extinguisher intg a plastiQ.bag and then holding the bag over the open end of the sampling tube and noting the correspondinggalvanometer deflection. This method avoids flooding the entire area and thus affecting other pickups in addition to the one being checked.
Par 6 Page 5

AC No. 20-100 9/21/77
a. The event indicator also should be checked before an actual test is conducted. This is done by disconnecting the agent container discharge valve from the discharge switch. 'Ibe discharge switch then is activated and sinultaneously an interrupted light beam should be observed in the oscillograph. The interruption of the light beam is indicated by a broken line on the record chart. When conducting a test, the recorder chart speed should be adjusted to approximately 1.50 inches per second.
b. The flight conditions under which the test is conducted are determined by the test requirements.
c. Tests usually are conducted during takeoff and normal cruise cond:i:tions, although a Vne cruise condition is very often tested since it is a designated flight velocity; and if coverage is adequate at this condition, it will be adequate at normal cruise conditions. More detailed descriptions of test conditions are contained in Report No. FAA-DS-70-J. It is possible in some cases to conduct tests on the ground, sirrru.lating flight conditions by introducing the appropriate airflow in the nacelle. If ground tes~ing is feasible, a considerable savings in time and costs may be realized.
d. Be.fore the equipment is airborne, it should be warmed up on the ground; otherwise, it will be necessary to extend the flight time to allow for heating the equipment. After the desired altitude is reached, a final check is made on the alignment of the galvanometer traces. This should be done with the oscillograph on and the vacuum pump operating intermittently.
e. In conducting the test, the emergency £ire shutdown procedure specified for the aircraft is followed. At least 20 seconds before the agent discharge switch is activated, the oscillograph is turned on and the chart is started. Approximately 10 seconds before the agent is discharged, the vacuum pump is turned on. The equipment should remain in operation approximately 30 seconds after .the agent is discharged. At the time of the test, the ambient pressure, temperature, and humidity should be recorded. By following the above sequence of operation, the concentration recorder is cali brated for 100 percent air sarrple before each test run is made. A typical oscillogram is shown in Figure 5.
8. DATA .REDUCTION. The oscillogram of the test shows the agent concentration buildup and decline at each of the 12 sampling locations on a time basis from the time of discharge until the agent is dissipated from the protected zone. A timing signal generated and printed on the oscillogram provides the time reference. At this point it should be recognized that a time and pressure lag will exist in long runs of tubing and must be taken into consideration.
Page 6

9/21/77 AC No. 20-100
a. Since the galvanometer deflection for a given channel is propoI"tional to the pressure drop across the porous plug, a definite deflection will result for each pure gas. Any mixture of two gases,·such as air and an extinguishing agent, will produce a deflection somewhere between the respective values for the pure constituents. Subsequently, the relative concentration of an extinguishing agent in any mixture of the agent and air may be determined by the formula shown below:
Percent relative concentration= AD - MD X 100
AD - CD where
AD= displacement for 100% air, in inches, from baseline MD= displacement for mixture, in inches, from baseline CD= displacement for pure agent, in inches, from baseline
b. It is not necessary to calibrate the instrument for 100 percent concentration of the agent each time a test is conducted. By cali brating the instrument experimentally, the ratios for galvanometer defiection for 100 percent agent to galvanometer deflection for 100 percent air can be determined for various agents. These ratios are determined as· an average for all of the individual channels in operation within standard deviation limits. The calibration ratios for various extinguishing agents are as follows:
Calibration Agent Ratio
Carbon Dioxide (CO2) 0.717 Methyl Bromide (CH3Br) 0.466 Bromochloromethane (CH2BRCl) 0.395 Dibromodifiuoromethane (CBrZF2) 0.319 Bromotrifluoromethane (CBrF3) 0.401
c. The ratios are based upon the pressure drop obtained with dry air. If there is an appreciable amount of mofsture in the air, a slight error will result from the use of these ratios. Figo:re 6 gives the correction factor by which the ratios nust be multiplied to correct for the specific humidity and ambient temperature conditions existing at the time the test is conducted.
d. The following illustrates how the relative concentration may be determined for any channel, for a specific time interval, after the agent has been discharged. Figure 5 shows that on channel 9 the deflection for air is 3.08 inches (AD= 3.08). '!he calibration ratio for CO2 a.gent is 0/717. The defiection corresponding to 100 percent
Par 8 Page 7

AC No. 20-100 9/21/77
concentration of the agent then is determined as J.08 x 0.717 = 2.21 inches. This means CD= 2.21. To compute the deflection from the 100 percent airline corresponding to 100 percent of the agent, subtract the deflection due to the agent from that due to air. For channel 9, Figure 5, (AD-CD) is given by (3.08 - 2.21) = 0.87. To determine the CO2 concentration for channel 9 at 2 ½seconds after discharge, extend the 100 percent air deflection line to the right and beyond the vertical time interval line, which indicates a time lapse of 2 ½seconds from discharge. Determine by measure.ment the defiection for channel 9 from the 100 percent airline at this point. This is 0.46 inches and represents the value (AD-MD). The ratio of this deflection to the deflection from the reference line from 100 percent concentration of the agent, expressed as a percentage, will give the concentration of the mixture. In this example, the relative CO2 concentration
AD-MD . 0 46 AD-CD x 100 is: o:a7 x 100 = 52.9 percent.
9. INTERPRE'I'ATION OF DATA.
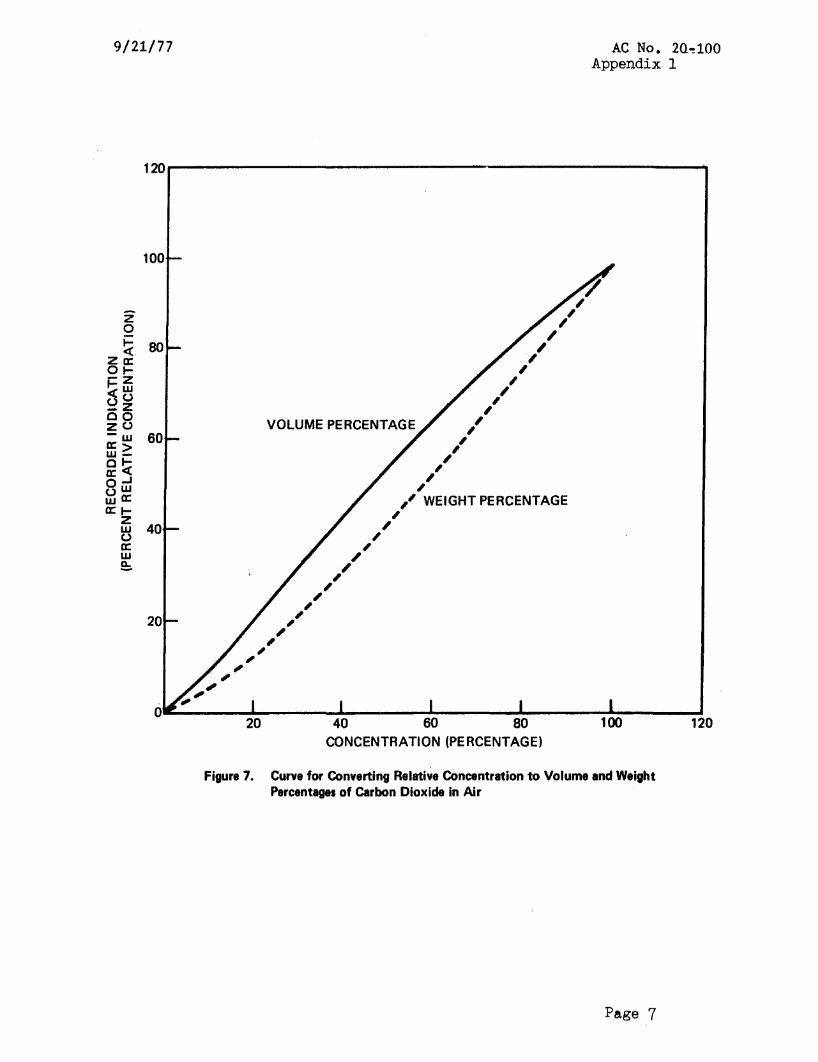
a. The percentage of relative concentration, based on the ratio of oscillograph galvanometer displacements, does not indicate the concentration percentage on a volumetric or weight basis. To convert to a volumetric percentage or weight percentage, the curves shown in Figures 7 through 11 may be used. Referring to Figure 7, the concentration percentage corresponding 52.9 percent would be approximately 49 percent by volume and 60 percent by weight.
b. In order to determine by means of the recorder whether the extinguishing agent is to be effective, concentrations sufficient to extinguish fire must exist simultaneously at all sampling points long enough to provide initial extinguishment and assure protection while flammable vapors dissipate and hot surfaces cool. The minimum time that the minimum concentration should exist is one-hal:f second.
Page 8 Par 8

9/21/77 AC No. 20-100
.Elcamples of mininurn concentrations sufficient to extinguish fire and prevent its recurrence are as follows:
AGF.NT CONCENTRATION IN PERCffiT RELATIVE CONCffiTRATION BY WEIGHT BY VOLUME PERcntT
CO2 49 37 40
CH3Br 30 11 15
CH2BRC1 36 11 25
CF2Br2 26.5 5 15 CFJBr 22 6 15
.
.(,~~A. FERRARESE
Acting Director Flight. St~ndards Service
Par ·g Page 9
- SAMPLING TUBES
nnnnP ~ ·~n?n'rn --------- nnnn (F' ANALYZER ANALYZER ANALYZER
UNIT UNIT UNIT CELLS 1-4 CELLS5-8 CELLS 9-12
-- ~
/ I
VACUUM MANIFOLD LINE·
~
...:
CONNECTING CABLES 9r n J28VDC VACUUM MOTOR PUMP-
CONTROL UNIT I /~;YELL NOS, --
1-4 5-8 9-12 0 ,,:1 Q OSCILLOGRAPHr.x> (ti') (t(l
I ~ i ~ ~p,.... >< 2:
0 f,-1 .
N 0
Figure 1. Aeent Concentration Recorder Installation Diagram I.. 0 0

9/21/77AC No. 20-100 Appendix 1
1 • TEMPERATURE-REGULATING POROUS PLUG
2 • PRESSURE-DROP POROUS PLUG
3 · CRITICAL FLOW ORIFICE
4 • VACUUM MANIFOLD
5 • PRESSURE-SENSITIVE BELLO'NS} • STRAIN GAGE TRANSDUCER ASSEMBLY
6
7 · HEATING ELEMENT
8-THERMOSTATTEMPERATURECONTROL
9 • METAL BLOCK
Figure 2. Typical Gas Analyzer Cell
Page 2
9/21/77 AC No. 20-100 Appendix 1
'It'
....
e:,J
I
O')
00
('II
.... 00
O>
('II
en C 'i: .2 .t:
1. .a e 0.. Q
.5 a. E
r}J
.r· a: .:. g
LL.
1·a ~ c,; ! i
i.i:
Page 3 ·

AC No. 20-100 9/21/77 Appendix 1
CJ)
-
N-0-
N
0---
N
...
--
M I
.r
.B I l. J l !' i. cl Cl I: ii: ! f:.
I ~
"'I! g i.i:
~
I
Page 4

4 I I I I I
~ 4.or-
Figure s.. Typical Flight Test Oscillograph Record

AMBIENT TEMPERATURES (°C}
-50 -40 -30 -20 -10 0 10 20 30 40 50 60 70 80 901.00----------------...-------.-------------------------1.01
HUMIDITY
a: ~ ~ LL.
zo 5 wa: a: 8
1.02
1.03·
1.04
1.05
1.
1.07-
100 PERCENT
80 PERCENT
60PERCENT
40PERCENT
20 PERCENT
Figure 6. Humidity Correction Factors
9/21/77 AC No. 2Q-:100 Appendix 1
120------------------·-----------
100
,7 ,,-z 0 /
80 ,/~ z a: ,01 ,I= z <( w ,,00 ,-Z ,co ,zo -w 60 ,,0:> ,w ,c~ ,a: ..I ,Ow ~a: ,, WEIGHT PERCENTAGE ,a: I-
z ,w 40 ,0 ,a: ,w ,e:. ,,,, 20 , ,, ,,,
20 40 60 80 100 120
,," ,,.,,.
CONCENTRATION (PERCENTAGE)
Figure 7. Curve for Converting Relative Concentration to Volume and Weight Percentages of Carbon Dioxide In Air
Page 7

AC No. 20-100 9/21/77 Appendix 1
120,------------------------------
100
z 0 .:: 80z<oa:
-11-Z
c:S~ -z00 ~(.)
a: w 60w> o~sOwwa: a: 1
z ~ 40 a: we:.
20
___.....;.....1
,,,,,,, ,,,,,,,,,
,, ,, ,,, ,,
I, I
I I
I,
I I
I I
I I
I I
I I
I,,
11 WEIGHT PERCENTAGE· ,,,
0-;._________._____..._____L-.___....,,
20 40 60 80 100 CONCENTRATION (PERCENTAGE)
Figure 8. CurYI for Converting Relative Concentration to Volume and Weight PercenUlfli' of Methyl Bromide In Air
Page 8
120

VOLUME PERCENTAGE
,, ,,,,,,,,----
25--------------------------------------,, ,,,,,,,. ,,20· ,,z 0 ,,.:: ,,<a: ,,zt ,oz
-w 15 ,,1-0 ,~~ ,,
50 ,,zw-> a: ,, WEIGHT PERCENTAGE w~ ,,C ..J ,,a:w 10Ca: ,01- ,,wz a:w ,,
0 ,,a: w ,,,e:.
5
0-------------------------------------------5 10 15 20 25 30 35 40 >CONCENTRATION (PERCENTAGE) :g ~ Figure 9. Curve for Converting Relltin Concentration to Volume and W•Wit za:
~
Percentage of,Bromochlorol'lllth- In Air ~ •0
.... N 0 ...I 0 0

AC No. 20-100 9/21/77 Appendix 1
120------------------------------,
100 I
I I z
0
~ 80 I=
zzOw -ut-z ~o-U Ow 60Z>
ffi ~ 0 ..Ja:W oa: (.J t w z a: w 40u
er: w !:.
20
,",,,,, "".,,
"',.,,, . ,,,,, ,, ,,,,,
,,, ","
",
I,,, ~,,,
I I,
I I
I
I
,, WEIGHT PERCENTAGE,
o....,____..____________._____.....,____....._____ ~ ~ 60 80 100 1~
CONCENTRATION (PERCENTAGE)
Figure 10. Curve for Converting Relative Concentration to Volume and Weight Percentages of Dibromodifluoromethane
Page 10

9/21/77 AC No. 20-100 Appendix 1
1~------------------------------
100
I I
Iz 0 I j:: I80c{ I a: IZt- Ioz -w I
~~ I ' -0 ,Icu Zw 60 ,->a:- ,wt- ,,0~ a: UJ ,,8c: wt-a: z , ," w 40 ,,,
C.) a: ,," UJ e:. .,,,.,,, WEIGHT PERCENTAGE
,,," ,,,
20 ,, ,, ,,.,,,,,.,,,,,, 0
20 40 60 80 100 120 CONCENTRATION (PERCENTAGE)
Figure 11. Curve for Converting Relative Concentration to Volume and Weight Percentages of Bromotrifluoromethane In Air
,i, V. 8, OOVIIIRNJIDIT PRIMTINO OJ'FJCIII: 19'1'7 731•174/S1
Page 11