a_b_testing_present
TRANSCRIPT

Tableau Meetup
A/B Testing
Presented by: Vanessa Foster
Lior Barak

Getting Smart Friday presentation
• LOVOO is a social discovery network app for finding like-minded people nearby and with
25 million active users one of the leading local networks. Use LOVOO to upload and
share your best moments and get to meet people through what they love!
How best to show what you love by hash tagging it?!
• And that’s the idea: hashtag what you love, your interests and hobbies and easily find
new people by browsing through hashtags in our app. Through our live radar you can
then locate people like you in your immediate vicinity and share great moments with
them!
About Lovoo

Getting Smart Friday presentation
About Lovoo

Getting Smart Friday presentation
The Main Challenge
The amount of creatives we use increases from week to week. This makes
the task of comparing them more difficult on a daily or weekly basis

Getting Smart Friday presentation
The story begins with a need to make smart Comparisons
• The Facebook channel managers had difficulties analyzing the different creatives. They could not determine
which ones work better.
• Facebook is one of our main marketing channels at Lovoo, and as a result the analysis team was asked to
provide a solution for the problem.

Getting Smart Friday presentation
Comparing Creatives

Getting Smart Friday presentation
Comparing Creatives

Getting Smart Friday presentation
The story continues with a huge need
• How can you determine which creatives correlate with each other?
• After a long search and investigation we came up with the perfect solution for the given problem!
• The goal was to create a tool that allowed channel managers to:
• Have an environment where they could easily compare two or more different creatives
• Help determine if a comparison between creatives is statistically valid

Getting Smart Friday presentation
Chi-squared test
• A chi-squared test, also referred to as χ² test (or chi-square test), is any statistical hypothesis test in which
the sampling distribution of the test statistic is a chi-squared distribution when the null hypothesis is true.
• A chi-squared test is a test in which this is asymptotically true, meaning that the sampling distribution (if the
null hypothesis is true) can be made to approximate a chi-squared distribution as closely as desired by
making the sample size large enough.
• The test is used to determine whether there is a significant difference between the expected frequencies
and the observed frequencies in one or more categories. Does the number of individuals or objects that fall
in each category differ significantly from the number you would expect? Is this difference between the
expected and observed due to sampling variation, or is it a real difference?

Getting Smart Friday presentation
A B C D Total
Blue colour 90 60 104 95 349
Purple colour 30 50 51 20 151
Green colour 30 40 45 35 150
Total 150 150 200 150 650
Chi-squared test example
Let us take the sample proportion living in Country A, 150/650, to estimate what proportion of the whole
population of 1 million who live in Country A. Similarly, we take 349/650 to estimate what proportion of the
1 million people seen are the colour blue. Then the null hypothesis independence tells us that we should "expect" the number of people with blue colour in Country A to be

Getting Smart Friday presentation
• country, but residents of different countries would have different probabilities of being chosen if the four
sample sizes are not proportional to the populations of the four Countries.
• In such a case, we would be testing "homogeneity" rather than "independence". The question is whether
the proportions of blue color, white color, and service workers in the four countries are the same. However,
the test is done in the same way.
Chi-squared test example

Getting Smart Friday presentation
• We created the test in excel to see if it works
First step – Excel
Dimensions • Country • Gender • Creative
measurements • CTR • Installs/Clicks • Regs/Installs • Regs/Clicks
Getting Smart Friday presentation
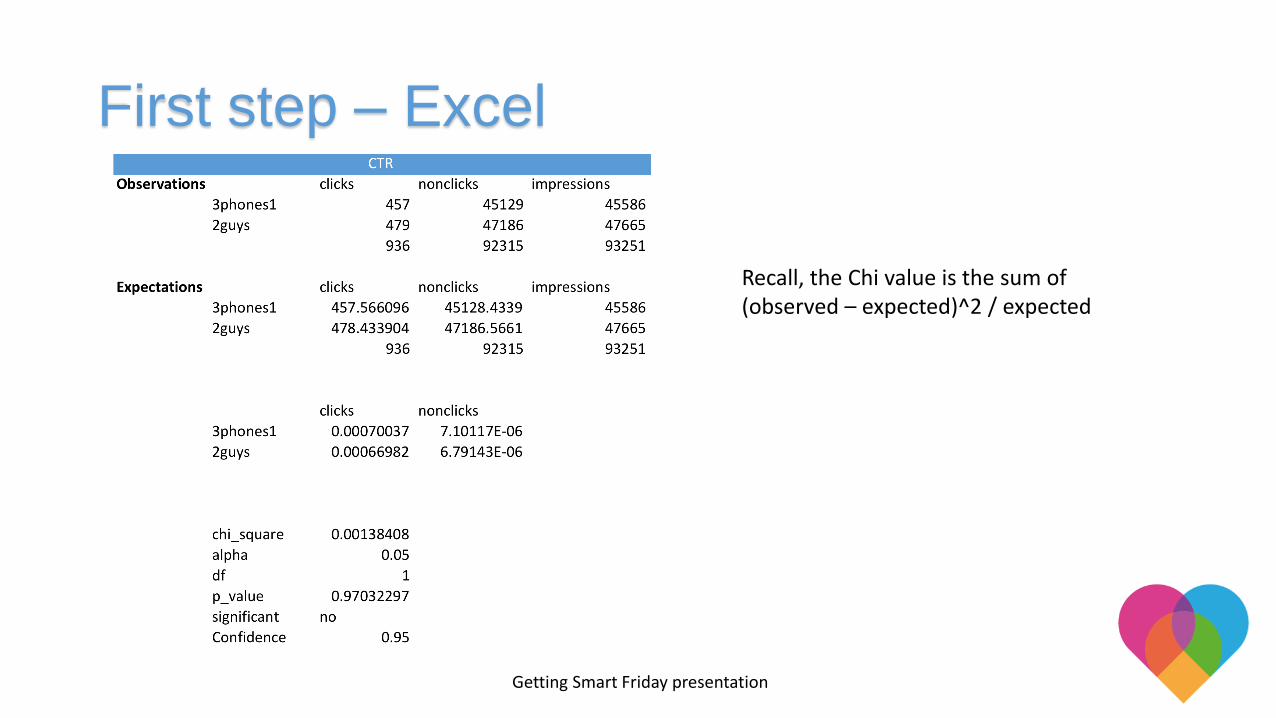
First step – Excel
Recall, the Chi value is the sum of (observed – expected)^2 / expected

Getting Smart Friday presentation
Comparing Creatives
√
√
√

Getting Smart Friday presentation
• In Tableau we created a tool that calculates the chi-square.
• Then the score we receive, is compared to the bucket system that we created.
• The bucket system is a system with origins from the Nielsen methodology, that creates buckets of data to
compare different periods, equal to a significance level but with a small twist.
• In our bucket, we used the percentile calculation to determent if we accept or reject the coloration between
the two creatives.
Second step – Transferring to Tableau

Getting Smart Friday presentation
• First Python reads in all data from tableau (currently from an exported csv file, in the future this will change)
• Then Python separates the creatives into different groups by week and gender
• For each of these groups, Python computes the chi value for all possible pairs: that is, if n is the number of
creatives in a given group, then (n choose 2) is the number of different chi values produced.
(n choose 2) = n (n-1) / 2
For instance, a group of 360 different combinations, we have 64.620 chi values
• Going a step further, when we compare triples, or 3 creatives at a time we have (n choose 3)
360 choose 3 which is 7.711.320. For a group of size 500 this is 20.708.500.
The Chi-Square buckets – using Python

Getting Smart Friday presentation
• Next Python takes the list of chi values it computed and orders them from smallest to largest.
• Then to create the table of chi buckets Python extracts the chi values at the chosen percentiles. Thus for
each week and each gender python does the same process and creates a table
The Chi-Square buckets – using Python

Getting Smart Friday presentation
The Chi-Square buckets – using Python

Getting Smart Friday presentation
• We wanted to ensure that certain creatives did not bias the calculation of the buckets. Additionally, some
creatives were part of test campaigns that had too small numbers of impressions and clicks to be considered
in the test.
• To exclude such creatives the following rules were implemented and creatives which do not satisfy these
requirements are excluded from calculations in Python and Tableau:
• I. Creative must have more than 100 impressions
• II. Creative must have more than 50 clicks
Manually set Rules – Tableau & Python

Getting Smart Friday presentation
• After receiving the data from Python run we can analyze the data, the system becomes a semi automatic
tool that can compare up to three different creatives on the same time.
• The creatives are then compared against the bucket of the specific week and gender and it allows us to
better understand if it is valid to compare the creatives in question.
Second step - Tableau
Will be changed to creative names
Internal use for validating the data
The accepted chi score
The bucket for the week

Getting Smart Friday presentation
• During the process we had many challenges and re-thinking about the model functionality, the final result is
not close to the place we started but it do give the results we wanted and can be a great tool.
Excel Challenges
I. The working with mac was a horrible, causing us a lot of headache every time the vlookup or the pivot did
not work.
II. The need to download an updated file every time a comparison is needed, was a big no no.
III. Tracking error is harder, as we don’t have control over the data inserted from Aj/SQL
Challenges along the way

Getting Smart Friday presentation
Tableau Challenges
I. The biggest issue was in the p-value calculation, while calculating the chi-square, the p-value was a
different issue, as there was no explanation to how to calculate it.
II. The p-value that we created did not give us enough freedom to compare different KPIs between two
campaigns
III. Our segmentation at the beginning as we segmentation by country, gender, week and device brought us to
situation we did not have enough data points to compare and create the buckets.
IV. Not enough data impressions/clicks/installs/regs caused us again to situation we received a very low chi
score which damaged our correlation checking.
Challenges along the way

Getting Smart Friday presentation
• The segmentation goes now by gender and week only, with this we solved the problem of having not
enough creatives, which had resulted in the very high/low chi score in the buckets.
• By filtering creatives with less then hounded impressions and less then 50 clicks out we managed to reduce
the problem of rejection and created a stable bucket to compare.
• Tableau is not a perfect tool but there are works around with him that we will need to keep explore,
specially on the decision making tools that will help everyone to better understand the data and the work
they do.
Conclusions and learnings

Getting Smart Friday presentation
Comparing Creatives
√
√
√

Getting Smart Friday presentation
• Next Technical steps:
• Connnect Python to Tableau to upload bucket tables automatically rather than manually
• (if needed) Connect Python to Hadoop to read in data
• Next steps with Tools:
• Create tests to compare the install rates, reg rates, and overall funnel rate between different creatives
• Expand the tool so that it works for other channels (Adwords, Twitter, …)
• For each week create a worksheet giving the Top 5 performing Creatives (by CTR, reg rate, install rate,
etc) and the Bottom 5 worst performing creatives
The future of the tool

Getting Smart Friday presentation
• Thank you for listening
• Questions
• Slides will be posted on Tableau meet up site
Thank you to Fyber for hosting