abstract title of document: measuring wishful thinking
TRANSCRIPT

ABSTRACT
Title of Document: MEASURING WISHFUL THINKING: THEDEVELOPMENT AND VALIDATION OF ANEW SCALE
Angela H. Eichelberger, Ph.D., 2007
Directed by: Professor Harold Sigall, Department ofPsychology
This dissertation describes the development and validation of a 10-item scale measuring
individual differences in wishful thinking, or the degree to which individuals’ desires bias
their judgments. A study was conducted to investigate the new scale’s psychometric
properties, as well as its relationships with other self-report measures. The wishful
thinking measure demonstrated convergent validity with other measures of bias,
including self-deceptive enhancement, belief in a just world, and social desirability.
Wishful thinking showed discriminant validity with several dimensions of problem-
focused coping. Wishful thinking was related to optimism and greater use of positive
reinterpretation and growth, an emotion-focused coping response. Next, the new measure
was used to distinguish optimists who were wishful thinkers from those who were
realistic. An experimental study was conducted to investigate hypothesized differences
between wishful thinkers and realistic optimists. In this study, participants were asked to
make judgments about their future performance. When success at the task was important

to wishful thinkers, they judged success as more likely than when success was not
important to them. Realistic optimists did not vary their judgments as a function of
importance. The optimal margin of illusion hypothesis was not supported; extreme levels
of optimism and wishful thinking were not associated with overconfidence and poor
performance. Potential uses of the wishful thinking measure for future research are
discussed.

MEASURING WISHFUL THINKING: THE DEVELOPMENT ANDVALIDATION OF A NEW SCALE
By
Angela H. Eichelberger
Dissertation submitted to the Faculty of the Graduate School of theUniversity of Maryland, College Park, in partial fulfillment
of the requirements for the degree ofDoctor of Philosophy
2007
Advisory Committee:Professor Harold Sigall, ChairProfessor Judson MillsProfessor Charles StangorProfessor Seppo Iso-AholaAssociate Professor Carl Lejuez

© Copyright byAngela H. Eichelberger
2007

ii
Dedication
To my son Barrett.

iii
Acknowledgements
Completion of this dissertation would not have been possible without the support
of many individuals. I wish to thank my advisor, Hal Sigall for his insightful feedback on
the many drafts of my proposal and dissertation, as well as his guidance and support
throughout my graduate career. Thanks to my committee members: Jud Mills, Chuck
Stangor, Carl Lejuez, and Seppo Iso-Ahola for their invaluable feedback and suggestions
for developing the methodology of this research. Thanks to my husband, Craig
Eichelberger, and my parents, Tom and Patti Harless for their love and support
throughout the process.
iv
Table of Contents
Dedication ........................................................................................................................... iiAcknowledgements............................................................................................................ iiiList of Tables ...................................................................................................................... vChapter 1: Introduction and Literature Review .................................................................. 1
Approaches to Optimism ................................................................................................ 3Optimism as the Key to Motivation............................................................................ 3Optimism as an Illusory Belief ................................................................................. 22Optimism as a Strategy ............................................................................................. 27Summary................................................................................................................... 29
Understanding the Complexity of Optimism................................................................ 29Too Much Optimism? ............................................................................................... 30Placing Optimism in Context.................................................................................... 32Different Kinds of Optimism.................................................................................... 35Realistic Optimism and Wishful Thinking ............................................................... 38
Chapter 2: Wishful Thinking Studies ............................................................................... 41Study 1: Development of Items .................................................................................... 41
Method ...................................................................................................................... 41Results....................................................................................................................... 45Discussion ................................................................................................................. 48
Study 2: Factor Analysis and Validation ...................................................................... 48Method ...................................................................................................................... 48Results....................................................................................................................... 51Discussion ................................................................................................................. 56
Study 3: Validation ....................................................................................................... 57Method ...................................................................................................................... 58Results....................................................................................................................... 60Discussion ................................................................................................................. 64
Chapter 3: General Discussion.......................................................................................... 66Research Summary and Implications............................................................................ 66
Scale Development ................................................................................................... 66Reliability.................................................................................................................. 67Validity ..................................................................................................................... 67
Implications for Theories of Optimism......................................................................... 68Self-Regulation ......................................................................................................... 68Optimal Margin Hypothesis...................................................................................... 69
Limitations of the Present Research ............................................................................. 70Future Directions .......................................................................................................... 71
Appendices........................................................................................................................ 75Appendix A: Items Constructed for the New Measure of Wishful Thinking............... 75Appendix B: Wishful Thinking Scale Items................................................................. 77Appendix C: Sample Puzzles........................................................................................ 80Appendix D: Puzzle Questionnaire............................................................................... 82Appendix E: Wishful Thinking and Behavior-Outcome Contingencies ...................... 83
References......................................................................................................................... 89

v
List of Tables
Table 1: Correlations Between Items and the Indirect Measure of Bias (Difference Score)........................................................................................................................................... 47
Table 2: Internal Consistency of the Wishful Thinking Measure..................................... 52
Table 3: Item Loadings for the Wishful Thinking Measure ............................................. 53
Table 4: Correlations Among Measures ........................................................................... 55
Table 5: Mean Predictions for Future Success (and Standard Deviations) as a Function ofGroup and Success Type................................................................................................... 86
Table 6: Mean Confidence Ratings (and Standard Deviations) as a Function of Group andSuccess Type..................................................................................................................... 87
Table 7: Correlations Among Dependent Variables......................................................... 88

1
Chapter 1: Introduction and Literature Review
Conventional wisdom holds that having a positive outlook is key to life success.
Expecting the best is the main principle underlying many popular self-help programs,
including the best-selling book, The Power of Positive Thinking by Norman Vincent
Peale (1996). In the psychological literature, this characteristic is known as optimism, a
trait that denotes individuals who hold positive expectations for the future (Scheier &
Carver, 1985), as well as people who tend to explain events in a favorable light (Peterson,
et al., 1982).
Optimism has been the focus of more than two decades of empirical research, and
its benefits are well-documented (see Chang, 2001 for a review). Various measures of
optimism have been associated with good health, an absence of depression, adaptive
coping, high levels of achievement at school and work, and strong social networks.
Optimism has been identified as a crucial ingredient for achieving a happy and successful
life (e.g., Myers, 1993; Seligman, 1991). David Myers described optimism as one of the
four traits of happy people, suggesting that a positive spin might increase our emotional
well being. In Learned Optimism, Martin Seligman argued that optimism is important
across various life domains, including school, work, sports, politics, religion, and health.
Interventions based on optimism, such as the Penn Optimism Program, have been
developed to help individuals at risk for depression. An optimism intervention was
successfully used to reduce depressive symptoms in children experiencing high levels of
family conflict (Yu & Seligman, 2002), and ongoing research will assess the long-term
effects of such interventions (Gillham & Reivich, 2004).

2
Models such as Carver and Scheier's (1981) control theory of self-regulation
provide a framework for understanding the relationships found between positive
expectancies and positive outcomes. The control theory of self-regulation has generated a
large amount of research on the benefits of optimism, particularly within the domain of
health. A general prediction derived from this theory is that optimism fosters persistence
when individuals encounter difficulties in self-regulation. According to the theory,
individuals who typically have positive expectations (i.e., dispositional optimists) should
be more likely to believe that they can overcome difficulties and therefore, will persist
longer and harder than will pessimists.
Other theories suggest that positive thinking can sometimes lead to the opposite
effect. Optimism may, at times, be detrimental to one’s health or performance. To the
extent that individuals believe that they are not at risk for a particular health problem,
they may not take actions to protect their health (Weinstein, 1980). Research within this
framework has found that individuals who believed that they were less at risk than their
peers were less worried about health threats (Weinstein, 1982) and less likely to take
actions to protect their health (Weinstein & Lyon, 1999). Experimental research with
defensive pessimists provides further evidence of the potential damaging effects of
optimism. Across several studies, this research program consistently demonstrated that a
positive thinking induction caused the pessimists to perform worse than a control group
of pessimists (e.g., Norem & Cantor, 1986; Norem & Illingworth, 1993).
Consequently, a thorough review of the literature reveals evidence to support both
the notion that optimism is beneficial and the idea that it is detrimental. The dissertation
will provide a critical review of existing approaches to measuring and conceptualizing

3
optimism. Research within each framework will be presented. Then the review will
proceed with a discussion of potential explanations for inconsistent findings within the
optimism literature, proposing that there may be two different kinds of optimism—
realistic optimism and wishful thinking—which have been confounded by current
measures of optimism. Finally, a new measure of wishful thinking will be developed and
validated.
Approaches to Optimism
There have been many different approaches to studying a positive outlook. Some
researchers have approached the measurement of optimism by directly assessing people’s
outcome expectancies (e.g., Scheier & Carver, 1985), whereas others have developed
measures that examine people’s attributions for positive and negative events (Peterson et
al., 1982). Yet others have emphasized the unrealistic nature of positive beliefs (e.g.,
Weinstein, 1980). Many of these approaches conceptualize optimism as either a positive
or negative trait, but Norem and her colleagues have studied optimism and pessimism as
two different, yet equally adaptive strategies that people can use to reach their goals (e.g.,
Norem & Cantor, 1986; Norem & Illingworth, 1993). Finally, there are closely related
constructs, such as hope (Snyder, et al., 1991), which are measured with items that may
capture some aspect of optimism. In this section, the methods, theory, and key findings
associated with each of these approaches to optimism will be reviewed.
Optimism as the Key to Motivation
Optimism is a central construct in both Carver and Scheier's (1981) control theory
of self-regulation and Abramson, Seligman, and Teasdale’s (1978) reformulated learned
helplessness theory (RLHT). Both theories predict that optimistic expectations will lead

4
to greater persistence in the face of setbacks. Likewise, Snyder and his colleagues’ (1991)
model of hope proposes that positive expectations are necessary for successful goal
pursuit. Though the different theoretical approaches make similar predictions, each is
associated with different techniques for measuring optimism. The expectancy-based
measures directly assess outcome expectancies (e.g., Scheier & Carver, 1985), whereas
an alternate approach has been to assess people’s attributions for outcomes that have
already occurred (e.g., Peterson, et al., 1982).
Expectancy-based measures. Fibel and Hale (1978) developed one of the first
measures designed to assess people’s expectancies for the future. The Generalized
Expectancy for Success Scale (GESS) is a 30-item measure that asks the respondent to
rate the probability of experiencing a variety of outcomes in the future. Some examples
of these items include, “be a good parent,” “handle unexpected problems successfully,”
and “attain the career goals that I have set for myself.” Some examples of the negative
items on the GESS include, “be unable to accomplish my goals” and “experience many
failures in my life.”
Whereas Fibel and Hale measured optimism by assessing expectancies across a
variety of life domains, Scheier and Carver (1985) developed a similar measure designed
to assess generalized outcome expectancies. The 8-item Life Orientation Test (LOT) has
become one of the best known measures of dispositional optimism. Positive items
include, “in uncertain times, I usually expect the best” and “I’m always optimistic about
my future.” Negative items include, “if something will go wrong for me, it will” and “I
hardly ever expect things to go my way.”
5
There have been some extensions and revisions of Scheier and Carver’s original
LOT. Dember, Martin, Hummer, Howe, and Melton (1989) created the 36-item
Optimism and Pessimism Scale (OPS), which contains items similar to those of the LOT.
Chang, Maydeu-Olivares, and D’Zurilla (1997) suggested that the broad definition of
optimism as a positive outlook on life, on which the OPS is based, may be confounding
optimism with other related constructs such as self-esteem or life satisfaction. Thus, the
Extended Life Orientation Test (ELOT; Chang et al., 1997) was constructed using the
items from the OPS and the LOT that seemed to best fit the definition of optimism as a
positive outcome expectancy. The result was a 15-item scale comprised of two reliable
subscales for optimism (α = .77) and pessimism (α = .89).
Control theory of self-regulation. Scheier and Carver’s (1985) approach to
optimism is embedded within the control theory of self-regulation, which explains how
people continually regulate their behavior in order to attain desired goals and avoid
undesired states. The control theory of self-regulation (Carver & Scheier, 1981) is an
expectancy-value model of motivation. Like previous expectancy-value models, control
theory suggests that motivation is increased when a goal is desirable or important (high
value) and when people think that the goal is attainable by them (high expectancy).
Carver and Scheier (1981) extended previous expectancy-value models by suggesting
that there are feedback control processes, which detect discrepancies between a desired
state and the present state and monitor progress toward reducing these discrepancies. In
response to perceived discrepancies, individuals continually adjust their behavior to move
toward desired goals (or away from undesired states). However, the discrepancy-
reduction process is interrupted when a difficulty is encountered. An impediment—

6
whether it is an external constraint (e.g., lack of resources) or an internal constraint (e.g.,
lack of skill)—will interrupt the process and will trigger a subjective evaluation of the
likelihood of overcoming the obstacle. This point is where optimistic expectations play in
important role in self-regulation. According to the theory, expectations for success cause
people to persist at goal attainment when an impediment is encountered (Carver &
Scheier, 1990). An optimistic expectancy will lead to continued effort, whereas a
pessimistic expectancy will lead to disengagement from the goal (Carver & Scheier,
2001). Thus, optimism helps individuals stay engaged with a goal in the face of a
challenge or threat, because the optimists are more likely to believe that impediments can
be overcome.
Correlates of dispositional optimism. Optimistic expectations have generally been
associated with good mental and physical health, adaptive coping, and a focus on health-
promoting behavior. For example, Carver and Gaines (1987) found that optimists were
less likely to suffer from depression after the birth of a child than were pessimists. An
optimistic outlook may be particularly important when individuals are faced with
stressful situations. When college students were faced with sexism against their gender
group, the dispositional pessimists showed greater depressed emotions and lower self-
esteem than a control group, but the dispositional optimists did not get depressed when
they experienced sexism (Kaiser, Major, & McCoy, 2004, Study 1). In Kaiser and
colleagues’ (2004) second study, women were induced to think pessimistically with a
writing task. The women in the pessimism condition wrote about negative events that
could happen to them in the future, whereas the women in a control condition wrote
about negative events that could happen to a television character. Those who were
7
induced to think pessimistically about their future showed the same pattern of results as
the dispositional pessimists. When faced with sexism, the pessimistic women showed a
reduction in their emotional well being. Study 3 (Kaiser et al., 2004) found that
dispositional optimists were less likely to appraise sexism as stressful than were
pessimists. The less stressful appraisals made by optimists were found to mediate the
relationship between optimism and emotional well being.
Dispositional optimism was related to better physical health, as measured by self-
reported symptoms (e.g., Scheier & Carver, 1985, Study 3; Scheier et al., 1989) and
physiological indicators (e.g., Antoni & Goodkin, 1988; Cohen, Kearney, Kemeny, &
Zegans, 1989; Byrnes, et al., 1998). Friedman, Bruce, Webb, Weinberg, and Cooper
(1993) found that dispositional optimism was associated with health-promoting behavior
(i.e., the frequency of skin self-examination in a population at risk for skin cancer).
Friedman and her colleagues suggested that optimists are more likely to engage in
problem-focused behaviors than are pessimists because the optimists anticipate more
favorable outcomes.
Many of the physical and mental benefits might occur because optimists are more
likely to employ adaptive coping strategies than are pessimists. In a number of studies
(e.g., Scheier, Weintraub, & Carver, 1986; Carver, Scheier, & Weintraub, 1989),
optimism tended to be related to several adaptive coping responses (e.g., planning, active
coping, positive reinterpretation). In contrast, optimism was related to less use of
avoidant coping responses, including denial, behavioral disengagement, mental
disengagement, and alcohol-drug disengagement (Carver, et al., 1989).

8
Although the research documenting the positive correlates of optimism is ample,
there are a few exceptions. Although Byrnes and colleagues (1998) found that optimism
was related to stronger immune systems in women with HIV, Cohen and his colleagues
(1989) found that optimism was related to decreased immunocompetence in certain
situations. Cohen and his colleagues found that optimism buffered women’s immune
systems from the effects of acute stress, but optimists showed decrements in their
immune system function compared to pessimists when stress persisted at high levels.
This finding suggests that there might be certain contexts where optimism is detrimental.
Moreover, optimism is not universally related to the performance of health-
promoting behaviors. Contrary to previous findings, Friedman, Nelson, Webb, Hoffman,
and Baer (1994) failed to find support for the idea that dispositional optimists engage in
more health-protective behaviors. Optimism was not related to the frequency of breast
self-examination among women. In addition, some evidence suggests that optimists may
take more risks than do pessimists. Dispositional optimism was linked to gambling
behavior in two laboratory studies conducted by Gibson and Sanbonmatsu (2004). In
Study 1, optimists were more likely than pessimists to report that they expected to win at
gambling. Among participants who had prior experience at gambling, this difference was
even more apparent: pessimists with a history of losses reported lower expectations (than
other pessimists), whereas optimists with a history of losses continued to report high
expectations. In two experimental studies, dispositional optimists continued to gamble
after experiencing losses, whereas pessimists bet less after experiencing a poor outcome.
In the loss condition, the optimists were more likely to remember near wins than were
pessimists.

9
Another line of research that has yielded inconsistent results focuses on the role of
optimism in academic outcomes. Experimental research with expectancies has shown that
individuals who expect to succeed at a task generally are more successful at the task than
those with low expectancies for task success (see Brown & Marshall, 2001 for a review).
Expectancies are probably related to success because they tend to foster motivation and
persistence. In a study by Feather (1961), people with high expectations persisted longer
at impossible tasks. To the extent that optimism induces people to believe that success is
likely, they should be motivated to persist at a difficult task. Therefore, optimism should
be an important ingredient for academic achievement. Gibbons, Blanton, Gerrard, Buunk,
and Eggleston (2000) conducted a longitudinal study in which optimism, social
comparison, and grades were measured at several points in time. Optimistic first-year
college students had significantly higher grade point averages for their first semester of
college than did the pessimistic students. The optimists continued to outperform the
pessimists in subsequent semesters. Optimism was also related to better teacher-reported
grade point averages in a large sample of public middle school students (Pajares, 2001).
However, correlations between optimism and grades have not been found consistently.
Robbins, Spence, and Clark (1991) measured dispositional optimism along with other
several other variables believed to be related to academic performance. Correlations
between students’ levels of optimism and their college grade point averages and SAT
scores were close to zero.
Optimistic explanatory style. Peterson and his colleagues (1982) invented the
Attributional Style Questionnaire (ASQ), which is a measure designed to capture
individual differences in the degree to which people use various attributional styles. This
10
measure asks the respondent to read about 12 hypothetical events (half are positive and
half are negative), write down one major cause of each event, and rate each of the causes
along three attributional dimensions. An example of a good event is, “You become very
rich,” and an example of a bad event is, “You go out on a date and it goes badly.” The
three attributional dimensions are internal vs. external, stable vs. unstable, and global vs.
specific. Composite scores are computed by summing the internality, stability, and
globality ratings and then dividing the sum by the number of items in the composite.
Optimists attribute negative events in their lives to external, unstable, and specific causes;
however, they show the reverse pattern of causal attributions for positive events. This
pattern of responses on the ASQ is therefore known as optimistic explanatory style. With
the addition of 12 new items to the ASQ, Peterson and Villanova (1988) created the
Expanded Attributional Style Questionnaire (EASQ) in order to increase the reliability of
the measure.
Peterson, Schulman, Castellon, and Seligman (1992) developed the Content
Analysis of Verbatim Explanations (CAVE), which is a method of coding attributions on
the internality, stability, and globality dimensions. The CAVE allows researchers to
determine the explanatory style of individuals who they would not normally be able to
study in the lab. This technique was used to study the relationships of optimistic
explanatory style with the performance of professional athletes (Seligman, Nolen-
Hoeksema, Thornton, & Thornton, 1990) and the success of presidential candidates
(Zullow, Oettingen, Peterson, & Seligman, 1988).
Reformulated learned helplessness theory. This attributional approach to
optimism grew out of the reformulated learned helplessness theory (RLHT; Abramson,

11
Seligman, & Teasdale, 1978). The concept of explanatory style was introduced in the
reformulation of the original learned helplessness model to account for the fact that some
participants never gave up despite experiencing frustration or failure (Seligman, 1991).
The reformulated model predicts that different kinds of explanations for past events will
lead to different kinds of expectations for the future. For example, unstable and specific
explanations for problems (as opposed to stable and global explanations) should lead to
expectations that outcomes are controllable. This pattern of attributions is expected to
foster renewed effort in the face of setbacks. Thus, the reformulated model makes some
predictions that are similar to those of the control theory of self-regulation, but the
relationship between outcome expectancies and attributional styles is surprisingly
variable. Correlations between the LOT and ASQ range from .20 to .77 (Gillham, Shatte’,
Reivich, & Seligman, 2001).
Correlates of optimistic explanatory style. A number of studies have examined the
relationship between explanatory style and depression. Joiner and Wagner (1995)
conducted a meta-analysis of 27 studies that measured attributional style and depression
in children and adolescents. The 13 cross-sectional studies that reported an overall
composite of the different attributional dimensions found that pessimistic explanatory
style was consistently related to depression. Composites of attributional scores for
positive events and for negative events were also related to depression. The studies
included clinical and non-clinical samples and participants ranging in age from 6 to 18
years, and the results were consistent across these variables. Joiner and Wagner also
reviewed several prospective studies that measured explanatory style between 4 weeks to
12
2 years before assessing depression. Overall, explanatory style was a statistically
significant predictor of later depression in children and adolescents.
While it is clear that a pessimistic explanatory style is related to depression in
children and adolescents, there is mixed support for the causal hypothesis that a
pessimistic explanatory style makes young people more vulnerable to depression in the
presence of negative life events. Three studies (Dixon & Ahrens, 1992; Panak & Garber,
1992; Hilsman & Garber, 1995) found results consistent with this diathesis-stress
hypothesis, while three studies (Hammen, Adrian, & Hiroto, 1988; Cole & Turner, 1993;
Spence, Sheffield, & Donovan, 2002) found null results. Abela (2001) and Bennett and
Bates (1995) found mixed results. The three supportive studies found that the predicted
interaction between explanatory style and stress was related to depression. A pessimistic
explanatory style interacted with daily negative events (Dixon & Ahrens, 1992), peer
rejection (Panak & Garber, 1992), and unacceptable grades (Hilsman & Garber, 1995) to
predict depressive symptoms in children. In contrast, Hammen and colleagues (1988)
conducted a prospective study, in which initial symptoms and life stress were the only
significant predictors of depression in a sample of youth aged 8 to 16 years. Negative
explanatory style and the interaction between stress and explanatory style both failed to
predict clinical depression at a 6 month follow-up (Hammen, et al., 1988). Likewise, Cole
and Turner (1993) failed to find support for the hypothesis that explanatory style
moderates the effects of stress on depression. Spence and colleagues (2002) found that
pessimistic explanatory style and negative life events were related to depressive
symptoms in a sample of adolescents, but their interaction was not a significant predictor
of depressive symptoms. In a study of students in grades 3 and 7, pessimistic explanatory

13
style interacted with negative life events to predict depression; however, the interaction
was significant only for students in grade 7 (Abela, 2001). Finally, Bennett and Bates
(1995) used multiple measures of stress and depressive symptoms in a prospective study
of 11- to 13-year olds. Only one out of the 12 interactions that were tested was supportive
of the diathesis-stress hypothesis.
The findings in the adult literature have generally been more supportive of the
RLHT’s predictions than those found in the youth literature. It is clear that a relation
between pessimism and depression exists in adults. Sweeney, Anderson, and Bailey
(1986) conducted a meta-analysis of 104 studies that assessed both explanatory style and
depression. A pessimistic explanatory style was related to depression, and the effect was
significant for both clinical and non-clinical samples. However, a consistent correlation
does not necessarily indicate that a pessimistic explanatory style makes people vulnerable
to depression. Prospective studies provide stronger evidence for the RLHT by controlling
for initial levels of depression. These studies have found that a pessimistic explanatory
style is related to increases in depressive symptoms (e.g., Golin, Sweeney, & Schaeffer,
1981). Furthermore, many studies have found evidence for the hypothesis that a
pessimistic explanatory style interacts with stressful events to predict depressive
symptoms in adults (e.g., Metalsky, Abramson, Seligman, Semmel, & Peterson, 1982;
Metalsky, Halberstadt, & Abramson, 1987; Stiensmeier-Pelster, 1989; Luten, Ralph, &
Mineka, 1997; Vazquez, Jimenez, Saura, & Avia, 2001; Kwon & Laurenceau, 2002).
A handful of studies have failed to find significant interaction effects (e.g., Robins
& Block, 1989; Hummer & Hokanson, 1990). Although there are many possible reasons
for the null results, some of the findings in the adult literature may be inconsistent due to
14
the low reliability of the ASQ. Abramson and her colleagues (1998) used the cognitive
style questionnaire (CSQ), an expanded version of the attributional style questionnaire
and found that a hopeless cognitive style predicted depression in a sample of college
students who were at risk for suicide. Initial results demonstrated that the CSQ may be a
more reliable measure of explanatory style than the ASQ.
Overall, a pessimistic explanatory style was consistently related to depression in
children and adults. Furthermore, some studies found that a pessimistic explanatory style
interacted with various stressful events to predict depressive symptoms. These findings
are generally consistent with Abramson and colleagues’ (1978) reformulated learned
helplessness theory. However, possible alternative explanations for the results have
largely been ignored by proponents of the RLHT. Despite the longitudinal design of
many studies reviewed in this section, it remains unclear whether a pessimistic
explanatory style causes susceptibility to depression in the face of stressful life events, or
whether some other variable causes both explanatory style and vulnerability to
depression. Very few studies have used experimental designs to investigate whether
optimistic explanations or some other closely related variable makes individuals
vulnerable to depression. Preliminary research has yielded inconclusive results for
optimism interventions. Gillham, Reivich, Jaycox, and Seligman (1995) reported the
results of a study that examined the effects of an intervention designed to help children
make more optimistic attributions. Fifth and sixth grade children who were at risk for
depression were selected to participate in the study. The children were screened for
depressive symptoms every 6 months for a 2-year period. Throughout the follow-up
period, the intervention group reported fewer depressive symptoms than did a control

15
group. However, Gillham and Reivich (1999) found that the beneficial effects of the
intervention on depressive symptoms did not extend past the 2-year follow-up period,
even though the children in the intervention group retained a more optimistic explanatory
style. Furthermore, the intervention not only trained the children to question their
pessimistic attributions, but it also taught the children a variety of social and problem-
solving skills. Because the treatment consisted of several different strategies, it is unclear
whether a change in explanatory style or another aspect of the treatment alleviated
depression in the early phases of the study. In summary, much of the literature on
depression and explanatory style is consistent with the RLHT, but alternative
interpretations for these results remain to be investigated.
Relatively few studies have examined the relationship between explanatory style
and physical health. These studies generally find that explanatory style is related to good
health. Individuals with an optimistic explanatory experienced fewer physical health
problems than did their pessimistic peers (e.g., Peterson, 1988; Peterson & De Avila,
1995). In a longitudinal study, those with an optimistic explanatory style even lived
longer than those who explained life events in a more negative manner (Buchanan, 1995).
In a cross-sectional study, Peterson (1988) investigated possible links between
explanatory style and illness. A negative explanatory style was related unhealthy habits,
and unhealthy habits were related to a higher incidence of illness. A negative explanatory
style was also related to more stressful life events, and stressful life events were related to
illness. This pattern of results suggests that unhealthy habits and stressful life events may
partially mediate the relationship between explanatory style and illness.

16
A handful of studies have examined the role of explanatory style in the academic
realm, but the findings were not consistent. Optimistic explanatory style was related to
higher math achievement among school children (Yates, Yates, & Lippett, 1995), and
higher grade point averages among university freshmen (Peterson & Barrett, 1987).
Peterson and Barrett (1987) found that an optimistic outlook at the beginning of the year
predicted higher end-of-year grades, even while controlling for SAT scores and
depression. The pessimistic students had less specific goals and fewer advising visits than
their optimistic counterparts. The optimism and grade link was replicated with a sample
of Chinese college students, in which optimistic students had slightly higher grades than
did the pessimistic students (Lee & Seligman, 1997). However, as with the expectancy
literature, these findings were variable. In a sample of male and female student athletes,
Hale (1993) measured optimistic explanatory style during the students’ freshman year
and grades at the end of the first year and during the junior year. No relationship was
found between grades and optimism. Two studies found that optimists’ grades were
actually lower than those of pessimists (Satterfield, Monahan, & Seligman, 1997;
LaForge & Cantrell, 2003). Satterfield and colleagues found that pessimism was related
to greater academic achievement in a sample of law students, and LaForge and Cantrell
found that a pessimistic explanatory style was related to higher grade point averages and
more course points among junior and senior marketing majors.
Few studies have investigated the role of coping as a potential mediator for
explanatory style and the various physical, psychological, and behavioral outcomes. The
RLHT suggests that an optimistic explanatory style will foster motivation when problems
are encountered. Hence, individuals with an optimistic explanatory style should

17
demonstrate good coping skills. However, there is some evidence to the contrary.
Students who made pessimistic attributions for poor exam performance reported more
plans to study for the next exam than did the optimists (Follette & Jacobson, 1987). This
finding is contrary to the RLHT’s prediction that the optimists would cope better.
Two kinds of positive expectancies. Another theory that promotes positive
thinking as a key to motivation is Snyder and his colleagues’ (1991) model of hope. The
central construct of the theory is hope, which is a generalized expectancy about the
future, though it differs from Scheier and Carver’s (1985) dispositional optimism
construct. Snyder and his colleagues (1991) included two types of expectancies in their
model of hope: 1) agency, or a sense of success in the pursuit of past, present, and future
goals (i.e., self-efficacy); and 2) pathways thinking, or one’s perceived capability of
imagining ways to reach one’s goals. Agency and pathways thoughts combine to create
outcome expectancies for the pursuit of goals. Thus the 12-item Hope Scale (Snyder et.
al., 1991; Snyder, Sympson, Michael, & Cheavens, 2001) is comprised of two subscales,
one that measures agency and one that measures pathways thinking. An example of an
agency item from the Adult Trait Hope Scale is, “I meet the goals that I set for myself,”
and an example of a pathways item is, “There are lots of ways around any problem.”
Snyder and his colleagues’ (1991) model of hope articulates how feedback control
processes help move individuals toward achieving their goals. Hope is the key construct
that motivates behavior. According to the theory, both agency and pathways thinking—
the two components measured by the hope scale—are necessary for successful goal
pursuit. Individuals may believe that they can achieve a goal (high agency), yet they
might lack the plans to make their dreams happen (low pathways thinking). On the other
18
hand, one may have plans but lack the agency to move forward. In contrast, Scheier and
Carver (1985) did not distinguish between different kinds of expectancies. In their
seminal paper, they wrote:
It is our position that outcome expectancies per se are the best predictors of
behavior rather than the bases from which those expectancies were derived. A
person may hold favorable expectancies for a number of reasons—personal
ability, because the person is lucky, or because he is favored by others. The result
should be an optimistic outlook—expectations that good things will happen.
(Scheier & Carver, 1985, p. 223)
Thus, Scheier and Carver (1985) argued that although the source of expectations may
vary, the expectation that success is possible is the most important ingredient for
motivation. Likewise, the RLHT does not make different predictions for different sources
of optimism. The RLHT also hypothesizes that optimism increases motivation, regardless
of the source of that optimism. However, there is some evidence that the two-component
hope model may predict outcomes better than generalized outcome expectancies. When
scores on the Hope Scale were entered in a multiple regression along with LOT and
GESS scores, the Hope Scale was a somewhat better predictor of coping than either of
the optimism measures (Snyder et al., 2001). It is likely that the Hope Scale accounts for
a greater amount of variance than the LOT because the Hope Scale measures two
constructs, while the LOT measures only one. The Hope’s agency scale overlaps a great
deal with the LOT, but the pathways scale goes beyond what is measured on the LOT,
which does not attempt to measure how people plan to achieve their goals.
19
Correlates of hope. Like optimism, hope has been associated with a number of
positive outcomes, including psychological adjustment, physical health, and academic
achievement. Hope was positively related to feelings of self-worth (e.g., Curry, Snyder,
Cook, Ruby, & Rehm, 1997) and positive affect (Snyder, 1996), and it was negatively
related to depressive symptoms (Gibb, 1990, cited in Snyder et al., 2001). Trait hope was
related to lower levels of distress in mothers who were caring for children with chronic
physical conditions (Venters & Wallander, 2001), and it was related to less burnout in
nurses working in a high stress environment (Sherwin et al., 1992). Elliot, Witty, Herrick,
and Hoffman (1991) examined the role of the agency and pathways components of hope
in individuals coping with spinal cord injuries. Individuals who scored high on the
pathways component reported less depression. However, agency was not related to
depression. Pathways scores were related to less psychosocial impairment, and this
relationship increased as the time since the injury increased. Agency was also related to
less psychosocial impairment, but only for individuals who had recently experienced the
injury.
Although there are very few studies examining hope and health-related outcomes,
two studies suggest that hope might be beneficial to one’s health. Hope was related to
fewer unhealthy behaviors in burn survivors (Barnum, Snyder, Rapoff, Mani, &
Thompson, 1998), and greater knowledge of cancer in a sample of college women
(Irving, Snyder, & Crowson, 1998).
Hope was related to higher academic achievement in both children (Snyder, et al.,
1997) and college students (Snyder, et al., 2001). In the latter study, Hope Scale scores
were measured at the beginning of college. Hope was a significant predictor of
20
cumulative grade point average and graduation status, even after controlling for ACT
scores. In addition, Curry and colleagues (1997) found that trait hope predicted both
grade point average and athletic achievement in a sample of college athletes. In one
study, hope predicted semester grade point averages in male and female athletes. In two
subsequent studies, female college athletes with high hope outperformed those low in
hope, even after controlling for athletic ability. In each of these studies, the students
performed better than measures of ability had predicted, although this fact does not rule
out the possibility that other variables not included in the research designs might account
for the relationship between hope and performance.
Summary. Dispositional optimism, explanatory style, and hope were each
conceptualized within theoretical frameworks that view optimism and related contructs as
important for regulating behavior in the face of setbacks (e.g., failing a test, recovering
from an illness). Whether an individual is adjusting to the demands of college or dealing
with a life-threatening illness, a positive outlook should lead to better coping and
ultimately better outcomes for these individuals, compared to pessimists.
On the whole, the research reviewed in this section found that individuals with an
optimistic orientation perceive situations more positively, experience less emotional
distress, and ultimately experience fewer physical and depressive symptoms than do
pessimists. These results held over a variety of methodologies. Thus, optimists generally
appear to be healthier and happier than their pessimistic counterparts. However, Cohen
and his colleagues (1989) found that there may be exceptions to this general pattern of
results, particularly when the stressful situation is chronic.

21
The hypothesis that optimism moderates the effects of stressful life events on
mental health was supported by several studies, although a handful of studies failed to
replicate the findings. Nearly all of the studies reviewed in this section employed research
designs that were inadequate for making causal inferences. However, the experimental
study conducted by Kaiser and colleagues (2004) suggested that optimism may play a
causal role in well being. Women who were induced to think pessimistically experienced
a decrease in emotional well-being when faced with a negative event (i.e., sexism); a
pattern of results that is consistent with the correlational studies.
Studies that have examined the behavioral correlates of optimism reveal mixed
results. Friedman and colleagues (1993) found that dispositional optimism was associated
with a health-promoting behavior (i.e., the frequency of skin self-examination in a
population at risk for skin cancer), but in another study Friedman and colleagues (1994)
failed to find support for the idea that dispositional optimists engage in more health-
protective behaviors (i.e., the frequency of breast self-examination among women).
Furthermore, Gibson and Sanbonmatsu (2004) found that optimists continued to gamble
even after experiencing losses, which might have been caused by their propensity to
remember near-wins more often than pessimists.
Optimists’ academic performances were quite variable across different studies.
Some studies found a positive relationship between optimism and academic success,
while others found a negative or no relationship. Studies of coping and optimism reveal
that optimists report that they are more proactive copers. If these self-reports are accurate,
then optimists should perform better than pessimists. However in one study, it was the
pessimists who reported more plans to study (Follette & Jacobson, 1987).

22
The inconsistent findings discussed in this review suggest that optimism may be
more complex than has previously been recognized. Optimism may be detrimental in
certain contexts. Although it is easy to gloss over the exceptions and simply conclude that
optimism is the key to success, some theorists have focused solely on the costs of positive
beliefs (e.g., Weinstein, 1980).
Optimism as an Illusory Belief
Unrealistic optimism. Unrealistic optimism, a term first introduced by Weinstein
(1980), occurs when people underestimate their risk of experiencing a negative outcome
or overestimate their chance of experiencing a positive outcome. For example, in
Weinstein’s (1980) study, college students thought they were 58 percent less likely to
develop a drinking problem and 50 percent more likely to like their postgraduation job
than their peers. Unrealistic optimism is usually measured by asking individuals to make
comparative risk estimates for a list of possible events that they might experience in the
future. They are asked to rate their chances of experiencing each event relative to their
peers. If the participants believe that they are less likely to experience the negative event
than their peers, then the group is said to be unrealistically optimistic for that event. For
the positive events, the group is unrealistically optimistic if their average is above the
midpoint of the scale (i.e., they believe that they are more likely to experience the
positive event). A less direct method to get comparative risk estimates is to have
participants rate their own risk on one scale and the average person’s risk on another
separate scale. When the mean of the self-ratings is lower than the mean of the other-
ratings for a negative event (and the reverse for positive events), the group is
unrealistically optimistic for that event.

23
Weinstein (1980) hypothesized that people believe their chances of experiencing
negative events are less than average and that their chances of experiencing positive
events are greater than average. Furthermore, Weinstein posited that various
characteristics of the events might influence the degree of unrealistic optimism for the
events. These characteristics included the desirability/undesirability of the event, the
perceived probability of the event, previous personal experience, perceived controllability
of the event, and whether a stereotype exists for the type of person that typically
experiences the event. Weinstein (1980) found evidence for a strong optimistic bias;
people thought that they would experience fewer negative and more positive events than
would their peers. The amount of bias for the particular events varied, and much of this
variance was accounted for by the event characteristics.
In subsequent studies, Weinstein has demonstrated that individuals who falsely
believe that they are less at risk than others fail to take precautions. To the extent that
individuals are motivated to avoid thinking about negative outcomes, they may avoid
taking actions to prevent these undesirable outcomes. Unrealistic optimism was inversely
related to worry about health threats and interest in risk reduction in a sample of college
students (Weinstein, 1982), and unrealistically optimistic homeowners were less likely to
buy radon testing kits than those who accepted that their risk was the same as others
(Weinstein & Lyon, 1999).
There are a few researchers who have looked at dispositional optimism and
unrealistic optimism within the same context. In two studies, Davidson and Prkachin
(1997) measured both dispositional optimism and unrealistic optimism and found a
significant interaction between the two kinds of optimism in predicting exercise behavior

24
and increases in health knowledge. In one study, individuals high in both dispositional
optimism and unrealistic optimism showed the largest decrease in exercise over the
course of the semester, while those high on dispositional optimism but not unrealistic
optimism showed the smallest decrease in exercise behavior. In a second study, a similar
pattern of results was found. Those scoring high on both measures of optimism showed
the least increase in knowledge after attending a lecture on the prevention of coronary
heart disease, while those high on dispositional optimism but low on unrealistic optimism
showed a relatively larger increase in knowledge. The researchers concluded that
dispositional optimists who also believe that they are less at risk than others fail to
perceive the health threat, and therefore, they do not engage their problem-focused
coping skills. In contrast, optimists who do not believe that they are at less risk perceive
the health threat and engage in health-promoting behaviors.
More recently, Radcliffe and Klein (2002) studied the relationships between
different measures of optimism and individuals’ perceptions of and knowledge about
their risks. Participants rated their risk of having a fatal heart attack, the risk of someone
who is the same age and sex, and their risk relative to someone who is the same age and
sex. The participants also completed a measure of dispositional optimism. Individuals
scoring high on dispositional optimism were less worried about their health risk levels
than were non-optimists. This lack of worry appears to be justified by the fact that the
optimists had lower blood pressure, lower overall heart attack risk, higher levels of
activity, and higher life satisfaction than did the pessimists. A similar pattern of results
was found for individuals who rated their risk as lower than that of their peers. These
individuals actually had lower blood pressure, lower overall heart attack risk, higher

25
levels of activity, and higher life satisfaction than lows that rated their risk higher than
others. This study demonstrated that comparative risk estimates are not necessarily
unrealistic; individuals who rated their risk as lower than others actually were at lower
risk than others.
Wishful thinking. Weinstein (1980) developed his measure to assess unrealistic
thinking at the group level. Sigall, Kruglanski, and Fyock (2000), however, wanted a
measure of individual differences in unrealistic thinking. For this purpose, they
developed the Wishful Thinking Scale (WTS) to measure individual differences in
wishful thinking, or the degree to which motivation affects cognition. The WTS consists
of 25 items selected and adapted from Weinstein’s (1980) items. In scoring the WTS,
other-ratings are subtracted from self-ratings for positive items (and the reverse for
negative items). Next, an individual’s score is computed by summing across all items.
The WTS differs from Weinstein’s unrealistic optimism measure in that the scores are
aggregated across events for each individual, rather than aggregating scores across
individuals for each event.
Sigall, Kruglanski, Stangor, and Fyock (1997) found that wishful thinking was not
highly correlated with dispositional optimism (r = .22) and that wishful thinking did
appear to be related to motivated cognition. In Study 2, students who scored high on the
WTS predicted higher grades for themselves than others, but they did not outperform the
low wishful thinkers. This study suggests that wishful thinkers’ judgments about the
future may not be accurate. In a study modeled after Klein and Kunda (1992),
participants were paired with another person and completed a quiz contest against another
pair. High wishful thinkers thought it more likely that their teams would win, compared
26
to low wishful thinkers. Because the participants were always assigned to the role of
questioner and did not have any control over whether they would actually win, this
judgement was presumably motivated by their desire to win. In their final study, Sigall
and his colleagues (2000) hypothesized that wishful thinkers would be more likely to
procrastinate than low wishful thinkers. The wishful thinkers took significantly longer to
report back to the experimenter when they were expecting to complete a boring task.
Thus, the wishful thinkers procrastinated when they were motivated to avoid a boring
task, but not when they expected an enjoyable task. The wishful thinkers also believed
that they would finish the task more quickly than did individuals who scored low on the
wishful thinking scale.
Summary. There is some evidence that illusory beliefs may be motivated by a
desire to avoid unpleasant outcomes (e.g., avoiding a boring task) and to experience
positive outcomes (e.g., winning a game). Furthermore, these unrealistic perceptions may
prevent individuals from taking appropriate precautions (e.g., Weinstein & Lyon, 1999).
However, there is also evidence that those who perceive themselves to be less at risk than
others may actually be less at risk (e.g., Radcliffe & Klein, 2002).
The theories reviewed thus far have generally conceptualized the various types of
optimism as either good or bad. In contrast, Norem and Chang (2001) have taken a more
balanced approach and have argued that optimism researchers need to consider the
potential costs and benefits of optimism, as well as the contexts that might have
implications for the effects of optimism and pessimism.
27
Optimism as a Strategy
Norem and Cantor (1986) coined the terms defensive pessimism and strategic
optimism in reference to two different cognitive strategies that people use to deal with
future events. Defensive pessimism is a strategy in which the individual sets an
unrealistically low expectation for an upcoming performance. These low expectations
create initial anxiety, which the individual then harnesses to work hard and prepare
(Norem, 2001). In contrast, the strategic optimist sets high expectations for upcoming
performances that are generally consistent with prior experience. Strategic optimists are
low in anxiety and avoid thinking about negative outcomes, yet they still prepare for the
future (Norem, 2001).
The two strategies are measured by Norem’s (2001) Defensive Pessimism
Questionnaire (DPQ). The DPQ consists of four pessimism items and eight reflectivity
items, as well as filler items. The pessimism items are similar to the reversed items of the
LOT. An example is, “I go into these situations expecting the worst, even though I will
probably do OK.” The reflectivity items capture the degree to which people think about
future items. Some examples include, “I often think about how I will feel if I do very well
in these situations” and “Considering what can go wrong in academic situations helps me
to prepare.” Respondents who score high on both the reflectivity and pessimism items are
classified as defensive pessimists, those who score low on reflectivity and pessimism are
considered strategic optimists, and everyone else is labeled as aschematic.
Julie Norem and her colleagues have conducted several experimental studies that
examine the effects of getting people to change strategies. This research suggests that
individuals who are defensive pessimists may not benefit from thinking more

28
optimistically. In Norem and Cantor’s (1986) research, some participants were told to
“expect to do well.” In this condition, the pessimists performed worse on the
experimental tasks than those in a control condition. In other similar studies, Norem and
her colleagues (Norem & Illingworth, 1993; Spencer & Norem, 1996) demonstrated that
optimists and pessimists performed worse at tasks when they were not allowed to use
their typical strategies to prepare for the tasks. Defensive pessimists performed worse at
an arithmetic task when they were not allowed to engage in thought about what would
happen on the performance task (Norem & Illingworth, 1993). Additionally, the
pessimists who were not encouraged to think about the task reported feeling more
anxious, and skin conductance readings were consistent with the self-reports. Defensive
pessimists performed the best at a dart-throwing task when they were allowed to imagine
correcting their mistakes, and they performed relatively worse when they imagined a
flawless performance or tried to relax (Spencer & Norem, 1996). This research suggests
that one cannot simply use a positive-thinking strategy and expect better performance.
Imposing such a strategy on anxious individuals may actually result in decrements in
performance.
When strategic optimists were not allowed to use their normal strategies, their
performances declined. Norem and Illingworth (1993) included a condition in which
participants were encouraged to think about their future performance with a thought-
listing task. Strategic optimists who performed the thought-listing task were more
anxious in this condition than optimists who were assigned to work on an unrelated task.
Moreover, strategic optimists performed the best in conditions, such as the relaxation
condition (Spencer & Norem, 1996), which imitated their normal strategies

29
Norem (2001) has argued that the psychological context is very different for
strategic optimists and defensive pessimists. The defensive pessimists have much anxiety
about their upcoming performance, even though they have been successful in the past. On
the other hand, strategic optimists are low in anxiety. Thus, defensive pessimists and
strategic optimists experience the same performance situation differently. The different
psychological contexts require the use of different strategies. Norem (2001) describes the
task of defensive pessimists as managing anxiety to keep it from interfering with their
performance. The task of strategic optimists is to maintain a positive outlook, so that they
do not experience anxiety.
Summary
Although dispositional optimism, optimistic explanatory style, and hope were
related to better mental and physical health, and greater academic performance, positive
expectations are clearly not a panacea for all of life’s problems. The work of Weinstein
and Norem has established that positive thinking can sometimes lead to less interest in
risk reduction and decrements in academic performance. Furthermore, several conflicting
findings suggest that optimism is more complex than many theories would suggest.
Although there is a great deal of research linking positive beliefs to positive outcomes,
there are also a number of exceptions to the general pattern of results. The next section
will consider several explanations for these incongruent findings.
Understanding the Complexity of Optimism
One view is that optimism is adaptive, but too much optimism is not. Another
view suggests that the effects of optimism and pessimism are context-dependent. A final

30
explanation holds that there are different kinds of optimism, some that are mostly
adaptive and some that are less so. Each of these views will be considered in this section.
Too Much Optimism?
Research on depressive realism suggests that it is the happy people who are
unrealistic (Alloy & Abramson, 1979). Accurately estimating one’s successes, efficacy,
and other good qualities is associated with depression. Yet overconfidence in one’s
abilities may lead to unrealistic, unachievable goals. Baumeister (1989) noted that small
positive illusions might be advantageous, whereas larger distortions might be associated
with disadvantages such as overconfidence and nonproductive persistence. Thus, a
curvilinear relationship between positive beliefs and success was suggested. Too little
optimism should lead to depression and a failure to take appropriate risks, while on the
contrary, too much optimism would lead to performance outcomes that do not stand up to
one’s wildly inflated expectations. Taylor and Brown (1994) concurred that it is “mild”
positive illusions that are adaptive, whereas “extreme levels” of positive illusions might
be maladaptive (p. 24).
A test of Baumeister’s optimal margin hypothesis would require the use of
statistics that can detect curvilinear relationships. Unfortunately, most studies of positive
beliefs report statistical tests that reveal linear relationships among variables, such as the
Pearson product moment correlation or a median split between optimism and pessimism.
Wallston (1994) suggested that this reliance on linear statistics may be responsible for the
inconsistent relationships between optimism and adaptive behavior.
Among the few studies that do examine their data for curvilinear relationships,
evidence to support Baumeister’s hypothesis has been mixed. For instance, Taylor,
31
Lerner, Sherman, Sage, and McDowell (2003) examined the relationship between
multiple measures of self-enhancement and mental health. While a positive linear
relationship was found, there was no evidence for a curvilinear one. However, it is
possible that Taylor and colleagues’ (2003) data did not reveal a curvilinear relationship
between self-enhancement and mental health due to the restricted range of mental health
among the college students who participated in their study. The students were screened
for serious mental and health problems, use of mental health-related drugs, and current
treatment by a mental health practitioner. If the students who were excluded from the
study consisted of individuals at the maladaptive end of the self-enhancement range, the
chances of finding a curvilinear relationship would be reduced.
Devine and colleagues (2000) conducted a longitudinal study investigating the
relationship between optimism and depression in a sample of inner city African American
women. Optimism was a significant predictor of depressive symptomatology 12 to 14
months later. For women who were not infected with HIV, the relationship between
optimism and depressive symptoms was U-shaped. That is, both low and high levels of
optimism were related to more depressive symptomatology. This finding is consistent
with Baumeister’s hypothesis. However, for the HIV-infected women, an inverted U-
shaped relationship was found. In this sample, both low and high optimism were the most
beneficial, whereas moderate levels of optimism were related to more depressive
symptomatology.
Baumeister’s explanation makes good sense. Any generally positive trait taken to
an extreme may have some costs. Nonetheless, the current literature fails to clearly
support or refute Baumeister’s hypothesis that one can be too optimistic. Few studies
32
have used statistics that would reveal curvilinear relationships. Even when the
appropriate statistics are used, the use of convenience samples raises the possibility of
range restriction, which may distort the relationship observed between optimism and well
being.
Placing Optimism in Context
Advocates of optimism occasionally acknowledge that too much optimism may
be a problem. However, the bulk of the research and theory on optimism clearly
emphasizes the positive aspects of optimism and the negative aspects of pessimism.
Interventions focus on making people more optimistic, despite the possibility that
individuals may develop unrealistically positive expectations for the future. This overly
optimistic view of optimism may be responsible for the lack of research on contexts
where optimism may have costs. A consideration of the costs and benefits of optimism in
different contexts would not only better inform the development of appropriate
interventions, but it may also resolve some of the inconsistencies within the optimism
literature.
Optimism research has typically focused on narrow sets of outcome variables
related to well being and coping. Even if optimism interventions have a positive effect on
an individual’s subjective well being, what are the effects of such interventions on other
aspects of functioning? Perhaps optimists would be most helpful for creative tasks and in
situations that require energetic persistence, while pessimists would be more effective at
detail-oriented tasks and in situations that require caution. This point may explain why
the findings regarding the role of optimism in academic achievement have been so
contradictory. Different studies have sampled from different populations of students in

33
different situations. An optimistic outlook was positively related to achievement among
school children (Pajares, 2001; Yates et al., 1995) and university freshmen (Gibbons, et
al., 2000; Peterson & Barrett, 1987). In contrast, pessimism was related to better
achievement among law students (Satterfield, et al., 1997) and upper-level marketing
majors (LaForge & Cantrell, 2003). Although the reason for this contradictory pattern of
results in not clear, pessimism appears to be an advantage in certain contexts. However,
few research programs have attempted to uncover the potential benefits of pessimism.
In his critique of the positive psychology movement, Lazarus (2003) disputed the
notion that psychology should focus more on the positive qualities of humans. Rather
than promoting optimism, Lazarus suggested that the world is more in need of pessimists
to mobilize outrage against social evils. The effects of optimism and pessimism on how
individuals view and respond to social injustices—prejudice, discrimination, slavery,
genocide, and the like—are unknown. On one hand, it seems possible that optimists may
have positive expectations about their ability to bring about social change, and therefore,
may actually work harder to bring about change. On the other hand, if Lazarus is correct,
being optimistic may blind individuals to the suffering of others.
It is conceivable that optimists are best suited to cope with certain kinds of life
events, while pessimists are best able to deal with other kinds of events. Isaacowitz and
Seligman (2001) studied the relationship between explanatory style and depressive
symptoms in a sample of adults aged 64 to 94 years. At the outset of the study,
explanatory style, depressive mood, and life events were measured. At a one-month, six-
month, and one-year follow-up session, depressive mood and life events were measured
again, The results of the study were the opposite of those found with samples of younger
34
adults (e.g., Metalsky, et al., 1982). At the six-month and one-year follow-ups, a
significant interaction between explanatory style and life events in predicting depressive
symptoms was found. Optimists who experienced negative life events became more
depressed than pessimists who experienced negative life events. The different nature of
the life events that are experienced at different stages of life may be responsible for the
contrasting results. An optimistic explanatory style encompasses the view that negative
events are temporary. This view may not be helpful for individuals facing negative life
events of a permanent nature (e.g., death of a friend), which the older adults were more
likely to experience than the younger adults.
Another type of context, which Norem and Chang (2001) referred to as the
intrapsychic context, adds further support to the argument that optimism interventions are
not a one-size-fits-all solution for life’s problems. Optimism and pessimism are traits that
may have developed as strategies to deal with different psychological situations. Norem
and her colleagues (Norem & Cantor, 1986; Norem & Illingworth, 1993; Spencer &
Norem, 1996) have demonstrated that anxious individuals use pessimism as a method of
harnessing their anxiety. Furthermore, Norem’s research has clearly shown that getting
optimists or pessimists to change strategies harms their performance. Although
individuals who are typically optimistic or pessimistic may be facing the same objective
situation, the situation is different psychologically for optimists and pessimists. Optimism
and pessimism are interrelated with other personality traits that create different
psychological contexts for optimists and pessimists. For example, pessimism is correlated
with anxiety and neuroticism, whereas optimism is correlated with extraversion and
positive affect. Anxious individuals who use defensive pessimism as a strategy fare better

35
than anxious individuals who do not (Norem & Chang, 2002). Anxious individuals
demonstrated increases in self-esteem and satisfaction, better academic performance,
greater social support networks, and more progress toward goals than those who did not
use defensive pessimism.
Achieving success and satisfaction is much more complicated than simply
thinking positively about the future. Although optimism has been associated with many
positive outcomes, concluding that optimism is better than pessimism is an
oversimplification. Future research and theory on optimism should embrace the
complexity of this construct, including the variety of interpersonal, social, and
intrapsychic contexts within which optimism may be beneficial or detrimental.
consequences.
Different Kinds of Optimism
Adding to the complexity of optimism is the possibility that there are different
varieties of optimism that have different consequences. Schwarzer (1994) and more
recently, Schneider (2001) argued that there might be an important distinction between
realistic and unrealistic future-oriented beliefs. Unfortunately, much research has failed to
address this distinction and has even assumed that optimism and realism are at opposite
ends of the same continuum. Taylor and her colleagues (e.g., Taylor & Brown, 1988;
Taylor & Armor, 1996) made no distinction between realistic and unrealistic optimism.
According to Taylor and Gollwitzer (1995), people are either realistic or optimistic,
depending on their mindset. They proposed that there are times when people need to be
realistic, particularly when they are in a deliberative mindset in which different goals are
evaluated. However, when people are in an implemental phase, positive beliefs can help
36
them achieve their goals by fostering motivation. In Taylor and Gollwitzer’s (1995)
studies, mindset (deliberative or implemental) was manipulated, and positive beliefs (i.e.,
levels of mood, optimism, risk perception, and self-esteem) were measured. Individuals
in the implemental phase were more positive than those in the deliberative phase.
However, these positive beliefs were not necessarily unrealistic as Taylor and Gollwitzer
assumed. If an individual is likely to achieve a particular goal, then it is realistic to hold a
positive expectation. In many situations in life, it would be unrealistic to expect failure.
Schwarzer (1999) has maintained that optimism and realism are orthogonal
concepts, and that a combination of both realism and optimism is the most adaptive.
Functional optimism—which is comprised of dispositional optimism, self-efficacy, and
optimistic explanatory style—is necessary throughout the different phases of self-
regulation from goal setting to goal attainment. Schwarzer (1999) surmised that
functional optimism helps people to set realistic and challenging goals, to imagine future
success, and to respond to barriers and setbacks with new strategies.
Schwarzer considers both pessimism and unrealistic optimism to be maladaptive.
According to Schwarzer (1999), pessimism may lead to a failure to form any goals at all,
whereas being overly optimistic may lead to inappropriate goals and non-productive
persistence. Biases in risk perception, which Schwarzer (1994) termed defensive
optimism, may be particularly detrimental when individuals are threatened with a
negative outcome. Defensive optimists may fail to notice threats and thus, fail to develop
behavioral intentions to avert those threats. On the contrary, functional optimism turns
risk awareness into preventive action.
37
Schwarzer (1994; 1999) has made a sensible argument for a conceptual
distinction between different kinds of optimism. However, a major problem with his
approach is that the his explanation cannot be adequately tested. Current measures of
optimism, such as the Life Orientation Test (LOT; Scheier & Carver, 1985) were not
designed to measure different kinds of optimism. “Functional” optimism may not always
be functional, and “defensive” optimism may sometimes be functional. Many studies,
including many of those reviewed in this paper, are consistent with these
conceptualizations of optimism, yet mounting research suggests that dispositional
optimism is not always accurate or adaptive. This point is clearly illustrated by the
optimistic gamblers who refused to change their expectations about winning, even when
they had a history of losses (Gibson & Sanbonmatsu, 2004). One reason that optimists
may not change their expectations is that they have a positively biased memory.
Optimistic gamblers were more likely to remember losses as “near-wins” than pessimists
(Gibson & Sanbonmatsu, 2004). Moreover, Norem (2001) found that optimists tended to
remember positive feedback better than negative feedback, while pessimists remembered
relatively more of the negative feedback. Generalized outcome expectancies (i.e.,
whether individuals generally expect to experience positive or negative outcomes in the
future) may be due in part, to motivated cognition. An individual who scores high on this
measure of optimism might be a realistic optimist (someone who is basing their
expectations on past outcomes) or a wishful thinker (someone who is basing their
expectations on what they want to happen). The validity of using measures of
dispositional optimism to capture realistic, or functional optimism appears to be
questionable.

38
A similar problem arises when comparative risk estimates are used to assess the
construct defensive optimism. Individuals who believe that they are less at risk than
others may actually be less at risk. These measures may confound wishful thinking and
realistic optimism.
Realistic Optimism and Wishful Thinking
Optimism is an expectation for the future that may have many different kinds of
antecedents. Some expectations may be based on relatively objective information,
whereas some expectations may stem from biased thinking. This point has been well
documented by research on motivated cognition (Kunda, 1990). Expectations based on
biases may be relatively common, and situational variables may influence the extent of
this motivated reasoning.
There may also be individual differences in the extent to which people typically
engage in such thinking (e.g., Sigall et al., 1997). An individual who frequently makes
judgments influenced by his or her motivation is known as a wishful thinker. Wishful
thinking is conceptualized as a positive expectation that is rooted in defensive processing.
Wishful thinking typically involves an avoidance of thinking and preparing for
unpleasant future outcomes. Wishful thinking also involves an assumption that positive
outcomes are assured.
In contrast, realistic optimism is a positive expectancy that is based on relatively
objective information, derived from past experience, including an individual’s knowledge
about his or her abilities to attain desired outcomes and avoid unpleasant outcomes.
Furthermore, realistic optimists pay attention to important aspects of the situation that are

39
relevant to attaining desired outcomes. Realistic optimism typically involves an
awareness of the contingencies between one’s behavior and future outcomes.
In summary, realistic optimism and wishful thinking are judgments about the
future that are based on different factors. Individuals who typically hold unrealistic
positive beliefs (i.e., wishful thinkers) base their predictions on their desire to experience
success or to avoid negative outcomes, rather than aspects of the situation. Unrealistic
individuals will avoid or discount information that might disconfirm what they want to
believe. In contrast, individuals who typically hold realistic beliefs (i.e., realistic
optimists) base their predictions on information about the situation and their own abilities
to deal with the situation, rather than their motivation to succeed.
Because current measurement techniques may confound wishful thinking and
realistic optimism, it is not clear whether expectations based on different kinds of
information are associated with different patterns of behavior. The present framework
makes several general predictions regarding the expected pattern of outcomes for the two
kinds of optimism.
First, the differential attention hypothesis suggests that realistic optimists and
wishful thinkers will pay attention to different kinds of information. Realistic individuals
will have a tendency to pay attention to feedback that is relevant to their goals, regardless
of whether the information is positive or negative. In contrast, wishful thinkers will avoid
or discount feedback that is contrary to their desires.
Second, the information upon which people base their judgments has implications
for their behavior (differential action hypothesis). Because realistic optimists are aware of
the contingencies between behavior and outcomes, they should typically take actions to

40
bring about desired outcomes and to avoid undesirable outcomes. The realistic optimists
will generally engage in proactive, problem-focused coping to the extent that they believe
these responses will result in success. In contrast, wishful thinkers should be less likely to
engage in problem-focused coping than realistic optimists. Because wishful thinkers do
not monitor feedback in the same way as realistic optimists, they may be less aware of
obstacles that may impede their goals. Therefore, they will be less prepared to deal with
threats to their health, well being, and goal achievement.
Third, the differential performance hypothesis asserts that the different actions of
realistic optimists and wishful thinkers will be related to differences in the outcomes that
they experience. Realistic optimism may create a self-fulfilling prophecy, in which high
expectations lead to behaviors that bring about those expectations. However, wishful
thinking may create a self-disconfirming prophecy, in which high expectations are part of
an illusion that positive outcomes are assured, thereby reducing the chances that the
individual will take action to bring about the desired outcome.
Finally, the differential accuracy hypothesis holds that some positive beliefs are
generally more accurate than others. Because realistic optimists base their predictions on
their knowledge of their abilities and the situation, they will make relatively accurate
predictions for their own performance. Wishful thinkers, who base their predictions on
motivation, will not make predictions that are as accurate. This is not to say that wishful
thinkers are always inaccurate or that realistic optimists are always accurate, but rather
that realistic optimism is a way of thinking that will generally lead to more positive
outcomes relative to wishful thinking.

41
Chapter 2: Wishful Thinking Studies
The primary purpose of the present research was to develop and validate a new
measure of wishful thinking. Study 1 focused on the development and construction of this
new measure. Study 2 provided additional data on the wishful thinking measure
developed in Study 1. A factor analysis was conducted to explore the factor structure
underlying the items. For purposes of establishing convergent and discriminant validity,
several scales that measure conceptually similar and conceptually distinct constructs were
included in the study.
Study 3 provided validation for the new measure of wishful thinking. A central
assumption underlying the present research is that optimism is an expectation with
different kinds of antecedents. The aim of Study 3 was to examine this assumption more
directly. If wishful thinkers and realistic optimists typically base their judgments on
different kinds of information, then their judgments should vary as a function of the
available and relevant information. More specifically, compared to realistic optimists,
wishful thinkers’ judgments were expected to be relatively more influenced by their
desire (i.e., motivation) than by objective information, when objective information was
available.
Study 1: Development of Items
Method
Participants and procedure. One hundred eighty-three male and female
undergraduates participated in the study. The students received extra credit in their
psychology courses for participating. When the students arrived at the lab, they were
asked to complete a questionnaire containing potential items for the new measure of
42
wishful thinking. Then they completed an indirect measure of bias, which was used to
select items for the new wishful thinking scale.
Scale development. Several items that reflect different aspects of either realistic
thinking or wishful thinking were constructed. For example, the item “When making
decisions, I seek information from many different sources, even those that I may not
agree with” was included to assess whether the individual attempts to seek out objective
information. In contrast, the item “I think the best way to handle most problems is just
not to think about them” was included to capture the defensive nature of wishful thinking.
Many of the items intended to measure wishful thinking were worded to reflect an
extreme amount of control or confidence (e.g., “I believe that I can achieve anything that
I want to life”), whereas other items seem to capture a belief in fate (e.g., “If something
doesn’t work out, then it wasn’t meant to be”). Many of the items intended to measure
realistic thinking allude to an openness to new ideas (e.g., “I am usually willing to try a
new approach to doing things”), positive reframing (e.g., “Even the negative aspects of
life can be opportunities for growth”) and proactive coping (e.g., “I don’t wait around for
my problems to solve themselves”). A total of 32 new items were included in the item
pool (see Appendix A for a complete list of the new items). All items were rated on a
Likert scale ranging from 1 (strongly disagree) to 5 (strongly agree).
Other measures in the item pool. Three additional measures with potential items
for the new measure were completed by participants. Norem’s Defensive Pessimism
Questionnaire (2001) contains several items such as, “I carefully consider all possible
outcomes,” which seem to describe the behaviors of a realistic individual. Similarly,
Snyder and colleagues’ (1991) Hope Scale was included because the items appeared to

43
have potential for measuring realistic thinking. A 15-item measure of optimism (Chang et
al., 1997) comprised of two subscales that measure optimism and pessimism was also
included. An example of an optimism item is “I always look on the bright side of things,”
and an example of a pessimism items is “If something will go wrong for me, it will.”
Revisions to the Wishful Thinking Scale. The Wishful Thinking Scale (WTS)
developed by Sigall and his colleagues (2000) was also included as a measure of wishful
thinking with some additional events included (see Appendix B). The revised version of
the scale consisted of 20 positive life events (e.g., “Getting a great job offer before
graduation,” “Being happily married”) and 24 negative life events (e.g., “Developing
cancer,” “Getting divorced”). The respondents rated the likelihood of each event
occurring in the future for the self and for the average other person of the same age and
sex. These likelihood estimates were rated on a scale ranging from 1 (extremely unlikely)
to 9 (extremely likely).
Indirect measure of bias. Because wishful thinkers may fail to recognize the role
of motivation in their judgments, and therefore, may be unable to report on their biases, it
was important to ensure that the self-report items actually distinguished those individuals
who were motivated to report that they are realistic from those individuals who were
accurately reporting on their behavior. For this purpose, the study included an indirect
measure of bias that assessed the extent to which individuals’ judgments were influenced
by their motivation relative to objective information.
Participants were told that they would be performing two different, yet equivalent
puzzle tasks designed to measure logical skills (see Appendix C for examples of the
puzzles). They were also told that practice with the puzzles could help them develop

44
strategies for solving the puzzles more quickly. They were shown sample puzzles for
each of the two tasks. For one of the tasks, they were told that they would receive $25 if
they could solve the puzzle correctly within the time limit. For the other task, the
participants were told that they would be able to work with a practice puzzle before
completing their timed trial; however, they were offered no money in this condition. The
order of the two conditions was varied randomly, and the particular puzzle associated
with the $25 reward was varied randomly. After receiving these instructions, participants
were asked to make a prediction about the likelihood of success for each of the tasks.
Participants rated the likelihood of solving each of the puzzles on a scale ranging from
0% to 100% (see Appendix D). Participants were also asked to rate the importance of
solving each puzzle on a 7-point scale ranging from 1 (not important to me at all) to 7
(extremely important to me). This item was included to verify that the potential reward of
$25 increased the participants’ motivation to solve the puzzles.
The puzzle tasks had been pilot tested to confirm that the two tasks would be
perceived by the participants as equivalent in difficulty, and participants were also told
that the two tasks were equivalent measures of logical skills. Therefore, any difference in
the way the two puzzle tasks were rated between the two conditions was likely to be a
function of the different kinds of information that participants were given about the two
tasks. The instructions created two kinds of information upon which participants could
base their judgments. When offered $25, the participants had a reason for wanting to do
well at the puzzle (i.e., high motivation). However, when they were offered a chance to
practice at a puzzle, they had an objective reason to actually perform better at the puzzle
(i.e., high objective basis). The difference between participants’ predictions for the two

45
puzzle tasks should reflect the relative weight of the two kinds of information (motivation
vs. objective basis) in forming their judgments. Therefore, bias was indicated by the
belief that success was more likely in the high motivation condition than in the high
objective basis condition.
Results
Manipulation check. As expected, participants rated success at the task as being
more personally important to them in the high motivation condition (M = 4.34, SD =
1.38) than in the high objective basis condition (M = 4.03, SD = 1.30), F (1, 182) = 22.46,
p < .01.
Biased judgments. Each participant’s likelihood rating in the high objective basis
condition was subtracted from his or her likelihood rating in the high motivation
condition. Possible difference scores ranged from -100 to 100, with a 0 indicating that the
participant thought solving the two puzzles was equally likely. Positive scores indicated
bias; that is, participants with positive scores thought solving the puzzle for $25 was
more likely than solving the puzzle after practicing with a sample. Actual difference
scores ranged from -60 to 60 with a mean score of -3.14 and a standard deviation of
15.10.
Item selection. Items were selected from the item pool for the wishful thinking
scale on the basis of the item’s relationship with the measure of bias (i.e., difference
scores). If an item’s correlation with the difference score had a p-value of less than .15,
the item was retained for further analysis in Study 2. An alpha level of .15 was used
(rather than the conventional .05), so that more items could be included in the scale,

46
potentially increasing the reliability of the scale. Items that met this criterion are listed in
Table 1, which displays the correlation coefficients and p-values for each of the items.
A wishful thinking score was computed using the items in Table 1. Items with
negative correlations were reversed scored. Scores on all items were converted to z
scores, because the different measures in item pool used different rating scales.
Revised Wishful Thinking Scale. The Revised Wishful Thinking Scale (RWTS)
was evaluated as an alternative measure of wishful thinking. Because the response format
and scoring of this scale is very different than the other self-report measures in the item
pool, the RWTS items were not combined with the other measures. In scoring the RWTS,
other-ratings were subtracted from self-ratings, and negative items were reversed scored.
Then scores were computed by summing across all items. Scores on the RWTS were not
related to biased judgments, r (181) = -.05, p = .51.
Next, individual items on the RWTS were evaluated to explore whether there was
a subset of items that would be related to biased judgments. Of the 44 items included on
the RWTS, 7 items were significantly related to bias (p < .15). The mean of this subset of
RWTS items was positively related to scores on the new wishful thinking scale, r (181) =
.17, p = .02. Both the mean of the RWTS items and the mean of the new wishful thinking
items were positively related to bias, r (181) = .28, p < .01 and r (181) = .38, p < .01,
respectively; the difference between these correlations was not statistically significant, t
(180) = 1.71, p > .05. The mean of both RWTS items and the mean of the new wishful
thinking items were simultaneously entered into a regression equation to determine which
scale would be the best predictor of biased judgments. Both wishful thinking scales were
significant predictors of bias; however, the regression coefficient for the new wishful

47
thinking scale was larger (B = .33, p < .01) than the regression coefficient for the items
derived from the RWTS (B = .21, p < .01).
Table 1
Correlations between Items and the Indirect Measure of Bias (Difference Score)
Itemr
p-valueWT4 I worry that I won’t be able to accomplish what I want in life. -.13
.09
WT9 I ignore pessimists. .12.10
WT13 Really wanting to achieve a goal raises my expectations. .13.09
WT14 I never doubt that things will turn out okay. .15.05
WT25 I don’t care to think negatively about the future. .11.13
WT28 I often see challenges where other people see problems. -.11.14
HOPE1 I can think of many ways to get out of a jam. -.22.05
HOPE2 I energetically pursue my goals. -.19.09
HOPE6 I can think of many ways to get the things in life that are important to me. -.21.06
HOPE12 I meet the goals that I set for myself. -.17.13
DPQ6 I imagine how I would feel if things went badly. -.19.10
DPQ7 I try to picture how I could fix things if something went wrong. -.25.02
DPQ9 When I want to do my best in a particular situation, I spend a lot of time planning. -.26.02
ELOT14 In general, things turn out all right in the end. .40<.01
N = 183
Note: WT items were written specifically for this measure, HOPE items were adapted from the Hope Scale(Snyder et al., 1991), DPQ items were taken from the Defensive Pessimism Questionnaire (Norem, 2001),and ELOT14 was taken from the Extended Life Orientation Test (Chang, et al., 1997).

48
Discussion
Fourteen items were selected for a new measure of wishful thinking. Participants
who endorsed items on the wishful thinking measure thought that they were more likely
to solve a puzzle for which $25 was offered than a puzzle that they could practice at
before trying to solve it.
Although the new wishful thinking measure was a stronger predictor of bias than
the Revised Wishful Thinking Scale, more research was needed to establish the reliability
and validity of the new measure. Two additional studies were conducted for this purpose.
Study 2: Factor Analysis and Validation
Study 2 was conducted with two goals in mind. The first goal was to establish the
reliability of the wishful thinking measure. For this purpose, an internal consistency
analysis was conducted, and the factor structure of the items was explored. The second
goal was to begin establishing the convergent and discriminant validity of the wishful
thinking measure.
Method
Participants and procedure. Three hundred thirty-three undergraduates enrolled
in various psychology courses were recruited to participate in the study. The students
received extra credit for their participation. Students were asked to complete a
questionnaire containing the item pool from Study 1 and several other measures, which
are described in the following sections. Due to time limitations in the administration of
the questionnaires, not all measures were included in every questionnaire, which accounts
for the different degrees of freedom that are reported for the statistical analyses.

49
Measures. All participants completed the item pool, which included the items
developed in Study 1, the Defensive Pessimism Questionnaire (Norem, 2001), the Hope
Scale (Snyder, et al., 1991), and Extended Life Orientation Test (Chang, et al., 1997). In
an effort to begin establishing the convergent and discriminant validity of the new
measure, several additional measures were administered along with the item pool. These
included the Balanced Inventory of Desirable Responding (Paulhus, 1991), the Marlowe-
Crowne Social Desirability Scale (Crowne & Marlowe, 1960), a measure of Just World
Beliefs (Lerner & Miller, 1978), and a multidimensional coping inventory (Carver, et al.,
1989).
Self-deceptive enhancement (SDE) was assessed with a scale from the Balanced
Inventory of Desirable Responding (BIDR; Paulhus, 1991). The scale consists of 20
items measuring the tendency to present a positively biased report of the self. Sample
items include “I don’t care to know what other people really think of me” and “I never
regret my decisions.” Participants rated their agreement with each item on a scale ranging
from 1 (strongly disagree) to 7 (strongly agree). A score was computed by adding one
point for each extreme response (6 or 7). The SDE scale has shown good internal
consistency (coefficient alphas ranging from .68 to .80) and satisfactory test-retest
reliability over a 5-week period (.69; Paulhus, 1991). Self-deceptive enhancement was
related to repression, self-serving bias after a failure, and excessive confidence in
memory judgments (Paulhus, 1991). Therefore, it is reasonable to expect SDE to be
positively related to wishful thinking.
The BIDR (Paulhus, 1991) also contains an impression management (IM) scale.
The IM scale consists of 20 items measuring the tendency to overreport positive

50
behaviors and underreport negative behaviors. Sample items include “I never take things
that don’t belong to me” and “I sometimes drive faster than the speed limit.” Items were
scored in the same manner as the SDE scale. Although high scorers on the IM scale may
give biased reports of their good and bad qualities, this construct is conceptually distinct
from wishful thinking. Whereas high impression management scores may indicate a
tendency to tailor one’s responses to an audience, high wishful thinking scores indicate a
tendency to tailor one’s responses to what one wants to believe. Hence, wishful thinking
is not expected to correlate strongly with IM scores.
The 33-item Marlowe-Crowne Social Desirability Scale (Crowne & Marlowe,
1960) is comprised of items representing desirable, uncommon behaviors (e.g., “When I
don’t know something I don’t at all mind admitting it”), as well as reverse-keyed
undesirable, common behaviors (e.g., “I like to gossip at times”). The respondent rates
each of the behaviors as true or false. Crowne and Marlowe (1964) reported that
individuals with high Marlowe-Crowne scores are more influenced by others, avoid
evaluations by others, and have a high need for approval.
Lerner and Miller’s (1978) Just World Scale was used to assess the extent to
which participants believe that the world is a just place and that people get what they
deserve. Items such as, “Basically, the world is a just place” and “By and large, people
deserve what they get” were rated on a scale ranging from 1 (strongly disagree) to 6
(strongly agree). The scale contained 20 items, including 9 reverse-keyed items (e.g.,
“Many people suffer through absolutely no fault of their own”). Belief in a just world was
conceptualized as a motivational bias that helps people adapt to the harsh realities of the
world. Individuals who hold this belief want to believe that they have some control over
51
their fates, that bad things only happen to bad people, and good things happen to good
people. Because belief is a just world is a motivational bias, it was expected to be related
to wishful thinking.
Carver and colleagues’ (1989) multidimensional coping inventory (COPE)
assessed various dimensions of coping. Five of the problem-focused coping
dimensions—active coping, planning, suppression of competing activities, restraint
coping, and seeking of instrumental support—are conceptually distinct from wishful
thinking. Problem-focused coping would require an individual to recognize that a
problem exists, which is something that a wishful thinker might be motivated to avoid
thinking about. Several additional coping dimensions serve the goal of dealing effectively
with distress caused by a problem, rather than dealing directly with the problem itself.
These emotion-focused dimensions include positive reinterpretation and growth, venting
of emotion, acceptance, and denial. The COPE also contains three avoidant coping styles:
behavior disengagement, mental disengagement, and alcohol/drug disengagement.
Participants rated how often that engaged in each activity on a scale ranging from 1
(never) to 5 (always).
Results
Internal consistency. An analysis of the internal consistency of the scale found
that several items had poor item-total correlations. Therefore, items were removed one at
a time to increase alpha. This process was repeated until there were no items to remove
that would substantially increase the reliability of the scale. As a result of this analysis,
four items (Hope 1, 2, 6, & 12) were deleted from the wishful thinking measure to
increase the internal consistency of the scale (α = .67). Table 2 displays the item-total
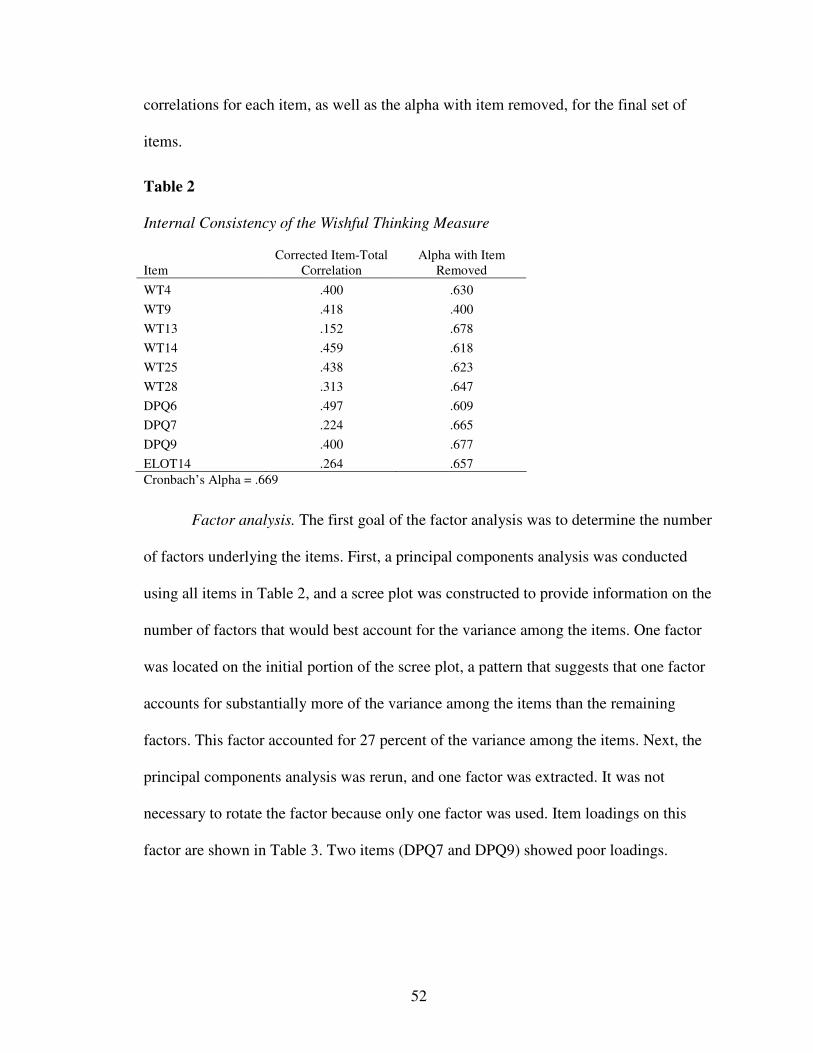
52
correlations for each item, as well as the alpha with item removed, for the final set of
items.
Table 2
Internal Consistency of the Wishful Thinking Measure
ItemCorrected Item-Total
CorrelationAlpha with Item
Removed
WT4 .400 .630
WT9 .418 .400
WT13 .152 .678
WT14 .459 .618
WT25 .438 .623
WT28 .313 .647
DPQ6 .497 .609
DPQ7 .224 .665
DPQ9 .400 .677
ELOT14 .264 .657Cronbach’s Alpha = .669
Factor analysis. The first goal of the factor analysis was to determine the number
of factors underlying the items. First, a principal components analysis was conducted
using all items in Table 2, and a scree plot was constructed to provide information on the
number of factors that would best account for the variance among the items. One factor
was located on the initial portion of the scree plot, a pattern that suggests that one factor
accounts for substantially more of the variance among the items than the remaining
factors. This factor accounted for 27 percent of the variance among the items. Next, the
principal components analysis was rerun, and one factor was extracted. It was not
necessary to rotate the factor because only one factor was used. Item loadings on this
factor are shown in Table 3. Two items (DPQ7 and DPQ9) showed poor loadings.

53
Table 3
Item Loadings for the Wishful Thinking Measure
ItemItem Loadings
on Factor 1
WT4 -.589
WT9 .641
WT13 .295
WT14 .657
WT25 .635
WT28 .533
DPQ6 -.631
DPQ7 -.280
DPQ9 -.224
ELOT14 .419Eigenvalue = 2.679Note: Items with negative loadings were reversed scored.
Convergent and discriminant validity. Optimism scores were computed using
items from the ELOT (α = .74), not including item 14 because this item was used on the
wishful thinking scale. Correlation coefficients were computed for all measures included
in the study (see Table 4). Wishful thinking showed convergent validity with optimism
and pessimism. Wishful thinking was related positively to optimism, r (234) = .63, p <
.01, and negatively to pessimism, r (234) = -.52, p < .01.
As expected, wishful thinking showed convergent validity with other measures of
motivational biases. Wishful thinkers showed a tendency to believe in a just world, r
(107) = .30, p < .01, and to engage in self-deceptive enhancement, r (234) = .45, p < .01.
Wishful thinking was also related to social desirability bias, as measured by the Marlowe-
Crowne Social Desirability Scale, r (213) = .33, p < .01. However, wishful thinking was
not related as strongly to the Impression Management scale of the BIDR, r (234) = .18, p
= .01.

54
The wishful thinking scale showed discriminant validity with problem focused
coping. Wishful thinking was not strongly related to active coping, r (224) = .18, p = .01,
nor was it related to planning, r (224) = .04, p = .60, suppression of competing activities,
r (224) = .07, p = .28, restraint coping, r (224) = -.07, p = .32, and seeking instrumental
social support, r (224) = -.02, p = .82.
With the exception of positive reinterpretation and growth, r (224) = .39, p < .01,
wishful thinkers were not more likely than realists to use emotion-focused coping
Wishful thinking was not related to seeking emotional support, r (224) = .01, p = .85,
acceptance, r (224) = -.03, p = .67, and denial, r (224) = -.02, p = .73. Wishful thinkers
were less likely to vent emotion than realists, r (224) = -.21, p < .01.
Wishful thinkers were less likely to use behavioral and mental disengagement as
coping strategies, r (224) = -.14, p = .04 and r (224) = -.13, p = .05, respectively. Wishful
thinkers were not more likely to report the use of alcohol or drugs in order to cope with
problems, r (224) = -.05, p = .47.

Table 4
Correlations Among Measures
Measure 1 2 3 4 5 6 7 8 9 10 11 12 13 14 15 16 17 18 19
1. Wishful Thinking —
2. Optimism .63* —
3. Pessimism -.52* -.54* —
4. Just World Beliefs .30* .30* -.29* —
5. Social Desirability .33* .29* -.02 .09 —
6. Self-DeceptiveEnhancement
.45* .39* -.15 .26* .46* —
7. Impression Management .18* .16 -.07 .20* .49* .38* —
8. Active Coping .18* .29* -.31* .25* .07 .39* .14 —
9. Planning .04 .20* -.26* .09 .08 .27* .08 .57* —
10. Suppression .07 .14* -.13 .44* -.05 .04 -.11 .40* .45* —
11. Restraint -.07 -.11 .10 .00 .12 .06 -.01 .02 .08 .05 —
12. Instrumental SocialSupport
-.02 -.03 -.10 .03 .01 -.10 -.06 .19* .39* .15* .10 —
13. Emotional SocialSupport .01 .01 -.14* .12 .05 -.15 -.03 .05 .15* .05 .02 .67* —
14. Positive Reinterpretation .39* .37* -.28* .14 .23* .26* .12 .37* .37* .17* .20* .29* .19* —
15. Venting Emotion -.21* -.13* .01 -.02 -.06 -.17* .01 .05 .04 .04 -.05 .37* .62* -.07 —
16. Acceptance -.03 -.07 .07 .02 .03 .06 -.05 .09 .16* .06 .31* .15* .02 .39* -.04 —
17. Denial -.02 .03 .15* -.09 -.11 -.13 -.17* -.18* -.27* -.14* .05 -.12 -.02 -.08 .11 -.15* —
18. BehavioralDisengagement
-.14* -.23* -.18* -.23* -.19* -.23* .25* -.23* -29* -.25* .15* .03 .00 -.13* .12 .12 .39* —
19. Mental Disengagement -.13* -.17* .18* -13 -.26* -.23* -.26* -.16* -.18* -.26* .23* .14* .12 .09 .10 .24* .37* .36* —
20. Alcohol/DrugDisengagement
-.05 -.09 .15* -.13 -.23* -.09 -.17* -.06 -.19* -.18* .06 .10 .10 -.04 .01 .02 .36* .34* .34*
* p < .05
56
Discussion
The wishful thinking measure showed acceptable internal consistency after four
items were deleted from the scale. A factor analysis found that few of the item loadings
were relatively weak. These items were not removed from the scale, because doing so
would not have substantially improved the internal consistency of the scale.
The wishful thinking measure demonstrated convergent validity with other
measures of bias, including self-deceptive enhancement, belief in a just world, and social
desirability. The common theme among these measures is that each is a belief or
judgment that is influenced by motivation. The motive underlying the self-deceptive
enhancement and social desirability measures is the desire to hold a positive view of the
self. A different motive is responsible for just world beliefs; the desire in this case, is for
a stable, controllable environment. If one assumes that the world is just, this implies that
one can control outcomes by being a good person.
Wishful thinking showed a weak relationship with impression management,
which is not surprising considering that the type of motivation underlying impression
management is the desire to appear positive, which may be distinct from the desire to
hold a positive view of one’s self or future.
Wishful thinking showed discriminant validity with several coping dimensions.
The common thread among the problem-focused coping responses is that each deals
directly with a problem. Active coping involves taking direct action in an effort to reduce
or eliminate the source of the problem, planning is thinking about how to handle the
problem, suppression of competing activities allows the individual to concentrate more
fully on the problem, restraint coping is holding oneself back from acting prematurely,
57
and seeking social support for instrumental reasons involves gathering information
related to problem-solving. It is not surprising that wishful thinking was not strongly
related to this kind of reflection, because wishful thinkers may fail to recognize potential
problems in attaining their goals and may assume that a positive future is assured.
Wishful thinking was related to positive reinterpretation and growth, which
entails looking for the positive in a stressful situation. This coping response may be
adaptive as a method of managing distress. Wishful thinking was negatively related to
venting emotion. This pattern suggests that wishful thinkers prefer to deal with distress
by reframing the situation as positive, rather than expressing their distress over the
situation. Acceptance and denial are also coping strategies that may be useful for
managing distress. To the extent that wishful thinkers do not want to believe something,
they should engage in denial, which is the refusal to believe that the problem exists.
However, wishful thinkers were not more likely to report the use of denial as a coping
strategy than were realists.
Wishful thinking was negatively related to behavioral and mental disengagement,
which are methods of avoiding problems. Disengagement involves behaviors such as
sleeping and daydreaming. Perhaps wishful thinkers’ penchant for finding the positive in
a situation allows them to reduce their distress and stay engaged with their goals.
Study 3: Validation
The aim of Study 3 was to test the hypothesis that wishful thinkers and realistic
optimists would use different kinds of information in forming their judgments about the
future. More specifically, it was hypothesized that wishful thinkers would be influenced

58
by their motivation, whereas realistic optimists would be influenced by objective
information.
Method
Participants and design. Twenty-nine male undergraduates and 71 female
undergraduates enrolled in various introductory psychology courses were recruited to
participate in the study. The students received extra credit for their participation.
Participants completed measures of wishful thinking and optimism and were randomly
assigned to one of four experimental conditions in a 2 (high or low motivation) x 2 (high
or low objective basis) design.
Procedure. When participants arrived at the lab, they were told that they would be
participating in a two-part study on personality and task performance. First, they would
complete a “personality questionnaire” consisting of the wishful thinking measure, the
Extended Life Orientation Test (Chang, et al., 1997), and some demographic questions.
Second, they would complete a “puzzle task designed to measure logical skills.”
The wishful thinking measure consisted of the 10 items listed in Table 2 (α = .43).
Several additional items from the original item pool in Study 1 were used as filler items
on the questionnaire. All items were rated on a 7-point Likert scale. Because low wishful
thinking scores may indicate realistic optimism or pessimism, Chang and colleagues’
(1997) pessimism scale (α = .88) was included to separate the pessimists from the
realistic optimists.
Participants were randomly assigned to a high or low motivation condition. In the
high motivation condition, they were told that they could receive a cash prize of $25 for
solving the puzzle correctly within a 10-minute time limit. Participants in the low

59
motivation condition were not offered a prize, but were simply asked put their best effort
into solving the puzzle.
Participants were randomly assigned to a high or low objective basis condition.
All of the participants were told that practice is important to solving the puzzles quickly
and that most people can learn new strategies through practice. In both conditions,
participants received 5 minutes to work with a sample puzzle before completing their
timed trial. In the high objective basis condition, the participants were given tips for
solving the puzzles in addition to the sample puzzle. In the low objective basis condition,
the participants simply received a sample puzzle with no strategy tips.
After the practice session, participants were asked to complete a brief
questionnaire similar to the one used in Study 1 (see Appendix D). Participants were
asked to rate the likelihood that they could solve the puzzle during the 10 minute time
limit, given their best effort. Likelihood estimates were rated on an 11-point scale ranging
from 0 to 100 percent. Participants also rated the importance of solving the puzzle on a 7-
point scale.
Finally, participants were given 10 minutes to solve a Nurikabe puzzle (see
Appendix C). There was only one correct solution for the puzzle, and the most effective
way to solve the puzzle required the use of logical skills. All participants were given an
identical puzzle, which was pilot tested to ensure that there would be variability in
performance. The actual performance of the participants was assessed by counting the
number of correctly solved areas on the puzzle. Possible scores ranged from 0 to 12.

60
Results
Preliminary analyses. Preliminary analyses were conducted to assess whether any
of the predictor variables or dependent variables were related to any of the demographic
variables. An alpha level of .05 was used for these analyses and all subsequent statistical
tests. There were no differences in any of the dependent variables or predictors as a
function of age, cumulative grade point average, ethnic group, year in school, or major.
However, gender was related to wishful thinking, r (98) = .27, p < .01. Women had
higher scores on the wishful thinking scale (M = 39.72, SD = 4.31) than did men (M =
36.79, SD = 5.90). The interaction between gender and wishful thinking was tested in a
multivariate regression analysis of perceived likelihood and puzzle performance. The
interactions between gender and wishful thinking were not statistically significant.
Therefore, all further analyses were collapsed across gender.
Manipulation check. Participants in the high motivation condition did not rate
success at the puzzle task as being more important (M = 4.53, SD = 1.38) than those in
the low motivation condition (M = 4.26, SD = 1.36), F (1, 98) = .95, p = .33. Thus, the
motivation manipulation did not appear to have the intended effect.
Wishful thinking and pessimism. Wishful thinking was inversely related to
pessimism, r (98) = -.49, p < .01. Therefore, it is unclear whether individuals with low
wishful thinking scores were pessimists or realistic optimists. In order to make
comparisons between wishful thinkers and realistic optimists, it was important to exclude
pessimists from the analyses. Pessimists were identified by their scores on the pessimism
scale from the ELOT. An examination of the scores for this scale revealed that few
participants were pessimists. Nineteen participants who scored above the midpoint of the
61
pessimism scale were excluded from the following analyses. After removing pessimists
from the analysis, there was not a significant difference in optimism between high
wishful thinkers (M = 14.5) and low wishful thinkers (M = 13.9), t (79) = .99, p = .33.
Likelihood of success ratings. Participants’ ratings of their likelihood of success
ranged from 0 percent to 90 percent (M = 47.80, SD = 20.82). It was hypothesized that
wishful thinkers’ likelihood judgments would be influenced by their motivation.
Therefore, whether or not wishful thinking is related to the perception that success is
likely should depend on whether the wishful thinker wants to be successful. Three
regression analyses were conducted in order to examine the interaction between wishful
thinking and other variables in the study. In each of the following analyses, all of the
main effects and interactions were simultaneously entered into a linear regression
analysis. As recommend by Aiken and West (1991), all predictor variables were centered
prior to conducting the multiple regression analyses in which interaction terms were
entered.
The first regression analysis examined perceived likelihood of success as a
function of wishful thinking and motivation. The main effect of wishful thinking was not
related to perceived likelihood of success, B = -.06, p = .59, nor was motivation related to
perceived likelihood of success, B = -.04, p = .74. The hypothesized interaction between
wishful thinking and motivation was not significant, B = -.12, p = .30.
Next the perceived likelihood of success was examined as a function of wishful
thinking and objective likelihood of success. Objective likelihood was not related to
perceived likelihood of success, B = -.00, p = .98. The hypothesized interaction between
wishful thinking and objective likelihood was not significant, B = -.02, p = .84.

62
A power analysis was conducted to determine whether the sample size was
adequate for detecting a small effect size (.10). For the current sample size (after
excluding pessimists), the likelihood of detecting a small effect using an alpha level of
.05 was 80 percent.
The failure to find the predicted interactions between wishful thinking and the
independent variables in the study may have been caused by a problem with the
manipulation of the independent variables. Therefore, perceived importance, which was
included as a manipulation check, was analyzed as an alternative. This analysis examined
perceived likelihood of success as a function of wishful thinking and perceived
importance. The main effects of wishful thinking, B = -.06, p = .59, and importance, B =
.13, p = .30, were not significant; however, the Wishful Thinking x Importance
interaction was statistically significant, B = .24, p = .05. To the extent that wishful
thinkers rated the task as important, they thought that they were more likely to succeed.
Realistic optimists (i.e., individuals with low wishful thinking scores) did not vary their
likelihood ratings as a function of importance (see Figure 1).

63
0
10
20
30
40
50
60
70
80
90
Low Medium High
Perceived Importance
Low Wishful Thinking
Medium Wishful Thinking
High Wishful Thinking
Figure 1. Likelihood ratings as a function of wishful thinking and perceived importance.
Puzzle performance. Out of a possible score of 12, participants’ scores ranged
from 0 to 9 (M = 3.30, SD = 1.91). Wishful thinking was not related to performance for
the puzzle task, r (79) = -.04, p = .36. A multiple regression analysis was conducted to
investigate whether the wishful thinking and importance interaction would relate to
performance. However, the interaction was not statistically significant, B = .09, p = .47.
Although wishful thinkers thought they were more likely to solve the puzzle when it was
important to them to do so, their performance did not improve as a function of
importance.
Relationships between pessimism and dependent variables. Although the present
research did not specify any predictions regarding pessimism, the data were analyzed to
explore possible relationships between pessimism and the dependent variables. Two
regression analyses were conducted in order to examine the role of pessimism in
likelihood ratings and performance. The first regression analysis examined perceived
64
likelihood of success as a function of pessimism and perceived importance. All of the
main effects and interactions were simultaneously entered into a linear regression
analysis. The main effect of pessimism was negatively related to perceived likelihood of
success, B = -.32, p < .01, and importance was positively related to perceived likelihood
of success, B = .32, p < .01. Pessimists did not vary their ratings of likelihood as a
function of importance, B = .09, p = .40. A second regression analysis was conducted to
investigate whether pessimism was related to performance. Pessimism was negatively
related to the number of areas solved on the puzzle task, B = -.29, p = .01.
Optimal margin hypothesis. Baumeister’s optimal margin hypothesis predicted
that “too much” optimism may be associated with overconfidence and performance
outcomes that do not measure up to expectations. This hypothesis was investigated with a
regression analysis, in which dispositional optimism and dispositional optimism-squared
were entered as predictors of likelihood judgments and performance. There was no
evidence for a curvilinear relationship between optimism and perceived likelihood of
success, B = -.06, p = .93. Optimism-squared was related to the number of areas solved,
however, B = 1.63, p = .03. Both those individuals with low optimism scores and those
with high optimism scores performed better than did individuals with medium levels
optimism. A similar analysis was conducted with wishful thinking. Wishful thinking did
not have a curvilinear relationship with likelihood judgments (B = -.84, p = .40) or
performance (B = -1.71, p = .09).
Discussion
Although there was adequate variability in the dependent variables (i.e., perceived
likelihood of success and puzzle performance), the predicted interactions between
65
wishful thinking and the independent variables were not found. A manipulation check
suggested that the $25 reward failed to motivate students.
Despite this failure, an analysis of the interaction between participants’ ratings of
importance and their wishful thinking scores suggested that wishful thinkers’ judgments
were indeed influenced by motivation. For wishful thinkers, the more important solving
the puzzle was to them, the more they thought they could solve the puzzle. This pattern is
consistent with the wishful thinking framework and implies that the wishful thinking
measure is a valid measure of motivational bias.
While this study garnered some evidence for the validity of the wishful thinking
measure, the scale demonstrated poor internal consistency (α = .43) in this sample of
students. This finding suggests that the scale needs more refinement to increase the
internal consistency among the items.
The study did not find any evidence in support of Baumeister’s optimal illusion
hypothesis. Very high levels optimism were not related to greater likelihood judgments
than individuals’ with moderate levels of optimism, but very high optimism was related
to better performance. This pattern suggests that high levels of dispositional optimism are
not necessarily illusory or maladaptive.

66
Chapter 3: General Discussion
Wishful thinking was conceptualized as a positive expectation for the future that
is based on one’s motivation to experience positive outcomes. Individuals may believe
that they are likely to experience positive outcomes, such as success at an intellectual
task, because these outcomes are desirable. Past research has found that motivational
biases are prevalent (e.g., Kunda, 1991). This dissertation contends that wishful thinking
is not only common, but that there are also individual differences in the extent to which
people tend to engage in wishful thinking. Wishful thinkers are individuals who often
allow their judgments to be influenced by motivation, whereas realistic individuals prefer
to use objective information in making their judgments when such information is
available.
Research Summary and Implications
Scale Development
The present research developed a new self-report measure to capture individual
differences in wishful thinking. In Study 1, self-report items were selected from the item
pool if they were related to biased judgments. Bias was assessed by having participants
rate their expected performance on two different tasks. Because the two tasks were said
to be equivalent, a “realistic” judgment would have been to judge success at the task with
practice as more likely than success at the $25 task, whereas a “biased” judgment would
have involved rating success at the $25 task as more likely than the task with practice.
Participants were not asked to report directly on their biases because wishful thinkers
may be unaware of their biases and therefore, unable to report them.
67
Several self-report items were predictive of the degree of bias in participants’
judgments. That is, individuals who endorsed certain items in the item pool thought that
they were more likely to solve a task for money than a task for which they could practice.
This subset of items identified in Study 1 was used to develop the wishful thinking
measure used in subsequent research.
Reliability
Study 2 sought to improve the reliability of the wishful thinking measure by
deleting four items from the scale. In this study, the wishful thinking measure had an
acceptable level of internal consistency, as measured by Cronbach’s alpha. However, the
scale showed poor internal consistency in Study 3.
Validity
The wishful thinking measure was related to other measures in the studies in
theoretically meaningful ways, demonstrating some evidence for the construct validity of
the measure.
Wishful thinking and measures of bias. Study 2 found that wishful thinking was
related to self-report measures of motivational biases, including self-deceptive
enhancement, just world beliefs, and social desirability. This pattern of results suggests
that wishful thinking is a pervasive bias; for wishful thinkers, motivation not only
influenced judgments about the self, but also beliefs about the world.
Study 3 also found evidence that wishful thinking is related to motivated
judgments. In this study, the importance of the task was related to wishful thinkers’
judgments of likelihood. Wishful thinkers thought they were more likely to solve the task
when it was important to them to do so. Realistic optimists (i.e., low wishful thinkers,

68
after excluding pessimists from the analysis) did not vary their likelihood ratings as a
function of importance.
Wishful thinking and problem-solving. The overall pattern of results between
wishful thinking and the various COPE dimensions suggests that wishful thinkers do not
use a variety of coping strategies to deal with their problems. In contrast, a recent meta-
analytic review of dispositional optimism and coping found that optimists generally
report the use of problem-focused coping strategies (Nes, 2006). Wishful thinkers did
report the frequent use of positive reinterpretation and growth, which is considered an
adaptive coping mechanism for reducing emotional distress. The use of positive
reinterpretation is a coping strategy that optimists use to reduce distress, and it was found
to mediate well-being during times of stress.
These findings may have important implications for goal-directed behavior. In
situations where success simply requires persistence and a positive attitude to overcome
problems, wishful thinking might have the advantage of fostering persistence. However,
some problems require more than mere persistence to overcome them; it is these
situations in which realistic optimists may have the advantage over wishful thinkers.
Implications for Theories of Optimism
Self-Regulation
The control theory of self-regulation does not make distinctions about the source
of expectancies. The theory assumes that any positive expectation may foster motivation
and persistence. The results of the present research suggest that source of expectancies
may be important to self-regulation. Although wishful thinking was related to optimism,
wishful thinking did not demonstrate a pattern of results that was typical of optimists.

69
Wishful thinking was weakly related to problem-focused coping, whereas optimism has
often been found to be positively correlated to the use of these coping strategies. Wishful
thinkers, despite being motivated to experience success, may underestimate what it takes
to actually achieve the desired outcome. Therefore, they may be less motivated to take
appropriate actions to reach their goals, compared to realistic optimists. This finding may
help explain why generalized outcome expectancies are sometimes related to health-
promoting behavior and other times risky behavior. Generalized expectancies may
confound wishful thinking and realistic optimism, which appear to be related to different
patterns of coping and self-regulation.
Past research has found that optimists do not persist at unattainable goals (e.g.,
Aspinwall & Richter, 1999). However, these findings may not extend to wishful thinkers
who may be ill-equipped to make judgments about whether a particular goal is likely to
be attainable, considering that their judgments may be biased. When outcomes are
desirable, wishful thinkers may be much more likely to persist at impossible tasks,
compared to realistic optimists.
Optimal Margin Hypothesis
No support was found for the optimal margin of illusion hypothesis. Regression
analyses were conducted to explore this hypothesis. Contrary to the hypothesis that high
levels of optimism would be related to overconfidence, Study 3 found that high optimism
was related to better performance than moderate optimism. No curvilinear relationships
with any of the dependent measures were found for wishful thinking.

70
Limitations of the Present Research
The wishful thinking measure demonstrated poor internal consistency. Future
work is required to improve the internal consistency of the scale, as low reliability may
attenuate the correlations between wishful thinking and other measures. The scale could
be refined by examining the how particular items on the scale performed across the three
studies. Items that showed poor reliability could potentially be rewritten, so that the
wording of the items is more consistent with other items on the scale. Additional items
could be generated, and items for the revised scale could be administered to a large
sample and subjected to additional factor analysis.
The present research did not investigate test-retest reliability for the wishful
thinking measure. Therefore, it is not known whether the individual differences captured
by the wishful thinking scale represent differences that are relatively stable. The present
framework has conceptualized wishful thinking as a trait; however, wishful thinking may
also depend on the situation. Because wishful thinking was assessed at the same time as
other measures in the studies, an individual’s motivation could have influenced both
responses on the wishful thinking measure and judgments for the task at hand.
The hypothesized interactions between wishful thinking and the independent
variables were not found in Study 3, which was probably due to a failure to adequately
manipulate the independent variables. Although the interaction between importance and
wishful thinking was consistent with the hypothesis that motivation influences wishful
thinkers’ judgments, there are plausible alternative explanations. Likelihood ratings could
have influenced ratings of importance. When success seemed unlikely, wishful thinkers
may have rated the task as less important, so that they would not appear overconfident.

71
Another possibility is that the wishful thinkers were self-deceptive in their judgments of
importance. Wishful thinkers may have rated the task as less important as a way of
convincing themselves that it was not important to them, so that it would be less
disappointing if they did fail.
The results of the present research may have limited generalizability. Because the
wishful thinking measure was validated using samples of college students, the measure
may not be valid in other populations. The psychometric properties of the scale may also
vary across different populations.
Future Directions
This dissertation presented a new framework for thinking about optimism, and it
proposed that there are two different kinds of optimism: wishful thinking and realistic
optimism. Several general hypotheses regarding differences between wishful thinking
and realistic optimists were articulated. Further research is required to determine whether
wishful thinking is related to different patterns of attention, behavior, and performance
compared to realistic optimists.
The present framework suggests that wishful thinkers and realistic optimists may
behave differently in similar situations due to differences in the way the two types of
optimists make judgments. Because realistic optimists may be focused on objective
information, they should be more aware of behavior-outcome contingencies than wishful
thinkers. Furthermore, realistic optimists should make success predictions only when they
perceive success as contingent on their behavior, whereas, wishful thinkers should think
that they can achieve a desirable goal, regardless of whether the outcome is contingent
upon their behavior. Preliminary results for such a study are presented in Appendix E.

72
More research is needed to determine whether wishful thinking and realistic
optimism are related to differences in behavior. Although the present research found that
wishful thinking was related to self-reported differences in coping behavior, it is not
known whether wishful thinkers are less effective at dealing with problems than are
realistic optimists.
An assumption about optimism is that the source of an expectancy does not
matter, and that increasing optimism by whatever means will translate into better
outcomes. This assumption should be investigated. A parallel problem has occurred with
the self-esteem construct. On the basis of modest correlations between self-esteem and
various indicators of well-being, it was assumed that boosting self-esteem would make
people happier. A thorough review of the self-esteem literature failed to find evidence
that interventions aimed at manipulating self-esteem were related to benefits (Baumeister,
Campbell, Krueger, & Vohs, 2003). In some cases, efforts to increase self-esteem in
students had negative effects on academic performance. Similar efforts to boost optimism
may inadvertently create wishful thinking. Wishful thinking may have very different
patterns of self-regulation and coping compared to optimism that is rooted in reality.
Optimism interventions should be carefully investigated.
In their seminal paper on positive illusions, Taylor and Brown (1988) cited many
benefits of unrealistic optimism. They argued that positive illusions—which included
unrealistic optimism, among other positive traits—are not only a normal part of human
thought, but that they are also adaptive. This view was challenged by Colvin and Block,
(1994) on the basis that there is little empirical evidence to support it. Taylor and
Brown’s conclusions rested primarily on evidence showing that positive beliefs were

73
related to an absence of depression. While optimism has been consistently related to
lower levels of depression, its relationships with other outcomes have been quite variable
(e.g., health-promoting behavior, academic success). The wishful thinking measure has
the potential to shed light on this issue by demonstrating the extent to which an illusory
belief, such as wishful thinking, relates to these positive outcomes.
Another shortcoming of the positive illusions framework is that there is
surprisingly little evidence to show that optimism is illusory. Many theories of optimism
simply assume that it is unrealistic. Given that at least some optimists may have a history
of past success, it seems reasonable, not unrealistic, for these optimists to predict future
success. Hence the adaptive nature of unrealistic optimism has yet to be established. The
new wishful thinking measure has the potential to investigate the unrealistic side of
optimism and its potential costs and benefits.
Little is known about the intrapsychic context for wishful thinking, because the
relationships between wishful thinking and other personality measures have not been
investigated. Norem and Chang (2001) argued that optimism and pessimism are traits that
may have developed as strategies to deal with different psychological situations. They
proposed that pessimists who are typically anxious individuals face a different
intrapsychic context than do optimists who are typically low in anxiety. Just as the
defensive pessimists in Norem’s research may have learned to use pessimism as a
strategy for harnessing their anxiety, wishful thinking might be an adaptation for dealing
with distress for anxious individuals.
There are many different research areas that a wishful thinking measure has the
potential to expand. Domains to investigate wishful thinking might include risk-taking,
74
health, academic performance, and interpersonal relationships. Wishful thinking may be
adaptive in the short term, to the extent that wishful thinkers respond to problems by
focusing on the positive (i.e., positive reinterpretation). However, questions remain about
the long-term implications of wishful thinking. For example, do wishful thinkers take
dangerous risks, fail to engage in health-promoting behavior, or ignore problems in their
relationships as a result of their biased thinking?
The notion that there are individual differences in wishful thinking seems
intuitive, yet the results of the present research reveal that the construct is difficult to
measure at the individual level. The first study found that only a few self-report items in
the wishful thinking item pool were associated with an indirect measure of bias. Despite
the limitations of the present research, the items derived from this analysis show some
promise as the basis of a new wishful thinking scale. The individual items appear to
capture various aspects of wishful thinking. For example, the item that correlated most
strongly with the measure of bias—“In general, things turn out all right in the end”—
seems to capture the general idea that a positive future is assured, a hallmark of wishful
thinking. The measure also demonstrated a theoretically meaningful pattern of results
with other established measures. The wishful thinking scale failed to demonstrate
adequate internal consistency, so the measure will require additional development. With
refinement of the items on the scale and further validation, a new measure of wishful
thinking would provide a fuller picture of positive thinking, identifying both the potential
advantages and limitations of this kind of optimism.

75
Appendices
Appendix A: Items Constructed for the New Measure of Wishful Thinking
1. I believe that I can achieve anything that I want to in life.
2. If something doesn’t work out, then it wasn’t meant to be.
3. I ignore criticism from others, when it doesn’t fit my expectations.
4. I worry that I won’t be able to accomplish what I want in life.
5. My desire for things to turn out well biases my thinking about the future.
6. I do my best to see reality as it is, rather than what I want it to be.
7. I believe that I have the willpower and ability to accomplish any goal in life.
8. I believe that I can achieve any goal in life through effort and hard work.
9. I ignore pessimists.
10. When I make plans I am certain to make them work.
11. I am good at differentiating between the things I can control and the things I cannot
control.
12. I feel confident that I can acquire the skills to solve any problem that comes up in life.
13. Really wanting to achieve a goal raises my expectations.
14. I never doubt that things will turn out okay.
15. I am entirely responsible for creating my own successes.
16. I think the best way to handle most problems is just not to think about them.
17. I believe that the best things in life take a lot of hard work.
18. Even the negative aspects of life can be opportunities for growth.
19. I try to set realistic, yet challenging goals for myself.
20. I would rather focus my attention on opportunities than on limitations.

76
21. I consider all possible alternatives to a problem before deciding on a course of action.
22. I am open to new ideas.
23. It’s all right with me if sometimes, I don’t get my way.
24. I try to stay focused on what I can do to achieve my goals, rather than dwelling on the
obstacles.
25. I don’t care to think negatively about the future.
26. I am usually willing to try a new approach to doing things.
27. I think that it is important to listen to constructive criticism, in order to learn from my
failures.
28. I often see challenges where other people see problems.
29. When making decisions, I seek information from many different sources, even those
that I may not agree with.
30. The successes of others provide a model for me to learn from.
31. I don’t wait around for my problems to solve themselves.
32. When things go poorly, I focus on how I can make things better in the future.

77
Appendix B: Wishful Thinking Scale Items
Positive Events
1. Traveling to Hawaii within the next 5 years.
2. Becoming famous in your desired profession.
3. Getting A's on all your final exams in at least one semester.
4. Getting a great job offer before graduation.
5. Being happily married.
6. Doing something heroic (e.g. saving someone else's life).
7. Marrying someone wealthy.
8. Owning your own home.
9. Having a mentally gifted child.
10. Personal achievements are described in a newspaper.
11. Traveling to Europe.
12. Home doubles in value after 5 years.
13. Catching a foul ball at a baseball game (as a spectator).
14. Getting a higher starting salary than most of one’s friends.
15. Work is recognized with an award.
16. Getting a starting salary that would permit one to afford a luxury automobile.
17. In 10 years, earning more than one’s parents earn today.
18. Winning over a million dollars in the lottery.
19. Winning a free vacation.
20. Meeting a celebrity.

78
Negative Events
1. Dying in a terrorist attack.
2. Being the victim of a violent assault.
3. Developing cancer before age 50.
4. Getting seriously injured in an automobile accident that’s not your fault.
5. Having a child with a serious, incurable illness.
6. House burning down in a fire.
7. Becoming blind.
8. Sitting in a chair that breaks.
9. Having a heart attack before age 40.
10. Being fired from a job.
11. Having a drinking problem.
12. Being a victim in a mugging.
13. Attempting suicide.
14. Getting a ticket for speeding.
15. Being sued by someone.
16. Getting divorced.
17. Being a victim of a burglary.
18. Contracting a sexually transmitted disease.
19. Having a car stolen.
20. Being sterile.
21. Having a car turns out to be a lemon.
22. Getting a flat tire.

79
23. Having the computer crash while writing a paper.
24. Being in a plane crash.

80
Appendix C: Sample Puzzles
Nurikabe
1. Create white areas surrounded by black walls.2. Each white area contains only one number.3. The number of cells in a white area is equal to the number in it.4. The white areas are separated from each other with a black wall.5. Cells containing a number must not be filled in.6. The black cells must be linked into a continuous wall.7. Black cells cannot form a square of 2x2 or larger.
4 5 3 4
6 44 3
4 5 1 4

81
Hitori
1. Numbers must never appear more than once in each row or column.2. Crossed out numbers are never adjacent in a row or column.3. White cells create a single continuous area, undivided by crossed out cells.
3 2 6 1 4 1 12 1 9 8 7 510 11 10 5 3 8 3 7 12 12 12 15 4 2 8 6 4 10 8 12 11 1 77 7 7 9 2 4 1 3 5 11 6 82 6 12 6 7 4 5 10 1 11 3 98 8 8 11 5 9 6 4 10 10 10 21 2 11 4 5 12 6 9 3 9 8 79 9 9 10 5 3 6 11 8 1 2 44 12 1 7 10 7 9 2 2 2 5 1211 10 4 12 1 1 1 2 5 3 9 612 3 3 3 9 10 2 6 7 4 11 87 1 4 2 12 10 8 6 11 5 9 3

82
Appendix D: Puzzle Questionnaire
1. Have you ever worked on this type of puzzle before? (check one)
_____ Yes
_____ No
_____ Don’t know
For the following questions, please indicate your response by circling the appropriatenumber on the rating scale.
2. Given that you put your best effort into solving the puzzle, what is the likelihood ofsolving this puzzle in the amount of time given?
The likelihood of my solving the puzzle is…
Extremely about Extremelyunlikely 50% likely
0 10 20 30 40 50 60 70 80 90 100
3. Please consider how interesting this kind of puzzle is to you.
This kind of puzzle is…
ExtremelyNot interesting interesting
to me at all to me
1 2 3 4 5 6 7
4. Please consider how important solving the puzzle is to you.
Solving the puzzle is…
ExtremelyNot important important
to me at all to me
1 2 3 4 5 6 7

83
Appendix E: Wishful Thinking and Behavior-Outcome Contingencies
This appendix discusses the preliminary results of a follow-up study of wishful
thinking. In this study, participants completed a laboratory task in which they were asked
to make judgments about their current and future performance. If realistic optimism
involves an awareness of the contingencies between behavior and outcomes, then realistic
optimists should take behavior-outcome contingencies into account when making
judgments regarding whether they will succeed or fail at a task. Realistic optimists should
only make success predictions for a task in which they experienced success that was
contingent on their behavior, but not for task in which they experienced non-contingent
success. In contrast, wishful thinkers should tend to think that they can achieve a
desirable goal, regardless of whether the outcome is contingent upon their behavior.
Therefore, wishful thinkers’ judgments were not expected to vary as a function of
contingency; rather, they were expected to predict success in both the contingent and
non-contingent conditions.
Method
Participants and procedure. Fifty-seven male and female undergraduates enrolled
in various introductory psychology courses were recruited to participate in the study. The
students received extra credit for their participation. When the students arrived at the lab,
they were asked to complete a questionnaire containing measures of wishful thinking and
optimism, and they were randomly assigned to one of two experimental conditions:
contingent success or noncontingent success.
Overview of procedure. First, participants completed the questionnaire, which
included the wishful thinking measure and Chang and colleagues’ (1997) pessimism

84
scale from the ELOT. Next, the participants completed a general knowledge task. They
were told that the task was a measure of intellectual ability, and that they would be
completing two trials of the task. After completing the first trial of the task, the
participants were asked to make predictions regarding their performance on the second
trial of the task, which was said to be an equivalent measure of ability. They did not
actually complete the second trial.
The type of success (contingent or noncontingent) was manipulated between
subjects. As the participants completed the task, they were asked to rate their confidence
for each individual answer and to estimate the total number of items they believed they
answered correctly. After receiving success feedback, they were asked to judge their
future performance on the next trial of the task.
Manipulation of success. In both conditions, participants received a difficult
question to begin the task. In order to create noncontingent success, the items were
manipulated, so that the participant did not answer more than five or six questions
correctly. All items were pilot tested, and questions were separated into groups based on
the percentage of students who had answered the questions correctly on the pilot test. The
questions used for the task were obtained and used with permission from the FunTrivia
Web site. At the end of the task, participants in the non-contingent success condition
were given false success feedback before making their predictions about the next trial of
the task. In order to create contingent success, the difficulty of the task was adjusted for
each participant, so that success at the task was ensured. Participants were given accurate
success feedback in this condition and asked to make a prediction for the next trial of the
task.
85
Judgments of current and future performance. Participants were asked to make
several judgments about their current and future performance on the intellectual task. As
described above, they made a confidence rating for each response on a 0 (not at all
confident) to 100 (completely confident) scale. After they completed the task, they were
asked to judge their overall performance by estimating the number of questions they
answered correctly on the task.
After receiving the contingent or noncontingent success feedback, the participants
were given a questionnaire with a few questions about the task. Two questions were
intended to assess the participants’ predictions for their future performance on the task
just completed. One question asked them to rate their future performance as worse,
better, or the same. The other question asked them to estimate the actual number they
expected to get correct on the next trial.
Preliminary Results
Wishful thinking, realistic optimism, and pessimism. In order to easily compare
wishful thinkers, realistic optimists, and pessimists to one another, a “group” variable
was created on the basis of the individuals’ scores on the wishful thinking and pessimism
scales. Pessimists were identified by their scores on the pessimism scale, which was
negatively correlated to wishful thinking, r (55) = -.59 p < .01. Respondents who scored
at or above the midpoint of the scale (i.e., scores of 18 and above) were deemed
pessimists. After the pessimists were identified, the next step was to use the wishful
thinking scale to distinguish between wishful thinkers and realistic optimists in the
remaining participants. Individuals with scores above the 50th percentile were categorized

86
as wishful thinkers, while individuals with lower scores were categorized as realistic
optimists.
For all of the following statistical tests, an alpha level of .05 was used. Two-way
analyses of variance (ANOVA) were conducted to examine the interactions between the
group variable and type of success.
Predictions for future success. On average, participants predicted that they would
answer 6.40 out of 10 questions correctly on the next trial of the task (SD = 1.45).
Overall, wishful thinkers, realistic optimists, and pessimists did not differ in their
predictions of success, F (2, 51) = 1.20, p = .31.
Participants who experienced contingent success predicted that they would get
more correct on the next trial of the task (M = 7.14, SD = 1.11) than did those who
experienced non-contingent success (M = 5.83, SD = 1.34), F (1, 51) = 22.43, p < .01.
The interaction between group and contingency was marginally significant, F (2,
51) = 2.58, p = .08. Wishful thinkers did not vary their predictions across the contingency
conditions as much as realistic optimists and pessimists, who tended to make lower
predictions when success was not contingent on their performance.
Table 5
Mean Predictions for Future Success (and Standard Deviations) as a Function of Groupand Success Type
Group
Success Type Wishful Thinkers Realistic Optimists Pessimists
Contingent 7.08 (1.32) 7.10 (0.74) 7.40 (1.34)
Non-contingent 6.29 (0.82) 5.80 (1.69) 4.60 (1.14)
Total 6.67 (1.14) 6.45 (1.43) 6.00 (1.89)
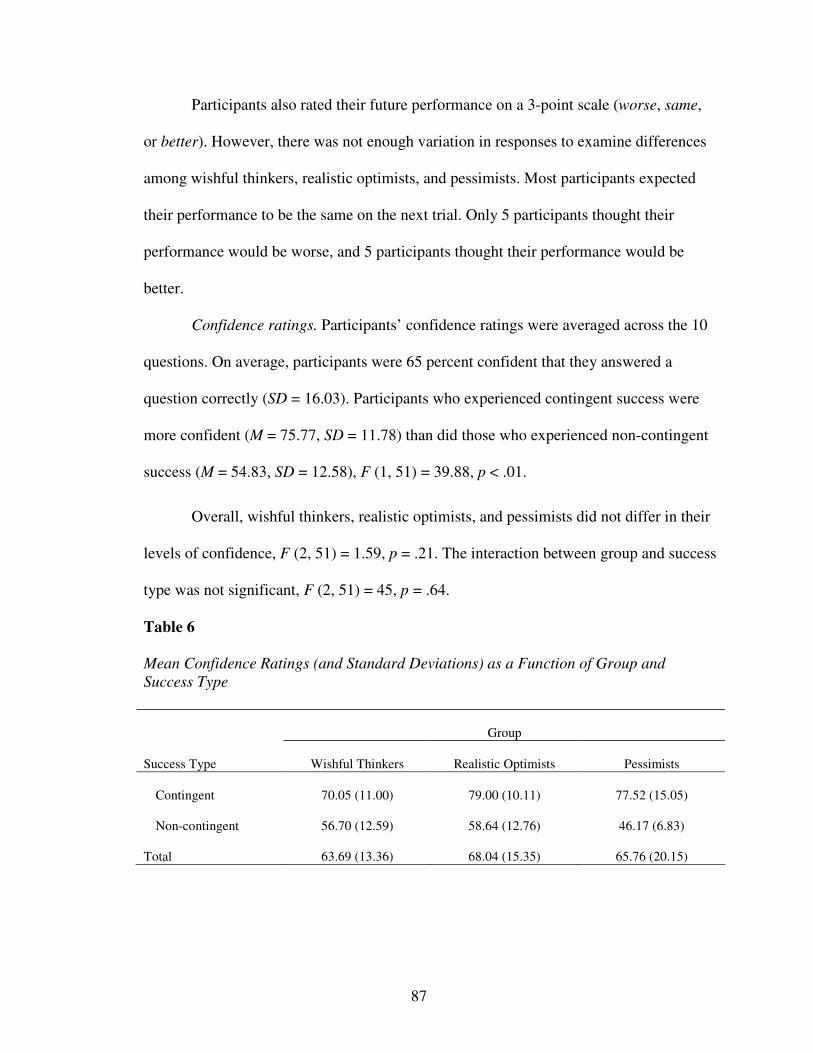
87
Participants also rated their future performance on a 3-point scale (worse, same,
or better). However, there was not enough variation in responses to examine differences
among wishful thinkers, realistic optimists, and pessimists. Most participants expected
their performance to be the same on the next trial. Only 5 participants thought their
performance would be worse, and 5 participants thought their performance would be
better.
Confidence ratings. Participants’ confidence ratings were averaged across the 10
questions. On average, participants were 65 percent confident that they answered a
question correctly (SD = 16.03). Participants who experienced contingent success were
more confident (M = 75.77, SD = 11.78) than did those who experienced non-contingent
success (M = 54.83, SD = 12.58), F (1, 51) = 39.88, p < .01.
Overall, wishful thinkers, realistic optimists, and pessimists did not differ in their
levels of confidence, F (2, 51) = 1.59, p = .21. The interaction between group and success
type was not significant, F (2, 51) = 45, p = .64.
Table 6
Mean Confidence Ratings (and Standard Deviations) as a Function of Group andSuccess Type
Group
Success Type Wishful Thinkers Realistic Optimists Pessimists
Contingent 70.05 (11.00) 79.00 (10.11) 77.52 (15.05)
Non-contingent 56.70 (12.59) 58.64 (12.76) 46.17 (6.83)
Total 63.69 (13.36) 68.04 (15.35) 65.76 (20.15)

88
Relationships among dependent variables. The correlations among the dependent
variables are displayed in Table 7. Participants’ levels of confidence, their judgments
about the current and future tasks, and their actual performance were all interrelated.
Table 7
Correlations Among Dependent Variables
Variable 1 2 31. Total Number Predicted Correct on Future Task —2. Average Confidence Rating for Current Task .62* —3. Total Number Predicted Correct on Current Task .69* .85* —4. Actual Number Correct on Current Task .33* .36* .28*N = 57* p < .05
Discussion
Realistic optimists and pessimists who experienced success that was contingent
on their performance predicted that they would answer more questions correctly than did
those who experienced non-contingent success; wishful thinkers’ predictions, however,
did not differ as much between the two contingency conditions. This pattern of results
suggests that realistic optimists and pessimists were more aware of the contingencies
between behavior and outcomes than were wishful thinkers. This finding is consistent
with the idea that wishful thinking is not related to consideration about how to achieve a
goal, but rather it is related to the extent that the individual wants to achieve a particular
goal.
89
References
Abela, J. R. Z. (2001). The hopelessness theory of depression: A test of the diathesis-stress and causal mediation components in third and seventh grade children.Journal of Abnormal Child Psychology, 29, 241-254.
Abramson, L. Y., Alloy, L. B., Hogan, M. E., Whitehouse, W. G., Cornette, M.,Akhavan, S., & Chiara, A. (1998). Suicidality and cognitive vulnerability todepression among college students: A prospective study. Journal of Adolescence,21, 473-487.
Abramson, L. Y., Seligman, M. E. P., & Teasdale, J. D. (1978). Learned helplessness inhumans: Critique and reformulation. Journal of Abnormal Psychology, 87, 49-74.
Aiken, L. S., & West, S. G. (1991). Multiple regression: Testing and interpretinginteractions. Newbury Park: Sage Publications.
Alloy, L. B., & Abramson, L. (1979). Judgment of contingency in depressed andnondepressed students: Sadder but wiser? Journal of Experimental Psychology:General, 108, 441-485.
Antoni, M. H., & Goodkin, K. (1988). Host moderator variables in the promotion ofcervical neoplasia I: Personality facets. Journal of Psychosomatic Research, 32,327-338.
Aspinwall, L. G., & Richter, L. (1999). Optimism and self-mastery predict more rapiddisengagement from unsolvable tasks in the presence of alternatives. Motivationand Emotion, 23, 221-245.
Barnum, D. D., Snyder, C. R., Rapoff, M. A., Mani, M. M., & Thompson, R. (1998).Hope and social support in the psychological adjustment of children who havesurvived burn injuries and matched controls. Children’s Health Care, 27, 15-30.
Baumeister, R. F. (1989). The optimal margin of illusion. Journal of Social and ClinicalPsychology, 8, 176-189.

90
Baumeister, R. F., Campbell, J. D., Krueger, J. I., & Vohs, K. D. (2003). Does high self-esteem cause better performance, interpersonal success, happiness, or healthierlifestyles? Psychological Science in the Public Interest, 4, 1-44.
Bennet, D. S., & Bates, J. E. (1995). Prospective models of depressive symptoms in earlyadolescence: Attributional style, stress, and support. Journal of EarlyAdolescence, 15, 299-315.
Brown, J. D., & Marshall, M. A. (2001). Great expectations: Optimism and pessimism inachievement settings. In E. C. Chang (Ed.), Optimism and pessimism:Implications for theory, research, and practice (pp. 239-255). Washington, DC:American Psychological Association.
Buchanan, G. M. (1995). Explanatory style and coronary heart disease. In G. M.Buchanan & M. E. P. Seligman (Eds.), Explanatory style (pp. 225-232). Hillsdale,NJ: Erlbaum.
Byrnes, D. M., Antoni, M. H., Goodkin, K., Efantis-Potter, J, Asthana, D., Simon, T.,Munajj, J., Ironson, G., & Fletcher, M. A. (1998). Stressful events, pessimism,natural killer cell cytotoxicity, and cytotoxic/suppressor T cells in HIV+ Blackwomen at risk for cervical cancer. Psychosomatic Medicine, 60, 714-722.
Carver, C. S., & Gaines, J. G. (1987). Optimism, pessimism, and postpartum depression.Cognitive Therapy and Research, 11, 449-462.
Carver, C. S., & Scheier, M. F. (1981). Attention and self-regulation: A control theoryapproach to human behavior. New York: Springer-Verlag.
Carver, C. S., & Scheier, M. F. (1990). Principles of self-regulation: Action and emotion.In R. M. Sorrentino & E. T. Higgins (Eds.), Handbook of motivation andcognition: Foundations of social behavior (Vol. 2, pp. 3-52). New York:Guilford Press.
Carver, C. S., & Scheier, M. F. (2001). Optimism, pessimism, and self-regulation. In E.C. Change (Ed.), Optimism and pessimism: Implications for theory, research, andpractice (pp. 31-52). Washington, DC: American Psychological Association.

91
Carver, C. S., Scheier, M. F., & Weintraub, J. K. (1989). Assessing coping strategies: Atheoretically based approach. Journal of Personality and Social Psychology, 56,267-283.
Chang, E. C. (Ed.). (2001). Optimism and pessimism: Implications for theory, research,and practice. Washington, DC: American Psychological Association.
Chang, E. C., Maydeu-Olivares, A., & D’Zurilla, T. J. (1997). Optimism and pessimismas partially independent constructs: Relationship to positive and negativeaffectivity and psychological well-being. Personality and Individual Differences,23, 433-440.
Cohen, F., Kearney, K. A., Kemeny, M. E., & Zegans, L. S. (1989). Acute stress, chronicstress, and immunity, and the role of optimism as a moderator. PsychosomaticMedicine, 51, 255-278.
Cole, D. A., & Turner, Jr., J. E. (1993). Models of cognitive mediation and moderation inchild depression. Journal of Abnormal Psychology, 102, 271-281.
Colvin, C. R., & Block, J. (1994). Do positive illusions foster mental health? Anexamination of the Taylor and Brown formulation. Psychological Bulletin, 116, 3-20.
Crowne, D. P., & Marlowe, D. (1960). A new scale of social desirability independent ofpsychopathology. Journal of Consulting Psychology, 24, 349-354.
Crowne, D. P., & Marlowe, D. (1964). The approval motive. New York: Wiley.
Curry, L. A., Snyder, C. R., Cook, D. L., Ruby, B. C., & Rehm, M. (1997). The role ofhope in academic and sport achievement. Journal of Personality and SocialPsychology, 73, 1257-1267.
Davidson, K., & Prkachin, K. (1997). Optimism and unrealistic optimism have aninteracting impact in health-promoting behavior and knowledge changes.Personality and Social Psychology Bulletin, 23, 617-625.
92
Dember, W. N., Martin, S. H., Hummer, M. K., Howe, S. R., & Melton, R. S. (1989).The measurement of optimism and pessimism. Current Psychology: Research andReviews, 8, 102-119.
Devine, D., Forehand, R., Morse, E., Simon, P., Clark, L., & Kernis, M. (200). HIVinfection in inner-city African American women: The role of optimism inpredicting depressive symptomatology. International Journal of Rehabilitationand Health, 5, 141-156.
Dixon, J. F., & Ahrens, A. H. (1992). Stress and attributional style as predictors of self-reported depression in children. Cognitive Therapy and Research, 16, 623-534.
Elliott, T. R., Witty, T. E., Herrick, S., & Hoffman, J. T. (1991). Negotiating reality afterphysical loss: Hope, depression, and disability. Journal of Personality and SocialPsychology, 61, 608-613.
Feather, N. T. (1961). The relationship of persistence at a task to expectation of successand achievement related motives. Journal of Abnormal and Social Psychology,63, 552-561.
Fibel, B., & Hale, W. D. (1978). The generalized expectancy for success scale: A newmeasure. Journal of Consulting and Clinical Psychology, 46, 924-931.
FunTrivia. (n.d.). [Trivia questions]. Retrieved March 4, 2005, fromhttp://www.funtrivia.com
Follette, V. M., & Jacobson, N. S. (1987). Importance of attributions as a predictor ofhow people cope with failure. Journal of Personality and Social Psychology, 52,1205-1211.
Friedman, L. C., Bruce, S., Webb, J. A., Weinberg, A. D., & Cooper, H. P. (1993). Skinself-examination in a population at increased risk for skin cancer. AmericanJournal of Preventive Medicine, 9, 359-364.
Friedman, L. C., Nelson, D. V., Webb, J. A., Hoffman, L. P., & Baer, P. E. (1994).Dispositional optimism, self-efficacy, and health beliefs as predictors of breastself-examination. American Journal of Preventive Medicine, 10, 130-135.

93
Gibbons, F. X., Blanton, H., Gerrard, M., Buunk, B., & Eggleston, T. (2000). Does socialcomparison make a difference? Optimism as a moderator of the relation betweencomparison level and academic performance. Personality and Social PsychologyBulletin, 26, 637-648.
Gibson, B., & Sanbonmatsu, D. M. (2004). Optimism, pessimism, and gambling: Thedownside of optimism. Personality and Social Psychology Bulletin, 30, 149-160.
Gillham, J. E., & Reivich, K. J. (1999). Prevention of depressive symptoms inschoolchildren: A research update. Psychological Science, 10, 461-462.
Gillham, J., & Reivich, K. (2004). Depression prevention in children. Retrieved June 18,2004, from http://www.positivepsychology.org/prpsum.htm
Gillham, J. E., Reivich, K. J., Jaycox, L. H., & Seligman, M. E. P. (1995). Prevention ofdepressive symptoms in schoolchildren: Two-year follow-up. PsychologicalScience, 6, 343-351.
Gillham, J. E., Shatte’, A. J., Reivich, K. J., & Seligman, M. E. P. (2001). Optimism,pessimism, and explanatory style. In E. C. Chang (Ed.), Optimism and pessimism:Implications for theory, research, and practice (pp. 53-75). Washington, DC:American Psychological Association.
Golin, S., Sweeney, P. D., & Schaeffer, D. E. (1981). The causality of causal attributionsin depression: A cross-lagged panel analysis. Journal of Abnormal Psychology,90, 14-22.
Hale, B. D. (1993). Explanatory style as a predictor of academic and athletic achievementin college athletes. Journal of Sport Behavior, 16, 63-75.
Hammen, C., Adrian, C., & Hiroto, D. (1988). A longitudinal test of the attributionalvulnerability model in children at risk for depression. British Journal of ClinicalPsychology, 27, 37-46.
Hilsman, R., & Garber, J. (1995). A test of the cognitive diathesis-stress model ofdepression in children: Academic stressors, attributional style, perceived

94
competence, and control. Journal of Personality and Social Psychology, 69, 370-380.
Hummer, J. T., & Hokanson, J. E. (1990). The causal relations of attributions forinterpersonal events to depression: A prospective longitudinal study. Journal ofSocial and Clinical Psychology, 9, 511-528.
Irving, L. M., Snyder, C. R., & Crowson, Jr., J. J. (1998). Hope and coping with cancerby college women. Journal of Personality, 66, 195-214.
Joiner, T. E., Jr., & Wagner, K. D. (1995). Attributional style and depression in childrenand adolescents: A meta-analytic review. Clinical Psychology Review, 15, 777-798.
Kaiser, C. R., Major, B., & McCoy, S. K. (2004). Expectations about the future and theemotional consequences of perceiving prejudice. Personality and SocialPsychology Bulletin, 30, 173-184.
Klein, W. M., & Kunda, Z. (1992). Motivated person perception: Constructingjustifications for desired beliefs. Journal of Experimental Social Psychology, 28,145-168.
Kunda, Z. (1990). The case for motivated reasoning. Psychological Bulletin, 108, 480-498.
Kwon, P., & Laurenceau, J. (2002). A longitudinal study of the hopelessness theory ofdepression: Testing the diathesis-stress model within a differential reactivity andexposure framework. Journal of Clinical Psychology, 58, 1305-1321.
LaForge, M. C., & Cantrell, S. (1993). Explanatory style and academic performanceamong college students beginning a major course of study. Psychological Reports,92, 861-865.
Lazarus, R. S. (2003). Does the positive psychology movement have legs? PsychologicalInquiry, 14, 93-109.

95
Lee, Y., & Seligman, M. E. P. (1997). Are Americans more optimistic than the Chinese?Personality and Social Psychology Bulletin, 23, 32-40.
Lerner, M. J., & Miller, D. T. (1978). Psychological Bulletin, 85. 1030-1051.
Luten, A. G., Ralph, J. A., & Mineka, S. (1997). Pessimistic attributional style: Is itspecific to depression versus anxiety versus negative affect? Behavioral Researchand Therapy, 35, 703-719.
Metalsky, G. I., Abramson, L. Y., Seligman, M. E. P., Semmel, A., & Peterson, C.(1982). Attributional styles and life events in the classroom: Vulnerability andinvulnerability to depressive mood reactions. Journal of Personality and SocialPsychology, 43, 612-617.
Metalsky, G. I., Halberstadt, L. J., & Abramson, L. Y. (1987). Vulnerability to depressivemood reactions: Toward a more powerful test of the diathesis-stress and causalmediation components of the reformulated theory of depression. Journal ofPersonality and Social Psychology, 52, 386-393.
Myers, D. G. (1993). The pursuit of happiness. New York: Avon Books.
Nes, L. S., & Segerstrom, S. C. (2006). Dispositional optimism and coping: A meta-analytic review. Personality and Social Psychology Review, 10, 235-251.
Norem, J. K. (2001). Defensive pessimism, optimism, and pessimism. In E. C. Chang(Ed.), Optimism and pessimism: Implications for theory, research, and practice(pp. 77-100). Washington, DC: American Psychological Association.
Norem, J. K., & Cantor, N. (1986). Defensive pessimism: Harnessing anxiety asmotivation. Journal of Personality and Social Psychology, 51, 1208-1217.
Norem, J. K., & Chang, E. C. (2001). A very full glass: Adding complexity to ourthinking about the implications and applications of optimism and pessimismresearch. In E. C. Chang (Ed.), Optimism and pessimism: Implications for theory,research, and practice (pp. 347-367). Washington, DC: American PsychologicalAssociation.
96
Norem, J. K., & Chang, E. C. (2002). The positive psychology of negative thinking.Journal of Clinical Psychology, 58, 993-1001.
Norem, J. K., & Illingworth, K. S. S. (1993). Strategy-dependent effects of reflecting onself and tasks: Some implications of optimism and defensive pessimism. Journalof Personality and Social Psychology, 65, 822-835.
Pajares, F. (2001). Toward a positive psychology of academic motivation. The Journal ofEducational Research, 95, 27-35.
Panak, W. F., & Garber, J. (1992). Role of aggression, rejection, and attributions in theprediction of depression in children. Development and Psychopathology, 4, 145-165.
Paulhus, D. L. (1991). Measurement and control of response bias. In J. P. Robinson, P. R.Shaver, and L. S. Wrightsman (Eds.), Measures of personality and socialpsychological attitudes (pp. 17-59). New York: Academic Press.
Peale, N. V. (1996). The power of positive thinking. New York: Ballantine Books.
Peterson, C. (1988). Explanatory style as a risk factor for illness. Cognitive Therapy andResearch, 12, 119-132.
Peterson, C., & Barrett, L. C. (1987). Explanatory style and academic performanceamong university freshman. Journal of Personality and Social Psychology, 53,603-607.
Peterson, C., & De Avila, M. (1995). Optimistic explanatory style and the perception ofhealth problems. Journal of Clinical Psychology, 51, 128-132.
Peterson, C., Schulman, P., Castellon, C., & Seligman, M. E. P. (1992). CAVE: Contentanalysis of verbatim explanations. In C. P. Smith (Ed.), Motivation andpersonality: Handbook of thematic content analysis (pp. 383-392). New York:Cambridge University Press.

97
Peterson, C., Semmel, A., von Baeyer, C., Abramson, L. Y., Metalsky, G. I., & Seligman,M. E. P. (1982). The attributional style questionnaire. Cognitive Therapy andResearch, 6, 287-300.
Peterson, C., & Villanova, P. (1988). An expanded attributional style questionnaire.Journal of Abnormal Psychology, 97, 87-89.
Radcliffe, N. M., & Klein, W. M. P. (2002). Dispositional, unrealistic, and comparativeoptimism: Differential relations with the knowledge and processing of riskinformation and beliefs about personal risk. Personality and Social PsychologyBulletin, 28, 836-846.
Robbins, A. S., Spence, J. T., & Clark, H. (1991). Psychological determinants of healthand performance: The tangled web of desirable and undesirable characteristics.Journal of Personality and Social Psychology, 61, 755-765.
Robins, C. L., & Block, P. (1989). Cognitive theories of depression viewed from adiathesis-stress perspective: Evaluations of the models of Beck and of Abramson,Seligman, & Teasdale. Cognitive Therapy and Research, 13, 297-313.
Satterfield, J. M., Monahan, J., & Seligman, M. E. P. (1997). Law school performancepredicted by explanatory style. Behavioral Sciences and the Law, 15, 95-105.
Scheier, M. F., & Carver, C. S. (1985). Optimism, coping, and health: Assessment andimplications of generalized outcome expectancies. Health Psychology, 4, 219-247.
Scheier, M. F., Matthews, K. A., Owens, J. F., Magovern, G. J., Sr., Lefebvre, R. C.,Abbott, R. A., & Carver, C. S. (1989). Dispositional optimism and recovery fromcoronary artery bypass surgery: The beneficial effects on physical andpsychological well-being. Journal of Personality and Social Psychology, 57,1024-1040.
Scheier, M. F., Weintraub, J. K., & Carver, C. S. (1986). Coping with stress: Divergentstrategies of optimists and pessimists. Journal of Personality and SocialPsychology, 31, 1257-1264.

98
Schneider, S. L. (2001). In search of realistic optimism: Meaning, engagement, and warmfuzziness. American Psychologist, 56, 250-263.
Schwarzer, R. (1994). Optimism, vulnerability, and self-beliefs as health-relatedcognitions: A systematic overview. Psychology and Health, 9, 161-180.
Schwarzer, R. (1999). Self-regulatory processes in the adoption and maintenance ofhealth behaviors: The role of optimism, goals, and threats. Journal of HealthPsychology, 4, 115-127.
Seligman, M. E. P. (1991). Learned optimism. NewYork: Alfred A Knopf.
Seligman, M. E. P., Nolen-Hoeksema, S., Thornton, N., & Thornton, K. M. (1990).Explanatory style as a mechanism of disappointing athletic performance.Psychological Science, 1, 143-146.
Sherwin, E. D., Elliott, T. R., Rybarczyk, B. D., Frank, R. G., Hanson, S., & Hoffman, J.(1992). Negotiating the reality of care giving: Hope, burnout, and nursing.Journal of Social and Clinical Psychology, 11, 129-139.
Sigall, H., Kruglanski, A., & Fyock, J. (2000). Wishful thinking and procrastination.Journal of Social Behavior and Personality, 15, 283-296.
Sigall, H., Kruglanski, A., Stangor, C., & Fyock, J. (1997). Individuals differ in how theirmotivation affects their cognition: Studies in wishful thinking. Unpublishedmanuscript, University of Maryland at College Park.
Snyder, C. R., (1996). To hope, to lose, and hope again. Journal of Personal andInterpersonal Loss, 1, 1-16.
Snyder, C. R., Harris, C., Anderson, J. R., Holleran, S. A., Irving, L. M., Sigmon, S. T.,Yoshinobu, L., Gibb, J., Langelle, C., & Harney, P. (1991). The will and theways: Development and validation of an individual-differences measure of hope.Journal of Personality and Social Psychology, 60, 570-585.

99
Snyder, C. R., Hoza, B., Pelham, W. E., Rapoff, M., Ware, L., Danovsky, M.,Highberger, L., Rubinstein, H., & Stahl, K. J. (1997). The development andvalidation of the children’s hope scale. Journal of Pediatric Psychology, 22, 399-421.
Snyder, C. R., Shorey, H. S., Cheavens, J., Pulvers, K. M., Adams, V. H., III, & Wiklund,C. (2002). Hope and academic success in college. Journal of EducationalPsychology, 94, 820-826.
Snyder, C. R., Sympson, S. C., Michael, S. T., & Cheavens, J. (2001). Optimism andhope constructs: Variants on a positive expectancy theme. In E. C. Chang (Ed.),Optimism and pessimism: Implications for theory, research, and practice (pp.101-125). Washington, DC: American Psychological Association.
Spence, S. H., Sheffield, J., & Donovan, C. (2002). Problem-solving orientation andattributional style: Moderators of the impact of negative life events and thedevelopment of depressive symptoms in adolescence? Journal of Clinical ChildPsychology, 31, 219-229.
Spencer, S. M., & Norem, J. K. (1996). Reflection and distraction: Defensive pessimism,strategic optimism, and performance. Personality and Social Psychology Bulletin,22, 354-365.
Steinsmeier-Pelster, J. (1989). Attributional style and depressive mood reactions. Journalof Personality, 57, 581-599.
Sweeney, P. D., Anderson, K., & Bailey, S. (1986). Attributional style and depression: Ameta-analytic review. Journal of Personality and Social Psychology, 50, 974-991.
Taylor, S. E., & Armor, D. (1996). Positive illusions and coping with adversity. Journalof Personality, 64, 873-898.
Taylor, S. E., & Brown, J. D. (1988). Illusion and well-being: A social psychologicalperspective on mental health. Psychological Bulletin, 103, 193-210.
Taylor, S. E., & Brown, J. D. (1994). Positive illusions and well-being revisited:Separating fact from fiction. Psychological Bulletin, 116, 21-27.
100
Taylor, S. E., & Gollwitzer, P. M. (1995). Effects of mindset on positive illusions.Journal of Personality and Social Psychology, 69, 213-226.
Taylor, S. E., Lerner, J. S., Sherman, D. K., Sage, R. M., & McDowell, N. K. (2003).Portrait of the self-enhancer: Well adjusted and well liked or maladjusted andfriendless? Journal of Personality and Social Psychology, 84, 165-176.
Vazquez, C., Jimenez, F., Saura, F., & Avia, M. D. (2001). The importance of“importance”: A longitudinal confirmation of the attributional-stress model ofdepression measuring the importance of the attributions and the impact of thestressor. Personality and Individual Differences, 31, 205-214.
Venters, T. H., & Wallander, J. L. (2001). Hope and social support as resilience factorsagainst psychological distress of mothers who care for children with chronicphysical conditions. Rehabilitation Psychology, 46, 382-399.
Wallston, K. (1994). Cautious optimism vs. cockeyed optimism. Psychology and Health,9, 201-203.
Weinstein, N. D. (1980). Unrealistic optimism about future life events. Journal ofPersonality and Social Psychology, 39, 806-820.
Weinstein, N. D. (1982). Unrealistic optimism about susceptibility to health problems.Journal of Behavioral Medicine, 5, 441-460.
Weinstein, N. D., & Lyon, J. E. (1999). Mindset, optimistic bias about personal risk andhealth-protective behavior. British Journal of Health Psychology, 4, 289-300.
Yates, S. M., Yates, G. C., & Lippett, R. M. (1995). Explanatory style, ego-orientationand primary school mathematics achievement. Educational Psychology, 15, 23-34.
Yu, D. L., & Seligman, M. E. P. (2002, May). Preventing depressive symptoms inChinese children. Prevention and Treatment, 5, Retrieved August 3, 2004, fromhttp://journals.apa.org/prevention

101
Zullow, H. M., Oettingen, G., Peterson, C., & Seligman, M. E. P. (1988). Pessimisticexplanatory style in the historical record: CAVE-ing LBJ, presidential candidates,and East versus West Berlin. American Psychologist, 43, 673-682.