abstract title of document: evaluating …€¦ · title of document: evaluating alternative...
TRANSCRIPT

i
ABSTRACT
Title of Document: EVALUATING ALTERNATIVE NUTRIENT SOURCES IN
SUBSISTENCE-LEVEL AQUAPONIC SYSTEMS
Jonathan Aguilera-Titus, Yusi Cao, Eric Kazyak, Kalyani
Kumar, Kevin Li, Adam Louie, Alan Louie, Jessica Lu,
Winston Mann, Daniel Mirsky, Kelly Misner, Luke O’Connor,
Miriam Tarshish, Chenmuren Zhang
Directed By: Dr. Andrew Lazur
Assistant Dean and Assistant Director – Natural Resource and
Sea Grant Program Leader, University of Maryland Extension
Many food production methods are both economically and environmentally
unsustainable. Our project investigated aquaponics, an alternative method of
agriculture that could address these issues. Aquaponics combines fish and plant crop
production in a symbiotic, closed-loop system. We aimed to reduce the initial and
operating costs of current aquaponic systems by utilizing alternative feeds. These
improvements may allow for sustainable implementation of the system in rural or
developing regions. We conducted a multi-phase process to determine the most
affordable and effective feed alternatives for use in an aquaponic system. At the end
of two preliminary phases, soybean meal was identified as the most effective
potential feed supplement. In our final phase, we constructed and tested six full-scale
aquaponic systems of our own design. Data showed that soybean meal can be used to
reduce operating costs and reliance on fishmeal. However, a more targeted
investigation is needed to identify the optimal formulation of alternative feed blends.
ii
EVALUATING ALTERNATIVE NUTRIENT SOURCES IN SUBSISTENCE-
LEVEL AQUAPONIC SYSTEMS
By
Jonathan Aguilera-Titus, Yusi Cao, Eric Kazyak, Kalyani Kumar, Kevin Li, Adam
Louie, Alan Louie, Jessica Lu, Winston Mann, Daniel Mirsky, Kelly Misner, Luke
O’Connor, Miriam Tarshish, Chenmuren Zhang
Thesis submitted in partial fulfillment of the requirements of the Gemstone Program,
University of Maryland, 2014
Advisory Committee:
Dr. Andrew Lazur, University of Maryland Extension, Mentor
Dr. Thomas Miller, Chesapeake Biological Laboratory
Dr. David Love, Johns Hopkins Center for a Livable Future
Christian Melendez, Eco-City Farms

iii
© Copyright by
Jonathan Aguilera-Titus, Yusi Cao, Eric Kazyak, Kalyani Kumar, Kevin Li, Adam
Louie, Alan Louie, Jessica Lu, Winston Mann, Daniel Mirsky, Kelly Misner, Luke
O’Connor, Miriam Tarshish, Chenmuren Zhang
2014
iv
Acknowledgements
We would first like to thank Dr. Andrew Lazur for his invaluable mentorship
and guidance throughout our project. His wisdom and guidance took us far beyond
our expectations for the project. We extend our sincerest thanks to Nevenka
Zdravkovska, our Librarian, for always being willing to provide expert advice during
our literature review and the thesis writing process.
We’d also like to thank the University Sustainability Council for supporting
our project through a grant from the University Sustainability Fund; Greg Thompson,
the University of Maryland Dining Services, Gary Seibel, the UMD Environmental
Science and Technology Project Development Center and The University Research
Greenhouse Complex for allowing us to use their space for conducting our research;
and Thought For Food for sending us to Berlin and Auburn for conferences.
Finally, we’d like to thank the Gemstone staff for their consistent support
throughout the process.

v
Table of Contents
Acknowledgements ...................................................................................................... iv Table of Contents .......................................................................................................... v
List of Figures ............................................................................................................. vii List of Tables ............................................................................................................... ix Abbreviations and Units ............................................................................................... x Introduction ................................................................................................................... 1 Literature Review.......................................................................................................... 5
Hydroponics .............................................................................................................. 5 Aquaculture ............................................................................................................... 5 Aquaponics ............................................................................................................... 6
Existing Systems ....................................................................................................... 7 Fish and Plants ........................................................................................................ 10 Nutrient Sources...................................................................................................... 12
Duckweed. .......................................................................................................... 13 Compost. ............................................................................................................. 14
Dairy and Poultry Manures. ................................................................................ 15 Activated Sludge. ................................................................................................ 16 Rice bran. ............................................................................................................ 17
Sorghum. ............................................................................................................. 17 Soybean meal. ..................................................................................................... 17
Metrics .................................................................................................................... 18 Applications and Global Markets ........................................................................... 19
Experiment Structure .............................................................................................. 22 Phase 1 Protein Analysis of Duckweed ...................................................................... 25
Introduction ............................................................................................................. 25 Methodology ........................................................................................................... 25 Results ..................................................................................................................... 28
Discussion ............................................................................................................... 31 Phase 2: Small-scale Aquaponic Analysis of Alternative Feeds ................................ 33
Introduction ............................................................................................................. 33 Logistics .................................................................................................................. 33
Research Design...................................................................................................... 34 General Procedure ................................................................................................... 37 Data Collection Method .......................................................................................... 38 Results ..................................................................................................................... 39
Tilapia Weight. ................................................................................................... 39 Dried Plant Biomass. .......................................................................................... 41
Discussion ............................................................................................................... 44
Phase 3: Small-scale Aquaponic Analysis of Blended Nutrients ............................... 45 Introduction ............................................................................................................. 45 Logistics .................................................................................................................. 45 Research Design...................................................................................................... 45 General Procedure ................................................................................................... 46

vi
Data Collection Method .......................................................................................... 47 Results ..................................................................................................................... 47
Tilapia Weight. ................................................................................................... 48 Dried Plant Biomass. .......................................................................................... 50
Discussion ............................................................................................................... 53 Phase 4: Larger-scale Analysis of Soybean Meal in Aquaponic Systems .................. 54
Introduction ............................................................................................................. 54 Logistics .................................................................................................................. 54 Research Design...................................................................................................... 61
General Procedure ................................................................................................... 63 Data Collection Method .......................................................................................... 64 Results ..................................................................................................................... 65
Plant Growth. ...................................................................................................... 67
Discussion ................................................................................................................... 70 Introduction ............................................................................................................. 70
Phase 1 .................................................................................................................... 70 Phases 2 and 3 ......................................................................................................... 71
Phase 4 .................................................................................................................... 75 Water Chemistry ..................................................................................................... 78 System Design ........................................................................................................ 79
Future Directions .................................................................................................... 81 Economic Analysis ................................................................................................. 82
Conclusion .................................................................................................................. 86 Research Summary ................................................................................................. 86 Potential Implications ............................................................................................. 87
Future Work ............................................................................................................ 88
Final Words ............................................................................................................. 89 Appendix A: Acceptable Nitrogen Concentration Ranges for Tilapia Health ........... 90 Appendix B: Phase 1 Data Tables .............................................................................. 91
Appendix C: Phase 2 Data Tables .............................................................................. 92 Appendix D: Phase 3 Data Tables .............................................................................. 94
Appendix E: Phase 4 Data .......................................................................................... 98 Appendix F: Water Chemistry Protocols .................................................................... 99
Appendix G: Nutrient Source Product Information .................................................. 105 Appendix H: Alternative Feed Source Product Information .................................... 106 Appendix I: Fish Feed Product Information ............................................................. 108 Appendix J: Product Information.............................................................................. 109 Appendix K: Product Information ............................................................................ 111
Appendix L: Diagram of University of Virgin Islands Aquaponic System .............. 120 Appendix M: Phase 4 Fluid Dynamics Calculations ................................................ 121
Appendix N: Glossary of Terms ............................................................................... 122 Appendix O: Reference List ..................................................................................... 128

vii
List of Figures
Figure 1. Schematic representation of research design. ............................................. 23
Figure 2: Phase 1 effect of nutrient sources on duckweed biomass ........................... 29
Figure 3: Phase 1 effect of nutrients sources on duckweed protein ........................... 30
Figure 4. Peat pellet setup for germination. ............................................................... 35
Figure 5. Average fish weight over time. ................................................................... 40
Figure 6. Phase 2 average fish growth percentages. ................................................... 41
Figure 7. Phase 2 average cumulative lettuce production. ......................................... 42
Figure 8. Phase 2 average cumulative basil production. ............................................ 43
Figure 8. Basil and lettuce growth. ............................................................................. 43
Figure 10. Phase 3 average weight per fish over time. ............................................... 48
Figure 11. Phase 3 average fish growth percentages. ................................................. 49
Figure 12. Phase 3 average cumulative lettuce production. ....................................... 51
Figure 13. Phase 3 cumulative basil production. ........................................................ 52
Figure 14. Top, isometric, front, and side views of the overall structure. .................. 55
Figure 15. Top and side views of the individual drain pipe. ...................................... 57
Figure 16. Water flow in system. ............................................................................... 58
Figure 17. Rooftop high tunnel. ................................................................................. 59
Figure 18. Rooftop high tunnel interior. ..................................................................... 60
Figure 19. Average fish weight vs. time..................................................................... 66
Figure 20. Average fish growth percentages. ............................................................. 66
Figure 21. Phase 4 average cumulative lettuce production. ....................................... 68
Figure 22. Phase 4 average cumulative basil production. .......................................... 69
Figure 23. Comparison of feed ingredients and fish product. .................................... 85
Figure 24: Phase 3 Diagram, Distribution of Fish Mortality Among Replications.... 95
Figure 24. La Motte Ammonia Nitrogen Test Kit Protocol. ...................................... 99
Figure 25. La Motte Nitrite Nitrogen Test Kit Protocol. .......................................... 100
Figure 26. La Motte Nitrate Nitrogen Test Kit Protocol. ......................................... 101
Figure 28. La Motte Low Range Phosphate Test Kit Protocol. ............................... 102
Figure 29. La Motte Alkalinity Test Kit Protocol. ................................................... 103
Figure 30.La Motte Total Hardness Test Kit Protocol. ............................................ 104
Figure 31. Poultry manure product information. ...................................................... 105
Figure 32. Activated sludge product information..................................................... 105
Figure 33. Rice bran product information. ............................................................... 106
Figure 34. Soybean meal product information. ........................................................ 106
Figure 35. Sorghum product information. ................................................................ 107
Figure 36.Commercial fish feed product information. ............................................. 108
Figure 37. Lettuce product information. ................................................................... 109
Figure 38. Basil product information. ...................................................................... 109
Figure 39. Okra product information........................................................................ 110

viii
Figure 40. Broccoli product information. ................................................................. 110
Figure 40. Dissolved oxygen meter product information. ........................................ 111
Figure 41. pH meter product information. ................................................................ 112
Figure 43. Jiffy-7® plugs product information. ....................................................... 113
Figure 44. Sodium thiosulfate product information. ................................................ 114
Figure 45. Air pump product information. ............................................................... 115
Figure 46. Biomedia product information. ............................................................... 115
Figure 46. Water heater product information. .......................................................... 115
Figure 48. Phase 4 water pump product information. .............................................. 116
Figure 49. Phase 2 and 3 water pump product information. .................................... 117
Figure 50. Lamp/Bulb product information. ............................................................ 118
Figure 51. Clay aggregate product information. ...................................................... 118
Figure 52. Water conditioner product information. .................................................. 119
Figure 53. Aquaponic system diagram. .................................................................... 120
Figure 54. Phase 4 fluid dynamics calculations. ...................................................... 121

ix
List of Tables
Table 1. Percent nitrogen content of Milorganite® activated sludge, compost, poultry
manure, and dairy manure ............................................................................................................ 25
Table 2. Minimum and Maximum Ammonia Nitrogen concentrations measured during
Phase 1 pilot study ........................................................................................................................ 27
Table 3. Phase 1 Data: Alternative Nutrient Source Characteristics and Effect on
Dukweed Production ..................................................................................................................... 28
Table 4. Percentage tilapia body mass fed over time ................................................................... 62
Table 5. Phase 4 Data, Average Growth, FCR, and Survival Rate .............................................. 67
Table 6. Acceptable Nitrogen Concentration Ranges for Tilapia (Rakocy, 1989,
September) .................................................................................................................................... 90
Table 7. Phase 1 Data: Tukey Multiple Comparisons Test for Total Duckweed
Biomass and Protein Content ....................................................................................................... 91
Table 8. Phase 2 Data, Tilapia Weights and Final Growth Percentage ...................................... 92
Table 9. Phase 2 Data, Tukey Multiple Comparisons Test for Tilapia Growth
Percentage .................................................................................................................................... 92
Table 10. Phase 2 Data, Average Cumulative Lettuce Production .............................................. 92
Table 11. Phase 2 Data, Average Cumulative Basil Production .................................................. 93
Table 12. Phase 2 Data, Tukey Multiple Comparisons Test for Dried Plant Biomass ................ 93
Table 13. Phase 3 Data, Tukey Multiple Comparisons Test on Tilapia Growth
Percentage .................................................................................................................................... 94
Table 14. Phase 3 Data, Tukey Multiple Comparisons Test on Tilapia Growth
Percentage .................................................................................................................................... 94
Table 15. Phase 3 Data, Average Cumulative Lettuce Production .............................................. 95
Table 16. Phase 3 Data, Average Cumulative Basil Production .................................................. 96
Table 17. Phase 3 Data, Tukey Multiple Comparisons Test for Dried Plant Weight ................... 97
Table 18. Toxin Analysis for Tissue Samples from Phase 3 ......................................................... 97
Table 19. Phase 4 Tilapia Weights and Final Growth Percentage .............................................. 98
Table 20. Phase 4 Data, Average Cumulative Lettuce Production .............................................. 98
Table 21. Phase 4 Data, Average Cumulatice Basil Production .................................................. 98
x
Abbreviations and Units
ADC Apparent Digestibility Coefficient
AMVA American Veterinary Medical Association
ANOVA Analysis of Variance
CF Solution Conductivity Factor
DO Dissolved Oxygen
FAO Food and Agriculture Organization
FCR Feed Conversion Rate
FDA Food and Drug Administration
FE Feed Efficiency
GFCI Ground Fault Circuit Interrupter
IMF International Monetary Fund
LDCs Least Developed Countries
LECA Light Expanded Clay Aggregate
LIFDC Low Income Food Deficit Countries
MEGA Maximizing Efficiency of Greenhouses using Aquaponics
NH3 Ammonia
NO2 Nitrite
NO3 Nitrate
NOAA National Oceanic and Atmospheric Administration
O3 Ozone
PO4 Phosphate
SVSU Saginaw Valley State University
TWC The WorldFish Center
UMD University of Maryland
UVI University of the Virgin Islands
VAC Voltage, Alternating Current
WFP World Food Programme

xi
ºC Degrees Celsius
cm Centimeter
fish/L Fish per liter
fish/gal. Fish per gallons
ft2 Square feet
g. Grams
gal. Gallons
gal./min Gallons per minute
hp Horsepower
in. Inches
Kcal/100 g Kilocalories per 100 grams
Kg Kilograms
Kg/(m2·year) Kilograms per square meter per year
lb. Pound
l Liters
l/h Liters per hour
l/min Liters per minute
m Meters
m2 Square meters
mg/L Milligrams per Liter
mg/kg Milligrams per kilogram
mm Millimeters
mmol photons/m2s Millimole photons per square meter per second
ppm Parts per million
V Voltage
W Watts

1
Introduction
According to the Food and Agriculture Organization of the United Nations (FAO), 842
million people, approximately one in every eight, suffered from chronic hunger, the lack of
sufficient dietary energy to conduct an active life, from 2011 to 2013 (Food and Agriculture
Organization (FAO), 2013). Of these 842 million, 98% live in developing countries1 and nearly
three quarters reside in rural areas (World Food Programme, n.d.). Several factors are known to
contribute to the high incidence of hunger in developing regions. While the population in
developing countries is increasing, available farmland is decreasing due to development,
desertification1, and drought (Ezeh, Bongaarts, & Mberu, 2012; Ramankutty, Foley, &
Olejniczak, 2002). For example, areas in sub-Saharan Africa, Ethiopia, Malawi, and Cambodia
with imperfect food markets subsequently lack food security because of geographic isolation
(van Brakel & Ross, 2010; Ghanem, 2008; FAO, 2012; CSIS, 2010; Holden & Shiferaw, 2002;
Zeller, Diagne, & Mataya, 1998).
Furthermore, there is a widespread lack of infrastructure within developing regions of the
world. Globally, 1.4 billion people are without electricity, 85% of whom live in rural
communities (Kaygusuz, 2012). One billion people do not have access to a clean water supply,
and many areas cannot support the large amounts of water demanded by agriculture (Hunter,
MacDonald, & Carter, 2010). Fisheries, an economically feasible alternative to land-based
agriculture, have become critical to food security in the developing world (FAO, 2012). Fish
accounts for 19.2% of animal protein intake in the diet of developing countries and an average of
24% in the 62 countries categorized as Low-Income Food Deficient Countries1 (LIFDCs) by the
1 For a full glossary of terms, see Appendix N. All terms with this denotation will be defined in
Appendix N.

2
FAO (2012; 2014). In 2010, fish exports from LIFDCs accounted for $4.7 billion of the world’s
total trade (FAO, 2012).
Unfortunately, overfishing of the world’s oceans has since reduced the viability of wild-
caught fish as a stable food source. An estimated 90% of large fish such as tuna, swordfish,
marlin, cod, and halibut are gone from oceans, and selectively harvesting these fish has placed
evolutionary pressure on the population, resulting in slower growth and reduced body sizes
(Conover, Munch, & Arnott, 2009; Myers & Worm, 2003). Wild-caught fish and natural aquatic
resources are therefore unlikely to be able to satisfy the protein demands of a growing world
population (van Brakel & Ross, 2010).
Despite these setbacks to wild fisheries, fish as a protein source for humans has been
steadily increasing via aquaculture1 (Larsen & Roney, 2013). Aquaculture, the farming of fish or
other seafood, recently surpassed both wild-caught fish and beef production and has become the
fastest growing food production sector, maintaining an average growth of 8.3% annually since
the mid-1980s (Larsen & Roney, 2013; National Oceanic and Atmospheric Administration
Fisheries, 2012a). Aquaculture now provides more than 50% of the seafood eaten globally;
producing an all-time high of 60 million metric tons (130 billion lb.) in 2010 (NOAA Fisheries,
2012a; FAO, 2012). Recirculating1 aquaculture systems have gained momentum in part because
they can sustain both omnivorous1 and carnivorous1 species at a low cost while limiting disease
transfer, nutrient pollution, and genetic mixing1 that are frequently associated with traditional
aquaculture (Naylor et al., 2009; Martins et al., 2010).
The rapid expansion of aquaculture, however, has raised questions about its
sustainability. Most fish raised in aquaculture systems require high protein diets for faster
growth, which commonly consist of fishmeal made from lower-value, wild-caught fish, such as
3
anchovies, mackerel, sardines, and menhaden (Larsen & Roney, 2013; Naylor et al., 2009; Pauly
& Watson, 2009). Furthermore, the global distribution of aquaculture systems remains
unbalanced as the least developed countries1 (LDCs) contribute only 4.1% to world aquaculture
production (FAO, 2012). This suggests that current aquaculture systems are infeasible for
application in these LDCs due to cost, inaccessibility, and the depletion of fisheries, which has
led to increased prices for fish feed.
Aquaponics is a novel, alternative method of fish and crop production that combines
aquaculture with hydroponics1, a method of growing plants without soil. The plants filter waste
products harmful to the fish from the system by utilizing them as a nutrient source (Rakocy,
Bailey, Shultz, & Thomas, 2004). This symbiotic interaction in the system can reduce the need
for filters, fertilization, mechanical maintenance1, water monitoring, and water changes as
compared to aquaculture or hydroponics alone (Diver, 2006; Rakocy et al., 2004). These
advantages can reduce operating costs and improve the potential for profit through increased
yields (Rakocy et al., 2004).
Current aquaponic systems exist in several urban areas for educational and commercial
production purposes, but they have not seen widespread use in rural settings as a means of
subsistence1. This is partially because current aquaponic systems require large inputs of capital,
electricity, and processed fish feed (Lapere, 2010; Hishamunda, Jolly, & Engle, 1998; Kassie &
Zikhali, 2009). Studies conducted in South Africa, Rwanda, and Nigeria found that the lack of
available resources (such as electricity, presence of markets, and access to skilled labor) in
developing countries is an important factor that limits the feasibility of a cost efficient and
sustainable1 aquaponic system (Lapere, 2010; Hishamunda et al., 1998; Kassie & Zikhali, 2009).
Additionally, formulated fish feeds represent one of the largest variable costs in traditional

4
aquaculture systems (Naylor et al., 2009). A viable aquaponic system would therefore have to
grow local crops, be built using local building materials, and utilize locally available alternative
feeding sources.
The primary goal of our project is to evaluate the effect of alternative feed sources on fish
growth and crop production of a closed-loop subsistence-level aquaponic system. To do so, we
have implemented a four phase experimental design. We define subsistence-level as a low
energy system that can provide a supply of food for direct consumption by the individuals
maintaining it. By using alternative nutrient sources in subsistence-level aquaponics, we
hypothesize that we can produce biomass yields1 comparable to existing systems while reducing
input costs.
5
Literature Review
Hydroponics
Hydroponics is a broad term, but it is commonly defined as a form of soilless agriculture
in which plant roots are suspended in either a static, continuously aerated nutrient solution or a
continuous flow of nutrient solution (Jones, 2012). Hydroponics is optimal in situations where
space is limited. Traditional crops require substantial amounts of land, labor, and other
resources. Hydroponics nearly eliminates the need for soil and labor for tilling and other
agriculture practices (Jones, 2012). Another issue with traditional agriculture is the loss of
nutrients from the fields due to leaching. According to Wignarajah (as cited by Pessarakli, 2014)
leaching is the process by which water soluble plant nutrients leave the soil through rainwater or
irrigation. Leaching does not occur in hydroponics due to the lack of soil. While hydroponics
does save a lot of soil management and labor time, it presents other challenges. The initial
startup costs for hydroponics are high. In addition, the required knowledge on plant health,
system operation, and nutrient requirements often deter amateur farmers (Jones, 2012). Despite
these difficulties, hydroponic farming has grown in past years, generating revenues of $606.8
million worldwide in 2013 (Kruchkin, 2013).
Aquaculture
Aquaculture may be defined as the process of “…breeding, rearing, and harvesting of
plants and animals in all types of water environments including ponds, rivers, lakes, and the
ocean” (NOAA Fisheries, 2012b). Aquaculture has reduced the pressures on wild caught
fisheries to fulfill increased demands by providing an alternative source of large fish
(Chamberlain & Rosenthal, 1995). The difference between demand and natural fish population
supply has been filled by a steady increase in fish from cage aquaculture1 (Findlay, Podemski, &

6
Kasian, 2009). Despite the intriguing advantages of aquaculture systems, there are pitfalls as
well. Cage aquaculture produces uneaten feed, solid nitrogenous waste, disease, antibiotics and
harmful oils that can be introduced to the local ecosystem (Liu & Sumaila, 2010; Findlay et al.,
2009). In addition, feed for aquaculture systems currently uses fish and fish waste as a food
source (FAO, 2012). Together, these issues can increase the potential for eutrophication1 and
threaten biodiversity1 in the surrounding aquatic communities. Recirculating aquaculture
provides a more sustainable option with the recycling of water (Durham, 2010) and increased
biosecurity. Unfortunately, most commercial systems to date have failed to achieve the goals of
increased sustainability due to poor design, inferior management, and flawed economics
(Masser, Rakocy, & Losordo, 1999, March). Commercial aquaculture systems produce 40.1% to
the world total fish production with 62.7 million metric tonnes (69.1 million tons) in 2011
compared to 34.7 million metric tonnes (38.3 million tons) ten years earlier (FAO, 2011).
Despite large production numbers, research continues to reveal ecological detriments of
aquaculture and the demands for more sustainable methods within the production of fish remain.
Aquaponics
Aquaponics combines fish and plant crop production in a symbiotic1, closed-loop system.
Aquaponics can provide fish yields comparable to intensive aquaculture and plant yields
exceeding those of conventional hydroponics. The symbiotic relationship that develops between
the fish and plants can result in these increased yields while reducing costs and required inputs
and maintenance (Savidov, Hutchings, & Rakocy, 2005; Wilson, 2005). In most aquaponic
systems, fish are fed a high-protein diet (Rakocy, Masser, & Losordo, 2006, November; Rakocy,
2011). The fish excrete waste that is high in potentially toxic nitrogen compounds, including
ammonia (NH3), through their gills as well as in their feces. These compounds are first

7
processed into nitrite (NO2), then nitrate (NO3) by nitrifying bacteria on submerged surfaces in
the system. The plants utilize the nitrate from the water for growth, serving as a biofilter1 and
thereby reducing the need for active biological or chemical filtration and water quality
management. As the plants filter the water, they also reduce the need to replace water for the
fish tanks, while the fish provide biologically available1 nutrients for the plants. Together, these
key processes can eliminate the need for expensive nutrient management systems employed in
conventional hydroponics, and induce plant growth more effectively (Rakocy et al., 2006,
November).
Overall, the closed-loop design of an aquaponic system effectively minimizes required
inputs (nutrient, energy, and manpower) thereby lowering economic barriers to aquaponics as
compared to conventional hydroponics and aquaculture (Rakocy et al., 2006, November).
Existing Systems
One of the most tested and documented aquaponic systems was developed at the
University of the Virgin Islands (UVI) (see Appendix L for diagram). In this system, 7,800 L
(2,060 gal.) fish-rearing tanks are used with flow rates of 380 L/min (100 gal./min). The water
flows through degassing and filter tanks before providing water for 11,000 L (3,000 gal.) plant
beds growing lettuce, basil, and several other plants. Because of the extensive filtration system
for maintaining water quality, the UVI system has stocking densities of 0.077 fish/L (0.29
fish/gallon). A settling tank and clarifier also remove solids while regulating pH1 to stay
between 6.5 and 7 through the application of potassium hydroxide and calcium hydroxide. An
extensive aeration1 system is also required to keep fish alive in this aquaponic system; the test
system at UVI uses 22 air diffusers in each fish-rearing tank, requiring a constant supply of
power (Rakocy, 2006).

8
Because of all of this equipment, the system, which produces 5,000 kg (11,000 lb.) of
tilapia and 37,800 heads of lettuce per year, costs over $40,000 to build, excluding labor costs
(“Commercial Facility,” 2009). The system was developed in a tropical environment and the
plant beds were not covered or protected, though subsequent research has shown that the system
adapts well to a greenhouse environment (Savidov et al., 2005). An enclosure would add to the
cost if needed for non-tropical settings.
In the UVI system, a commercial fish feed with approximately 34% protein is used in a
well-defined feeding regimen in order to achieve optimal growth. Nile tilapia (Oreochromis
niloticus) fingerlings had a survival rate of 98.3% over the course of the study. 3.2 mm (0.13 in.)
feed pellets are used until the fish reach a mean size of 300 g. Subsequently, 4.8 mm (0.19 in.)
pellets are used. The fish are fed 2.5% of their body weight each day up to 300 g and then are
given 1.25% per day. Under this feeding regimen, fish in 24.8° C water reach an average mass
of 813.8 g in 24 weeks from a starting average mass of 79.2 g (Rakocy et al., 2006, November).
For plants in the system, seeds are germinated in rockwool1 and then transferred onto
polystyrene rafts that float on the water circulating through the plant beds. This method of
hydroponics is highly stable, requiring less maintenance than other options, which trap solid
waste and must be cleaned periodically (Lennard & Leonard, 2006). In a study that adapted the
UVI system for use in a greenhouse in Canada, the plants were kept in an area with air
temperature between 22º and 25º C, and artificially lit at levels greater than 300 mmol
photons/m2/s for sixteen hours a day (Savidov et al., 2005).
Intensive aquaponic systems are becoming more popular and are being implemented on a
larger scale. The majority of this growth has occurred in urban areas, where there are more
available resources. One example is the Milwaukee, WI based Sweet Water Foundation, which

9
raises over 80,000 fish in a former crane factory. Another example is the Massachusetts Avenue
Project in New York, an organization focusing on large urban aquaponics where one greenhouse
has the ability to raise over 35,000 fish concurrently (Metcalf & Widener, 2011). These current
high-density systems exist for commercial applications. However, the requirements (a large
investment of capital, reliable power, and proper infrastructure) make existing systems largely
infeasible for use in developing nations, particularly in rural areas. A large number of people
therefore cannot utilize existing aquaponic systems, but may benefit immensely from a
simplified, less resource-intensive system.
Unfortunately, research regarding the successful implementation of small-scale
aquaponics is limited, and previous large-scale1 projects in developing countries have failed.
Attempts to implement large-scale tilapia production systems in rural areas have been
unsuccessful, due to local government resistance and problems with economic feasibility. In
South Africa, for example, farming of Nile tilapia is illegal, and there are no examples of the
government making exceptions. Furthermore, financing these ventures was described as difficult
(Lapere, 2010). Despite logistical concerns regarding large-scale tilapia production, there is
potential for subsistence-level aquaponics. One article written by Nelson and Pade (2007)
discusses the potential benefits of a small-scale simplified aquaponic system they termed
“Village Aquaponics.” They predicted that aquaponic systems that grow food primarily for local
consumption can be a viable means of providing protein and vegetables to people in both
developing and developed nations. This prediction can only be verified with further studies of
subsistence-level aquaponics.
Luke’s Mission is one of few documented examples of a local aquaponic system being
implemented in a rural environment. This system was built in Haiti, and although a website and

10
a journal article on the project exist, no further updates have been documented since construction
in 2004 (Perry & Rittgers, 2004). This seems to indicate that, if successful, it was an isolated
instance, and the project has not expanded. This system does not have access to electrical power,
and thus utilized alternative means of circulation and other required system processes.
Hughey (2005) designed a flooding system that allowed a low flow pump to be used. He
predicted that an off-grid1 aquaponic system was possible, and that it would be very beneficial.
He planned to implement a pilot system in Kenya using wind power, but noted that design
modifications still needed to be made. This pilot system, which he calls “barrel-ponics” due to
the use of plastic barrels as plant beds and other containers, was then constructed. The program
appears to be successful, but quantitative information about the system has not been collected to
evaluate its efficiency relative to other aquaponic systems. However, applications of this system
could be limited because it requires over 400 W (0.536 hp) of electricity to run a 2650 L (700
gal.) system and access to plastic barrels that are often used to ship food-products (Hughey,
2008).
In order to successfully utilize aquaponics as a primary means of subsistence, low energy
methods of water circulation, aeration, and filtration are needed.
Fish and Plants
Nile tilapia is a common choice of fish for aquaponics. Tilapia is a freshwater fish
species that grows and reproduces quickly. They are also readily accepted in the world market
(Rakocy, 2011). Red and Nile tilapia (both members of the Oreochromis niloticus species) are
regularly used, but Nile tilapia grow larger and can have a better survivability rate (Rakocy et al.,
2004; Rakocy et al., 2006, November). Even in adverse conditions, Nile tilapia grow easily,
making them a good choice for both high- and low-intensity1 aquaponic systems. They consume

11
a primarily vegetable diet, which allows the use of nutrient options that are more sustainable and
more available than conventional processed fish feed (Delong, Losordo & Rakocy, 2009, June).
Ideal conditions in which tilapia grow and reproduce most quickly are as follows: Dissolved
oxygen (DO) concentrations of 5.0 - 7.5 mg/L (ppm), temperatures 27 - 29º C and pH 6-9. They
can survive extreme oxygen conditions of as low as 0.3 mg/L briefly, but should be maintained
above 1.0 mg/L. Temperatures below 10 - 11º C are fatal, and feeding stops below 17º C (Popma
& Masser, 1999, March).
There are also many varieties of plant species that can be grown in aquaponic systems.
Of these plants, the most commonly grown in aquaponic systems are lettuce, basil, and tomatoes.
Broccoli, a cool climate crop, is also suitable for aquaponics (Rakocy et al., 2006, November;
Harston, 2007). Fruiting vegetables have a longer growing cycle and often have more pest and
disease problems associated with them, but typically receive higher prices at markets (Rakocy et
al., 2006, November). The exception to that is basil, which thrives in the aquaponic environment
(yielding up to 42 kg/(m2·year)) and can be sold at a high price in most regions. For this reason,
basil is the most researched crop in aquaponics. Crops that can be grown in an aquaponic setting
fall into three main categories based on the solution conductivity factor1 (CF) in which the plants
perform best. Group 1 comprises plants with high CF and includes tomato and eggplant. Group
2 plants have medium CF and include lettuce, basil, and cucumber. Group 3 consists of plants
with low CF and includes watercress (Savidov et al., 2005). It is important to consider the
requirements of the specific cultivars1 that will be grown in an aquaponic system when
determining if nutrient supplementation will be necessary. There are thirteen total nutrients that
these plants need to absorb from the water: nitrogen, potassium, calcium, magnesium,
phosphorus, sulfur, chlorine, iron, manganese, boron, zinc, copper, and molybdenum. The first

12
three are macronutrients1, while the others are micronutrients1. The limiting factors1 in the UVI
system are potassium, calcium, and magnesium, which they supplement in the form of potassium
hydroxide, calcium hydroxide, and dolomite (CaMg(CO3)2) in order to maintain plant growth
(Rakocy et al., 2006, November).
Nutrient Sources
Once the aquaponic system is in place, the primary cost of continuing production is
purchasing fingerlings and feed. Tilapia can reproduce quickly in an aquaponic system as
previously noted, and therefore the cost of fingerlings can be largely avoided through husbandry
practices that retain a brood stock1. Feed poses more of a challenge as it is expensive to
purchase, and many rural areas do not have market access to purchase processed feeds (Metcalf
& Widener, 2011). Therefore, alternative sources of nutrients that are widely available and more
cost-effective would make a system more flexible and feasible. We searched existing literature
on the subject in order to find possible alternatives to commercial fish feed.
El-Sayed (1999) conducted a study on fish feeding of farmed tilapia. He found that over
50% of operating costs in aquaculture are dedicated to dietary sources for fish feeding. The high
costs are attributed to the expense of traditional commercial fish feeds, which typically consist of
fish meal as the main protein source. El-Sayed’s paper investigates blending fish feed with
alternative substances. When blended in 1/1 ratio with fish meal, fish silage1 provides
insignificant differences to growth and digestibility of Nile tilapia. Higher ratios of fish by-
products were also tested, but led to reduced performance. Tilapia growth surpassed the control
fish meal feed when a 3/1 meat and bone meal1 was used as the supplemental feed. These
supplemental feeds provide possible alternatives in reducing the conventional use of fish meal
(El-Sayed, 1999).

13
The percentage of overexploited fish stocks increased from 10% in 1974 to 26% in 1989
and has continued to rise since then. Over 29% of fish stocks are estimated to be overexploited
and are in need of strict management plans to restore ecological balance. The top ten species are
fully exploited and production rates therefore remain stagnant. The top ten species together
account for nearly 30% of the world marine capture fisheries production and include anchoveta,
blue whiting, and Alaska pollock (FAO, 2013; Conover, Munch, & Arnott, 2009). In 2012, FAO
reported that the state of world marine fisheries is worsening and overexploitation must be
managed to prevent further ecological damage and increase production rates (FAO, 2013).
Our literature review of potential alternative feeds led us to several potential sources that
would be more accessible in our targeted regions. These nutrients include vegetable compost1,
dairy manure1, poultry manure1, activated sludge1, rice bran1, sorghum1, and soybean meal1. In
addition to these by-products and wastes, we looked for an intermediary plant1 that could be used
to capture nutrients dissolved in water and that would be more readily accepted by the fish as a
feed. This intermediate plant is necessary because several of the nutrient sources mentioned
above may not be accepted if offered directly as feed to the tilapia. Duckweed1 was identified as
the best option to serve this purpose.
Duckweed.
Duckweed is one of the fastest-growing vascular plants1, doubling in mass every 16-48
hours. The plant contains very little fiber content and has extremely high digestibility. It can be
used as a complete feed for adult tilapia, providing all of the major and minor nutrients required
to promote rapid growth.
Apparent digestibility coefficient (ADC) 1 can be used as a metric to measure the
proportion of a food that is digested compared to what is absorbed, expressed as a
14
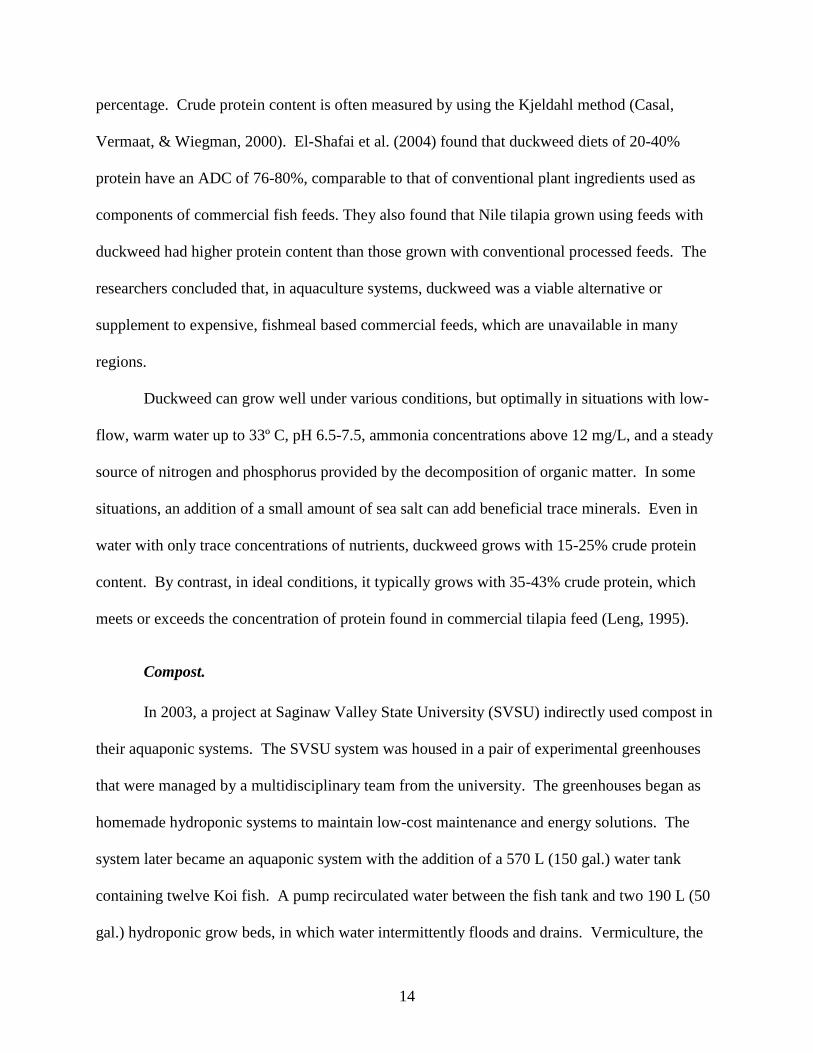
percentage. Crude protein content is often measured by using the Kjeldahl method (Casal,
Vermaat, & Wiegman, 2000). El-Shafai et al. (2004) found that duckweed diets of 20-40%
protein have an ADC of 76-80%, comparable to that of conventional plant ingredients used as
components of commercial fish feeds. They also found that Nile tilapia grown using feeds with
duckweed had higher protein content than those grown with conventional processed feeds. The
researchers concluded that, in aquaculture systems, duckweed was a viable alternative or
supplement to expensive, fishmeal based commercial feeds, which are unavailable in many
regions.
Duckweed can grow well under various conditions, but optimally in situations with low-
flow, warm water up to 33º C, pH 6.5-7.5, ammonia concentrations above 12 mg/L, and a steady
source of nitrogen and phosphorus provided by the decomposition of organic matter. In some
situations, an addition of a small amount of sea salt can add beneficial trace minerals. Even in
water with only trace concentrations of nutrients, duckweed grows with 15-25% crude protein
content. By contrast, in ideal conditions, it typically grows with 35-43% crude protein, which
meets or exceeds the concentration of protein found in commercial tilapia feed (Leng, 1995).
Compost.
In 2003, a project at Saginaw Valley State University (SVSU) indirectly used compost in
their aquaponic systems. The SVSU system was housed in a pair of experimental greenhouses
that were managed by a multidisciplinary team from the university. The greenhouses began as
homemade hydroponic systems to maintain low-cost maintenance and energy solutions. The
system later became an aquaponic system with the addition of a 570 L (150 gal.) water tank
containing twelve Koi fish. A pump recirculated water between the fish tank and two 190 L (50
gal.) hydroponic grow beds, in which water intermittently floods and drains. Vermiculture, the
15
process of growing worms, was introduced as a means to supplementing the hydroponic plant
growth. Worms were placed into vermiculture1 beds and cultivated in a mix of SVSU’s
compost, which consisted of food scraps and shredded, recycled paper. As the worms cultured in
the beds, excess water leached through vermicompost to buckets placed below drain pipes. This
leachate would then be used to fertilize the hydroponic plants and those grown in topsoil
(Jorgensen, Meisel, Schilling, Swenson, & Thomas, 2009).
There is limited literature regarding the use of compost to fertilize duckweed. However,
compost is often used as a fertilizer in organic farming (Rynk, 1992). Additionally, duckweed
thrives in the presence of decomposing organic matter. Thus, compost is a promising nutrient
source for duckweed growth.
Dairy and Poultry Manures.
Dairy and poultry manure are routinely used as fertilizers in agriculture due to their high
concentration of key nutrients, such as phosphorous and nitrogen. This makes them excellent
nutrient sources for growing duckweed, if risks of pathogens are effectively managed. In a study
conducted by Yao, Wu, Zhu, Sun, and Miller (2011), protein extract from dairy manure was used
as a source of nitrogen to grow fungus, demonstrating its usefulness as fertilizer. Alhadhrami
and Yousif (1994) used camel and cow manures in isonitrogenous1 and isocaloric1 diets prepared
for blue tilapia. Their results indicate that pelleted feeds containing 10-20% manure provided
comparable results to a control diet of commercial feed. Higher inclusions of manure show
reduced growth. Another study by Green (1992) showed that chicken manure can replace up to
58% of pelleted supplemental feed without significantly affecting tilapia growth. The ubiquity
of both manures in agriculture makes them excellent sources for our experiment.

16
Activated Sludge.
Reusing treated wastewater in agricultural settings is becoming an increasingly popular
practice around the world. In a study conducted by Rojas-Valencia, de Velásquez, and Franco
(2011), the efficacy of wastewater treatment through the application of ozone was examined.
Treating raw wastewater for one hour with ozone at a concentration of 7.36 mg/L O3 resulted in
the removal of 87% of biological oxygen demand1 and 93% of chemical oxygen demand1. This
method preserved nutrients in the water, while eliminating harmful pathogenic microorganisms.
In another study, the use of dried fecal sludge as a fertilizer by farmers in Ghana was examined.
The research revealed that despite challenges, including smell and transportation, farmers were
seeing a large increase in productivity of the soil, resulting in increased yields, profit, and food
security for their families. The study concluded that with proper training about disease
transmission, the use of fecal sludge is a viable and affordable alternative to the imported
manufactured fertilizers that it replaces (Cofie, Kranjac-Berisavljevic, & Drechsel, 2005).
Lopez Zavala, Funamizu, and Tukakuwa (2004) studied the biological activity in bio-toilets, a
type of composting toilet, and the contents of the resulting composted material. They found that
the low-temperature processes carried out in this specific model resulted in a dramatic reduction
of ammonia nitrogen: a 93% drop. This is detrimental to its usefulness as an agricultural
fertilizer, which they noted. However, they also concluded that further modifications could be
made in order to increase the agronomic value. The waste is available everywhere and, if
properly treated, the nutrient-rich properties could be used to stimulate the growth of duckweed,
which in turn would provide a source of fish food.

17
Rice bran.
Rice bran is the residue left after the rice has been milled, and it has shown promise as a
source of fish feed. According to one study led by Amissah, Ellis, Oduro, and Manful (2003),
several different bran samples were found to contain energy levels in the area of 300 Kcal/100 g.
The bran also displayed high concentrations of potassium, phosphorous, and calcium, proving its
usefulness as a potential nutrient source. In a study by Veverica, Liti, Were, and Bowman
(2001), rice bran was used as the primary feed in an aquaculture system. Although fish raised on
a rice bran diet had the lowest average fish weight, rice bran proved more economically feasible1
than other feeds and supported acceptable water quality.
Sorghum.
Past studies demonstrate the effectiveness1 of sorghum as another viable alternative
nutrient source in aquaponics. A study led by Guimarães, Pezzato, Barros, and Tachibana (2008)
measured the apparent ADC in several feed sources to ascertain values of nutrient availability in
these sources. The digestibility values of energy and dry matter in sorghum were 82.37% and
87.29%, which were the second highest results for the five ingredients tested. Sorghum
displayed a high availability of the essential amino acid leucine. However, sorghum proved the
least effective in terms of protein digestibility, at only 56.77%. In 2000, the global area of
sorghum exceeded 50 million hectares (124 million acres) and the fastest growing sorghum
producing zones were in developing countries (Okuthe, Ngesa, & Ochola, 2013).
Soybean meal.
Soybean meal is the processed portion of the soybean after its oil has been extracted.
Soybeans are grown on every continent, excluding Antarctica, and are commonly used in both
human and animal diets. The most common soybean products used as feed in aquaculture are

18
toasted soybean meals. These come in two different varieties, dehulled and hulled. We used the
dehulled product, which has a protein content of roughly 49% (Brown, Kaushik, & Peres, 2008).
Certain anti-nutritional1 factors present in raw soybeans limit their effectiveness as a food source.
However, these factors can be mitigated through heat treatment. In fact, studies show that up to
40% of the protein provided in standard fish meal may be replaced with soybean meal without
adverse effects on the growth and body of fish (Buyukcapar & Kamalak, 2007).
Other studies show that soybean meal could replace from 67-100% of fish meal (Shiau,
Kwok, Hwang, Chen, & Lee, 1989). Many studies have produced mixed results on tilapia. As
El-Sayed (1990) describes, dietary protein concentrations in soybean meal are directly correlated
to tilapia growth rate. Multiple accounts blame reductions of tilapia growth on typical sulfur and
phosphorus compounds found in oilseed plants. Other studies alleviate such reduction by mixing
an animal protein source with the fish meal. In the case of Sadiku and Jauncey (1995), they fed
soybean flour and poultry meat meal to Nile tilapia. They found that the highest feed efficiency1
and growth rates occurred at a 75/25 blend of soybean flour to poultry meat meal.
Metrics
In examining the base of literature available on aquaponics, we found a variety of metrics
that will be useful in comparing our results with existing systems. Plant yield is measured in
pounds per square foot and pounds per plant (Savidov et al., 2005). These yields are then
evaluated based on market value1 in order to measure economic feasibility. Fish yields are
measured in weight per volume of the tank, growth rate of the fish in grams per day, survival
rate, feed conversion rate1 or feed efficiency (FCR or FE), and are also evaluated by market
value. Nile tilapia in the UVI system had a FCR of 1.7, meaning that 1.7 pounds of feed must be
consumed for the fish to grow by one pound.

19
The water flow and turnover rates1 are important considerations when determining the
stocking density1 and aeration capacity of an aquaponic system. DO, pH, and nitrogen
compounds (ammonia, nitrite, and nitrate) are measured regularly to ensure fish survival
(Rakocy et al., 2006, November). Throughout the nitrogen cycle, ammonia, nitrite, and nitrate
are intermediate and final byproducts. Ammonia and nitrite have been shown to have
detrimental effects on fish growth and plant stress. Un-ionized ammonia at concentrations as
low as 0.07 mg/L have caused tissue damage and slowed fish growth while nitrite concentrations
as low as 5 mg/L damaged root tips (Masser et al., 1999, March). Nitrate is only toxic to fish at
very high concentrations (Hrubec et al., 1996). The tolerable ranges for toxic ammonia1 and
nitrite concentrations for fish are 0-2 mg/L and 0-5 mg/L respectively (Rakocy, 1989,
September). More importantly, pH is essential for fish growth, plant health, and the nitrification
process. The production of toxic ammonia and nitrite increased significantly at a pH of 8.5
compared to that of 6.5 (Tyson et. al, 2007).
Applications and Global Markets
High levels of undernourishment1 are prevalent through much of the eastern hemisphere.
Sub-Saharan Africa, the Caribbean, and Southern Asia carry the highest percentages of total
undernourished population with 24.8, 19.3, and 16.8%, respectively. The three regions
mentioned have seen the least signs of improvement in previous 20 years, and the lack thereof
may be attributed to political instability and poor infrastructure (FAO, 2013). Van Brakel and
Ross (2011) evaluated the food markets in Cambodia, and found that large numbers of rural
residents do not have access to urban markets, contributing heavily to food insecurity. They
concluded that an aquaculture strategy that improves rural access to food would benefit up to one
million impoverished Cambodians.
20
Small-scale agriculture has a variety of benefits. Not only does it require less energy
input from potentially dangerous fertilizers and pesticides, but has also been linked to healthier,
more nutritious diets. One example of the widespread implementation of small-scale agriculture
was post-Soviet Union Cuba. After the fall of the Soviet Union, Cuba lost access to important
resources for conventional agriculture, such as oil, fertilizer and pesticides. The resultant decline
in food production caused an estimated 30% reduction in the country’s caloric intake during the
early 1990s (Murphy, 1999) The Cuban government responded by encouraging the extensive
development of urban agriculture. By 1997 there were nearly 8,000 gardens in the capital city of
Havana, covering roughly 15,000 hectares (37,000 acres) (Altieri et al., 1999). The city residents
overcame issues of poor quality soil and limited fertilizer by using raised plant beds and
producing organic fertilizers. The result of this small-scale urban agriculture was a resounding
success. In 1998, Havana produced roughly 490,000 metric tonnes (541,000 tons) of food, with
several neighborhoods producing up to 30% of their subsistence needs (Murphy, 1999). These
gardens also offered the benefits of diverse, highly nutritious crops that were ready for
consumption without the need for refrigeration or transportation.
However, implementing a similarly sized aquaponics based program to decrease food
security has many obstacles. A major challenge is funding, as the rural residents cannot afford to
put forward the capital required to purchase even a relatively inexpensive system. The same
issues were faced in Thailand, where a local government provided several communities with
aquaculture kits so that residents could grow their own fish. The citizens were not required to
directly pay back the loan, but were told to pay into a community fund so others could afford
similar kits if, and only if, their own systems were successful. The communities involved
responded well, with 50% growth in participation, going from 40 families to 60 families from
21
1996 to 2000 (Sheriff, Little, & Tantikampton, 2008). Similar approaches could be used with
aquaponic systems in other regions. It is important that the local institutions become invested in
the success of the program, as this involvement is needed for the project to succeed in the long-
term (Perry & Rittgers, 2004).

22
Experiment Structure
Our research was conducted in four phases:
Phase 1 – Evaluation of alternative nutrient sources for growing duckweed
Phase 2 – Evaluation of alternative feed sources for tilapia, 100% replacement
Phase 3 – Evaluation of alternative feed sources for tilapia, 50% replacement
Phase 4 – Large scale test of 50% soybean meal replacement
Phase 1 evaluated the use of alternative nutrient sources to grow duckweed. In particular,
activated sludge1, poultry manure, dairy manure, and local compost were compared against a
control of no added nutrient source in a two-week study. This phase was conducted in triplicate
for a total of fifteen duckweed systems. The duckweed was then evaluated based on total protein
content through lab analysis. We reached the conclusion that activated sludge as a nutrient
source grew duckweed with a protein content of 40.67%, comparable to the protein content of
duckweed grown under ideal conditions. Based on this, we chose to use duckweed grown with
activated sludge for one of the alternative nutrient sources in Phases 2 and 3.
Phase 2 evaluated the use of alternative feed sources as a 100% feed replacement for
raising tilapia and growing basil and lettuce. In particular, duckweed, sorghum, rice bran and
soybean meal were compared against a control of commercial fish feed. As mentioned above,
the duckweed was grown with activated sludge. This phase was conducted over the course of
eleven weeks and in duplicate. Based on the plant biomass yield and tilapia mass yield, along
with considerations of fish health and water chemistry, duckweed and soybean meal were chosen
for the next phase.
Phase 3 evaluated the use of alternative nutrient sources as a 50% feed replacement.
Once again, tilapia were raised and basil and lettuce were grown. In this phase, duckweed and

23
soybean meal were evaluated against a control of 100% commercial fish feed. Each of the
alternative nutrient sources was blended with 50% commercial fish feed. This phase was
conducted over the course of nine and a half weeks and in triplicate. Based on the same yields
and considerations as Phase 2, soybean meal was chosen as the only alternative nutrient source
for the final phase.
Phase 4 was the final phase in our project. This phase was conducted in a more real-
world setting and with larger numbers of fish and plants per system to help model a subsistence-
level system. In this phase, soybean meal was evaluated as a 50% feed replacement against a
control of commercial fish feed. Once again, the soybean meal was blended with 50%
commercial fish feed. This phase was conducted over the course of eight weeks and in triplicate,
shown in Figure 1. Based on this phase, we were able to evaluate the use of soybean meal as an
alternative nutrient source in a partial feed replacement for a subsistence-level aquaponic system.
(A) (B)
(C)
Figure 1. Schematic representation of research design.
(A) Phase 1 will determine what is the most effective nutrient source to fertilize duckweed. (B)
The duckweed utilized in Phase 2 will be fertilized with the selected nutrient source from Phase

24
1. (C) Phase 2 will feature three subsistence-level systems utilizing the most effective alternative
feed source determined by Phase 1.
25
Phase 1 Protein Analysis of Duckweed
Introduction
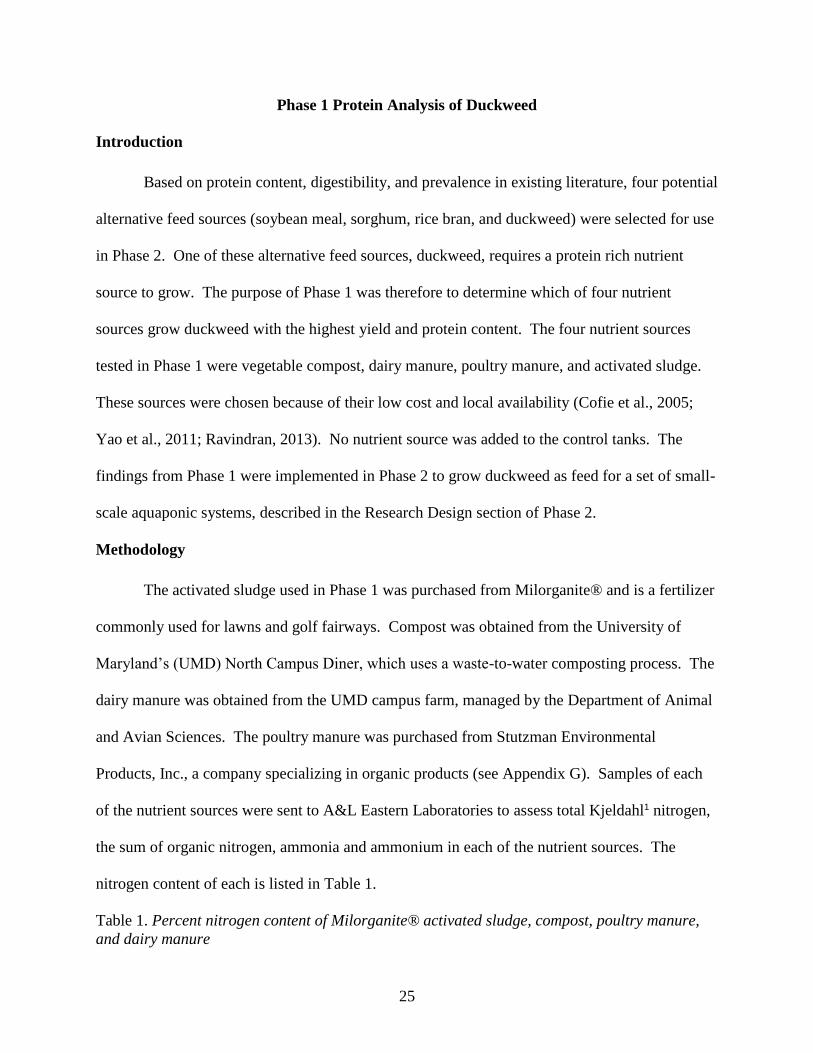
Based on protein content, digestibility, and prevalence in existing literature, four potential
alternative feed sources (soybean meal, sorghum, rice bran, and duckweed) were selected for use
in Phase 2. One of these alternative feed sources, duckweed, requires a protein rich nutrient
source to grow. The purpose of Phase 1 was therefore to determine which of four nutrient
sources grow duckweed with the highest yield and protein content. The four nutrient sources
tested in Phase 1 were vegetable compost, dairy manure, poultry manure, and activated sludge.
These sources were chosen because of their low cost and local availability (Cofie et al., 2005;
Yao et al., 2011; Ravindran, 2013). No nutrient source was added to the control tanks. The
findings from Phase 1 were implemented in Phase 2 to grow duckweed as feed for a set of small-
scale aquaponic systems, described in the Research Design section of Phase 2.
Methodology
The activated sludge used in Phase 1 was purchased from Milorganite® and is a fertilizer
commonly used for lawns and golf fairways. Compost was obtained from the University of
Maryland’s (UMD) North Campus Diner, which uses a waste-to-water composting process. The
dairy manure was obtained from the UMD campus farm, managed by the Department of Animal
and Avian Sciences. The poultry manure was purchased from Stutzman Environmental
Products, Inc., a company specializing in organic products (see Appendix G). Samples of each
of the nutrient sources were sent to A&L Eastern Laboratories to assess total Kjeldahl1 nitrogen,
the sum of organic nitrogen, ammonia and ammonium in each of the nutrient sources. The
nitrogen content of each is listed in Table 1.
Table 1. Percent nitrogen content of Milorganite® activated sludge, compost, poultry manure,
and dairy manure

26
Nutrient Source Nitrogen Content (mg/L)
Activated sludge 6.02%
Vegetable compost 3.28%
Dairy manure 1.60%
Poultry manure 4.43%
Before beginning Phase 1, a pilot study was conducted to optimize the mass equivalent of
nitrogen1 to be introduced to each tank of duckweed in Phase 1. This pilot study was set up and
conducted in a sealed, temperature-controlled growth chamber1 located in the Animal Science /
Agricultural Engineering building at the University of Maryland, College Park. The T12 (1½ in.
diameter) fluorescent tube grow lights in the chamber, located at a constant distance of about 0.8
meters from the plant beds, were set on a timer to simulate natural light cycles (8:00 AM to
10:00 PM) (see Appendix K). Temperature in the growth chamber varied between 21.3 - 26º C
daily. The humidity of the growth chamber was maintained between 71 - 77%.
The pilot study was conducted over a two week period. Each nutrient source was tested
in triplicate; therefore, a total of fifteen tanks of duckweed were studied. The duckweed was
grown in plastic 58.7 x 42.2 x 16 cm (23.1 x 16.6 x 6.4 in.) Sterilite® brand containers,
providing a total of 0.3 m2 (3 ft2) of growing area. Each container was filled to a depth of 15 cm
(6 in.), or 38 L (10 gal.), and was refilled to maintain water level on a daily basis. The individual
tanks in the chamber were distributed to normalize fluctuations in temperature or lighting within
the chamber. Ammonia concentrations were assessed every day for the first three days of the
experiment to gauge standard conditions. Following this initial period, in which satisfactory
growing conditions were confirmed, water chemistry was monitored every other day. The
calorimetric La Motte™ Ammonia Nitrogen Test was used to track any change in Ammonia

27
concentrations (See Appendix F for water chemistry protocol). The ranges of ammonia
measured during this pilot study are tabulated in Table 2.
Table 2. Minimum and Maximum Ammonia Nitrogen concentrations measured during Phase 1
pilot study
Nutrient Source Range of Ammonia
Concentration (mg/L)
Activated sludge 0.2-8
Vegetable compost 0.2-16
Poultry manure 0.2-10
Dairy manure 0.2-8
Control 0-0.2
Each day, a set amount of each nutrient source was inoculated into each tank containing
100 g of duckweed. The amount of each nutrient source used was calculated based on its
nitrogen content so that each duckweed tank received equal amounts of nitrogen. On the first
day, a mass equivalent of 80 mg/L of nitrogen was inoculated in each 38 L (10 gal.) tank. On
day two, 7.5% of a mass equivalent of 80 mg/L of nitrogen was inoculated. On days three to
fourteen, after monitoring ammonia concentrations daily, 10% of a mass equivalent of 80 mg/L
of nitrogen was inoculated. From this pilot study, it was found that a threshold of 80 mg/L of
nitrogen could be introduced without limiting duckweed growth over the course of two weeks.
Phase 1 was conducted in a University of Maryland Research Greenhouse space over the
course of two weeks. There were three main benefits to housing it in the greenhouse: the
research greenhouse received natural light, temperature could be maintained at a constant 26o C
day and night, and humidity was regulated at 71%. As in the pilot study, each of the four
nutrient sources (compost, dairy manure, poultry manure and activated sludge) was tested in

28
triplicate alongside three control tanks (containing no additional nutrient source) for a total of
fifteen tanks of duckweed. Because ammonia concentrations stayed within acceptable ranges
during the pilot study, water chemistry was not monitored during Phase 1. Ten percent of the
mass equivalent of 80 mg/L of nitrogen of each nutrient source was inoculated into each tank
daily. On day one, 100 g of duckweed were introduced into each of the fifteen tanks. The first
inoculation took 48 hours to cover the surface of the Sterilite® container with fronds. Based on
this approximation, half the surface area of duckweed (0.14 m2 or 1.5 ft2) was harvested every 48
hours for the duration of Phase 1. This was accomplished by dividing each tank of duckweed in
half using a plastic divider and collecting duckweed from one side of the divider using a mesh
net. The collected duckweed was air dried overnight in a brown paper bag and weighed.
Results
Table 3. Phase 1 Data: Alternative Nutrient Source Characteristics and Effect on Duckweed
Production
Nutrient Source
Nitrogen
Content of
Nutrient
Source (%)
Average
Duckweed
Protein (%)
Average
Duckweed
Biomass (g)
Control 0.00 9.00 13.25
Std. Dev. -- 1.14 1.16
Activated Sludge 6.02 40.67 38.07
Std. Dev. -- 0.71 2.85
Vegetable Compost 3.28 32.90 18.55
Std. Dev. -- 0.30 0.719
Dairy Manure 1.60 12.47 19.99
Std. Dev. -- 0.38 0.888
Poultry Manure 4.43 34.20 33.89
Std. Dev -- 1.57 1.113

29
Figure 2: Phase 1 effect of nutrient sources on duckweed biomass
13.25
38.07
18.55 19.99
33.89
0.00
5.00
10.00
15.00
20.00
25.00
30.00
35.00
40.00
45.00
Control ActivatedSludge
VegetableCompost
Dairy Manure Poultry Manure
Av
era
ge B
iom
ass P
rod
uced
(g
)
Nutrient Source

30
Figure 3: Phase 1 effect of nutrients sources on duckweed protein
Half the surface area of duckweed was harvested every 48 hrs. Average protein values and
average biomass of duckweed harvested across three replications are shown.
In Phase 1, we determined the most effective nutrient source for growing duckweed by
assessing total duckweed biomass and protein content, as shown in Table 3.
A single factor analysis of variance (ANOVA) test was conducted on the dried biomass
of duckweed grown by each nutrient source treatment, producing a p-value of 0.0002 (see
Appendix B). A post-hoc Tukey Multiple Comparisons Test was conducted to determine if there
are significant differences in duckweed biomass when grown by different nutrient sources. All
statistical analyses were conducted at an alpha level of 0.05. As seen in Figure 2, activated
9.00%
40.67%
32.90%
12.47%
34.20%
0.00%
5.00%
10.00%
15.00%
20.00%
25.00%
30.00%
35.00%
40.00%
45.00%
Control ActivatedSludge
VegetableCompost
Dairy Manure PoultryManure
Av
era
ge P
rote
in P
rod
uced
(g
)
Nutrient Source

31
sludge and poultry manure produced significantly higher biomasses than any other treatment, but
activated sludge was not significantly higher than poultry manure.
According to these findings, activated sludge and poultry manure produced significantly
higher biomasses of duckweed than any other treatment. Poultry manure was second to activated
sludge, but only showed significantly higher biomasses when compared against control and dairy
manure.
Because biomass assessment could not sufficiently determine the most effective nutrient
source, we then turned to our second method of analysis: ANOVA across duckweed protein
content. A Single Factor ANOVA Test determined that there were significant differences in
duckweed protein content among the different treatments (p < 0.0001). A Tukey Multiple
Comparisons Test determined that there are significant differences in crude protein content
among all the treatments except poultry manure and vegetable compost (See Table 7).
Because activated sludge grew duckweed with a statistically higher protein content than
any other treatment, we determined that activated sludge was the most effective nutrient source
for growing duckweed.
Discussion
In Phase 1, we determined that activated sludge is the ideal nutrient source to fertilize
duckweed. Activated sludge can be used to grow large amounts of duckweed with a protein
content of 40.67%, comparable to the protein content of duckweed grown under ideal conditions
(40-43%) (Rusoff, Blakeney, & Culley, 1980; Leng, Stambolie, & Bell, 1995). The difference
between biomass yields of activated sludge and poultry manure is insignificant, as seen in Figure
2, but the protein content of activated sludge is significantly higher than the other nutrient

32
sources. Due to its higher protein content, activated sludge was chosen as the nutrient source for
the duckweed throughout Phases 2 and 3.
There were some limitations with our Phase 1 study. Certain fertilizers tested in the pilot
study, particularly activated sludge and dairy manure, contained solids that would not completely
dissolve in the water. This feature led to difficulty collecting the duckweed samples without also
including some fertilizer, which potentially added extra mass to the weighed sample. We
resolved this issue later in Phase 1 by avoiding settled solids on the bottom of the tanks and by
visually inspecting the collected duckweed before weighing. This change in collection technique
reduced standard deviations between replications.
Other issues encountered during the Phase 1 study included overcrowded duckweed
tanks, issues keeping tanks well mixed, and equal harvesting of each tank during each collection.
A study with fewer, larger harvests in a larger container might have had fewer issues, but most
issues were applicable to the whole system, not just a single treatment. Additionally, data
analysis also showed very significant differences between activated sludge and the other
candidates, increasing our confidence in our results.

33
Phase 2: Small-scale Aquaponic Analysis of Alternative Feeds
Introduction
The purpose of our initial research, Phase 1, was to determine which nutrient source
grows duckweed with the highest biomass yield and protein content. We found that activated
sludge was the best source according to those criteria. Using these findings, we proceeded to our
second phase of research using activated sludge as our duckweed fertilizer. The purpose of
Phase 2 was to determine which alternative feed would produce the highest yield of plant
biomass and tilapia mass in a small-scale aquaponic system: 150 L (40 gal.) fish tank versus the
5700 L (1500 gal.) system at UVI. Specifically, we aimed to assess and compare the yields of
Genovese basil, Bibb lettuce, and Nile tilapia grown with five different feed sources: duckweed
(cultivated with activated sludge), sorghum, rice bran, soybean meal, and commercial fish feed
as a control.
Logistics
The Phase 2 study was conducted in the same growth chamber used in the exploratory
component of Phase 1. The lighting for the study was timed to mimic natural daylight so that the
lights turned on at 8:00 AM and turned off at 10:00 PM (14L:10D). Phase 2 began on October 5,
2012 and concluded eleven weeks later on December 21, 2012. The temperature throughout the
study ranged from 27.1- 27.7o C with an average of 27.5o C. The humidity throughout the study
ranged from 47 - 55% with an average of 52%. For Phase 2, sorghum was obtained from Purcell
Mountain Farms©, rice bran from NutraCea® (see Appendix H), soybean meal from Down To
Earth Distributors, Inc., (see Appendix H) and activated sludge used to cultivate duckweed from
Milorganite®. We grew duckweed using the methodology from the primary component of
Phase 1 in the same research greenhouse. Genovese basil and Bibb lettuce seeds were acquired

34
from Home Depot® (see Appendix J). Tilapia fingerlings1 used to stock our system were
purchased from Til-Tech Aquafarms, LLC.
Research Design
Prior to initiating Phase 2 research, lettuce and basil seeds were germinated. The
germination process was as follows. First, a container was filled with water to moisten Jiffy-7®
peat pellets (see Appendix K). When the centers softened, the pellets were transferred atop of 2
in. diameter net pots. The net pots were prepared by filling each with light-expanded aggregate
clay (LECA®) as a growing medium for the plants (see Appendix K). Without the presence of
the clay, the plants would have been saturated and subject to root rot. The LECA® was
positioned such that the plants would sit on top and the roots would grow through and between
the clay pellets and reach the water. Next, three to four seeds were placed on the surface of each
pot and covered with a layer of peat. The seeds were watered every two to three days and
germinated for ten days. At that time, the most under-developed or smallest of the seedlings
were removed so that only one plant remained in each pot. The peat pellet with a single seedling
was then suitable to be used in the study as seen in Figure 4.
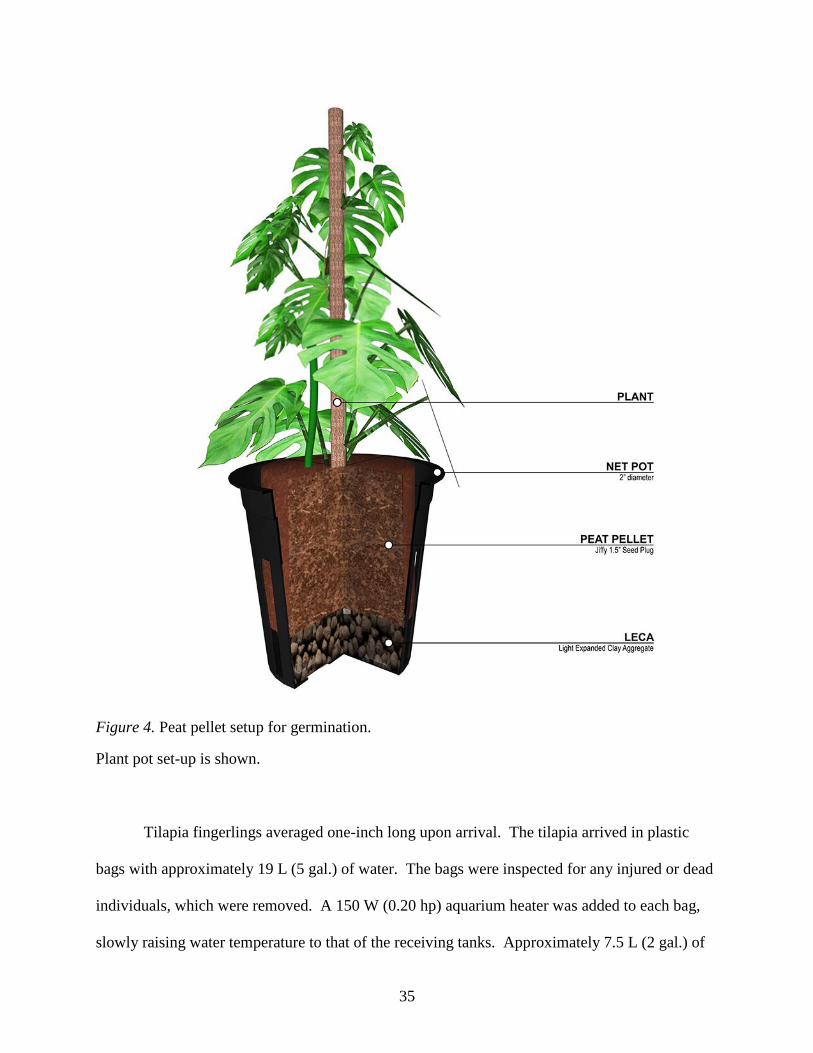
35
Figure 4. Peat pellet setup for germination.
Plant pot set-up is shown.
Tilapia fingerlings averaged one-inch long upon arrival. The tilapia arrived in plastic
bags with approximately 19 L (5 gal.) of water. The bags were inspected for any injured or dead
individuals, which were removed. A 150 W (0.20 hp) aquarium heater was added to each bag,
slowly raising water temperature to that of the receiving tanks. Approximately 7.5 L (2 gal.) of

36
water were removed from the bag and discarded. We used a drip acclimation1 process to initially
acclimate fingerlings to our system’s water quality. A tube was used to slowly siphon water
from the tanks into the bag. After 20 minutes, two gallons of water had been removed. Two
more gallons of water were removed and discarded, and the rate of the siphon was increased
slightly. After 15 minutes, another two gallons was removed, and the siphon rate increased
again. After a final 10 minutes, the siphon was cut-off. After 10 minutes, the tilapia fingerlings
were netted and added to the receiving tanks and observed for 30 minutes to check for signs of
stress. All fingerlings were stocked in two holding tanks for the first week prior to being stocked
in the experimental tanks. This was to ensure that all of the fingerlings were exposed to the same
conditions prior to the start of the study, including being on the same diet.
The growth chamber housed ten individual units. Each unit consisted of one 208 L (55
gal.) tank filled to 150 L (40 gal.) and an 88.3 x 41.9 x 15.0 cm (34.8 x 16.5 x 6 in.) Sterilite®
plant bed container. Each tank was filled with 150 L (40 gal.) of water for ease of maintenance
and avoidance of accidental flooding. The water level in the plant bed container was maintained
at a depth of 10 cm (4 in.) or 38 L (10 gal.), to allow the rafts to remain buoyant. Twelve round
spaces were uniformly distributed across the surface of ½ in. thick polystyrene sheets that were
fitted to each plant bed container. Air stones were used to increase dissolved oxygen
concentrations inside each tank, and an Azoo 1200 11 W pump was used for water circulation
(see Appendix K). The net pots containing the germinated plants were inserted into the spaces in
the polystyrene sheets. Each unit contained six Genovese basil plants, six Bibb lettuce plants,
and eight tilapia fingerlings. Two replicates of the trials were conducted.

37
General Procedure
The fish were fed twice a day, in the morning (between 9:00am and 11:00am) and
evening (between 4:00pm and 6:00pm), over the course of this phase. Water temperature,
dissolved oxygen concentrations, and pH were measured daily in the evening (see Appendix K
for instruments). Other water chemistry measurements, specifically ammonia (NH3), nitrite
(NO2), nitrate (NO3), phosphate (PO4), total hardness, and alkalinity were measured on a weekly
basis.
On a weekly basis, the water level was maintained by refilling the tanks with tap water
that was dechlorinated using Reptisafe® water conditioner. Reptisafe® removes chlorines and
chloramines. The liquid conditioner was stirred into a 19 L (5 gal.) bucket and added to the tank.
This process was repeated until the water level reached the line at 150 L (40 gallons).
Each of the alternative feeds was pelletized so that each was uniform in size and shape
for means of equal palatability. Each individual feed was blended into a powder. The powdered
feed was then placed into a meat grinder and mixed with water until it began coagulating. The
feed mixture was then extruded through the meat grinder as spaghetti-like strands onto the racks
of a dehydrator. The feed was dehydrated for at least twelve hours so that the added moisture
was removed. The dehydrated feeds were then broken up into small pellets (roughly the size of
the commercial feed) so that the feed was manageable for fish consumption based on the size of
the fish being fed. The commercial fish feed was already pelletized and did not have to be
altered. The fish were fed 3% of their body mass for the first five weeks. This was increased to
5% afterward and maintained until the end of the study.

38
Data Collection Method
The edible matter of Genovese basil and Bibb lettuce were collected weekly if a majority
of the treatments had harvest-ready plants. For basil, we looked for a majority of the plants to
have at least one inch wide leaves. For lettuce, we looked for at least three inch long leaves.
Two team members would remove the harvestable leaves using disinfected scissors and place
them in marked paper bags. Two separate bags were used per unit, one for lettuce and one for
basil. The collected material was then placed in a storage chamber kept at a controlled
temperature of 35oC and a low humidity of 12%, which allowed for the dehydration of the plant
material. After two weeks, the plant matter samples were entirely dehydrated and their weights
were recorded for analysis at the end of the phase. Dried biomass yields from weeks 7 and 8
were extrapolated from hydrated masses using a conversion ratio based on measurements from
previous weeks.
Accurate data regarding fish growth required a careful process to weigh the fish without
causing unnecessary stress. Before the weighing procedure began, the updated fish log was
checked to verify the current number of fish in each tank. The tanks were weighed one at a time
in the following manner. First, the fish were captured in a large net and moved to a small bucket
to hold them until all the fish in the tank were collected. Then, the fish were removed from the
bucket one by one and placed into a vessel resting on a scale. The weight of the vessel was
recorded three times: before the fish were added, with the fish, and after the fish were removed.
This measurement taken after the fish were removed was compared to the initial weight to assure
that water added as the fish were transported to and from the vessel did not strongly influence the
fish weight data. After the fish weight was recorded for the tank, both the bucket and vessel were
rinsed before proceeding to the next tank. When turbid water caused exceptionally poor

39
visibility, the tanks were partially drained in order to collect the fish more efficiently and reduce
the stress caused by extended periods of fish collection. After collection, the drained water was
returned to the tank before moving on to the next one.
At the end of the phase, all of the fish were euthanized following procedures
recommended by the 2007 AMVA guidelines. First, each fish was concussed by manually
applying a blunt force to the head. Then, the fish was pithed1, which destroys the brain by
cutting into the head with a knife. Finally, the fish was decapitated. This method was chosen
instead of chemical procedures to ensure that the final product could be safely consumed (Leary,
2013).
Results
In Phase 2, we determined the effectiveness of a complete alternative feed diet by
assessing its effect on tilapia mass and dried plant biomass compared to a standard commercial
fish feed treatment.
Tilapia Weight.
A one-way ANOVA was used to determine if our feed treatments produced significantly
different yields of tilapia growth percentage. Growth percentage was calculated by dividing the
difference between the original and final weights by the original weight. A p-value of 0.003
indicated that our results were statistically significant (see Appendix C). Results from our post-
hoc Tukey multiple comparisons test indicate there are significant differences in tilapia growth
percentages between the control treatment and each of the alternative feeds. The control
commercial feed produced significantly greater fish weight. However, there are no significant
differences in tilapia growth among the alternative treatments.
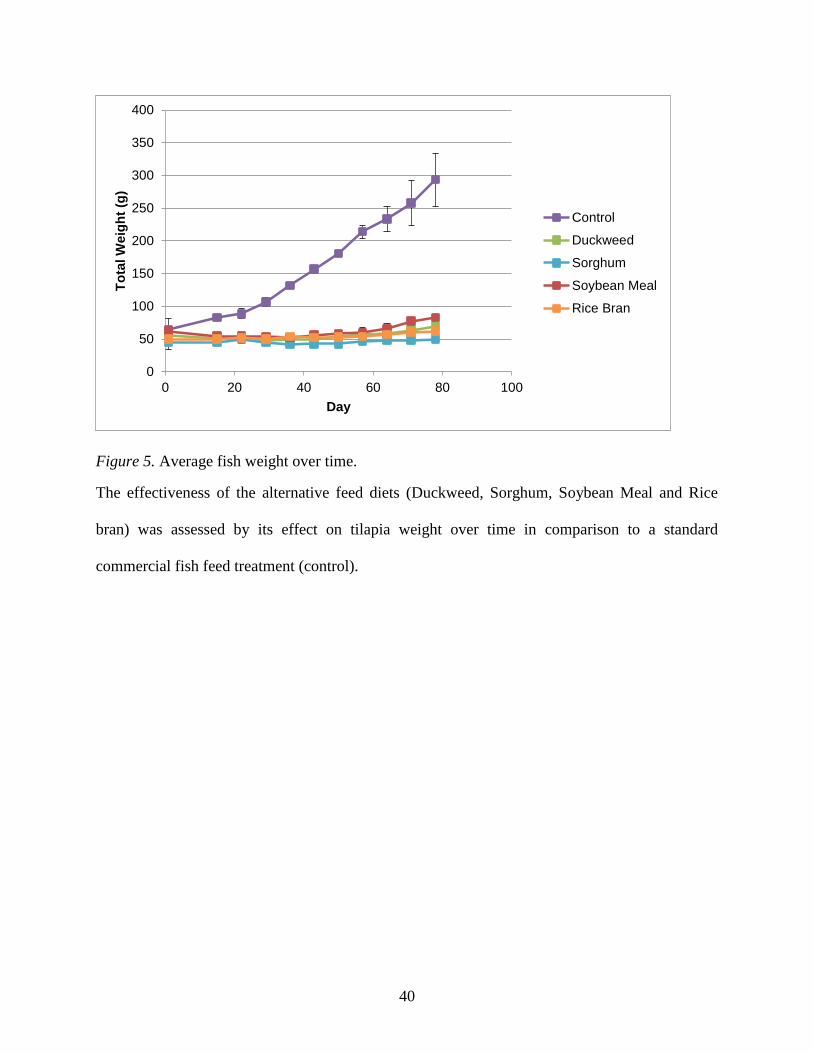
40
Figure 5. Average fish weight over time.
The effectiveness of the alternative feed diets (Duckweed, Sorghum, Soybean Meal and Rice
bran) was assessed by its effect on tilapia weight over time in comparison to a standard
commercial fish feed treatment (control).
0
50
100
150
200
250
300
350
400
0 20 40 60 80 100
To
tal W
eig
ht
(g)
Day
Control
Duckweed
Sorghum
Soybean Meal
Rice Bran

41
Figure 6. Phase 2 average fish growth percentages.
The effectiveness of the alternative feed diets (Duckweed, Sorghum, Soybean Meal and Rice
bran) was assessed by its effect on tilapia growth in comparison to a standard commercial fish
feed treatment across two replications (control) (see Appendix C).
Dried Plant Biomass.
Based on the plant biomass produced, our data indicates that the most effective feeds are
commercial fish feed (control), soybean meal, and duckweed. . For visual reference, the
progression of plant growth is shown in Figure 8. A two-way ANOVA and Tukey multiple
comparisons test shows a significant difference in basil growth between all treatments (p-values
ranged from 0.00019 to 0.00837, see Table 12 and Appendix C), except for the top three
treatments (commercial fish feed, soybean meal, and duckweed). Similar results were seen for
lettuce growth, although our data showed no significant difference between the rice bran and
control treatments.
124%
41%
15% 19%
58%
0%
20%
40%
60%
80%
100%
120%
140%
160%
Control Duckweed Rice Bran Sorghum SoybeanMeal
Gro
wth
Perc
en
tag
e
Feed Source
Control
Duckweed
Rice Bran
Sorghum
Soybean Meal
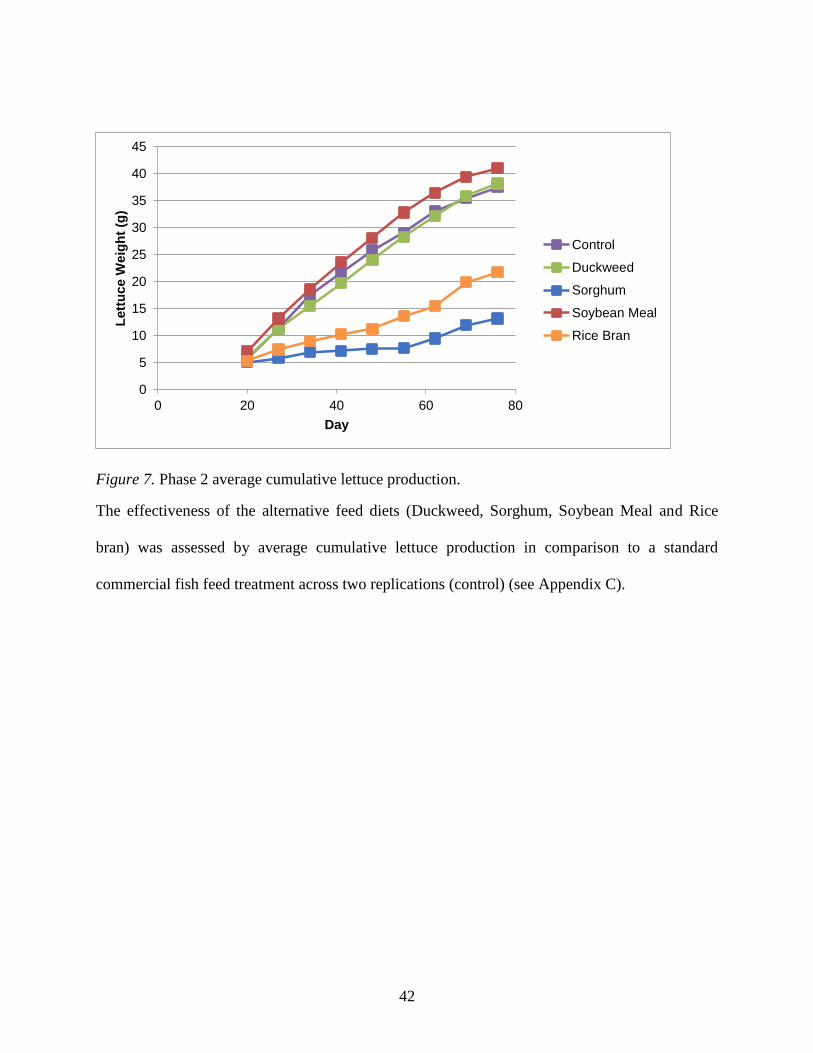
42
Figure 7. Phase 2 average cumulative lettuce production.
The effectiveness of the alternative feed diets (Duckweed, Sorghum, Soybean Meal and Rice
bran) was assessed by average cumulative lettuce production in comparison to a standard
commercial fish feed treatment across two replications (control) (see Appendix C).
0
5
10
15
20
25
30
35
40
45
0 20 40 60 80
Lett
uce W
eig
ht
(g)
Day
Control
Duckweed
Sorghum
Soybean Meal
Rice Bran

43
Figure 8. Phase 2 average cumulative basil production.
The effectiveness of the alternative feed diets (Duckweed, Sorghum, Soybean Meal and Rice
bran) was assessed by average cumulative basil production in comparison to a standard
commercial fish feed treatment across two replications (control) (see Appendix C).
0
5
10
15
20
25
30
35
40
45
50
0 20 40 60 80
Basil W
eig
ht
(g)
Day
Control
Duckweed
Sorghum
Soybean Meal
Rice Bran
Figure 9. Basil and lettuce growth.
Phase 2, Progression of basil and lettuce growth in the course of fifteen days.
44
Discussion
Although there was no significant difference in tilapia mass yield among the alternative
feeds, there was a difference in the biomass yield of the plants. These results led the team to
choose soybean meal and duckweed as the alternative feeds in the Phase 3 testing.
Phase 2 provided important data and results for the advancement of the study into Phase
3. The difference in yields was suspected to be the result of varying nutrient content among the
feeds. Due to insignificant fish growth with a complete alternative feed diet, Phase 3 tested
blended feeds (50% alternative feed and 50% commercial feed) to identify differences between
the two most successful alternative feeds, duckweed and soybean meal. Another study practice
identified by the results of Phase 2 was the addition of a mechanism to siphon excess waste from
the fish tanks. Water chemistry analysis in Phase 2 displayed elevated concentrations of
ammonia. High ammonia concentrations are produced by the presence of excessive waste and
uneaten feed and may lead to toxicity to fish. The team decided that removing the waste and
replacing the tank water more frequently in Phase 3 would increase water quality, and therefore
increase fish health and growth.

45
Phase 3: Small-scale Aquaponic Analysis of Blended Nutrients
Introduction
From analyzing the results of Phase 2, duckweed and soybean meal produced the highest
yields of basil, lettuce, and tilapia compared to the other alternative feeds. However, the control
(commercial fish feed) led to faster growth in the tilapia. We hypothesized that blending
alternative feed sources with commercial fish feed would produce yields that would enable us to
better distinguish between the alternative feeds. The specific aim of Phase 3 was to assess the
yields of tilapia, basil, and lettuce grown with one of three feed sources: a 50% duckweed and
50% commercial feed blend (50/50 duckweed/commercial), a 50% soybean meal and 50%
commercial feed blend (50/50 soybean meal/commercial), and 100% commercial fish feed as the
control.
Logistics
The Phase 3 study began on March 16, 2013 and concluded nine and a half weeks later
on May 22, 2013. The Phase 3 study was set up in the same manner as the Phase 2 study and in
the same growth chamber. The temperature throughout the study ranged from 25.1 - 28.6oC with
an average of 25.8oC. The humidity ranged from 50 - 62% with an average humidity throughout
the study of 57.4%. We used the same sources of duckweed, soybean meal, and commercial fish
feeds as in Phase 2.
Research Design
The germination protocol used in Phase 3 was similar to that used in the previous study:
peat pellets housed the seeds, which were contained within net pots carrying clay pellets. In
total, the chamber housed nine individual units. Each unit was identical to those used in Phase 2:
a 208 L (55 gal.) barrel housing eight tilapia fingerlings and a plant bed containing six basil

46
plants and six lettuce plants. The trials, however, were conducted in triplicate for Phase 3, with
three units for each treatment.
General Procedure
For Phase 3, some slight changes were made to the daily procedure. Tank temperature,
dissolved oxygen concentrations, and pH were measured every other day. Ammonia, nitrite,
nitrate, and phosphate were the only water chemistry measures that were measured on a weekly
basis. Total hardness and alkalinity were measured at the beginning and the end of the phase.
Feeding procedures and times remained the same.
Similar to Phase 2, conditioned tap water was used to maintain water levels in the fish
tanks. However, in Phase 3 ProLine® sodium thiosulfate was used in place of Reptisafe® water
conditioner (see Appendix K). Again, water was added in increments of 19 L (5 gallons).
However, the sodium thiosulfate required an intermediate step where the amount to condition 19
L (5 gal.) of water was placed in a small container that was shaken vigorously to ensure proper
dissolution. The dissolved sodium thiosulfate was then stirred into a 19 L (5 gal.) bucket of
water that was added to the tank. This process was repeated until the water level reached 150 L
(40 gallons).
Due to high concentrations of ammonia recorded in the Phase 2 study, fish waste was
removed from the bottom of the tanks using a siphon every three to four days. A team member
would use a small pipe with a tube attached and create a siphon. The siphon then worked as a
vacuum to remove the waste from the bottom of the tank. The waste was drawn into the siphon
and collected in a 19 L (5 gal.) bucket. When little to no waste remained on the bottom of the
tank, the 19 L (5 gal.) bucket was emptied and the process repeated for the remaining tanks.

47
For Phase 3, only soybean meal and duckweed were used as alternative feeds. However,
they were blended in a 50/50 mix with commercial fish feed. The commercial feed used for the
control treatments was already pelletized and ready for use, as it was in Phase 2. For soybean
meal, the soybean meal powder and commercial feed pellets were placed in a blender in equal
parts by mass and blended until a homogeneous mixture was achieved. This powder was then
pelletized using the same method as in Phase 2. For duckweed, the Phase 2 procedure was
followed to create duckweed pellets. The duckweed pellets were then blended in the same
manner with commercial feed pellets. The fish were fed 2% of their body mass on the first day of
experimentation. This was steadily increased to 7% in response to changes in water chemistry.
Data Collection Method
For Phase 3, plant harvests and dehydration schedules and protocols remained the same
from the previous phase. However, fish weighing was reduced to once every two weeks in an
effort to minimize stress that may have affected fish health in Phase 2. Although there was no
specific data to indicate that weighing the fish weekly was affecting fish growth, disturbing the
fish often inevitably induces unwanted stress, so weighing was reduced to avoid further stress
(Pankhurst & van der Kraak, 1997).
Results
We determined in Phase 2 that complete alternative feed diets did not produce adequate
fish growth. Thus, Phase 3 tested 50/50 blended feeds to identify differences between duckweed
and soybean meal as a partial feed source. Tilapia mass and dried plant biomass were assessed
to determine which blended feed was most effective in an aquaponic system.

48
Tilapia Weight.
Figure 10. Phase 3 average weight per fish over time.
The effectiveness of the alternative feed diets (Duckweed Blend and Soybean Meal Blend) was
assessed by average weight per fish in comparison to a standard commercial fish feed treatment
across three replications (control). The first weighing took place during the acclimation period
prior to Day 1, the first day of the study.
0
1
2
3
4
5
6
7
-10 0 10 20 30 40 50
Weig
ht
Per
Fis
h (
g)
Day
Control
Duckweed Blend
Soybean Meal Blend

49
Figure 11. Phase 3 average fish growth percentages.
The effectiveness of the alternative feed diets (Duckweed Blend and Soybean Meal Blend) was
assessed by average fish growth percentages in comparison to a standard commercial fish feed
treatment across three replications (control).
Due to fish disease, the systems had significant fish mortality. The deaths were sporadic
and did not seem to be isolated to any specific treatments. This may have influenced the
reliability of the results. Instead of calculating total tilapia mass, we calculated the average
weight per fish based on how many fish were in the system at the time of weighing. Deaths were
believed to be the result of an unidentified disease, but necropsies yielded no insight to the cause
of the disease.
A one-way ANOVA and Tukey multiple comparisons tests on tilapia growth percentages
indicate there are no significant differences between soybean meal blend and control treatments,
143%
90%
282%
0%
50%
100%
150%
200%
250%
300%
350%
Control Duckweed Blend Soybean MealBlend
Gro
wth
Perc
en
tag
e
Feed Source
Control
Duckweed Blend
Soybean Meal Blend

50
nor duckweed blend and control treatments. These results show that in terms of tilapia growth
percentage, both the soybean meal and duckweed blended treatments are comparable to that of a
commercial fish feed diet.
Results from our post-hoc test of fish growth indicate a statistically significant difference
between tilapia growth percentage produced by blended soybean meal and blended duckweed
treatments. Because the soybean meal blend produced a higher average biomass per fish, we
determined that soybean meal blend was the more effective of the two alternative feeds.
Dried Plant Biomass.
A two-way ANOVA and Tukey multiple comparisons test indicate there is no
significance in plant growth between the three treatments at an alpha level of 0.05. We could
make no conclusive statements about the effectiveness of our alternative feed treatments based
on plant production.
The plant growth may have been limited by low nutrient concentrations found in the
water due to the waste siphoning. These nutrient concentrations were lower than those measured
in Phase 2 and can be found in Appendix A.

51
Figure 12. Phase 3 average cumulative lettuce production.
The effectiveness of the alternative feed diets (Duckweed Blend and Soybean Meal Blend) was
assessed by average cumulative lettuce production in comparison to a standard commercial fish
feed treatment across three replications (control).
0
5
10
15
20
25
30
35
40
45
0 10 20 30 40 50 60
Lett
uce W
eig
ht
(g)
Day
Control
Duckweed Blend
Soymeal Blend
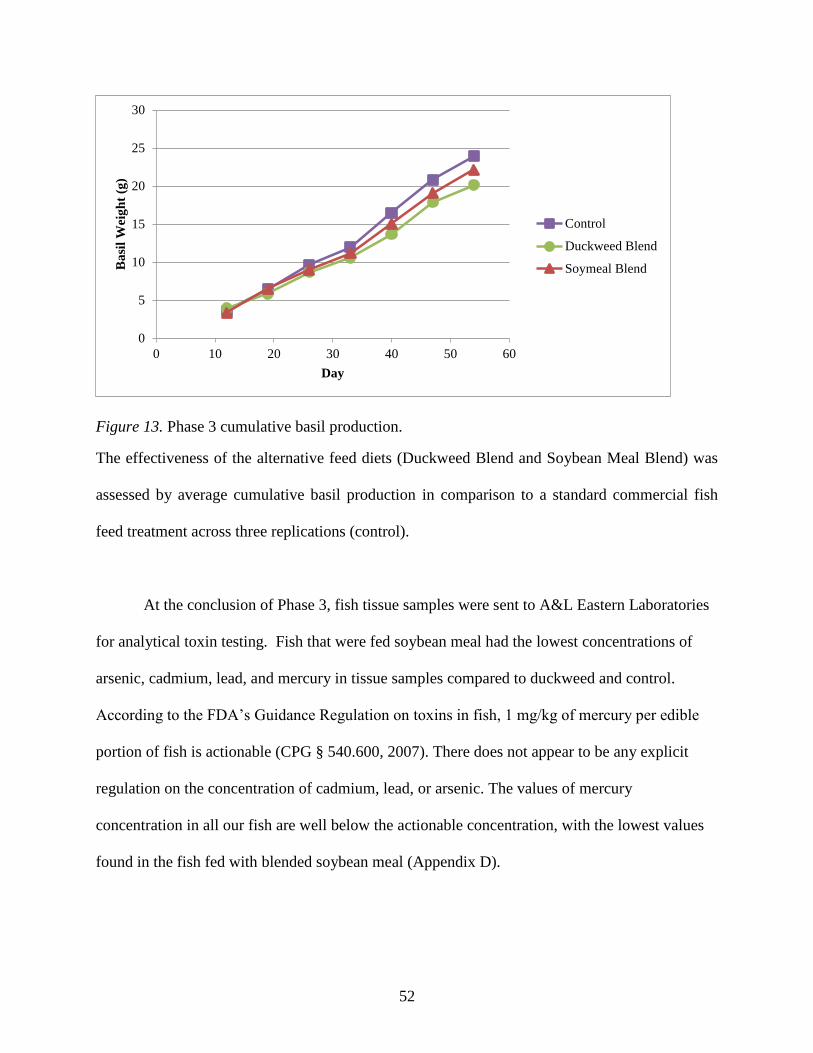
52
Figure 13. Phase 3 cumulative basil production.
The effectiveness of the alternative feed diets (Duckweed Blend and Soybean Meal Blend) was
assessed by average cumulative basil production in comparison to a standard commercial fish
feed treatment across three replications (control).
At the conclusion of Phase 3, fish tissue samples were sent to A&L Eastern Laboratories
for analytical toxin testing. Fish that were fed soybean meal had the lowest concentrations of
arsenic, cadmium, lead, and mercury in tissue samples compared to duckweed and control.
According to the FDA’s Guidance Regulation on toxins in fish, 1 mg/kg of mercury per edible
portion of fish is actionable (CPG § 540.600, 2007). There does not appear to be any explicit
regulation on the concentration of cadmium, lead, or arsenic. The values of mercury
concentration in all our fish are well below the actionable concentration, with the lowest values
found in the fish fed with blended soybean meal (Appendix D).
0
5
10
15
20
25
30
0 10 20 30 40 50 60
Ba
sil
Wei
gh
t (g
)
Day
Control
Duckweed Blend
Soymeal Blend

53
Discussion
Plant growth across all three tested feeds did not vary; there was no statistically
significant difference between the groups. However, tilapia fed the soybean meal blend grew
more significantly than tilapia fed the duckweed blend by the end of the study. Though
confounding variables, particularly the unexplained fish deaths, may have influenced the results,
we found soybean meal to be the best alternative nutrient source for an aquaponic system when
considering both fish and plant growth.
Upon completion of the Phase 3 study, we made several conclusions that affected the
Phase 4 research design. First, in an effort to reduce nitrogenous waste concentrations in Phase
3, we removed fish waste on a regular basis. However, we observed that this removal of fish
waste caused the nitrogenous waste concentrations to drop significantly, which was concerning
because nitrogenous compounds are necessary for plant growth. This, along with stress induced
by the procedure, caused us to discontinue the waste removal process for the subsequent study.
54
Phase 4: Larger-scale Analysis of Soybean Meal in Aquaponic Systems
Introduction
Phase 4 was the final stage of the study. The purpose of this phase was to determine the
effectiveness and economic feasibility of using soybean meal as a supplemental feed in an
aquaponic system with larger water volume, more plants, and more fish than previous phases.
This phase also continued to verify results obtained for the nutrient source chosen from Phase 3.
The most successful alternative feed, as determined from Phase 3, was utilized in Phase 4. The
systems maintained the stocking density at 0.053 fish/L (0.20 fish/gallons). Phase 4 used a 50/50
soybean meal/commercial fish feed blend and then 100% commercial fish feed for a control.
The feasibility and efficacy of the feed were determined by the biomass yield of the fish and
plants as well as the feed conversion ratios of each nutrient source. Thus, Phase 4 is a
continuation of Phases 2 and 3, but with only one alternative feed and different, larger scale.
Logistics
The system of Phase 4 was set up on the rooftop of the University of Maryland’s South
Campus Diner in a 74 m2 (800 ft2) high tunnel1 that we constructed. Phase 4 began on
September 10, 2013 and concluded eight weeks later on November 13, 2013 due to cold weather
conditions. The temperature throughout the study ranged from 11.1 - 39.8oC with an average of
26.3oC. Humidity in the high tunnel was often very high, leading to condensation on the
polyethylene film cover. The high tunnel housed six independent aquaponic systems. Each
system was allotted approximately the same area with appropriate spacing in between to allow
team members to access the systems from all sides in order to check for problems and perform
maintenance. Its location in an open section of the rooftop meant little obstruction to sunlight or
other irregularities. The foundation of the high tunnel was reinforced with cement anchors,

55
while the electrical system consisted of four 120 VAC receptacles (eight outlets) rated for the six
pumps, storage refrigerator, lights, air pumps, and heaters (see Appendix K). Three systems
were fed with a commercial fish feed produced by Purina® AquaMax® (see Appendix I). The
remaining three were fed with the experimental feed, a 50/50 blend of the Purina® AquaMax®
fish feed and soybean meal.
Figure 14 shows a diagram of our aquaponic systems. Photos of the high tunnel and
systems are shown in Figure 17 and Figure 18, respectively. Each unit included an
approximately 3.72 m2 (40 ft2) plant bed and a 750 L (200 gal.) water tank. A Neiko ½ hp. water
pump was used to pump water between the plant bed and the water tank (see Appendix K). The
½ hp. pump was calculated to be sufficient for achieving the required head 1.5 m (5 ft.) and flow
rate of 1900 L/h (500 gallons/hour). See Appendix M for Phase 4 Fluid Dynamics Calculations.
Figure 14. Top, isometric, front, and side views of the overall structure.

56
The tank shown below the structure and the four drain pipes are on top. The intermediate piping,
biomedia containers, and pump are not shown. Units in inches.
The structural frame of the units, also shown in Figure 14 with isometric, front, and side views,
was composed of pine wood. Several rows of 4 in. diameter, 10 ft. long drain pipes produced by
Advanced Drainage Systems® were placed in a parallel formation above each tank to receive
water from the pump, which was situated at the bottom of the system. In each system,
underneath the four rows of drain pipes was the main 750 L (200 gal.) polyethylene water tank.
The tanks were raised by a short metal frame that allowed for PVC piping to route from the
single two inch drainage pipe at the center of the tank to the ½ hp. pump. Also, ¼ in. knotless
mesh by Delta Net & Twine© was used as a cover for the tank in order to prevent fish from
jumping out and other outside matter from falling into and contaminating the tank. Along the
top of each pipe, we drilled 5 cm (2 in.) diameter holes, spaced 10 cm (4 in.) apart, for the
placement of the net pots holding the plants. As with the previous phases, the plants acted as a
biofilter for the system, with water entering the plant drain pipe at one end and exiting at the
other end.
The plants were added to the systems in three stages. The first wave consisted of
seedlings (basil and lettuce) purchased from a local nursery; the team desired more mature plants
in order to help spur the development of a system biofilter. Once these plants had been
established, additional basil and lettuce plants were installed using the same method as from
Phases 2 and 3 using peat pots1 to germinate the plants and then transferring them to the clay
aggregate. The roots of these plants would grow through the peat pots and between the clay
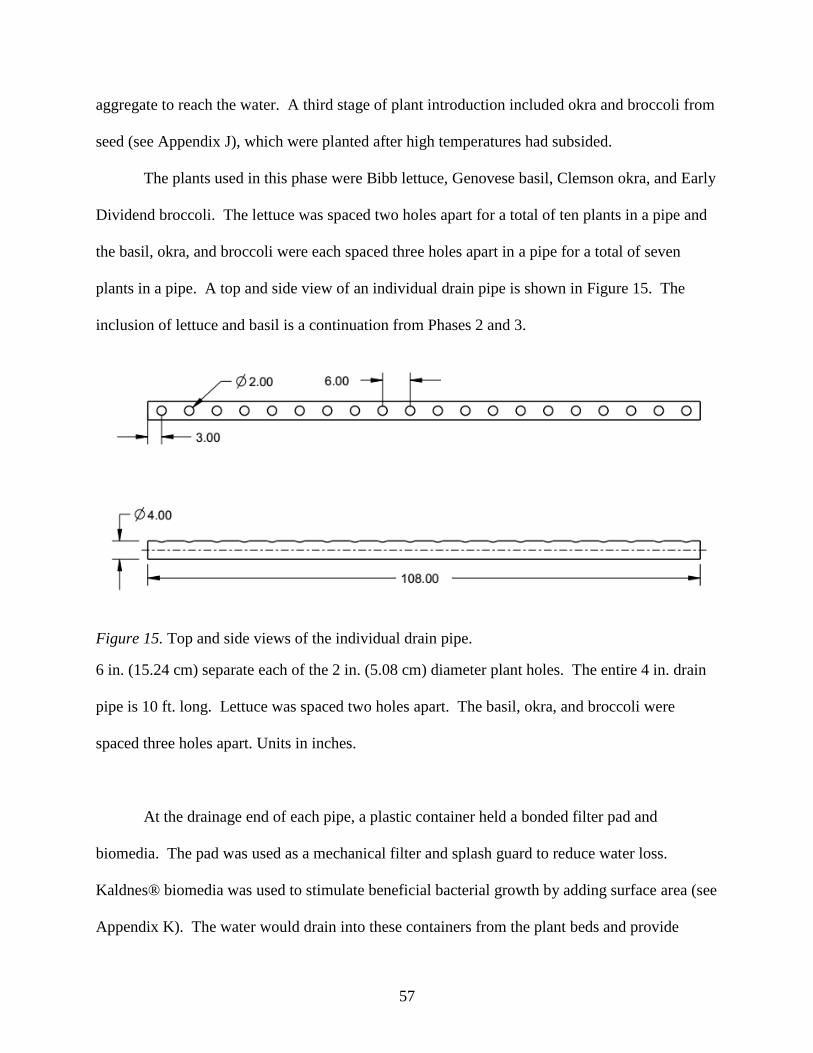
57
aggregate to reach the water. A third stage of plant introduction included okra and broccoli from
seed (see Appendix J), which were planted after high temperatures had subsided.
The plants used in this phase were Bibb lettuce, Genovese basil, Clemson okra, and Early
Dividend broccoli. The lettuce was spaced two holes apart for a total of ten plants in a pipe and
the basil, okra, and broccoli were each spaced three holes apart in a pipe for a total of seven
plants in a pipe. A top and side view of an individual drain pipe is shown in Figure 15. The
inclusion of lettuce and basil is a continuation from Phases 2 and 3.
Figure 15. Top and side views of the individual drain pipe.
6 in. (15.24 cm) separate each of the 2 in. (5.08 cm) diameter plant holes. The entire 4 in. drain
pipe is 10 ft. long. Lettuce was spaced two holes apart. The basil, okra, and broccoli were
spaced three holes apart. Units in inches.
At the drainage end of each pipe, a plastic container held a bonded filter pad and
biomedia. The pad was used as a mechanical filter and splash guard to reduce water loss.
Kaldnes® biomedia was used to stimulate beneficial bacterial growth by adding surface area (see
Appendix K). The water would drain into these containers from the plant beds and provide
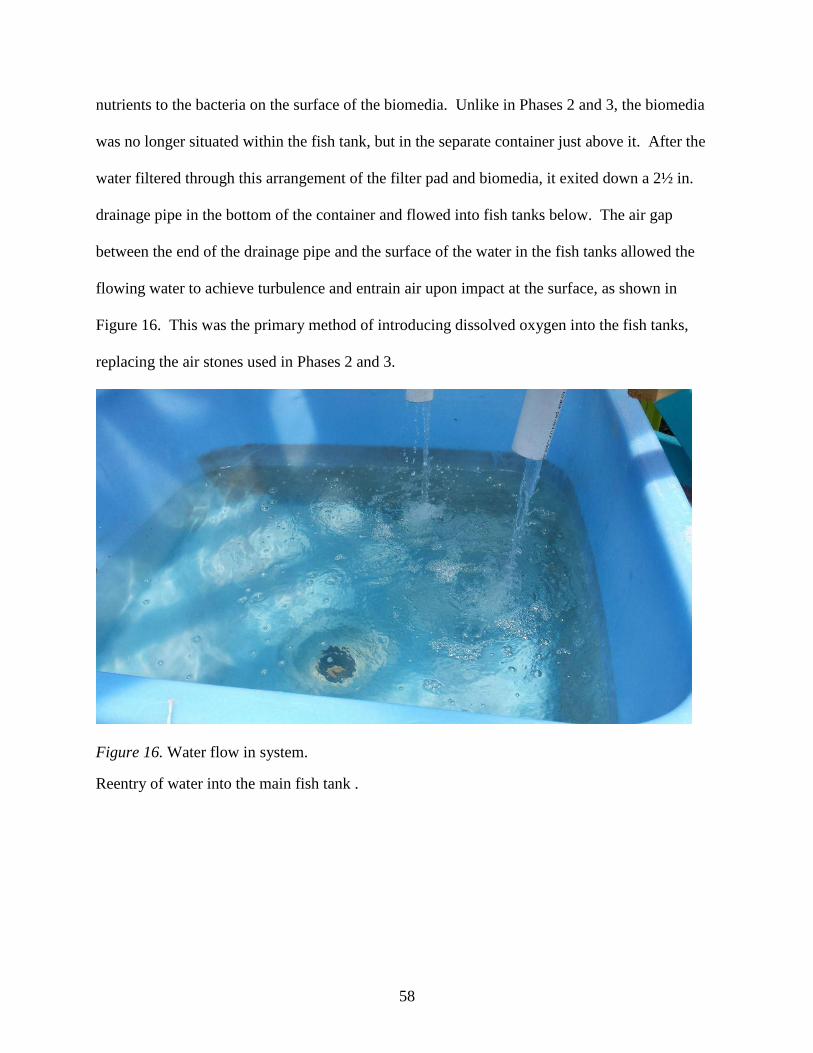
58
nutrients to the bacteria on the surface of the biomedia. Unlike in Phases 2 and 3, the biomedia
was no longer situated within the fish tank, but in the separate container just above it. After the
water filtered through this arrangement of the filter pad and biomedia, it exited down a 2½ in.
drainage pipe in the bottom of the container and flowed into fish tanks below. The air gap
between the end of the drainage pipe and the surface of the water in the fish tanks allowed the
flowing water to achieve turbulence and entrain air upon impact at the surface, as shown in
Figure 16. This was the primary method of introducing dissolved oxygen into the fish tanks,
replacing the air stones used in Phases 2 and 3.
Figure 16. Water flow in system.
Reentry of water into the main fish tank .

59
Figure 17. Rooftop high tunnel.
Exterior face view of the rooftop high tunnel.

60
Figure 18. Rooftop high tunnel interior.
Interior view of the rooftop high tunnel showing 5 of the 6 aquaponic systems.
As mentioned above, the fish were stocked at 0.05 fish/L (0.20 fish/gallons). This
stocking density was based on the stocking density used by Rakocy in his aquaponic systems
(Rakocy et al., 2004). However, while his design was intended for commercial use, our design is
a study of sustainability, low-energy input use, and fish health, leading us to use a lower stocking
density. Unlike previous phases, the fingerlings purchased for Phase 4 had an average starting
length of approximately 7.62 cm (3 inches). The decision to purchase more mature fingerlings
was made because of delays to the project that resulted in its September start and projected
November or December finish. Because of the expected low temperatures and short duration,
the purchased fingerlings had to be further along in their development in order to reach near
market size. This motivation is similar to the one described above for purchasing pre-grown
plants in the first wave of planting.

61
Additionally, a 300 W (0.4 hp.) EHEIM submersible aquarium thermostat heater was
placed inside each fish tank in order to facilitate temperature stability and prevent fish death due
to cold temperatures (see Appendix K). These measures would likely not be necessary in a
tropical region and are a requirement only because of the local climate. While the high tunnel
was able to provide a warming greenhouse effect, temperature swings during the 2013 autumn
proved to be problematic, particularly at night. These thermostat heaters were set at 27.2oC.
The greenhouse held two 208 L (55 gal.) tank used to hold spare water for refilling. The
tanks of each unit were refilled with approximately 95 L (25 gal.) once every three to four days,
depending on evaporation in the systems. Procedure for preparing the refill water was similar to
the process from Phases 2 and 3. Water was acquired from a tap source and treated with the
appropriate amount of sodium thiosulfate in order to remove chlorine harmful to the fish.
Because a much larger volume of water was being treated in Phase 4, the water was allowed to
sit in the 208 L (55 gal.) tanks for a few days with an air stone in order to further bubble out the
chlorine and allow the temperatures to equilibrate. During cold weather, a heater set at 27.2oC
was also used to raise the temperature of the water to avoid shock to the fish during refilling.
Research Design
The research design involved six aquaponic units inside the high tunnel, three of which
were fed the commercial fish feed as the control, and three of which were fed the 50/50 blend of
commercial fish feed and soybean meal. The fish were weighed at the start of the phase, and
then at four week intervals until the end of the study. The percentage of the feed given to the
fish varied based on suggestions from a schedule as delineated in prior literature (Rakocy, 1989,
September). In his studies, Rakocy fed at a rate of between 4% and 10% body mass for initial

62
masses of 5 to 20 grams. These masses are approximately similar to the initial measurements in
our experiment.
In our design, adjustments to feed rates were made on a weekly basis and dependent on
water chemistry results. The feed rates were therefore changed based on measurable
characteristics of the water quality, such as dissolved oxygen, pH, ammonia, and nitrate. This
schedule is outlined in Table 4. This table illustrates the week to week progression of feeding
rates as a percentage of the body mass of the fish. Steady increases from 3% to 5% to 7% during
the first half of the study correspond to the push to increase fish growth in coordination with
acceptable water chemistry (ammonia and nitrite). We were not able to start at a large feeding
rate immediately because we were implementing new systems and bacteria populations had not
built up yet. The decline and plateau at 5% corresponds to higher ammonia and nitrite
concentrations observed later on in the study.
Table 4. Percentage tilapia body mass fed over time
Week Percentage of Body
Mass Fed (%)
09/13/13 3
09/20/13 3
09/27/13 5
10/04/13 7
10/11/13 7
10/18/13 7
10/25/13 5
11/01/13 5
11/08/13 5
63
General Procedure
Fish were fed twice a day, morning (between 8:00 AM and 10:00 AM) and afternoon
(between 4:00 PM and 6:00 PM). Air temperature and air humidity were monitored daily. Water
levels, system condition and plant health were monitored daily. If the water flow was
constrained, it was most likely due to algae or biomedia buildup in the pipes, so the pump would
need to be shut off and the pipe blockage removed manually. During daily feedings, any
overflows discovered would be countered by turning off the pump immediately and dislodging
blockages. Ultimately, frequent clearing of the drain pipes was required in order to prevent
consistent algal obstructions.
The feeds for the fish were stored in a small refrigerator inside the high tunnel and were
divided up into small bags designated for each tank on each day of the week. At the beginning
of each week, the feeds would be prepared and parceled out for the whole week. In the morning
and afternoon feedings, half the contents of each bag were poured into the designated tanks. The
team member would then observe the fish and record any unusual behavior or occurrences in the
log book. In the afternoon, every other day, tank temperature, dissolved oxygen, and pH were
recorded.
On a weekly basis, concentrations of the three chemicals involved in the nitrogen cycle
(ammonia, nitrite, and nitrate) were measured. Since these three chemicals were all directly
related to feed rate, they were used as a basis for feed rate decisions. Moderate nitrate
concentrations are desirable as this facilitates plant growth. If ammonia and nitrite
concentrations were within a safe range, feeding levels were increased to maximize fish growth.
Phosphorus, hardness, and alkalinity were infrequently measured for benchmarking purposes.

64
Because concentrations stayed within an acceptable range, they did not require constant
monitoring.
If at any point the concentrations of ammonia rose above the tolerable range thresholds,
the systems would need to be supplemented with the reserve water stored in the 208 L (55 gal.)
tank in order to dilute the concentration of ammonia. Additionally, daily feeding levels would be
reduced. A similar procedure was utilized for high nitrite concentrations. However, since nitrite
is a secondary stage in the nitrogen cycle, nitrite concentrations were slow to change, lagging
behind ammonia changes.
Data Collection Method
The fish weight data, collected every four weeks, was used to calculate the required
amount of feed for each tank. The process started with weighing and taring a 19 L (5 gal.)
bucket of water from the tank. This container sat on the scale for the duration of the process to
avoid variations in weight. The fish were collected using a net that spanned the walls of the tank.
The nets crowded the fish into a small section (minimizing contact between the fish and the net
itself) and allowed for smaller handheld nets to collect the fish and place them in a temporary
holding bucket. Finally, the fish were individually placed in the pre-weighed container and the
total weight recorded.
Plants were harvested weekly to determine the biomass yield for that time period. To
determine whether the leaves were harvestable, we looked for the same criteria as Phase 2. If no
leaves were large enough, the plants at that location would not be harvested for the week and no
number would be recorded. The plant matter weight in each bag was recorded. Unlike Phases 2
and 3, the plants were not dried before weighing in order to obtain wet weight data used in real-
world markets for our economic analysis. The dehydrated mass in Phases 2 and 3 was used for a

65
more academic emphasis, while the wet mass in Phase 4 was production focused. This shift
mirrors the scaling up of the aquaponic systems and length of grow out for the fish.
As noted in Appendix E, the only plant biomass recorded was for the lettuce and basil
wet weights. The broccoli and okra were not harvested because none of the plants had fruited
and therefore no foodstuff was produced. There was non-negligible plant mass grown, but it was
inedible and therefore unnecessary data for the study.
Results
The data for Phase 4 follows the same general format as Phases 2 and 3, focusing on
plant biomass and fish weight over time. Like Phase 3, an emphasis was put on the average fish
weight instead of the overall fish weight. This is because there were different numbers of fish
stocked into each tank.
FCRs were also used as indications of how effective the feeds were in each tank. FCR is
calculated by dividing total dry feed fed (g) by total wet weight gain (El-Saidy & Gaber, 2005).
By finding a ratio of the two variables, a feed-to-growth efficiency rate could be calculated.
These values are shown in Table 5. Additionally, a one-way ANOVA was conducted to
determine whether a significant difference existed between the two kinds of feeds and their
respective feed conversion ratios.

66
Figure 19. Average fish weight vs. time.
Total fish weight per tank over time, averaged across all three replications
Figure 20. Average fish growth percentages.
Total fish growth during the entire phase for each treatment averaged across all three replication
0
200
400
600
800
1000
1200
1400
1600
1800
2000
0 10 20 30 40 50 60 70
Fis
h W
eig
ht
(g)
Day
Control
Soymeal Blend
701%
483%
0%
100%
200%
300%
400%
500%
600%
700%
800%
900%
Control Soybean Meal Blend
Gro
wth
Per
cen
tag
e
Feed Source
Control
Soybean Meal Blend

67
Table 5. Phase 4 Data, Average Growth, FCR, and Survival Rate
Avg. Growth % Avg. FCR Avg. Survival Rate %
Control 700.74 1.54 98.10
Std. Dev. 74.76 0.98 1.60
Soybean Meal Blend 483.36 2.08 98.10
Std. Dev. 64.25 1.45 3.20
A one-way ANOVA test indicated that there is a significant difference (p-value of
0.01863) in tilapia growth percentage between the soybean meal blended treatment and our
control treatment of commercial fish feed. From these results, we cannot determine that our
alternative diet was as efficient for growing tilapia as the commercial diet. However, it still
produced growth, just not at a comparable rate, as can be seen in Table 5.
Plant Growth.
A two-way ANOVA test indicated that there was no significant difference in lettuce
production between the two feed treatments (p-value of 0.08288). A similar conclusion was
made for basil production (p-value of 0.34702).
Based on numbers alone, our data suggests that in terms of plant production a soybean
meal blended treatment is comparable to that of a commercial fish feed treatment. Based on our
plotted graphs (see Figure 19 and Figure 20), it is evident that the plant production did not differ
significantly for the first six weeks. However, the systems receiving a full commercial diet grew
more successfully from weeks six through nine, as can be seen in Figure 21 and Figure 22. Exact
reasons for this are unknown. A possible explanation for this trend is that a second wave of
lettuce and basil seedlings grew to harvest size by week six. These seedlings were germinated
using the protocol from Phase 2 and 3, unlike the original batch which were purchased already

68
germinated from a local nursery. Additionally, high temperatures early in the phase caused
several lettuce plants to bolt1, reducing the harvested quantities of lettuce during that time.
Figure 21. Phase 4 average cumulative lettuce production.
Cumulative weight of edible harvests of lettuce over the course of Phase 4, averaged across all
three replications of each treatment
0
200
400
600
800
1000
1200
1400
0 20 40 60 80
Lett
uce W
eig
ht
(g)
Weighing Day
Control
Soybean Meal Blend

69
Figure 22. Phase 4 average cumulative basil production.
Cumulative weight of edible harvests of basil over the course of Phase 4, averaged across all
three replications of each treatment.
0
100
200
300
400
500
600
700
0 20 40 60 80
Basil W
eig
ht
(g)
Weighing Day
Control
Soybean Meal Blend

70
Discussion
Introduction
As the project progressed, the research question expanded and shifted. Investigating the
original question of what alternative feed sources can effectively and efficiently support a
subsistence-level aquaponic system led to another question studied in Phase 1: Which nutrient
source could grow duckweed, a potential alternative feed for tilapia, with the highest overall
biomass and protein content? We used the best nutrient source from Phase 1 to grow the
duckweed used in Phases 2 and 3. The results from Phase 2 caused us to change our focus from
100% feed replacements diets to 50% replacements diets. Thus, we reevaluated the overall
research question, which subsequently became: Which alternative feed source can most
effectively and efficiently supplement commercial fish feed in a subsistence-level aquaponic
system?
Finally, for Phase 4, our research question evolved into: How does supplementing
commercial fish feed with soybean meal in a larger subsistence-level aquaponic system affect
economic viability of the system?
Phase 1
In Phase 1, we collected data to determine which nutrient source could grow duckweed
with the highest overall biomass and protein content. We determined that activated sludge can
be used to grow large amounts of duckweed with very high protein content of 40.67%,
comparable to the protein content of duckweed grown under ideal conditions (40-43%) (Rusoff
et al., 1980; Leng et al., 1995). The difference between biomass yields of activated sludge and
poultry manure is insignificant (see Figure 2), but the protein content of activated sludge is
71
significantly higher [Figure 3]. Due to its higher protein content, activated sludge was chosen as
the nutrient source for the duckweed throughout Phases 2 and 3.
There were some limitations with our Phase 1 study. Certain tested fertilizers,
particularly activated sludge and dairy manure, had solids that would not completely dissolve in
the water. This led to difficulty collecting the duckweed samples without also including some
fertilizer, which potentially added extra mass to the weighed sample. We resolved this issue
later in the phase by avoiding settled solids on the bottom of the tanks and by visually inspecting
the collected duckweed before weighing. This change in collection technique reduced standard
deviations between replications.
Phases 2 and 3
Phases 2 and 3 served as a preliminary evaluation of all candidate alternative feeds, with
the original intent to conduct two identical replications. However, results from Phase 2 caused a
reworking of our original research question. None of the alternative feeds resulted in fish growth
comparable to the growth in the control tanks (see Figure 5 and Figure 6). Plant growth data,
however, eliminated rice bran and sorghum from further consideration as those feeds yielded
significantly less basil and lettuce than duckweed and soybean meal (see Figure 7 and Figure 8).
A possible reason for this is that lower digestibility of our feed sources by the tilapia results in
more nutrients in the water for the plants to absorb.
The layout of our system led to unexpected issues during Phase 2. High turbidity in the
fish tanks made observation difficult. Suspended solids, in the form of uneaten feed and fish
waste, led to degraded water quality and spikes in concentrations of toxic ammonia and nitrite to
near dangerous concentrations. Also refer to Appendix A, which details the acceptable nitrogen

72
ranges for fish health. We lowered these concentrations to acceptable ranges by more frequently
siphoning out settled solids and replacing tank water with clean water in Phase 3.
In Phase 2, we used a 100% replacement feed treatment for non-control tanks, with no
commercial fish feed given to these tanks after acclimation. Possibly due to the reduced
digestibility of the alternate sources, unsatisfactory palatability, a lack of key nutrients, or the
presence of antinutrients, fish in these experimental tanks grew significantly less than fish fed
commercial fish feed. The tilapia receiving alternate feed diets also showed very slow growth
rates compared to the tilapia receiving commercial feed diets (see Figure 5 and Figure 6).
According to (Francis, Makkar, & Becker, 2001), soybean meal can contain antinutrients
including: protease inhibitors, lectins, phytic acid, saponins, phytoestrogens, antivitamins, and
allergens. Their analysis showed tentatively that a majority of these are not important in a
practical sense and will not impact growth at the concentrations commonly seen in fish diets.
It was brought to our attention in February 2014 that there was a product recall on the
fish feed we ordered for Phase 2 (Food and Drug Administration, 2012) There were elevated
concentrations of vitamin D in several lot numbers between April 2, 2012 and May 8, 2012, and
our order fell within that range. All of the tilapia were initially acclimated using this commercial
fish feed. We did notice some sluggish activity and lack of interest in feeding, but we cannot
confirm whether it was caused by the incorrect formulation, as no literature on toxicity of
vitamin D in fish is available. The behavior may also have been caused by an excess of feed in the
system.
Phase 3
During Phase 3, we switched from the 100% replacement feed to 50/50 blends for the
alternative feed tanks. One test feed consisted of commercial fish feed and duckweed while the

73
other consisted of commercial feed and soybean meal. As a result, we changed our research goal
to evaluating duckweed and soybean meal as supplements instead of total replacements. The
data from Phase 3 was sufficient to determine that soybean meal was the most effective
alternative feed supplement. Though differences in plant growth between the two feeds was
insignificant (see Figure 12 and Figure 13), fish fed with 50/50 soybean meal and commercial
fish feed grew to weights comparable to those of the control fish (see Figure 10 and Figure 11).
The difference in fish growth between the soybean meal and duckweed tanks was significant
enough for us to conclude that soybean meal is the better candidate. Based on toxin tissue
analysis, soybean meal had the lowest concentrations of arsenic, cadmium, lead, and mercury
compared to duckweed and control (See Table 18). Additionally, we can only compare our
resultant concentration of mercury to the concentration determined to be actionable by the FDA,
as there does not appear to be any explicit regulation on the concentrations of cadmium, lead, or
arsenic (CPG § 540.600, 2007). Our toxicity analysis indicated that the levels of mercury in all
of our fish were below actionable concentration of 1 mg/kg, with the lowest concentration found
in the fish fed with blended soybean meal (Appendix D). Although most of the toxin
concentrations were detectable, they were below the concentration for accurate quantification.
Thus, though we are confident that they are within a safe range, we cannot be entirely confident
in quantitative values.
Phase 3 had high fish mortality in several of the replications. We examined the carcasses
of individual specimens, but were unable to identify a conclusive cause of death. The pattern of
deaths suggests a pathogen, as certain tanks, especially those with unexplained organic matter
buildup, lost several individuals while others of the same treatment suffered no mortality (see
Appendix D).

74
The control tanks had the highest mortality, possibly due to already elevated stress levels
caused by the high concentrations of ammonia and nitrite nitrogen from the commercial fish
feed. We did not consider the number of fish deaths in the final analysis because the distribution
of fish deaths indicates that they were likely not caused by any specific feeds. A one-way
ANOVA indicated that the fish mortalities were not attributed to a specific feed treatment and
were randomly distributed among the tanks (p-value: 0.42). We corrected for the mortality by
using the average weight per remaining fish in the comparison.
We observed less vigorous feeding activity with the soybean meal alternative diet. This
disagrees with the findings of Robaina et al. (1995), who observed no change in feeding
behavior. The combined soybean meal pellets proved to be less buoyant than the commercial
diet, which means that the tilapia may have had less time to notice the food and consume it while
it was in the water column. However, tilapia are typically quite willing to feed off the bottom of
the tank, and slow sinking pellets are common in tilapia culture (Fitzsimmons, 2000). The
observed turbidity may have had an impact, as floating feed allowed fish more time to locate the
feed before it was filtered or settled out of the water column.
Our results agree with other studies conducted on tilapia and other species of fish, which
identified soybean meal as a viable diet supplement at varying levels of inclusion (Venou,
Alexis, Fountoulaki, & Haralabous, 2006; Webster, Tiwell, Goodgame, Yancey, & Mackey,
1992; Dabrowski, Poczyczynski, Köck, & Berger, 1989; Kikuchi, 1999; Shiau, Chuang, & Sun,
1987). Our 50% inclusion rate is higher than what was used by these studies, which replaced
between 25% and 45% of the fish diet with soybean meal. We decided to push the limits of
previously studied feed replacement percentages, because higher replacement rates result in
higher cost savings. These studies observed possible detrimental effects beginning to appear as

75
the inclusion rate increased, possibly as a result of decreased starch digestibility1 of the included
soybean meal (Venou et al., 2006).
Some differences between our findings and previous literature can be attributed to
differences between experimental apparatuses. We are modeling a subsistence-level aquaponic
system utilizing available resources in developing countries. This includes feed replacement and
less water filtration. Nitrogen concentrations were higher in our systems than would be found in
the high flow-rate systems used in other studies (Rakocy et al., 2011). This poor water quality
may have reduced growth and feed conversion efficiency.
Little research has been conducted towards utilizing alternative feeds in aquaponic
systems. Nearly all of the existing work with soybean meal was done in recirculating
aquaculture systems without any plant production component. As part of an aquaponic system,
the elevated nitrogen concentrations contribute to enhanced plant growth at the cost of water
quality. The parameters of the water must be maintained within the growing range of the fish
while simultaneously at a concentration that provides sufficient nutrients for growth of plants.
Fish growth follows a linear trend with feeding rate while water quality degrades exponentially
with increased feeding (Swick, 2001). Thus, it is very important to regulate water quality in
order to prevent excessive stress on the fish. Stress reduces growth, as the fish become less
efficient at processing the feed (Pankhurst & van der Kraak, 1997).
Phase 4
As mentioned earlier, Phase 2 showed that complete substitution soybean meal for
commercial feed entirely yielded poor fish growth. In Phase 3, fish growth in the 100%
commercial and 50% soybean meal diets was very similar, with no statistically significant
difference between the average fish weight across the three repetitions of each system. Thus, we
76
modified the hypothesis slightly; we now hypothesize that an unprocessed vegetable protein
supplement can be used in the diet of tilapia to increase the viability of aquaponic systems in
developing countries by reducing costs while maintaining fish growth.
The goal for Phase 4 was to evaluate the effects of soybean meal on the cost of the
system and system output, but on a larger scale and over a longer period of time compared to
earlier phases. Phase 4 also modeled real-world settings. Instead of being in a controlled growth
chamber, Phase 4 was conducted outdoors in a rooftop high tunnel where it was subject to
unpredictable weather conditions. Our Phase 4 growth study was ended prematurely by a period
of cold weather that threatened to lower water temperatures below tolerable levels for tilapia
(Popma & Masser, 1999, March). We collected eight weeks of data, which was enough to
distinguish between the two treatments, but too short to reach harvest size for several of our plant
crops. Additionally, several plants grew sporadically through the experiment, which caused
some inconsistent harvests. The diminished autumn sunlight also affected plant growth.
In our study, we were modeling a system intended for a tropical region. However, we
conducted our study in temperate region in mid-autumn, and thus we faced some challenges
associated with the mismatched climates. We had an excessive amount of condensation in the
high tunnel resulting from the temperature difference created when the tunnel was sealed in as
the weather cooled. The condensation created challenges for our electrical systems, sometimes
tripping ground fault circuit interrupters (GFCI) outlets and interrupting water flow. An early
bout of extremely warm weather also caused several lettuce plants to bolt, thereby rendering
them useless to the rest of our study. Eventually, we had to use water heaters and, later on, an air
heater to keep water temperatures in a good growing range for the tilapia and to prevent freezing
77
air temps from damaging plants at night. These measures should not be necessary in tropical or
sub-tropical climates.
The type of commercial feed used for control and blended pellets was changed before the
final weighing due to an oversight. We noticed decreased appetite for the new feed across both
control and soybean meal systems, which may have also been a result of the steadily decreasing
temperature outside and inside of the high-tunnel. However, only the last fish weighing was
affected by this switch, and the study was ended shortly after due to cold weather.
Tilapia grew well in both treatments during the early portion of the phase, while the
weather was warm. To compare the growth between the two treatments, a feed conversion ratio
was calculated. The lower the feed conversion ratio, the more efficient the organism is at
converting feed to edible product. An aquaculture study conducted by Minufiya University in
Shebin El-Kom, Egypt, showed a tilapia FCR of 2.5 (Abdelhamid, 2011), while a study by
Rakocy, Bailey, Schultz, and Danaher (2011) showed a range of 1.7 (for Nile tilapia) to 1.8 (for
Red Tilapia).
In the first four weeks of Phase 4, control had an average FCR of 0.844 (see Appendix
E). An FCR lower than one suggests that either the tilapia were also feeding on additional
matter, perhaps algae growing in the tanks, or it simply arose because of the addition of wet fish
tissue from dry feed, which is common in young fish growing rapidly (Fry, 2011). Although this
adds a confounding variable to our study, this finding is promising in our intended applications,
since naturally growing algae can be an effective nutritional supplement for fish (Riche &
Garling, 2003, August). However, later measurements of fish weight showed a significant
difference between control and soybean meal treatments. Control fish displayed a statistically
significant increased mass over the soybean meal fed fish.
78
Plant production also showed differences between the two treatments. Results from
ANOVA tests conclude there is are no significant differences in lettuce or basil growth between
the two groups. Although this suggests that control and blended treatments are comparable for
plant production, we have reason to question these results. We recorded high standard deviations
between replications that may have influenced the results and ANOVA test. We attribute these
discrepancies to temperature fluctuations in the high tunnel, unequal light distribution between
systems, and human error. Although these parameters were closely controlled in our previous
phases (2 and 3), these factors were more difficult to control in a real-world application.
On the other hand, our ANOVA tests indicate that there was no difference in lettuce growth
between the two groups. Although this suggests that control and blended treatments are
comparable for lettuce growth, we are hesitant to accept these results. We recorded high
standard deviations between replications that may have skewed the results and ANOVA test.
We were also growing okra and broccoli in these systems, but because both crops were
germinated late into the study, neither crops reached harvest over the course of our eight-week
study.
Water Chemistry
Originally, we intended to use water chemistry as a parameter for feed success, since the
ideal alternative nutrient feed should not significantly degrade water quality. Specifically, we
focused on ammonia and nitrite, nitrogenous wastes that are poisonous to fish at high
concentrations. However, we identified no difference in toxic nitrogen concentrations between
the different treatments throughout all phases of research. In our studies, we used water
chemistry as a general assessment of fish health. However, an idea system would not require
regular chemical monitoring. Instead, fish behavior and plant health are adequate indicators of
79
system success. If a tank had elevated toxic nitrogen concentrations, we did not feed that day,
and monitored the tank closely.
In Phase 2, we regularly observed elevated concentrations of toxic nitrogen. One
possible cause was a lack of waste removal from the bottom of the barrels. When uneaten feed
and fish waste degrade, they release nitrogenous wastes into the water. In preparation for Phase
3, we decided to change our methodology to address this issue.
In Phase 3, we removed fish waste from the bottom of the barrels on a weekly basis.
After adopting this technique, we observed no traces of nitrogen in the water. Although the
concentrations of toxic ammonia and nitrite were nearly zero, the regular waste removal process
was stressful for the tilapia and limited plant growth. The plants exhibited discoloration and
extreme stress from low nutrients. From our qualitative and quantitative observations of Phase 3,
we decided to eliminate the waste removal process for Phase 4.
During Phase 4, dissolved oxygen concentrations as low as 0.67 mg/L were noted in two
tanks. However, these measurements may have been due to a DO probe malfunction. In
instances of low dissolved oxygen, the tanks with low dissolved oxygen were not fed until
concentrations rose to acceptable ranges of above 5 mg/L, since digestion increases respiration
rates, which decreases dissolved oxygen concentrations (Masser et al., 1999, March). These
skipped feedings likely had an insignificant effect on the final fish weights as they were
infrequent. Additionally, we did not experience any fish death caused by low dissolved oxygen
concentrations.
System Design
In addition to utilizing alternative nutrient sources, an ideal subsistence-level aquaponic
system could be built with less expensive materials, maintained without instrumentation testing,

80
and operated with varying electrical conditions. Our Phase 4 system consisted of thick, plastic
fish tanks connected to drain pipes in a high tunnel - materials that are readily available in
developed nations, but less so and at a higher cost in the developing nations such as Nigeria and
Thailand (Ogunlana & Olomolaiye, 1989; Ogunlana, Promkuntong, & Jearkjirm, 1999).
There are alternative ways of constructing an aquaponic system using more accessible
materials. For instance, the plastic tank could be replaced by a wooden or metal box with a liner.
Increasing the surface area by making the plant beds larger could also act as a natural biofilter,
replacing the foam padding we used in our system, while other methods of introducing beneficial
bacteria could replace the biomedia. The exact materials used in each system depend on the
materials available in a given part of the world, but an ideal subsistence-level design would be
flexible enough work with different materials.
One of the biggest limitations of our Phase 4 system was its reliance on constant
electricity. A power outage after the data collection stage resulted in the deaths of an entire tank
of fish. Electricity in rural, developing regions of the world such as Nigeria is even less stable
(Uduma & Arciszewski, 2010). Therefore, decreasing the electricity requirements of the system
would be very beneficial. We investigated several solutions for keeping an aquaponic system
running without electricity, such as building a manual bike pump and elevated water storage into
the system or adding solar panels, but many of them hinged on designing a low-flow system.
Our ½ hp. motor was more than sufficient for our system, so a subsistence-level system could
use a much less energy intensive motor, particularly if the plant beds were at the same or similar
elevation as the fish tanks, reducing head requirements (see Appendix M for Phase 4 Fluid
Dynamics Calculations). The lower flow would also reduce surface agitation leading to a lower
rate of evaporation, reducing the requirement for clean fresh water replacement. That, coupled

81
with a backup such as a bike pump or even batteries with solar photovoltaic, could work well in
the targeted rural farming regions of the world.
Future Directions
Though our data has shown that higher inclusion rates of alternative feeds yields less fish
and plant growth, there is still the potential for a simple, 100% replacement formula. Areas and
communities where purchasing commercial feed is not possible or practical would need such a
replacement solution to facilitate aquaponic systems. Valuable future work would be to develop
this simplified alternative, perhaps using soybean meal and duckweed as a starting point.
Additionally, processing the raw soybean meal prior to inclusion in fish diets may further
improve its efficacy as a nutrient source. Wee and Shu (1989) noted that boiling the soybean
meal inactivated up to 80% of the trypsin inhibitor1, and that fish growth was significantly better
with boiled or defatted soybean meal than with raw soybean meal. This can, however, degrade
the nutritive value of the feed as well, so further work is needed to investigate the trade-offs
presented when using soybean meal in tilapia diets.
For our systems, we only investigated Nile tilapia and a limited variety of crops. While
tilapia are a hardy fish and a good choice for warm climates, future research should continue
testing alternative diets for other species, including those that can tolerate colder water
temperatures (e.g. catfish, trout, yellow perch (Buttner, Flimlin, & Webster, 1992)) to better suit
local economies and tastes. Further investigation should also be conducted on different varieties
of plants, again to better suit the preferences of the local culture and climate where an aquaponic
system may be deployed.
We considered aspects of a model system to meet the requirements of food insecure
regions of the world, but further research could be done to investigate lower flow and lower
82
stocking densities. The fish tanks could be made in a variety of ways from locally sourced
materials (wood, stone, cinder block, pond liner, etc.). The water flow could be accomplished by
using electric pumps in areas with reliable electricity, but could also be done by filling an
elevated reservoir using a bicycle powered pump or by manually lifting the water in buckets and
using valves to control the flow of water back through the plant beds and into the fish rearing
tanks. Further work could be done to investigate other types of hydroponic media. Our system
used peat pots, expanded clay pebbles and net pots that were suspended in free-flowing water.
There are other possibilities for growing media that may be cheaper and easier to maintain, such
as gravel beds with an ebb and flow system.
Economic Analysis
We investigated whether it would be economically beneficial to include a plant
supplement in fish feed. In aquaponics, according to the WorldFish Center (TWC) (2009),
purchasing feed is 50-70% of the main operating cost1, a percentage that varies depending on
farming intensity. Thus, adjusting the existing farm-made feed ingredients to include cheaper,
more sustainable plant-based feeds would lower the production cost. This would benefit
economically struggling areas in developing countries.
According to the International Monetary Fund (IMF)’s January 2014 report (International
Monetary Fund, 2014), the commodity price1 of soybean meal is $500 per metric ton ($0.23 per
pound), which is less than one-third that of fishmeal (priced at $1600 per metric ton or $0.73 per
pound). Therefore, any replacement of fishmeal with an alternative nutrient lowers operating
costs, as long as growth is not sacrificed.
When conducting economic analysis, we looked at one aquaculture study located in
Bangladesh. Since our research is aimed at tropical developing regions this study serves as an
83
appropriate model. Fish farmers experimented with alternative feed formulas, where only 10%
of the feed was composed of fish feed, and up to 90% of the feed was composed of plant-based
products such as rice bran and duckweed. In Bangladesh, commercial fish feed is valued at
$0.35/kg ($0.16/lb.) (TWC, 2009). This replacement formula lowered the cost of feed to
$0.22/kg ($0.10/lb.). However, even in the locally made alternative diet, the cost of fishmeal
exceeded any other expenditure. Although fishmeal only comprised 10% of the farm alternate
feed, it made up 45% of the cost. Thus, it would be advantageous to lower the ratio of fish meal
to alternate nutrient as much as possible while still maintaining satisfactory fish growth. For
instance, simply lowering the fishmeal quantity to 5% in the example feed would decrease
production costs by approximately 23%.
In our Phase 4 study, we compared the efficiency of a 50/50 commercial fish
feed/alternative feed blend with that of a complete commercial fish diet. For the fish treated with
commercial fish feed, we utilized 9.6 kg of commercial fish feed and yielded 5.4 kg of fish
product. Using the Price Commodity Index as provided by the International Monetary Fund, we
determined that the total feed cost in order to produce this amount of product would be $15.06.
The tilapia receiving control treatments had an average FCR of 1.786, while fish
receiving blended soybean meal/commercial fish feed treatments had a less effective FCR of
2.27. The lower FCR indicates that the fish are less effective at converting the 50/50 blended
feed to body mass. These fish require a longer grow-out time to reach market size, and
consequently will require more feed. Our next step was to determine whether the significantly
lower cost of soybean meal is a worthwhile investment, despite the longer grow-out time and
more overall feed required.

84
We calculated that we would need 12.25 kg of 50/50 soybean meal and commercial fish
feed blend in order to match the production levels of our control tanks. This would cost
approximately $12.60, an 8.86% decrease from $15.06, the cost for a complete commercial fish
feed treatment. Thus, we conclude that it is economically beneficial to use an alternate protein
supplement or replacement feed. Even though our fish raised with a blended treatment grew
slower, there is a greater return on investment over time. Similarly, the reduced cost of fertilizer
would lower the production costs of the plant crops as well, further increasing the potential for
profit.
A potential area of further study is adjusting the ratio of replacement feed to commercial
feed. A study conducted by Kikuchi (1999) found that the ideal proportion of soybean meal
substitution in fish feeds is below 43%. Above this concentration, feed conversion efficiency was
compromised.
Although soybean meal is projected to be an economically beneficial feed supplement,
our percentage feed replacement produced insignificant results. Our results, comparing the fish
production for the two treatments, are shown in Figure 23. A study conducted over a longer
growing season, where fish can reach market size, would lead to more conclusive results.

85
Figure 23. Comparison of feed ingredients and fish product.
Feed input and total fish produced for each treatment across all three replications
0
2
4
6
8
10
12
1 2
Feed
In
gre
die
nts
an
d F
ish
Pro
du
ced
(kg
)
Commercial Fish Feed Used(kg)
Soybean Meal Used (kg)
Fish Produced (kg)

86
Conclusion
Team MEGA identified aquaponics as a potential method of providing access to high
quality food, which remains inaccessible to a large number of people. The primary constraints
limiting widespread implementation are initial and operating costs and market access. To
address these challenges, we began investigating widely available, low-cost alternative nutrient
sources that could be used to supplement fish diets, reducing operating costs and the need for
market access. We decided to evaluate these nutrient sources in a way that modeled the intended
application. Nutritional studies to this point have typically been conducted in fish-only systems.
By using aquaponic systems, we were able to observe and quantify the effects of feed source on
fish and plant growth.
Research Summary
To begin, we identified four alternative feeds sources: duckweed, soybean meal, rice
bran, and sorghum. Each option is high in protein, is lower in cost than fishmeal, and is
commonly found or grown in many regions worldwide. Duckweed has been used as an
alternative feed in practice, but very little empirical data was available. We designed and
conducted Phase 1 of our study to determine what fertilizer would produce the most duckweed
with the highest protein content. We tested dairy manure, poultry manure, vegetable compost,
and activated sewage sludge in a two-week controlled growth study and found that activated
sewage sludge produced a large amount of duckweed with very high protein content (40%).
Using activated sludge, we grew duckweed and tested this feed against the other three
alternatives with 100% replacement of the control commercial diet (Phase 2). After eleven
weeks, we found that though there was a clear difference between the plant growth of several of
the treatments, the 100% replacement diets were not producing significant growth in the tilapia.

87
We eliminated sorghum and rice bran due to lower plant yields, and repeated the study with 50%
replacement for duckweed and soybean meal (Phase 3). At the conclusion of this trial, we
determined that soybean meal yielded better fish growth.
To further study the results found in Phase 3, and to obtain data more relevant to the
intended final application, we conducted a larger scale growth study in a less-controlled
environment. In a rooftop high-tunnel, Phase 4 compared the fish and plant growth of three
replications each of soybean meal and a commercial diet over eight weeks. Despite the short
growing season due to cold weather, we obtained usable growth data, and conducted an
economic analysis based on the values. We found that despite reduced growth, with the 50%
soybean meal replacement the cost of feed would be reduced by just over 8%. The large-scale
study also enabled us to explore some of the challenges that must be overcome in order to
successfully implement a robust, low-cost, low-energy aquaponic system.
Using existing literature, which found that soybean meal replacement did not lower
growth significantly, we extrapolated on an economic case study in Bangladesh. We found that
by replacing 50% of the fishmeal in a farm-made diet (10% fishmeal), the cost of the total diet
could be reduced by as much as 22%.
Potential Implications
Our findings have implications for a number of aspects of aquaculture and aquaponics,
particularly in low-density and subsistence-level applications. We tested a range of waste
products that can be used to grow duckweed as a supplemental feed source. Our data indicates
that using processed human waste as a fertilizer yields high growth rates and protein content.
Since this is a ubiquitous waste stream, it can be used worldwide. Growing duckweed would
also serve as a means of removing excess nutrients from wastewater, reducing environmental
88
impact, and recycling nutrients for food production. This duckweed was tested against other
alternatives as a feed replacement in aquaponic systems, with promising results. By growing the
feed source for tilapia, farmers could dramatically reduce costs without a large drop in fish or
plant yields. Testing feed sources in aquaponic systems is a novel research approach, and one
that provides valuable insight into the effects of feeds on both fish and plant yields. Our growth
data for soybean meal suggests that soybean meal and possibly other alternative feeds could
displace a larger portion of fishmeal in fish diets, reducing costs and fishing pressure on wild
fisheries.
Future Work
To make the alternatives more viable options, further work needs to be done to determine
what combinations are most effective, what replacement rates provide the best compromise
between growth and cost, and the regions in which each is available. Further investigation is
also needed to identify methods of reducing the energy requirements and allow for low-cost
water movement, aeration, and filtration. As mentioned, current systems require a constant
supply of electricity, which is not available in many regions of the world. We considered several
options to reduce the need for electricity throughout our project, but did not conduct any tests.
Potential solutions include manual water movement using bicycle pumps or buckets and electric
pumps powered by solar photovoltaic (though cost is an issue). These options could be used
with elevated water storage to eliminate the need for a constant energy supply, whether electrical
or manual labor. For example, an elevated reservoir could be filled using buckets or a pump, and
then a valve could control the flow over the next six hours, until the reservoir would be filled
again.

89
To reduce costs and enable systems to be constructed in a variety of locations, further
work needs to be done to identify materials and methods that utilize locally available, low-cost
materials. The fish tanks, plant beds, and substrate all need to be found locally. The fish tanks
can be made from a range of materials including plywood, gravel, concrete block, or they can be
dug into the ground and lined with a pond liner. Plant beds can be made similarly, and barrels
cut in half can also be used. Gravel can be an effective plant substrate, and is commonly
available. Floating rafts can also be used where gravel is not present.
Final Words
We see aquaponics as a means to enable people around the world to grow high quality
food on a small-scale, alleviating hunger and food insecurity. There are several challenges that
must be overcome in order to make aquaponics economically viable for this purpose, but through
the use of lower cost feed supplements and other methods detailed above, it has tremendous
potential. With increasing costs of fossil fuels, it is unlikely that conventional agriculture will
continue to be able to provide food to many regions of the world. Therefore, a range of new
methods needs to be developed and implemented, and we hope that aquaponics will be part of
that portfolio.

90
Appendix A: Acceptable Nitrogen Concentration Ranges for Tilapia Health
Table 6. Acceptable Nitrogen Concentration Ranges for Tilapia (Rakocy, 1989, September)
Name Chemical Formula Acceptable Range
Ammonia NH3 - N 0 – 2 ppm
Nitrite NO3 – N 0 – 5 ppm

91
Appendix B: Phase 1 Data Tables
Table 7. Phase 1 Data: Tukey Multiple Comparisons Test for Total Duckweed Biomass and
Protein Content
Biomass Protein
Groups p-value p-value
Vegetable Compost-Activated Sludge 0.0031257* 0.000012*
Control-Activated Sludge 0.0004914* 0*
Dairy Manure-Activated Sludge 0.005382* 0*
Poultry Manure-Activated Sludge 0.8029669 0.000062*
Control-Vegetable Compost 0.6441074 0*
Dairy Manure-Vegetable Compost 0.9948887 0*
Poultry Manure-Vegetable Compost 0.0157963* 0.4869878
Dairy Manure-Control 0.4370417 0.0081312*
Poultry Manure-Control 0.0020727* 0*
Poultry Manure-Dairy Manure 0.0282972* 0*
*Indicates significant value at an alpha level of 0.05

92
Appendix C: Phase 2 Data Tables
Table 8. Phase 2 Data, Tilapia Weights and Final Growth Percentage
Date 10/5/12 10/19/12 10/26/12 11/2/12 11/9/12 11/16/12 11/23/12 11/30/12 12/7/12 12/14/12 12/21/12 Growth %
Day 1 15 22 29 36 43 50 57 64 71 78 78
Control 64.50 82.50 88.50 106.50 131.50 157.00 180.50 214.00 233.50 257.50 293.50 123.19%
Std. Dev. 16.26 3.54 7.78 6.36 2.12 4.24 3.54 9.90 19.09 34.65 40.31 27.05%
Sorghum 44.50 44.50 50.00 44.50 42.00 42.50 42.50 46.50 48.00 48.00 50.00 19.05%
Std. Dev. 10.61 2.12 7.07 2.12 0.00 2.12 2.12 2.12 0.00 0.00 0.00 0.00%
Soymeal 62.00 54.50 54.50 54.00 52.50 56.00 58.50 60.00 66.00 77.00 82.50 57.14%
Std. Dev. 0.00 2.12 2.12 0.00 4.95 4.24 2.12 5.66 7.07 2.83 0.71 16.23%
Rice Bran 49.50 50.00 51.50 49.50 54.00 52.00 53.00 53.50 57.00 60.50 62.00 14.81%
Std. Dev. 6.36 0.00 2.12 0.71 2.83 2.83 1.41 3.54 4.24 2.12 0.00 6.02%
Duckweed 55.50 50.50 50.50 48.50 49.50 49.50 54.00 56.50 59.00 63.50 69.50 40.40%
Std. Dev. 13.44 3.54 7.78 7.78 7.78 9.19 7.07 10.61 7.07 10.61 10.61 0.64%
Table 9. Phase 2 Data, Tukey Multiple Comparisons Test for Tilapia Growth Percentage
Groups p-value
Duckweed/Control 0.0120178*
Rice Bran/Control 0.0036537*
Sorghum/Control 0.0043352*
Soybean Meal/Control 0.0310616*
Rice Bran/Duckweed 0.4819033
Sorghum/Duckweed 0.6133975
Soybean Meal/Duckweed 0.7685347
Sorghum/Rice Bran 0.9982951
Soybean Meal/Rice Bran 0.1467364
Soybean Meal/Sorghum 0.1952919
*Indicates significant value at an alpha level of 0.05
Table 10. Phase 2 Data, Average Cumulative Lettuce Production
Date 10/24/12 10/31/12 11/7/12 11/14/12 11/21/12 11/28/12 12/5/08 12/12/12 12/19/13
Day 20 27 34 41 48 55 62 69 76
Control 5.69 11.27 17.41 21.66 25.78 29.07 33.03 35.49 37.53
Std. Dev. 0.70 0.29 0.88 2.67 2.58 2.61 3.43 2.12 0.08
Sorghum 5.05 5.86 6.91 7.24 7.57 7.68 9.47 11.93 13.17
Std. Dev. 1.57 1.37 1.50 1.70 1.91 1.84 2.55 0.23 1.26
Soymeal 7.10 13.18 18.60 23.61 28.14 32.80 36.50 39.41 41.00
Std. Dev. 0.25 1.72 2.84 3.26 3.49 2.35 2.78 3.46 4.20
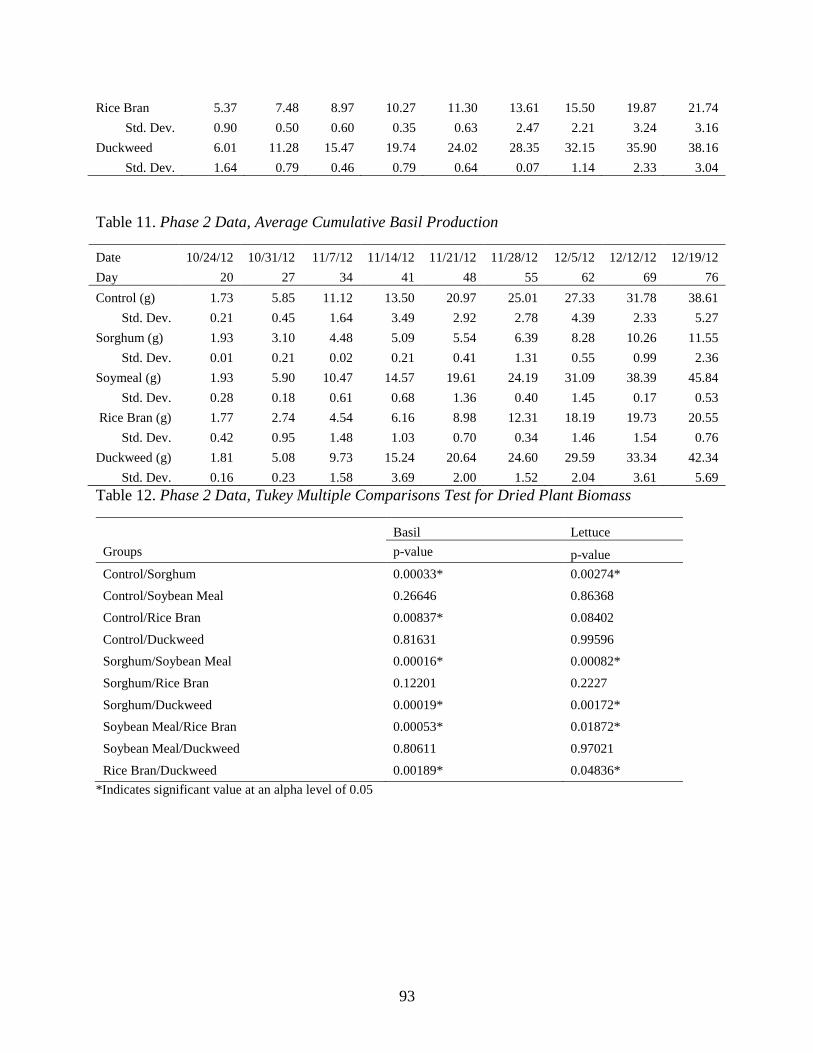
93
Rice Bran 5.37 7.48 8.97 10.27 11.30 13.61 15.50 19.87 21.74
Std. Dev. 0.90 0.50 0.60 0.35 0.63 2.47 2.21 3.24 3.16
Duckweed 6.01 11.28 15.47 19.74 24.02 28.35 32.15 35.90 38.16
Std. Dev. 1.64 0.79 0.46 0.79 0.64 0.07 1.14 2.33 3.04
Table 11. Phase 2 Data, Average Cumulative Basil Production
Date 10/24/12 10/31/12 11/7/12 11/14/12 11/21/12 11/28/12 12/5/12 12/12/12 12/19/12
Day 20 27 34 41 48 55 62 69 76
Control (g) 1.73 5.85 11.12 13.50 20.97 25.01 27.33 31.78 38.61
Std. Dev. 0.21 0.45 1.64 3.49 2.92 2.78 4.39 2.33 5.27
Sorghum (g) 1.93 3.10 4.48 5.09 5.54 6.39 8.28 10.26 11.55
Std. Dev. 0.01 0.21 0.02 0.21 0.41 1.31 0.55 0.99 2.36
Soymeal (g) 1.93 5.90 10.47 14.57 19.61 24.19 31.09 38.39 45.84
Std. Dev. 0.28 0.18 0.61 0.68 1.36 0.40 1.45 0.17 0.53
Rice Bran (g) 1.77 2.74 4.54 6.16 8.98 12.31 18.19 19.73 20.55
Std. Dev. 0.42 0.95 1.48 1.03 0.70 0.34 1.46 1.54 0.76
Duckweed (g) 1.81 5.08 9.73 15.24 20.64 24.60 29.59 33.34 42.34
Std. Dev. 0.16 0.23 1.58 3.69 2.00 1.52 2.04 3.61 5.69
Table 12. Phase 2 Data, Tukey Multiple Comparisons Test for Dried Plant Biomass
Basil Lettuce
Groups p-value p-value
Control/Sorghum 0.00033* 0.00274*
Control/Soybean Meal 0.26646 0.86368
Control/Rice Bran 0.00837* 0.08402
Control/Duckweed 0.81631 0.99596
Sorghum/Soybean Meal 0.00016* 0.00082*
Sorghum/Rice Bran 0.12201 0.2227
Sorghum/Duckweed 0.00019* 0.00172*
Soybean Meal/Rice Bran 0.00053* 0.01872*
Soybean Meal/Duckweed 0.80611 0.97021
Rice Bran/Duckweed 0.00189* 0.04836*
*Indicates significant value at an alpha level of 0.05

94
Appendix D: Phase 3 Data Tables
Table 13. Phase 3 Data, Tukey Multiple Comparisons Test on Tilapia Growth Percentage
Groups p-value
Duckweed/Control 0.2239944
Soybean Meal/Control 0.0145218
Soybean Meal/Duckweed 0.0036117*
*Indicates significant value at an alpha level of 0.01
Table 14. Phase 3 Data, Distribution of Fish Mortality Among Replications
Tank Total Dead
1 - Control1 1
2 - Duckweed1 0
3 - Soymeal2 0
4 - Control2 5
5 - Duckweed2 0
6 - Soymeal2 0
7 - Control3 6
8 - Duckweed3 2
9 - Soymeal3 7

95
Figure 24: Phase 3 Diagram, Distribution of Fish Mortality Among Replications
Table 15. Phase 3 Data, Average Cumulative Lettuce Production
Date 4/10/13 4/17/13 4/26/13 5/1/13 5/8/13 5/15/13 5/17/13
Day 12 19 26 33 40 47 54
Control 9.87 14.30 18.20 21.17 24.23 28.33 36.37
Std. Dev. 1.50 1.05 2.91 4.25 5.11 6.21 7.70
Duckweed Blend 10.43 14.87 18.17 20.50 22.80 25.50 33.60
Std. Dev. 1.91 2.82 2.86 3.03 2.79 2.34 4.60
Soybean Meal Blend 10.53 15.27 19.43 21.73 25.17 28.40 38.87
Std. Dev. 3.97 4.26 5.18 5.42 4.43 3.21 7.32
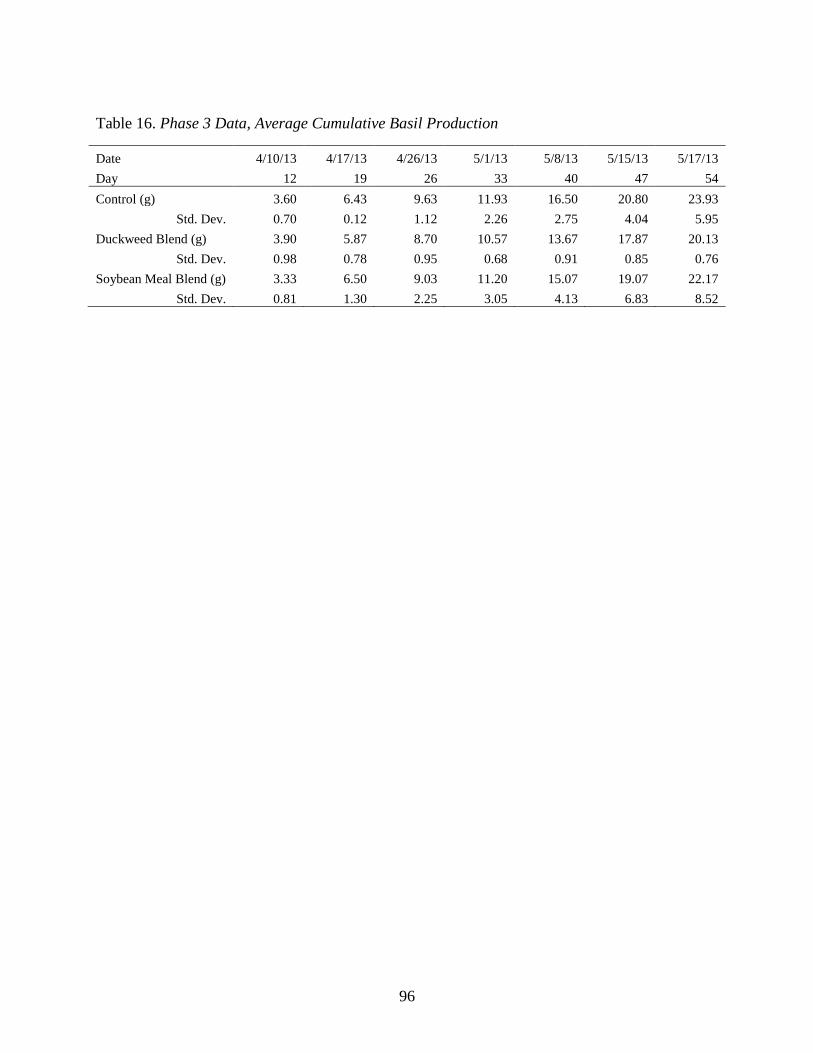
96
Table 16. Phase 3 Data, Average Cumulative Basil Production
Date 4/10/13 4/17/13 4/26/13 5/1/13 5/8/13 5/15/13 5/17/13
Day 12 19 26 33 40 47 54
Control (g) 3.60 6.43 9.63 11.93 16.50 20.80 23.93
Std. Dev. 0.70 0.12 1.12 2.26 2.75 4.04 5.95
Duckweed Blend (g) 3.90 5.87 8.70 10.57 13.67 17.87 20.13
Std. Dev. 0.98 0.78 0.95 0.68 0.91 0.85 0.76
Soybean Meal Blend (g) 3.33 6.50 9.03 11.20 15.07 19.07 22.17
Std. Dev. 0.81 1.30 2.25 3.05 4.13 6.83 8.52

97
Table 17. Phase 3 Data, Tukey Multiple Comparisons Test for Dried Plant Weight
Basil Lettuce
Groups p-level p-level
Control/Duckweed 0.75003 0.85703
Control/Soybean Meal 0.93859 0.88136
Duckweed/Soybean Meal 0.9196 0.58248
Table 18. Toxin Analysis for Tissue Samples from Phase 3
Arsenic (ppm) Cadmium (ppm) Lead (ppm) Mercury (ppm)
Control 0.15 0.048* 0.021* 0.025
Duckweed 0.15 0.015* 0.024* 0.033
Soybean Meal 0.11 0.018* 0.013* 0.016*
* - Estimated concentration above the adjusted method detection limit and below the adjusted reporting limit

98
Appendix E: Phase 4 Data
Table 19. Phase 4 Tilapia Weights and Final Growth Percentage
Date 9/10 10/10 11/6 11/13 Growth %
Day 1 31 58 65
Control (g) 224.67 740.00 1753.33 1799.00 700.74%
Std. Dev. 8.96 20.66 109.26 177.97 74.76%
Soymeal Blend (g) 232.33 644.33 1369.67 1355.33 483.36%
Std. Dev. 10.41 7.77 102.69 171.93 64.25%
Table 20. Phase 4 Data, Average Cumulative Lettuce Production
Date 9/18/13 9/25/13 10/2/13 10/9/13 10/16/13 10/23/13 10/30/13 11/6/13 11/13/13
Day 9 16 23 30 37 44 51 58 65
Control (g) 90 143 179 198 217 217 649 940 1301
Std. Dev. 12.49 19.09 20.65 23.64 26.65 26.65 95.69 157.51 241.86
Soybean Meal Blend (g) 113 164 210 227 244 244 337 506 664
Std. Dev. 5.86 5.51 7.55 6.51 5.69 5.69 32.39 81.38 85.64
Table 21. Phase 4 Data, Average Cumulatice Basil Production
Date 9/18/13 9/25/13 10/2/13 10/9/13 10/16/13 10/23/13 10/30/13 11/6/13 11/13/13
Day 9 16 23 30 37 44 51 58 65
Control (g) 23 23 23 49 75 75 285 418 621
Std. Dev. 0.58 0.58 0.58 0.58 1.00 1.00 27.22 34.12 21.52
Soybean Meal Blend (g) 15 15 15 35 55 55 96 163 300
Std. Dev. 2.65 2.65 2.65 5.77 8.96 8.96 15.62 40.50 50.69
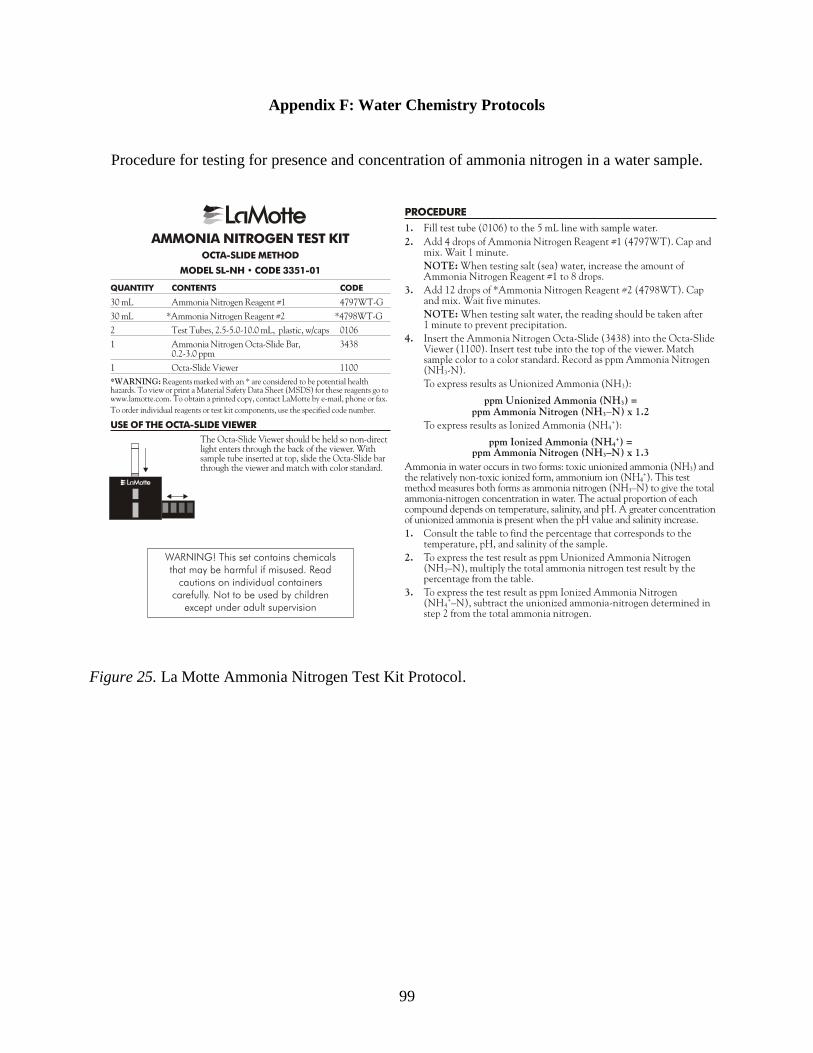
99
Appendix F: Water Chemistry Protocols
Procedure for testing for presence and concentration of ammonia nitrogen in a water sample.
Figure 25. La Motte Ammonia Nitrogen Test Kit Protocol.
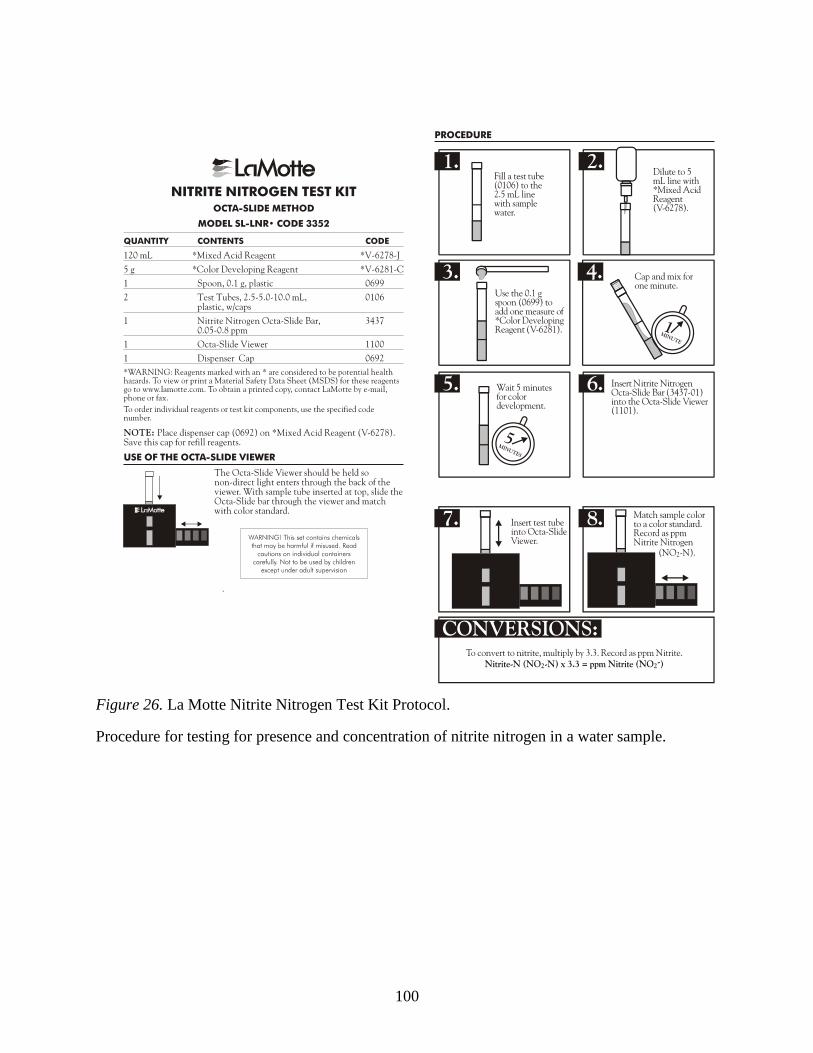
100
Procedure for testing for presence and concentration of nitrite nitrogen in a water sample.
Figure 26. La Motte Nitrite Nitrogen Test Kit Protocol.

101
Figure 27. La Motte Nitrate Nitrogen Test Kit Protocol.
Procedure for testing for presence and concentration of nitrate nitrogen in a water sample.

102
Figure 28. La Motte Low Range Phosphate
Test Kit Protocol.
Procedure for testing for presence and
concentration of phosphate in a water sample.
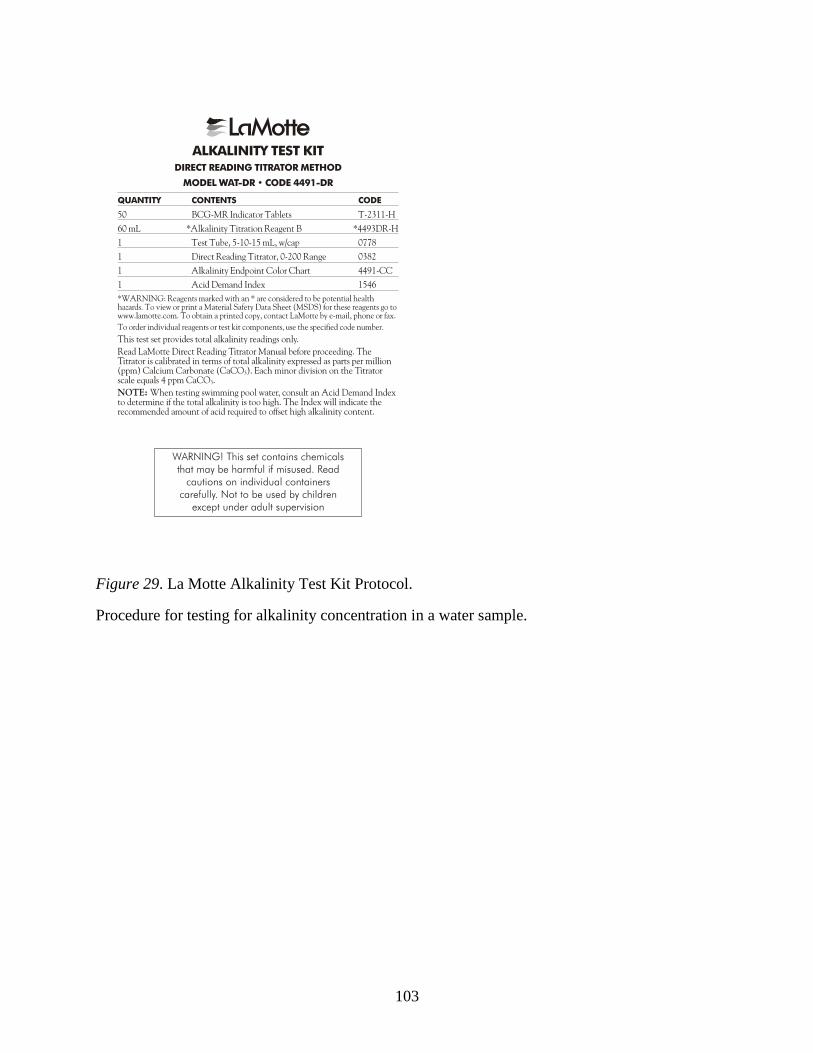
103
Figure 29. La Motte Alkalinity Test Kit Protocol.
Procedure for testing for alkalinity concentration in a water sample.

104
Figure 30.La Motte Total Hardness Test Kit Protocol.
Procedure for testing for hardness in a water sample.

105
Appendix G: Nutrient Source Product Information
Figure 31. Poultry manure product information.
Stutzman Farms SUP’R GREEN 3-2-2 poultry manure product ingredient analysis.
Figure 32. Activated sludge product information.
Milorganite® 5-2-0 fertilizer composition/information on ingredients

106
Appendix H: Alternative Feed Source Product Information
Figure 33. Rice bran product information.
NutraCea® Rice Bran product ingredient specifications.
Figure 34. Soybean meal product information.
Certified organic soybean meal product ingredient analysis.
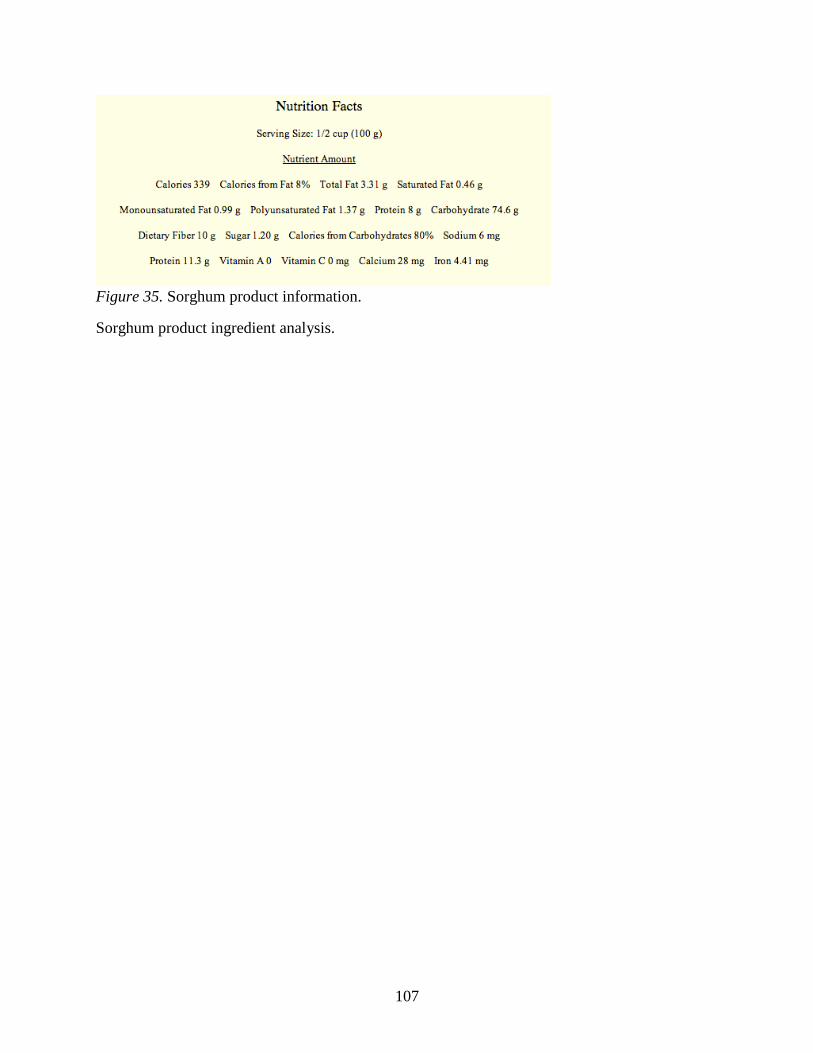
107
Figure 35. Sorghum product information.
Sorghum product ingredient analysis.
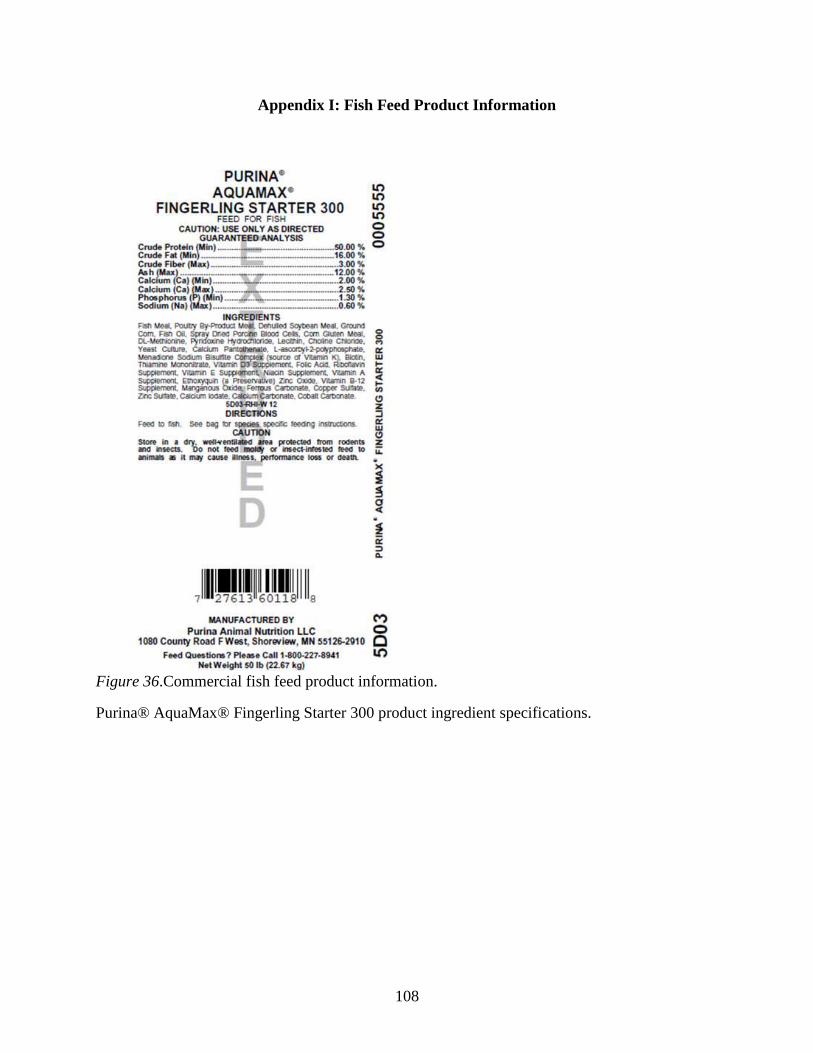
108
Appendix I: Fish Feed Product Information
Figure 36.Commercial fish feed product information.
Purina® AquaMax® Fingerling Starter 300 product ingredient specifications.

109
Appendix J: Product Information
Figure 37. Lettuce product information.
Environmental preferences for Bibb Lettuce purchased from Ferry Morse.
Figure 38. Basil product information.
Genovese Basil purchased from Seeds of Change.

110
Figure 39. Okra product information.
Clemson Spineless Okra purchased from Burpee®.
Figure 40. Broccoli product information.
Early Dividend Hybrid Broccoli purchased from Cornucopia Seed

111
Appendix K: Product Information
Figure 41. Dissolved oxygen meter product information.
EcoSense® DO200 Dissolved Oxygen/Temperature specifications.
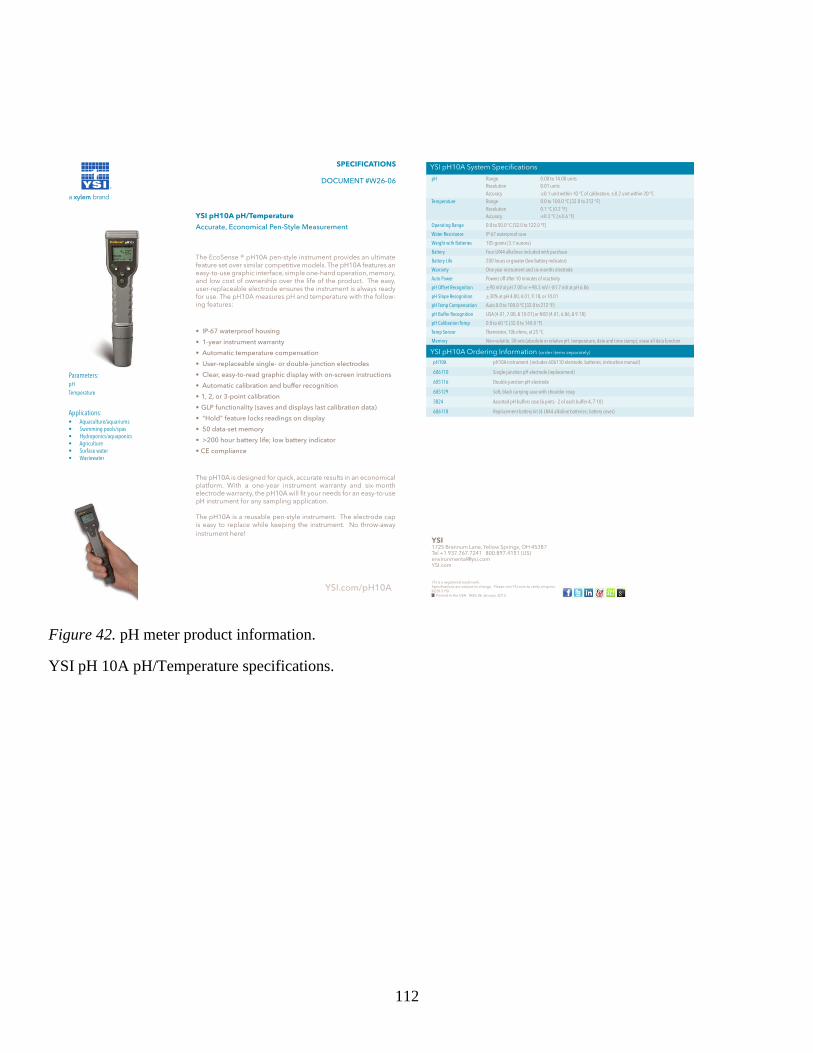
112
Figure 42. pH meter product information.
YSI pH 10A pH/Temperature specifications.

113
Figure 43. Jiffy-7® plugs product information.
Jiffy-7® plugs usage specifications.
Jiffy-7 now with increased air porosity for easier water management andfaster rooting. Jiffy bio-products are earth-friendly, non-toxic and provideproducers of horticultural products economical alternatives to plastic andother more expensive bio-like products.
Increased Returns
Jiffy-7 offers quicker rooting due to the air pruning thatstimulates fibrous root development within the plug.This can decrease crop cycle up to 25% to producestronger, more compact plants.
Unlike other plugs, Jiffy-7 is supplied in a driedcompressed form allowing the grower tostore un-used plugs until the next cropcycle. Efficient storage is a benefit of theJiffy-7 while also occupying less than onequarter of the space of regular plugs.Jiffy pellets are easily re-hydrated byhand or during the normal irrigation
cycle.
Convenience
All Jiffy-7 sizes feature a pre-formed softcentre for easy insertion of even the smallest cuttings.The fully enclosed capillary net allows easy handling of
the plugs without loss of substrate while extending thetransplant window.
Jiffy-7 plugs contain a specially formulated fertilizer toprovide the best start for your young plants.
Polyroll offers unrivalled convenience by providing plugsthat are pre-spaced on perforated polythene or capillaryfleece underlay. Plugs are spaced to the growers’requirements. The length and width of the under lay canbe made to fit individual benches ensuring maximumuse of bed space. All pellet-pack trays feature a picturelabel slot to allow secure attachment of a label withoutdamaging a plug.
Extensive Range
Six plug sizes are available from 18mm to 44mmdiameter that are either loose in cartons or pre-loaded ina range of growing trays. Tray options range from 25 cellstrips to 144 strips all in full size growing trays. Plugs canalso be pre-spaced in the growing trays ensuring there isa Jiffy-7 solution to suit all crops. All trays feature the
unique Jiffy air-prune design, which makes certainthe plug is held firmly within the cell while
allowing free air movement around theplug. This minimizes root diseases
and maximizes root development.
Environment
Jiffy-7 Pellets are manufactured fromsphagnum peat (and Coir fibers) harvested
from carefully selected bogs which are subjectedto stringent internal and governmental inspection.
Peat is taken from sources where the re-generation rateis greater than the harvest rate, and the local ecology isnot adversely affected. The addition of 25% coir fibersmakes Jiffy-7 suitable for reduced peat production.
For further information or to arrange a trial of Jiffy-7 Plugsplease contact your area manager or use the contact options below
Jiffy Products of America Inc.Toll Free 1-800-323-1047 (North America only)
E-mail: [email protected]
www.jiffygroup.com
Jiffy Products International BVTel.: +31 168 41 35 55E-mail: [email protected]
www.jiffygroup.com

114
Figure 44. Sodium thiosulfate product information.
Procedure for use of sodium thiosulfate purchased from Aquatic Ecosystems Inc.

115
Figure 45. Air pump product information.
ActiveAquaTM Commercial Air Pump with 6 outlets (eco-5064) specifications.
Figure 46. Biomedia product
information.
Kaldnes® media specifications.
Figure 47. Water heater product information.
EHEIM thermocontrol 300 specifications.

116
Figure 48. Phase 4 water pump product information.
½ HP clear water pump specifications.

117
Figure 49. Phase 2 and 3 water pump product information.
Azoo Powerheads specifications.
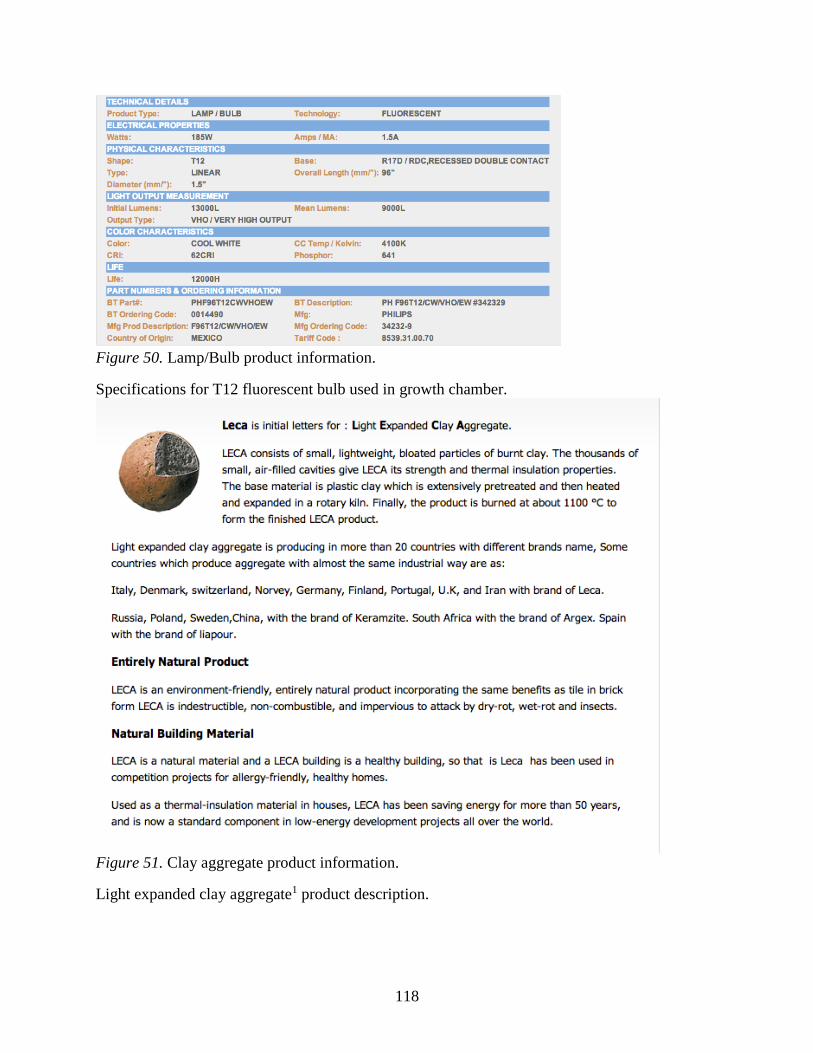
118
Figure 50. Lamp/Bulb product information.
Specifications for T12 fluorescent bulb used in growth chamber.
Figure 51. Clay aggregate product information.
Light expanded clay aggregate1 product description.

119
Figure 52. Water conditioner product information.
ReptisafeTM terrarium water conditioner procedure and specifications.

120
Appendix L: Diagram of University of Virgin Islands Aquaponic System
Figure 53. Aquaponic system diagram.
The University of Virgin Islands aquaponic system setup.

121
Appendix M: Phase 4 Fluid Dynamics Calculations
Figure 54. Phase 4 fluid dynamics calculations.
Calculations for water circulation in Phase 4.
122
Appendix N: Glossary of Terms
Acclimation: a period of time after the delivery of new fish in which they are gradually adjusted
to a new aquatic environment
Activated sludge: in the context of this research, it will be defined as a pathogen-free pelletized
solid fertilizer made from processed human waste.
Aeration: the process used to increase oxygen content in the water of the aquaponic system by
circulating air through the liquid.
ANOVA: the analysis of variance, or more briefly ANOVA, refers broadly to a collection of
experimental situations and statistical procedures for the analysis of variance within an
experiment.
Anti-nutritional: biologically active compounds that interrupt nutrient absorption.
Apparent digestibility coefficient (ADC): the specific measurement of a feed or diet, which can
be digested by the species of tilapia.
Aquaculture: the method of cultivating marine or freshwater fish or other sea-life under
controlled conditions.
Biodiversity: briefly, the variety of life, including but not limited to genetic, species, and
ecosystem diversity.
Biofilter: device using living microorganisms to capture and break down organic pollutants. It is
used to process wastewater by capturing harmful chemicals.
Biologically available: the extent to which an active ingredient (nutrient source) is available to
the given region and user of the system.
Biological oxygen demand: the amount of dissolved oxygen needed by aerobic biological
organisms in a body of water to break down organic material present in a given water sample.
Biomass yield: the ratio of the amount of biomass produced to the amount of substrate
consumed, where biomass is the given weight or quantity of an organism in a given area
or volume.
Bolt: the premature growth of a flowering stem, often resulting from non-ideal growing
conditions such as high temperatures. This can halt the growth of harvestable material in crops
like lettuce and basil.
Bonemeal: a mixture of ground bone and other slaughterhouse waste products sometimes used
as a fertilizer and feed supplement.
123
Brood stock: a group of mature individuals used for breeding purposes.
Cage aquaculture: the farming of fish or other seafood in an enclosure within an existing body
of water.
Carnivorous: deriving all or most of its nutrition from the consumption of animal tissue.
Chemical oxygen demand: a common water-quality measure used to determine the amount of
organic compounds in a sample.
Commodity price index: a weighted average of selected commodity prices.
Conductivity factor: the measurement of a solutions ability to conduct electricity.
Cultivar: a variety or species of plant that is created or intentionally selected and maintained
through cultivation.
Dairy manure: the phosphorous rich excrement of dairy cattle, often used as fertilizer.
Developing nations: a country with a low-level of material well-being.
Desertification: a type of land degradation in which relatively dry regions become increasingly
arid over time.
Duckweed: a fast-growing group of simple floating aquatic plants living in slow-moving bodies
of water. We will be referring primarily to the specific type of duckweed Lemna minor.
Economic feasibility: degree to which a system is able to be profitable after accounting for
construction and upkeep over a reasonable time period (1-2 years)
Effectiveness: will be determined differently in each phase of research. Within Phase 0,
effectiveness will be measured by protein content greater than 25%. In Phases I and II,
effectiveness will be measured by water concentrations of nitrate, nitrite, and ammonia.
Efficiency: will be determined differently in each phase of research. Phase 0 will measure
efficiency by the measurement of feed cost/mass of duckweed ($/g). Phase I will measure
biomass yield and cost (feed). In Phase II, efficiency will be measured by biomass yield, market
yield, and cost (construction, maintenance, feed).
Eutrophication: the process by which increased nutrients in a water body influence the
ecosystem. Changes include increased algae blooms, decreased dissolved oxygen, and more.
Feed conversion rate: the measured ratio of feed consumed to net weight gain.
Fingerling: a young or small fish.
124
Fish silage: a liquid product made from whole fish or parts of fish that are liquefied by the action
of enzymes in the presence of an added acid
Genetic mixing: the exchange of genetic information within and between populations.
Growth chamber: a growing chamber with controlled conditions (ex. temperature, light,
humidity) used to study plant growth.
High-intensity/high energy: referring to the resulting aquaponic system consisting of high-
technology engineering innovations that require more resources and manual labor to
operate; higher stocking density
High tunnel: a commercial greenhouse used in agriculture applications to maintain a more
reliable and uniform temperature and humidity and to protect plants from external
variables (e.g. wind, etc.)
Hydroponics: the process of growing plants in sand, gravel, or liquid with added nutrients but
without the use of soil.
Intermediary plant: a plant that grows from a feed that would not otherwise be accepted by a
fish population as a direct source of food. Instead, the fish will feed off the intermediary
plant.
Isocaloric: normalized to have the same energy content.
Isonitrogenous: normalized to have the same nitrogen or protein content.
Kjeldahl method: an analytical chemistry method used to quantitatively determine the amount
of nitrogen in a chemical substance.
Large vs. small scale: manufactured for the purpose of commercial production as opposed to a
smaller subsistence-level system.
Least developed countries (LDC): a country, defined by the United Nations as having the
lowest indicators of socio-economic development, based on poverty, human resource weakness
and economic vulnerability.
Light Expanded Clay Aggregate (LECA): a low-density, porous clay product used as a
hydroponic substrate for growing plants.
Limiting factors: factors that limit the growth of the plant and is used as a supplement in the
system.

125
Low Income Food Deficient Countries (LIFDC): a country defined by FAO as having a low
per capita Gross National Income, weak food trade (Imports vs. Exports), and have not
specifically requested being left off the list. There are currently 62 LIFDC.
Low-intensity/low energy: referring to the resulting aquaponic system consisting of low-
technology engineering innovations that require minimal resources and manual labor to operate;
lower stocking density.
Macronutrients: a nutrient source that is required in higher concentrations to sufficiently feed
the plant (such as carbohydrates, proteins, and fats).
Market value: the monetary amount for which something can be sold in a given market. As it
pertains to the project, the market value will be utilized in comparing the system’s efficiency.
Mass equivalent of nitrogen: a measure of the amount of nitrogen inoculated into duckweed
tanks in Phase 1; calculated by dividing the desired nitrogen quantity by the nitrogen content of
one gram of nutrient source.
Mechanical maintenance: the maintenance required on a system’s components in order to allow
continuously smooth operation
Micronutrients: a nutrient source that requires less concentration to sufficiently feed the plant
(such as vitamins and minerals)
Off-grid: operates independently of municipal electricity, water, and other utility services, but
most often referred to for electricity.
Omnivorous: capable of eating and deriving nutrients from a varied diet of animals, plants,
algae, and fungi. Often referring to opportunistic feeders.
Operating costs: costs included in addition to the costs of construction and initial materials.
These include maintenance costs, water replacement, fish replenishment.
Peat pots: a cylinder of peat material enclosed in a fine mesh used to cultivate plants.
Pithing: the euthanizing technique by which a blunt needle is thrust into the vertebral canal
resulting in the destruction of the brain and spinal cord. This method of euthanasia is
considered humane and approved.
pH: the measure of acidity or basicity of an aqueous solution. The scale ranges from 0 to 14
where a range of 0 to 7 results in an acidic solution while 7 to 14 results in a basic
solution. Water (pH 7) is considered neutral.
Poultry litter: a by-product of the poultry industry consisting of a mixture of chicken or turkey
feces, bedding material, spilled feed, and feathers.
126
Recirculating: in the context of aquaculture, aquaponics, and agriculture, a system designed to
reuse all water; water only leaves the system through unintended mechanisms such as leaks and
evaporation. Contrast with open-loop.
Rice bran: a by-product of the rice milling process.
Rockwool: an inorganic, sterile material made from molten rock used as a growing medium.
Solution conductivity factor (CF): a measure of a solution’s ability to conduct electricity, as a
function of dissolved salts.
Soybean meal: a solid residue of the production of soybean oil often used as filler in animal
feeds.
Sorghum: a type of grass crop grown in hot, arid regions for the grain which is used for food,
beverage, and fuel production.
Starch digestibility: the amount of the starch that can be converted into useful energy and
nutrients.
Stocking density (high vs. low): amount of fish per unit area, high stocking density requires
high water turnover rate in order for fish to adequately grow. 0.29 fish/gal for UVI
system vs. 0.145 fish/gal for Phase II.
Subsistence: self-sufficiency farming in which the farmer focuses on growing enough food to
feed their families.
Sustainable: able to maintain at a certain rate or level while conserving a balance by avoiding
depletion of natural resources.
Symbiotic: a close, prolonged association between two or more different organisms of a
different
species that may, but does not necessarily, benefit each member.
Toxic ammonia: the unionized form of ammonia (NH3), more of which is present at higher
temperatures and pH values.
Trypsin inhibitor: chemicals that reduce the availability of biologically active trypsin, an
enzyme vital to nutrition in animals.
Turnover rate: indicates the flow rate of the system relative to the capacity of fish tanks. Often
expressed as a factor such as 10x. This indicates the flow rate of the system per hour is ten times
the capacity of the fish tank.
Undernourished: the condition of having too little food for a good level of health and condition.

127
Vascular plants: any plant in which the phloem transports sugar and the xylem transports water
and salts.
Vegetable compost: organic matter, in this case waste from food preparation that has been
decomposed and recycled for use as soil or fertilizer.
Vermiculture: the management of worms, often used for the purpose of composting organic
matter.

128
Appendix O: Reference List
Abdelhamid, A. M. (2011). Intensive rearing of mono-sex Nile tilapia and silver carp under
mono-or poyculture systems at different stocking densities in floating net
cages. Aquaculture, Retrieved from http://en.engormix.com/MA-
aquaculture/articles/tilapia-carp-growth-at-different-stocking-densities-t1708/p0.htm
Alhadhrami, G. A., & Yousif, O. M. (1994). An initial evaluation of camel and cow manures as
dietary ingredients in pelleted feed for blue tilapia (Oreochromis aureus). Bioresource
Technology, 50(3), 265-268. doi:10.1016/0960-8524(94)90100-7
Altieri, M. A., Companioni, N., Cañizares, K., Murphy, C., Rosset, P., Bourque,
M., & Nicholls, C. I. (1999). The greening of the “barrios”: Urban agriculture for food
security in Cuba. Agriculture and Human Values, 16(2), 131–140.
doi:10.1023/A:1007545304561
Amissah, J. G. N., Ellis, W. O., Oduro, I., & Manful, J. T. (2003). Nutrient composition of bran
from new rice varieties under study in Ghana. Food Control, 14(1), 21-24.
doi:10.1016/S0956-7135(02)00047-6
Barrett, J. (2010, May 14). Fish are jumping—off assembly line. The Wall Street Journal.
Retrieved from
http://online.wsj.com/news/articles/SB10001424052748703950804575242594125593702
van Brakel, M. L., & Ross , L. G. (2010). Aquaculture development and scenarios of change in
fish trade and market access for the poor in Cambodia. Aquaculture Research, 42(7),
931–942. doi:10.1111/j.1365-2109.2010.02661.x
Brown, P., Kaushik, S., & Peres, H. (2008). Protein feedstuffs originating from soybeans. In C.
Lim, C. Webster & C.-S. Lee (Eds.), Alternative protein sources in aquaculture diets (pp.
205-223). New York, NY: The Haworth Press, Taylor and Francis Group.
Buttner, J., Flimlin, G., & Webster, D. (1992). Aquculture species for the northeast (No. 130)
[Fact sheet]. Retrieved from darc.cms.udel.edu/AquaPrimer/neaqspeciesnrac130.pdf
Buyukcapar, H. M., & Kamalak, A. (2007). Partial replacement of fish and soyabean meal
protein in mirror carp (Cyprinus carpio) diets by protein in hazelnut meal. South African
Journal of Animal Science, 37(1), 35-44. doi:10.4314/sajas.v37i1.4024
Casal, J. A., Vermaat, J. E., & Wiegman, F. (2000). A test of two methods for plant protein
determination using duckweed. Aquatic Botany, 67(1), 61–67. doi:10.1016/S0304-
3770(99)00093-5
Center for Strategic & International Studies. (2010). The role of markets and trade in food

129
security a report of the CSIS Global Food Security Project. Washington, DC: Hebebrand,
C., & Wedding, K. Retrieved from
http://csis.org/files/publication/100622_Hebebrand_RoleOfMarkets_WEB.pdf
Chamberlain, G., & Rosenthal, H. (1995). Aquaculture in the next century: Opportunities for
growth, challenges of sustainability. World Aquaculture, 26(1), 21–25.
Cofie, O. O., Kranjac-Berisavljevic, G., & Drechsel, P. (2005). The use of human waste for peri-
urban agriculture in northern Ghana. Renewable Agriculture and Food Systems, 20(2),
73-80. doi:10.1079/RAF200491
Commercial facility based on the university of the virgin island’s aquaponic system (2009). In F.
W. Watch (Ed.): Food & Water Watch.
Conover, D. O., Munch, S. B., & Arnott, S. A. (2009). Reversal of evolutionary downsizing
caused by selective harvest of large fish. Proceedings of the Royal Society B: Biological
Sciences, 276(1664), 2015-2020. doi:10.1098/rspb.2009.0003
Dabrowski, K., Poczyczynski, P., Köck, G., & Berger, B. (1989). Effect of partially or totally
replacing fish meal protein by soybean meal protein on growth, food utilization and
proteolytic enzyme activities in rainbow trout (Salmo gairdneri). new in vivo test for
exocrine pancreatic secretion. Aquaculture, 77(1), 29–49. doi:10.1016/0044-
8486(89)90019-7
Davila, J., Marcial-Martinez, L.M., Viana, M.T., and Vazquez-Duhalt, R. (2010). The effect of
broccoli in diet on the cytochrome P450 activities of tilapia fish (Oreochromis niloticus)
during phenol exposure, Aquaculture, 304(1–4), 58-65.
doi:10.1016/j.aquaculture.2010.03.020
DeLong, D. P., Losordo, T.M., & Rakocy, J.E. (2009, June). Tank culture of tilapia (No. 282)
[Fact sheet]. Retrieved from
http://www.extension.org/mediawiki/files/7/78/Tank_Culture_of_Tilapia.pdf
Diver, S. (2006). Aquaponics - integration of hydroponics with aquaculture. Retrieved from
http://www.backyardaquaponics.com/Travis/aquaponic.pdf
Durham, S. (2010). Recirculating water helps aquaculture. Agricultural Research, 58(9), 4–6.
Retrieved from
http://search.ebscohost.com/login.aspx?direct=true&db=bth&AN=55190532&site=ehost-
live
El-Helaly, M. A., & Suloma, A. A. (2012). Influence of aquaculture effluent on broccoli yield
and quality. Australian Journal of Basic and Applied Sciences, 6(11), 505-510.
El‐Saidy, D. M., & Gaber, M. (2005). Effect of dietary protein levels and feeding rates on

130
growth performance, production traits and body composition of Nile tilapia, Oreochromis
niloticus (L.) cultured in concrete tanks. Aquaculture Research, 36(2), 163-171.
El-Sayed, A-F. M. (1990). Long-term evaluation of cotton seed meal as a protein source for Nile
tilapia, Oreochromis niloticus. Aquaculture, 84(3-4), 315-320. doi:10.1016/0044-
8486(90)90096-6.
El-Sayed, A-F. M. (1999). Alternative dietary protein sources for farmed tilapia,
Oreochromis spp. Aquaculture, 179(1–4), 149-168. doi:10.1016/S0044-8486(99)00159-
3
El-Shafai, S. A., El-Gohary, F. A., Verreth, J. A. J., Schrama, J. W., & Gijzen, H. J. (2004).
Apparent digestibility coefficient of duckweed (lemna minor), fresh and dry for Nile
tilapia (Oreochromis niloticus l.). Aquaculture Research, 35(6), 574–586.
doi:10.1111/j.1365-2109.2004.01055.x
Ezeh, A. C., Bongaarts, J., & Mberu, B. (2012). Global population trends and policy options. The
Lancet, 380(9837), 142–148. doi:10.1016/S0140-6736(12)60696-5
Findlay, D. L., Podemski, C. L., & Kasian, S. E. (2009). Aquaculture impacts on the algal and
bacterial communities in a small boreal forest lake. Canadian Journal of Fisheries and
Aquatic Sciences, 66, 1936-1948. doi:10.1139/F09-121.
Fish, Shellfish, Crustaceans and other Aquatic Animals - Fresh, Frozen or Processed - Methyl
Mercury. CPG § 540.600 (2007).
Fitzsimmons, K. (2000). Tilapia aquaculture in Mexico. Tilapia Aquaculture in the Americas, 2,
171–183. Retrieved from http://ag.arizona.edu/azaqua/ista/reports/FitzsimMexico.pdf
Food and Agriculture Organization. (2012). The State of World Fisheries and Aquaculture.
Retrieved from http://www.fao.org/docrep/016/i2727e/i2727e.pdf.
Food and Agriculture Organization. (2013). The State of Food Insecurity in the World. Retrieved
from http://www.fao.org/publications/sofi/en/.
Food and Agriculture Organization. (2014). Low-Income Food-Deficit Countries (LIFDC) - List
for 2013. Retrieved from http://www.fao.org/countryprofiles/lifdc/en/.
Food and Agriculture Organization Fisheries and Aquaculture Department . (2013). Global
aquaculture production statistics for the year 2011 [online].
ftp://ftp.fao.org/FI/news/GlobalAquacultureProductionStatistics2011.pdf
Francis, G., Makkar, H. P. S., & Becker, K. (2001). Antinutritional factors present in plant-
derived alternate fish feed ingredients and their effects in fish. Aquaculture, 199(3-4),
197–227. doi:10.1016/S0044-8486(01)00526-9
131
Fry, R.C. (2011). Measuring feed efficiency: Why and how on the back of a napkin. 2011 Penn
State Dairy Cattle Nutrition Workshop. Workshop conducted from Penn State University,
Grantville, PA.
Cattle Nutrition Workshop. Workshop conducted from Penn State University, Grantville, PA.
Ghanem, H. (2008). The state of food insecurity in the world, 2008: High food prices and food
security: Threats and opportunities. Rome: Food and Agriculture Organization of the
United Nations (FAO). ftp://ftp.fao.org/docrep/fao/011/i0291e/i0291e00.pdf.
Retrieved October 5, 2013
Green, B. (1992). Substitution of organic manure for pelleted feed in tilapia production.
Aquaculture, 101(3-4), 213-222.
Guimarães, I., Pezzato, L., Barros, M., & Tachibana, L. (2008). Nutrient digestibility of cereal
grain products and by-products in extruded diets for Nile tilapia. Journal of the World
Aquaculture Society, 39(6), 781-789. doi:10.1111/j.1749-7345.2008.00214.x
Harston, M. (2007). Naturally grown tilapia fish and certified organically grown herbs and
vegetables using aquaponics. In Boucher, É., Vickerson, A., Couturier, C.
(Eds.), Proceedings of contributed papers and second national freshwater
symposium (pp. 115-116). Retrieved from
http://www.aquacultureassociation.ca/assets/Uploads/AC07-proceedings-final-with-
covers.pdf
Hishamunda, N., Jolly, C., & Engle, C. (1998). Evaluation of small-scale aquaculture with intra-
rural household trade as an alternative enterprise for limited resource farmers: The case
of Rwanda. Food Policy 1998, 23(2), 143-154.
Holden, S., & Shiferaw, B. (2002). Land degradation, drought and food security in a less-
favoured area in the Ethiopian highlands: A bio-economic model with market
imperfections. Agricultural Economics, 30(2004), 3149. doi:10.1111/j.1574-
0862.2004.tb00174.x
Hrubrec, T.C., Smith S. A, & Robertson J.L. (1996). The effect of temperature and water quality
on antibody response to Aeromonas salmonicida in sunshine bass (Morone chrysops ×
Morone saxatilis). Veterinary Immunology and Immunopathology, 50(1-2), 157-166.
doi:10.1016/0165-2427(95)05491-X.
Hughey, T. W. (2005). Aquaponics for developing countries. Aquaponics, 8(38), 16-18.
Hughey, T. W. (2008). Faith and sustainable technologies. Retrieved November 28, 2011, 2011,
from http://www.fastonline.org/
Hunter, P. R., MacDonald, A. M., & Carter, R. C. (2010). Water supply and health. PLOS
Medicine, 7(11), doi:10.1371/journal.pmed.1000361

132
Institute for Food and Development Policy. (1999). Development report no 12: Cultivating
Havana: Urban agriculture and food security in the years of crisis. Oakland, CA:
Murphy, C.
International Monetary Fund. (2014). Commodity market monthly. Washington, D.C.
Retrieved from http://www.imf.org/external/np/res/commod/pdf/monthly/011014.pdf
Jones Jr., J. B. (2012). Hydroponics: A practical guide for the soilless grower. CRC Press.
Jorgensen, B., Meisel, E., Schilling, C., Swenson, D., & Thomas, B. (2009, February).
Developing food production systems in population centers. Biocycle, 50(2), 27-29.
Kassie, M. & Zikhali, P. (2009). Brief on sustainable agriculture: Prepared for the expert group
meeting on sustainable land management and agricultural practices in Africa: Bridging
the gap between research and farmers. Gothenburg, Sweden: University of Gothenburg.
Kaygusuz, K. (2012). Energy for sustainable development: A case of developing
countries. Renewable and Sustainable Energy Reviews, 16(2), 1116–1126.
doi:10.1016/j.rser.2011.11.013
Kikuchi, K. (1999). Use of defatted soybean meal as a substitute for fish meal in diets of
Japanese flounder (Paralichthys olivaceus). Aquaculture, 179(1–4), 3–11.
doi:10.1016/S0044-8486(99)00147-7
Kruchkin, A. (2013). IBISWorld Industry Report OD4012. Hydroponic Crop Farming. Retrieved
March 9, 2014 from IBISWorld database.
Lapere, P. (2010). A techno-economic feasibility study into aquaponics in South Africa. (Master
of Science in Engineering Master's Thesis), University of Stellenbosch, Stellenbosch,
South Africa. Retrieved from http://hdl.handle.net/10019.1/5400. Available from
University of Stellenbosch SUNScholar Research Repository database.
Larsen, J., & Roney, J. M. (2013). Farmed fish production overtakes beef. Retrieved from
http://www.earth-policy.org/plan_b_updates/2013/update114
Leary, S. L., & American Veterinary Medical Association,. (2013). AVMA guidelines for the
euthanasia of animals: 2013 edition.
Leng, R. A., Stambolie, J. H., & Bell, R. (1995). Duckweed - a potential high-protein feed
resource for domestic animals and fish. Livestock Research for Rural Development, 7(1).
Lennard, W. A., & Leonard, B. V. (2006). A comparison of three different hydroponic sub-
systems (gravel bed, floating and nutrient film technique) in an aquaponic test system.
Aquaculture International, 14(6), 539-550. doi:DOI 10.1007/s10499-006-9053-2

133
Liu, Y., & Sumaila, U.R. (2010). Estimating pollution abatement costs of salmon aquaculture: A
joint production approach. Land Economics, 86(3), 569–584.
Lopez Zavala, M.A., Funamizu, N., & Takakuwa, T. (2004) Temperature effect on aerobic
biodegradation of feces using sawdust as a matrix. Water Research, 38(9), 2406–2416.
doi:10.1016/j.watres.2004.02.026
Martins, C. I. M., Eding, E. H., Verdegem, M. C. J., Heinsbroek, L. T. N., Schneider, O.,
Blancheton, J. P., … & Verreth, J. A. J. (2010). New developments in recirculating
aquaculture systems in Europe: A perspective on environmental sustainability.
Aquacultural Engineering, 43(3), 83-93. Retrieved from
http://archimer.ifremer.fr/doc/00021/13190/10273.pdf
Masser, M. P., Rakocy, J. E., & Losordo, T. M. (1999, March). Recirculating aquaculture tank
production systems: Management of recirculating systems (No. 452) [Fact sheet].
Retrieved from http://aqua.ucdavis.edu/DatabaseRoot/pdf/452RFS.PDF
Metcalf, S. S., & Widener, M. J. (2011). Growing Buffalo's capacity for local food: a systems
framework for sustainable agriculture. Applied Geography, 31(4), 1242-1251.
doi:10.1016/j.apgeog.2011.01.008
Moreno, D. A., López-Berenguer, C., Martínez-Ballesta, M. C., Carvajal, M. and García-
Viguera, C. (2008). Basis for the new challenges of growing broccoli for health in
hydroponics. Journal of the Science of Food and Agriculture, 88: 1472–1481.
doi:10.1002/jsfa.3244
Myers, R. A., & Worm, B. (2003). Rapid worldwide depletion of predatory fish
communities. Nature, 423(6937), 280-283. doi:10.1038/nature01610
National Oceanic and Atmospheric Administration Fisheries. (2012a). Aquaculture in the U.S.
Retrieved from http://www.nmfs.noaa.gov/aquaculture/aquaculture_in_us.html.
National Oceanic and Atmospheric Administration Fisheries. (2012b). What is aquaculture.
Retrieved from http://www.nmfs.noaa.gov/aquaculture/what_is_aquaculture.html
Naylor, R. L., Hardy, R. W., Bureau, D. P., Chiu, A., Elliott, M., Farrell, A. P., … & Nichols, P.
D. (2009). Feeding aquaculture in an era of finite resources. Proceedings of the National
Academy of Sciences of the United States of America, 106(36), 15103–15110.
doi:10.1073/pnas.0905235106
Ogunlana, S. O., & Olomolaiye, P. O. (1989). A survey of site management practice on some
selected sites in Nigeria. Building and Environment, 24(2), 191–196.
Ogunlana, S. O., Promkuntong, K., & Jearkjirm, V. (1996). Construction delays in a fast-
growing economy: Comparing Thailand with other economies. International Journal of
Project Management, 14(1), 37–45.
134
Okuthe, I. K., Ngesa , F. U., & Ochola , W. W. (2013). The influence of institutional factors on
the adoption of improved sorghum varieties and technologies by smallholder farmers in
western Kenya .International Journal of Humanities and Social Science, 3(16), 197-206.
Retrieved from
http://www.ijhssnet.com/journals/Vol_3_No_16_Special_Issue_August_2013/22.pdf
Pade, J. S., & Nelson, R. L. (2007). Village aquaponics. Acta Horticulturae (Vol. 742, pp. 197-
200).
Pankhurst, N. W., & Van Der Kraak, G. (1997). Effects of stress on reproduction and growth of
fish. Fish stress and health in aquaculture, 73-93.
Pauly, D., & Watson, R. (2009). The Princeton guide to ecology. (pp. 501-509). Princeton:
Princeton University Press. Retrieved from
http://www.seaaroundus.org/researcher//dpauly/PDF/2009/Books&Chapters/SpatialDyna
micsOfFisheries.pdf
Perry, A., & Rittgers, S. (2004). Aquaponics in Haiti. Aquaponics Journal, (32), 8-15. Retrieved
from http://aquaponicsjournal.com/docs/articles/Lukes-Mission-Aquaponics-in-Haiti.pdf
Pessarakli, K. (2014) Handbook of Plant and Crop Physiology, Third Edition. Boca Raton,
Florida: CRC Press.
Popma, T., & Masser, M. (1999, March). Tilapia: Life history and biology (No. 283) [Fact
sheet]. Retrieved from http://aqua.ucdavis.edu/DatabaseRoot/pdf/283FS.PDF
Rakocy, J. E. (1989, September). Tank culture of tilapia (No. 282) [Fact sheet]. Retrieved from
http://aqua.ucdavis.edu/DatabaseRoot/pdf/282FS.PDF
Rakocy, J.E. (2011). Cultured aquatic species information programme. Oreochromis niloticus.
Cultured Aquatic Species Information Programme. FAO Fisheries and Aquaculture
Department.
Rakocy, J. E., Bailey, D. S., Shultz, R. C., & Thoman, E. S. (2004). Update on tilapia and
vegetable production in the UVI aquaponics system. Informally published manuscript,
Agricultural Experiment Station, University of the Virgin Islands, Kingshill, VI,
Retrieved from http://ag.arizona.edu/azaqua/ista/ista6/ista6web/pdf/676.pdf
Rakocy, J. E., Bailey, D. S., Shultz, R.C., & Danaher, J.J. (2011). A commercial-scale aquaponic
system developed at the University of the Virgin Islands. Informally published manuscript,
Agricultural Experiment Station, University of the Virgin Islands, Kingshill, VI,
Retrieved from http://ag.arizona.edu/azaqua/ista/ISTA9/FullPapers/Rakocy1.doc

135
Rakocy, J. E., Masser, M. P., & Losordo, T. M. (2006, November). Recirculating aquaculture
tank production systems: Aquaponics—integrating fish and plant culture (No. 454) [Fact
sheet]. Retrieved from http://www2.ca.uky.edu/wkrec/454fs.pdf
Ramankutty, N., Foley, J. A., & Olejniczak, N. J. (2002). People on the land: Changes in global
population and croplands during the 20th century. AMBIO: A Journal of the Human
Environment, 31(3), 251-257. doi:10.1579/0044-7447-31.3.251
Ravindran, V. (2013). Poultry feed availability and nutrition in developing countries (FAO
Poultry Development Review). Retrieved from
http://www.fao.org/docrep/013/al706e/al706e00.pdf
Riche, M., & Garling, D. (2003, August). Feeding tilapia in intensive recirculating systems (No.
114) [Fact sheet]. Retrieved from agrilifecdn.tamu.edu/fisheries/files/2013/09/NCRAC-
Fact-Sheet-Series-No.-114-Feeding-Tilapia-in-Intensive-Recirculating-Systems.pdf
Robaina, L., Izquierdo, M. S., Moyano, F. J., Socorro, J., Vergara, J. M., Montero, D., &
Fernández-Palacios, H. (1995). Soybean and lupin seed meals as protein sources in diets
for gilthead seabream (sparus aurata): Nutritional and histological
implications. Aquaculture, 130(2-3), 219-233. doi: 10.1016/0044-8486(94)00225-D
Rojas-Valencia, M. N., Orta de Velásquez, M. T., & Franco, V. (2011). Urban agriculture, using
sustainable practices that involve the reuse of wastewater and solid waste. Agricultural
Water Management, 98(9), 1388–1394. doi:10.1016/j.agwat.2011.04.005
Rusoff, L. L., Blakeney Jr., E. W., & Culley Jr., D. D. (1980). Duckweeds (Lemnaceae family):
A potential source of protein and amino acids. Journal of Agricultural and Food
Chemistry, 28(4), 848–850. doi:10.1021/jf60230a040
Rynk, Robert. (1992). On-Farm Composting Handbook. Ithaca, NY: NRAES-54.
Sadiku, S.O.E., & Jauncey, K. (1995). Digestibility, apparent amino acid availability and waste
generation potential of soybean flour: poultry meat meal blend based diets for tilapia,
Oreochromis niloticus (L.), fingerlings. Aquaculture Research, 26(9), 651-657.
doi:10.1111/j.1365-2109.1995.tb00956.x
Savidov, N., Hutchings, E., & Rakocy, J.E. (2005). Fish and plant production in a recirculating
aquaponic system: A new approach to sustainable agriculture in Canada. Acta
Horticulturae, 1(742), 209-221.
136
Sheriff, N., Little, D. C., & Tantikamton, K. (2008). Aquaculture and the poor—is the culture of
high-value fish a viable livelihood option for the poor?. Marine Policy, 32(6), 1094–
1102. doi:10.1016/j.marpol.2008.03.008
Shiau, S.-Y., Chuang, J.-L., & Sun, C.-L. (1987). Inclusion of soybean meal in
tilapia (Oreochromis niloticus × O. aureus) diets at two protein
levels. Aquaculture, 65(3–4), 251–261. doi:10.1016/0044-8486(87)90238-9
Shiau, S.-Y., Kwok, C.-C., Hwang, J.-Y., Chen, C.-M. and Lee, S.-L. (1989), Replacement of
fishmeal with soybean meal in male tilapia (Oreochromis niloticus X O. aureus) fingerling
diets at a suboptimal protein level. Journal of the World Aquaculture Society, 20, 230–
235. doi:10.1111/j.1749-7345.1989.tb01007.x
Swick, R.A. (2001). Feed based tilapia culture. Singapore: American Soybean Association.
Tyson, R. V., Simonne, E. H., Davis, M., Lamb, E. M., White, J. M., & Treadwell, D. D. (2007).
Effect of nutrient solution, nitrate-nitrogen concentration, and pH on nitrification rate in
perlite medium. Journal of Plant Nutrition, 30(6), 901–913.
doi:10.1080/15226510701375101
Uduma, K., & Arciszewski, T. (2010). Sustainable energy development: The key
to a stable Nigeria. Sustainability, 2(6), 1558–1570. doi:10.3390/su2061558
U.S. Food and Drug Administration. (2012). Recall -- firm press release [Press release].
Retrieved from http://www.fda.gov/Safety/Recalls/ucm311992.htm
Venou, B., Alexis, M. N., Fountoulaki, E., & Haralabous, J. (2006). Effects of extrusion and
inclusion level of soybean meal on diet digestibility, performance and nutrient utilization
of gilthead sea bream (Sparus aurata).Aquaculture, 261(1), 343–356.
doi:10.1016/j.aquaculture.2006.07.030
Veverica, K., Liti, D., Were, E., & Bowman, J. (2001). Fish Yields and economics benefits of
tilapia/calrias polyculture in fertilized ponds receiving commercial feeds or pelleted
agricultural by-products. PD/A CRSP Annual Technical Report, 18(Ninth Work Plan),
27-29. Retrieved from oregonstate.edu website:
http://pdacrsp.oregonstate.edu/pubs/technical/18tch/9FFR2.pdf
Webster, C. D., Tidwell, J. H., Goodgame, L. S., Yancey, D. H., & Mackey, L.

137
(1992). Use of soybean meal and distillers grains with solubles as partial or total
replacement of fish meal in diets for channel catfish, Ictalurus punctatus. Aquaculture,
106(3–4), 301–309. doi:10.1016/0044-8486(92)90262-J
Wee, K. L., & Shu, S. W. (1989). The nutritive value of boiled full-fat soybean in pelleted feed
for Nile tilapia. Aquaculture, 81(3-4), 303–314. doi: 10.1016/0044-8486(89)90155-5
World Food Programme. (n.d.). Who are the hungry?. Retrieved from
http://www.wfp.org/hunger/who-are/.
The WorldFish Center. (2009). Producing tilapia feed locally: A low-cost option for small-scale
farmers [Flyer]. Penang, MY: The WorldFish Center. Retrieved from
http://www.worldfishcenter.org/resource_centre/WF_2462.pdf
Yao, W., Wu, X., Zhu, J., Sun, B., & Miller, C. (2010). Utilization of protein extract from dairy
manure as a nitrogen source by Rhizopus oryzae nrrl-395 for l-lactic acid
production. Bioresource Technology, 101(11), 4132–4138.
doi:10.1016/j.biortech.2010.01.004
Yussefi, M. (2008). The world of organic agriculture: Statistics and emerging trends 2008.
Earthscan.
Wilson, G. (2005). Greenhouse aquaponics proves superior to inorganic hydroponics.
Aquaponics, 8(39), 14-17.
Zeller, M., Diagne, A., & Mataya, C. (1998). Market access by smallholder farmers in Malawi:
Implications for technology adoption, agricultural productivity and crop
income. Agricultural Economics, 19(1-2), 219–229. doi:10.1016/S0169-5150(98)00027-9