abstract.-the geographic variation in cranial … et al.: geographic variation in cranial morphology...
TRANSCRIPT

William F. PerrinSouthwest Fisheries Science Center. National Marine Fisheries SeNice. NOAAP.O. Box 271. La Jolla. California 92038
Gary D. SchnellDaniel J. HoughOklahoma Biological SUNey and Department of BiologyUniversity of Oklahoma. Norman. Oklahoma 73019
Michael E. DouglasOklahoma Biological SUNey and Department of ZoologyUniversity of Oklahoma. Norman. Oklahoma 730 J9Present address: Department of Zoology and Museum
Arizona State University. Tempe. Arizona 85287
Geographic variation incranial morphology of spinnerdolphins Stenella longirostris inthe eastern tropical Pacific Ocean
the coast of Central America and isrelatively large, with relatively longbeak, erect to forward-canted dorsalfin, and monotonic gray coloration.The eastern form is smaller, withshorter beak; it also has the erect orcanted fin and is gray overall, butwith light patches in the axillary andgenital areas. The whitebelly formshave a tripartite color pattern of darkgray, light gray, and (ventrally) white,and the dorsal fin is highly variable,ranging in adults from falc!lte toerect. The northern and southernstocks were divided based on modaldifferences in cranial measurements;the boundary is at the Equator. Theeastern spinner and northern whitebelly spinner stocks overlap broadly;overlap between the eastern spinnerand southern whitebelly spinner isvery slight (Perrin et al. 1985). Dolphins killed in the fishery are identified to stock based on the modal appearance of adults in the school and,in the case of the two whitebellystocks, location.
Most recently, Perrin (1990) described three subspecies of Stenella
Information on geographic variationof dolphins in the eastern tropicalPacific is of intrinsic scientific interest, but also has practical implications because fishermen in the regionkill dolphins in the course of purseseining for yellowfin tuna (Allen1985). Tuna in the region associatewith schools of dolphins, primarilyStenella spp. and Delphinus delphis,and the fishermen set their nets onthe schools to capture the tuna belowthem. In the process, many dolphinsdie, as many as 80,000-125,000 annually in recent years (Hall and Boyer1988, 1989, 1990). The U.S. Government has used a series of management units, or stocks, in regulatingthis exploitation of the dolphins byU.S. vessels. For the spinner dolphin,these have been the eastern spinner,Costa Rican spinner, northern whitebelly spinner, and southern whitebelly spinner stocks (Perrin et al.1985). These divisions are based onmorphology, including body lengthand shape, color pattern, shape of thedorsal fin, and cranial characters.The Costa Rican form occurs close to
Manuscript accepted 9 December 1991.Fishery Bulletin, U.S. 90:54-76 (1992).
54
Abstract.-The spinner dolphinStenella longirostris is widely distributed in the eastern tropical PacificOcean. Geographic patterns in 30 cranial features were determined from246 museum specimens grouped into 25 5° latitude-longitude blocks.Statistically significant sexual dimorphism was demonstrated for one-halfof the cranial characters, with malesgenerally being larger. ANOVAs, aswell as principal components, canonical variates, and cluster (UPGMAand function-point) analyses demonstrated geographic variation in allcharacters. Patterns of geographicvariation in morphology were evaluated for all S. longirostris·specimensusing Mantel tests and matrix correlations; 20 of 30 characters showedsignificant "regional patterning,"while most (25 of 30) exhibited "local"patterning. The latitude-longitudeblock with specimens ofS. l. centroamericana was distinctive in a number of features. Also, eastern spinner dolphins (S. l. orientalis) weresmaller than spinners found to thesouth, southwest, or west. Many ofthe cranial characters exhibited aconcentric pattern of geographicvariation similar to that found byprevious investigators for several external characters. Hawaiian specimens are the largest incorporatedinto this study and, typically, aremore like those from southern localities than animals from geographically closer blocks. The association between morphological characters and13 environmental measures was assessed with Mantel tests and productmoment correlations, revealing statistical concordance of morphologicalpatterns for a number of cranial characters with those for water depth,sea surface temperature in Januaryand July, surface salinity, thermocline depth, and surface dissolvedoxygen. Several of these environmental variables manifest the samedistributional pattern found in manyof the cranial features.

Douglas et al.: Geographic variation in cranial morphology of Stenella longirostris 55
Figure 1Known range of Stenella longiTostris in eastern tropical Pacific Ocean (modified fromPerrin 1990), with numbers of males (above) and females (below) available for each 5°latitude-longitude block (total of 246 specimens). Asterisks indicate 10 blocks includedin analysis of sexual dimorphism. The 25 blocks with two or more specimens used asbasis for analyses of geographic variation; for some aspects. the 10 blocks with singlespecimens projected onto axes based on the 25 blocks. Each block identified by numericalcode (numbers on left and bottom margins are combined; e.g., block 0812 is just to eastof southern tip of Baja California). One block (Le., 06-02) is located off map to west (left).
Data from 246 adult museum specimens (maturityjudged by evaluating fusion of premaxilla with the max-
ilIa at distal end of rostrum; Dailey and Perrin 1973)of spinner dolphins were used·in this investigation (Fig.1). We purposely included all appropriate specimensavailable, including those from the three named subspecies recognized from the region (Perrin 1990); furthermore, we did not differentiate between those withdifferent color patterns ("eastern" and "whitebelly";Perrin et al. 1985, 1991), in order to focus simply oncranial features. The animals used included 188 of 199specimens used in the earlier study of sexual dimorphism (Douglas et al. 1986; the 11 remaining specimensnot used had been incorrectly aged or had inadequatelocality data) and 58 new specimens.
The first set of specimens was measured by M.E.Douglas and the new specimens by W.F. Perrin. Inaddition, Perrin remeasured 81 specimens of spinnerdolphins and spotted dolphins S. attenuata measuredby Douglas. This allowed a comparison to determinewhether measurements were repeatable. Initially, 36morphometric and meristic characters were evaluated(illustrations and character definitions given in Schnellet al. 1985a). Comparisons of measurements taken onthe same specimens by the two investigators indicated
814
11 2 5
- 3 14 2 5
21
,"" 0"
- - 7 2 o.5 4
,0"
1I3 05 07 oe 11 13 15 17 1901
07
oe
01
02
05
04
118
1I3
0IHl2
T.:~-
Materials and methods
longirostris: the pantropical spinner dolphin S. l. longirostrisoccurring in the Central, South,and Western Pacific, Indian, andAtlantic oceans; the CentralAmerican spinner S. l. centroamericana endemic to the coastof Central America and corresponding to the Costa Rican spinner management stock; and theeastern spinner S. l. orientalisendemic to the eastern tropicalPacific off Mexico, Central America, and northern South Americaand corresponding to the easternspinner management stock. Heconcluded that the more offshorewhitebelly forms constitute abroad zone of hybridization orintergradation between the eastern and pantropical forms. Thisview has support from results ofa genetic study; Dizon et al.(1991) found no unique haplotypes in a restriction-enzyme examination of mitochondrial DNAof animals of the eastern andwhitebelly morphological types.
Perrin et al. (1991) reexaminedcolor pattern, body size andshape, and dorsal fin shape with-out a priori assignment of speci-mens to subspecies or management stock. They compared specimens from 50 geographic blocks. The results of their analyses support the taxonomic treatmentby Perrin (1990); the whitebelly forms constitute a complex zone of highly variable animals intermediate between the eastern and pantropical types. Perrin et al.(1991) concluded that the pattern of geographic variation does not justify separation of northern and southern units on morphological grounds alone.
The purpose of the studies reported here was to carryout a parallel analysis of geographical cranial variationin the eastern Pacific, again making no a priori assignment of specimens to subspecies or management stock.We also examined relationships between cranial variation and environmental variables, in an effort to betterunderstand the ecologies of the several forms of spinner dolphins.

56 Fishery Bulletin 90(1), 1992
Table 1Geographic variation and sexual dimorphism in Stenella longrirostris evaluated for 30 characters.
F·valueb Mean'Correction Percentage
Character a Block Sex Male Female factor d difference"
1 Condylobasal L. 22.19·" 0.05 405.9 404.6 0.22 0.322 L. Rostrum (frm.Base) 15.93"· 0.50 258.9 259.4 -0.61 -0.213 L. Rostrum (frm.Pterygoid) 20.71"· 0.01 299.6 299.3 -0.08 -0.114 W. Rostrum (at Base) 15.19"· 2.88 74.2 73.1 0.37 1.445 W. Rostrum (at 1/4 L.) 10.17"· 11.82"· 52.1 50.6 0.67 2.846 W. Rostrum (at 1/2 L.) 9.97·" 10.20" 44.2 42.8 0.65 3.167 W. Premax. (at 1/2 L.) 5.65"· 8.31" 21.4 20.8 0.31 3.028 W. Rostrum (at 3/4 L.) 2.92" 24.96·" 32.5 30.5 1.01 6.349 Preorbital W. 38.05"· 8.67" 139.9 137.5 1.00 1.76
10 Postorbital W. 49.34·" 8.19" 155.7 153.3 0.93 1.5711 Skull W. (at Zygomatic P.) 49.11·" 14.89"· 154.4 151.3 1.27 2.0412 Skull W. (at Parietals) 6.27"· 20.36·" 130.1 127.2 0.10 0.5213 Ht. Braincase 16.56"· 15.52"· 89.1 87.1 0.89 2.2814 L. Braincase 18.71"· 8.09" 101.7 100.3 0.67 1.4715 Max. W. Premax. 6.55"· 0.22 62.9 62.6 0.04 0.3616 W. External Nares 3.88·" 0.09 41.6 41.5 1.40 2.2717 L. Temporal Fossa 4.32"· 9.27" 50.4 48.7 0.82 3.5218 W. Temporal Fossa 9.24·" 17.82"· 40.2 38.2 0.96 5.1619 Orbital L. 6.56"· 0.00 40.7 40.6 -0.01 -0.1320 L. Antorbital P. 12.41"· 11.46"· 42.7 41.4 0.67 3.2721 W. Internal Nares 22.50"· 3.85 43.5 42.7 0.31 1.8122 L. Up. Toothrow 16.23·" 1.12 224.3 225.5 -0.82 -0.5423 No. Teeth (Up.Lf.) 3.39"· 3.88 53.2 52.5 0.42 1.3024 No. Teeth (Up.Rt.) 5.19·" 1.15 52.7 52.3 0.21 0.7625 No. Teeth (Low.Lf.) 2.33· 0.80 51.3 51.1 0.17 0.3926 No. Teeth (Low.Rt.) 2.61" 0.34 51.0 50.9 0.11 0.2927 L. Low. Toothrow 13.99·" 1.00 218.4 219.5 -0.76 -0.5128 Ht. Ramus 21.64·" 13.02"· 55.4 54.1 0.60 2.5129 Tooth W. 3.74·" 13.84"· 2.6 2.5 0.07 5.1030 L. Ramus 18.06"· 0.04 346.8 345.6 0.20 0.35
a Abbreviations: frm. = from; Ht. = height; L. = length; Lf. = left; Low. = lower; Max. = maximum; No. = number; P. = process;Premax. = premaxillary; Rt. = right; Up. = upper; W. = width.
bF-values from main effects two-way analysis of variance (5° block vs. sex) involving 10 blocks (·P<0.05; "P<O.OI; ... P<O.OOl).Total of 170 individuals. Degrees of freedom 9 for among-block variation and 1 for between sexes.
'Unweighted mean for 10 blocks.dAdded to all individual female measurements and subtracted from all individual male measurements to correct for sexual differences."Difference between sexes (males minus females) multiplied by 100, with the resulting value divided by average of male and female means.
that 6 of the original 36 measurements (Le., W. Lf.Premax. [at midline of Nares], W. Rt. Premax. [atmidline of Nares], Separation of Pterygoids, L. Lf.Tympanic CaVity, L. Rt. Tympanic Cavity, and W. atPterygobasioocipital Sutures; abbreviations used inthese and other character names are listed in footnotea of Table 1) should be deleted, because we were notable consistently to repeat these measurements. Forsome other measurements, there were differencesbetween investigators, but the differences were consistent (e.g., one obtained measurements that weresmaller than those reported by the other). Therefore,we calculated regression equations for each of theremaining characters based on the 81 jointly-measured
specimens. These regression equations were used toconvert the measurements from the rest of the initialspecimens to appropriate values for inclusion with themeasurements taken by Perrin. Through these procedures, we developed a data set of 30 characters (listedin Table 1) for 246 specimens.
Only specimens that were largely complete were included in the analysis. Missing values (1.34% of total)were estimated by linear regression ("Missing DataEstimator" program developed by Dennis M. Power,Santa Barbara Mus. Nat. Hist., pers. commun.) ontothe character that explained the greatest proportionof the variance for the variable under consideration.
Specimens then were assigned to 50 latitude-Iongi-
Douglas et al.: Geographic variation in cranial morphology of Stenella longirostris 57
tude blocks, with each geographic block given anumerical code (see Fig. 1). We had specimens from35 blocks, although 10 were represented by only asingle specimen; the other 25 blocks were used as thebasis for most analyses of geographic variation. Whileseveral of the remaining 25 blocks are represented byrelatively small samples, tests for geographic patterning (described below) suggest that, in general, samplevalues are representative of what would be expectedfor these blocks based on their geographic positions.The 50 block size was selected, in part, because it wasjudged that available sample sizes would not permitdetailed analysis of smaller geographic units. Furthermore, migratory movements and related factors wereless likely to significantly influence results when theserelatively large sampling areas were used.
Douglas et al. (1986) showed that S. longirostris inthe eastern tropical Pacific was sexually dimorphic for13 of 36· characters. Because some specimens used inthat analysis were removed and new specimens added(see above), we reanalyzed the data with a two-wayanalysis of variance (ANOVA) for block and sex basedon specimens in 10 blocks that had at least four of eachsex (Fig. 1). We then produced a series of correctionterms to adjust measurements of the larger sex downward and the smaller sex upward, thus producing sexadjusted or "zwitter" measurements (for details on thisadjustment, see Schnell et al. 1985a). These correctionsenabled us to combine specimens for both sexes in anoverall analysis of geographic variation.
Correlation, ordination and clustering
Mter conversion to zwitters, characters were thenstandardized so that means for blocks were zeros andstandard deviations ones. Product-moment correlationswere computed among characters, and the generalassociations among characters were summarized byclustering characters using the unweighted pair-groupmethod with arithmetic averages (UPGMA).
This type of hierarchical cluster analysis also wasperformed to summarize average distance coefficients(Sneath and Sokal 1973) calculated for all pairs ofblocks based on standardized data. Cophenetic correlation coefficients were computed to indicate the degreeto which distances in the resulting dendrogram accurately represented original interblock morphologicdistances.
In addition, we analyzed standardized data using anonhierarchical K-group method called function-pointcluster analysis (Katz and Rohlf 1973; described inRohlf et al. 1979). Blocks are assigned to a seriesof subgroups at a specified level. The value for thew-parameter used by the function-point clusteringmethod was varied. A hierarchical (but not necessar-
ily non-overlapping) system of clusters can be obtainedby conducting the analysis at more than one clustering level. Results are presented in the form of a modified skyline diagram (Wirth et al. 1966) where, for agiven w-value, blocks joined in a common line are inthe same cluster.
Based on standardized data, we constructed scatterdiagrams of blocks projected onto the first two principal components (Sneath and Sokal 1973) extractedfrom a matrix of correlations among the 30 characters.Canonical variates analysis also was applied to determine the subset of variables that show the greatestdegree of geographic variation-in this case, those thatprovide the greatest interblock separation relative tothe degree of intrablock variation (Program P7M ofBMDP; Dixon 1990). Plots of the first two canonicalvariables show the maximum separation of blocks intwo-dimensional space. The original variables, whichin combination exhibited maximum interblock variability, were then subjected to additional analyses.
Mantel test for geographic patterning
Using a test devised by Mantel (1967) and describedby Sokal (1979), we analyzed interlocality variation ineach character to determine whether values are geographically patterned, or vary spatially at random. Thisprocedure enabled us to determine whether differencesin character values between all pairs of samples arestatistically associated in a linear manner with corresponding geographic distances. The observed association between sets of character differences andgeographic distances was tested relative to its permutational variance, and the resulting statistic was compared against a Student's t-distribution with infinitedegrees of freedom. Computations were performedusing GEOVAR, a library of computer programs forgeographic variation analysis written by David M.Mallis and furnished by Robert R. Sokal (State University of New York at Stony Brook).
Character differences were compared first with actual geographic distances (in nautical miles) betweencenters of blocks and then with reciprocals of distances.In evaluations of reciprocals, where distances arescaled in a nonlinear manner, longer distances are considered effectively to be equal, and the portion of thescale involving smaller distances is expanded. Thus, useof reciprocals of distances increases the power of analyses to reveal geographic patterns that are "local" innature (i.e., involving closely placed blocks), whereastests involving nautical-mile distances evaluate"regional" trends. Positive associations of characterdifferences and nautical-mile distances are indicatedby positive t-values, while negative t-values denote suchassociations when reciprocals of distances are used.

58 Fishery Bulletin 9011). J992
Table 2Environmental measurements compiled for each 5° latitude-longitude block.·
1 Sea Current (N., Winter)-Average northern component (in knots) of the surface water current in winter (Innis et al. 1979; theirfig. 2.2).
2 Sea Current (W., Winter)-Average western component (in knots) of the surface water current in winter (Innis et al. 1979; fig. 2.3).3 Water Depth-Average sea depth (in m) (Bartholomew 1975; fig. 122).4 Solar Insolation (Jan.)-Average incoming solar radiation for January (in gm.. cal/cm2; Brunt 1934; table 2).5 Solar Insolation (Annual)-Average annual incoming solar radiation in gm.. cal/cm2; Brunt 1934; table 2).6 Sea Surface Temp. (Jan.)-Average January sea surface temperature (in °C; Robinson 1976: fig. 2 north of 50S; Wyrtki 1974:
fig. 2 south of 50S).7 Sea Surface Temp. (July)-Average July sea surface temperature (in °C; Robinson 1976: fig. 74 north of 50S; Wyrtki 1974: fig.
8 south of 50S).8 Sea Surface Temp. (Ann. Var.)-Average annual sea surface temperature variation (in °C; Robinson 1976: fig. 148 north of 50S;
Wyrtki 1974: fig. 26 south of 50S).9 Oxygen Min. Layer (Depth)-Annual mean depth (in m) of the absolute oxygen minimum surface with respect to the vertical (Levitus
1982: fig. 52).10 Surface Salinity-Average salinity (0/00) of surface sea water (Levitus 1982: microfiche F-02, frames 2-5).11 Thermocline Depth (Winter)-Mean depths (in m) to the top of the thermocline for January, February, and March (Robinson 1976:
figs. 12, 24, and 36 north of 50S; Cromwell 1958: fig. la south of 50S).12 Thermocline Depth (Summer)-Mean depths (in m) to the top of the thermocline for July, August, and September (Robinson 1976:
figs. 84, 96, and 108 north of 50S; Cromwell 1958: fig. lc south of 50S). .13 Surface Dissolved Oxygen-Annual mean dissolved oxygen (mL/L) of surface sea water (Levitus 1982: microfiche F-03, frames 2-5).
• Abbreviations: Ann. Var. =Annual variation; Jan. =January; Min. =Minimum; N. = North; Temp. =Temperature; W. =West.
As an example of the Mantel procedure, consider the25 blocks for which two or more specimens wereavailable (Fig. 1). The geographic distances (in nauticalmiles) between each pair of the 25 blocks (300 pairstotal) are computed. We then obtain the mean valuefor a given morphological character for each block; consider a character with large mean values in northernblocks, a gradual change as one proceeds south, andthe smallest means in the most southerly blocks. Wecalculate the absolute character difference for each pairof blocks (300 difference values); in general, for thishypothetical case, close blocks geographically exhibitsmall differences in character means, while blocks farapart (e.g., a northern and a southern block) have thelargest morphological differences. We and the Manteltest would identify this morphological character as having a strong regional pattern. We also compare reciprocals of geographic distance for each block pair withcorresponding morphological differences; this approachindicates whether, in general, geographically closeblocks also are similar morphologically (a case of localgeographic patterning). The examplar morphologicalcharacter, thus, would be identified as displaying astrong local pattern (in addition to the strong regionalpattern). In general, a character showing a regionalpattern (as we have defined it) also will exhibit a localpattern, but the reverse is not necessarily true. For instance, if the morphological character was large in boththe north and south, was small for blocks in the middle,
and had gradual changes between adjacent blocks, itwould have a strong local pattern but no regional pattern (because many distant blocks are nearly identicalmorphologically). Detailed computational examples ofthe Mantel test can be found in Douglas and Endler(1982), Schnell et al. (1985b), and Manley (1985).
We also computed matrix correlations (Sneath andSokal 1973) between character differences and theassociated geographic distances or reciprocals of distances between localities. The significance of thesecoefficients cannot, however, be tested in the conventional way, because all pairs of localities were used andthese are not statistically independent. However, theresulting values are useful as descriptive statistics indicating the degree of association of difference values.
Morphological-environmental covarlatlon
Relatively little is known about the relationship (if any)of geographic variation in morphological characteristicsof S. longirostris to differences in the environment.Therefore, as an initial exploratory analysis of covariation, we have calculated product-moment correlations of block means for morphological characters withenvironmental variables. Data were available for 13environmental variables for the eastern tropical PacificOcean (Table 2). We also used UPGMA to summarizeassociations among these environmental variablesfor 51 blocks with specimens of S. longirostris or

Douglas et al.: Geographic variation in cranial morphology of Stene/la longirostris 59
Figure 2 .Correlations among characters based on character means for 25 blo<:ks. Cluste~mg ~er
formed using UPGMA on absolute correlations among characters (I.e., negative SIgnS
removed). Cophenetic correlation coefficient is 0.74.
0.75
Correlallon
Correlation, ordination and clustering
Figure 2 summarizes associations among charactersbased on means for the 25 blocks. Virtually all of theintercharacter correlations were positive in sign; a fewindicated weakly negative associations. For the clusteranalysis, absolute character correlations were analyzed(Le., sign of correlation ignored), be~au.se we wantedto assess simply the degree of covanatlOn. The character showing the most distinctive pattern relative to
Results
Sexual dimorphism
In the two-way ANOVA for block and sex, only threemeasurements showed a significant interaction forblock and sex (W. Rostrum [at Base], L. TemporalFossa and No. Teeth [Up.Lf.]). All characters exhibitedsignificant variation by block (Le., geographic variation), and 15 of the 30 characters displayed significantsexual dimorphism (Table 1). For most characters,males are larger than females. Character differencesbetween sexes range up to 6.34% (see Table 1), withthe most dimorphic character being W. Rostrum (at3/4 L.).
0.50,1 Condylob.sal L.2 L. Roslrum(frm.Base)
30 L. Ramus3 L. Roslrum(frm.Plerygold)
22 L. Up. Toolhrow27 L. Low. TooIhrow23 No. Teelh(Up.U.)24 No. Teelh(Up.Rl.)25 No. Teelh(Low.U.)26 No. Teelh(Low.Rl.)
L- 19 OrbllalL.
r---- 4 W. Roslrum(.1 Base)5 W. Roslrum(all/4 L.)6 W. Roslrum(al 1/2 L.)9 Preorbilal W.
10 Poslorbilal W.t 1 Skull W.lal Zygomatic P.)14 L. Braincase
'-----28 HI. RemusL..- 20 L Anlorbnal P.
L.... 18 W. Temporal Fossa
r_~=~=====:15 Max. W. Premax.12 Skull W.lal Parlelals)13 HI. Braincase
L----------21 W.lnlernalNares
L-----e======== 7 W. Premax.(aII/2L.)8 W. Roslrum(al3/4 L.)L. 17 L. Temporal Fossa
L----------------18 W. External NaresL------29
ToolhW.
0.25,
S. attenuata or both; since thesetwo dolphin species have broadly overlapping distributions inthe eastern tropical Pacific, theblocks used are representative ofareas inhabited by S. longirostris.
We conducted a principal components analysis of the 13 environmental variables for the 51blocks in order to obtain summary variables that reflect overall environmental trends. Individual blocks were projected ontothe resulting environmental principal components based on standardized data. These block variables were used as compositeenvironmental variables forcomparisons with morphologicalcharacteristics.
In addition to using matrix correlations and the Mantel procedure to test for local and regionalpatterning of variation in individual morphological characters, wecompared difference patterns ofselected morphological measureswith those of environmental vari-ables. In these tests, differencesbetween each pair of blocks for a morphological variable were compared with those for an environmentalvariable.
Sources for environmental data are expanded overthose used by Schnell et al, (1986: table 2) so as to accommodate the broader geographic representationresulting from increased numbers of specimens. Valuesfor depth of the oxygen minimum layer were taken forall blocks from Levitus (1982). Data for sea surfacetemperatures and thermocline depths were not available in the previously used source for blocks west of1200
• Data for these and other blocks north of 50 S weretaken from Robinson (1976). Overlapping blocks fromthe two sources for each environmental variable wereused to produce regression equations. Previous datafor blocks south of 50 S were converted using theseregression equations. Overall, agreement of data.foroverlapping blocks from the two sources was relatIvely good. Correlations for sea surface temper~t~res
were: January, 0.956; July, 0.951; annual vanatI?n,0.929. Thermocline depth in winter had a correlatIonof 0.840, while that for summer values was lower(0.767). All correlations were statistically significant(P<O.OOl), and the associations of values from the twosources were basically linear.

60 Fishery Bulletin 90(1). 1992
Table 3Principal component loadings for Stenella longirostris involving character means for 25 blocks.
Component· Component·
Character I II Character II
1 Condylobasal L. 0.914 -0.325 16 W. External Nares 0.573 -0.0452 L. Rostrum (frm.Base) 0.872 -0.397 17 L. Temporal Fossa 0.575 0.0403 L. Rostrum (frm.Pterygoid) 0.885 -0.396 18 W. Temporal Fossa 0.647 0.5994 W. Rostrum (at Base) 0.856 0.083 19 Orbital L. 0.782 -0.0645 W. Rostrum (at 1/4 L.) 0.838 0.242 20 L. Antorbital P. 0.849 0.1086 W. Rostrum (at 1/2 L.) 0.880 0.248 21 W. Internal Nares 0.631 0.4277 W. Premax. (at 1/2 L.) 0.578 0.044 22 L. Up. Toothrow 0.864 -0.4268 W. Rostrum (at 3/4 L.) 0.508 0.504 23 No. Teeth (Up.Lf.) 0.608 -0.6809 Preorbital W. 0.938 0.255 24 No. Teeth (Up.Rt.) 0.688 -0.593
10 Postorbital W. 0.917 0.344 25 No. Teeth (Low.Lf.) 0.600 -0.66611 Skull W. (at Zygomatic P.) 0.916 0.359 26 No. Teeth (Low.Rt.) 0.652 -0.63012 Skull W. (at Parietals) 0.331 0.659 27 L. Low. Toothrow 0.814 -0.46713 Ht. Braincase 0.625 0.719 28 Ht. Ramus 0.872 0.21914 L. Braincase 0.881 0.326 29 Tooth W. 0.216 0.75215 Max. W. Premax. 0.811 0.042 30 L. Ramus 0.877 -0.366
• Relatively high loadings highlighted in bold as follows: (component I» 10.81; (II» 10.61.
Figure 3Projections of blocks onto first two principal components based on 30 characters. Solidsymbols indicate 25 blocks on which analysis conducted. Open symbols represent blockswith only single specimens, which were projected onto axes generated from 25 blockswith two or more specimens.
....,
• GSO!
."".0000' o oe·02....
C°:S~~17.°215.°117..,. • .,111 0 0101
.05IS 0°410 .... 0315 02~ 0311 .0116 00..
•• 07o, .0313.0614 ..".0113 0°206
.0612.061! ...,
.0411 0 0 0604
.. 0702
.0912
.°511
Component I
other morphological characters isTooth W. In addition, correlations of L. Temporal Fossa andW. External Nares with othercharacters are relatively low.The rest of the characters areplaced in two groups. The firstcluster (characters listed between1 and 19 at top of Fig. 2) includeslengths involving the anteriorportion of the skull, tooth numbers, and Orbital L. The secondgroup (characters 4 to 8 as listedin Fig. 2) includes a variety ofskull widths, dimensions of thebraincase, and Ht. Ramus.
Character loadings of a principal components analysis using25 blocks are presented in Table3. The first component explained57.0% of the total charactervariance and the second 18.5%(cumulative total of 75.4%). Projections of all blocks onto thesecomponents are shown in Figure3, while Figure 4 is a map summarizing geographically the projections onto the first component.This component, which reflectsgeneral skull size, has relatively
1.5
1.0
=C 0.5mc0Q.E
0.00U
-0.5
-1.0-1.5 -1.0 -0.5 0.0 0.5 1.0 1.5 2.0

Douglas et al.: Geographic variation in cranial morphology of Stenella longirostris 61
o'
19
0.0I
17
0.5
'5
ii 1\
13
i
1.0I
11
o Ov
Distance
09
1.5,
07
,...
05
2.0I
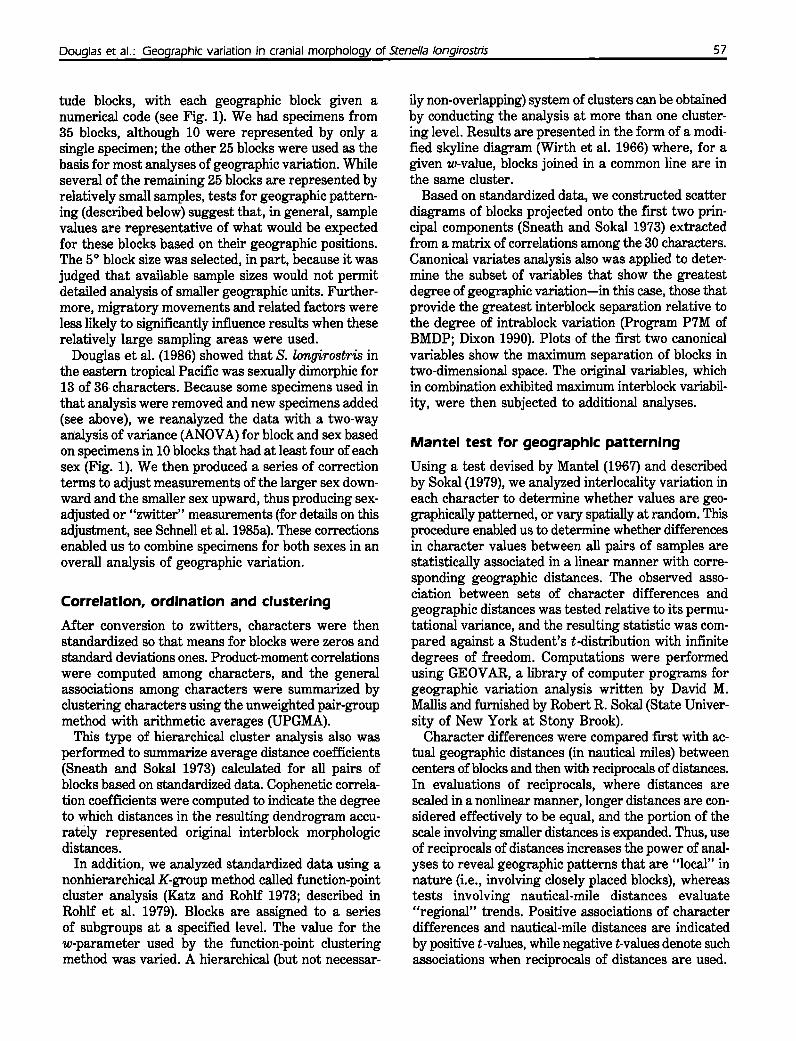
division results with smaller w-values (see Fig. 6A).A similar analysis (Fig. 6B) was conducted using
the five characters-Postorbital W, L. Rostrum (frm.
.---------0115,-----0117L..----0215
L..----0215.--------0313'------0508
L..--------0315'-----------0802
L------------0516,....------0411.--------- 0615'-------0812.--------0505
--0612L-...J L ---0614
'-----0613,-----0417'-----0512
'-------0514L..--- 0513
L..-------0506,-------0505·'L 0509
L..--------------OS07L.-------------------0702
03
,60"
Figure 5Distance phenogram summarizing UPGMA clustering of 25 blocks based on30 characters. Cophenetic correlation is 0.80.
2.5
01
n,·55.0.25
·1.15
PrincipalComponent I
Figure 4Geographic variation in principal component I. Bar represents range (low to high blockvalues), and midpoint is marked. Darkened part of bar indicates value for particular block.
0'
02
04
03
05
,~ '~~ I~( \r1---4-+-1--+-+-t----l--+--+--t--+-l'\i'I"",,)..O
08 .•, ( f,~
I ~~WL Q~~I--+-+-+--t--+-+-t--lt-t-+--t--+---+--+.....:::.r~
0000\ ~~-+--1--f-~+--+--+-t-+--+--+-t-+--+-+-I-~\--1;;:--1 ,o'
OQ~O~~~
05
07
09
high correlations (Table 3) withall characters except Tooth Wand Skull W (at Parietals). Localities to the right in Figure 3 arefrom the Hawaiian Island area(0702 and 0802; see Fig. 4), wl:J,ereanimals are larger. Specimensfrom southern blocks (e.g., 0116,0117,0313) also are larger thananimals from other parts of therange. Blocks to the left in Figure 3, with negative loadings oncomponent I, have sIllaller individuals. In general, S. longirostris from the northeastern blockswere the smallest (e.g., 0515,0613, 0612).
Component II has its highestpositive correlations with SkullW·(at Parietals), Ht. Braincase,and Tooth W; it has negativeassociations with characters 23-26, which involve numbers ofteeth. Block 0507 is the most extreme, with a positive projectionon this component (see Fig. 3);animals from this block haverelatively wide skulls and re-duced numbers of teeth. In con-trast, block 0516 is at the other extreme,with relatively narrow skulls and greaternumbers of teeth.
Figure 5 is a dendrogram depictingresults from a UPGMA cluster analysisof the 25 geographic blocks. Four mainclusters are evident, with block 0702being the most divergent and in its owncluster. Block 0507 also is in a cluster byitself. The first group in the diagram (i.e.,blocks 0116 through 0516 at top of Fig.5) includes predominantly southern andwestern localities. Those in the largestcluster (listed from block 0411 to 0509 inFig. 5) are situated to the north and/oreast.
A modified skyline diagram (Fig. 6A)resulting from function-point clusteringfor 25 blocks based on 30 characters indicates an initial separation of block 0702(which includes part of Hawaii) from theothers. At a w-value of 3.50, there arethree clusters: (1) block 0702; (2) thesouthern blocks in addition to blocks 0508 and 0802;and (3) the remaining northern and eastern blocks, including those just north of the Equator. Further sub-
62
Pterygoid), W. Internal Nares, W. Premax. (at 1/2 L.),and W. Rostrum (at Base)-that, in combination, werebest for discriminating among blocks (based on canon-
A 1.50 ••••_ •••••• _ •••••••••1.70 ••• • ••••_ ••••••••
1~ •• •• • ••••••~o ••• •••••2.30 •• ••
G~5O •• ••a~70 •• ••~ 2.90 • ••~ 3.10 • •
3.30 •3.50 •3.70 ••3.90 •
4.10 •4.30
o 0 0 0 0 0 0 0 0 0 0 0 0 0 000 0 0 0 0 0 0 0 0781 321 2 5 3 5 4 5 6 6 6 6 5 4 5 6 5 5 5 5 5001 1 1 1 101 1 1 1 1 111 1 1 1 1 000 1 02 263 6 756 5 4 7 2 5 3 2 4 5 1 3 2 5 9 6 6 7
Blocks
••••••••••
o 0 0 0 0 0 0 0 0 0 0 0 0 0 0 0 0 0 0 0 0 0 0 0 07 8 3 1 3 2 5 2 1 5 555 5 4 5 5 5 6 6 6 6 548001 1 1 101 101 001 101 1 1 1 1 1 1 1 12 2 5 8 3 6 8 5 756 764 7 9 3 2 5 4 235 1 2
Blocks
Fishery Bulletin 90P I. 1992
ical variates analysis reported below). With a w-valueof 1.79, block 0702 is separated from the remainingblocks. Note that four groups were formed when usinga 1.47 w-value; there are two single-block groups (i.e.,0702 and 0802). When the w -value was lowered to 1.37,the same groups were formed, except that 0315 wasin its own group and 0802 joined with a group ofpredominantly southern localities. With a 1.26 w-value,the clusters are the same except that block 0505 joinsthe northeastern blocks instead of those from the south.Three groups were formed with a 1.15 w-value: (1)block 0702; (2) a group of eight blocks, including southern blocks in addition to 0508, 0505, and 0802; and (3)the northern and eastern blocks, including 0411 and0417, as well as 0506, 0507, and 0509. At smallerw-values, there is further subdivision.
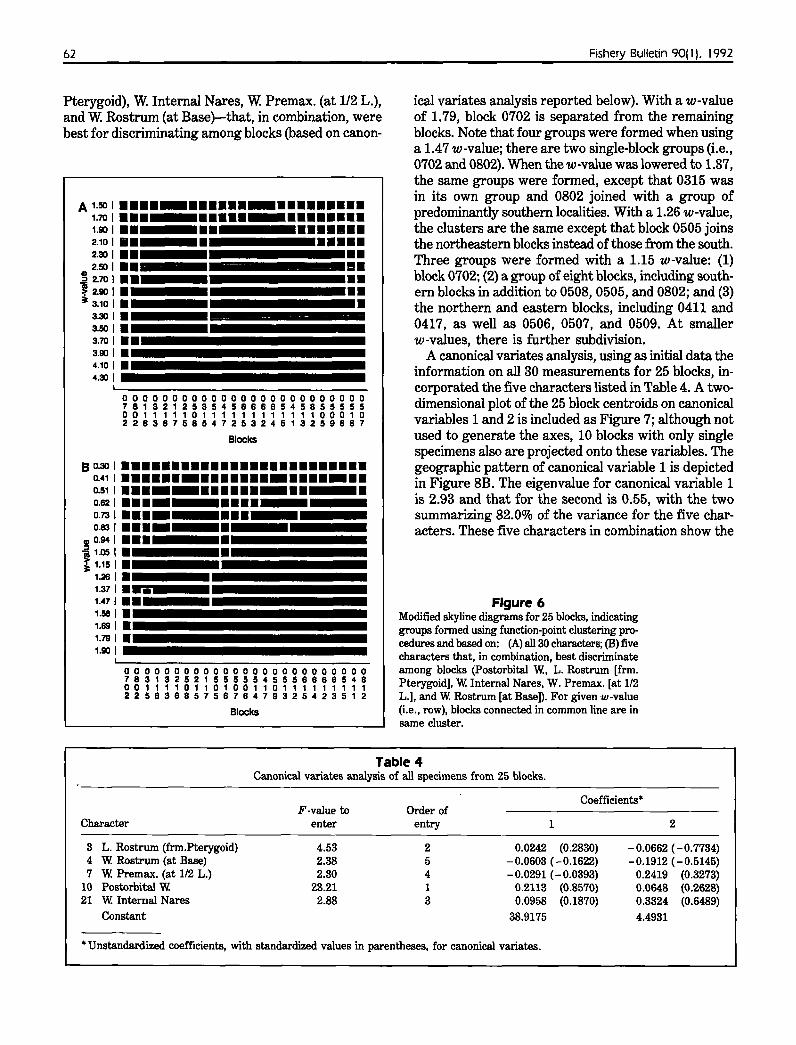
A canonical variates analysis, using as initial data theinformation on all 30 measurements for 25 blocks, incorporated the five characters listed in Table 4. A twodimensional plot of the 25 block centroids on canonicalvariables 1 and 2 is included as Figure 7; although notused to generate the axes, 10 blocks with only singlespecimens also are projected onto these variables. Thegeographic pattern of canonical variable 1 is depictedin Figure 8B. The eigenvalue for canonical variable 1is 2.93 and that for the second is 0.55, with the twosummarizing 82.0% of the variance for the five characters. These five characters in combination show the
Figure 6Modified skyline diagrams for 25 blocks, indicatinggroups formed using function-point clustering procedures and based on: (A) all 30 characters; (B) fivecharacters that, in combination, best discriminateamong blocks (Postorbital w., L. Rostrum [frm.Pterygoid]. W. Internal Nares. W. Premax. [at 1/2L.], and W. Rostrum [at Base]). For given 'w-value(Le., row), blocks connected in common line are insame cluster.
Table 4Canonical variates analysis of all specimens from 25 blocks.
Character
3 L. Rostrum (frm.Pterygoid)4 W. Rostrum (at Base)7 W. Premax. (at 1/2 L.)
10 Postorbital W.21 W. Internal Nares
Constant
• Unstandardized coefficients, with standardized values in parentheses, for canonical variates.

Douglas et al.: Geographic variation in cranial morphology of Stenella longirostris 63
Figure 7Projections of blocks onto first two canonical variables based on 30characters. Solid symbols indicate 25 blocks on which analysis conducted. Open symbols represent blocks with only single specimens,which were projected onto axes generated from 25 blocks with twoor more specimens.
Morphologlcal-envlronmental covar'atlon
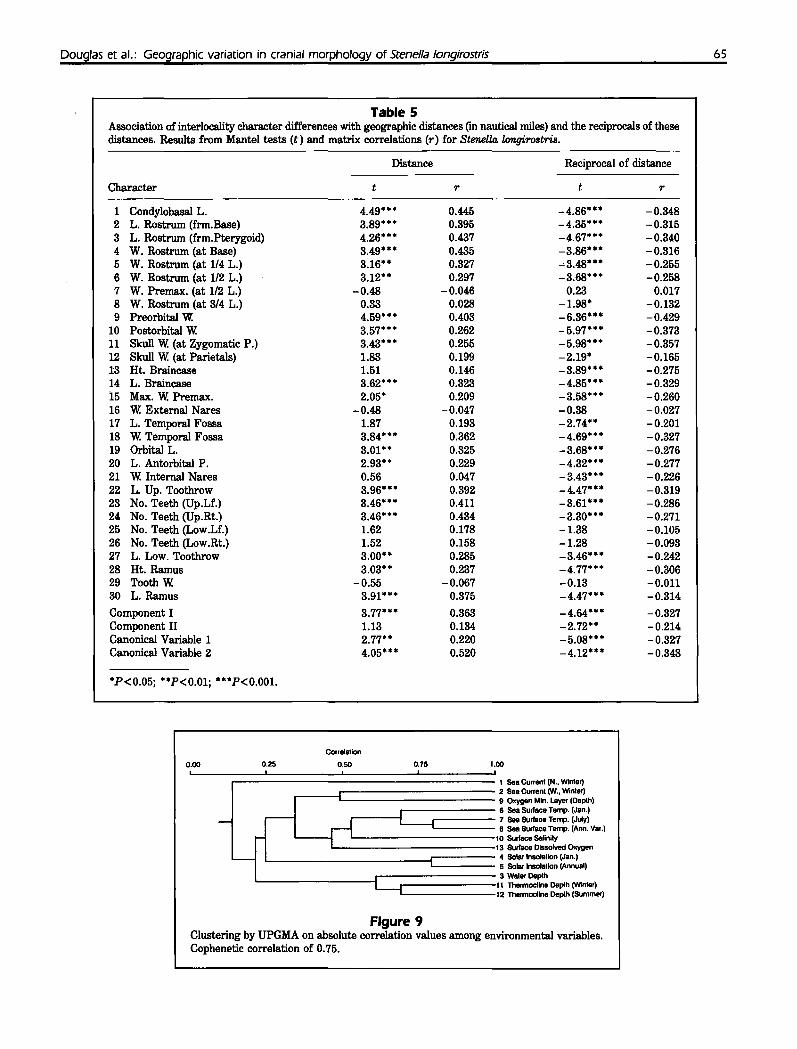
Figure 9 is a dendrogram indicating absolute correlations among the 13 environmental variables, subdividing them into five clusters. Sea Current (N.,Winter) is in a group by itself and quite different fromthe others. Sea Current (W, Winter) and Oxygen Min.Layer (Depth) are in the second cluster, which joinswith a group of five variables involving surface measures of temperature, oxygen, and salinity. The fourthcluster involves two measures of solar insolation, andthe fifth reflects aspects of water depth.
The loadings of environmental variables on the firstthree environmental principal components are givenin Table 6. The first component statistically explains33.0% of the total character variance, the second23.2%, and the third 15.8% (cumulatively 72.0%). Maps(Fig. 10) depict projections of the 25 blocks with twoor more S. longirostris onto the first two environmental components. Environmental component I has relatively high values for blocks between 50 and 15oN, withintermediate values to the north and low values southof the Equator (Fig. lOA). Sea Surface Temp. (July)
JIIOSD7 00312
~"~ "DO
"",.... .'2:::'•as,s OSOI Il DIlO .... 0117
:131 04:,~
..,. 03'" 1,,- Dom
'1..,•
06131011206'..0115
.0511.IM11 .0:315
0-0""
• 0111 0 .... .....0 ....
.....
Canonical Variable 1
54321o-5
-3 -2 -1
3
2
C\I
lD..c 0as.;::as> -1tU.~r::: -20r:::asU ·3
-4
greatest among-group variability relative to thatwithin groups and are used for more detailed comparisons with environmental variables (presentedbelow).
As indicated in Table 4, the first canonicalvariable is most influenced by Postorbital W. (Fig.8A). In Figure 7, blocks that are large for thischaracter are to the right, while those that aresmall are to the left. When considering only thoseblocks with more than one specimen (Le., thoseshown with solid symbols in Fig. 7), the two blocksfrom the vicinity of the the Hawaiian Islands(0802 and 0702) are to the right, as are blockspredominantly from the southern portion of therange. The blocks with single specimens (whichtend to be more westerly) also are to the right.Specimens from blocks to the north and east aresmaller; they are depicted to the left in Figure7. Some west-central blocks group with thesouthern blocks, while others are intermediate orgroup with those to the northeast. The secondcanonical variable contrasts blocks from theHawaiian Island area (0702, 0802) with the others(see Fig. 7); in the characters reflected by thisvariable, values of block 0812 (which is northern,but to the east) show some similarities to thosefor 0702 and 0802.
Mantel test for geographic patterning
Individual characters were evaluated with respectto geographic patterning using Mantel tests, aswell as matrix correlations that compare interblock geographic distances (or reciprocals of thesedistances) and character differences between localities.Of the 30 characters, 66.7% (20) show statisticallysignificant regional patterning indicating that geographic distances (in nautical miles) and interblockcharacter differences are interrelated (Table 5). Formeasures showing significant t-values the greatestcharacter differences tend to be between blocks thatare farthest away from each other, while nearerlocalities are more similar.
Local patterning, as indicated by a significant negative association of distance reciprocals and characterdifferences, was found in 83.3% (25) of the characters(Table 5). All characters that showed regional patterning also exhibited local patterning.
Principal component projections also were assessedin terms of geographic patterning. As indicated at thebottom of Table 5, component I (Fig. 4) has strongregional and local patterning; component II has significant local patterning. Canonical variables 1 (Fig. 8B)and 2 both exhibit marked regional and local patterning (Table 5).

64 Fishery Bulletin 9011). J992
Figure 8Geographic variation in (A) Postorbital W. and (B) canonical variable 1. Darkened partof bar indicates value for particular block.
has a high positive loading on component I, while thatfor Sea Surface Temp. (Ann. Var.) is negative. Fiveother variables have relatively high correlations withthis component (Table 6). The second environmental
,so" I'D' ,,..~
'oo'r .'" \r.,J ~Iij
,,~?I~
jO c.l,.t
0 0 00\ ,.)2.
i QQi 0 0 0 0O~~~'D'
0 0)B ~ D'
Canonical Variable 1 i j': .,
~3.'0 i i 1\ 'D'0.49
-2.12 I I \.I
,so" I'D' ,,..,~\ 'oo'r ."
\~i'\\
..J ~O< "
P':.~
1° ~~~L c. ~J:
0 000'\ .,.)2.
~~'0'
j .. i i 0 0 0 Q0 00 Q)
A ~ D'
Postorbital W. i j':~
W'65.71T11Tl i i 1\ '0'155.8
145.9 I I \.I
19
19
17
17
component has high values forthe two blocks adjacent to theHawaiian Islands (Fig. lOB). withintermediate values in otherwestern blocks. Strong negativeprojections on this componentare found for blocks along thecoast of South and CentralAmerica just north of the Equator. The most substantial loadings on this component are forthe two thermocline variables(Table 6), while Water Depth andSurface Salinity also exhibitrelatively high positive projections for component II. Environmental component III reflectsmainly Solar Insolation (Annual),with Solar Insolation (Jan.) alsohaving a relatively high positiveloading (Table 6). The mostextreme negative projection forcomponent III is for the northern block near the coast (Le.,0812), with the highest positiveprojects for blocks in the westcentral portion of the study area(Le., 0505 through 0509). Ingeneral, other blocks have relatively high projection values,except for 0802 (which is somewhat lower). Other componentsbeyond the first three tended torepresent only single environmental variables.
Several of the environmentalmeasures showed few or no statistical associations with morphological characters (and resulting principal components orcanonical variables), while othersexhibited significant covariation(Table 7). The first environmental variable, Sea Current (N.,Winter), is not significantly correlated with any of the 30 morphological measures. The othercharacter summarizing sea-current information, Sea Current(W,Winter), has a geographicpattern showing relatively weak
statistical concordance with eight of the morphological characters. Toothrow lengths and three of thefour tooth counts are among those with significantassociations.
15
'"
13
. '3
11
11
09
09
07
07
05
05
03
03
01
01
01
05
04
07
03
06
08
02
09
01
02
03
04
05
01
08
os
09
Douglas et al.: Geographic variation in cranial morphology of Stenella /ongirostris
Table 5Association of interlocality character differences with geographic distances (in nautical miles) and the reciprocals of thesedistances. Results from Mantel tests (t) and matrix correlations (r) for Stenella longirostris.
Distance Reciprocal of distance
Character r r
1 Condylobasal L. 4.49**" 0.445 -4.86*"* -0.3482 L. Rostrum (frm.Base) 3.89**" 0.395 -4.35**" -0.3153 L. Rostrum (frm.Pterygoid) 4.26*" * 0.437 -4.67*"* -0.3404 W. Rostrum (at Base) 3.49*"* 0.435 -3.86*"* -0.3165 W. Rostrum (at 1/4 L.) 3.16*" 0.327 ~3.48**" -0.2556 W. Rostrum (at 1/2 L.) 3.12*" 0.297 -3.68*"* -0.2587 W. Premax. (at 1/2 L.) -0.48 -0.046 0.23 0.0178 W. Rostrum (at 3/4 L.) 0.33 0.028 -1.98* -0.1329 Preorbital W. 4.59*"* 0.403 -6.36*"* -0.429
10 Postorbital W. 3.57**" 0.262 -5.97*"* -0.37311 Skull W. (at Zygomatic P.) 3.43*"* 0.255 -5.98**" -0.35712 Skull W. (at Parietals) 1.83 0.199 -2.19* -0.16513 Ht. Braincase 1.51 0.146 -3.89**" -0.27514 L. Braincase 3.62*"* 0.323 -4.85**" -0.32915 Max. W. Premax. 2.05* 0.209 -3.58**" -0.26016 W. External Nares -0.48 -0.047 -0.38 -0.02717 L. Temporal Fossa 1.87 0.193 -2.74*" -0.20118 W. Temporal Fossa 3.84**" 0.362 -4.69**" -0.32719 Orbital L. 3.01*" 0.325 -3.68*"* -0.27620 L. Antorbital P. 2.93*" 0.229 -4.32**" -0.27721 W. Internal Nares 0.56 0.047 -3.43*"* -0.22622 L. Up. Toothrow 3.96*"* 0.392 -4.47**" -0.31923 No. Teeth (Up.Lf.) 3.46*"* 0.411 -3.61*"* -0.28624 No. Teeth (Up.Rt.) 3.46**" 0.434 -3.30**" -0.27125 No. Teeth (Low.Lf.) 1.62 0.178 -1.38 -0.10526 No. Teeth (Low.Rt.) 1.52 0.158 -1.28 -0.09327 L. Low. Toothrow 3.00*" 0.285 -3.46*"* -0.24228 Ht. Ramus 3.03*" 0.237 -4.77*"* -0.30629 Tooth W. -0.55 -0.067 -0.13 -0.01130 L. Ramus 3.91**" 0.375 -4.47*"* -0.314
Component I 3.77**" 0.363 -4.64**" -0.327Component II 1.13 0.134 -2.72*" -0.214Canonical Variable 1 2.77*" 0.220 -5.08**" -0.327Canonical Variable 2 4.05**" 0.520 -4.12*"* -0.343
*P<0.05; *"P<O.OI; *"*P<O.OO1.
65
0.00 0.25
Correlation
0.50 0.75 1.00
-
'-----;:==============~===== 1 SeaCurrent(N.. Wlntar)
r---lC:::C:::C:::C:::C:::C:::C:::C:::C:::C:::C:::: 2 Saa Current (W.O Winter)9 Oxygen Min. Layer (Oaplh),..----r---===== 6 Saa Surfaca Temp. (Jan.),....---L-rt 7 Sea Surfaca Temp. (JUy)
'------ 6 Sea Surface Temp. (linn. Var.)'------------10 Surfaca Salinity
'-------------13 Surfaca Dillsolved Oxygen
L--------------i===== 4 SClarlnsolalion (Jan.)5 Selar Insolallon (Annual)
L---------r--======= 3 WalarOopih.-------11 Thermocllna Ooplh (Winter)'--------12 Tharmoclina Ooplh (Summl'l)
Figure 9Clustering by UPGMA on absolute correlation values among environmental variables.Cophenetic correlation of 0.75.

66 Fishery Bulletin 90P I. J992
Table 6Principal component loadings for environmental variables.
Component·
Environmental variable
1 Sea Current (N.,Winter)2 Sea Current (W.,Winter)3 Water Depth4 Solar Insolation (Jan.)5 Solar Insolation (Ann.)6 Sea Surface Temp. (Jan.)7 Sea Surface Temp. (July)8 Sea Surface Temp. (Ann.Var.)9 Oxygen Minimum Layer (Depth)
10 Surface Salinity11 Thermocline Depth (Winter)12 Thermocline Depth (Summer)13 Surface Dissolved Oxygen
I
-0.126-0.495-0.279-0.683-0.274
0.7680.942
-0.8480.675
-0.6080.172
-0.044-0.596
II
0.307-0.037
0.783-0.227-0.291-0.255
0.014-0.224
0.4420.6000.8880.8360.089
III
0.431-0.091
0.2790.6270.8720.380
-0.101-0.304
0.157-0.046-0.269
0.363-0.380
• Relatively high loadings highlighted in bold as follows: (component I) > 10.81; (II and III) > 10.61.
Table 7Product-moment correlations of block means for morphological variables and components versus environmental variables and com-ponents based on 25 blocks of Stenella longirostris.'
EnvironmentalEnvironmental variableb component
Character 1 2 3 4 5 6 7 8 9 10 11 12 13 I II III
1 Condylobasal L. ++2 L. Rostrum (frm.Base) + + +3 L. Rostrum (frm.Pterygoid) + + ++4 W. Rostrum (at Base) ++ + +++ ++ +++5 W. Rostrum (at 1/4 L.) ++ + ++ ++ +++6 W. Rostrum (at 1/2 L.) ++ + + ++ ++7 W. Premax. (at 1/2 L.) + ++8 W. Rostrum (at 3/4 L.) ++ ++ +9 Preorbital W. ++ +++ + ++ + ++
10 Postorbital W. ++ +++ + ++ + ++11 Skull W. (at Zygomatic P.) ++ +++ + ++ + ++12 Skull W. (at Parietals) +13 Ht. Braincase ++ +++ ++ +14 L. Braincase +++ +++ + ++ +15 Max. W. Premax. + +16 W. External Nares ++ +++ +17 L. Temporal Fossa +18 W. Temporal Fossa +++ ++ ++ +++19 Orbital L. + +20 L. Antorbital P. + ++ +21 W. Internal Nares + ++22 L. Up. Toothrow + + ++23 No. Teeth (Up.Lf.) +24 No. Teeth (Up.Rt.) +25 No. Teeth (Low.Lf.)26 No. Teeth (Low.Rt.) +27 L. Low. Toothrow + + + +28 Ht. Ramus ++ + + + + +29 Tooth W. +30 L. Ramus + ++Component I + ++ + + + +Component II ++ + +Canonical Variable 1 ++ - -- + ++ + ++ +Canonical Variable 2 ++ ++ ++

Douglas et aJ.: Geographic variation in cranial morphology of Stenella longirostris
Table 7 (continued'
"Blanks indicate nonsignificant correlations. Individual symbols refer to significant positive or negative correlations (P<0.05; >0.396);double symbols indicate highly significant correlations (P<O.OI; >0.505); and triple symbols represent very highly significant correlations (P<O.OOI; >0.620).
bEnvironmentai variables: (1) Sea Current (N., Winter); (2) Sea Current (W., Winter); (3) Water Depth; (4) Solar Insolation (Jan.);(5) Solar Insolation (Annual); (6) Sea Surface Temp. (Jan.); (7) Sea Surface Temp. (July); (8) Sea Surface Temp. (Ann. Var.); (9) Oxygen Min. Layer (Depth); (10) Surface Salinity; (11) Thermocline Depth (Winter); (12) Thermocline Depth (Summer); and (13) SurfaceDissolved Oxygen.
67
,ed' ,lid' ,20'~. '00",' .'" ...
··1~
>Q~ ~( 'I. ~,0 "~?L~ 1rJ:;
~ QQ01\ l,.-Q.
i i i i i ~ 0 0 DO ~'fI ,0"
)
Q 0VCr
..B 0Environmental V
PrincipalComponenlll
~ 1.13 ~Q 1\ ,0"0.'8
-0.811
~ ~ \
,00" .1Id' ,20'
~'oo"r .'" \r
..j \l i p:;::,( 'J, ~
iI ~~:L ~:J:
I I I 1'\ ~
I I I I I I I I II~~I '0'
~ I )~, 0'
A
0 0"Environmenlal yPrincipal
Component I
~0.82 0 D 1\ '0'-0.30
-1.41 0 0 \, I
09
08
07
C8
05
03
02
01
09
08
07
06
os
Q4
03
02
01
0'
01
03
03
05
os
07
07
C9
09
11
11 13
'5
15
17
17
19
19
Figure 10Geographic variation in environmental variables as summarized in (A) principal component I and (B) principal component II.Darkened part of bar indicates value for particular block.
Water Depth (variable 3; Fig.11B) is positively correlated with13 morphological measures, twoof which (L. Braincase and W.Temporal Fossa) are very highlysignificant (P< 0.001). The blockvalues for W. Temporal Fossa(which have a 0.755 correlationwith Water Depth values) areshown in Figure 11A. For the 13variables, relatively large valuestypically were recorded in block0117 and those in the vicinity ofthe Hawaiian Islands (0702 and0802), all of which have relatively deep waters, while more shallow localities like 0516 and 0812had individuals that were smallerfor these characters.
The fourth environmentalmeasure, Solar Insolation (Jan.),changes from high to low valuesuniformly from north to south. Itis statistically associated withonly one character, W. InternalNares, which has small values for0812; values tend to get higheras one proceeds south, but thereare exceptions (such as 0802,which is relatively high). Canonical variable 2 has a patternstatistically similar to this environmental variable (bottom ofTable 7).

68 Fishery Bulletin 90/1). 1992
'9
19
17
17
ronmental factor (Table 7), each of which are negativeand relatively weak.
The sixth environmental variable, Sea Surface Temp.(Jan.), has significant negative correlations with 22
morphological characters, as wellas principal component I (Fig. 4)and canonical variable 1 (Fig.8B). Variable 7, which is Sea Sur-face Temp. (July) (Fig. 12), has arelatively high number (21) ofsignificant negative associationswith morphological measures, aswell as with principal componentI (Fig. 4) and canonical variable1 (Fig. 8B). Postorbital W. (Fig.8A) has the strongest correlation(- 0.681) of any of the morphological characters with Sea Surface Temp. (July).
The eighth environmental vari- .able, Sea Surface Temp. (Ann.Var.), exhibited relatively weakgeographic concordance with sixmorphological characters, one ofwhich was a negative association(Table 7). Also, only weak negative correlations of five morphological variables were found withdepth of the oxygen minimumlayer (variable 9).
Fourteen of the 30 morphological measures are significantlycorrelated with environmentalvariable 10, Surface Salinity (Fig.13B). In addition to east-westchanges from lower to highervalues at a given latitude, salinity also exhibits a north-to-southtrend of increasing values (below15ON). The highest correlation(0.661) is with L. Braincase (Fig.13A).
Thermocline Depth (Winter),variable 11, was positively associated with 13 morphologicalvariables (Table 8), while Thermocline Depth (Summer), variable12, has statistically significantpositive correlations with 11morphological traits. The final.variable, Surface Dissolved Oxy-gen, covaries with 16 morphological variables. As suggested inthe dendrogram in Figure 9, thisenvironmental variable has a
15
15
'311
11
0907
07
05
05
03
03
01
01
,eo' ,... .20'
~.~ 'oo'r "V
J··1
-~
Ch ~( ~
1° ~~::1L120'
<:::.6!v.
~ 0 i il\ l,.,Q.
~~I~
I I I I i ~QQQ0 1
Q 0)~1
~B
~Water Depth
1
~:mj i \ ,~
2500 j I \I
leo' ,..- 1.0-
'~.00'/ ~ \r
··1'\1~Q p;;;.
\: ........J.. ~,0~~::L ~:d:
0 000'\ ve.i ~ I i i ~ ~ ~ QO~~'~
Q Q)i 1
~
A
iW. Temporal Fossa y
~ ••.omm i ~ ~ ,.-39.4
34.9 i I \I
Figure 11Geographic variation in (A) W. Temporal Fossa and (B) Water Depth. Darkened partof bar indicates value for particular block.
01
05
03
04
02
06
08
01
02
05
07
03
04
09
07
06
08
09
Annual solar insolation (variable 5) has high valuesat the earth's Equator, with decreasing values as oneproceeds toward either pole. Only two morphologicalvariables have significant correlations with this envi-

Douglas et al.: Geographic variation in cranial morphology of Stenella /ongirostris 69
Figure 12Geographic variation in Sea Surface Temp. (Jul.). Darkened part of bar indicates valuefor particular block.
00 ~1--If----l---+--+--t-t--+--+----+---+--+--+--+--1-I
\\ ,0'
00 \.
IIIII
pattern with similarities to thosefor sea surface temperatures.
Table 7 indicates that the pattern of correlations of environmental principal component Iwith cranial measures is similarto that of Sea Surface Temp.(July) (variable 7), which is expected given the strong loadingsof this environmental variable onthis component (see Table 6). Environmental principal componentII has positive correlations withmost skull-width measures (Table7). The third environmental component has relatively few significant correlations with morphological characters; its strongestassociation is with one of thesummary morphological variables, canonical variable 2.
In Table 8, we have summarized Mantel t-values and matrixcorrelations between selected
0'
'917151311
i i)o
.211'
0907
....
0503
,10"
01
n 28.75"C
.24.10
19.45
Sea SurfaceTemp. (JUly)
0'
05
04
02
03
07
09
09
Table 8Results of Mantel tests (t) and matrix correlations (r) for SteneUa Umgirostris. Comparison of interlocality differences for 13 environmentalvariables and 3 environmental components against those for 5 morphological variables selected in canonical variates analysis.
L. Rostrum W. Internal W. Premax. W. RostrumPostorbital W. (frm.Pterygoid) Nares (at 1/2 L.) (at Base)
Environmental variable r r r r r
1 Sea Current (N.,Winter) -0.56 -0.050 -0.59 -0.083 1.99* 0.215 -0.56 -0.073 -0.79 -0.1412 Sea Current (W.,Winter) -1.38 -0.092 0.12 0.010 -0.72 -0.053 0.59 0.048 -0.44 -0.0443 Water Depth 3.23** 0.235 1.27 0.128 2.25* 0.186 -0.76 -0.073 2.22* 0.2714 Solar Insolation (Jan.) 4.46*** 0.339 2.60** 0.283 4.49*** 0.393 0.77 0.079 1.81 0.2415 Solar Insolation (Ann.) 2.14* 0.176 1.95 0.241 1.86 0.180 -0.54 -0.062 1.43 0.2196 Sea Surface Temp. (Jan.) 5.47*** 0.371 3.71*** 0.327 3.63*** 0.271 0.53 0.045 1.63 0.1707 Sea Surface Temp. (July) 4.82*** 0.353 1.73 0.176 4.65*** 0.387 2.55* 0.244 0.64 0.0798 Sea Surface Temp.
(Ann.Var.) 1.64 0.114 1.22 0.113 3.80*** 0.294 1.40 0.123 -0.40 -0.0449 Oxygen Minimum Layer
(Depth) 1.22 0.077 . 2.12* 0.158 3.54*** 0.236 1.62 0.116 -0.61 -0.05110 Surface Salinity 4.57*** 0.323 0.37 0.035 1.03 0.082 0.06 0.005 0.62 0.07211 Thermocline Depth
(Winter) 2.92** 0.241 4.42*** 0.548 -0.96 -0.093 -0.55 -0.063 3.87*** 0.59812 Thermocline Depth
(Summer) 2.52* 0.172 1.63 0.146 -0.15 -0.001 -0.35 -0.030 3.41*** 0.36213 Surface Dissolved Oxygen 2.52* 0.204 1.43 0.172 1.88 0.179 0.93 0.105 -0.18 -0.027
Environmental Component I 3.63*** 0.268 1.68 0.174 4.09*** 0.345 2.02* 0.197 0.11 0.014Environmental Component II 2.75** 0.212 3.85*** 0.429 -1.11 -0.099 -0.75 -0.078 3.70*** 0.508Environmental Component III 1.39 0.120 1.19 0.160 1.99* 0.207 -0.97 -0.121 0.32 0.054
*P<0.05; **P<O.OI; ***P<O.OO1.

70 Fishery Bulletin 90P). J992
Figure 13Geographic variation in (A) L. Braincase and (B) Surface Salinity. Darkened part of barindicates value for particular block.
,OG" ,..- 120'
I~IOO'~ '" eo"
··1~ i I ~ ~~
iI ~LI'"'
~i~,0 Q~ 0'\ < ve-
i i I ~ i QQQQO~~'~
i 0~~. ..
B
i i"Surface Salinity y
.lit35.'5°'00 I I ~ ,~34.15
32.84 I I \
o'
'9
19
J
17
17
Mantel test (Table 8), with SeaSurface Temp. (Jan.) being thehighest. The seven environmental variables displaying correlations in Table 7 with PostorbitalW also are judged concordantusing the Mantel test. In addition, based on interblock difference values, there are statistically significant associations withthe two measures of solar insolation (variables 4 and 5; see Table8). The concordance with thesetwo environmental variables isprimarily on the strength of pattern similarities in the easternportion ofthe range. PostorbitalW also shows significant associations with the first two environmental principal components.
Based on correlation tests forblock means (Table 7), L. Rostrum (frm.Pterygoid) exhibited ageographic distribution of meanblock values that was statistically associated with those for sixenvironmental measures. Foursignificant associations wereidentified using the Mantel test(Table 8), only two of which werefound by both tests (Sea SurfaceTemp. [Jan.] and Oxygen Minimum Layer [Depth]). It has asignificant association with environmental component II.
In Table 8, a total of sevensignificant associations of difference values are recorded for WInternal Nares with environmental variables, including the threelisted in Table 7 as having statistically significant associationsbased on means. Differencevalues for environmental components I and III significantlycovary with those of W InternalNares.
Using difference values, WPremax. (at 1/2 L.) has only aweak correlation with a single
environmental variable (Table 8); only a single significant association was found using correlations of meanvalues, and this was with another environmentalvariable (see Table 7). W Premax. (at 1/2 L.) is weakly associated with environmental component I.
'5
15
ii 1\
100'1"'")
'3
'3
I
"
"
09
09
07
07
05
05
03
03
01
01
01
03
02
04
05
06
07
08
09
,eo" ,..- ,,",
09
08 ..,07 1°08
os 0 i i ~ Qo.
A
03 L. Braincase
02...'OB.7mm
'01.5
0198.3
I
morphological and environmental variables. Assessingdifference matrices using these techniques representsan alternate method with which to evaluate covariation of geographic patterns. For Postorbital W (Fig.8A), there are nine significant associations using the

Douglas et al.: Geographic variation in cranial morphology of Stenella longirostris 71
The W Rostrum (at Base) exhibits covariation withthree of the environmental variables based on theMantel test (Table 8), two of which involve thermoclinedepth. The matrix correlation (Table 8) for W Rostrum(at Base) with Thermocline Depth (Winter) is substantial (0.598), as it is with environmental component II(0.508). Mean values also showed an association of WRostrum (at Base) with the thermocline variables andWater Depth, as well as with three other environmental variables (Table 7).
Discussion
Sexual dimorphism
Our analysis of sexual dimorphism extends the studiesof Douglas et al. (1986) in terms of additional specimensand minor adjustments in previously collected data. Wefound 15 of 30 variables were statistically dimorphic.Douglas et al. (1986) identified 13 of these as showingsexual differences, the increase of two characters(Postorbital Wand Tooth W) being due primarily toincreased numbers of specimens available. In fivecharacters, including two rostral and two toothrowlengths, measurements for females were slightly largerthan for males, although the differences were notstatistically significant. For all other measures, malesare larger than females, including all 15 where statistical significance was found.
Geographic variation
In 1889, when the existence of spinner dolphins in theeastern tropical Pacific was not yet known, True indicated that the absence of adequate samples madevery difficult the task of taxonomically evaluatingspecies in the genus Stenella. By the 1970s, Perrin(1975b) had available considerably more material fora monographic treatment ofS. attenuata and S. longirostris from the eastern tropical Pacific and was ableto make significant advances with respect to ourunderstanding of morphological variation of Stenella.However, his work on S. longirostris also was hinderedby the paucity of skeletal material from parts of therange. For our study, many additional specimens ofS. longirostris were available. On the whole, our resultsare strongly supportive of those obtained by Perrin(1975b) for cranial characteristics, but we also havebeen able to substantially extend his analyses.
Perrin (1972) conducted an initial analysis of geographic variation in color patterns of S. longirostrisin the eastern Pacific Ocean. He found geographicvariation, particularly in the "dorsal field system" ofcoloration, which overlies a basic general pattern.
These and other data suggested differentiation intoeastern, whitebelly, and Hawaiian forms. The differences were analyzed further by Perrin (1975a,b), whoindicated that the whitebelly form was in some wayssimilar to the Hawaiian form, but had a proportionatelysmaller beak. Perrin (1975b) described but did not namefour races-the three mentioned above plus a CostaRican form which occurs off the coast of CentralAmerica. Perrin et al. (1979b) evaluated possible differentiation in S. longirostris involving animals foundsouth of the Equator in the eastern Pacific Ocean. Theyconcluded that these S. longirostris are morphologically distinct from those to the northeast; characteristicsshowing such a trend include coloration, size, shape,and skeletal measures.
Recently, Perrin (1990) named and described threesubspecies: S. l. longirostris (Gray's spinner dolphin),S. l. orientalis (eastern spinner dolphin), and S. l.centroamericana (Central American spinner dolphin).In our geographic variation assessment, we purposelyincluded all adult specimens available, without anattempt a priori to differentiate previously describedforms. However, the differences among the namedforms are reflected in our results for cranial characteristics.
In our analyses, the Central American spinnerdolphin of Perrin (1990) is shown to be different fromother S. longirostris by the positioning of block 0516on principal component II; it had the lowest value ofany of the blocks (see Fig. 3). Three of the four specimens in block 0516 exhibit characteristics of CentralAmerican spinners (as does one of the nine from 0615).Character associations with the second principal component-summarized in Table 3-suggest that, aftertaking into account general size (summarized in andmathematically removed by component I), animals ofthis subspecies have relatively longer· toothrows,greater numbers of teeth, a narrower skull at theparietals, and a shallower braincase than S. longirostrisfrom other areas. Perrin (1990: table 2) provided comparative measurements and counts for S. l. longirostris and S. l. centroamericana, which show the Central American form to have longer toothrows andgreater numbers of teeth. He did not include data onHt. Braincase, but did characterize the Central American form as having a relatively long and narrow skull.While Skull W (at Parietals) is slightly greater for S. l.centroamericana than S. l. longirostris (Perrin 1990:table 2), the former has a relatively narrow skull givenits considerably greater length. Additional S. l. centroamericana specimens are needed, since the diagnosisand understanding of cranial variation in this subspecies still is based on very few animals.
Perrin (1990) suggested the existence of a zone ofhybridizationJintergradation between S. l. longirostris

72
and S. l. orientalis that may be about 2000km wide.Stenella l. orientalis is found primarily in the northeastern blocks we assessed. Our analyses confirm that,in general, adult spinner dolphins from this region aresmaller than those from areas to the south, southwest,and west (for general trends, refer to block projectionsonto canonical variable 1 in Fig. 8B). The nominatesubspecies, S. l. longirostris, of Perrin (1990) subsumesa series of broadly distributed populations. He indicatedthat S. l. longirostris likely includes areal entities (outside the eastern Pacific) worthy of formal taxonomicrecognition, but to date these have not been evaluatedproperly because of a paucity of specimens from major
. portions of the range.Extensive data on geographic variation in external
morphology of S. longirostris in the eastern tropicalPacific were assessed by Perrin et al. (1991). Theyevaluated color patterns, dorsal-fin shapes, and totallengths for S. longirostris from throughout the geographic range covered in our study. Some externalcharacters (e.g., ventral field coloration pattern) exhibited a "radial" or concentric pattern of variation,where spinners to the south, southwest and west weresimilar, but markedly different from those to the northeast. This pattern also was prevalent among cranialvariables (e.g., see values for Postorbital W. [Fig. 8A],canonical variable 1 [Fig. 8B], and L. Braincase [Fig.13Al).
We were able to incorporate specimens into ourana!~Tses from the genera! vicinit~T of the HavlaiianIslands. Perrin (1975b) evaluated Hawaiian specimensfor cranial features and concluded that, in general, theywere strikingly larger than other spinners. However,at the time, few specimens were available from southern localities. When these southern blocks are incorporated into the analysis, the Hawaiian specimens arenot quite as extreme, although for most characters theHawaiian specimens remain the largest (see PostorbitalW. [Fig. 8A], W. Temporal Fossa [Fig. llA] and L.Braincase [Fig. 13A], as well as principal componentI [Figs. 3 and 4] and canonical variable 1 [Figs. 7 and8Bl). Also, for many of the characters the Hawaiianspecimens are more similar to far-southern ones thanto those from geographically closer western blockslocated between 5° and lOON. When evaluating otherwestern single-specimen blocks that are situated closerto the Hawaiian Islands, some analyses (e.g., canonicalvariates analysis; see Fig. 7) indicate that spinnerssimilar to Hawaiian specimens are present; however,additional specimens will be needed in order to clarifythe trends in variation in this part of the Pacific.
In some descriptive analyses (e.g., see Figs. 6 and7), block 0702 to the south of the Hawaiian Islands isdepicted as quite distinct from other blocks, includingthe adjacent block to the north (0802). This incongruity
Fishery Bulletin 90P). J992
is likely a statistical aberration related to the smallsample size for 0702 (n 2), rather than to a biologicaldifference. Checking the specimens from the two blocksindicated that they were taken in relatively close proximity, but were separated because of where the borderbetween the blocks happened to be located. This apparent anomaly does not detract from the general conclusion that the spinners in the vicinity of the HawaiiariIslands are among the largest found in the overall studyregion.
Schnell et al. (1986) conducted an extensive analysisof geographic variation of offshore S. attenuata, asimilar species that broadly overlaps in range withS. longirostris. The two species frequently are seen inmixed schools (Au and Perryman 1985, Reilly 1990).Reilly (1990) noted that 73% of the S. longirostrissightings from research vessels also included S. attenuata; 49% of the records of the more common S. attenuata involved schools that also had S. longirostris. Whiledetailed comparisons evaluating interspecific geographic covariation in morphology are beyond the scopeof this paper, our preliminary findings indicate thatabout one-half of the individual morphological characters show similar geographic patterns for blockswhere both species are represented. However, twocharacters involving the temporal fossa (variables 17and 18) exhibit negative correlations (the length correlation is statistically significant and the width nearly so)-localities where the fossa is larger in S. attenu-nfn ;+;Q1 C1'1"'t"'l3l1O ;T\ Q ''''Nt,.".·~nca+~CI ""'hn +n'W'Y'l'l"\"...,.nl ~nlf"l"'"""""UI', .LU ,...,. IIIV I II:J ", vu." 1fU "'" """" .L,tIVL u..a .Lv..,..,a
reflects the size of muscles involved in the feedingapparatus. Also, the upper tooth counts show pronounced negative correlations interspecifically.Opposite trends in the two similar species for thesecharacters may be an example of ecological characterdisplacement related to differences in feeding and thetypes of food taken by the two species in given localities(Perrin 1984).
Genetic subdivision, management units,and Implications of cranial variation
Considerable attention has been given to definition ofstock units with a meaningful biological basis that canbe employed to manage S. longirostris in the easternPacific (Perrin 1975a, b; Perrin et al. 1979b, 1985,1991). One of the important questions with respect tothe effectiveness or relevance of geographic management units is the degree to which the species isgenetically subdivided. Perrin et al. (1991) noted a complex patchwork pattern of geographic variation in external and other characteristics in S. longirostris suggesting "that there is not a large amount of movementbetween the various regions." They pointed out thatthe complex geographic pattern of variation in the

Douglas et al.: Geographic variation in cranial morphology of Stenella longirostris 73
zone of intergradationlhybridization of S. l. orientaliswith S. l. longirostris is consistent with limited dataon movements from tag returns (Perrin et al. 1979a),which indicate "a home range of a diameter of hundreds rather than thousands of kilometers."
Our findings strongly support these conclusions. All30 characters studied showed geographic variation,with two-thirds having demonstrable regional patterning, and 25 of the 30 showing local patterning. Thesepatterns emerge even though data are based onspecimens pooled over season and for a number ofyears; consistent geographic patterns largely would beobscured if animals typically moved long distanceswithin or between years. Clearly, as found by Schnellet al. (1986) for S. attfmuata, in S. longirostris "thereare notable patterns of geographic variation ... indicating that geographic subdivision exists amongpopulations."
We found concordance of geographic patterns inS. longirostris for a number of cranial characters asnoted by Perrin et al. (1991) for external characters.Yet, some patterns are not concordant; in fact, thereis a mosaic of patterns involving different charactersand/or character suites. For example, many of the toothcounts, toothrow measurements, and rostrum andramus lengths show very similar patterns of variation(as indicated in Fig. 2), while other characters likeTooth W have a pattern among blocks that is not closely related to that of any other character. Not surprisingly, a number of skull widths covary. Overall, thefindings for S. longirostris parallel the situation typically found in other mammals where geographic variationin morphological characters has been studied. Someobserved patterns may be the consequence of actionby selective forces, while others simply result from andare maintained because of isolation by distance. Thefindings are consistent with S. longirostris beinggenetically subdivided, stemming from individualanimals or groups of animals having relatively limitedhome ranges.
For management stocks, Perrin et al. (1991) proposed an alternative management scheme where "an'eastern spinner conservation zone' could be devisedthat would offer appropriate and unequivocal protection to the unique and coherent gene pool of the easternsubspecies." For instance, a zone bounded on the southby ·lOoN and and on the west by 125°W would encompass 84% of the schools that were identified in the fieldas being composed of "eastern" spinners, and wouldinclude very few "whitebelly" animals (Perrin et al.1991). Based on the cranial measures we employed,spinners from the blocks in this portion of the rangeare very similar; the blocks typically were closely linkedin cluster analyses and ordinations. Blocks from mostother parts of the range did not show the same degree
of consistency and concordance. Our data also provideadditional biological justification for establishing ageographically defined management zone for S. l.orientalis that, operationally, would be easily understood and more effective for management purposes.
Perrin et al. (1991) also concluded that data on external characters do not support the division of whitebelly spinners into northern and southern stocks formanagement purposes. For cranial features, if one considers only eastern blocks, it is possible to achieve aconsiderable degree of separation between northernand southern whitebelly spinners. However, the situation becomes notably more complex when more westerly blocks are added. For virtually all cranial characters,the western blocks group with the more southerlyblocks even though they are at the same latitude asblocks to the east containing northern whitebelly spinners; the only possible exception is W Internal Nares,which shows a strong north to south gradient involving all blocks except for one in the vicinity of theHawaiian Islands (i.e., 0802). The addition of cranialspecimens from western locations has provided a moresophisticated picture of geographic variation of·S. longirostris in the region under study.
Morphological-environmental covarlation
Considerable heterogeneity exists in environmentalparameters over the range of S. longirostris in theeastern tropical Pacific (see examples of environmental variation in Figs. 11-13). With two circulatory gyresadjacent to the region, one to the north and the otherto the south, the eastern tropical Pacific has aneasterly-flowing equatorial counter-current from 3° tolOON latitude, and a number of fronts and convergences (Wyrtki 1966, 1967). These coupled withlatitudinal and other gradients result in substantialspatial differences in environmental characteristics.
Spotted ·dolphln/envlronmental comparisonsSchnell et al. (1986) evaluated covariation in a similarsuite of environmental and cranial morphologicalfeatures for offshore S. attenuata in the easterntropical Pacific. The S. attenuata investigation wasfocused in eastern areas (only 1 of 19 blocks was westof 115OW). Our analysis of S. longirostris covers considerably more of the ocean, and includes areas aroundthe Hawaiian Islands, which potentially could havesubstantially different marine environments. Theimportance of particular environmental variables, ofcourse, could be quite different when different geographic levels and different-sized areas are considered.Furthermore, environmental influence could well varybetween species. Yet it can be instructive to compareresults of environmental-morphologic patterns for

74
these two dolphin species with broadly overlappinggeographic ranges in the tropical Pacific Ocean.
Sea surface temperatures (variables 6 and 7; Julyvalues depicted in Fig. 12) have negative correlationswith a large number of morphological features in bothstudies (Table 7 and Schnell et al. 1986: table 6), indicating a general trend of larger animals in warmerwaters. Surface Salinity (Fig. 13B) exhibits relativelystrong morphologic correlations in both studies, reflecting a pattern that has both east-west and north-southcomponents. Also, Thermocline Depth (Summer),which has relatively low values in northern localitiesand higher numbers in blocks as one proceeds to thewest and south, is positively associated with a numberof morphological measures in S. longirostris (Table 7),and covaries with S. attenuata cranial features as well.
Solar Insolation (Jan.) registers a north-south gradient. Our S. longirostris study produced virtually nosignificant correlations with this measure, while therewere numerous positive correlations in the S. attenuata investigation. In the eastern portion of the S. longirostris range, a number of cranial features have northsouth gradients, but the overall statistical associationis negated with the addition of the western blocks,where animals often (irrespective of latitude) exhibitcharacteristics similar to those found in southern areas.The same findings were obtained for Solar Insolation(Ann.).
Three environmental variables-Water Depth (Fig.lIB), Thermocline Depth (',Vinter), and Sui'fac\': Di8solved Oxygen-are positively correlated with cranialmeasures in S. longi'rostris, but show few of theseassociations in S. attenuata. Again, the differences infindings simply may reflect the inclusion of a widergeographic range of blocks in the S. longirostris study.
Schnell et al. (1986) indicated that for S. attenuatait would be helpful to have additional samples, particularly from western locations. They suggested that"Such a geographic broadening of representation mayenable investigators to separate, at least in part,environmental-morphological correspondences thatreflect causal relationships from trends [in morphology]maintained primarily as a result of isolation by distance." For S. longirostris, where additional westernblocks are now represented (albeit in some cases withvery limited samples), it is clear that the gradients ina relatively large number of cranial characteristics arenot simply north-south trends, but rather what Perrinet al. (1991) described as a radial pattern. From northeastern blocks, these characters in S. longirostrischange more-or-Iess gradually as one moves to thesouth, the southwest, or the west. There are severalenvironmental variables exhibiting this type of pattern(e.g., Surface Salinity; Fig. 13B). At the same time, theJanuary and July sea surface temperatures (for July
Fishery Bulletin 90(1). J992
values, see Fig. 12) have a predominantly north-southorientation (with the Hawaiian Island blocks beinglower than expected, given their latitude) and are correlated with the largest number of cranial characters(see Table 7). When additional specimens of S. attenuata become available from westerly blocks notrepresented in samples available to Schnell et al. (1986),it will be of interest to determine whether patterns ofcranial variation (and covariation with environmentalmeasures) in this species will mirror those we havefound for S. longirostris.
Significance of covarlatlon with environmentalmeasures While previous literature has little information on the relation of environmental and cranialvariation in S. longirostris, other investigators (Au andPerryman 1985, Reilly 1990) have evaluated physicalenvironmental parameters with respect to distributionsof S. longirostris and several other species in theeastern tropical Pacific. They pointed out that thehighest school densities for S. longirostris are in thearea off the Mexican coast, which also is the mosttropical and least seasonally variable portion of therange. We have demonstrated notable associations ofcranial variation with physical environmental characteristics. Analyses involving environmental-cranialcorrelations, by their very nature, are descriptive anddo not provide direct information on causal factors perse. Nevertheless, they clearly indicate that betweenai'\':as wh\':i"t~ Cl.uimal:s art: difft:rt:IlL cranially, tht:re oftenare marked habitat differences involving the physicalenvironment.
The first two environmental principal components(Fig. 10) describe independent, orthogonal environmental patterns: component I has a general configurationof high values between 5° and 15°N, slightly lowervalues further to the north, and low values to the south(Fig. lOA), which is overlain by basically an east-to-westtrend summarized in environmental principal component II. The important individual environmental "covariates with morphological characters include surfacetemperatures, salinity, and measures of water depth.The physical environmental differences reflected by theprincipal components, as well as by individual environmental measures, describe basic habitat differences andlikely reflect, indirectly, geographic differences inavailable prey species and their abundances. Given themarked environmental differences exhibited in therange of S. longirostris, the most surprising resultwould have been if this species had been relativelyuniform geographically in cranial features-clearly, thisis not the case. Our initial assessment of morphologicenvironmental covariation further underscores theappropriateness of treating different parts of the rangeof S. longirostris in the eastern tropical Pacific

Douglas et al.: Geographic variation in cranial morphology of Stenella longirostris 75
separately for management purposes. In particular, agrowing base of information suggests giving specialattention to the spinners from the relatively uniformarea of the Pacific just to the west of the MexicanlCentral American coast, and viewing the pattern ofmorphologic variation as being broadly concentric innature.
Acknowledgments
S.B. Reilly and A.E. Dizon reviewed the manuscriptand provided useful suggestions. We thank J. Gilpatrick and J.V. Kashiwada for preparing and curatingsome of the specimens, as well as assisting with preparation of data for analysis. Computer programs andassistance were provided by F.J. Rohlf, R.R. Sokal, andM.A. Schene. Support for aspects of this research wasreceived by the University of Oklahoma through Contract 79-ABC-00167 from the U.S. Department ofCommerce, National Oceanographic and AtmosphericAdministration, and Purchase Orders 84-ABA-02177and 40JGNF0532 from the National Marine FisheriesService, Southwest Fisheries Science Center, La Jolla,CA. The following individuals provided access tomuseum specimens: S. Anderson, G.G. Musser, andD. Russell (American Museum of Natural History, NewYork, NY); M.C. Sheldrick (British Museum of NaturalHistory, Tring, United Kingdom); S. Bailey, L.C. Binford, and J. Schoenwald (California Academy ofScience, San Francisco, CAl; P.J.H. van Bree (Instituutvoor Taxonomische Zoologie, University of Amsterdam, Amsterdam, The Netherlands); D.R. Patten andJ.E. Heyning (Los Angeles County Museum of NaturalHistory, Los Angeles, CAl; C.P. Lyman and M. Rutzmoser (Museum of Comparative Zoology, HarvardUniversity, Cambridge, MA); W.Z. Lidicker Jr.(Museum of Vertebrate Zoology, University of California, Berkeley, CAl; C.G. van Zyll de Jong (Museum ofNatural Sciences, National Museum of Canada, Ottawa, Canada); J.G. Mead and C.W. Potter (NationalMuseum of Natural History, Washington D.C.); D.W.Rice and A.A. Wolman (NOAA Northwest and AlaskaFisheries Science Center, Seattle, WA); L.J. Hansen(NOAA Southwest Fisheries Science Center, La Jolla,CAl; G.F. Mees (Rijksmuseum van Natuurlijke Histoire, Leiden, The Netherlands); A. Rea (San DiegoMuseum of Natural History, San Diego, CAl; M.L.Johnson and E. Kritzman (University of Puget Sound,Tacoma, WA); and G.L. Worthen (Utah State University, Logan, UT).
Citations
Allen. R.A.1985 Dolphins and the purse-seine fishery for yellowfin tuna.
In. Beddington, J.R., R.J.H. Beverton. and D.M. Lavigne (eds.),Marine mammals and fisheries, p. 236-252. Allen and Unwin, London.
Au. D.W.K., and W.L. Perryman1985 Dolphin habitats in the eastern tropical Pacific. Fish.
Bull., U.S. 83:623-643.Bartholomew. J .. and Son
1975 The Times atlas of the world. Comprehensive Edition.Times Books, London, 223 p.
Brunt. D.1934 Physical and dynamical meteorology. University Press,
Cambridge, England, 411 p.Cromwell. T.
1958 Thermocline topography, horizontal currents and "ridging" in the eastern tropical Pacific. Inter-Am. Trop. TunaComm. Bull. 3:135-152.
Dailey, M.D.• and W.F. Perrin1973 Helminth parasites of porpoises of the genus Stenell.a in
the eastern tropical Pacific, with descriptions of two newspecies: Mastigon.ema ste-neUae gen. et sp. n. (Nematoda:Spiruroidea) and Zalophotrema pac-~fil.'Um sp. n. (Trematoda:Digenea). Fish. Bull.. U.S. 71:455-471.
Dixon. W.D. (chief editor)1990 BMDP statistical software, Vol. 1. Univ. Calif. Press,
Berkeley.Dizon, A.E.. 8.0. Southern. and W.F. Perrin
1991 Molecular analysis of mtDNA types in exploited populations of spinner dolphins (Ste.'ludla longirostris). Rep. Int.Whaling Comm. Spec. Issue 13:183-202.
Douglas. M.E.• and J .A. Endler1982 Quantitative matrix comparisons in ecological and evolu
tionary investigations. J. Theor. BioI. 99:777-795.Douglas. M.E.• G.D. Schnell, and D.J. Hough
1986 Variation in spinner dolphins (Ste.neUa longi,'Ostris) fromthe eastern tropical Pacific Ocean: Sexual dimorphism incranial morphology. J. Mammal. 67:537-544.
Hall. M.A.. and S.D. Boyer1988 Incidental mortality of dolphins in the eastern tropical
Pacific tuna fishery in 1986. Rep. Int. Whaling Comm. 38:439-441.
1989 Estimates of incidental mortality of dolphins in theeastern Pacific fishery for tropical tunas in 1987. Rep. Int.Whaling Comm. 39:321-322.
1990 Incidental mortality of dolphins in the tuna purse-seinefishery in the eastern Pacific Ocean during 1988. Rep. Int.Whaling Comm. 40:461-462.
Innis. G., J. Haefner, G. Worthen. and C. Fowler1979 ETP ecosystem model documentation. Report for
Southwest Fish. Cent., NMFS. NOAA, La Jolla, CA, 277 p.Katz. J.O., and F.J. Rohlf
1973 Function-point cluster analysis. Syst. Zool. 22:295-301.Levitus, S.
1982 Climatological atlas of the world ocean. NOAA Prof.Pap. 13, Rockville, MD.
Manley. B.J.F.1985 The statistics of natural selection on animal popula
tions. Chapman and Hall (Meuthen), NY.Mantel, N.
1967 The detection of disease clustering and a generalizedregression approach. Cancer Res. 27:209-220.

76
Perrin, W.F.1972 Color patterns of spinner porpoises (Stenella cf. S.
l.t:mgirostris) of the eastern Pacific and Hawaii, with commentson delphinid pigmentation. Fish. Bull., U.S. 70:983-1003.
1975a Distribution and differentiation of populations ofdolphins of the genusStenella in the eastern tropical Pacific. J.Fish. Res. Board Can. 32:1059-1067.
1975b Variation of spotted and spinner porpoise (genusSte1l.ella) in the eastern tropical Pacific and Hawaii. Bull.Scripps lnst. Oceanogr. 21:1-206.
1984 Patterns of geographical variation in small cetaceans.Acta Zool. Fenn. 172:137-140.
1990 Subspecies of Ste'll..ella longirostm (Mammalia: Cetacea:Delphinidae). Proc. BioI. Soc. Wash. 103:453-463.
Perrin, W.F.• W.E. Evans, and D.B. Holt1979a Movements of pelagic dolphins (Ste1/R-lla spp.) in the
eastern tropical Pacific as indicated by results of tagging, withsummary of tagging operations, 1969-1976. NOAA Tech.Rep. NMFS SSRF-737, 14 p.
Perrin, W.F., P.A. Sloan. and J.R. Henderson1979b Taxonomic status of the 'southwestern stocks' of spin
ner dolphin, Stenella l.ongirostm, and spotted dolphin, S. attenuata. Rep. Int. Whaling Comm. 29:175-184.
Perrin. W.F., M.D. Scott. G.J. Walker, and V.L. Case1985 Review of geographical stocks of tropical dolphins
(Ste1l.ella spp. and Delphinus delph-is) in the eastern Pacific.NOAA Tech. Rep. NMFS 28, 28 p.
Perrin, W.F., P.A. Akin, J.V. Kashiwada1991 Geographic variation in external morphology of the spin
ner dolphin Stenella longirostm in the eastern Pacific and implications for conservation. Fish. Bull.. U.S. 89:411-428.
Reilly. S.B.1990 Seasonal changes in distribution and habitat differences
among dolphins in the eastern tropical Pacific. Mar. Ecol.Prog. Ser. 66:1-11.
RuhinMon, wi.K.1976 Atlas of north Pacific Ocean monthly mean temperatures
and mean salinities of the surface layer. Naval Oceanogr. Office Ref. Publ. 2, Wash. DC.
Rohlf, F.J.• J. Kishpaugh, and D. Kirk1979 NT-SYS. Numerical taxonomy system of multivariate
statistical programs. State Univ. New York, Stony Brook.Schnell, G.D., M.E. Douglas. and D.J. Hough
1985a Sexual dimorphism in spotted dolphins (Stenella attenuata) in the eastern tropical Pacific Ocean. Mar. MammalSci. 1:1-14.
1986 Geographic patterns of variation in offshore spotteddolphins (Stenella atten.uata) of the eastern tropical PacificOcean. Mar. Mammal Sci. 2:186-213.
Schnell. G.D., D.J. Watt. and M.E. Douglas1985b Statistical comparison of proximity matrices: Applica
tions in animal behaviour. Anim. Behav. 33:239-253.
Fishery Bulletin 90P). J992
Sneath, P.H.A., and R.R. Sokal1973 Numerical taxonomy. W.H. Freeman, San Francisco.
Sokal. R.R.1979 Testing statistical significance of geographic variation
patterns. Syst. Zool. 28:227-232.True, F.W.
1889 Contributions to the natural history of the cetaceans, areview of the family Delphinidae. Bull. U.S. Natl. Mus.36:1-191.
Wirth, M•• G.F. Estabrook. and D.F. Rogers1966 A graph theory model for systematic biology with an ex
ample for the Oncidiinae (Orehidaceae). Syst. Zool. 15:59-69.Wyrtki, K.
1966 Oceanography of the eastern equatorial Pacific Ocean.Oceanogr. Mar. BioI. Annu. Rev. 4:36-68.
1967 Circulation and water masses in the eastern equatorialPacific Ocean. Int. J. Oceanol. Limnol. 1:117-147.
1974 The dynamic topography of the Pacific Ocean and its fluctuations. Rep. H-16-74-S, Hawaii Inst. Geophysics, 19 p.