abstract - nc state university · abstract coskun, hilmi ... for the construction or design of...
TRANSCRIPT

ABSTRACT
COSKUN, HILMI. Construction of SIMCON Retrofitted Reinforced Concrete Columns.
(under the direction of Dr. Michael L. Leming)
There is a growing interest on infrastructure retrofitting due to updated seismic codes
and increased service loads. There may be some economical reasons or preservation needs
to strengthen a structure instead of demolishing it. For strengthening purposes alternatives
include steel jacketing and Fiber Reinforced Plastic (FRP) wrapping. This study focuses on
Slurry Infiltrated Mat Concrete (SIMCON) as an option for strengthening of reinforced
concrete columns.
Before SIMCON is applied routinely for strengthening of a column, however, certain
critical construction and constructibility factors affecting the jacketed column behavior must
be resolved. In this study, the frost durability of SIMCON was examined, factors associated
with the construction of a SIMCON jacket were identified, the influence of these factors on
service load and ultimate state behavior were evaluated, the criticality of these factors was
determined, and general guidelines for the construction or design of SIMCON jackets on
existing columns were developed. In addition, an approximate cost of SIMCON jackets for
existing reinforced concrete columns was developed in order to evaluate the economic
viability of the SIMCON jacket.
SIMCON exhibited satisfactory deicer salt scaling resistance, even without the
presence of entrained air. No significant effect of cracking on scaling was observed.
Several construction aspects of jacketing were studied analytically. Bonding was not
found to be necessary for SIMCON jacketing of a column. The most important factor is the
end connections of a SIMCON jacket for load and moment transfer. Other critical factors
were thickness and strength tolerances of SIMCON jacket.
The construction costs of SIMCON jacket were estimated based on available data.
This and some other strengthening technique cost data showed that SIMCON jacketing is an
economically viable technique.
CONSTRUCTION OF SIMCON RETROFITTED
REINFORCED CONCRETE COLUMNS
by
HILMI COSKUN
A dissertation submitted to the Graduate Faculty ofNorth Carolina State University
in partial fulfillment of therequirements for the Degree of
Doctor of Philosophy
CIVIL ENGINEERING
Raleigh
2002
APPROVED BY
_________________________ _________________________
Dr. Sami Rizkalla Dr. David W. Johnston
_________________________ _________________________
Dr. Amir Mirmiran Dr. Michael L. Leming
Chair of Advisory Committee

ii
BIOGRAPHY
Hilmi Coskun was born in Eskisehir, Turkey in 1967. He got his elementary and
secondary education in Eskisehir and graduated from Demiryol Meslek Lisesi, (Railways
High School) in 1984. He received his Bachelor of Science degree in Civil Engineering from
Anadolu University in September of 1988.
Hilmi worked as a civil engineer in TCDD (Turkish State Railways) from 1988 to
1993. He won a scholarship in 1993 from the Turkish Government to pursue his Masters
and Ph.D. degrees from universities abroad. He joined the masters degree program in the
Civil Engineering Department at Old Dominion University, Norfolk, Virginia, USA in 1995.
There he studied the flexural behavior of thermoplastic beams under the direction of Dr. Zia
Razzaq, and received his M.S. degree in December 1997.
Hilmi started his Ph.D. degree program at North Carolina State University, Raleigh,
North Carolina, USA in January of 1998. He conducted his studies under the directions of
Dr. Michael L. Leming and completed the doctoral studies in the Summer of 2002.

iii
ACKNOWLEDGMENTS
My special thanks are extended to Dr. Leming for his guidance throughout my
studies. Furthermore, I want to thank Dr. Johnston and Dr. Rizkalla for their helps and
supports. I also would like to thank Dr. Krstulovic and Dr. Mirmiran for their helpful
suggestions.
I am grateful to Mustafa Kemal University, Turkey, which provided the financial
support for my studies. Support provided by NCSU Civil Engineering Department during
my last year of studies is gratefully acknowledged. I appreciate help of Mr. Jerry Atkinson
from the Constructed Facilities Laboratory during my experiments.
Last but not least, I would like to thank my wife, Meltem Coskun. Certainly I have
been gifted with her support and patience. I want to thank my daughters Ipek Pinar and Ezgi
Zeynep. Their smiles and hugs gave me happiness and encouraged me on my work. I would
also like to thank my family who send their prayers.

iv
TABLE OF CONTENTS
LIST OF TABLES . . . . . . . . . . . . . . . . . . . . . . . . . . . . . . . . . . . . . . . . . . . . . . . . . . . . x
LIST OF FIGURES . . . . . . . . . . . . . . . . . . . . . . . . . . . . . . . . . . . . . . . . . . . . . . . . . xiii
LIST OF SYMBOLS . . . . . . . . . . . . . . . . . . . . . . . . . . . . . . . . . . . . . . . . . . . . . . . . xviii
I. INTRODUCTION . . . . . . . . . . . . . . . . . . . . . . . . . . . . . . . . . . . . . . . . . . . . . . 1
1.1 Overview . . . . . . . . . . . . . . . . . . . . . . . . . . . . . . . . . . . . . . . . . . . . . . . 1
1.2 Problem Statement . . . . . . . . . . . . . . . . . . . . . . . . . . . . . . . . . . . . . . . . 2
II. LITERATURE REVIEW . . . . . . . . . . . . . . . . . . . . . . . . . . . . . . . . . . . . . . . . . 4
2.1 Fiber Reinforced Concretes . . . . . . . . . . . . . . . . . . . . . . . . . . . . . . . . . 4
2.2 SIMCON Material Properties . . . . . . . . . . . . . . . . . . . . . . . . . . . . . . 10
2.2.1 Mechanical Properties . . . . . . . . . . . . . . . . . . . . . . . . . . . . . . 10
2.2.2 Durability Concerns with HPFRCC . . . . . . . . . . . . . . . . . . . . . 12
2.2.3 Drying Shrinkage of SIFCON . . . . . . . . . . . . . . . . . . . . . . . . . 14
2.3 Slurry Properties . . . . . . . . . . . . . . . . . . . . . . . . . . . . . . . . . . . . . . . . . 15
2.3.1 Slurry Mixture Proportioning . . . . . . . . . . . . . . . . . . . . . . . . . . 15
2.3.2 Slurry Infiltration . . . . . . . . . . . . . . . . . . . . . . . . . . . . . . . . . . . 19
2.4 SIMCON Applications . . . . . . . . . . . . . . . . . . . . . . . . . . . . . . . . . . . . . 19
III. SCOPE OF THE STUDY AND RESEARCH METHODOLOGY . . . . . . . . 26
3.1 Scope of the Study . . . . . . . . . . . . . . . . . . . . . . . . . . . . . . . . . . . . . . . . 26
3.2 Research Methodology . . . . . . . . . . . . . . . . . . . . . . . . . . . . . . . . . . . . . 27
3.2.1 Investigation of Deicer Salt Scaling Resistance of SIMCON . 28
3.2.2 Identification of Factors Related to Design and Construction . 29

v
3.2.2.1 Methodology of Identification of Factors . . . . . . . . . . 29
3.2.2.2 Identification of Factors Affecting the Behavior of
SIMCON Jacketed Columns . . . . . . . . . . . . . . . . . . . . 30
3.2.3 Cost Analysis of SIMCON Jacketing . . . . . . . . . . . . . . . . . . . 34
IV. DURABILITY PERFORMANCE OF SIMCON . . . . . . . . . . . . . . . . . . . . . . 36
4.1 Overview . . . . . . . . . . . . . . . . . . . . . . . . . . . . . . . . . . . . . . . . . . . . . . . 36
4.2 Experimental Procedures . . . . . . . . . . . . . . . . . . . . . . . . . . . . . . . . . . . 36
4.2.1 Main Variables . . . . . . . . . . . . . . . . . . . . . . . . . . . . . . . . . . . . . 38
4.2.2 Mixture Used in the Experimental Study . . . . . . . . . . . . . . . . . 39
4.2.3 SIMCON Specimen Preparation and Testing . . . . . . . . . . . . . 42
4.2.4 Air Content . . . . . . . . . . . . . . . . . . . . . . . . . . . . . . . . . . . . . . . . 45
4.2.4.1 Test Method . . . . . . . . . . . . . . . . . . . . . . . . . . . . . . . . . 45
4.2.4.2 Results of Microscopic Examination . . . . . . . . . . . . . . 49
4.3 Test Results and Discussion . . . . . . . . . . . . . . . . . . . . . . . . . . . . . . . . . 50
4.3.1 Scaling Resistance . . . . . . . . . . . . . . . . . . . . . . . . . . . . . . . . . . 50
4.3.2 Effects of Cracking on Frost Durability . . . . . . . . . . . . . . . . . . 51
4.3.3 Corrosion of Fibers . . . . . . . . . . . . . . . . . . . . . . . . . . . . . . . . . 52
4.4 Conclusions . . . . . . . . . . . . . . . . . . . . . . . . . . . . . . . . . . . . . . . . . . . . . . 56
V. ANALYTICAL EVALUATION OF DESIGN AND CONSTRUCTION
FACTORS . . . . . . . . . . . . . . . . . . . . . . . . . . . . . . . . . . . . . . . . . . . . . . . . . . . . 57
5.1 Overview . . . . . . . . . . . . . . . . . . . . . . . . . . . . . . . . . . . . . . . . . . . . . . . 57
5.2 Identification of Factors to Be Evaluated . . . . . . . . . . . . . . . . . . . . . . . 58

vi
5.2.1 Identification of Design Factors with Significant Construction
Effects . . . . . . . . . . . . . . . . . . . . . . . . . . . . . . . . . . . . . . . . . . . 58
5.2.1.1 Bond Between SIMCON and Reinforced Concrete
Column . . . . . . . . . . . . . . . . . . . . . . . . . . . . . . . . . . . . . 58
5.2.1.2 SIMCON End Connections . . . . . . . . . . . . . . . . . . . . . 59
5.2.1.3 Removal of Load on Existing Reinforced Concrete
Column Prior to Jacketing . . . . . . . . . . . . . . . . . . . . . . 60
5.2.1.4 Thin Wall Buckling of SIMCON Jacket . . . . . . . . . . . 61
5.2.2 Identification of Factors Occurring During Construction . . . . 62
5.2.2.1 Routine Variations in SIMCON Strength . . . . . . . . . . 62
5.2.2.2 Routine Variations in SIMCON Jacket Thickness . . . 63
5.2.2.3 Non-Concentric Placement of the SIMCON Jacket
During Construction (Centering) . . . . . . . . . . . . . . . . . 63
5.2.2.4 Location and Strength of Fiber Mat Seams . . . . . . . . . 64
5.3 Analytical Methodology . . . . . . . . . . . . . . . . . . . . . . . . . . . . . . . . . . . . 65
5.3.1 Analytical Methods Used For Evaluation of Factors . . . . . . . . 65
5.3.2 Determination of Criticality of the Factors . . . . . . . . . . . . . . . 66
5.3.3 Cross Sections . . . . . . . . . . . . . . . . . . . . . . . . . . . . . . . . . . . . . 68
5.3.4 Material Characteristics . . . . . . . . . . . . . . . . . . . . . . . . . . . . . . 72
5.3.5 Assumptions for Structural Modeling . . . . . . . . . . . . . . . . . . . 78
5.4 Overview of Analytical Methods . . . . . . . . . . . . . . . . . . . . . . . . . . . . . 79
5.4.1 Moment-Curvature Analysis . . . . . . . . . . . . . . . . . . . . . . . . . . 79
vii
5.4.2 Application of Moment-Curvature Analysis to Available
Test Data . . . . . . . . . . . . . . . . . . . . . . . . . . . . . . . . . . . . . . . . . 84
5.4.3 Column Axial Load-Moment Interaction Diagrams . . . . . . . . 87
5.4.4 The Effects of Tolerances on Reinforced Concrete Section . . 89
5.5 Analysis of the Behavior of SIMCON Jacketed Reinforced
Concrete Columns . . . . . . . . . . . . . . . . . . . . . . . . . . . . . . . . . . . . . . . . 93
5.6 Results of Evaluation of Selected Construction Factors . . . . . . . . . . 102
5.6.1 Bond Between SIMCON and Reinforced Concrete Column . 102
5.6.2 Removal of Load on Existing Reinforced Concrete Column
Prior to Jacketing . . . . . . . . . . . . . . . . . . . . . . . . . . . . . . . . . . 114
5.6.3 The Effects of Routine Strength Variations of SIMCON . . . 118
5.6.4 The Effect of Routine Variations in SIMCON Thickness . . . 123
5.6.5 The Effect of Displacement of the SIMCON Jacket During
Construction . . . . . . . . . . . . . . . . . . . . . . . . . . . . . . . . . . . . . . 129
5.6.6 Effects of SIMCON Seams . . . . . . . . . . . . . . . . . . . . . . . . . . 134
5.6.7 Thin Wall SIMCON Jacket . . . . . . . . . . . . . . . . . . . . . . . . . . 140
5.6.8 SIMCON Jacket End Connections . . . . . . . . . . . . . . . . . . . . . 144
5.7 Summary of Analytical Evaluation . . . . . . . . . . . . . . . . . . . . . . . . . . 147
5.7.1 Summary of Analytical Evaluation of Selected Factors . . . . 147
5.7.2 Modification of Strength Reduction Factor for SIMCON
Jacketed Column . . . . . . . . . . . . . . . . . . . . . . . . . . . . . . . . . . 150
5.8 Conclusions and Recommendations . . . . . . . . . . . . . . . . . . . . . . . . . 152
viii
VI. COMPARISON OF ALTERNATIVE STRENGTHENING TECHNIQUES
AND COST ANALYSIS . . . . . . . . . . . . . . . . . . . . . . . . . . . . . . . . . . . . . . . . . 155
6.1 Overview . . . . . . . . . . . . . . . . . . . . . . . . . . . . . . . . . . . . . . . . . . . . . . . 155
6.2 Confinement by Jackets . . . . . . . . . . . . . . . . . . . . . . . . . . . . . . . . . . . . 156
6.2.1 Steel Jackets . . . . . . . . . . . . . . . . . . . . . . . . . . . . . . . . . . . . . . . 157
6.2.2 FRP Jackets . . . . . . . . . . . . . . . . . . . . . . . . . . . . . . . . . . . . . . . 160
6.2.3 Reinforced Concrete Jackets . . . . . . . . . . . . . . . . . . . . . . . . . . 163
6.2.4 Demolishing the Existing Reinforced Concrete Column and
Building a New Reinforced Concrete Column . . . . . . . . . . . 165
6.2.5 Adding a Steel Tube or Column Next to the Existing Member 166
6.3 Cost Analysis of SIMCON Jacketed Columns . . . . . . . . . . . . . . . . . . 166
6.3.1 Assumptions in Estimating Project Management Costs . . . . . 167
6.3.2 Work Breakdown Structure of SIMCON Jacketed Reinforced
Concrete Column . . . . . . . . . . . . . . . . . . . . . . . . . . . . . . . . . . . 169
6.3.3 Cost Analysis of SIMCON Jacketed Reinforced Concrete
Column . . . . . . . . . . . . . . . . . . . . . . . . . . . . . . . . . . . . . . . . . . . 172
6.3.4 Cost Data of Alternative Strengthening Techniques . . . . . . . 180
6.4 Conclusions . . . . . . . . . . . . . . . . . . . . . . . . . . . . . . . . . . . . . . . . . . . . . 182
VII. CONCLUSIONS AND RECOMMENDATIONS . . . . . . . . . . . . . . . . . . . . . 183
7.1 Conclusions . . . . . . . . . . . . . . . . . . . . . . . . . . . . . . . . . . . . . . . . . . . . . 183
7.2 Recommendations . . . . . . . . . . . . . . . . . . . . . . . . . . . . . . . . . . . . . . . . 185
REFERENCES . . . . . . . . . . . . . . . . . . . . . . . . . . . . . . . . . . . . . . . . . . . . . . . . . . . . . . 188

ix
APPENDIX A SIMCON MATERIAL PROPERTIES . . . . . . . . . . . . . . . . . . 198
A.1 SIMCON Tensile Strength . . . . . . . . . . . . . . . . . . . . . . . . . . . . . . . . . . 198
A.2 SIMCON Compressive Strength . . . . . . . . . . . . . . . . . . . . . . . . . . . . . 199
APPENDIX B SIMCON SCALING TEST SPECIMENS . . . . . . . . . . . . . . . 202
APPENDIX C RESULTS OF EVALUATION OF DESIGN AND
CONSTRUCTION FACTORS . . . . . . . . . . . . . . . . . . . . . . . . . 210

x
LIST OF TABLES
2.1 Slurry mixture proportions . . . . . . . . . . . . . . . . . . . . . . . . . . . . . . . . . . . . . . . . 17
3.1 Research methodology matrix . . . . . . . . . . . . . . . . . . . . . . . . . . . . . . . . . . . . . 28
4.1 Scaling test variables and SIMCON specimens’ properties . . . . . . . . . . . . . . 40
4.2 Slurry mixture proportions by mass . . . . . . . . . . . . . . . . . . . . . . . . . . . . . . . . . 40
4.3 Compression strength of slurries with and without air entrainment . . . . . . . . 45
5.1 Cross section configurations used in the analysis . . . . . . . . . . . . . . . . . . . . . . 76
5.2 The effects of tolerances for reinforced concrete column . . . . . . . . . . . . . . . . 92
5.3 Statistical evaluation of analytical results . . . . . . . . . . . . . . . . . . . . . . . . . . . 149
6.1 Crew labor hours . . . . . . . . . . . . . . . . . . . . . . . . . . . . . . . . . . . . . . . . . . . . . . . 173
6.2 Equipment costs . . . . . . . . . . . . . . . . . . . . . . . . . . . . . . . . . . . . . . . . . . . . . . . . 174
6.3 Slurry material costs . . . . . . . . . . . . . . . . . . . . . . . . . . . . . . . . . . . . . . . . . . . . . 174
6.4 Material costs . . . . . . . . . . . . . . . . . . . . . . . . . . . . . . . . . . . . . . . . . . . . . . . . . . 175
6.5 SIMCON jacket costs for the retrofit of a single reinforced concrete column 179
6.6 The likely high cost for SIMCON jacketing of a single reinforced
concrete column . . . . . . . . . . . . . . . . . . . . . . . . . . . . . . . . . . . . . . . . . . . . . . . . 180
A.1 Average values of SIMCON tensile tests . . . . . . . . . . . . . . . . . . . . . . . . . . . . . 199
A.2 Specific values to be used in equations for predicting injected SIMCON
specimens’ compression stress-strain response . . . . . . . . . . . . . . . . . . . . . . . 200
C.1 The effect of reinforcement placement on maximum moment capacities
of reinforced concrete sections . . . . . . . . . . . . . . . . . . . . . . . . . . . . . . . . . . . . 210
xi
C.2 The effect of reinforcement placement on axial load capacities of reinforced
concrete sections . . . . . . . . . . . . . . . . . . . . . . . . . . . . . . . . . . . . . . . . . . . . . . . 211
C.3 The effect of routine variations in concrete strength on maximum moment
capacities of reinforced concrete sections . . . . . . . . . . . . . . . . . . . . . . . . . . . . 212
C.4 The effect of routine variations in concrete strength on axial load capacities
of reinforced concrete sections . . . . . . . . . . . . . . . . . . . . . . . . . . . . . . . . . . . . 213
C.5 The effect of dimensional tolerances of concrete on maximum moment
capacities of reinforced concrete sections . . . . . . . . . . . . . . . . . . . . . . . . . . . . 215
C.6 The effect of dimensional tolerances of concrete on axial load capacities
of reinforced concrete sections . . . . . . . . . . . . . . . . . . . . . . . . . . . . . . . . . . . . 216
C.7 The increase in maximum moment capacities of reinforced concrete
sections provided by the SIMCON jacket . . . . . . . . . . . . . . . . . . . . . . . . . . . . 216
C.8 The increase in axial load capacities of reinforced concrete sections provided
by the SIMCON jacket . . . . . . . . . . . . . . . . . . . . . . . . . . . . . . . . . . . . . . . . . . . 218
C.9 The effect of bonding of SIMCON jacket in maximum moment capacities . . 219
C.10 The effect of existing load on maximum moment capacities . . . . . . . . . . . . . 220
C.11 The effect of existing load on axial load capacities . . . . . . . . . . . . . . . . . . . . . 223
C.12 The effect of routine strength variations of SIMCON on maximum
moment capacities . . . . . . . . . . . . . . . . . . . . . . . . . . . . . . . . . . . . . . . . . . . . . . 225
C.13 The effect of routine strength variations of SIMCON on axial load capacities 228
C.14 The effect of routine thickness variations of SIMCON on maximum
moment capacities . . . . . . . . . . . . . . . . . . . . . . . . . . . . . . . . . . . . . . . . . . . . . . 231
xii
C.15 The effect of routine thickness variations of SIMCON on axial load
capacities . . . . . . . . . . . . . . . . . . . . . . . . . . . . . . . . . . . . . . . . . . . . . . . . . . . . . 234
C.16 The effect of non-concentric placement of SIMCON during construction
on maximum moment capacities . . . . . . . . . . . . . . . . . . . . . . . . . . . . . . . . . . . 237
C.17 The effect of non-concentric placement of SIMCON during construction
on axial load capacities . . . . . . . . . . . . . . . . . . . . . . . . . . . . . . . . . . . . . . . . . . 241
C.18 The effect of reduced strength SIMCON seams and seam locations
on maximum moment capacities . . . . . . . . . . . . . . . . . . . . . . . . . . . . . . . . . . . 244
C.19 The effect of reduced strength SIMCON seams and seam locations
on axial load capacities . . . . . . . . . . . . . . . . . . . . . . . . . . . . . . . . . . . . . . . . . . 251

xiii
LIST OF FIGURES
2.1 Comparison of load-deflection curves of SIFCON, ordinary FRC with 2% steel
fibers, and the plain matrix loaded in three-point bending (Naaman, 1992) . . 5
2.2 SIMCON mat cut from a roll . . . . . . . . . . . . . . . . . . . . . . . . . . . . . . . . . . . . . . 7
2.3 Load-deflection behavior of SIFCON compared to SIMCON loaded in
three-point bending (Hackman, 1992) . . . . . . . . . . . . . . . . . . . . . . . . . . . . . . . 8
2.4 SIMCON mat roll as delivered . . . . . . . . . . . . . . . . . . . . . . . . . . . . . . . . . . . . 9
2.5 Concrete surface decay in the form of scaling in the presence of deicing
chemicals (ACI 201, 1992) . . . . . . . . . . . . . . . . . . . . . . . . . . . . . . . . . . . . . . . 13
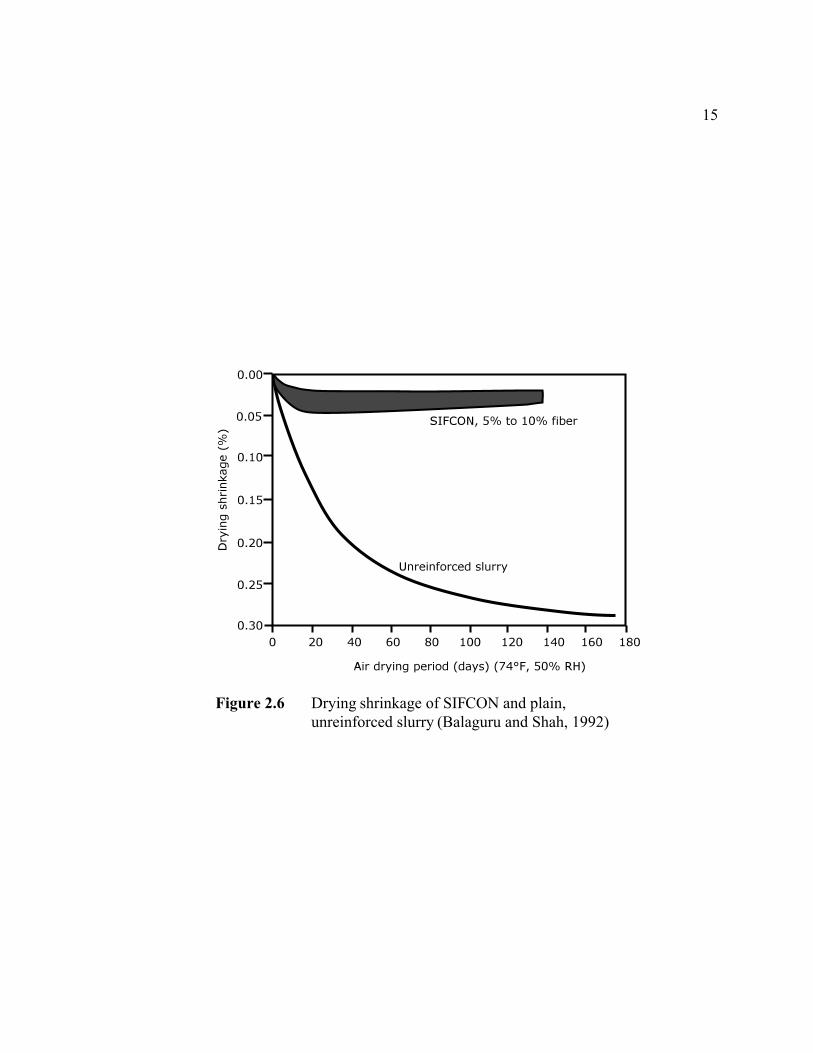
2.6 Drying shrinkage of SIFCON and plain, unreinforced slurry (Balaguru and
Shah, 1992) . . . . . . . . . . . . . . . . . . . . . . . . . . . . . . . . . . . . . . . . . . . . . . . . . . . 15
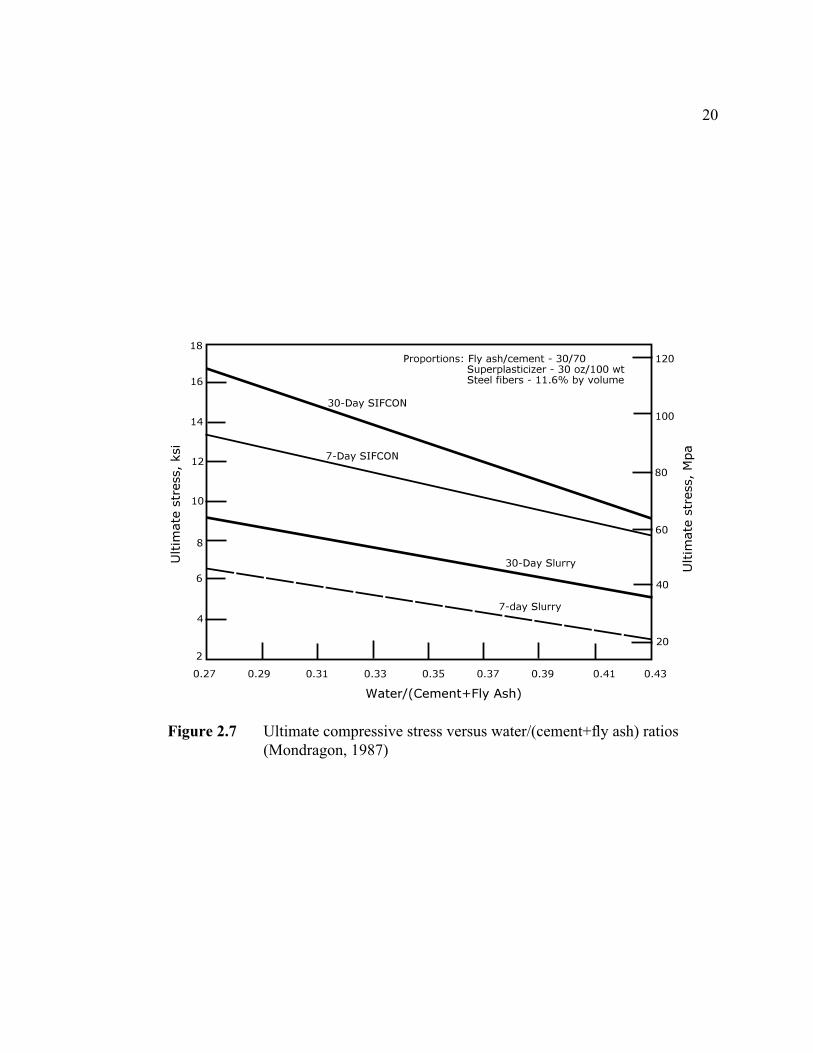
2.7 Ultimate compressive stress versus water/(cement+fly ash) ratios
(Mondragon, 1987) . . . . . . . . . . . . . . . . . . . . . . . . . . . . . . . . . . . . . . . . . . . . . 20
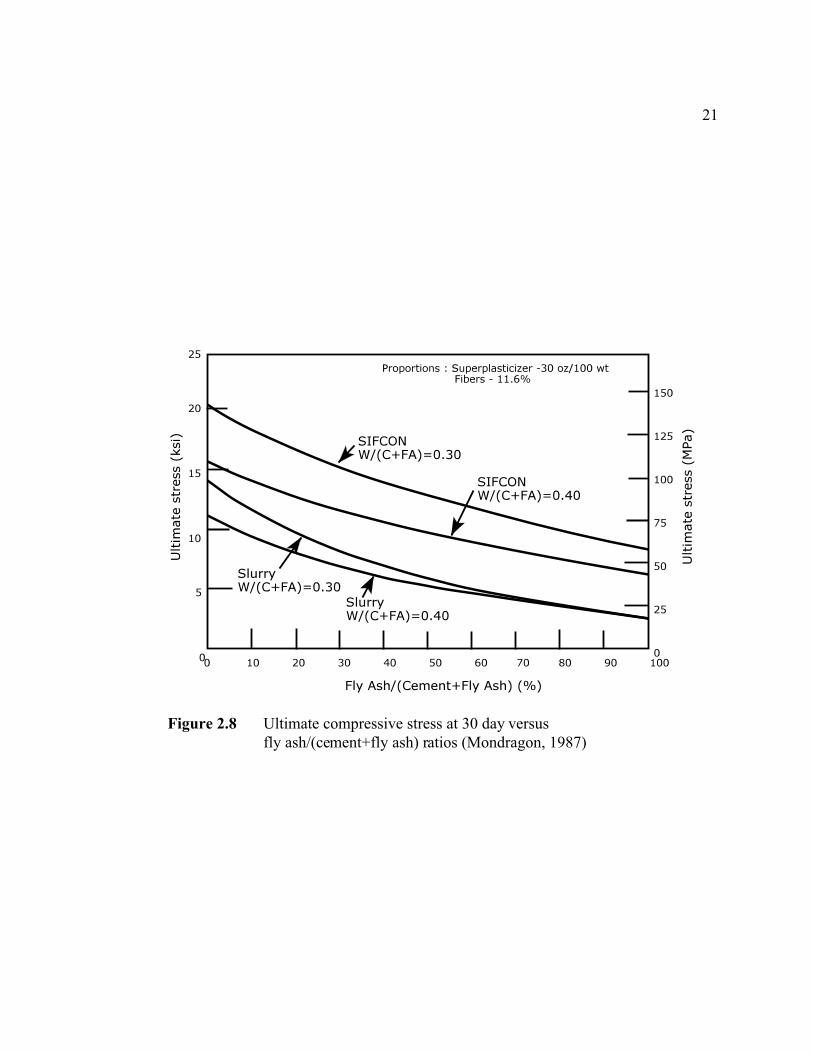
2.8 Ultimate compressive stress at 30 day versus fly ash/(cement+fly ash) ratios
(Mondragon, 1987) . . . . . . . . . . . . . . . . . . . . . . . . . . . . . . . . . . . . . . . . . . . . . 21
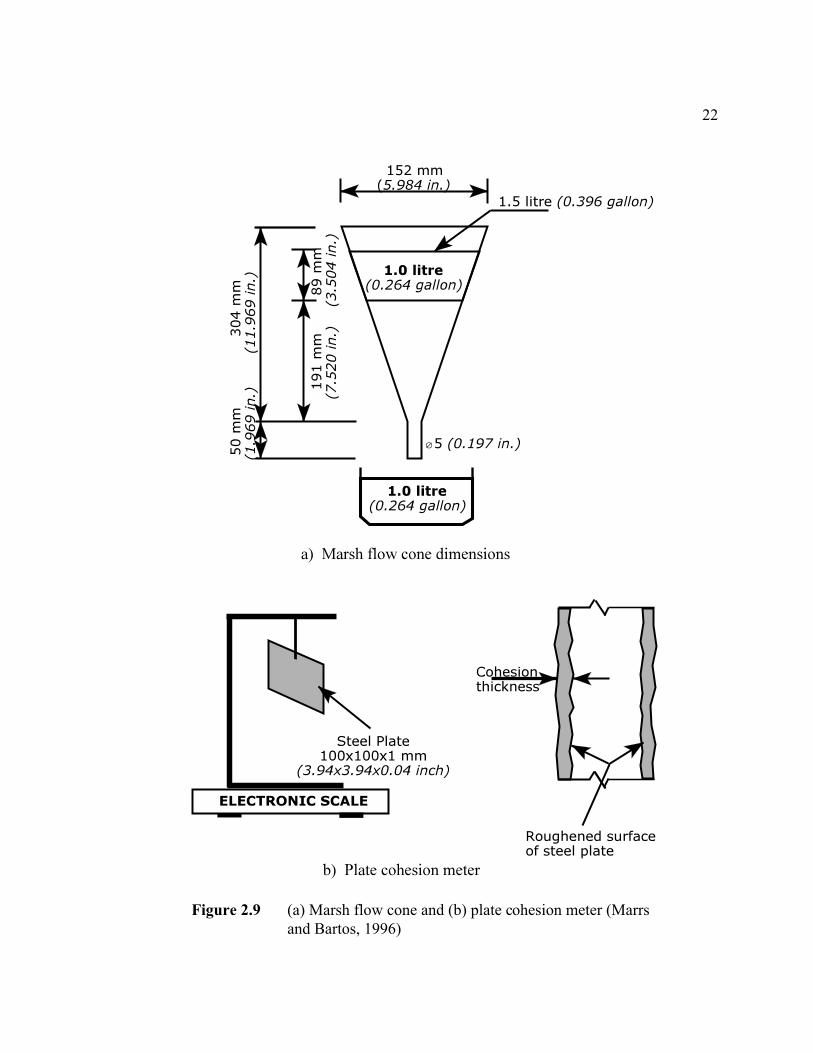
2.9 (a) Marsh flow cone and (b) plate cohesion meter (Marrs and Bartos, 1996) 22
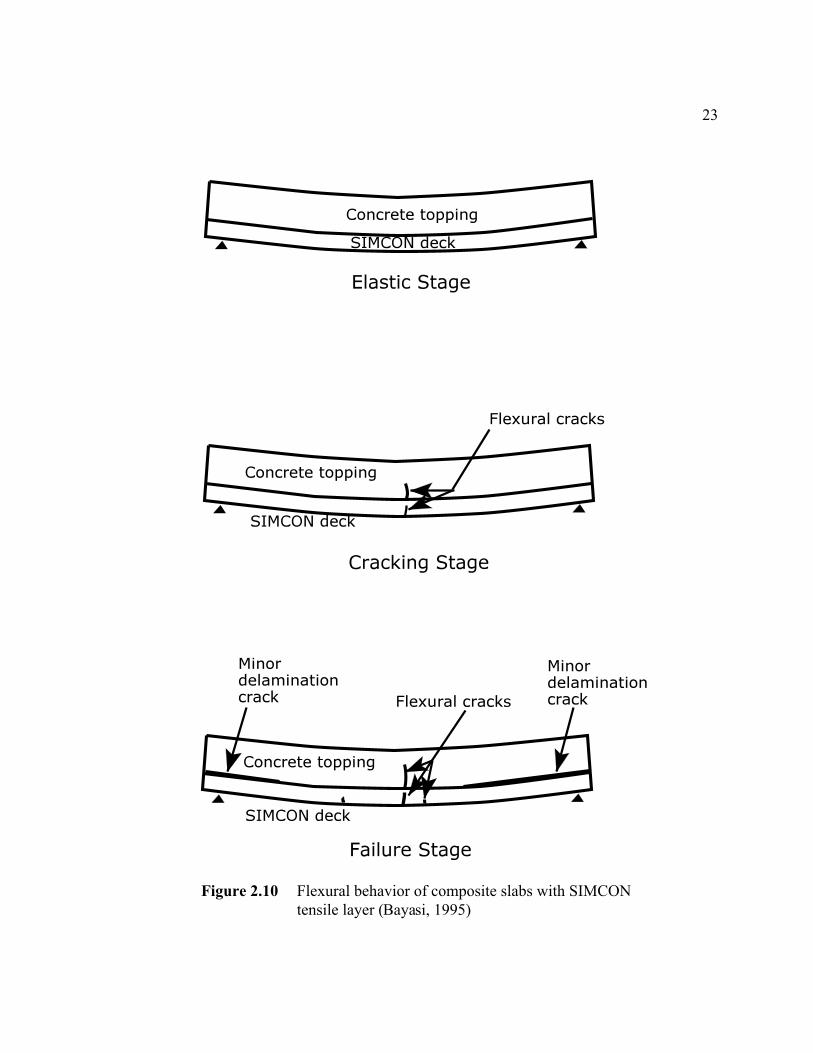
2.10 Flexural behavior of composite slabs with SIMCON tensile layer
(Bayasi, 1995) . . . . . . . . . . . . . . . . . . . . . . . . . . . . . . . . . . . . . . . . . . . . . . . . . 23
2.11 Experimental moment-curvature diagram of reinforced concrete-SIMCON
composite beams (Krstulovic, 1997) . . . . . . . . . . . . . . . . . . . . . . . . . . . . . . . . 25
4.1 SIMCON specimen for deicing salt scaling test . . . . . . . . . . . . . . . . . . . . . . . 43

xiv
4.2 Time-temperature graph of freezing environment . . . . . . . . . . . . . . . . . . . . . . 44
4.3 Slurry cube cuts for microscopical examination of the air void system . . . . . 47
4.4 Entrained air bubbles in hardened slurry . . . . . . . . . . . . . . . . . . . . . . . . . . . . . 48
4.5 Rust stains on the side surface of specimen A13CR-9 . . . . . . . . . . . . . . . . . . . 54
4.6 0.7 inch (18 mm) deep cut from specimen A13CR-9 . . . . . . . . . . . . . . . . . . . . 55
5.1 Definitions of Pn,max and Mo,max . . . . . . . . . . . . . . . . . . . . . . . . . . . . . . . . . . . . . . 67
5.2 Cross sections used in analysis . . . . . . . . . . . . . . . . . . . . . . . . . . . . . . . . . . . . 69
5.3 Reinforcement steel stress-strain relationship . . . . . . . . . . . . . . . . . . . . . . . . . 73
5.4 Concrete stress-strain relationship . . . . . . . . . . . . . . . . . . . . . . . . . . . . . . . . . . 74
5.5 SIMCON stress-strain relationship . . . . . . . . . . . . . . . . . . . . . . . . . . . . . . . . . 75
5.6 Curved beam-column and curvature, n = g / d . . . . . . . . . . . . . . . . . . . . . . . . 80
5.7 Reinforced concrete beam-column cross section, strains and internal forces . 82
5.8 Comparison of experimental and analytical moment-curvature diagrams of
reinforced concrete-SIMCON composite beams (Krstulovic, 1997) . . . . . . . . 85
5.9 Calculation of axial load-moment values for a SIMCON jacketed,
reinforced concrete column section . . . . . . . . . . . . . . . . . . . . . . . . . . . . . . . . . 88
5.10 Perfect bond between reinforced concrete and SIMCON . . . . . . . . . . . . . . . . 94
5.11 Perfectly bonded section strains and internal forces . . . . . . . . . . . . . . . . . . . . 96
5.12 Reinforced concrete section capacities are compared to perfectly bonded
SIMCON jacketed section capacities based on cross-section type . . . . . . . . . 98
5.13 Axial load-moment interaction diagram: square column . . . . . . . . . . . . . . . . 100
5.14 Axial load-moment interaction diagram: circular column . . . . . . . . . . . . . . . 101

xv
5.15 Axial load capacity ratios of SIMCON jacketed sections to reinforced
concrete sections . . . . . . . . . . . . . . . . . . . . . . . . . . . . . . . . . . . . . . . . . . . . . . 103
5.16 No bond between reinforced concrete and SIMCON . . . . . . . . . . . . . . . . . . 104
5.17 Strains and internal forces for non-composite SIMCON jacketed
reinforced concrete section . . . . . . . . . . . . . . . . . . . . . . . . . . . . . . . . . . . . . . 106
5.18 Superposed moment-curvature of unbonded section . . . . . . . . . . . . . . . . . . . 107
5.19 Unbonded and perfectly bonded cases of square section . . . . . . . . . . . . . . . . 108
5.20 Unbonded and perfectly bonded cases of circular section . . . . . . . . . . . . . . . 109
5.21 Maximum moment ratios of unbonded sections to those of perfectly bonded
sections . . . . . . . . . . . . . . . . . . . . . . . . . . . . . . . . . . . . . . . . . . . . . . . . . . . . . . 112
5.22 Moment-curvature of square section with initial strain of 0.1% . . . . . . . . . . 116
5.23 Moment-curvature of circular section with initial strain of 0.1% . . . . . . . . . 117
5.24 Effects of initial existing strain on maximum moments . . . . . . . . . . . . . . . . 119
5.25 Effects of initial strain on axial load capacity ratios . . . . . . . . . . . . . . . . . . . 120
5.26 Effects of SIMCON routine strength variations on maximum moments . . . . 122
5.27 Effects of SIMCON routine strength variations on axial load capacity ratios 124
5.28 Effects of SIMCON thickness variations on maximum moments . . . . . . . . . 126
5.29 Effects of routine variations in SIMCON thickness on axial load capacity
ratios . . . . . . . . . . . . . . . . . . . . . . . . . . . . . . . . . . . . . . . . . . . . . . . . . . . . . . . . 128
5.30 Non-concentrically placed SIMCON jacket around reinforced
concrete member . . . . . . . . . . . . . . . . . . . . . . . . . . . . . . . . . . . . . . . . . . . . . . 130
5.31 Effects of non-concentric placement of SIMCON on maximum moments . . 132
xvi
5.32 Effects of non-concentric placement of SIMCON on axial load capacity
ratios . . . . . . . . . . . . . . . . . . . . . . . . . . . . . . . . . . . . . . . . . . . . . . . . . . . . . . . . 133
5.33 Fiber mat seam locations on a SIMCON jacketed column . . . . . . . . . . . . . . 135
5.34 Analyzed fiber mat seam locations on a SIMCON jacketed column when
SIMCON is placed longitudinally . . . . . . . . . . . . . . . . . . . . . . . . . . . . . . . . . 137
5.35 Effects of SIMCON seams on maximum moments . . . . . . . . . . . . . . . . . . . . 138
5.36 Effects of SIMCON seams on axial load capacity ratios . . . . . . . . . . . . . . . . 139
5.37 Thin wall circular SIMCON tube local buckling critical stress . . . . . . . . . . . 142
5.38 Thin wall square SIMCON tube local buckling critical stress . . . . . . . . . . . . 143
5.39 Epoxy grouted gap between SIMCON jacket pedestal and slab . . . . . . . . . . 146
6.1 Column retrofit to increase confinement with steel hoops (Xanthakos, 1996) 158
6.2 Column retrofit using steel plate encasement (Xanthakos, 1996) . . . . . . . . . . 159
6.3 The REPLARK method for polymer composite wrapping of
columns (Hollaway and Head, 2001) . . . . . . . . . . . . . . . . . . . . . . . . . . . . . . . . 161
6.4 Xxsys Technologies for polymer composite wrapping of columns
(Hollaway and Head, 2001) . . . . . . . . . . . . . . . . . . . . . . . . . . . . . . . . . . . . . . . 162
6.5 Strengthening a column with reinforced concrete jacket (Xanthakos, 1996) . 164
B.1 Specimen A11NC-3 after scaling resistance test . . . . . . . . . . . . . . . . . . . . . . . 202
B.2 Specimen A12CR-6 after scaling resistance test . . . . . . . . . . . . . . . . . . . . . . . . 203
B.3 Specimen A13CR-9 after scaling resistance test . . . . . . . . . . . . . . . . . . . . . . . 204
B.4 Specimen A14NC-10 after scaling resistance test . . . . . . . . . . . . . . . . . . . . . . 205
B.5 Specimen N21CR-5a after scaling resistance test . . . . . . . . . . . . . . . . . . . . . . 206
xvii
B.6 Specimen N22NC-6a after scaling resistance test . . . . . . . . . . . . . . . . . . . . . . 207
B.7 Specimen N23CR-7a after scaling resistance test . . . . . . . . . . . . . . . . . . . . . . 208
B.8 Specimen N24NC-8a after scaling resistance test . . . . . . . . . . . . . . . . . . . . . . 209

xviii
LIST OF SYMBOLS
Abbreviations
ACI American Concrete Institute
ASCE American Society of Civil Engineers
ASTM American Society for Testing and Materials
EPA Environmental Protection Agency
FRC Fiber Reinforced Concrete
FRP Fiber Reinforced Polymer
HPFRCC High Performance Fiber Reinforced Cement Concrete
HRWRA High Range Water Reducing Admixture
ksf kips per square foot
ksi kips per square inch
kPa kilo Pascal
mm millimeter
MPa Mega Pascal
n.a. neutral axis
OSHA Occupational Safety and Health Administration
psf pounds per square foot
psi pounds per square inch
r.c. reinforced concrete
R.H. relative humidity
SIFCON Slurry Infiltrated Fiber Concrete

xix
SIMCON Slurry Infiltrated Fiber Mat Concrete
Nomenclature
A area
As area of reinforcement
b width of square cross section
C compressive force
CC concrete compressive force
CR reinforcement compressive force
CSIMCON SIMCON compressive force
D diameter of circular cross section
dc distance of concrete element from the neutral axis
ds distance of reinforcement from the neutral axis
dSIMCON distance of SIMCON element from the neutral axis
Es modulus of elasticity of reinforcement (Young’s modulus)
Esh strain-hardening modulus
e eccentricity of axial load at end of column
F degree Fahrenheit
fy specified yield strength of reinforcement
fc calculated stress in concrete
fct calculated tensile stress in concrete
fc! specified compressive strength of concrete
xx
fs calculated stress in reinforcement
fSIMCON calculated stress in SIMCON
fu ultimate stress
h full depth of square cross section
I moment of inertia
l height of column
M moment
MU ultimate moment
MCC Moment of concrete compressive force
MCR Moment of reinforcement compressive force
MCSIMCON Moment of SIMCON compressive force
MTC Moment of concrete tensile force
MTR Moment of reinforcement tensile force
MTSIMCON Moment of SIMCON tensile force
P nominal axial load
PU ultimate axial load
R radius of curvature
T tensile force
TC concrete tensile force
TR reinforcement tensile force
TSIMCON SIMCON tensile force
t thickness
xxi
Vf volume of fibers
xt distance from extreme tension fiber of section to neutral axis
x! distance from extreme compression fiber of section to neutral axis
g unit strain
gc concrete compressive strain
gsh strain at onset of strain hardening
gy yield strain
F calculated stress
D ratio of reinforcement to concrete area
N strength reduction factor
n curvature

CHAPTER I
INTRODUCTION
1.1 OVERVIEW
A research program directed by the National Science Foundation [1995] stated that
due to aging, overexposure, and other factors, many of the civil infrastructure systems, which
constitute a major portion of U.S. national wealth, are rapidly deteriorating as a result of
environmental factors and fatigue and are becoming more vulnerable to catastrophic failure.
The report calls for the development of novel, cost effective methods for infrastructural
repair and retrofit as an essential factor in economical well-being and sustainable
development (NSF 95-52, 1995).
As the number of civil infrastructure systems increases worldwide, the number of
deteriorated buildings and structures also increases. Complete replacement is likely to be an
increasing financial burden and might certainly be a waste of natural resources if upgrading
or strengthening is a viable alternative (Hollaway & Leeming, 1999).
Many reinforced concrete buildings and structures need repair or strengthening to
increase their load carrying capacities or enhance ductility under seismic loading (Naaman
& Reinhardt, 1995; Hollaway & Leeming, 1999). As an example, bridge piers designed
using currently obsolete criteria may need to be upgraded to meet existing requirements.
2
Other factors, such as inadequate transverse confinement or flaws in structural design may
also contribute to structural deficiency. Additionally, a structure may need to be upgraded
to limit deflections or to control cracking due to changes in service conditions. Moreover,
a column may need to be strengthened to support one or more added floors (Newman, 2001).
Strengthening may be required due to changes in use or chosen to extend useful life
while minimizing capital outlay. In these situations, strengthening can be advantageous
compared to (a) demolishing the structure or member and constructing a new one, or (b)
restricting use, limiting imposed loads, and continuously monitoring the structure.
Strengthening of reinforced concrete structures will typically include column
strengthening since the failure of a column has serious consequences for structural stability
(ACI 318, 2002). Alternatives for column strengthening may include:
a) Section enlargement,
b) Steel wrapping,
c) FRP wrapping, and
d) Wrapping with High Performance Fiber Reinforced Cement Composites
(HPFRCC).
1.2 PROBLEM STATEMENT
Slurry Infiltrated Mat Concrete (SIMCON) is one type of HPFRCC which can be
used to improve both load carrying capacity and ductility of reinforced concrete columns.
However, certain critical construction and constructibility factors affecting the SIMCON
jacketed column behavior, including the frost durability of SIMCON, must be resolved

3
before this technology can be applied routinely. Consequently, the goal of this research was
to identify factors associated with the construction of a SIMCON jacket, evaluate the
influence of these factors on service load and ultimate state behavior, determine which of
these factors are critical to the performance of the SIMCON jacket, and develop general
guidelines for the construction or design of SIMCON jackets on existing columns. In
addition, an approximate cost of SIMCON jackets for existing reinforced concrete columns
was developed in order to compare with approximate costs of alternative strengthening
techniques.

4
CHAPTER II
LITERATURE REVIEW
2.1 FIBER REINFORCED CONCRETES
Fiber reinforced concrete (FRC) has been used since the 1960's (ACI 544.1, 1996),
although use was generally limited to warehouse floor or pavement overlays. Steel, glass,
carbon, and polymers have been used commercially as fibers in concrete (ACI 544.1, 1996).
These fibers are produced in many shapes and sizes and are added to concrete in several
ways. The fiber volume in typical, commercially available fiber reinforced concrete usually
varies between 2% to 4%. Despite the fact that FRC is used for a variety of applications such
as tunnel linings, hydraulic structures, and explosion resistant structures (ACI 544.3, 1993),
the lack of design guidelines and mixing problems in the field have limited their use in
structural applications.
High Performance Fiber Reinforced Cement Composites (HPFRCC) were developed
in the 1990's to improve performance characteristics of fiber reinforced concrete (Naaman
and Reinhardt, 1995). In a special HPFRCC application termed Slurry Infiltrated Fiber
Concrete (SIFCON), steel fibers are placed inside a mold and then infiltrated by a high
strength, cementitious slurry. Although SIFCON can achieve higher strength and energy
absorption values under compression than plain concrete (Figure 2.1), this requires a
relatively large amount of fibers, about 12% to 15% (Hackman, et al, 1992), which is very

5
Figure 2.1 Comparison of load-deflection curves of SIFCON,ordinary FRC with 2% steel fibers, and the plainmatrix loaded in three-point bending (Naaman,1992)
6
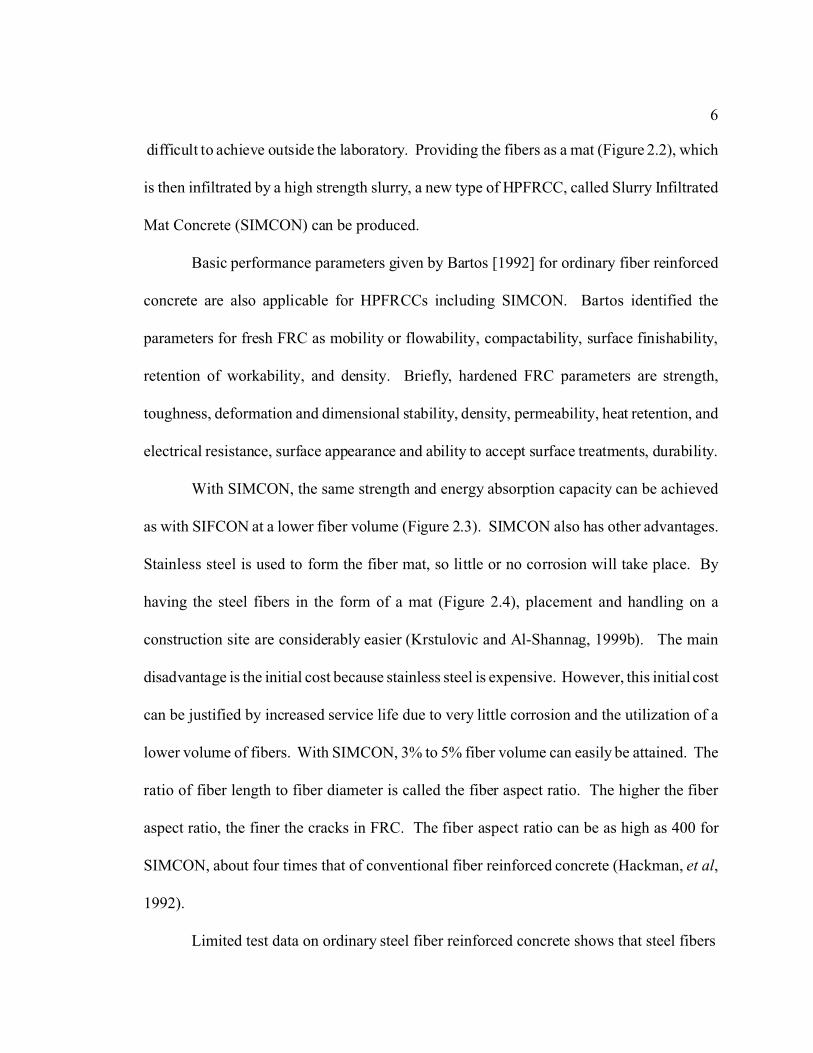
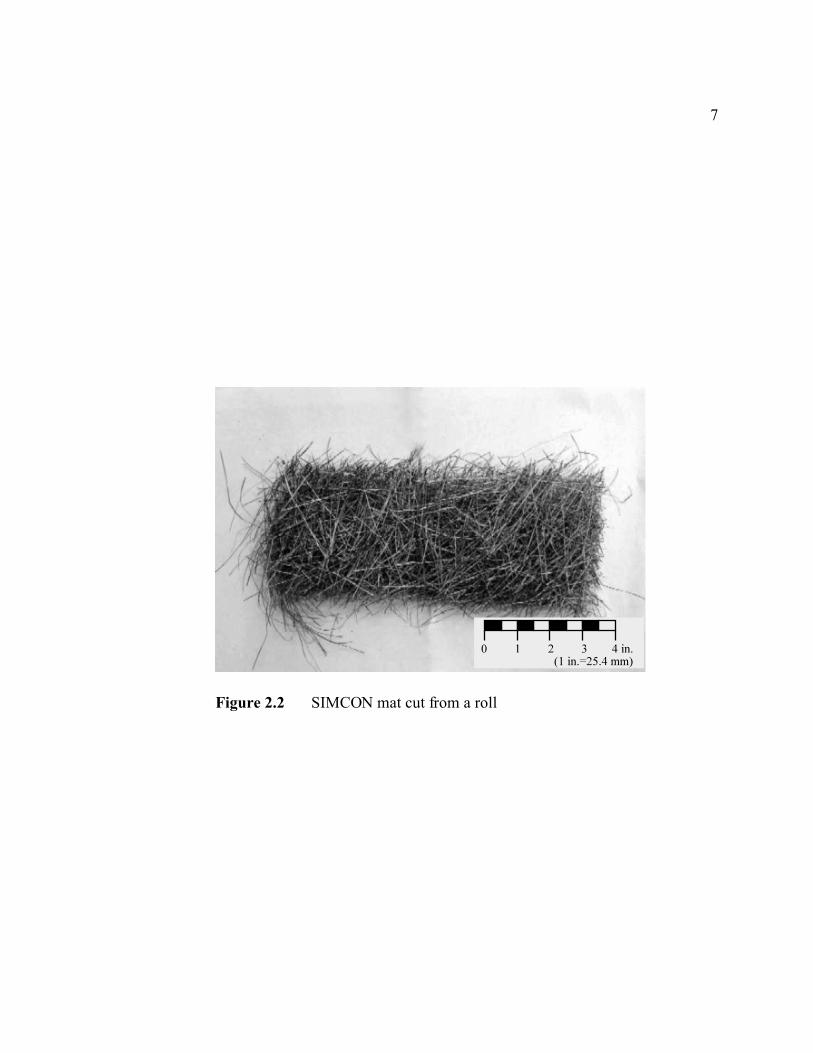
difficult to achieve outside the laboratory. Providing the fibers as a mat (Figure 2.2), which
is then infiltrated by a high strength slurry, a new type of HPFRCC, called Slurry Infiltrated
Mat Concrete (SIMCON) can be produced.
Basic performance parameters given by Bartos [1992] for ordinary fiber reinforced
concrete are also applicable for HPFRCCs including SIMCON. Bartos identified the
parameters for fresh FRC as mobility or flowability, compactability, surface finishability,
retention of workability, and density. Briefly, hardened FRC parameters are strength,
toughness, deformation and dimensional stability, density, permeability, heat retention, and
electrical resistance, surface appearance and ability to accept surface treatments, durability.
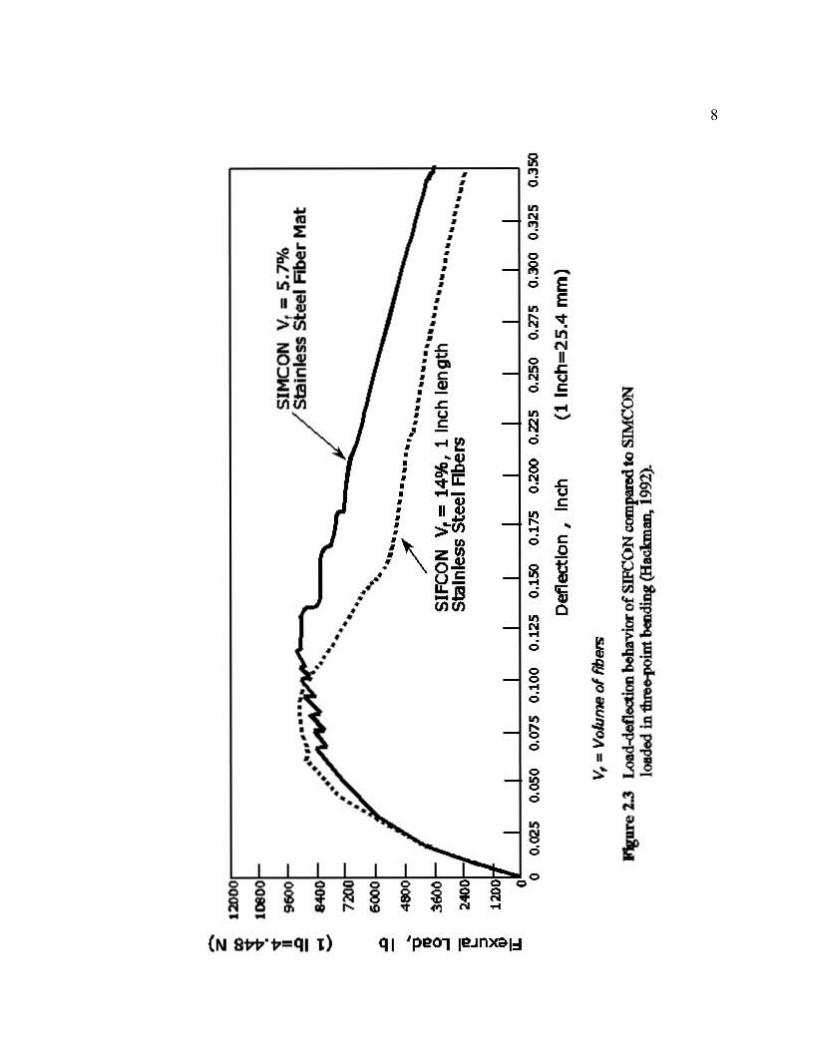
With SIMCON, the same strength and energy absorption capacity can be achieved
as with SIFCON at a lower fiber volume (Figure 2.3). SIMCON also has other advantages.
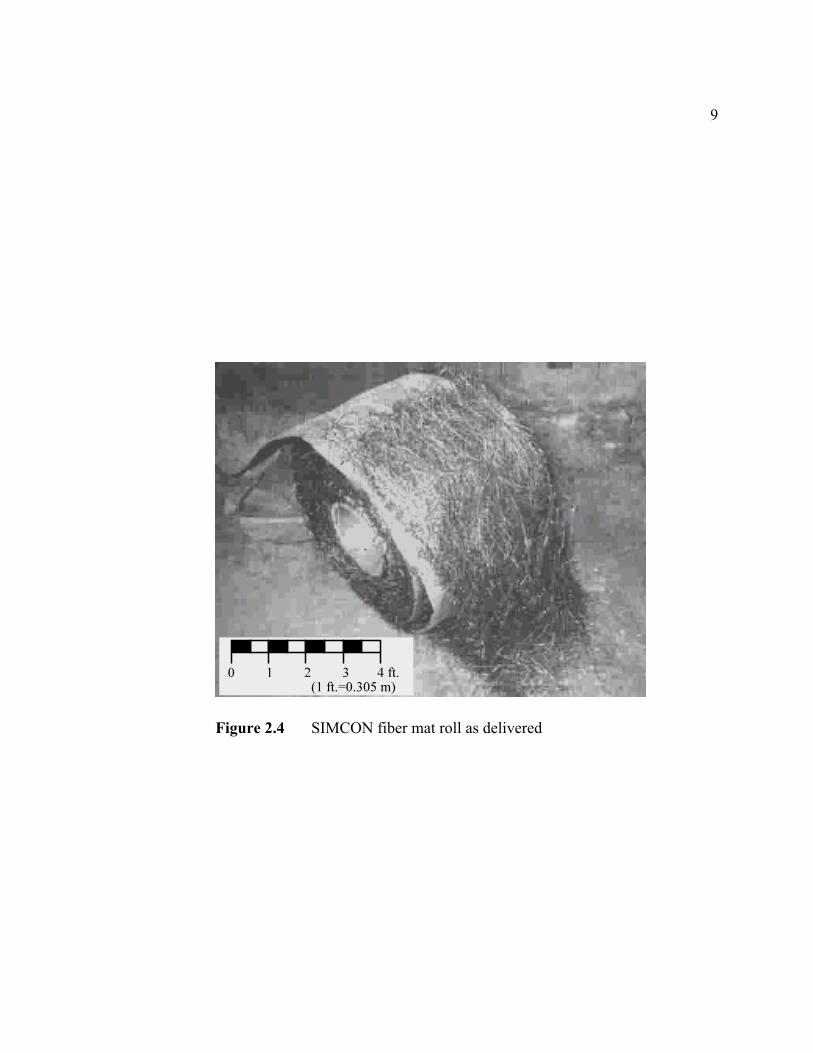
Stainless steel is used to form the fiber mat, so little or no corrosion will take place. By
having the steel fibers in the form of a mat (Figure 2.4), placement and handling on a
construction site are considerably easier (Krstulovic and Al-Shannag, 1999b). The main
disadvantage is the initial cost because stainless steel is expensive. However, this initial cost
can be justified by increased service life due to very little corrosion and the utilization of a
lower volume of fibers. With SIMCON, 3% to 5% fiber volume can easily be attained. The
ratio of fiber length to fiber diameter is called the fiber aspect ratio. The higher the fiber
aspect ratio, the finer the cracks in FRC. The fiber aspect ratio can be as high as 400 for
SIMCON, about four times that of conventional fiber reinforced concrete (Hackman, et al,
1992).
Limited test data on ordinary steel fiber reinforced concrete shows that steel fibers
7
Figure 2.2 SIMCON mat cut from a roll
8
• • " • • 0
• ~ • -• - ~ • • % • • 0
f." • • • • -. ~ • -• e ~ • 0
.Ii • e • • -->-;)1 •
" ~ • • 0 ~
~~ • :5 N
~ I
~ .• : a - ~ • c v • • 0 c
~ ~El · -• ~ • ~
"x • ~ - -~
~ • " , ~. 0 • • -.li . ~ • ~ • !!,o: -• jj U • 0 • ~-• II .!! c • • Ii • -• >"' " -• c S~ .\ . 0
: ZUl 0 •• oJ.!
- • ~ ~l!l / ~.: " .. _B 0 'Ii ]f .. en (/} 0 • - -• N • " • I • 0 •
~ l • ~., - g ~
" ~ 0 l • • - .. • - ~ • S • 1 • 0 • • •
....... ", .. - 0 >' • 0 ~ - - ~ " 0
I I II I II 00
~ 8 ~ ~ ~ ~ § ~ 0 0
~ " • , • " " --(N 8vv·v- QI t ) q I 'PI!Ol Ii?JnlGl::I
9
Figure 2.4 SIMCON fiber mat roll as delivered

10
in cracked concrete may become subject to corrosion (ACI 544.1R, 1996). Fibers used in
SIMCON are stainless steel fibers directly shaped from molten metal using a chilled wheel
(Hackman, et al, 1992). Using stainless steel fibers should help to minimize the corrosion
of fibers in service compared to other ferrous based fibers.
2.2 SIMCON MATERIAL PROPERTIES
Material properties of HPFRCCs include the behavior under compression and
tension. The primary concerns associated with HPFRCCs’ long-term performance are frost
durability, creep and shrinkage, and changes in the mechanical properties under load.
2.2.1 Mechanical Properties
Material properties of SIMCON under compression, tension and flexural loading
have been investigated by several researchers. Beams made of SIMCON and SIFCON were
tested under flexural loading by Hackman, et al [1992]. SIMCON beams with 5.7% fiber
volume achieved about the same flexural capacity as SIFCON beams with 14% fiber volume
(Figure 2.3). This effectiveness of SIMCON was attributed to using longer (9.5 inch [240
mm]) fibers in mat compared to the shorter (1 inch [25 mm]) SIFCON fibers.
The size and pattern of cracks are also different between ordinary reinforced concrete,
SIFCON and SIMCON. The cracks in ordinary reinforced concrete and SIFCON are usually
large and connected. However, the cracks in SIMCON are small in width (hairline) and
disconnected. The crack density in SIMCON is greater than in both reinforced concrete and
SIFCON (Krstulovic, et al, 1995a).
11
The tensile behavior of SIMCON was examined by Krstulovic, et al [1995a].
SIMCON with a fiber volume of 5% reached 2300 pounds per square inch (psi) (15.9 MPa)
at 1.1% of strain in direct tension tests. Krstulovic [1996] also investigated SIMCON under
compression and shear. Under compression, SIMCON with a 5% fiber volume reached
11000 psi (75.8 MPa). Based on these investigations, Krstulovic [1996] developed models
for SIMCON under tension and compression. He noted that SIMCON has a unique potential
for use in repair and retrofit of existing structures. The material properties of SIMCON are
given in Appendix A.
The effects of fiber orientation on SIMCON compressive strength were investigated
by Krstulovic, et al [1999b]. The test results showed no difference between compressive
strengths of specimens with different fiber orientations. This behavior is opposite to the
behavior observed with other fiber reinforced concretes, such as SIFCON behavior under
compression. The compressive strengths of SIFCON and conventional FRC are lower when
fibers are aligned transversely to the load than when the fibers are aligned parallel to the load
(Balaguru and Shah, 1992). The apparent insensitivity of compressive strength of SIMCON
to the fiber orientation was explained by two factors;
a) the scatter in the angle of fiber orientation within the mat and,
b) the longer length of fibers in the mat compared to the length of fibers used in
SIFCON or ordinary fiber concrete.
SIFCON tensile strength was shown to be sensitive to fiber orientation (Mier et al,
1992). Mier found that the SIFCON tensile strength was higher when fibers were aligned
parallel to load. No data is available on the fiber orientation effect on SIMCON tensile
12
strength. Although some fiber orientation effect is expected, that effect may not be as
pronounced as in SIFCON because of the fiber mat characteristics.
2.2.2 Durability Concerns with HPFRCC
Durability can be defined as the ability of a material, or a structure made of this
material, to remain operationally suitable over the design life of the material or structure.
The American Concrete Institute (ACI) provides many well established guidelines related
to concrete durability. ACI 201 [1992] discusses several important causes of concrete
deterioration. When concrete is exposed to freeze-thaw cycles in the presence of deicing
chemicals, the concrete may exhibit surface distress in the form of scaling or pitting as shown
in Figure 2.5. Concrete which has satisfactory resistance to rapid freezing and thawing may
still exhibit scaling.
Mehta [1993] lists the negative effects of deicing salts on concrete as: “(1) an
increase in the degree of saturation of concrete due to the hygroscopic character of salts;
(2) an increase in the disruptive effect when the supercooled water in pores eventually
freezes; (3) the development of differential stresses caused by layer-by-layer freezing of
concrete due to salt concentration gradients; (4) temperature shock as a result of dry
application of deicing salts on concrete covered with snow and ice; and (5) crystal growth
in supersaturated solutions in pores.”
Lankard [2001] concludes that scaling is often a problem because strength criteria is
relied on more than w/c ratio in residential construction. Lankard gives examples of types
of scaling deterioration and provides guidance for the scaling resistance of concrete,

13
Figure 2.5 Concrete surface decay in the form of scalingin the presence of deicing chemicals (ACI201, 1992)

14
emphasizing the importance of w/c ratio. He also recognizes the role of aggregate and
curing on scaling resistance of concrete.
A report published by ACI Committee 544 [1996] gives examples of applications of
fiber reinforced concrete. According to ACI 544, steel fiber reinforced concrete, exposed to
deicing salt, showed minimum corrosion of fibers and no adverse effects. It is reported that
the fibers on the surface showed minimum corrosion, however, the fibers in the interior
remained mostly intact.
2.2.3 Drying Shrinkage of SIFCON
One of the primary concerns associated with HPFRCCs’ long-term performance is
drying shrinkage behavior. No experimental data was found in the published literature
examining the creep or shrinkage behavior of SIMCON. However, limited test data on
ordinary steel FRC indicate that the presence of fibers reduces the shrinkage strains
(Balaguru and Shah [1992]). Shrinkage strains obtained using cement paste and melt extract
steel fibers, the same type of fibers used in SIMCON mats, were about 50% of the strains
obtained for cement paste at 500 days. According to Balaguru, the drying shrinkage strains
of SIFCON vary from 0.0002 to 0.0005 as shown in Figure 2.6. It was shown that the
shrinkage of SIFCON stops after about 28 days, while the shrinkage of cement paste typically
continues even after 160 days. The magnitude of SIFCON shrinkage strain is slightly lower
than that of typical normal-weight concrete. The addition of sand to the SIFCON matrix
reduces shrinkage considerably (Balaguru and Shah [1992]).
15
Figure 2.6 Drying shrinkage of SIFCON and plain,unreinforced slurry (Balaguru and Shah, 1992)

16
2.3 SLURRY PROPERTIES
SIMCON and SIFCON are composite materials since they consist of fibers and a
matrix. Composed of cementitious material placed as slurry, a very high volume of fibers
is used to produce SIMCON. Therefore, the slurry must have certain characteristics,
including high flowability for good infiltration, typically obtained by using a High Range
Water Reducing Admixture (HRWRA), a small maximum size aggregate, usually sand sized
or smaller. In addition, a high strength obtained by using a low water/cementitious materials
(w/cm) ratio and silica fume, and a high paste are common.
2.3.1 Slurry Mixture Proportioning
Silica fume is frequently used in the SIMCON slurry to improve strength. It is often
used in much greater quantities than in conventional concrete. Table 2.1, which shows the
slurry mixture proportions used in several studies, indicates silica fume contents of 10% to
15% are routine, in excess of the limit recommended in ACI 318 (2002) to control scaling
for exposure to deicer salts. Using silica fume, especially in these quantities, requires a
HRWRA in order to provide a highly fluid slurry, to ensure better infiltration into the fiber
mat.
Similar to ordinary concrete mixtures, the water to cement, or water to cementitious
materials ratio (w/cm), is a critical factor in the compressive strength of the slurry. If the
w/cm decreases, the compressive strength increases (Figure 2.7), but flowability of the
mixture may be decreased (Mondragon, 1987). Mondragon also found that increasing the
amount of cement in the cementitious materials increases the compressive strength (Figure

Table 2.1 Slurry mixture proportions used by researchers (amounts are by mass)
17
Sand W/CM S/CM HRWRA
fc!
ksi (MPa)
Mineral Admixtures
(by mass of cement) Reference
#250 0.31 0.6 4 16.5 (114) Microsilica§ (30%) Krstulovic [1999b]
#250 0.31 0.6 3 NR Solid Microsilica (4.5%) Krstulovic [1995]
#250 0.46 0.6 1.5 NR Solid Microsilica (4%) Krstulovic [1999a]
#250 0.31 0.6 4.5 11.8 (81) Microsilica§ (30%) "
#50-70 0.30 0.6 4 NR Microsilica§ (30%) Naaman and Reinhardt [1995]
0 0.35 0 3 NR 0 "
C 109 0.36 1.0 3 NR 0 "
C 109 0.40 1.5 3 NR 0 "
#270 0.40 0.6 4 NR Microsilica§ (30%) "
#20-30 0.45 1.0 3 NR 0 "
#50-70 0.45 1.0 3 NR 0 "
#270 0.45 0.6 3 NR Fly Ash (20%) "
#270 0.47 0.6 3 NR 0 "
#270 0.55 0.6 3 NR 0 "
#270 0.55 0.6 3 NR Fly Ash (50%) "
0 0.30 0 4.8 11 (76) Solid Microsilica (10%) Balaguru and Kendzulak [1987]
0 0.27 0 3 9* (62) Fly Ash (40%) Mondragon [1987]
0 0.43 0 3 5* (34) Fly Ash (40%) "
0 0.30 0 3 3-14* (21-97) Fly Ash (0-100%) "
0 0.40 0 3 3-11* (21-76) Fly Ash (0-100%) "
0 0.30 0 3 7.5-17.0 (52-117) Fly Ash (20%) Homrich and Naaman [1987]
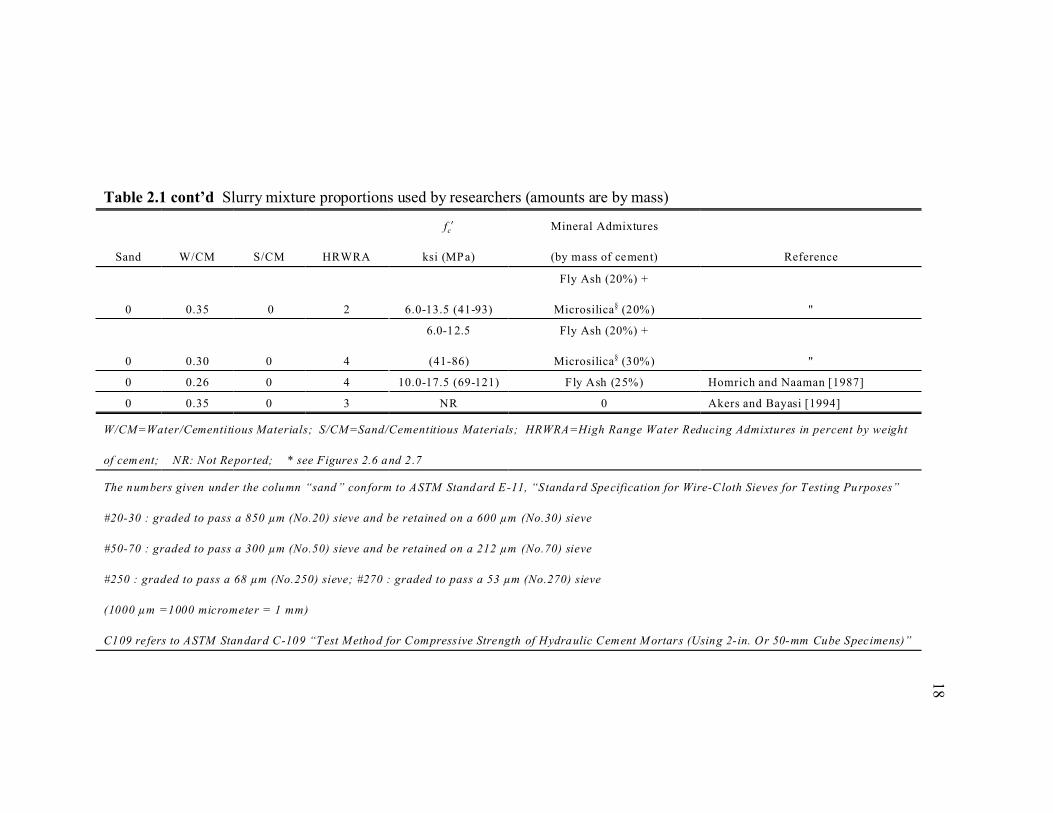
Table 2.1 cont’d Slurry mixture proportions used by researchers (amounts are by mass)
18
Sand W/CM S/CM HRWRA
fc!
ksi (MPa)
Mineral Admixtures
(by mass of cement) Reference
0 0.35 0 2 6.0-13.5 (41-93)
Fly Ash (20%) +
Microsilica§ (20%) "
0 0.30 0 4
6.0-12.5
(41-86)
Fly Ash (20%) +
Microsilica§ (30%) "
0 0.26 0 4 10.0-17.5 (69-121) Fly Ash (25%) Homrich and Naaman [1987]
0 0.35 0 3 NR 0 Akers and Bayasi [1994]
W/CM=Water/Cementitious Materials; S/CM=Sand/Cementitious Materials; HRWRA=High Range Water Reducing Admixtures in percent by weight
of cem ent; NR: Not Reported; * see Figures 2.6 and 2 .7
The numbers given under the column “sand” conform to ASTM Standard E-11, “Standard Specification for Wire-Cloth Sieves for Testing Purposes”
#20-30 : graded to pass a 850 µm (No.20) sieve and be retained on a 600 µm (No.30) sieve
#50-70 : graded to pass a 300 µm (No.50) sieve and be retained on a 212 µm (No.70) sieve
#250 : graded to pass a 68 µm (No.250) sieve; #270 : graded to pass a 53 µm (No.270) sieve
(1000 µm =1000 micrometer = 1 mm)
C109 refers to ASTM Standard C-109 “Test Method for Compressive Strength of Hydraulic Cement Mortars (Using 2-in. Or 50-mm Cube Specimens)”
19
2.8) of the slurry. Tests conducted by Balaguru and Kendzulak [1987] suggest that sand can
be added up to a ratio of 1:1.5 (cement : sand) before slurry strength is adversely affected.
Some researchers (Vandergerghe, 1992) suggested the use of a factory-prepared dry mixture
requiring only the addition of water on site to insure better control and consistency.
2.3.2 Slurry Infiltration
In laboratory experiments to date, SIFCON or SIMCON has been produced by first
placing the fibers or the fiber mat in a mold and then infiltrating the fibers or the fiber mat
with a slurry mixture by gravity while external vibration is applied. However, application
of external vibration can pose a difficulty in practice. Marrs and Bartos [1996] investigated
self-compacting slurry mixtures for SIFCON. Their research included comparison of the
ability of different slurry mixtures to infiltrate fibers, and using flow cone and plate cohesion
meter, shown in Figure 2.9, to predict the infiltration. They concluded that the flow cone is
not a reliable test method for predicting the infiltration, however, a plate cohesion meter can
be useful for infiltration prediction.
2.4 SIMCON APPLICATIONS
The possible use of SIMCON in different shapes for repair and retrofit of reinforced
concrete beams were investigated by Krstulovic [1995]. SIMCON retrofitted beams showed
improvements in terms of stiffness, moment capacity, and energy absorption capacity.
Composite slabs using SIMCON as the tensile element with a concrete topping for stiffness,
were tested under three point bending by Bayasi [1995] (see Figure 2.10). In Bayasi’s tests,
20
Figure 2.7 Ultimate compressive stress versus water/(cement+fly ash) ratios(Mondragon, 1987)
21
Figure 2.8 Ultimate compressive stress at 30 day versusfly ash/(cement+fly ash) ratios (Mondragon, 1987)
22
Figure 2.9 (a) Marsh flow cone and (b) plate cohesion meter (Marrsand Bartos, 1996)
23
Figure 2.10 Flexural behavior of composite slabs with SIMCONtensile layer (Bayasi, 1995)

24
delamination cracks were observed close to the supports where high shear forces exist.
SIMCON was also used as a shear reinforcement by Krstulovic, et al [1999a] to
replace stirrups. In his study, several reinforced concrete beams without stirrups were
retrofitted with SIMCON jackets. He investigated shear span-to-depth ratio and bonding
between the SIMCON jacket and concrete. Krstulovic concluded that a SIMCON jacket can
be used effectively in place of stirrups. Krstulovic found that behavior of beams with
unbonded SIMCON jackets showed no substantial difference compared to beams which had
bonded SIMCON jackets even though at the higher load levels beyond the elastic response
of the beam, measured strains in the SIMCON jackets differed from analytical values that
might have indicated debonding of SIMCON. The explanation given by Krstulovic was that
at low load levels there might be friction between the SIMCON and concrete, possibly
increased by the drying shrinkage of SIMCON which led to binding of the unbonded jacket
to the reinforced concrete beam.
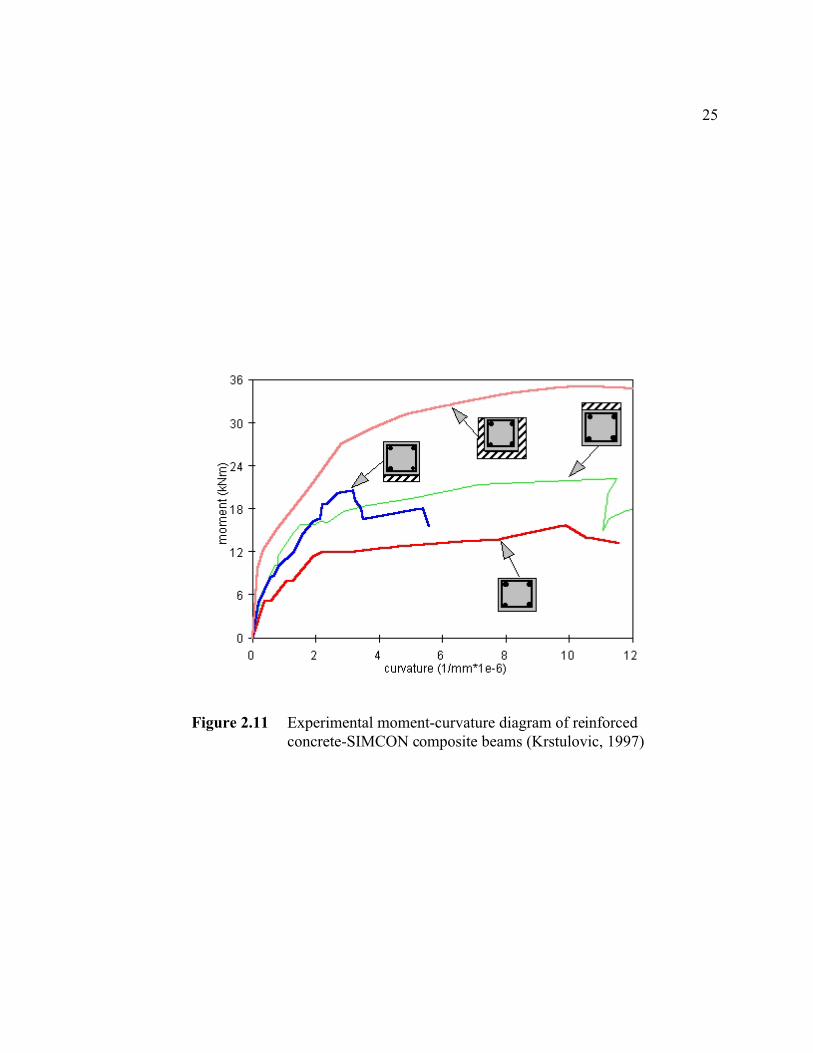
Krstulovic, et al [1997] also used SIMCON in different configurations with
reinforced concrete beams as shown in Figure 2.11. Krstulovic observed that delamination
of SIMCON top and bottom layers in two configurations were limiting factors in those two
beam failures. However, the failure of a beam, encased on three sides with SIMCON, was
initiated with the tensile failure of SIMCON. When the three-sided SIMCON jacket with
1 inch (25 mm) was used, it was reported that the maximum moment exhibited an average
of two times the reference values of reinforced concrete only section.
25
Figure 2.11 Experimental moment-curvature diagram of reinforcedconcrete-SIMCON composite beams (Krstulovic, 1997)

26
CHAPTER III
SCOPE OF THE STUDY AND
RESEARCH METHODOLOGY
3.1 SCOPE OF THE STUDY
The scope of this study was developed based on the literature survey and needed
information about the effects of construction on the in-service behavior of reinforced
concrete columns retrofitted with SIMCON jackets.
The literature suggested that the tensile and compressive behavior of SIMCON are
well established (Krstulovic, et al, 1995a; Krstulovic, 1996; Krstulovic, et al, 1999b). The
limited information available on SIMCON and concrete composite beam tests show that the
ultimate behavior is closely related to the composite beam cross section geometry. When
SIMCON is used only as a layer at the top or the bottom of a beam, bonding between
SIMCON and concrete becomes important (Bayasi, 1995; Krstulovic, et al, 1997). The
behavior of composite members with SIMCON jackets covering three or four faces of the
section were reported to be relatively insensitive to bonding at least up to the service load
level (Krstulovic, et al, 1997; Krstulovic, et al, 1999a).
No information was found in the literature examining the utilization of SIMCON to
strengthen or retrofit a reinforced concrete column. In particular, no information was found
27
regarding the sensitivity of SIMCON behavior, a relatively thin structural element composed,
in part, of a high strength cementitious slurry, to routine variations found in construction
materials in place or to routine construction practices which may affect design procedures
or construction and quality control requirements. If SIMCON is to be used to strengthen
columns, the effects of certain construction issues, including connection details and on-site
fabrication techniques, must be resolved.
Since SIMCON jacketing may be used in an unprotected environment, such as bridge
piers, there is a need for assessing the durability of SIMCON to frost. Because no research
data was found regarding the durability of SIMCON to frost attack or deicer scaling, the
freeze-thaw scaling durability of SIMCON when exposed to deicing salts needed to be
examined.
No information was found regarding the installed costs of SIMCON jackets.
Information is needed on cost in order to compare the economic viability of SIMCON jackets
with alternative jacketing options, such as Fiber Reinforced Plastic (FRP) wrapping and steel
jacketing.
3.2 RESEARCH METHODOLOGY
This study was conducted in three phases. The first phase examined the deicer
scaling durability of SIMCON. In the second phase, the construction of typical SIMCON
jackets was examined to identify characteristics, anticipated variability and consequences of
the construction process which could affect the structural behavior of the SIMCON jacket.
The effects were then analyzed, using simple structural models, to determine the likely

28
outcomes of those routine construction processes on load carrying capacity. The third phase
developed cost estimates of SIMCON jackets for comparison with alternative strengthening
techniques. The cost estimates were developed with sufficient accuracy to simply determine
if the technique was at least economically feasible. The cost estimate will, of course, vary
depending on the specifics of the project. An overview of this study is given in Table 3.1 as
a research methodology matrix. The parameters given in the table are not detailed; additional
levels and details are provided in subsequent chapters.
Table 3.1 Research Methodology Matrix
Investigated Parameter Methodology
Deicer salt scaling resistance of
SIMCON, ASTM C672
Experimental investigation to determine frost
resistance and entrained air requirements
Design and construction factors
Identify factors and evaluate those factors
analytically;
provide recommendations for design or
construction controls where appropriate
Cost analysis of SIMCON jackets Estimate the cost of a typical SIMCON jacket
application and compare with other typical
retrofit alternatives
3.2.1 Investigation of Deicer Salt Scaling Resistance of SIMCON
The first section of this study examined the deicer salt scaling durability of SIMCON
specimens. Acceptable frost durability of SIMCON was considered one of the critical factors

29
for the use of SIMCON jackets. The experimental evaluation of deicer salt scaling of
SIMCON was conducted following ASTM C672 procedures.
a) The effect of cracking of SIMCON on its scaling durability was examined on
specimens after cracks were induced using third point loading.
b) The presence of fibers and the process of placing the slurry may affect the in-place
air content in SIMCON. The very low water to cementitious materials ratio should mitigate
the frost damage somewhat, however. The sensitivity of air content on deicer salt scaling
resistance of SIMCON was planned to be examined by conducting ASTM C672 tests on
SIMCON which was similar except that either the material contained entrained air, or it did
not. The intended air content was in excess of 7%, which would have been minimal for a
paste. The actual air content obtained was considerably lower, however. While the results
are discussed in detail in Chapter 4, the low air content actually obtained proved to be
sufficient for this study.
3.2.2 Identification of Factors Related to Design and Construction
3.2.2.1 Methodology of Identification of Factors
In the second phase, construction factors which were likely to affect the behavior of
SIMCON jacketed reinforced concrete columns were identified and evaluated. This phase
was conducted in four parts. The first part involved identification of potential construction
effects or features which could affect behavior. The second part consisted of determining
the likely levels of the identified factors to be used in subsequent analysis. The third part
consisted of conducting simple structural analysis to determine both the relative effects of
30
the construction feature on the structural behavior and sensitivity of the structural behavior
to anticipated variation.
In this study, the construction factors identified in the first part were evaluated
predominantly using moment-curvature diagrams and short column axial load-moment
interaction diagrams. These are well established methods and can predict the non-linear
behavior of reinforced concrete. They are simple and ease to use compared to some other
methods such as finite element analysis. These analytical methods are appropriate for this
study since the primary purpose was to identify factors which would need to be resolved in
order to effectively use SIMCON jacketing in retrofit applications.
The last part of this phase consisted of ranking the effects as to “critical”, meaning
that routine variation could have a significant effect on the structural behavior which could
be critical either in service or in attaining the nominal, design load; “important”, meaning
that the effect was significant but could be easily controlled either in the design or using
simple quality control tests in construction; and “non-critical”, meaning that the effect was
not significant or did not cause unacceptable deviation from the nominal load carrying
capacity compared to conventional construction tolerances. For those effects which were
found to be critical or important, recommendations regarding control of the construction
process or needs for additional research were provided.
3.2.2.2 Identification of Factors Affecting the Behavior of SIMCON Jacketed Columns
The factors affecting the performance of SIMCON jacketed columns may be
considered in two categories, those factors which must be considered in the design stage,

31
such as whether to require a fully bonded jacket, and those factors which affect the behavior
and must be considered in establishing tolerances, such as whether routine variations in
dimensions or thickness provide acceptable behavior in service.
The desired dimensions and characteristics for any element are chosen at the design
stage. Similarly, with SIMCON jacketing, the designer can choose varying SIMCON
thicknesses and strength to fit the conditions and requirements. In reinforced concrete
structure design, there are certain assumptions which may not be applicable to SIMCON
jacketing, however. For instance, perfect bond is usually assumed between reinforcement
and concrete. This assumption has been validated in many cases in reinforced concrete
building. This assumption may not be valid with a new material and method like SIMCON
jacketing. Further, any attempt to make the SIMCON jacketing perfectly bonded to concrete
columns may not be fully beneficial or even necessary. Another example involves load
transfer at column-beam connections. In most reinforced concrete designs, these joints are
designed to be capable of transferring the moments, axial loads, and shear forces. SIMCON
jacket slab connections need to be examined to ensure adequate load transfer.
Another factor determined at the design stage could be whether to relieve the column
from existing loads or not. The backshoring of the existing floor system may be beneficial
in terms of more load carrying capacity in the column. However, if the costs outweigh
benefits, then jacking prior to the application of the SIMCON jacket need not be specified.
Hence, the investigation of effects of existing loads on SIMCON jacketed columns was
needed.
All construction practices and materials vary from ideal conditions even when they
32
are closely monitored to conform. The use of tolerances provides formal limits to these
variations. In reinforced concrete structures, these tolerances are usually provided by ACI
guidelines and specifications. The sensitivity of SIMCON jacketed columns to those
tolerances needed to be examined.
The minimum thickness of SIMCON is chosen by designer for expected loading
conditions considering the practical limitations of handling and forming the SIMCON jacket.
The fiber mats are commercially produced in 1 and 2 inch thicknesses, thicker SIMCON
jackets may be produced by applying several mats on each other. A thin SIMCON jacket
found adequate for expected loads may fail under compression with thin wall buckling.
Therefore, using the thin wall buckling example, the minimum thickness which would occur
in practice needed to be determined so that analysis of the structural effects could be
determined.
ACI 318 (ACI, 2002) specifies tolerances for concrete strength along with many
others. Some reductions from concrete design strength are tolerable. Routine variation
exists between the design and the in-place strength of concrete due to many variables, such
as materials and placement of concrete. The strength of concrete may be also affected by
frost damage. Therefore, the effects of the reduced SIMCON strength on the behavior of
SIMCON jacketed column needs to be examined. In this respect, the SIMCON strength
evaluation due to frost damage was conducted as explained in Chapter 4.
Routine variations in SIMCON thickness can be expected due to mishandling and
formwork dimension variations. Hence, the variations in thickness need to be examined.
Tolerances for dimensions and locations for reinforced concrete structures are given in ACI

33
117 (ACI, 1990). However, the tolerances given in ACI 117 may not be applicable to
SIMCON jackets due to factors, such as, a) the SIMCON jacket is a thin material compared
to existing column dimensions, b) the fiber mat compressibility is limited physically.
In addition, other factors affected by construction methods were examined, which
were not found in any published data. For example, the non-concentric placement of the
SIMCON jacket, that is, slightly off-center placement, may occur due to lack of control and
needs to be examined. The non-concentric placement of SIMCON means that some sides
of the jacket would be thinner than other sides and could affect behavior. The seams in the
SIMCON jacket due to fiber mat placement may also affect the behavior of jacketed
columns. Those effects should be examined.
After considering the typical tolerances and requirements and likely SIMCON
construction practices, the following items were identified as factors which needed to be
evaluated:
a) Bond between the SIMCON jacket and the reinforced concrete column,
b) Removal of load on existing reinforced concrete column prior to jacketing,
c) Routine variations in the SIMCON slurry strength,
d) Routine variations in the SIMCON jacket thickness,
e) Non-concentric placement of the SIMCON jacket,
f) Location and strength of fiber mat seams,
g) Thin wall buckling of the SIMCON jacket, and
h) SIMCON end connections to transfer end moments; bearing on the concrete slab
or beam where SIMCON transfers the additional axial load.

34
These were selected after preliminary analysis. Additional factors arising from a detailed
analysis were expected. The identification of these additional factors, the determination of
critical research needs, design criteria or construction control requirements constitute the
primary focus of this study. This preliminary list was not necessarily considered to be
exhaustive, pending detailed analysis, but was considered to be a critical step in the
acceptance of SIMCON as a feasible alternative for strengthening existing elements, both
technically for strength and durability, and economically.
3.2.3 Cost Analysis of SIMCON Jacketing
In the third phase, cost estimates for a routine SIMCON jacket application were
conducted. These costs were compared to the costs of selected alternative strengthening
techniques already used in practice. SIMCON costs, as installed, were based on a reasonable
work breakdown structure for this type of application using construction cost data commonly
available. The costs of alternative strengthening techniques, including FRP wrapping and
steel jacketing, were obtained from available construction cost data. This cost estimate was
not intended to provide detailed costs, since these are extremely sensitive to specific project
requirements. The cost estimate was provided simply to compare to the very broad ranges
found for alternative techniques to determine if the SIMCON alternative was at least
economically viable.
All phases of this study are clearly interrelated. The results of the deicer salt scaling
resistance of SIMCON, for example, may determine its criticality during construction. The

35
results obtained from analytical evaluation of selected factors may determine their criticality
and therefore their effects on construction costs. The interrelationships of critical or
important factors were also examined. Recognizing that identification and classification
required both subjective and objective evaluations, it was anticipated that a primary product
of this study was to help establish a priority of future research needs.

36
CHAPTER IV
DURABILITY PERFORMANCE OF SIMCON
4.1 OVERVIEW
SIMCON may be applied to columns, beams, or bridge piers as a jacket to improve
the capacity of the original structural member. When these applications occur in an exposed
environment, such as highway bridges and exterior elements in a structure, the durability of
SIMCON jacket must be considered. Since SIMCON is a low water/cement ratio material,
it should be more durable in aggressive media, all else being equal. SIMCON used to
strengthen highway bridge piers may be subjected to deicer chemical exposure, which is
more severe than simple frost attack of saturated concrete. This chapter describes the
experimental study conducted to assess the deicer salt scaling resistance of SIMCON jacket
material in freeze and thaw cycles.
4.2 EXPERIMENTAL PROCEDURES
The choice of experimental procedure to assess the frost resistance of a SIMCON
jacket around the concrete column was based on the characteristics of the SIMCON matrix,
a high strength slurry, and possible exposure conditions.

37
ASTM C666 “Standard Test Method for Resistance of Concrete to Rapid Freezing
and Thawing” (ASTM, 2002) evaluates the resistance of aggregate and paste under rapid
freezing and thawing. Several studies (Aïtcin, 1998; Pigeon, et al, 1991) have found that low
w/c ratio mixtures generally have good resistance to rapid freezing and thawing, even with
minimal air contents. Some studies have found reduced scaling resistance in very low w/c
ratio mixtures, especially when these mixtures contain a relatively large quantity of mineral
admixtures, including silica fume (Johnston, 1992; Biledaou and Malhotra, 1997). ACI 318
“Building Code Requirements for Structural Concrete and Commentary” (ACI, 2002)
prohibits the use of more than 10% silica fume in concrete exposed to deicing salts in order
to control scaling. Therefore, ASTM C672 (2002) was selected as a more representative
method of evaluating the response of SIMCON to frost attack.
ASTM C672 “Standard Test Method for Scaling Resistance of Concrete Surfaces
Exposed to Deicing Chemicals” (ASTM, 2002) measures the resistance of concrete to scaling
in the presence of deicing chemicals. This test is conducted at realistic, but high freezing
rates and is considered to be more indicative of frost resistance in service. This test also has
limitations, however. Durability is determined by visual ranking. The rating of scaling is
somewhat subjective, although the standard contains guidance.
The study was originally developed as factorial design with two factors and two
replicates for each condition. As seen in Table 2.1, the slurry mixtures used in this study had
similar proportions to those in other studies. Therefore, it was decided to focus this study
on critical factors other than water/cement ratio, or other properties of the slurry mixture.
Consequently, only a single mixture, similar to that proposed by Krstulovic [1999] was used.
38
Since this study is intended to investigate the frost durability of the matrix, only one volume
of fibers is used. The possible effects of different volumes of fibers may be considered in
future research.
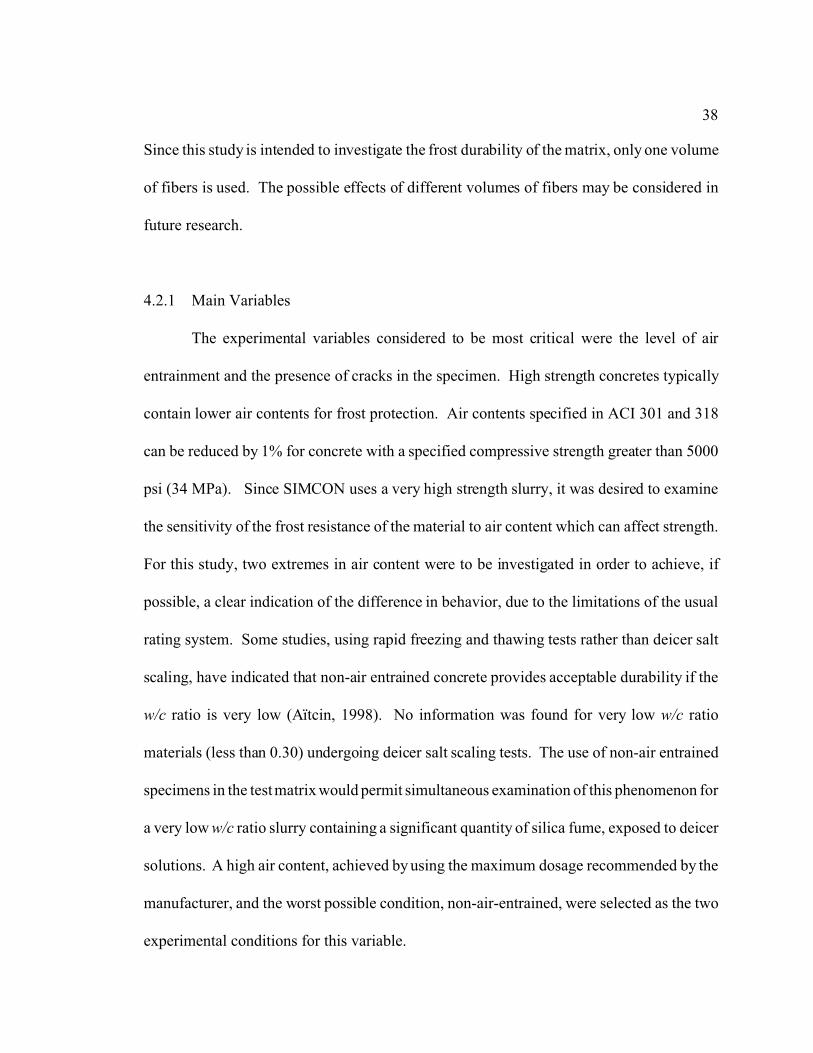
4.2.1 Main Variables
The experimental variables considered to be most critical were the level of air
entrainment and the presence of cracks in the specimen. High strength concretes typically
contain lower air contents for frost protection. Air contents specified in ACI 301 and 318
can be reduced by 1% for concrete with a specified compressive strength greater than 5000
psi (34 MPa). Since SIMCON uses a very high strength slurry, it was desired to examine
the sensitivity of the frost resistance of the material to air content which can affect strength.
For this study, two extremes in air content were to be investigated in order to achieve, if
possible, a clear indication of the difference in behavior, due to the limitations of the usual
rating system. Some studies, using rapid freezing and thawing tests rather than deicer salt
scaling, have indicated that non-air entrained concrete provides acceptable durability if the
w/c ratio is very low (Aïtcin, 1998). No information was found for very low w/c ratio
materials (less than 0.30) undergoing deicer salt scaling tests. The use of non-air entrained
specimens in the test matrix would permit simultaneous examination of this phenomenon for
a very low w/c ratio slurry containing a significant quantity of silica fume, exposed to deicer
solutions. A high air content, achieved by using the maximum dosage recommended by the
manufacturer, and the worst possible condition, non-air-entrained, were selected as the two
experimental conditions for this variable.

39
The SIMCON jacket is expected to be cracked in service. The application of load or
the effects of restrained shrinkage will induce cracking. The cracks in SIMCON are typically
very fine and closely spaced, as would be expected with a high steel ratio composed of small
diameter, dispersed reinforcement (Krstulovic and Malak 1997; Krstulovic and Al-Shannag,
1999). These fine cracks are small enough to have significant capillary suction and large
enough that water can enter freely. The effects of freezing on finely cracked concrete have
not been established. In addition, the small diameter reinforcement could corrode in the
severe deicing salt exposure of ASTM C672, contributing to scaling, since they are close to
the surface, or causing additional cracking. It was believed to be critical to assess the
behavior of the cracked SIMCON simultaneously exposed to salt solution and freezing and
thawing cycles. The test matrix therefore included two specimens of each set of four which
were cracked before they are subjected to freezing and thawing cycles. Table 4.1 displays
the variables and properties of SIMCON specimens. To improve statistical power, two
specimens were tested for each variable.
4.2.2 Mixture Used in the Experimental Study
The SIMCON slurry mixture proportions used in this part of the study are given in
Table 4.2. If the specimen is air entrained, then, the amount of air entraining admixture
given in Table 4.2 is added to the mixture, otherwise no air entraining admixture is added.

40
Table 4.1 Scaling test variables and SIMCON specimens’ properties
specimen no * air entrained cracked
A11NC-3 Y N
A14NC-10 Y N
A12CR-6 Y Y
A13CR-9 Y Y
N21CR-5a N Y
N23CR-7a N Y
N22NC-6a N N
N24NC-8a N N
* A=air entrained; N=no air entrainment; NC=not cracked; CR=cracked
Table 4.2 Slurry mixture proportions by mass
Wi/Wc [1]
Portland cement; Type III 1.0
Added water to the mixture 0.31
#250 Ottawa silica sand 0.60
Microsilica slurry [2] 0.30
High range water reducing admixture [3] 0.04
Air entraining admixture [4] 3 oz/100 lb (200 mL/100 kg)
[1] Wi=the mass of material; Wc= the mass of cement
[2] Microsilica slurry contains 49.7% solids
[3] HRWRA, ADVA 100, produced by W.R. Grace & Co. and meets ASTM C494,
Type F. One gallon weighs approximately 8.3 lbs (1.06 kg/L)
[4] Air entraining admixture, Daravair 1000, W.R.Grace &Co. and meets ASTM
C260.
41
The ratio of water to cementitious materials was 0.40 as shown in Equation 4.1.
water water added to the mixture + water in the microsilica slurry ))))))))))))))) = ))))))))))))))))))))))))))))))))))))))))) cementitious materials portland cement + silica fume in the microsilica slurry
0.31 + 0.15 = )))))))) = 0.40 (4.1) 1.0 + 0.15
The ratio of silica fume to cementitious materials was 0.13 as shown in Equation 4.2.
silica fume Silica fume in the microsilica slurry ))))))))))))))) = )))))))))))))))))))))))))))))))))))))))cementitious materials Portland cement + silica fume in the microsilica slurry
0.15 = )))))))) = 0.13 (4.2) 1.0 + 0.15
The desired air content was chosen assuming a severe exposure to frost attack. The
desired air content was selected to be some amount in excess of 6%. Neville [1997] states
that in the presence of a high proportion of ultrafine aggregate materials, and with low
water/cement ratios, more admixture is required. Therefore, the maximum addition rate of
air entraining admixture recommended by the manufacturer was used.
The volume of fibers, Vf, of SIMCON specimens was 1.6%. This steel fiber volume
ratio was selected to ensure that the steel fiber mats were infiltrated fully by the slurry
mixture under gravity, while maintaining a quantity sufficiently high to demonstrate any
contribution to deicer salt scaling and sufficiently low that any benefit from reinforcement
was minimized. Therefore, a reasonable worst-case scenario was investigated.

42
4.2.3 SIMCON Specimen Preparation and Testing
SIMCON slab specimens were prepared according to ASTM C672 specifications.
As shown in Figure 4.1, 12 in. by 12. in (305 mm×305 mm) SIMCON mats were prepared
and infiltrated by the slurry mixtures under gravity. Meanwhile, 2 in.×2 in.×2 in. (51 mm×51
mm×51 mm) slurry mixture cubes were prepared to determine their compressive strengths.
After casting, all the specimens were covered with a plastic sheet and left at room
temperature in a laboratory environment. After 24 hours, the specimens were demolded and
submerged in a lime-water bath for 14 days. All the specimens were then air dried for 14
days after removal from the water. At the 28th day after casting, four of the specimens were
cracked under three point bending (see Table 4.1). Crack widths ranged from 0.010 in.
(0.254 mm) to 0.024 in. (0.610 mm), and were 0.016 in. (0.406 mm) on average. At this
time, silicon dams were formed on the surface to hold the calcium chloride solution.
Slurry cubes were tested in compression at 28 days. The slurry containing the air
entraining admixture had an average compressive strength of 8350 psi (57.6 MPa); the non-
air entrained slurry had an average compressive strength of 12160 psi (83.9 MPa) as shown
in Table 4.3. The calcium chloride solution was prepared in accordance with ASTM C672,
such that each 100 mL of solution contained 4 g of anhydrous calcium chloride (5.345 oz per
gallon). The specimens were covered to a depth of ¼ in. (6 mm) with calcium chloride
solution at 28 days after casting. The specimens were then frozen for 16 to 18 hours and
thawed for 6 to 8 hours in air. Two of the applied freeze and thaw 7-day cycles are shown
in Figure 4.2 as an example. Between each cycle, the solution was checked and maintained
at the proper depth daily. Every fifth cycle, specimens were flushed with fresh water and the
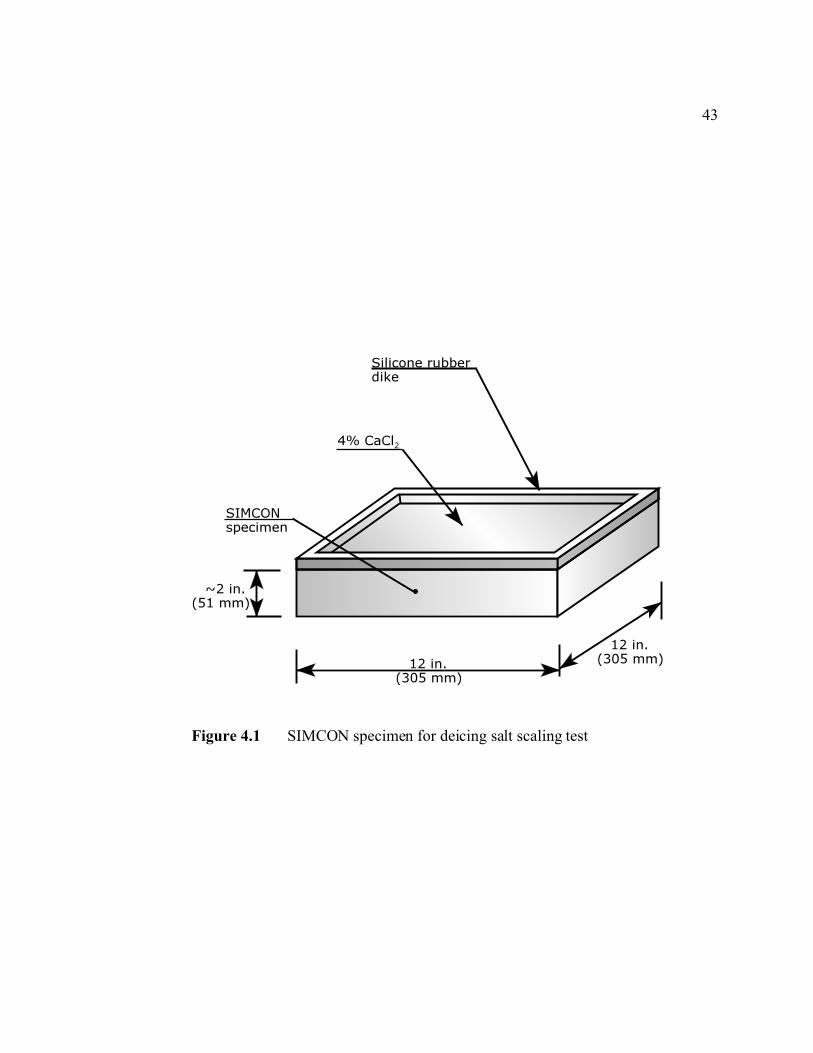
43
Figure 4.1 SIMCON specimen for deicing salt scaling test

44
Figure 4.2 Time-temperature graph of freezing environment

45
solution replaced.
Table 4.3 Compression strength of slurries with and without air entrainment
Non-air entrained 10680 psi (73.6 MPa)
Fcomp,avg = 12160 psi (83.9 MPa)Non-air entrained 12910 psi (89.0 MPa)
Non-air entrained 12700 psi (87.6 MPa)
Non-air entrained 12710 psi (87.6 MPa)
Non-air entrained 11820 psi (81.5 MPa)
Air entrained 7950 psi (54.8 MPa)
Fcomp,avg = 8350 psi (57.6 MPa)Air entrained 9140 psi (63.1 MPa)
Air entrained 8030 psi (55.4MPa)
Air entrained 8270 psi (57.0 MPa)
4.2.4 Air Content
4.2.4.1 Test Method
Methods such as ASTM C231 or C173 (ASTM, 2002) are typically used to determine
the air contents of fresh concrete. However, the air content of the fresh concrete was not
measured due to several reasons. First, the volume required for testing using these methods
is quite large. While a smaller quantity could have been used, it was decided to determine
the air content of the hardened slurry, after infiltration, due to possible detrimental effects
on the air void system due to the fiber mat. Therefore, microscopic examination of both
hardened slurry specimens and specimens taken from slabs after testing, which included the
fiber mat, was used to determine the total air content, the average spacing factor, and the
specific surface of the air void system.

46
The air contents of hardened slurry cubes were determined microscopically according
to ASTM C457 “Standard Test Method for Microscopical Determination of Parameters of
the Air-Void System in Hardened Concrete” (ASTM, 2002) except that the depth between
adjacent slices was smaller than required, possibly reducing the precision somewhat but
certainly not enough to affect the results of this study, since no coarse aggregate was used.
ASTM C457 specifies that a sample have a minimum area of 7 in2 (45 cm2) of
finished surface for microscopic measurement. Since the cubes could provide only about 3
in2 (19 cm2), they were sliced into three pieces as shown in Figure 4.3 to provide the required
area. The surfaces were polished using silicon carbide abrasives. Typical air voids are
shown in Figure 4.4.
After the scaling test of the SIMCON slabs was completed, specimens A11NC-3,
A12CR-6, N21CR-5a, and N24NC-8a were cut and microscopic analysis of the air-void
system was conducted. Due to the steel fibers in the specimens, the specimens could not be
polished as required by ASTM C457. The air void analysis of these sections was not
conducted, therefore, strictly in accordance with the standard. The results are acceptable for
this study, however, for several reasons. First, due to the very fine structure of the slurry
matrix, which contained no aggregate, the saw cut surface provided a relatively smooth
surface for examination. Second, it was not necessary to determine the air content with high
precision. The purpose of the analysis was simply to compare the air content of the
SIMCON specimen with that of the slurry cube, due to concern that by infiltrating the slurry
through the fibers, the entrained air content would change.
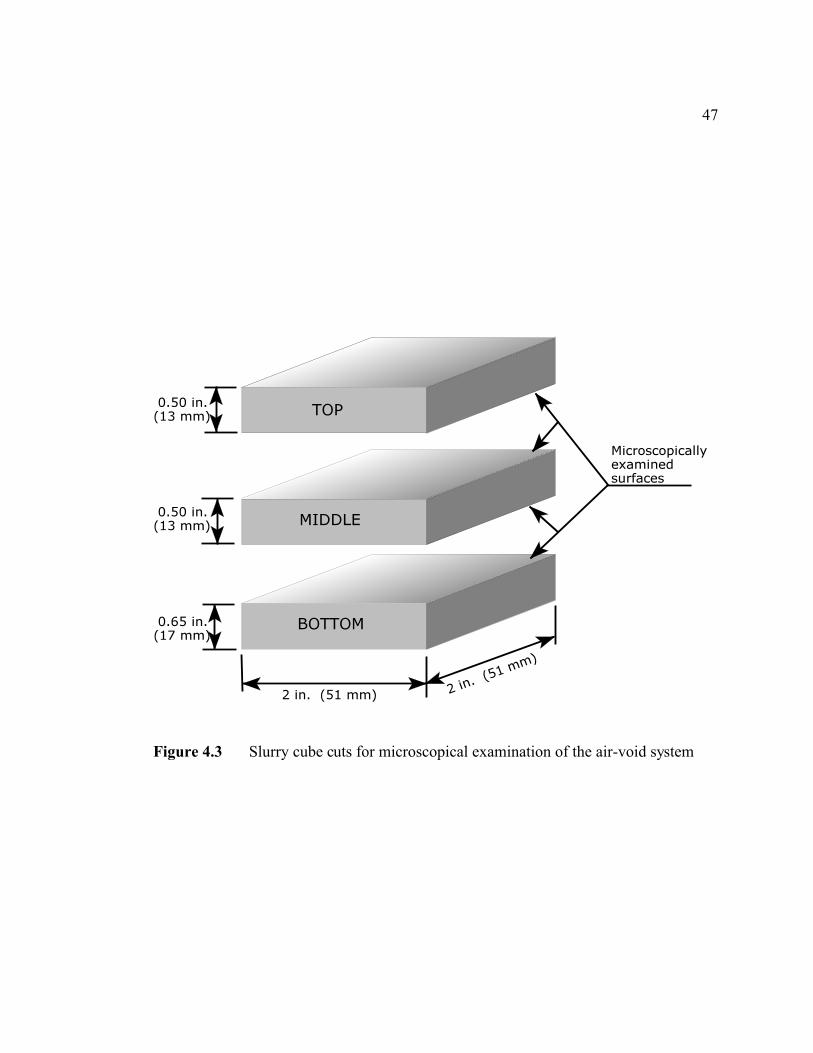
47
Figure 4.3 Slurry cube cuts for microscopical examination of the air-void system
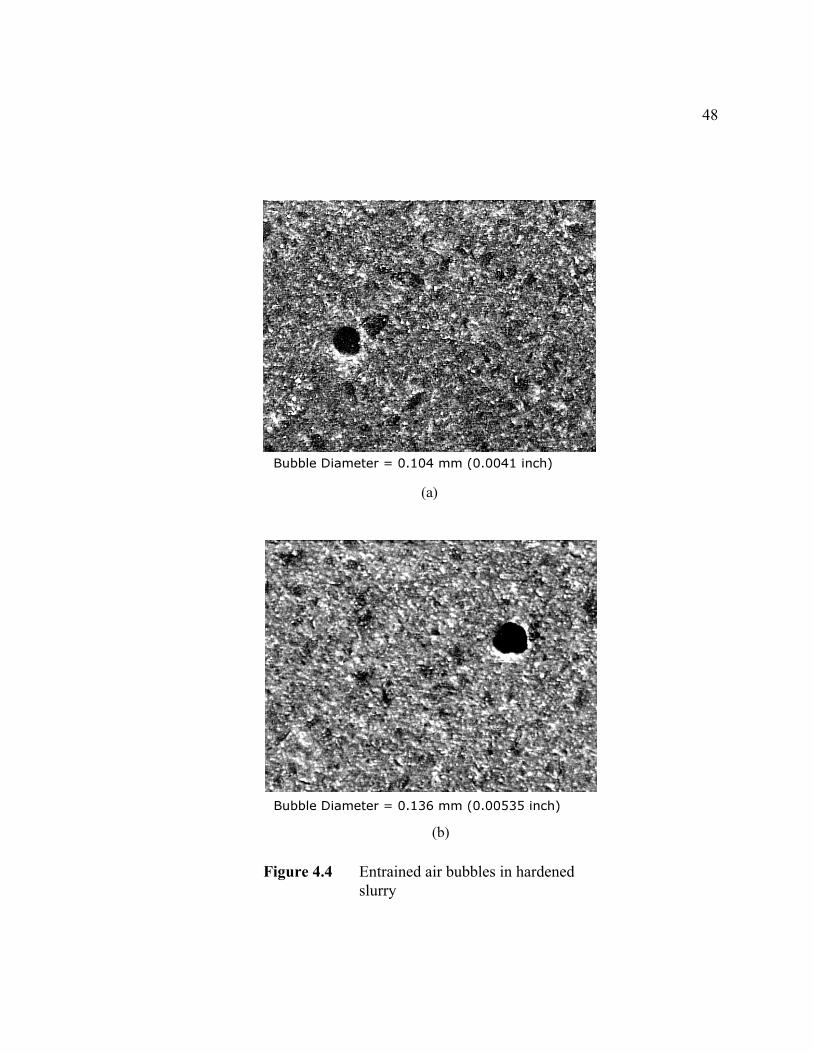
48
Figure 4.4 Entrained air bubbles in hardenedslurry
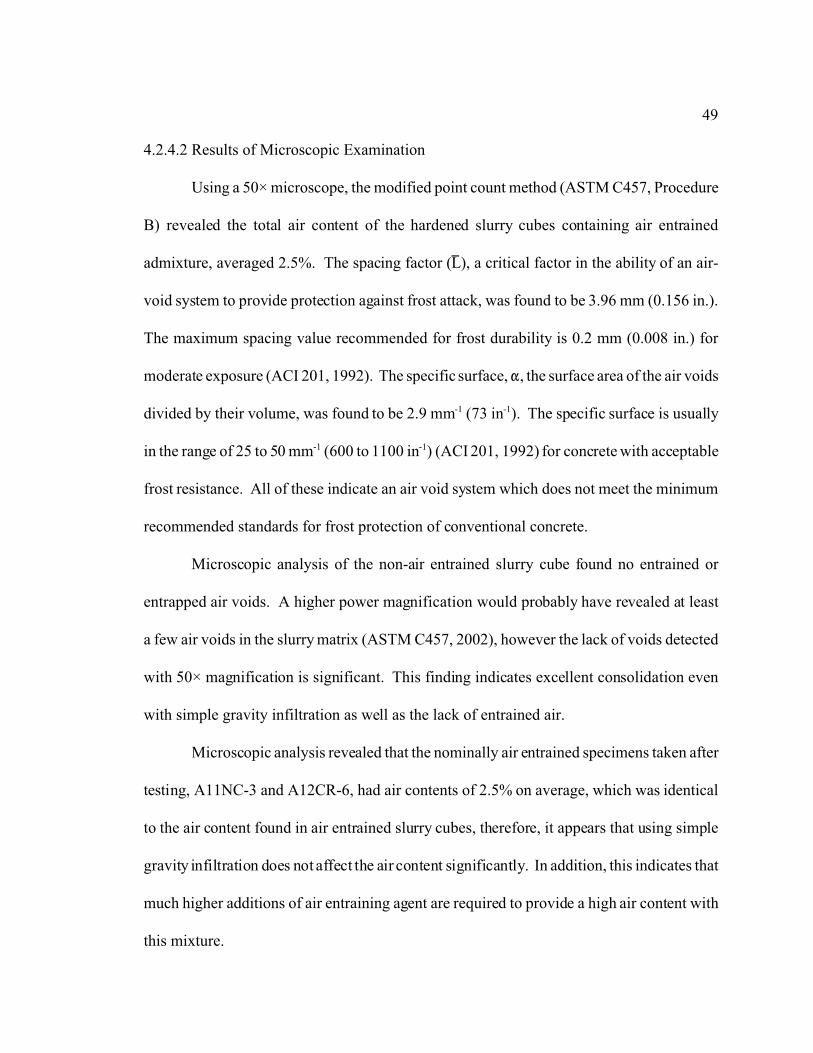
49
4.2.4.2 Results of Microscopic Examination
Using a 50× microscope, the modified point count method (ASTM C457, Procedure
B) revealed the total air content of the hardened slurry cubes containing air entrained
admixture, averaged 2.5%. The spacing factor (L6), a critical factor in the ability of an air-
void system to provide protection against frost attack, was found to be 3.96 mm (0.156 in.).
The maximum spacing value recommended for frost durability is 0.2 mm (0.008 in.) for
moderate exposure (ACI 201, 1992). The specific surface, ", the surface area of the air voids
divided by their volume, was found to be 2.9 mm-1 (73 in-1). The specific surface is usually
in the range of 25 to 50 mm-1 (600 to 1100 in-1) (ACI 201, 1992) for concrete with acceptable
frost resistance. All of these indicate an air void system which does not meet the minimum
recommended standards for frost protection of conventional concrete.
Microscopic analysis of the non-air entrained slurry cube found no entrained or
entrapped air voids. A higher power magnification would probably have revealed at least
a few air voids in the slurry matrix (ASTM C457, 2002), however the lack of voids detected
with 50× magnification is significant. This finding indicates excellent consolidation even
with simple gravity infiltration as well as the lack of entrained air.
Microscopic analysis revealed that the nominally air entrained specimens taken after
testing, A11NC-3 and A12CR-6, had air contents of 2.5% on average, which was identical
to the air content found in air entrained slurry cubes, therefore, it appears that using simple
gravity infiltration does not affect the air content significantly. In addition, this indicates that
much higher additions of air entraining agent are required to provide a high air content with
this mixture.

50
It was surprising to find very low air contents in the slurry cubes and SIMCON
specimens because the quantity of air-entraining agent used was sufficient to easily produce
an excess of entrained air in conventional concrete. The low air content found in the
hardened cement paste may be due to mixing the slurry for a long time after adding the air
entraining admixture, the high amount of silica fume in the mixture or both. The high
fluidity of the slurry may have also contributed to the low air content. Very high slumps can
result in a reduction in air content in conventional concrete under certain conditions. This
was not anticipated due to the low w/c ratio and the fact that the fluidity was due to the use
of a HRWR, however, it could have played a role. It was surprising to find essentially no air
in the non-air entrained slurry specimens, since some entrapped air can usually be found in
all mortars, especially in the absence of vibration.
The microscopic determination of air content of the hardened slurry cubes was
completed well before the end of the C672 testing phase. It was decided to continue the
deicer salt scaling test program for several reasons, even though the air entrained SIMCON
specimens did not meet ACI recommendations for air content. The test was already
underway at this point and both the air entrained and the non-air entrained specimens had
exhibited satisfactory resistance so far. In addition, this would permit evaluation of the
durability to deicer salt scaling with a minimal air content.
4.3 TEST RESULTS AND DISCUSSION
4.3.1 Scaling Resistance
All SIMCON specimens showed good scaling resistance. The SIMCON specimens

51
had a scaling rating of 1 or 2 which corresponds to light scaling. Visual observations of test
specimens showed no difference in specimen scaling due to air entrainment or due to
cracking. Photographs taken after the test are included in Appendix B (see Figure B.1 to
Figure B.8).
Although the recommended air contents were not achieved, the low water/cement
ratio used in the production of SIMCON provided a hardened mixture with very low
permeability, which is an important factor in resistance to frost attack and deicer scaling
resistance. This testing program showed that air entrainment is apparently not necessary for
frost scaling resistance, therefore no additional tests were conducted incorporating higher air
contents.
The lack of scaling was apparently a paste phenomenon. It was originally speculated
that at least two factors might affect the deicer salt scaling resistance of the SIMCON. The
presence of the fibers might reduce scaling somewhat by holding the paste together at the
surface and resisting the stresses due to temperature, moisture or salt gradients. Alternately,
the slurry directly over the fibers could be expected to flake off preferentially at a relatively
early stage, and deeper flaking would be expected between fibers. The lack of this type of
flaking indicates that the excellent deicer salt scaling resistance observed was due to the high
quality of the slurry. The presence of the fibers had little, if any, effect, however.
4.3.2 Effects of Cracking on Frost Durability
After the scaling test, crack widths of cracked specimens were measured. No
significant widening of cracks was observed. Either cracks were not affected by the freeze
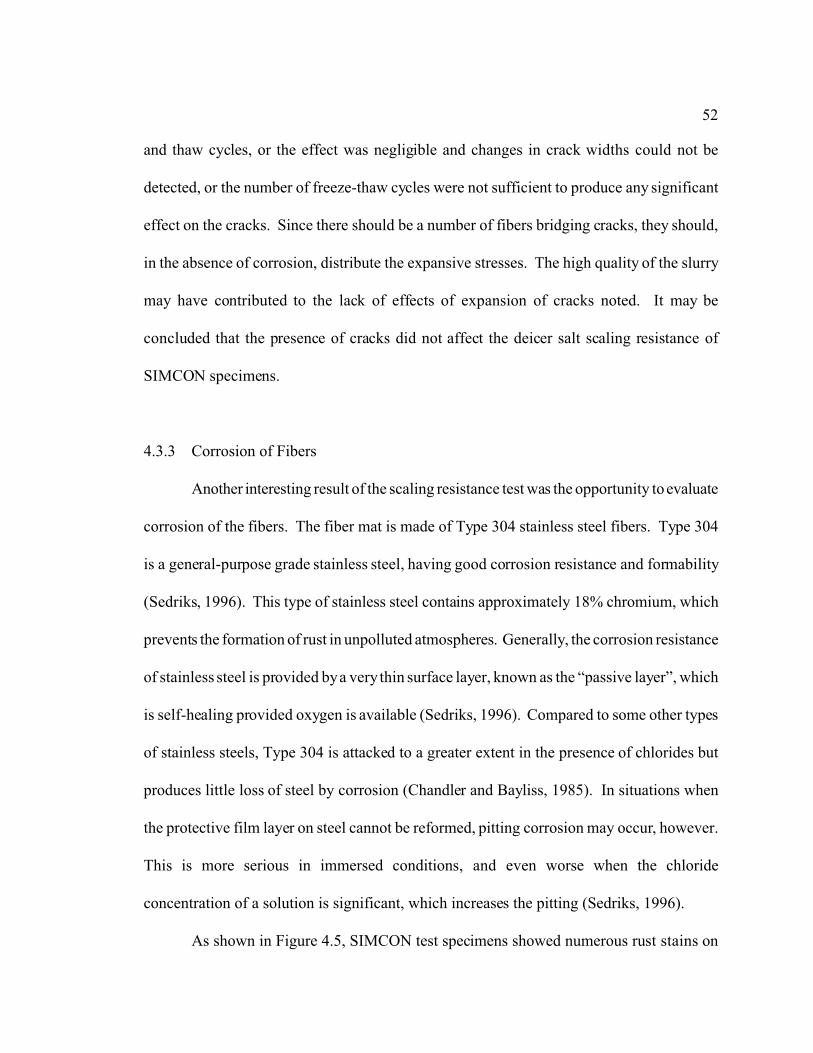
52
and thaw cycles, or the effect was negligible and changes in crack widths could not be
detected, or the number of freeze-thaw cycles were not sufficient to produce any significant
effect on the cracks. Since there should be a number of fibers bridging cracks, they should,
in the absence of corrosion, distribute the expansive stresses. The high quality of the slurry
may have contributed to the lack of effects of expansion of cracks noted. It may be
concluded that the presence of cracks did not affect the deicer salt scaling resistance of
SIMCON specimens.
4.3.3 Corrosion of Fibers
Another interesting result of the scaling resistance test was the opportunity to evaluate
corrosion of the fibers. The fiber mat is made of Type 304 stainless steel fibers. Type 304
is a general-purpose grade stainless steel, having good corrosion resistance and formability
(Sedriks, 1996). This type of stainless steel contains approximately 18% chromium, which
prevents the formation of rust in unpolluted atmospheres. Generally, the corrosion resistance
of stainless steel is provided by a very thin surface layer, known as the “passive layer”, which
is self-healing provided oxygen is available (Sedriks, 1996). Compared to some other types
of stainless steels, Type 304 is attacked to a greater extent in the presence of chlorides but
produces little loss of steel by corrosion (Chandler and Bayliss, 1985). In situations when
the protective film layer on steel cannot be reformed, pitting corrosion may occur, however.
This is more serious in immersed conditions, and even worse when the chloride
concentration of a solution is significant, which increases the pitting (Sedriks, 1996).
As shown in Figure 4.5, SIMCON test specimens showed numerous rust stains on
53
their sides. Figure 4.6 also shows a slice taken 0.7 in. (18 mm) deep from the same surface
shown in Figure 4.5. In Figure 4.5, the rust stains are clearly noticeable on protruding
strands of fiber, however, as shown in Figure 4.6, corrosion does not penetrate past the
surface. Corrosion was generally less on the surfaces (top of specimen) covered with
calcium chloride solution than on the sides of the specimens. The reason could be chloride
solution spills or contamination from adjacent specimens. The sides were continuously
exposed to oxygen while ponded surfaces were not, which may have also affected the
corrosion. Since, at the field, SIMCON will be exposed to deicer salt sprays and air, it is
possible too see some rust develop on the fibers protruding from the SIMCON jacket
surfaces. This may become a visual problem, therefore, needs to be investigated.
No difference was noted in corrosion between the cracked and uncracked specimens.
In cracked samples, no significant corrosion was noted on the fibers located in the cracks.
Although the cracks (ranging from 0.010 in. (0.254 mm) to 0.024 in. (0.610 mm), and on
average 0.016 in. (0.406 mm)) were equal to or sometimes larger than the maximum
tolerable crack width suggested in ACI 224 (1980), which is 0.016 in. (0.41 mm), the
stainless steel fibers incorporated in a dense, low w/c ratio matrix successfully resisted the
corrosive effect of calcium chloride solution for the duration of the test. Therefore, it may
be concluded that the SIMCON slabs exhibited excellent resistance to the corrosion of
embedded steel fibers in a severe salt exposure including multiple cycles of freezing and
thawing. The high quality matrix appears to provide adequate passivation of the stainless
steel reinforcement although additional, longer term studies, including the effects of
carbonation, should be conducted.

54

55
56
4.4 CONCLUSIONS
1. The SIMCON specimens, exposed to freezing-and-thawing cycles in the presence of
deicer salt, exhibited very slight scaling, indicating good to excellent resistance.
2. Air entrainment was not found to be required for satisfactory resistance to deicer salt
scaling, probably due to the very low w/c ratio used.
3. Excellent deicer salt scaling resistance was obtained even though the silica fume content
(13% of total cementitious materials), was higher than the limits (10%) recommended in ACI
318 (ACI, 2002).
4. Based on microscopic analyses on the slurry cubes and SIMCON specimens, excellent
consolidation was achieved with simple gravity infiltration.
5. The lack of entrained air in slurry cubes revealed by microscopic analysis indicates that
much higher additions of air entraining agents are required to provide a high air content with
this mixture.
6. The presence of cracks did not affect deicer salt scaling or corrosion.
7. Corrosion was observed only on fibers which were not embedded, the high quality matrix
apparently provides satisfactory protection, or passivation, for stainless steel fibers, at least
for the duration (approximately 2 months) of this severe test.
8. Corrosion may at least become a visual problem where the SIMCON is exposed to deicer
salt solutions.

57
CHAPTER V
ANALYTICAL EVALUATION OF
DESIGN AND CONSTRUCTION FACTORS
5.1 OVERVIEW
This chapter begins with a discussion of the identification of construction factors
which could affect the behavior of SIMCON jacketed columns in service or at ultimate load.
This is followed by an overview of the cross sections and materials used in the evaluation.
After that, the methods used for analysis are briefly described. Later, based on given
materials properties and geometries, the construction factors are evaluated using these
analytical methods, and the results compared to each other and to published results.
Several construction and constructibility factors affecting the behavior of SIMCON
jacketed reinforced concrete columns were identified and evaluated in this study. For the
identification and selection of factors related to construction and design of SIMCON, either
relevant ACI specifications and guidelines were referenced or possible critical aspects which
may be encountered in a SIMCON strengthening project were examined.

58
5.2 IDENTIFICATION OF FACTORS TO BE EVALUATED
5.2.1 Identification of Design Factors with Significant Construction Effects
Several factors were identified which, although they are clearly design issues, might
have a significant effect on the construction process itself. These factors were examined to
determine if their effects on the predicted behavior of the SIMCON jacketed column would
be critical. The factors identified included the effects of bonding between the jacket and the
column, the removal of existing load prior to construction, the requirement for end
connections between the jacket and the horizontal structural element and the potential for
thin wall buckling of the jacket.
5.2.1.1 Bond Between SIMCON and Reinforced Concrete Column
Investigation of bonding of SIMCON to concrete was considered important because
bonding affects the ultimate behavior of composite beams. When the SIMCON is placed as
a layer on top or at the bottom of reinforced concrete beam, delamination can occur. When
SIMCON was placed around various concrete sections in bending, it was found that
unbonded and bonded behavior differs slightly (Krstulovic, et al 1997 and 1999a).
In the literature review section, it was shown that SIFCON exhibits drying shrinkage
in the order of 0.02% to 0.05% after 21 days of casting. It may be reasonable to expect
similar shrinkage behavior from SIMCON. This type of shrinkage may have affected results
of unbonded SIMCON jackets in experiments conducted by Krstulovic, et al [1997 and
1999a]. Those SIMCON jackets demonstrated no difference in bonded and unbonded
behavior at least up to service load levels. Therefore, one may expect, even in the absence

59
of special bonding techniques, a reasonable bond to be developed between SIMCON and
concrete due to SIMCON drying shrinkage.
It was anticipated that bonding of a SIMCON jacket to a column may not pose a
problem. But this factor was identified as potentially critical since bonding also would
clearly affect the costs of construction as well as the column behavior. If the bonding were
found to be critical, then a good bond between SIMCON and concrete had to be ensured
rather than simply assumed due to differential shrinkage. To develop a good bond capacity,
a method similar to concrete-steel composite construction such as inserting studs into
concrete column or some other alternative method could be employed. If analysis shows that
the bonding is not critical, costs will be lower. An unbonded jacket would also prevent
possible damage to the existing concrete column by inserting studs.
5.2.1.2 SIMCON End Connections
SIMCON jacketing is anticipated in situations where an increase in both axial load
and the bending moment capacity of a column is desired. These capacity increases require
tensile and compressive forces to be developed in the SIMCON, and those forces must be
adequately transferred by connections between the SIMCON jacket ends and the slab or
beam to which it is attached. For example, the compressive forces may cause a punching
shear failure in a slab or localized crushing of the surface, because at ultimate load the
compressive stresses in the high strength SIMCON may exceed the bearing capacity of the
concrete in the connecting slab or beam which was probably placed with a lower strength,
commodity grade, commercial concrete.

60
Constructing SIMCON pedestal and capital at the ends of the SIMCON jackets may
be required to transfer and distribute the SIMCON compressive forces to the beams or slabs.
The tensile connections may be constructed in several ways, including the use of drilled
anchors or an epoxy agent. If longitudinal shrinkage is expected to be a problem, one
solution might be to leave a gap at the top of the jacket and later fill the gap with epoxy or
cementitious non-shrink grout after an adequate curing and drying period to avoid additional
tensile stresses due to the drying shrinkage of the SIMCON. Low fire resistance, creep, and
shear resistance properties of epoxy should be considered, however.
Another connection scheme could involve using steel collars at the ends. In this case,
although an adequate steel collar can be designed to resist loads, consideration should be
given to connection of the steel collar-SIMCON jacket to the concrete slab or footing.
Related concerns include the need to place anchors within the SIMCON, column and the
slab, and means for ensuring load transfer to the SIMCON jacket. These factors will clearly
affect the construction sequence requirements, and cost of a SIMCON jacket.
5.2.1.3 Removal of Load on Existing Reinforced Concrete Column Prior to Jacketing
It is reasonable to assume that in many cases the column to be strengthened is in an
older structure. It is known that an axially loaded, reinforced concrete column subjected to
constant load experiences a gradual but significant redistribution of stress with time; the
concrete stress decreases while the steel stress increases (Park and Pauley, 1975). If the load
is removed quickly, both the steel and the concrete undergo an instantaneous elastic recovery.
However, since the load carried by the steel has increased, while that for the concrete has

61
decreased due to creep, the steel tries to recover more than the concrete. The steel therefore
retains some residual compression while the concrete becomes stressed in tension, which
may cause cracking. The use of backshores to remove the external load on the reinforced
concrete column may create cracking in the column before the SIMCON jacket is applied.
The use of or the lack of backshores may affect the ultimate load behavior of SIMCON
jacketed columns. If analysis indicates that the removal of existing column load does not
have a significant effect on the behavior of SIMCON jacketed column, then backshoring
need not to be specified, and clearly the lack of backshores would decrease costs.
5.2.1.4 Thin Wall Buckling of SIMCON Jacket
One of the limiting factors in design of thin walled compression members is buckling
(AISC, 1995). Since SIMCON is an axially loaded, thin element, it may fail by local
buckling. The likelihood of thin wall buckling even may become greater if the SIMCON is
placed non-concentrically around the column, or if the SIMCON is thinner in one spot or
another due to routine construction variation. Another factor affecting thin wall buckling of
SIMCON jacket may be the bond between SIMCON and concrete. If SIMCON is perfectly
bonded to concrete, then the risk for thin wall buckling of SIMCON is reduced because of
the adhesion to the concrete. Therefore, the criticality of this factor depends in part on the
findings regarding criticality of bond. Thin wall buckling of the SIMCON jacket may be
controlled by specifying a greater thickness or establishing appropriate tolerances, if
required.
62
5.2.2 Identification of Factors Occurring During Construction
A number of factors were identified which would occur during construction and
which could affect behavior or, by logical extension, the design. Many of these factors
involve routine construction tolerances. The factors identified included variations in strength
of the SIMCON slurry, variations in thickness of the SIMCON jacket, variations in centering
the SIMCON jacket, and location of the fiber mat seams.
5.2.2.1 Routine Variations in SIMCON Strength
Routine variations in the properties of the constituents and variations in the
placement of the SIMCON slurry will cause the strength of the SIMCON to differ from
design strength. Slight changes in the water/cement ratio lead to variations in strength (see
Figure 2.7). The strength reduction could also be caused by frost damage. While this was
considered to be potentially problematic in the original development of factors, the likelihood
of serious damage due to frost attack was found to be minimal (see Chapter 4).
The lower strength may cause changes in ultimate axial load and moment capacities.
In ACI 318 [2002], the strength reduction factor for columns is lower than that for beams
because the strength of the concrete has a greater effect on the strength of a column than on
a beam. The anticipated strength variations of SIMCON jacket, when used to strengthen a
column will affect the capacity of the jacket-column system. If the effects of routine strength
variation do not have a significant effect on the ultimate load capacity, then routine variations
in strength of SIMCON may be permitted. Otherwise, additional constraints on construction
or a more conservative strength reduction factor may be required.
63
5.2.2.2 Routine Variations in SIMCON Jacket Thickness
SIMCON thickness may be affected by several factors at the construction site. These
factors include: (a) tolerances in the formwork dimensions as built or erected, (b) excessive
clamping forces on the formwork, and (c) bulging in formwork due to slurry injection
pressures.
SIMCON thickness may effect the behavior in several ways: (a) the ultimate axial
load capacity will be directly effected, (b) a thinner jacket may cause thin wall buckling of
the SIMCON jacket under compression, and (c) an enlarged SIMCON area will increase the
stiffness of a jacketed column. Since the SIMCON jacket is relatively thin, routine
construction tolerances may be too lenient requiring more stringent dimensional tolerances
or modifications in design requirements.
5.2.2.3 Non-Concentric Placement of the SIMCON Jacket During Construction (Centering)
Due to routine placement operations, formwork, and therefore the fiber mat, may be
placed non-concentrically around the existing column, that is, the jacket will not be centered
on the column. These variations in placement may affect the behavior in two ways: (a) the
moment carrying capacity of the column may be negatively affected, and (b) if the non-
concentric placement occurs in such a way that the thinner part is axially loaded excessively,
this may cause thin wall buckling of SIMCON. Again, the effects of multiple tolerances
must be examined.
64
5.2.2.4 Location and Strength of Fiber Mat Seams
According to Krstulovic, et al [1999b], SIMCON was not found to be sensitive to
fiber orientation under compression. SIMCON may also not be very sensitive to fiber
orientation under tension because of the scatter in orientation of the fibers in a mat.
Therefore, the fiber mat may be chosen to be placed in any way as long as it is feasible to do
so at the construction site. The method used to wrap the fiber mat around the concrete
column may pose another concern, however. The fiber mat seams may have less strength
due to fiber concentration and the difficulty of achieving good infiltration with the slurry if
the seams overlap. If the fiber mat is left butt-ended against itself this may contribute to
lower strength at that seam location. Therefore, seams may affect axial load and bending
moment capacities. Placement of seams one way or another may also have an impact on
construction practice.
The fiber mat rolls are commercially provided in 4 feet (1.22 m) widths. These rolls
can be either longitudinally wrapped or in discreet rings around the column. If the column
is wrapped longitudinally with a mat, then seams are placed longitudinally.
One issue to consider is the difficulty or ease in placing the mat using any one of
these three methods. If the mat is wrapped around the column beginning from the bottom,
it may be easier to place the upper portion by resting on the mat below. Spiral placement
may cause some waste in cutting the mat at the column bottom and top, however this may
be preferable because of the continuity provided. If the column wrapped is very large,
however, it may become necessary to place the mat in discreet rings, one on top of the other.
In this case, seams may be staggered. Analysis may indicate the importance of seams and

65
also help resolve the placement of seams.
Clearly, some precautions against seam opening during slurry injection must be
provided to avoid an unreinforced seam. Experimental work appears to indicate that this
potential problem can be avoided by tying the mat securely in place with tie wire.
5.3 ANALYTICAL METHODOLOGY
5.3.1 Analytical Methods Used For Evaluation of Factors
The factors selected for investigation were evaluated in terms of their effects on
ultimate load and service load behavior of SIMCON jacketed columns. The cross sections
and materials were selected from the most typical cross section types and materials of
reinforced concrete columns reasonably found in a majority of structures. The effects of
selected factors were evaluated on otherwise identical columns. For evaluation of the
factors, several methods were employed. These methods included moment-curvature
diagrams, short column axial load-moment interaction diagrams, and thin wall buckling
solutions.
Short column axial load-moment interaction (Pn-Mn) diagrams are the common
procedures for the basis of design procedure for reinforced concrete columns. Moment-
curvature (M-n) diagrams can also be calculated assuming varying axial loads. In this study,
however, moment-curvature (Mo-n) diagrams were examined only for zero axial load
condition. These procedures usually involve straight-forward computations. Therefore,
these two analytical tools were primarily employed in this study. Some representative axial
load-moment interaction and moment-curvature diagrams were shown for selected factors,

66
but evaluation of factors were based on axial load capacities (Pn,max) from Pn-Mn diagrams
(see Figure 5.1.a), and maximum moments (Mo,max) from Mo-n diagrams (see Figure 5.1.b).
Although the curvature values from the Mo-n diagrams could also be used for evaluation in
addition to Pn,max and Mo,max comparisons, after preliminary analysis, it was decided that they
would not provide as much insight as Pn,max and Mo,max comparisons, and therefore were not
used. The following factors were evaluated using Pn-Mn and Mo-n diagrams; a) bonding
between SIMCON and reinforced concrete, b) removal of the load on an existing reinforced
concrete column prior to jacketing, c) routine variations in SIMCON design strength, d)
routine variations in SIMCON jacket design thickness, e) non-concentric placement of
SIMCON jacket, and f) location and strength of fiber mat seams. The results were
graphically given in this chapter. The tabulated results are provided in Appendix C for the
evaluated factors.
Thin wall buckling of SIMCON jacket evaluation was based on the solutions of
Timoshenko [1961] for elastic structures. SIMCON end connections were evaluated by
comparing possible alternatives.
5.3.2 Determination of Criticality of the Factors
Once the factors were evaluated, their effects were compared to the effects of
appropriate ACI tolerances on the reinforced concrete column sections which were used in
this study. The ACI strength and dimensional tolerances were applied to square and circular
reinforced concrete column cross sections, and the effects of the tolerances on the columns
were determined analytically. The criticality of the factors was established based on
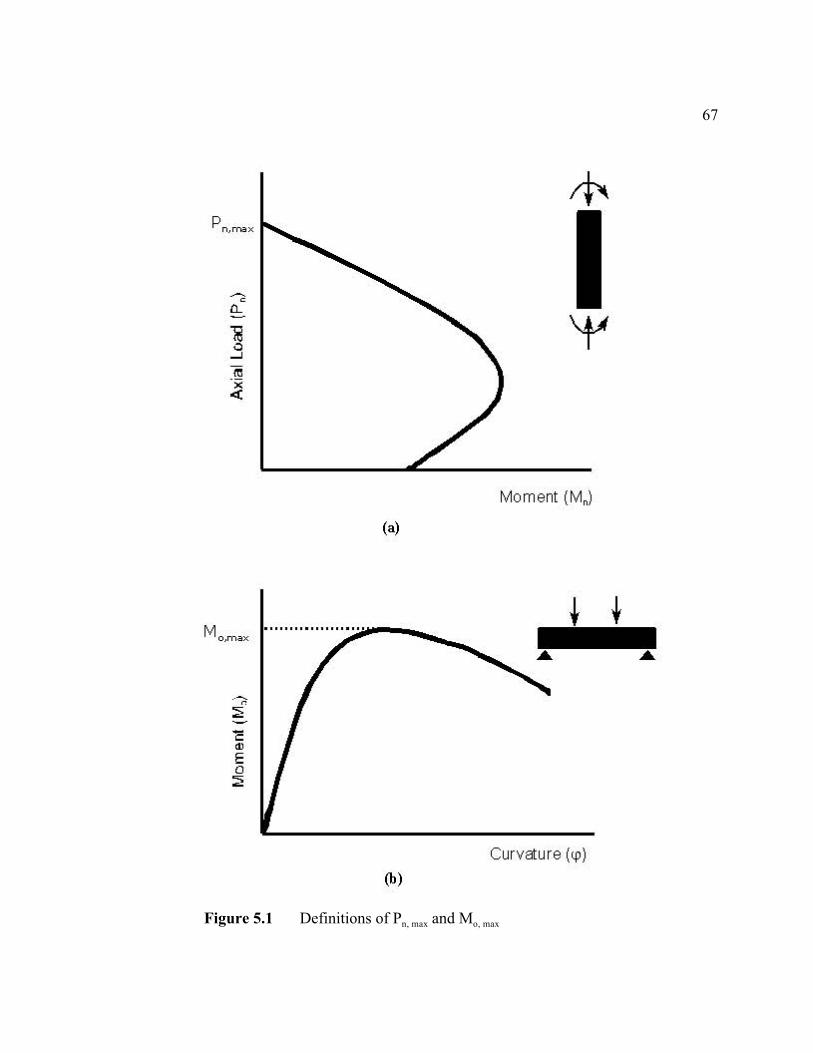
67
Figure 5.1 Definitions of Pn, max and Mo, max
Moment (Mol
o,mox ~
M ................. ,,-....--........
• • E c ,
Curvcture (,.,l 0)

68
comparison of the results of the analysis of the behavior of the SIMCON jacketed columns.
If a factor produced effects similar to those found with conventional concrete column
performance, using routine tolerances, then the level of the factor used in analysis was
determined to be satisfactory. If the effect of a factor was found to be negligible, then the
factor was considered “not important”. If analysis indicated the factor was important or
critical to the composite behavior of the SIMCON jacketed column, appropriate tolerances,
construction requirements, or guidance or design limitations were suggested where possible.
If a solution to the problem could not be determined on the basis of this study, additional
research was recommended. As noted above, a significant result of this study was to
prioritize future research needs, if any, to permit the application of this product and technique
in practice.
5.3.3 Cross Sections
Two cross sections, a square and a circular section, as shown in Figure 5.2, were
analyzed to find their moment-curvature curves and axial load-moment interaction diagrams.
In addition, biaxially loaded, square sections, as shown in Figure 5.2, were also analyzed.
These cross sections were chosen as representative of two distinct types of cross sections and
were therefore expected to exhibit at least somewhat different behavior. The cross section
dimensions were selected to represent those commonly found in column members which
might be encountered in retrofit operations. The size of each cross section was chosen to
provide a similar gross area of concrete; a 16 in. by 16 in. (400 mm by 400 mm) square and
18 in. (460 mm) diameter circular cross section were analyzed.

69
Figure 5.2 Cross sections used in analysis

70
Figure 5.2 cont’d Cross sections used in analysis
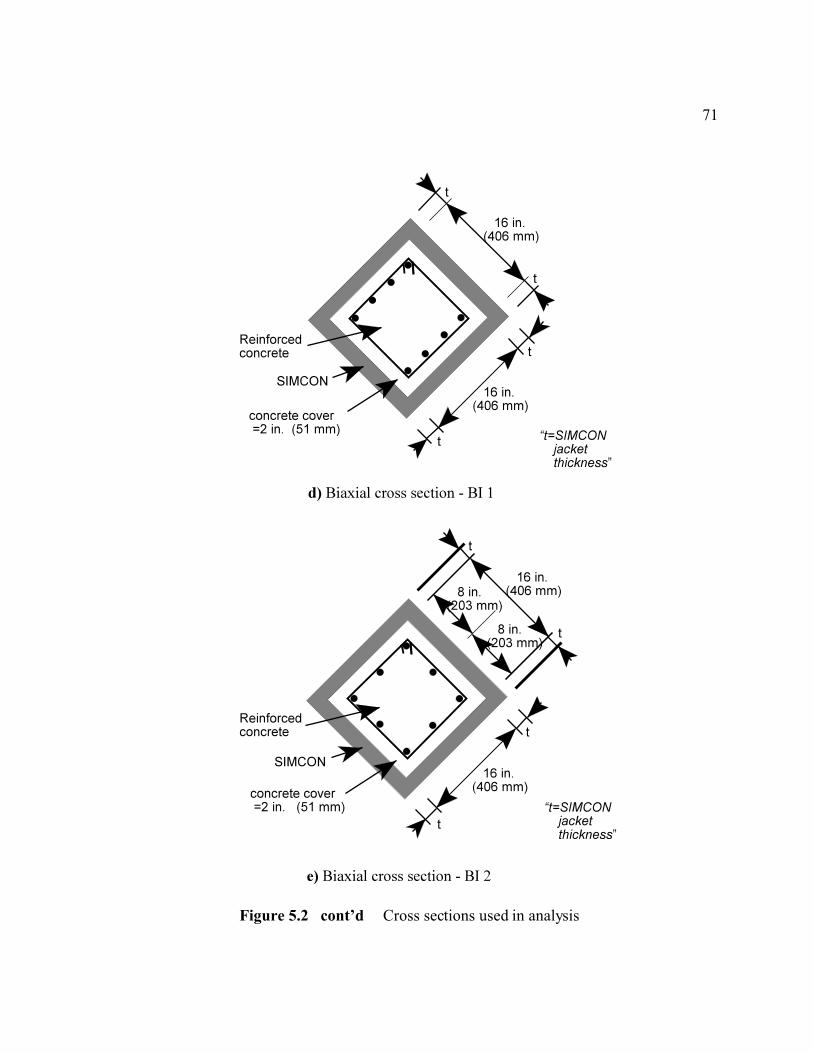
71
Figure 5.2 cont’d Cross sections used in analysis
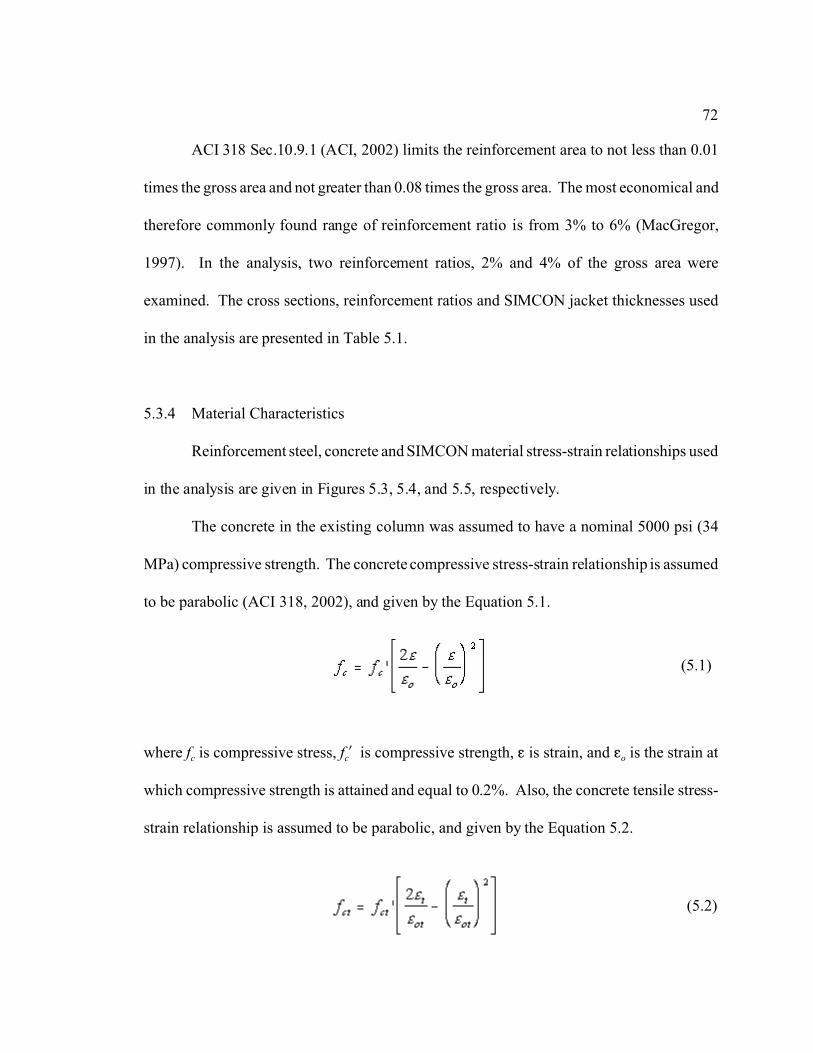
72
(5.1)
(5.2)
ACI 318 Sec.10.9.1 (ACI, 2002) limits the reinforcement area to not less than 0.01
times the gross area and not greater than 0.08 times the gross area. The most economical and
therefore commonly found range of reinforcement ratio is from 3% to 6% (MacGregor,
1997). In the analysis, two reinforcement ratios, 2% and 4% of the gross area were
examined. The cross sections, reinforcement ratios and SIMCON jacket thicknesses used
in the analysis are presented in Table 5.1.
5.3.4 Material Characteristics
Reinforcement steel, concrete and SIMCON material stress-strain relationships used
in the analysis are given in Figures 5.3, 5.4, and 5.5, respectively.
The concrete in the existing column was assumed to have a nominal 5000 psi (34
MPa) compressive strength. The concrete compressive stress-strain relationship is assumed
to be parabolic (ACI 318, 2002), and given by the Equation 5.1.
where fc is compressive stress, fc! is compressive strength, g is strain, and go is the strain at
which compressive strength is attained and equal to 0.2%. Also, the concrete tensile stress-
strain relationship is assumed to be parabolic, and given by the Equation 5.2.
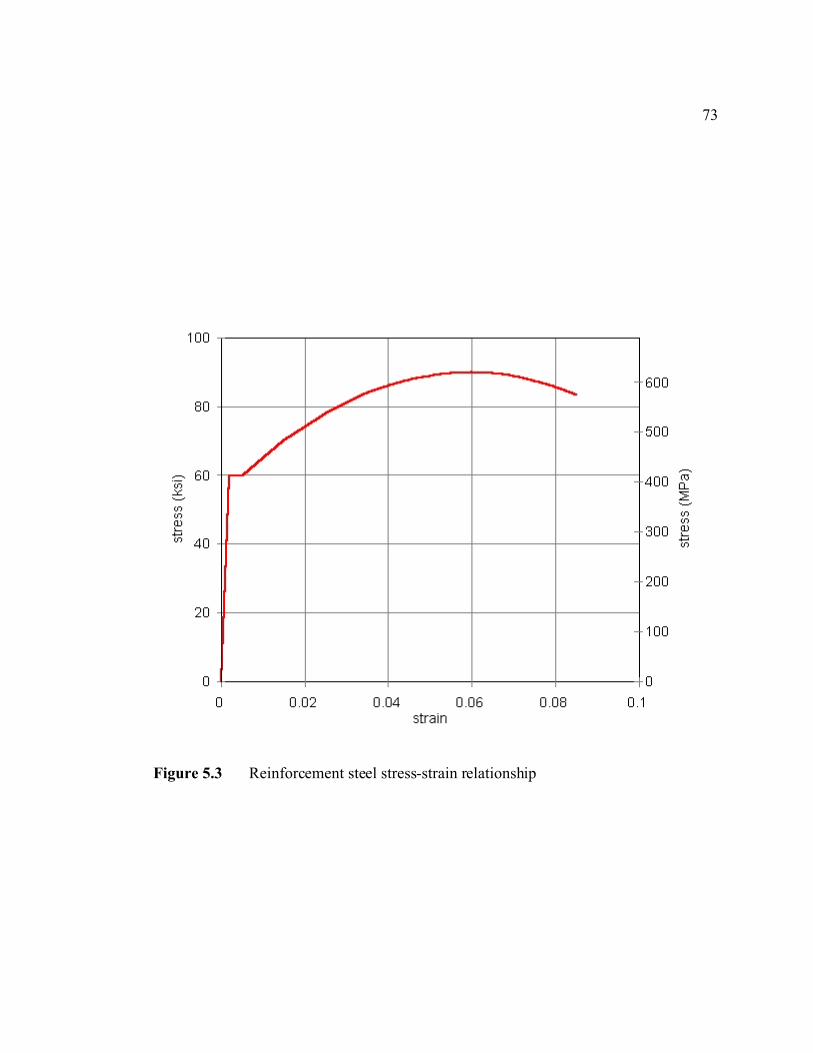
73
Figure 5.3 Reinforcement steel stress-strain relationship
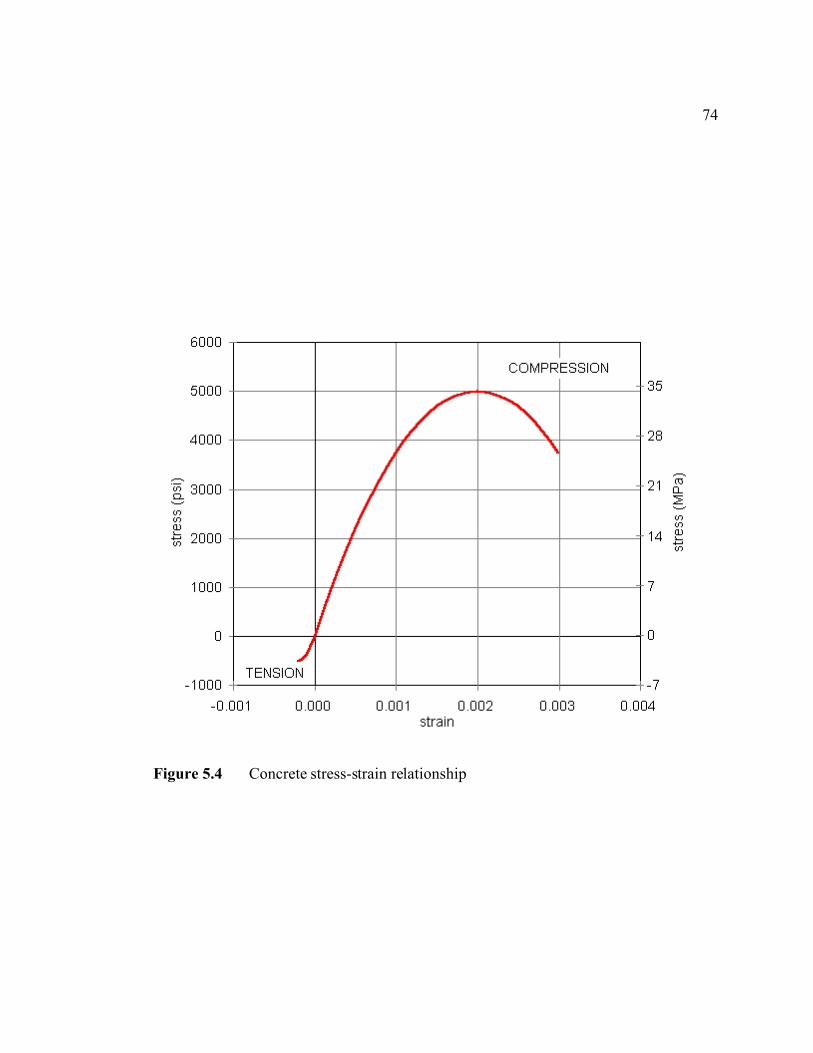
74
Figure 5.4 Concrete stress-strain relationship

75
Figure 5.5 SIMCON stress-strain relationship

76
where fct is tensile stress, fct! is tensile strength equal to { fc! /10 }, gt is tensile strain, got is the
strain at which tensile strength is attained and taken equal to 0.02%.
Table 5.1 Cross section configurations used in the analysis
Cross section reinforcement
Section designation (see Figure 5.2) SIMCON jacket thickness
SQ11 SQ1 8#7 1 inch (25.4 mm)
SQ12 SQ2 8#7 1 inch (25.4 mm)
SQ13 SQ1 8#10 1 inch (25.4 mm)
SQ14 SQ2 8#10 1 inch (25.4 mm)
SQ21 SQ1 8#7 2 inches (50.8 mm)
SQ22 SQ2 8#7 2 inches (50.8 mm)
SQ23 SQ1 8#10 2 inches (50.8 mm)
SQ24 SQ2 8#10 2 inches (50.8 mm)
CIR11 CIR 8#7 1 inch (25.4 mm)
CIR12 CIR 8#7 1 inch (25.4 mm)
CIR21 CIR 8#10 2 inches (50.8 mm)
CIR22 CIR 8#10 2 inches (50.8 mm)
BI11 BI1 8#7 1 inch (25.4 mm)
BI12 BI2 8#7 1 inch (25.4 mm)
BI13 BI1 8#10 1 inch (25.4 mm)
BI14 BI2 8#10 1 inch (25.4 mm)
BI21 BI1 8#7 2 inches (50.8 mm)
BI22 BI2 8#7 2 inches (50.8 mm)
BI23 BI1 8#10 2 inches (50.8 mm)
BI24 BI2 8#10 2 inches (50.8 mm)
#7 bar = 7/8 inch (22 mm) nominal diameter; #10 bar = 10/8 inch (32 mm) nominal diameter;
Column reinforcement is typically Grade 60 steel conforming to ASTM 615 standard
(ASTM, 2002). The reinforcement steel stress-stain relationship is given by Equations 5.3.a,
b, and c.

77
(5.3.c)
(5.3.a)
(5.3.b)
where F is stress, g is strain, E is elasticity modulus equal to 29000 ksi (200 GPa), gy is the
yield strain equal to 0.025%, fy is the yield stress equal to 60 ksi (414 MPa), gsh is the initial
strain hardening strain equal to 0.5%, Esh is the elasticity modulus at the beginning of strain
hardening equal to 1100 ksi (7,584 MPa), fu is the maximum stress equal to 90 ksi (621
MPa), and gu is the ultimate strain equal to 9%.
SIMCON stress-stain relationships under compression and tension are given in
Appendix A. Since the purpose of the analysis is to determine the criticality of several
factors, only one volume of fibers (Vf) was used in analysis. In this study, material properties
of SIMCON with a fiber volume, Vf of 5% was used. It was assumed that for strengthening
a column, the maximum benefit could be achieved using a SIMCON jacket which has the
highest practicable strength.
The characteristic tensile values of SIMCON used in analysis are; the 28 day ultimate
tensile strength, Ftu, equals 2300 psi (15.9 MPa), the strain at the maximum stress, gtu, equals
78
1.12%, and the tensile elastic modulus, Et, equals 3400 ksi (23.4 GPa). The characteristic
compression values are; the 28 day ultimate compressive strength, Fcu, equals 11000 psi (75.8
MPa), the strain at the maximum stress, gcu, equals 0.58%, and the compressive elastic
modulus, Ec, equals 3610 ksi (24.9 GPa).
5.3.5 Assumptions for Structural Modeling
In this study, the following assumptions are made;
1) plane sections remain plane after loading, i.e. strain distribution is linear across
the section,
2) the stresses in concrete, steel and SIMCON can be computed from appropriate
stress-strain diagrams,
3) perfect bond exists between the reinforcing steel and the concrete,
4) the concrete fails in compression at a strain of 0.3% (ACI 318, 2002),
5) any concrete strength increase due to spiral reinforcement and SIMCON jacketing
confinement can be conservatively neglected,
6) the concrete tensile strength is taken into consideration, and tensile strength is
assumed to be 10% of compressive strength,
7) transverse shear deformations can be neglected, that is no shear failure precedes
bending failure or axial compression failure, and
8) only a gradually increasing, static load occurs.

79
(5.4)
5.4 OVERVIEW OF ANALYTICAL METHODS
Conventional, commonly employed structural models were used in the analysis of
members. Since the purpose of this study was to identify and evaluate the effects of
construction factors on behavior, the use of simple, well established models is appropriate.
In this section, the basis for these models and analytical procedures are reviewed. The
analyses were conducted using two programs written and developed by the author to
determine the moment-curvature and axial load-moment interaction behavior of SIMCON
jacketed reinforced concrete columns.
5.4.1 Moment-Curvature Analysis
The moment-curvature diagrams were prepared using a successive approximation
approach based on strain compatibility and equilibrium. Strain compatibility means that the
stress at any point on the cross-section must correspond to the strain at that point. The
equilibrium is satisfied by balancing the internal forces with the external forces acting on the
member. Curvature, n, is calculated as given in Equation 5.4 (Timoshenko and Young,
1968).
where g is the strain at a distance d from the neutral axis as shown in Figure 5.6, at a given
load.
The following steps are followed for calculation of moment-curvature for a simple
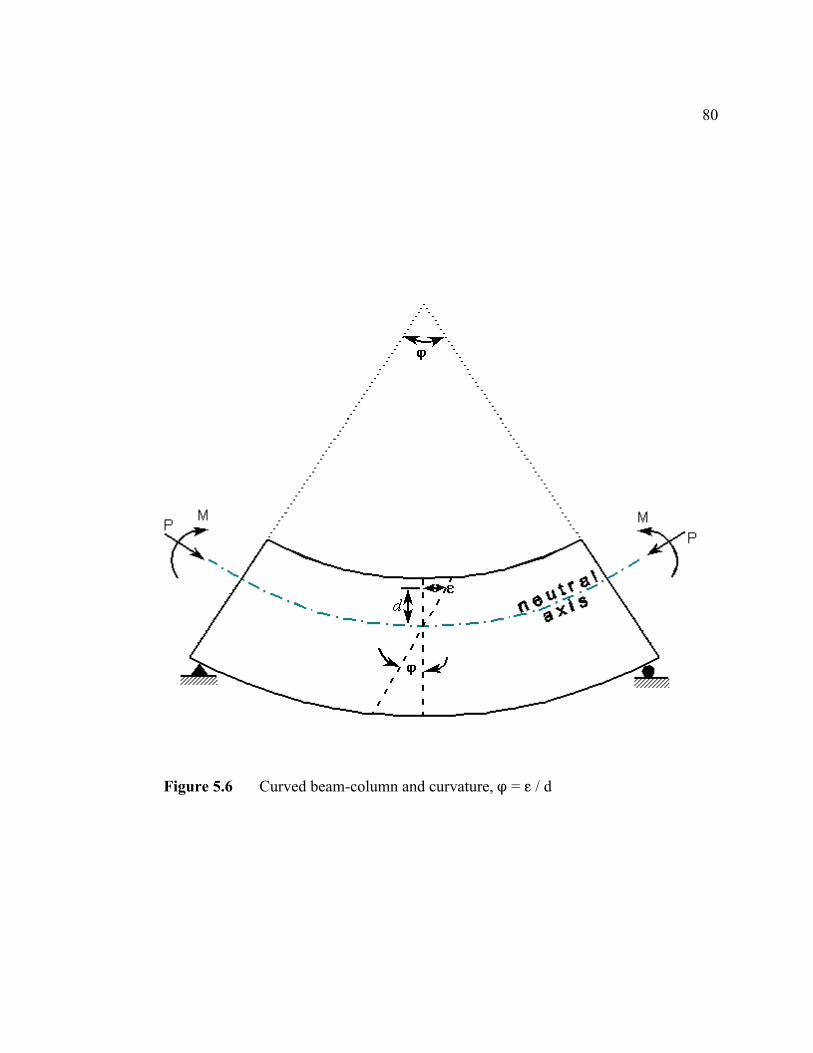
80
Figure 5.6 Curved beam-column and curvature, n = g / d

81
(5.5)
(5.6)
(5.7)
reinforced concrete section (MacGregor, 1997; Park and Pauley, 1975):
a) Assume a strain value, gc for the extreme compression fiber of the concrete as
shown in Figure 5.7.
b) Assume an initial x', the distance from the extreme compression fiber to the
neutral axis.
c) Find the strains in each reinforcement steel at a distance di from the extreme
compression fiber by using the Equation 5.5.
d) Determine the stresses in reinforcement steel. Calculate the tensile forces, TR and
the compressive forces, CR on each reinforcement using Equations 5.6.
e) Using the appropriate stress-strain diagrams, compute the concrete compression
force, CC and tension force, TC by Equations 5.7 and 5.8, respectively.

82
Fig
ure
5.7
Rei
nfor
ced
conc
rete
bea
m-c
olum
n cr
oss
sect
ion,
str
ains
and
int
erna
l fo
rces

83
(5.8)
(5.10)
(5.11)
f) Check equilibrium of internal forces by Equation 5.9,
CC + CR = TC + TR (5.9)
g) If equilibrium is not satisfied, choose another x' value and follow steps from (b)
through (f).
h) When equilibrium is satisfied, the internal resisting moment is determined by
multiplying the internal forces by their distance from the cross-section centroid as given by
Equations 5.10 through 5.14.
Moments of internal forces in the reinforcement can be found using Equation 5.10.
Moments of compressive and tensile internal forces in concrete are found using
Equations 5.11 and 5.12, respectively.
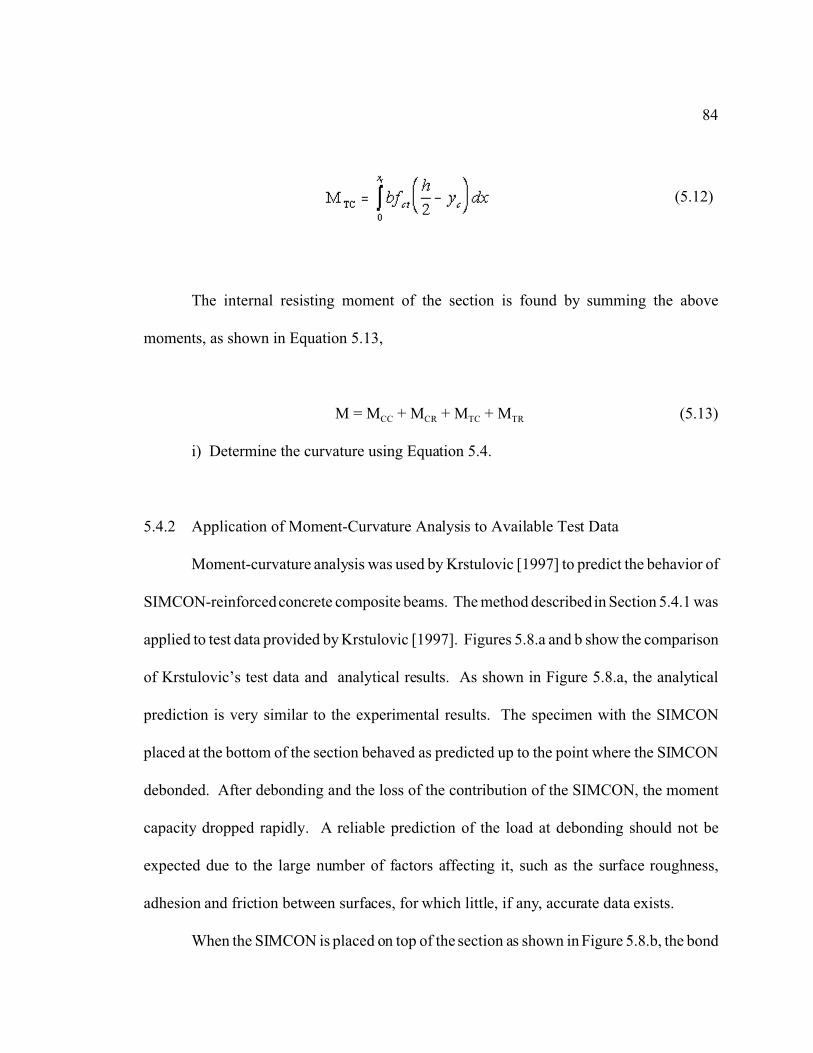
84
(5.12)
The internal resisting moment of the section is found by summing the above
moments, as shown in Equation 5.13,
M = MCC + MCR + MTC + MTR (5.13)
i) Determine the curvature using Equation 5.4.
5.4.2 Application of Moment-Curvature Analysis to Available Test Data
Moment-curvature analysis was used by Krstulovic [1997] to predict the behavior of
SIMCON-reinforced concrete composite beams. The method described in Section 5.4.1 was
applied to test data provided by Krstulovic [1997]. Figures 5.8.a and b show the comparison
of Krstulovic’s test data and analytical results. As shown in Figure 5.8.a, the analytical
prediction is very similar to the experimental results. The specimen with the SIMCON
placed at the bottom of the section behaved as predicted up to the point where the SIMCON
debonded. After debonding and the loss of the contribution of the SIMCON, the moment
capacity dropped rapidly. A reliable prediction of the load at debonding should not be
expected due to the large number of factors affecting it, such as the surface roughness,
adhesion and friction between surfaces, for which little, if any, accurate data exists.
When the SIMCON is placed on top of the section as shown in Figure 5.8.b, the bond

85
Figure 5.8.a Comparison of experimental and analytical moment-curvature diagramsof reinforced concrete-SIMCON composite beams (Krstulovic, 1997)

86
Figure 5.8.b Comparison of experimental and analytical moment-curvature diagramsof reinforced concrete-SIMCON composite beams (Krstulovic, 1997)

87
forces may be increased due to induced friction under the load. Debonding was reported to
occur soon after the flexural capacity of the composite beam was reached (see Figure 5.8.b).
Likewise, when SIMCON was placed on three sides of the beam in a U-shaped
configuration, no debonding was reported. Therefore, it may be concluded that the shape of
SIMCON and loading conditions are important for bonding capacity to develop.
Maximum moments ratios between predicted and observed behavior were 13% and
14% for SIMCON placed on the compression zone or in a U-shaped configuration,
respectively. These differences may originate from slight differences in SIMCON material
properties. In the analysis, the SIMCON tensile and compressive strength values given by
Krstulovic were used, although these values are not necessarily exactly the same as those of
the tested materials since the reported values were the average tensile and compressive
strengths for a given fiber volume. Since the results are conservative, however, the analytical
model appears to be appropriate. For the comparison of design and construction factors in
this study, the results using conventional analytical techniques appear to be adequate.
5.4.3 Column Axial Load-Moment Interaction Diagrams
The following procedure was used to determine axial load-moment interaction curves
for columns using the requirements of strain compatibility and equilibrium.
a) Assume the strain value for concrete extreme compression fiber as 0.3% (ACI-
318, 2002) as shown in Figure 5.9,
b) Assume a value for x', the distance from the extreme compression fiber to the
neutral axis,
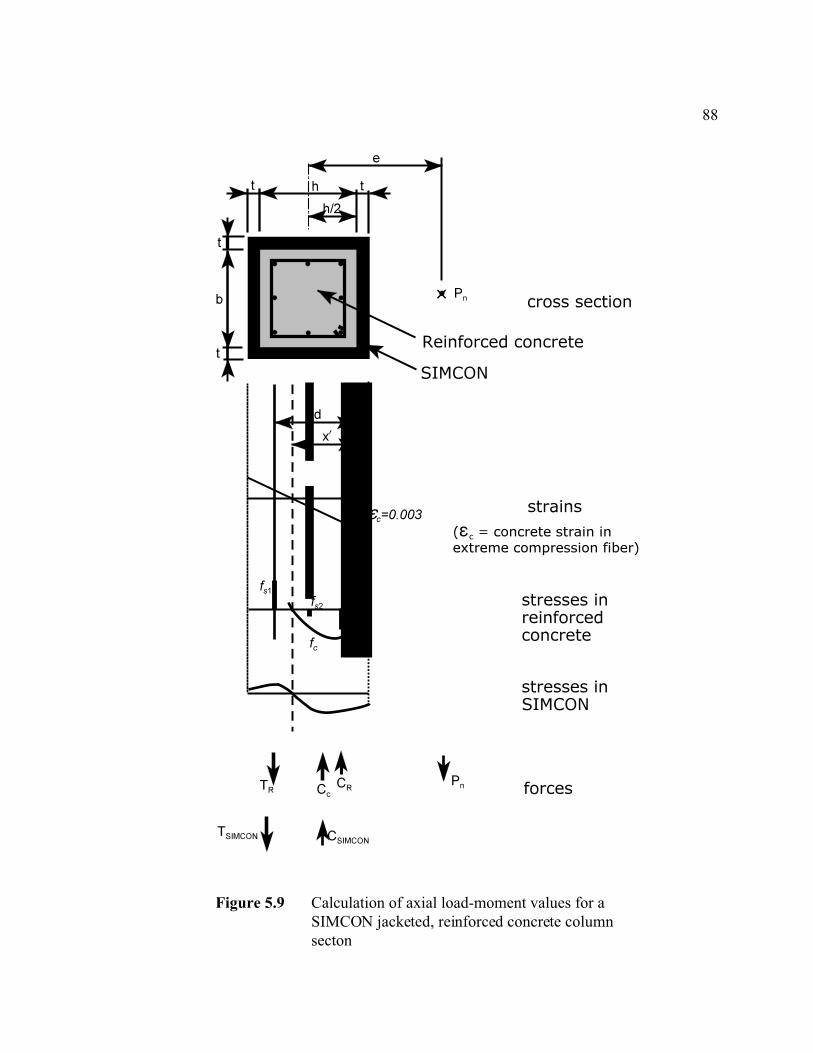
88
Figure 5.9 Calculation of axial load-moment values for aSIMCON jacketed, reinforced concrete columnsecton

89
c) Calculate strains and stresses in the reinforcement and concrete,
d) Determine the compressive and tensile forces in each material from their stress-
strain relationships as explained in moment-curvature procedure,
e) Sum up Pn using the Equation 5.14,
Pn = CC + CR + TC + TR (5.14)
f) Compute the internal resisting moment, Mn by multiplying the internal forces by
their distance from the centroid of cross-section as given by Equation 5.15, and
Mn = MCC + MCR + MTC + MTR (5.15)
g) Construct the axial load-moment interaction curve by varying the neutral axis
location and computing the resulting Pn and Mn values.
5.4.4 The Effects of Tolerances on Reinforced Concrete Section Behavior
The analytical procedures for determining moment-curvature and axial load-moment
interaction diagrams were used for reinforced concrete columns without a SIMCON jacket
to establish acceptance criteria for the evaluation of factors for a SIMCON jacketed column.
The cross sections in Table 5.1 and materials properties given in Section 5.3.4 were used.
Tolerances must be established for concrete strength as with any other specified,
measurable quantity. ACI 318 [2002] provides acceptance criteria for concrete. These

90
acceptance criteria effectively establish tolerances for the compressive strength of concrete
(Cutshall, Leming, and Johnston, 1999). If an individual test strength falls 500 psi (3.4 MPa)
below the specified value of fc! when fc! is 5000 psi (34.5 MPa) or less, then the Engineer of
Record must ensure that the load-carrying capacity of the structure is not jeopardized. Using
this acceptance criteria as the strength tolerance and applying it to the columns used in this
study, the effects of a strength reduction of 500 psi, or at least 10% of the compressive
strength of the concrete could be compared.
ACI 318 (ACI, 2002) gives the strength reduction factor for columns as 0.65 at the
design stage. For the evaluation of existing structures, a strength reduction factor of 0.8 is
appropriate for columns, if the dimensions of the column and the characteristics of the
materials, including the strengths of the concrete and the reinforcement, have been
established. Therefore, an 80%-65%=15% reduction in strength of the element, as designed,
is attributable to variation in material properties and dimensional control. Since the
contributions of dimensional tolerances are relatively minor for the columns, the primary
factors contributing to the difference in the strength reduction factors are material variation
(Cutshall, Leming and Johnston, 1999). Since the yield strength of the steel routinely
exceeds the specified value (Park and Pauley, 1975), much, although certainly not all, of the
difference in the strength reduction factor in practice is often attributable to concrete material
variation.
Significantly, when the strength value to be used in this calculation is based on core
tests, the core strengths, after any adjustment for length to diameter ratio, are further adjusted
as provided in ACI 318, Section 5.6.5.4, that is, with a 15% addition to the average measured

91
strength value. Considering these factors, a 15% reduction in strength was used as the lowest
reasonable strength tolerance for this investigation. Clearly this is not a complete or rigorous
analysis of safety factors or tolerances. These factors do, however, indicate that a 10%
strength tolerance is conservative and a 15% strength tolerance is very reasonable for the
purposes of comparing the effects of routine construction variation of SIMCON jackets to
conventional concrete columns, and therefore determining whether a particular construction
or design effect is critical, important or appears to be within expected values.
Another important comparison was developed using the dimensional tolerances for
columns given in ACI 117 (ACI, 1990) and tolerances on placement of longitudinal
reinforcing steel taken from ACI 318, Chapter 7 (ACI, 2002). Since these tolerances are
used to help control variation in construction, they also can be used to help establish the
effects of routine variation in construction. The tolerances used are appropriate for the
column sizes used in this study. Reinforced concrete columns should be constructed to
within -3/8 in (-10 mm) (ACI 117, 1990). Reinforcement should be placed within “d-1/2 in”
(d-13 mm) (ACI 318, 2002).
To evaluate the effects the axial load and maximum moment capacities of the
sections with the strength equal to design value and zero tolerances were determined. The
results were provided in Appendix C for all cross-sections, and for all investigated variables.
Then these values were compared to the values obtained for the sections with the given
tolerances. The ratios were then averaged for all the sections and tabulated as shown in
Table 5.2. The values show the increase (with a plus sign) or decrease (with a minus sign)
in capacities in percent. The biggest effect on axial load capacity is the decrease in

92
compressive strength of concrete (11% reduction). The decrease in column dimensions
causes a reduction of 3.5% axial load capacity. These are clearly expected because the
column axial load capacity is directly related to concrete compressive strength and the area
of concrete.
The maximum moment ratios are more sensitive to the variations in reinforcement
placement and concrete strength. The effects of reinforcement placement and concrete
strength tolerances cause 5.8% and 3.1% reductions in maximum moments, respectively.
The area of the concrete does not have a large effect on maximum moment.
Table 5.2 The Effects of Tolerances for Reinforced Concrete Column
Maximum MomentRatio (Mo,max)
Axial Load CapacityRatio (Pn,max)
Concrete strength tolerance,
0.85fc!
average !3.1 !11
maximum -4.8 -12.2
minimum -1.6 -9.7
Dimensional tolerances,
!3/8 in. (!10 mm)
average !0.8 !3.5
maximum -3.6 -4.0
minimum 0.1 -2.8
Reinforcement placement,
d!1/2 in. (d!13 mm)
average !5.8 0.1
maximum -7.4 0
minimum -2.9 0.3
Total of averages -9.8 -14.4
Combined effects of tolerances -9.9 -13.3
"d" is the distance between the most compressed fiber and the bottom reinforcement
These tolerances can occur simultaneously, so that their combined effects were also
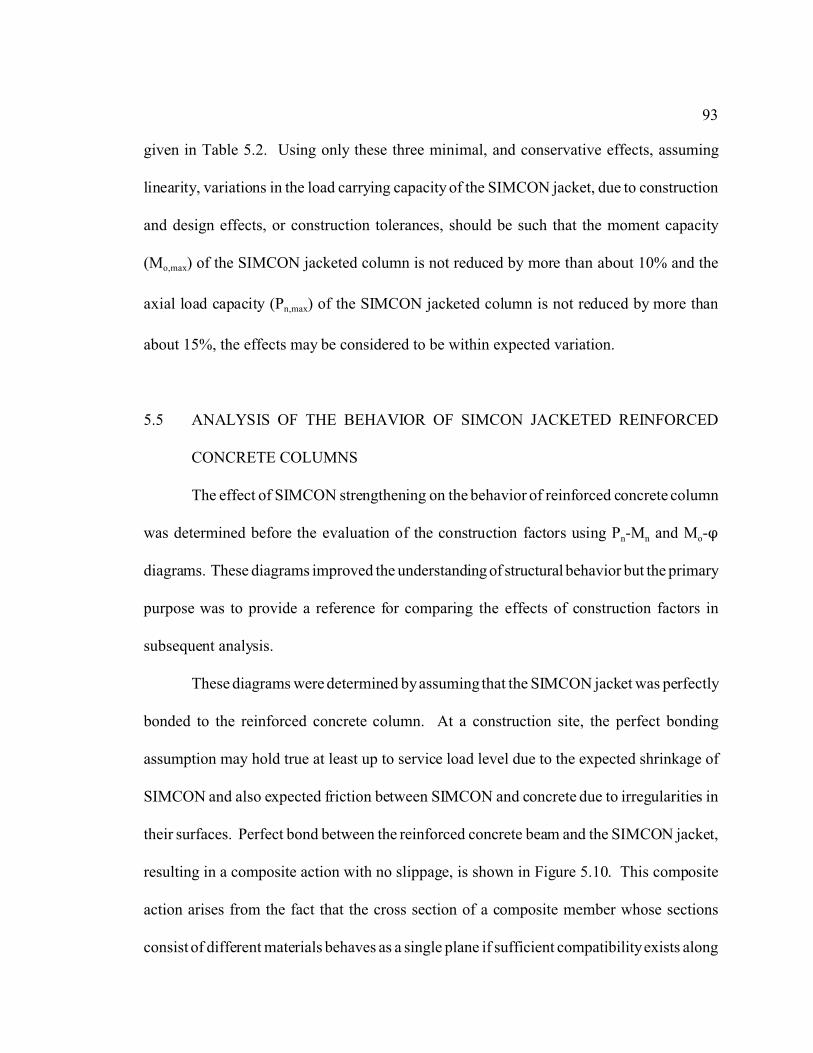
93
given in Table 5.2. Using only these three minimal, and conservative effects, assuming
linearity, variations in the load carrying capacity of the SIMCON jacket, due to construction
and design effects, or construction tolerances, should be such that the moment capacity
(Mo,max) of the SIMCON jacketed column is not reduced by more than about 10% and the
axial load capacity (Pn,max) of the SIMCON jacketed column is not reduced by more than
about 15%, the effects may be considered to be within expected variation.
5.5 ANALYSIS OF THE BEHAVIOR OF SIMCON JACKETED REINFORCED
CONCRETE COLUMNS
The effect of SIMCON strengthening on the behavior of reinforced concrete column
was determined before the evaluation of the construction factors using Pn-Mn and Mo-n
diagrams. These diagrams improved the understanding of structural behavior but the primary
purpose was to provide a reference for comparing the effects of construction factors in
subsequent analysis.
These diagrams were determined by assuming that the SIMCON jacket was perfectly
bonded to the reinforced concrete column. At a construction site, the perfect bonding
assumption may hold true at least up to service load level due to the expected shrinkage of
SIMCON and also expected friction between SIMCON and concrete due to irregularities in
their surfaces. Perfect bond between the reinforced concrete beam and the SIMCON jacket,
resulting in a composite action with no slippage, is shown in Figure 5.10. This composite
action arises from the fact that the cross section of a composite member whose sections
consist of different materials behaves as a single plane if sufficient compatibility exists along

94
Fig
ure
5.10
Per
fect
bon
d be
twee
n re
info
rced
con
cret
e an
d S
IMC
ON

95
(5.16)
(5.17)
(5.19)
the interface of two materials.
In the perfect bond case, strains in the reinforced concrete and the SIMCON jacket
are determined as shown in Figure 5.11. Internal compressive and tensile forces generated
in the SIMCON are given in Equation 5.16 and 5.17, respectively. Also, equilibrium must
be satisfied, resulting in Equation 5.18.
CC + CR + CSIMCON = TC + TR + TSIMCON (5.18)
The internal resisting moments produced by the SIMCON jacket are given by
Equations 5.19 and 5.20 for compressive and tensile internal forces.
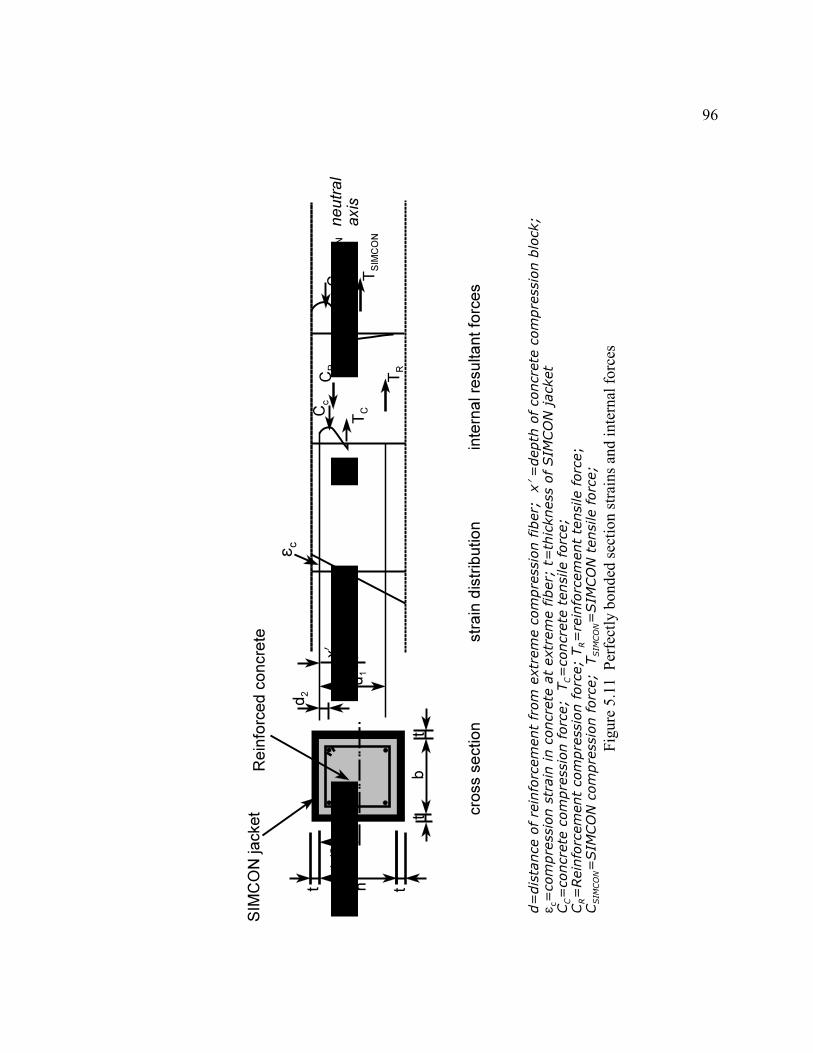
96
Fig
ure
5.11
Per
fect
ly b
onde
d se
ctio
n st
rain
s an
d in
tern
al f
orce
s
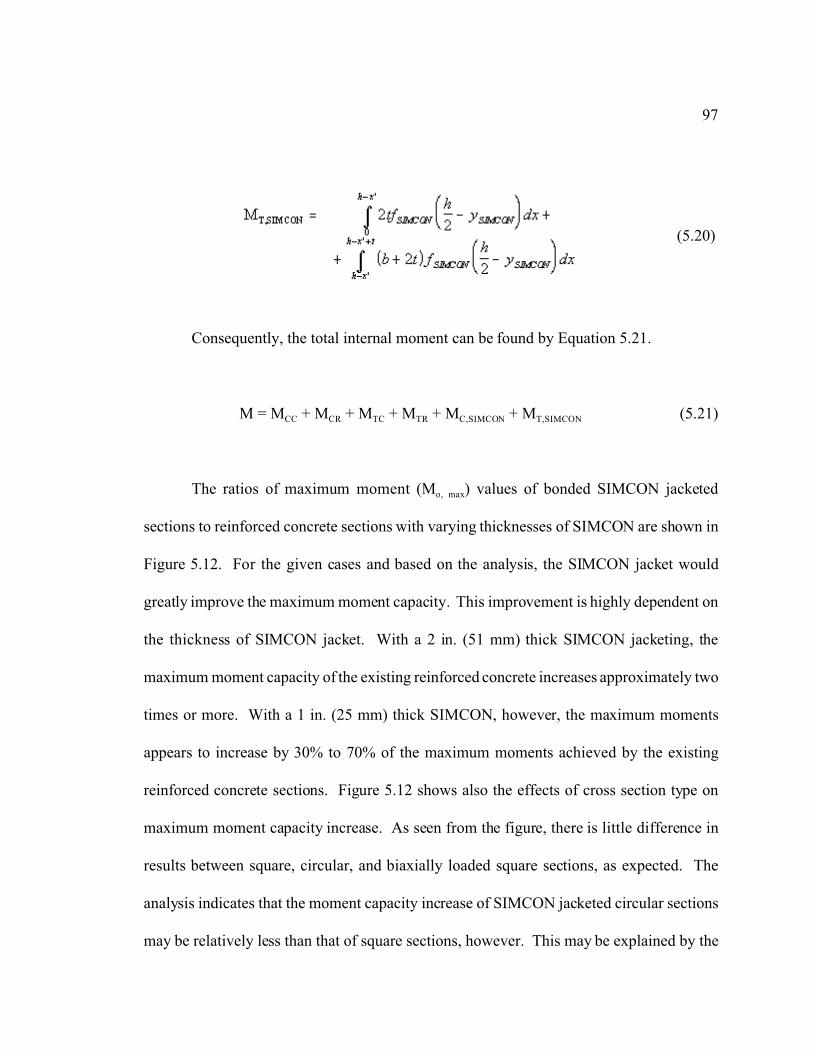
97
(5.20)
Consequently, the total internal moment can be found by Equation 5.21.
M = MCC + MCR + MTC + MTR + MC,SIMCON + MT,SIMCON (5.21)
The ratios of maximum moment (Mo, max) values of bonded SIMCON jacketed
sections to reinforced concrete sections with varying thicknesses of SIMCON are shown in
Figure 5.12. For the given cases and based on the analysis, the SIMCON jacket would
greatly improve the maximum moment capacity. This improvement is highly dependent on
the thickness of SIMCON jacket. With a 2 in. (51 mm) thick SIMCON jacketing, the
maximum moment capacity of the existing reinforced concrete increases approximately two
times or more. With a 1 in. (25 mm) thick SIMCON, however, the maximum moments
appears to increase by 30% to 70% of the maximum moments achieved by the existing
reinforced concrete sections. Figure 5.12 shows also the effects of cross section type on
maximum moment capacity increase. As seen from the figure, there is little difference in
results between square, circular, and biaxially loaded square sections, as expected. The
analysis indicates that the moment capacity increase of SIMCON jacketed circular sections
may be relatively less than that of square sections, however. This may be explained by the
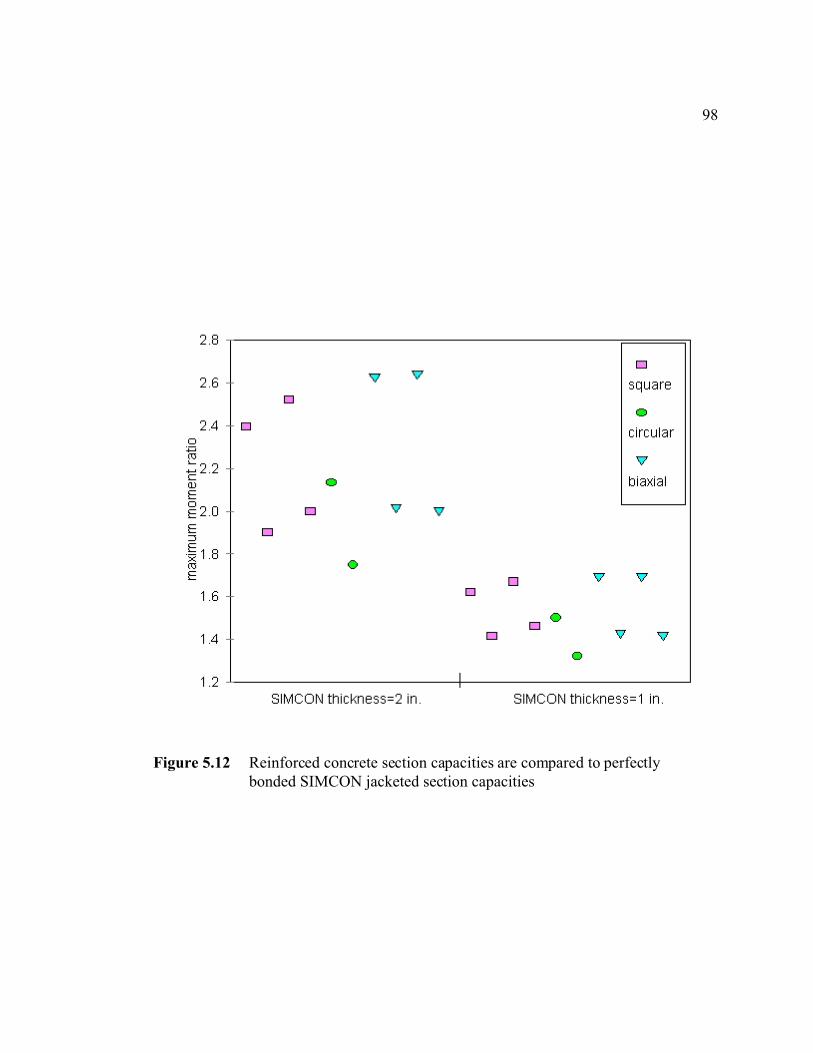
98
Figure 5.12 Reinforced concrete section capacities are compared to perfectlybonded SIMCON jacketed section capacities

99
relatively greater area of SIMCON which contributes more tensile and compressive forces
on the top and bottom of square sections than those of circular section. The maximum
moment with zero axial load (Mo, max) increase provided by the SIMCON jacket is related
mostly to the SIMCON tensile capacity. The maximum moment (Mo, max) is increased by the
additional tensile forces of the SIMCON jacket.
Axial load-moment (Pn-Mn) interaction diagrams for representative SIMCON
jacketed square and circular sections are shown in Figures 5.13 and 5.14, respectively. The
addition of the SIMCON jacket would, of course, improve the axial load capacity of both
square and circular sections. In the square section, shown in Figure 5.13, the axial load
capacity provided by 2 in. thick SIMCON is roughly equal to the axial load capacity provided
by 1 in. thick SIMCON, as expected. Similar results were found for circular section axial
load and moment capacity (see Figure 5.14). There are slight differences between the square
and circular sections, however.
For two different thicknesses of SIMCON jacket, the parallelism below the balanced
axial loads shown for circular section was not observed for the square section columns. The
explanation for this behavior is related to the differences in reinforcement ratios. The square
section has a low reinforcement ratio compared to the high reinforcement ratio of circular
section. Since the reinforcement ratio is low, the SIMCON tensile capacity is reached
quickly in the square section. In the circular section with the high reinforcement ratio,
however, the SIMCON tensile capacity is not reached quickly because the reinforcement
continues to provide additional tensile forces to match the additional compression force
provided by the SIMCON. Therefore, while the capacity increase in columns with a circular
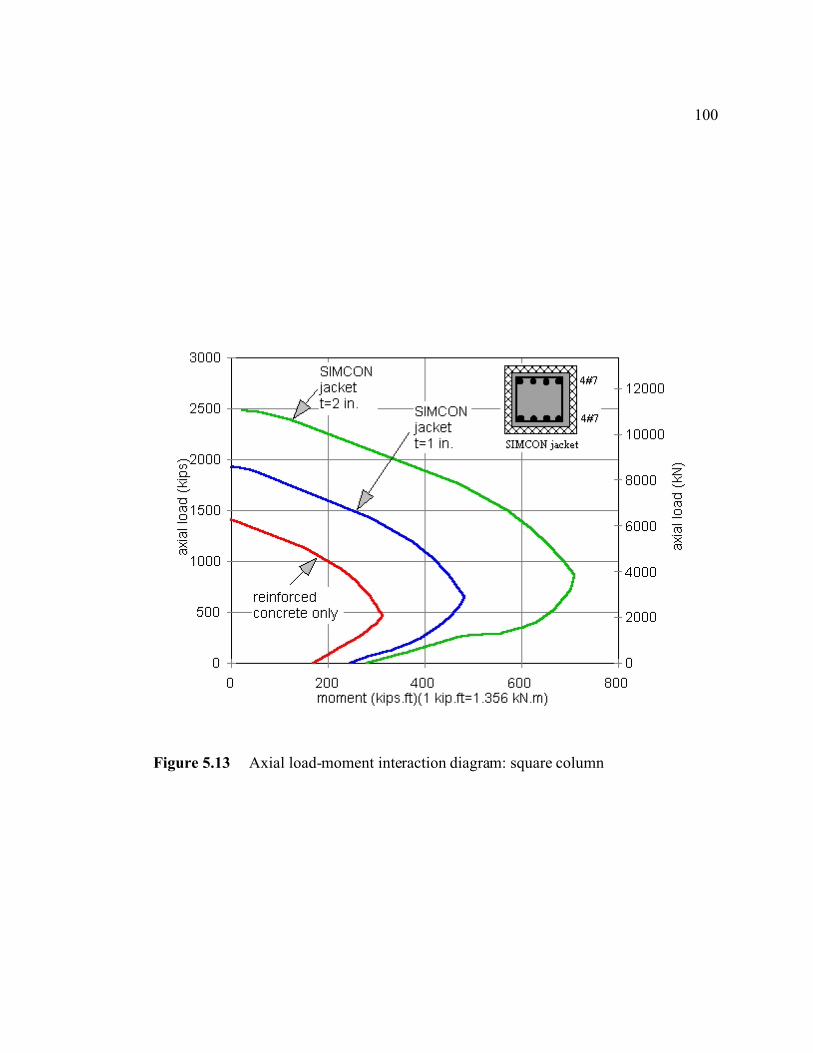
100
Figure 5.13 Axial load-moment interaction diagram: square column
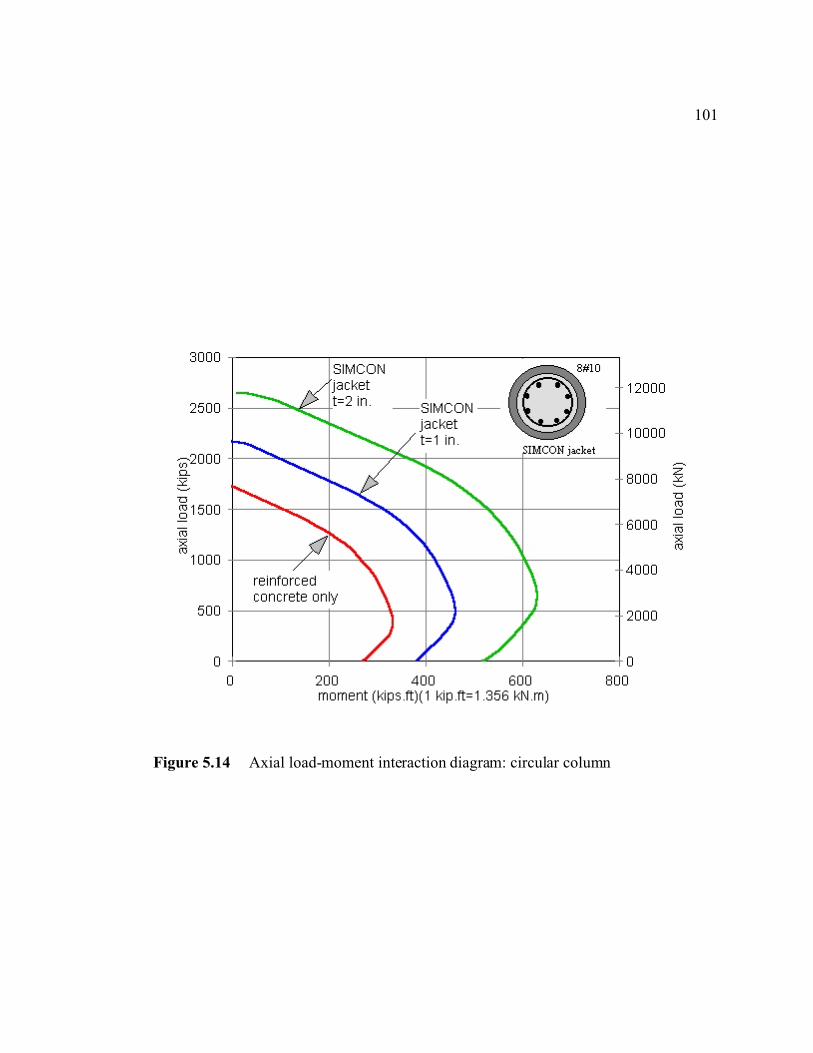
101
Figure 5.14 Axial load-moment interaction diagram: circular column

102
section with high reinforcement ratio and with 1 in. to 2 in. thick SIMCON jackets is roughly
equal, it is not so for columns with a square cross-section.
The axial load capacity (Pn,max) ratios of SIMCON jacketed sections to reinforced
concrete sections are shown in Figure 5.15. With a 2 in. (51 mm) thickness of SIMCON, it
may be possible to reach more than one and a half times the axial load capacity of the
reinforced concrete sections used in this study, alone, although the increase in axial load
capacity may be only approximately 30% with a 1 in. (25 mm) thick SIMCON jacket.
These results were anticipated. No unexpected behavior was uncovered in the
analysis. This and routine program verification checks indicated that the programs were
sound, the structural models appeared to be appropriate, and the results could be used for
comparison of the construction effects.
5.6 RESULTS OF EVALUATION OF SELECTED CONSTRUCTION FACTORS
5.6.1 Bond Between SIMCON and Reinforced Concrete Column
The unbonded SIMCON jacketed section should behave similarly to an unbonded
beam (see Figure 5.16). In this case, unlike in Figure 5.10, shear forces do not exist on the
contact surfaces because the reinforced concrete and the SIMCON react to loads
independently. The law of superposition was used to determine the moment-curvature of the
unbonded section (Kozak, 1991). This superposition requires two additional assumptions
to the general procedure described in Section 5.5: (a) the distribution of strains throughout
the depth of reinforced concrete and SIMCON jacket is linear as shown in Figure 5.16, and
(b) the reinforced concrete and the SIMCON jacket have equal deflections, that is, the

103
Figure 5.15 Axial load capacity ratios of SIMCON jacketed sections to reinforcedconcrete sections
'~,---------------------------------,
0
~1 , " 0 ~ 0 , , , TI ~
" "'1.4 , c c
V c c •
•
c
c c .
V
V V
•
v V
V V
c square
• circular
V
biaxial
"~--------------+---------~~~ SIMeON thickness=1 in SIMeON thickness=2 in
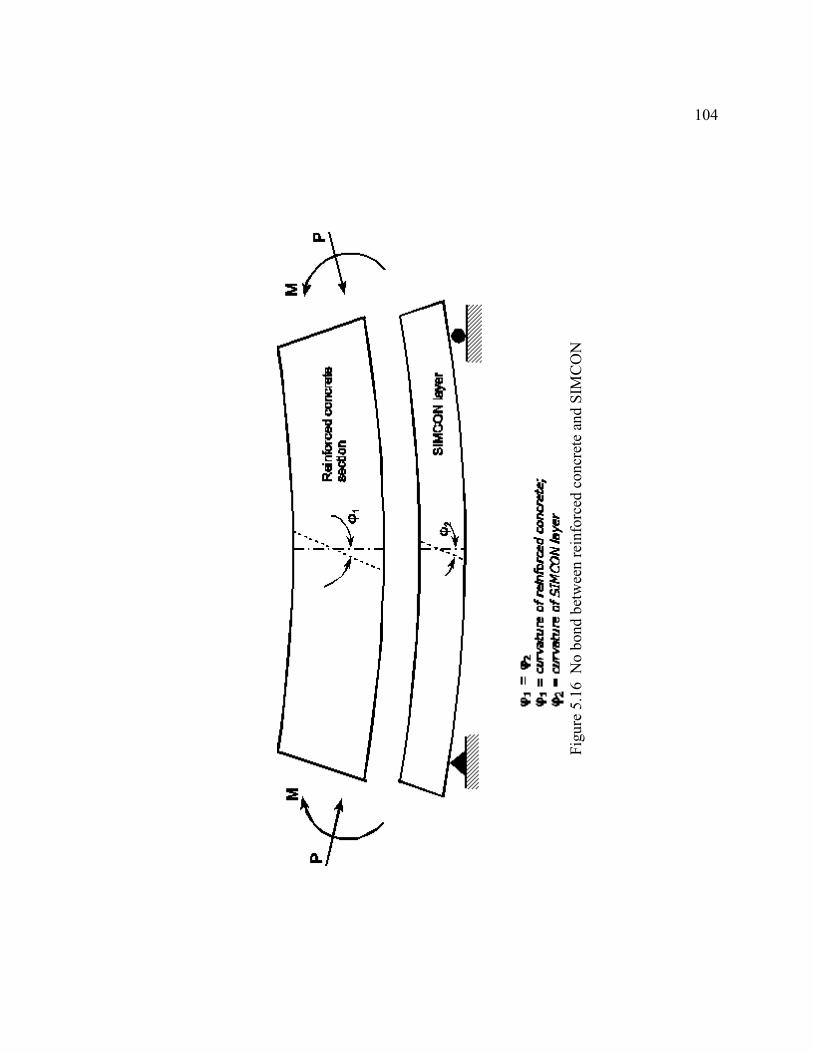
104
Fig
ure
5.16
No
bond
bet
wee
n re
info
rced
con
cret
e an
d S
IMC
ON
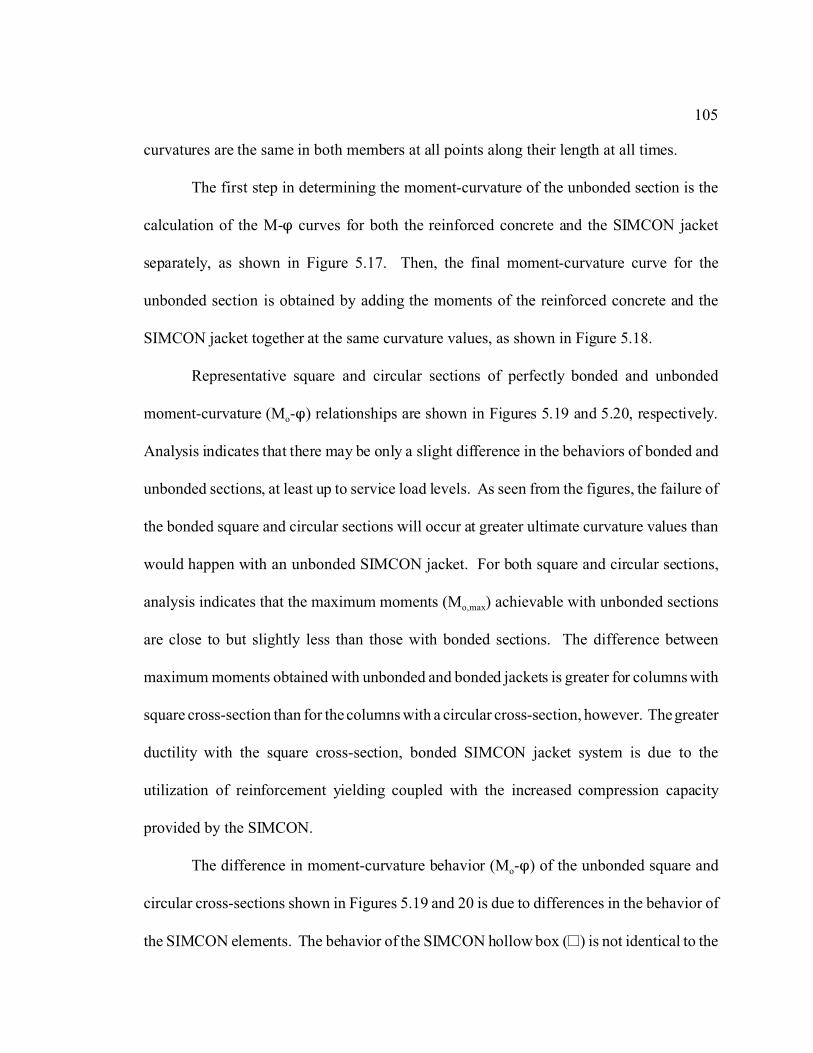
105
curvatures are the same in both members at all points along their length at all times.
The first step in determining the moment-curvature of the unbonded section is the
calculation of the M-n curves for both the reinforced concrete and the SIMCON jacket
separately, as shown in Figure 5.17. Then, the final moment-curvature curve for the
unbonded section is obtained by adding the moments of the reinforced concrete and the
SIMCON jacket together at the same curvature values, as shown in Figure 5.18.
Representative square and circular sections of perfectly bonded and unbonded
moment-curvature (Mo-n) relationships are shown in Figures 5.19 and 5.20, respectively.
Analysis indicates that there may be only a slight difference in the behaviors of bonded and
unbonded sections, at least up to service load levels. As seen from the figures, the failure of
the bonded square and circular sections will occur at greater ultimate curvature values than
would happen with an unbonded SIMCON jacket. For both square and circular sections,
analysis indicates that the maximum moments (Mo,max) achievable with unbonded sections
are close to but slightly less than those with bonded sections. The difference between
maximum moments obtained with unbonded and bonded jackets is greater for columns with
square cross-section than for the columns with a circular cross-section, however. The greater
ductility with the square cross-section, bonded SIMCON jacket system is due to the
utilization of reinforcement yielding coupled with the increased compression capacity
provided by the SIMCON.
The difference in moment-curvature behavior (Mo-n) of the unbonded square and
circular cross-sections shown in Figures 5.19 and 20 is due to differences in the behavior of
the SIMCON elements. The behavior of the SIMCON hollow box (~) is not identical to the
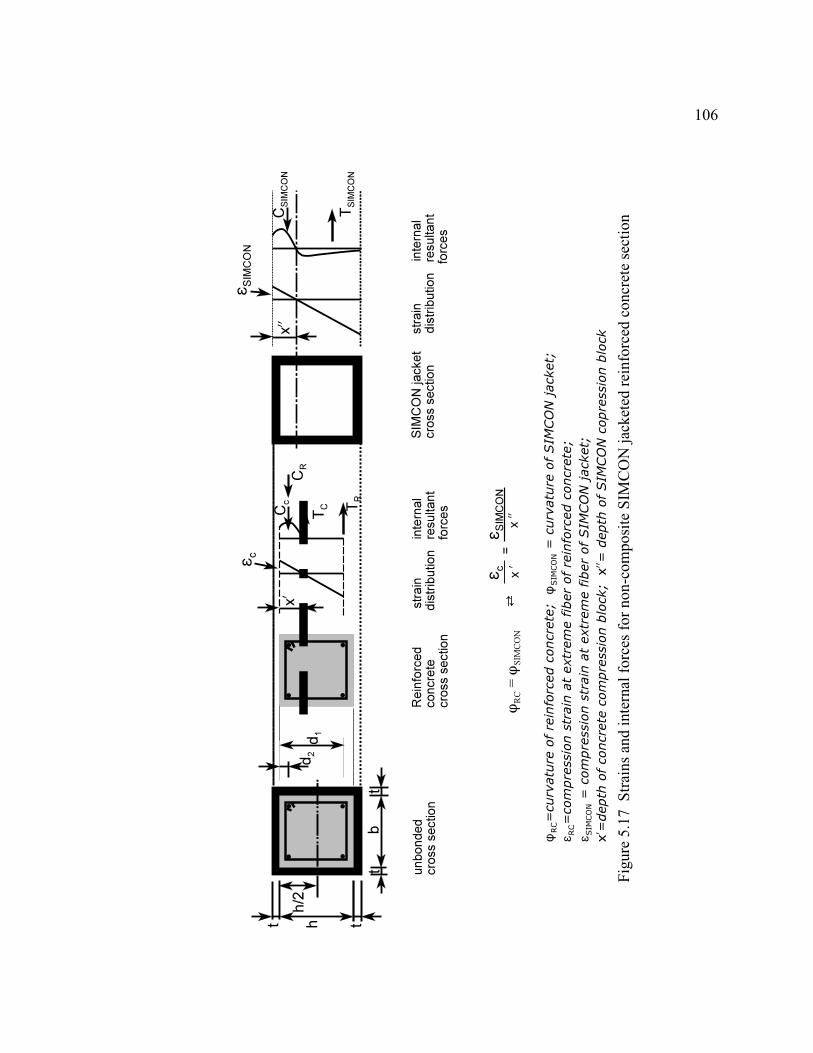
106
Fig
ure
5.17
Str
ains
and
int
erna
l fo
rces
for
non
-com
posi
te S
IMC
ON
jac
kete
d re
info
rced
con
cret
e se
ctio
n

107
Figure 5.18 Superposed moment-curvature of unbondedsection
D Unbonded SeCb()1
/ /
/
,-----,+0 Reinforced Concrete
SIMeON
Unbonded section
a Reinforced concrete
~ ------. ,/~
.. " "\" .. ... /
.. " " .............. ,....... SIMeON
,
Curvaure, !p
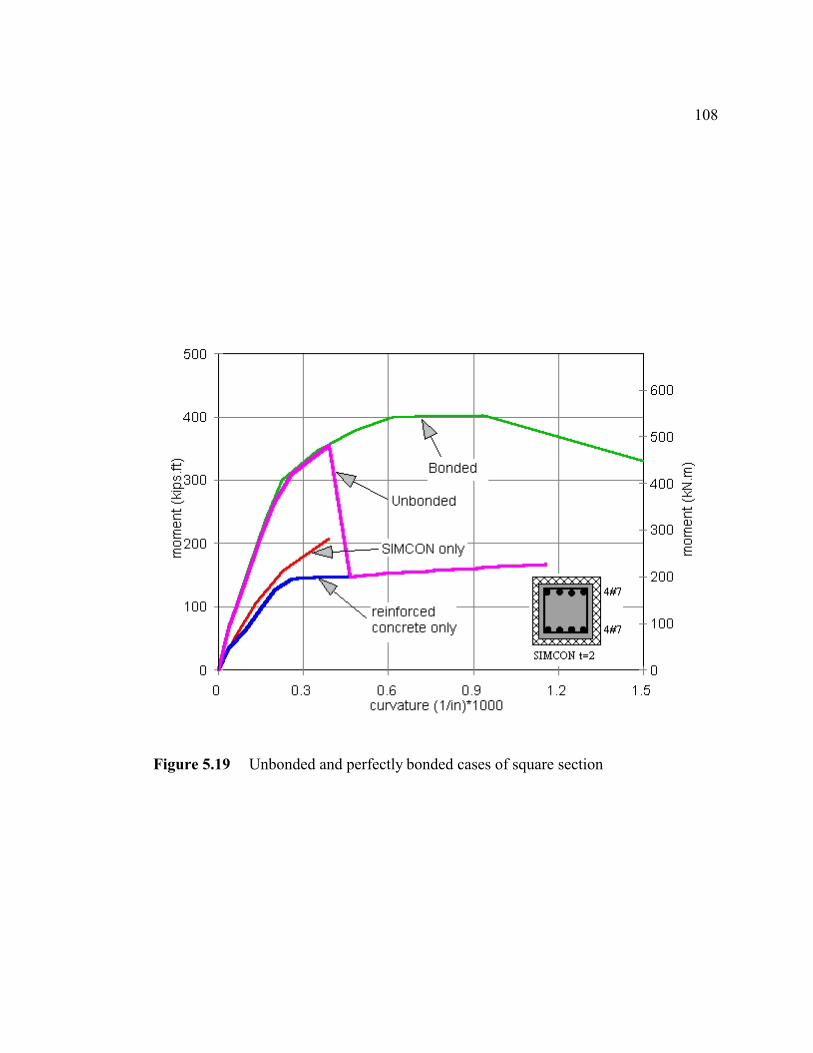
108
Figure 5.19 Unbonded and perfectly bonded cases of square section
109
Figure 5.20.a Unbonded and perfectly bonded cases of circular section with lowreinforcement ratio

110
Figure 5.20.b Unbonded and perfectly bonded cases of circular section with a highreinforcement ratio

111
SIMCON hollow tube (±). Analysis indicates that the SIMCON hollow tube is more ductile
than the hollow box although their moment capacities (Mo,max) are essentially the same. This
can be explained by the tensile forces provided by these sections. With the hollow box,
when the area at the bottom of section ruptures under tension, it causes a sudden reduction
in the area providing the tensile forces. With the hollow tube, the reduction in area under
tension is more gradual, therefore, the maximum moment is achieved at greater ductility.
The moment-curvature behavior of the composite member, assuming an unbonded condition,
is therefore directly related to the behavior of the SIMCON jacket.
The maximum bending moment (Mo,max) ratios of unbonded sections to bonded
sections for all cross sections are shown in Figure 5.21. As seen from the figure, the ratios
are similar for a given cross section. The unbonded square sections may achieve only
approximately 85% of moment capacity (Mo,max) of the bonded sections, while that ratio is
more than about 90% for circular and biaxially loaded square sections. Moment-curvature
analysis indicates that bonding is not critical for circular sections but likely to be important
for square sections. The average losses in maximum moment ratios (Mo,max) are 7.8% for 1
in. (25 mm) SIMCON jacket and 10.2% for 2 in. (50 mm) SIMCON jacket. The difference
is due to the greater bonded maximum moment capacity achieved with the 2 in. (50 mm)
thick SIMCON jacket when fully bonded.
These maximum moment ratios are equal to or less than those obtained with
reinforced concrete sections which had a 10% loss in maximum moment capacities. Since
the moment capacities achievable with an unbonded jacket are approximately the same as
with the allowable effects of construction tolerances on reinforced concrete, it may be

112
Figure 5.21 Maximum moment ratios of unbonded sections to those of perfectlybonded sections

113
concluded that the bonding effect is not critical for maximum moment capacities.
The axial load capacities (Pn,max) of unbonded and bonded SIMCON jacketed section
should be the same, as long as there is no gap left between the SIMCON jacket ends and the
slab at the top and bottom of the column. Since the axial load capacity (Pn,max) is the sum of
stress times the areas of contributing materials in both cases, the axial load capacity ratios
(Pn,max) of the unbonded SIMCON jacketed sections to the bonded sections may be taken
equal to one.
It is reasonable to anticipate the behavior of the SIMCON jacketed sections in the
field to lie between the two extremes of perfectly bonded and perfectly unbonded behavior.
Perfectly bonded composite action requires horizontal shear transfer between the reinforced
concrete and the SIMCON. Although in the analysis of the unbonded section, it was
assumed that no bond exists, in reality there may be some bond between SIMCON and
reinforced concrete due to adhesion or induced friction in part due to SIMCON shrinkage and
roughness of the interface. Adhesion and friction can function only up to some load level
so that a mechanical shear connector would be required to ensure perfectly bonded composite
action. Since the bond between the concrete and SIMCON is not critical in an axially loaded
column, the use of drilled in shear studs or other type of mechanical shear connectors is not
recommended in order to avoid any damage caused by those in concrete.
Another possible disadvantage of a perfectly bonded jacket is due to the effects of
drying shrinkage of the SIMCON. If the SIMCON jacket is perfectly bonded to existing
concrete which has already undergone shrinkage, the shrinkage of the SIMCON will be
restrained and cause unnecessarily high tensile stresses in the SIMCON jacket, creating

114
cracking.
Although the effect of unbonded behavior in axial load capacities (Pn,max) can be
ignored provided that there is no gap between SIMCON jacket end and slab, in practice all
columns are designed to carry some moment, meaning that SIMCON jacketed column also
should be designed to carry some moments. Unbonded behavior, however, causes a loss in
moment capacities (Mo,max) ofapproximately 10%, which is within the limits established in
Section 5.4.4. Therefore, an unbonded behavior of the SIMCON jacket may be assumed
since bonding of the SIMCON causes additional cost and concerns with the reliability of
bonding mechanisms in a bonded jacket. On the other hand, since the unbonded design
computations are more time consuming than the bonded design, the possible losses in load
carrying capacities can easily and best be handled by conducting a bonded design using a
strength reduction factor. A recommendation for a strength reduction factor will be provided
after evaluation of other critical factors.
5.6.2 Removal of Load on an Existing Reinforced Concrete Column Prior to Jacketing
When a SIMCON jacket is applied in the field, it may not be feasible or advisable to
remove the load on the existing reinforced concrete member. The effect of this factor on
design and construction was evaluated by examining the behavior of the SIMCON jacketed
column with different levels of compression strains in the existing concrete.
For service load levels, the stress does not exceed the elastic limit of the concrete
which typically occurs at 40 to 45% of the ultimate compressive strength, and occurs at
around 0.04% strain assuming a parabolic stress-strain curve. While a parabolic shape is

115
often assumed to ease computation of strain at various stresses, the true stress-strain behavior
of concrete is more complex. The elastic strain in the concrete at the end of the elastic range
is generally close to 0.02% (Park and Pauley, 1975; Neville, 1997). Assuming a 0.04% strain
provides a conservative result.
For the first level of existing strain, creep of concrete and SIMCON shrinkage effects
are considered together. Concrete undergoes a long term creep effect under constant
loading. It is not unrealistic to assume that the creep strains are equal to about 0.01% for a
typical column in service for more than five years (Park and Pauley, 1975). Therefore, the
concrete strain may be reduced to approximately 0.03% at service load levels. When the
SIMCON jacket is applied, this is the likely compressive strain in the concrete, hence this
was studied as the first level of this factor.
It may also be assumed that the SIMCON jacket experiences a longitudinal shrinkage
strain equal to 0.03% which is comparable to the shrinkage of SIFCON (Balaguru and Shah,
1992). Assuming a reasonable bond between the SIMCON and concrete at these relatively
low stress levels, due to radial shrinkage, this shrinkage strain may be added to the existing
concrete strain of 0.03%. A second level of 0.06% residual compressive strain was chosen.
For the third level, a limit value of 0.75fc! was chosen. At this limit, concrete begins
to disintegrate (Park and Pauley, 1975). This stress corresponds to approximately 0.1%
strain for conventional strength concrete. Therefore, 0.1% compressive strain was chosen
as the third level.
Figure 5.22 and 5.23 show the effect of 0.1% existing strain on reinforced concrete
on moment curvature curves for square sections and for circular sections, respectively, as

116
Figure 5.22 Moment-curvature of square section with initial strain of 0.1%
cc No initial concrete strain
CC \
~
/ /' , C "" V Concrete initial
,
rj strain is 0 1 %
C ~
If C:-" / Reinforced
concrete on~ W
>1 SI~CON t- 2
C
C CO " curvature (1/in)*1000

117
Figure 5.23 Moment-curvature of circular section with initial strain of 0.1%
No ini; ial , concrete strain 7/
~ ,
/ / Initial concrete ~
/ / strain is 0 1 %
,
0 '-V Reinforced , conc i ete on~
SIj'lCON t- 2 C
cc
0 z
CC " l' " 0 0
CC 0
curvature (1/in)*1000
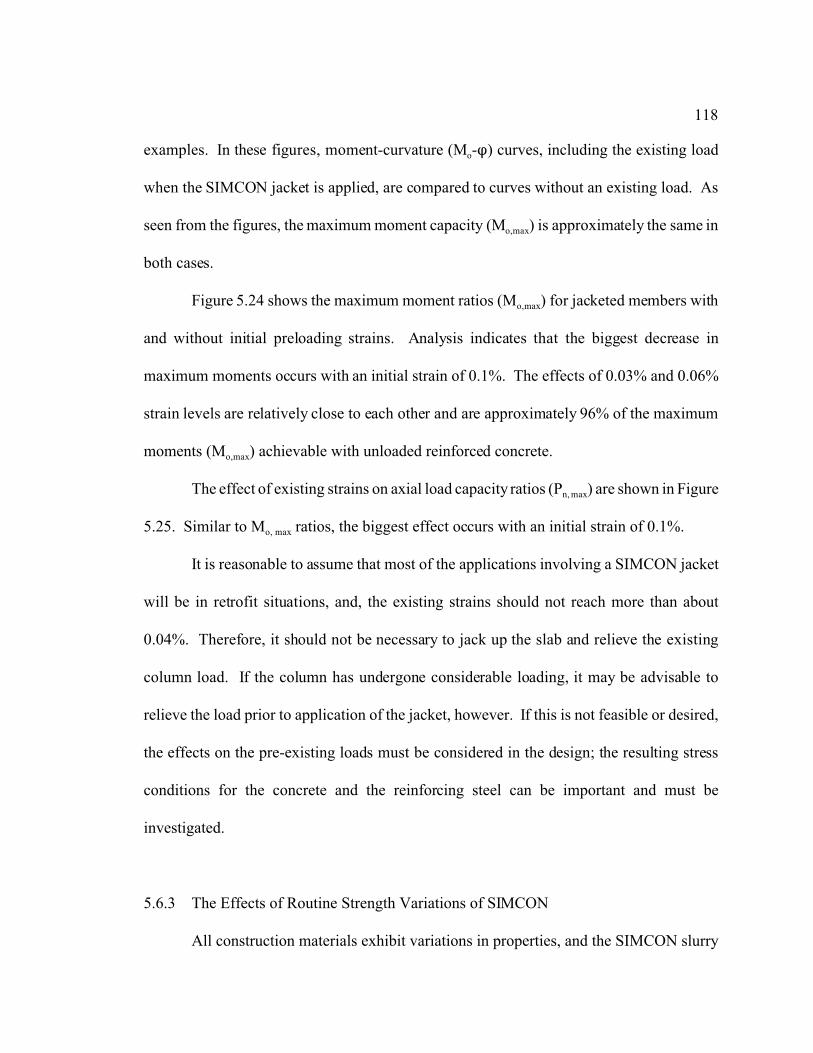
118
examples. In these figures, moment-curvature (Mo-n) curves, including the existing load
when the SIMCON jacket is applied, are compared to curves without an existing load. As
seen from the figures, the maximum moment capacity (Mo,max) is approximately the same in
both cases.
Figure 5.24 shows the maximum moment ratios (Mo,max) for jacketed members with
and without initial preloading strains. Analysis indicates that the biggest decrease in
maximum moments occurs with an initial strain of 0.1%. The effects of 0.03% and 0.06%
strain levels are relatively close to each other and are approximately 96% of the maximum
moments (Mo,max) achievable with unloaded reinforced concrete.
The effect of existing strains on axial load capacity ratios (Pn, max) are shown in Figure
5.25. Similar to Mo, max ratios, the biggest effect occurs with an initial strain of 0.1%.
It is reasonable to assume that most of the applications involving a SIMCON jacket
will be in retrofit situations, and, the existing strains should not reach more than about
0.04%. Therefore, it should not be necessary to jack up the slab and relieve the existing
column load. If the column has undergone considerable loading, it may be advisable to
relieve the load prior to application of the jacket, however. If this is not feasible or desired,
the effects on the pre-existing loads must be considered in the design; the resulting stress
conditions for the concrete and the reinforcing steel can be important and must be
investigated.
5.6.3 The Effects of Routine Strength Variations of SIMCON
All construction materials exhibit variations in properties, and the SIMCON slurry

119
Figure 5.24 Maximum moment ratios of the sections with an initial existing strains
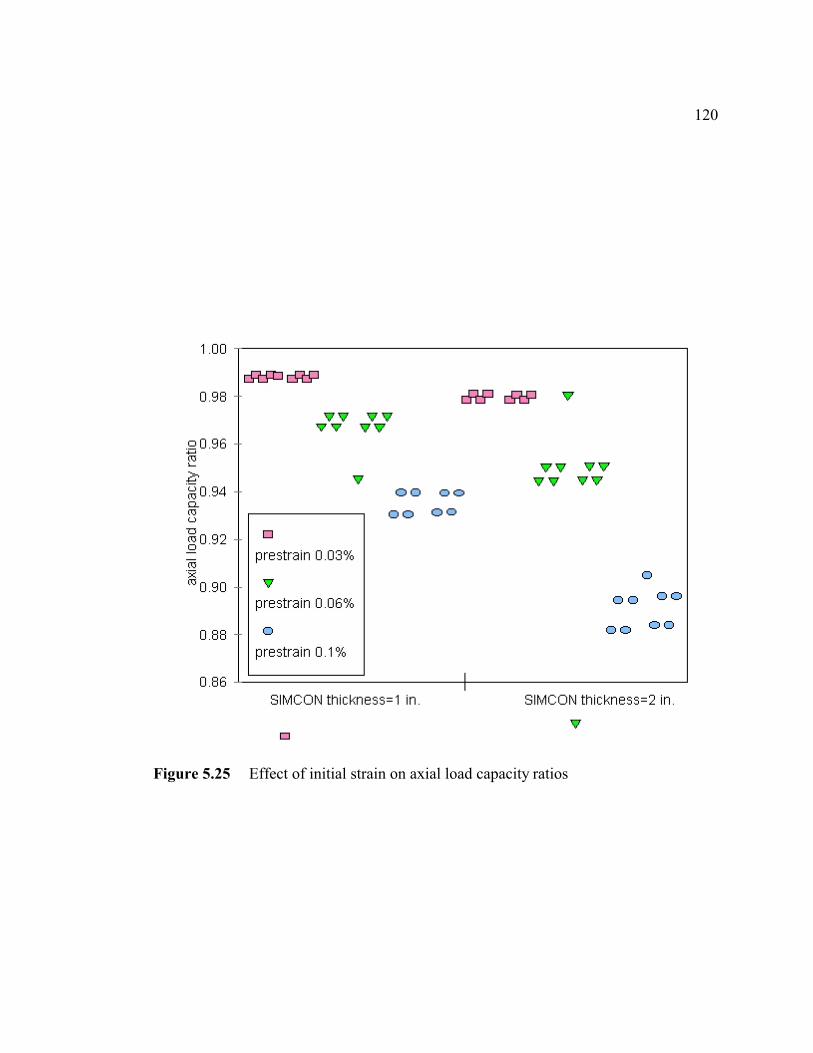
120
Figure 5.25 Effect of initial strain on axial load capacity ratios

121
may attain a lower strength than assumed in the design as a result of either routine, random
variation or assignable causes during construction. The reasons for this may include, but are
not limited to, improper batching, mixing, placing or curing procedures. The slurry used in
the SIMCON jacket is a relatively high strength, but homogeneous material. Slight
differences in water/cement ratio would have a disproportionate effect on strength compared
to conventional concrete. Guidelines for using high strength concrete (ACI 363, 1992) are
appropriate, as a minimum. The effects of variation in material properties on the behavior
of the SIMCON jacket were examined to determine if SIMCON jackets were more sensitive
to routine strength tolerances than other typical reinforced concrete elements.
In order to determine the sensitivity of SIMCON jacketing to variations in strength,
a 15% strength reduction was selected. As discussed in Section 5.4.4, a 15% reduction
would be routine under conventional construction controls. Since the SIMCON uses a high
strength slurry, a 10% strength reduction is also selected as a minimum level consistent with
ACI 318 (2002). Therefore, the effects of both 10% and 15% strength reductions were
investigated.
The maximum moment (Mo, max) ratios are shown in Figure 5.26. As seen from the
figure, the maximum moments are proportional to the strength of SIMCON. On average, 6%
to 9% loss in maximum moment was found with 1 in. thick and 2 in. thick SIMCON jackets,
respectively, with a 10% strength reduction of the SIMCON slurry. Using a 15% strength
reduction, 9% and 13% losses were found for the 1 in. thick and 2 in. thick SIMCON jackets,
respectively. Comparing these maximum moment (Mo,max) results to those obtained with the
total effects of tolerances for reinforced concrete column, shown in Table 5.2, the 15%

122
Figure 5.26 Effects of SIMCON routine strength variations on maximum moments
123
strength reduction in SIMCON strength appears to be acceptable.
Axial load capacity (Pn, max) ratios are shown in Figure 5.27. A loss of axial load
capacity was found with reduced SIMCON jacket strength. The losses in average were 3%
for 1 in. thick SIMCON to 5% loss for 2 in. thick SIMCON for a 15% reduction in strength.
In comparison to the reinforced concrete column, shown in Table 5.2, the losses in axial load
capacities of SIMCON jacketed column appears to be acceptable when the SIMCON jacket
has only 85% of design strength.
Since the columns are designed to carry axial load, the use of 15% strength reduction
for SIMCON slurry is recommended as a minimum limit, however, considering all the other
critical factors, a greater strength reduction factor can be recommended at the conclusions
of this chapter. Also, it is not unreasonable to assume that the retrofit project is conducted
one column at a time, so that the slurry for each column will constitute one batch. Therefore,
one batch-one column testing may be acceptable for testing of slurry strength. As with ACI
318, acceptance criteria may be established as 0.90 fc!.
5.6.4 The Effect of Routine Variations in SIMCON Thickness
The effect of routine variations of SIMCON thickness were examined using several
thickness levels. These levels were chosen as 10% and 20% reductions and 10% and 20%
increases in the original SIMCON jacket thicknesses. These levels were chosen as
reasonable variations encountered in construction practice and to examine the sensitivity of
thicknesses on load carrying capacities. Of course, for load carrying capacities the lower
limits, that is, thinner SIMCON jackets, are more important than the upper limits.

124
Figure 5.27 Effects of SIMCON routine strength variations on axial load capacityratios
125
The lower limit of reduction in thickness was chosen as 20% because it is reasonable
to assume that the thickness of fiber mat may not be reduced more than this due to difficulty
in compressing the fiber mat during construction. With a simple test, consisting of clamping
the mat between two plates and measuring the thickness obtained, it was found that, on
average, the mats could be pressed in to 40% of their original thicknesses. After
compression, when released the fiber mat returns to its original thickness. Although it was
found that the mat could be compressed up to 40%, this value was not used in analysis
because considerable pressure is required to achieve this degree of compaction, and would
not be developed in practice without extraordinary means. In addition, overall thickness
control, discussed below would preclude this degree of compaction.
It was assumed that, the strength of the SIMCON with a compressed mat up to 20%
was reasonably close to a strength of a SIMCON with uncompressed mat. Also, since the
purpose of this study was to examine the sensitivity of column behavior to different levels
of factors, the chosen levels should be adequate for this purpose. This finding does indicate,
however, that additional steps will be required during construction to ensure adequate control
of thickness of the fiber mat.
The effects of SIMCON thickness variations on maximum moment ratios (Mo,max) are
shown in Figure 5.28. As expected, analysis indicates that any increase or decrease in
SIMCON jacket thickness will cause an increase or decrease in maximum moments,
respectively. For example, a 10% decrease in thickness causes approximately 6% loss in
maximum moments. The critical factor, of course, is the 20% reduction in thickness. A
reduction in thickness of 20% reduces the maximum moments by about 12%. The moment-

126
Figure 5.28 Effects of SIMCON thickness variations on maximum moments
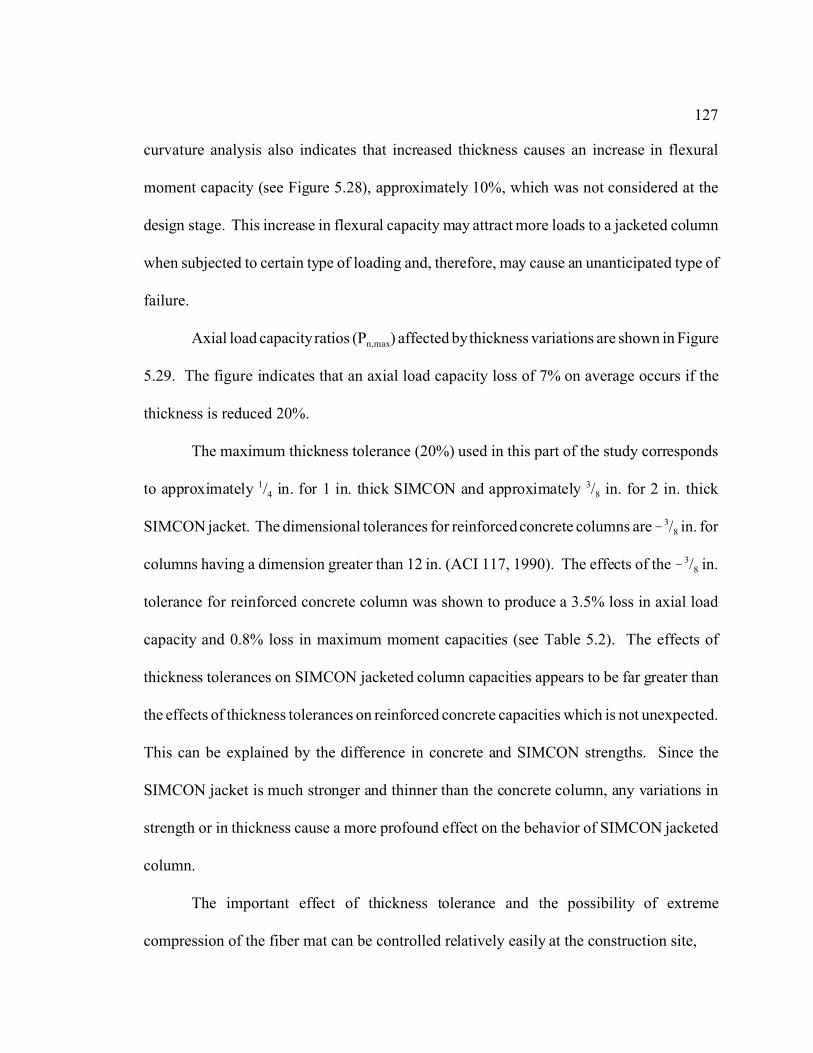
127
curvature analysis also indicates that increased thickness causes an increase in flexural
moment capacity (see Figure 5.28), approximately 10%, which was not considered at the
design stage. This increase in flexural capacity may attract more loads to a jacketed column
when subjected to certain type of loading and, therefore, may cause an unanticipated type of
failure.
Axial load capacity ratios (Pn,max) affected by thickness variations are shown in Figure
5.29. The figure indicates that an axial load capacity loss of 7% on average occurs if the
thickness is reduced 20%.
The maximum thickness tolerance (20%) used in this part of the study corresponds
to approximately 1/4 in. for 1 in. thick SIMCON and approximately 3/8 in. for 2 in. thick
SIMCON jacket. The dimensional tolerances for reinforced concrete columns are !3/8 in. for
columns having a dimension greater than 12 in. (ACI 117, 1990). The effects of the !3/8 in.
tolerance for reinforced concrete column was shown to produce a 3.5% loss in axial load
capacity and 0.8% loss in maximum moment capacities (see Table 5.2). The effects of
thickness tolerances on SIMCON jacketed column capacities appears to be far greater than
the effects of thickness tolerances on reinforced concrete capacities which is not unexpected.
This can be explained by the difference in concrete and SIMCON strengths. Since the
SIMCON jacket is much stronger and thinner than the concrete column, any variations in
strength or in thickness cause a more profound effect on the behavior of SIMCON jacketed
column.
The important effect of thickness tolerance and the possibility of extreme
compression of the fiber mat can be controlled relatively easily at the construction site,

128
Figure 5.29 Effects of routine variations in SIMCON thickness on axial load capacityratios

129
provided that attention is given to the SIMCON thickness prior to slurry injection. The
thickness of the SIMCON mat can be maintained with a simple procedure, such as inserting
a thin steel rod through the fiber mat at the injection holes prior to slurry injection and
measuring the distance between concrete surface and the formwork at several locations.
Once any adjustments have been made, the fiber mat can be injected with a slurry. Although
this method provides quick assurance, it does not guarantee the occurrence of non-
conformities due to statistical variations, therefore a reduced strength factor in design can be
employed. Although the effects of thickness variation can be estimated reasonably well, and
controlled reasonably simply, due to the difficulty in achieving the necessary accuracy on
site, a control limit of 20% reduction in thickness is more appropriate for SIMCON jackets
equal and less than 2 in. thick and 10% reduction in thickness for SIMCON jackets more
than 2 in. thick. Since the determination of the strength reduction factor depends on not only
the variations in thickness but also other effects, such as the variation in strength, the
appropriate strength reduction factor to be used for the design of SIMCON jacketed columns
is discussed later in this chapter after reviewing the effects of other factors.
5.6.5 The Effect of Displacement of the SIMCON Jacket During Construction
Examples of non-concentrically located SIMCON jackets are shown in Figure 5.30.
Since the voids will be filled with slurry in all cases, this results in a difference in thickness
of the SIMCON jacket, which would also affect the volume of fibers, Vf , somewhat and
could therefore affect the SIMCON characteristics. These effects in Vf can be ignored,
however, since the compression strength of the slurry would not change and the total quantity

130
Figure 5.30 Non-concentrically placed SIMCON jacketaround reinforced concrete member
t: thickness o f SIMCON jacket lOp of th e sections are th e m ost compressed part
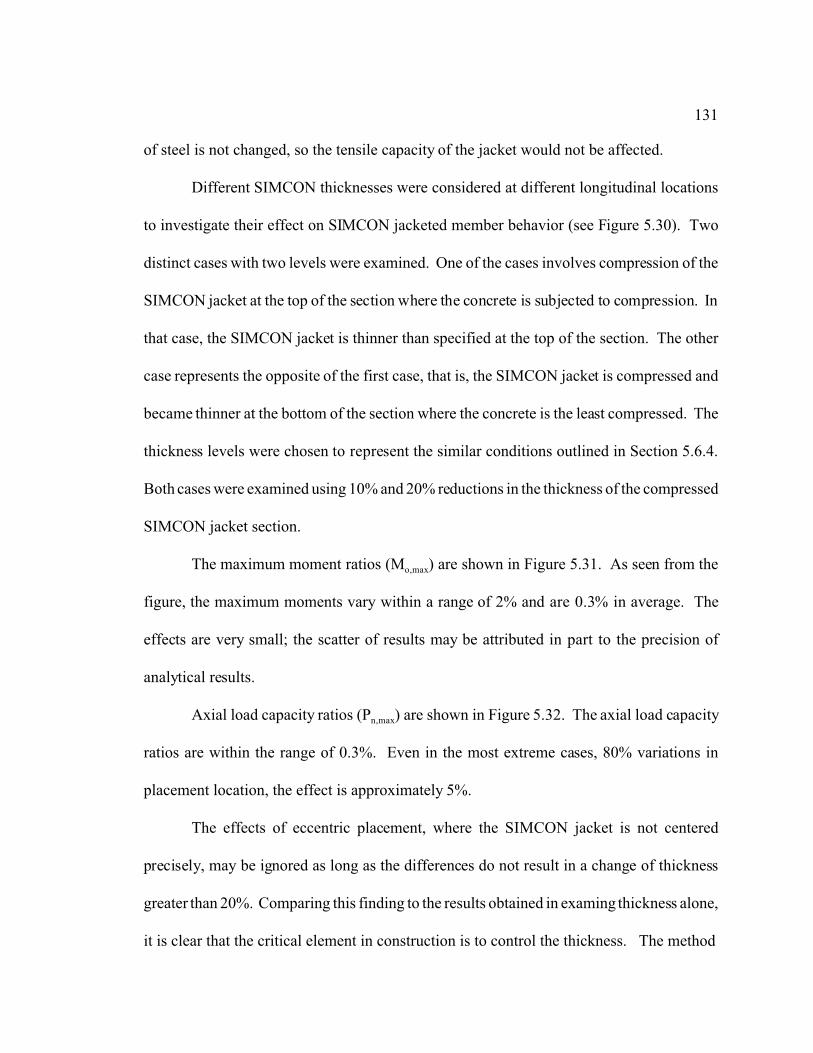
131
of steel is not changed, so the tensile capacity of the jacket would not be affected.
Different SIMCON thicknesses were considered at different longitudinal locations
to investigate their effect on SIMCON jacketed member behavior (see Figure 5.30). Two
distinct cases with two levels were examined. One of the cases involves compression of the
SIMCON jacket at the top of the section where the concrete is subjected to compression. In
that case, the SIMCON jacket is thinner than specified at the top of the section. The other
case represents the opposite of the first case, that is, the SIMCON jacket is compressed and
became thinner at the bottom of the section where the concrete is the least compressed. The
thickness levels were chosen to represent the similar conditions outlined in Section 5.6.4.
Both cases were examined using 10% and 20% reductions in the thickness of the compressed
SIMCON jacket section.
The maximum moment ratios (Mo,max) are shown in Figure 5.31. As seen from the
figure, the maximum moments vary within a range of 2% and are 0.3% in average. The
effects are very small; the scatter of results may be attributed in part to the precision of
analytical results.
Axial load capacity ratios (Pn,max) are shown in Figure 5.32. The axial load capacity
ratios are within the range of 0.3%. Even in the most extreme cases, 80% variations in
placement location, the effect is approximately 5%.
The effects of eccentric placement, where the SIMCON jacket is not centered
precisely, may be ignored as long as the differences do not result in a change of thickness
greater than 20%. Comparing this finding to the results obtained in examing thickness alone,
it is clear that the critical element in construction is to control the thickness. The method

132
Figure 5.31 Effects of non-concentric placement of SIMCON on maximum moments
133
Figure 5.32 Effects of non-concentric placement of SIMCON on axial load capacity ratios

134
to check the thickness of fiber mat should also provide the necessary control of concentric
placement of fiber mat by satisfying the same thickness of the mat all around the reinforced
concrete column.
5.6.6 Effects of SIMCON Seams
SIMCON is commercially available as rolls as shown in Figure 2.4. When applied
in-situ, columns can be jacketed longitudinally, along the perimeter, or spirally with these
rolls. In any of these procedures, the edges of rolls can introduce a line of weakness as
shown in Figures 5.33.a and 5.33.b. The effect of seams was represented in this analysis by
using a lower material properties along that portion of SIMCON. To investigate the effect
of seams, the following assumptions were made: (a) the SIMCON seam has an effective
width (the width of the weakness) of 4 in. (100 mm), (b) along the weak line, the
compressive and tensile properties of the SIMCON are assumed to be 90% and 85% of their
respective design strengths as discussed in Section 5.6.3. The selection of the width of seam
was based on previous work conducted by Krstulovic [2001] and assumed to be a reasonable
balance between not affecting the behavior of a column too much and minimizing the
amount of fiber mat used on the seam line, that is doubling the fiber mat used in the seam
area. Since the fiber mat volume is doubled, the slurry infiltration of fibers in this region
may become troublesome and therefore some parts may not be infiltrated by slurry causing
reduced strength at the seams.
In this study, SIMCON seams were presumed to be placed along the long axis of the
reinforced concrete column as shown in Figure 5.33.a. If the SIMCON rolls are placed
135
Figure 5.33 Fiber mat seam locations on a SIMCONjacketed column
~",W//h '0 W/////'W//////fi
I; I I
I I I I I "'I I I I I I I I
Fiber m at seam
ow". • ,,) SIMeON roll '5 placed
longitud inall y around a co lumn
" WY///////-W'//////////h
I : I I r· I .~ I I ,
7' I , I I I
Fib ermatseams
I : ~ w/,w//////////////, "
b) SIMeON roll is placed as d iscreete rings around a column
136
spirally around the column, as shown in Figure 5.33.b, then it can be assumed that those
seams may become critical section and these sections may be analyzed similar to the section
investigated in Section 5.6.3. As shown in Figure 5.34, seams will be located on the
compression side, on the tension side, and in the middle.
The effects of lower strength seams on maximum moments (Mo,max) are shown in
Figure 5.35. If the seam has 90% strength of specified, then the loss in maximum moments
may reach 2%. The loss in maximum moments may be 5% in average, however, if the seam
strength is only 85% of the specified strength and if the seam is at the tension side. Figure
5.35 shows the effect of seam location on maximum moment ratios (Mo,max). The maximum
moments will be affected most by the seams located on the tension loaded part of SIMCON.
The effects of seam strengths on axial load capacities (Pn,max) are shown in Figure
5.36. Analysis indicates that, if the seam has 90% of the specified strength, then the loss in
axial load capacities may reach 0.6%. The loss in axial load capacity will be even lower,
1.2%, if the seam strength is 85% of the specified strength. The axial load capacities may
be most affected by the seams located on the compression area of the SIMCON.
Analysis indicates that the existence of SIMCON seams has very little effect on axial
load capacities. The presence of seams on the tensile side of SIMCON jacket, however, may
cause some significant effect on maximum moment capacities (Mo,max), if the seam has only
85% strength. Although analysis indicates that seam strength is not critical for axial load
capacities, clearly, the expansion of existing concrete under compression, and increased
ductility under certain loading conditions may cause tensile forces perpendicular to seams
and separation of the seams. One possible solution to increase the tensile capacity of seams

137
Figure 5.34 Analyzed fiber mat seam locations on a SIMCONjacketed column when SIMCON is placedlongitudinally
R"; rf orced co"",", _,
SIMeON jacket ~ __
~) SI MeON seam is on side
b) SI MeON seam is on cOOlp;essi rn side
c) SI MeON seam is on tensi rn side
"f' is SIMeON j;.cket thickness

138
Figure 5.35 Effects of SIMCON seams on maximum moments
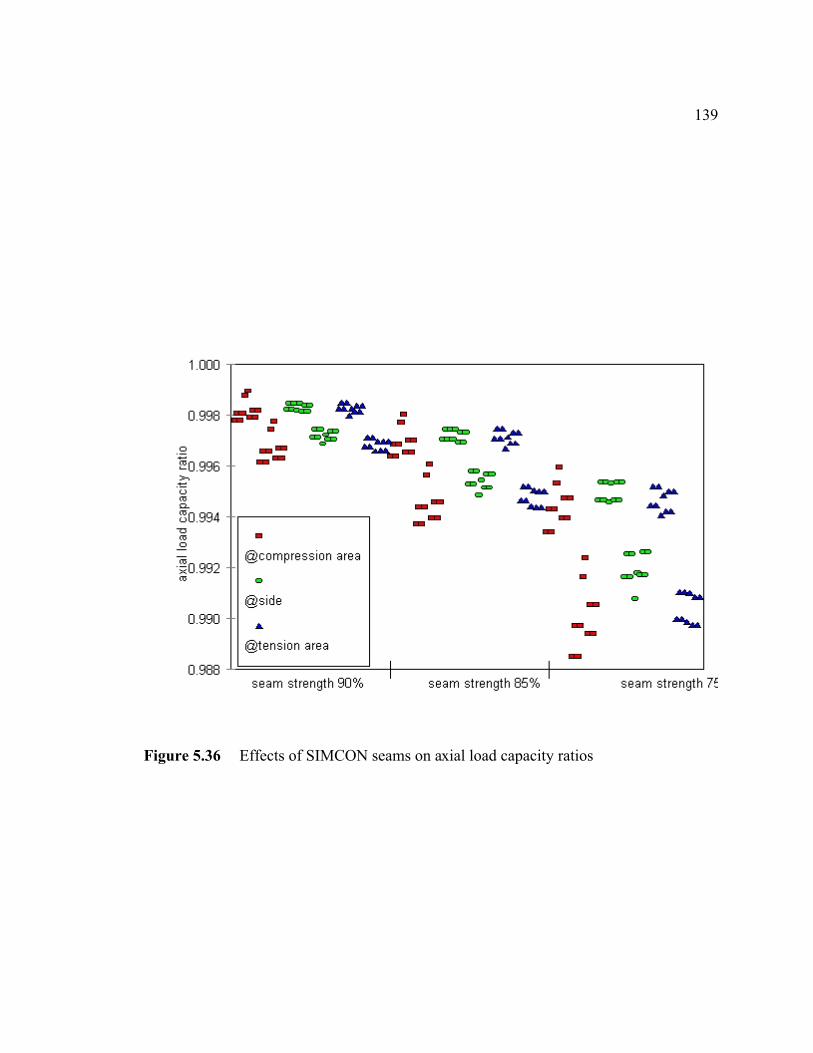
139
Figure 5.36 Effects of SIMCON seams on axial load capacity ratios
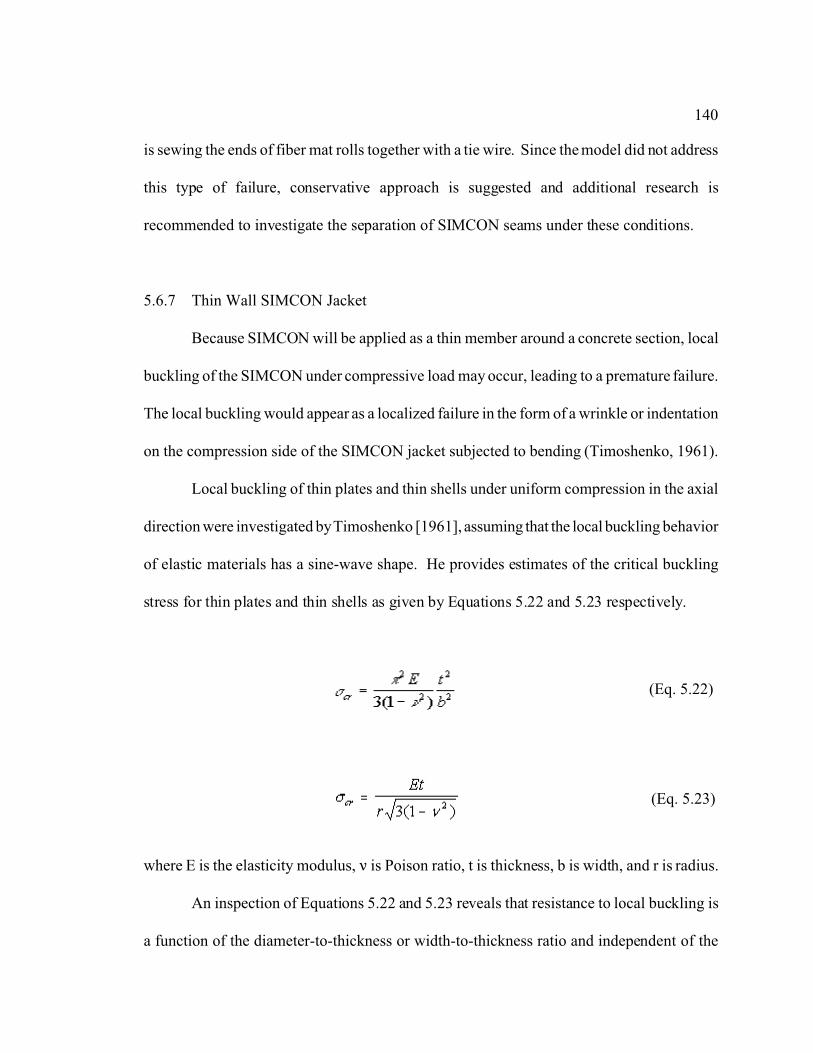
140
(Eq. 5.22)
(Eq. 5.23)
is sewing the ends of fiber mat rolls together with a tie wire. Since the model did not address
this type of failure, conservative approach is suggested and additional research is
recommended to investigate the separation of SIMCON seams under these conditions.
5.6.7 Thin Wall SIMCON Jacket
Because SIMCON will be applied as a thin member around a concrete section, local
buckling of the SIMCON under compressive load may occur, leading to a premature failure.
The local buckling would appear as a localized failure in the form of a wrinkle or indentation
on the compression side of the SIMCON jacket subjected to bending (Timoshenko, 1961).
Local buckling of thin plates and thin shells under uniform compression in the axial
direction were investigated by Timoshenko [1961], assuming that the local buckling behavior
of elastic materials has a sine-wave shape. He provides estimates of the critical buckling
stress for thin plates and thin shells as given by Equations 5.22 and 5.23 respectively.
where E is the elasticity modulus, < is Poison ratio, t is thickness, b is width, and r is radius.
An inspection of Equations 5.22 and 5.23 reveals that resistance to local buckling is
a function of the diameter-to-thickness or width-to-thickness ratio and independent of the
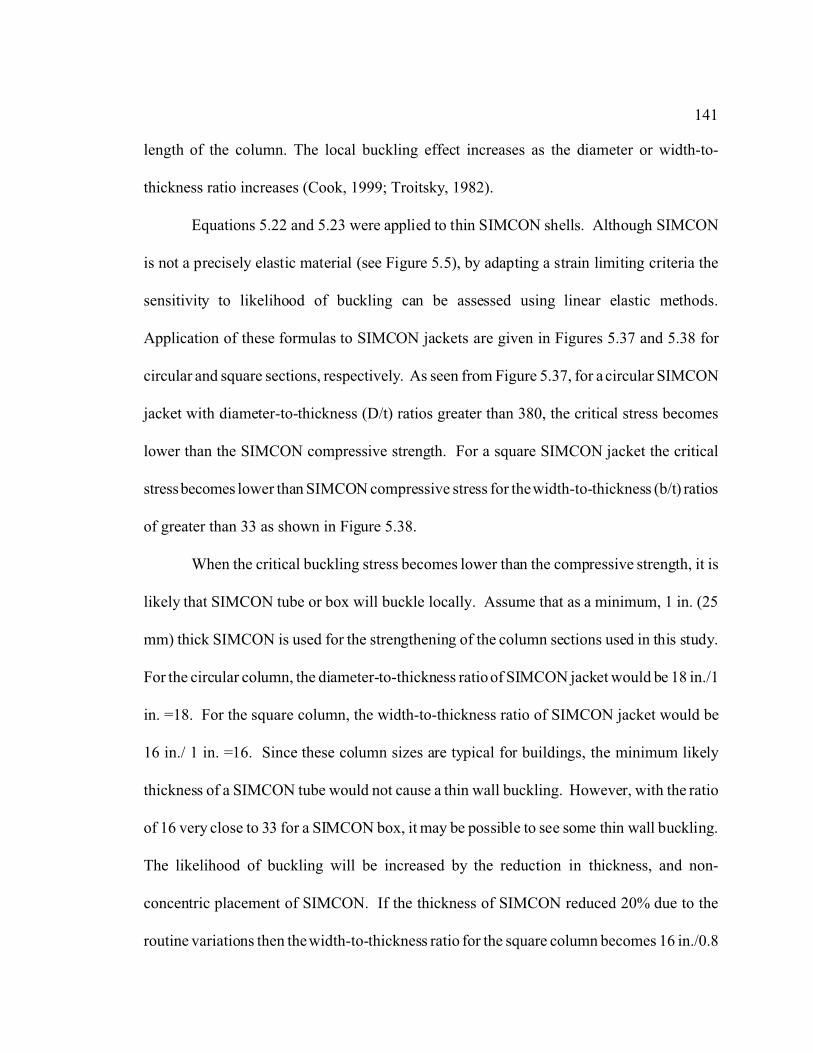
141
length of the column. The local buckling effect increases as the diameter or width-to-
thickness ratio increases (Cook, 1999; Troitsky, 1982).
Equations 5.22 and 5.23 were applied to thin SIMCON shells. Although SIMCON
is not a precisely elastic material (see Figure 5.5), by adapting a strain limiting criteria the
sensitivity to likelihood of buckling can be assessed using linear elastic methods.
Application of these formulas to SIMCON jackets are given in Figures 5.37 and 5.38 for
circular and square sections, respectively. As seen from Figure 5.37, for a circular SIMCON
jacket with diameter-to-thickness (D/t) ratios greater than 380, the critical stress becomes
lower than the SIMCON compressive strength. For a square SIMCON jacket the critical
stress becomes lower than SIMCON compressive stress for the width-to-thickness (b/t) ratios
of greater than 33 as shown in Figure 5.38.
When the critical buckling stress becomes lower than the compressive strength, it is
likely that SIMCON tube or box will buckle locally. Assume that as a minimum, 1 in. (25
mm) thick SIMCON is used for the strengthening of the column sections used in this study.
For the circular column, the diameter-to-thickness ratio of SIMCON jacket would be 18 in./1
in. =18. For the square column, the width-to-thickness ratio of SIMCON jacket would be
16 in./ 1 in. =16. Since these column sizes are typical for buildings, the minimum likely
thickness of a SIMCON tube would not cause a thin wall buckling. However, with the ratio
of 16 very close to 33 for a SIMCON box, it may be possible to see some thin wall buckling.
The likelihood of buckling will be increased by the reduction in thickness, and non-
concentric placement of SIMCON. If the thickness of SIMCON reduced 20% due to the
routine variations then the width-to-thickness ratio for the square column becomes 16 in./0.8

142
Figure 5.37 Thin wall circular SIMCON tube local buckling critical stress

143
Figure 5.38 Thin wall square SIMCON box local buckling critical stress
144
in. =20. This width-to-thickness ratio is closer to critical buckling stress as seen in Figure
5.38.
Since the SIMCON is a thin box or tube subjected to axial compression, the designer
should be aware of the possible thin wall buckling of the SIMCON jacket. In order to
mitigate the possibility of the thin wall buckling problem, the SIMCON jacket thickness may
need to be increased to reduce the width/diameter-to-thickness ratio for a given situation.
In this study, no minimum thickness of SIMCON jacket was recommended against the
possibility of the thin wall buckling problem because the given minimum thickness may not
satisfy the required width/diameter-to-thickness ratio for larger cross-sections. Since at the
design stage, the thin wall buckling problem can be avoided by selecting appropriate
SIMCON dimension, it can be concluded that the thin wall buckling is not a critical factor.
5.6.8 SIMCON Jacket End Connections
As seen in the previous sections, SIMCON jacketing may greatly enhance the axial
load-moment capacity of column sections. In order to achieve those enhancements, however,
the continuity of the load transfer from the SIMCON jacket to the reinforced concrete beam
or slab must be ensured. For this reason, the transfer of tensile forces and compressive forces
in SIMCON jacket to the existing frame or slab must be addressed.
Krstulovic, et al, [2000] and Dogan, et al, [2000] investigated the seismic behavior
of reinforced concrete beam-column connections by continuous jacketing with SIMCON.
Their research involved strengthening a newly constructed, cross shaped (\) joint. In the
actual frames, however, the joints have three or more beams and a slab connecting to it.
145
Thereby, although continuous jacketing with SIMCON seems to be capable of transferring
the loads, the constructibility of such system in actual frames will be very labor intensive and
costly.
A balanced failure of SIMCON jacketed section is assumed to occur when the
reinforcement yields in tension and the concrete reaches its maximum strength in
compression. The compressive strength of concrete used in slabs and beams in many
buildings may be assumed to be approximately 4000 psi (27.6 MPa), while the compressive
strength of SIMCON ranges between 9500 to 11000 psi (65.5 to 75.8 MPa). In this case,
since SIMCON has a much higher compressive strength than the concrete in the beam or
slab, the compression load in SIMCON jacket may cause crushing of the slab or beam at the
point of contact with the SIMCON jacket.
If the compressive strength of the SIMCON jacket is fully utilized, then the stress in
the concrete on which the SIMCON jacket is seated must be reduced to acceptable levels.
Therefore, to distribute the compression load from the SIMCON jacket, a pedestal or capital,
an extension of the SIMCON jacket, should be included, as shown in Figure 5.39.
In addition to axial loads, the end moments of the SIMCON jacketed column should
also be transferred from the SIMCON jacket to the reinforced concrete slab, beam or footing.
Some sort of connection must exist between the end of the SIMCON jacket to transfer the
tensile forces in SIMCON. Conceivably, this connection may be satisfied with epoxy
grouting, a thickened edge or using steel collars, or placing dowels in the concrete slab before
placing the SIMCON jacket.
As an example of a connection an epoxy grouting procedure given here may be

146
Figure 5.39 Epoxy grouted gap between SIMCON jacket pedestaland slab
147
followed. While constructing the SIMCON jacket, a narrow gap may be left intentionally
between the SIMCON pedestal and the concrete slab by placing a foam strip and after curing
of the SIMCON, removing the foam strip. After curing of SIMCON jacket, this gap may be
enclosed with a reusable form and injected with a Type IV epoxy (ASTM C882, 2002) to
bond SIMCON jacket to concrete slab. Nevertheless, considerations should be given to the
possible effects of fire to the epoxy, creep of epoxy, and shearing effect on epoxy. Type IV
epoxy is specified to be used in load bearing applications for bonding hardened concrete to
hardened concrete. The minimum bond strength of this type of epoxy is specified as 1000
psi (7 Mpa) and the compressive strength is specified as 10000 psi (70 MPa) (ASTM C882,
2002). Using these values and considering the tensile and compressive strengths of
SIMCON, the determination of required area of the pedestal is straight forward.
Although the design of the SIMCON jacket end connections were found to be critical
factor, their design requires the necessary design values to be known. The design is,
however, outside the scope of work for this study, which was to identify critical factors in
design or construction, develop reasonable methods to control these factors and to prioritize
research needs where solutions were not feasible or design conditions were not known with
sufficient accuracy. Clearly the design and behavior of the end connections are critical
research needs.
5.7 SUMMARY OF ANALYTICAL EVALUATION
5.7.1 Summary of Analytical Evaluation of Selected Factors
The results of analytical evaluation of selected factors are provided in Table 5.3. In

148
the table, the average values of analyzed sections were presented. The results were given for
two different SIMCON thicknesses because the behavior of the column is generally strongly
affected by the SIMCON thickness. The investigated factors were arranged by their effects
on column behavior.
In the table, the unbonded to bonded axial load capacities are not given but are equal
to one. This is closely related to the end conditions of the SIMCON jacket, however.
Therefore, the end connections appear to be the most important factor because of their effect
on load transfer mechanism. Although some possible solutions were discussed, the end
connection details require more detailed investigation regarding constructibility and their
effects.
The data in Table 5.3 indicate that the next most critical factor was thickness of the
SIMCON jacket. The variations in the SIMCON jacket are found to be important for the
maximum moments and axial load capacities, therefore they should be closely monitored at
the construction site. Thickness of the SIMCON jacket should be checked at several point
around the section and along the column. This procedure not only assures uniform thickness
but also should ensure the concentric placement of SIMCON, and should be employed to
verify the thickness prescribed in the specifications. Thin, steel rod may be inserted through
the form and the fiber mat and the distance from concrete surface to the surface of the fiber
mat measured. The slurry injection port openings may be used for access through the form.
The routine variations in SIMCON strength are the next important factor on
maximum moments (Mo,max) and axial load capacities (Pn,max) as seen in Table 5.3. The
strength of the slurry should be closely monitored. Based on findings in 5.6.3 and

Table 5.3 Statistical evaluation of selected analytical results
149
PARAMETERMAXIMUM MOMENT
RATIO (Mo,max)AXIAL LOAD CAPACITY
RATIO (Pn,max)
t=1 in t=2 in t=1 in t=2 in
Improvement in reinforced concrete due to bonded jacket 52.0 119.6 28.9 62.5
Bonding (perfectly bonded/unbonded) -7.8 -10.2 0* 0*
Thickness variations thickness is 80% -7.9 -13.3 -4.8 -8.6
thickness is 90% -4.1 -7.0 -2.4 -4.4
thickness is 110% 4.2 7.2 2.5 4.5
Strength tolerances strength is 90% -3.3 -5.1 -1.9 -3.2
strength is 85% -5.8 -9.1 -2.8 -4.7
Removal of existing load prestrain is 0.03% -4.4 -3.0 -1.7 -6.0
prestrain is 0.06% -5.5 -4.7 -2.0 -6.0
prestrain is 0.1% -8.2 -8.4 -2.7 -9.1
Non-concentric placement top thickness is 90% -0.2 -0.4 -0.2 -0.3
top thickness is 110% 0.2 0.3 0.3 0.4
top thickness is 80% -0.1 -0.3 -0.4 -0.6
top thickness is 120% 0.5 1.3 0.5 0.9
Fiber mat seams seam at top strength 90% -0.4 -0.7 -0.3 -0.6
seam at top strength 85% -2.6 -1.9 -0.6 -1.0
seam at side strength 90% -0.5 -0.4 -0.3 -0.5
seam at side strength 85% -3.0 -2.6 -0.5 -0.8
seam at bottom strength 90% -0.8 -1.3 -0.3 -0.5
seam at bottom strength 85% -4.4 -5.2 -0.5 -1.0
150
summarized in Table 5.3, the use of 10% strength acceptance criteria, as currently required
in ACI 318 for high strength concrete is acceptable.
The presence of existing loads on the column during jacketing appears to be an
important factor for the behavior. The cost of SIMCON jacketing will increase due to
jacking if the removal of existing loads is chosen to benefit the capacity increase, although
this increase in capacity would be marginal compared to routine variations in SIMCON
strength and thickness. Therefore, it is recommended that the SIMCON jacket be applied
without removal of existing loads, with the loss of capacity incorporated in the design phase.
The effects of routine variations in centering of SIMCON are within established range
of the effects of dimensional tolerances on the reinforced concrete column.
The effects of SIMCON seams with reduced strength are within the limits established
in 5.4.4. The potential problems include separation of seams due to barreling of jacket and
rotation of unreinforced fractured edges in compression. Stitching of the fiber mat edges
may provide a possible solution for these problems, additional research is recommended,
however.
5.7.2 Modification of Strength Reduction Factor for SIMCON Jacketed Column
ACI 318 [2002] gives strength reduction factors (N) to compensate for the
uncertainties in estimation of strength of structural members. The strength reduction factor
for a column with reinforcement other than spiral is given as 0.65 in Section 9.3.2 of ACI
318. The suitability of this factor for SIMCON jacketed columns needs to be addressed.
The effects of some factors investigated in this study are small, however, several are

151
significant, such as the effects of thickness variations and strength tolerance. Although
thickness control can be easily established in the field with a gauge and strength can be
maintained by testing, due to the relatively large effects caused by these factors, which could
occur simultaneously, it would appear prudent to adopt a more restrictive strength reduction
factor until sufficient research has been conducted.
The total of losses for thickness tolerance of 80%, strength tolerance of 85%, the
assumption of existing strain in the column as 0.06%, and the biggest effects of other factors
were divided by the axial load capacity increase in the jacketed reinforced concrete column.
Based on the results in Table 5.3, the axial load capacity loss ratio to total capacity increase
in reinforced concrete with 2 in. thick SIMCON jacket is
and with 1 in. thick SIMCON jacket is
These are equivalent to strength reduction factors of 0.67 and 0.63, respectively. These
results indicates that the axial load capacities of SIMCON jacketed columns with the applied
tolerances will achieve only about 65% of the axial load capacity over the axial load capacity
of the reinforced concrete jacketed with a SIMCON. Similar ratios were also found for
reductions in maximum moment capacities.
Based on these ratios, the strength reduction factor (N), 0.65 given in current ACI 318

152
for columns could be used as a minimum for the design of SIMCON jacket. Considering the
other factors, however, such as uncertainties in end connections, and seam behavior which
need future research, and the importance of columns in structures, it may not be unreasonable
to use a more conservative strength reduction factor such as 0.60, pending additional
research.
5.8 CONCLUSIONS AND RECOMMENDATIONS
1. Analysis indicates that the SIMCON jacket may greatly improve the maximum moment
capacity of a reinforced concrete column; increases of one and a half times or more of the
original reinforced concrete section capacity were found for typical SIMCON thicknesses and
. Based on analysis, SIMCON thickness plays an important role in axial load capacities.
With 2 in. (51 mm) thickness of SIMCON jacket applied on the column types used in this
study, it may be possible to reach more than one and half times the axial load capacity of
reinforced concrete section itself.
2. The following factors in design of SIMCON jacketed columns were identified and
evaluated:
a) Bond Between SIMCON and Reinforced Concrete Column: There does not appear
to be a significant difference in axial load capacities of bonded and unbonded section
provided that there is no gap left between the SIMCON jacket and slab. Therefore, an
unbonded SIMCON jacket can be used for strengthening due to additional cost by bonding
of the SIMCON and concerns with the reliability of bonding mechanisms in a bonded jacket
b) SIMCON jacket end connections: The end connections appear to be the most

153
important factor because of their effect on load transfer mechanism. Although some possible
solutions were discussed, the end connection details require more detailed investigation
regarding constructibility and their effects.
c) Removal of load on existing reinforced concrete column prior to jacketing:
Analysis indicates that the presence of existing loads on the column during jacketing is an
important factor for the behavior. It is recommended, however, the SIMCON jacket may be
applied without removal of existing loads, with the loss of capacity incorporated in the
design phase with an appropriate strength reduction factor because of the increased cost of
the SIMCON jacketing with jacking and backshoring.
d) Thin wall buckling of SIMCON jacket: The SIMCON jacket is a thin box or tube
subjected to axial compression, so that there is a possibility of thin wall buckling of the
SIMCON jacket. The thin wall buckling problem can be avoided, however, at the design
stage by selecting appropriate SIMCON dimensions, therefore it was concluded that the thin
wall buckling is not a critical factor.
3. The following factors in construction of SIMCON jacketed columns were identified and
evaluated:
a) Routine variations in SIMCON strength: Analysis indicates that the use of 10%
strength acceptance criteria, as currently required in ACI 318 for high strength concrete is
acceptable for the routine variations in SIMCON strength. It is recommended that the
strength of the slurry should be maintained by testing.
b) Routine variations in SIMCON jacket thickness: Based on analysis, the variations
in the SIMCON jacket were found to be important for the maximum moments and axial load

154
capacities, therefore they should be closely monitored at the construction site.
c) Non-concentric placement of the SIMCON jacket during construction: Based on
analysis, the effects of routine variations in centering of SIMCON are within established
range of the effects of dimensional tolerances on the reinforced concrete column.
d) The effects of location and strength of fiber mat seams: The effects of SIMCON
seams with reduced strength are within the limits established for the effects of dimensional
tolerances on the reinforced concrete column. There are potential problems with seams,
however, including separation of seams due to barreling of jacket and rotation of
unreinforced fractured edges in compression. Therefore, additional research is
recommended.
4. The strength reduction factor, (N), 0.65 given in ACI 318 for reinforced concrete columns
may be used as a minimum for the design of SIMCON jacket. It may not be unreasonable,
however, to use a more conservative strength reduction factor such as 0.60 for SIMCON
jacketed column design considering the uncertainties in end connections and seam behavior,
which need additional research, and the importance of columns in structures, pending
additional research.

155
CHAPTER VI
COMPARISON OF ALTERNATIVE STRENGTHENING
TECHNIQUES AND COST ANALYSIS
6.1 OVERVIEW
The utility of any material, element, device or configuration depends on both
economical and technical feasibility. In this chapter, the economic viability of a SIMCON
jacket, applied as a retrofit to an existing column, is compared to several other widely
available alternatives. These alternatives are not exactly equivalent technically. The increase
in moment capacity of the FRP alternative (Teng, et al, 2002) is not the same as that
provided by the SIMCON jacket, for example. In addition, costs are very site specific in
terms of working conditions, site location and access, and technical specifications, to name
just a few factors. Only an approximate comparison of costs, ir order to determine economic
feasibility, was required, therefore, a detailed cost estimate was neither necessary nor
possible.
Since no estimates of in-place costs of SIMCON jacket were available, a simple
analysis was considered which could be used to determine the general economic feasibility
of the SIMCON jacket, in comparison with the very broad cost estimates of alternatives

156
available in the literature or quoted in practice. It is significant to note that the cost estimate
could be prepared only after identifying those critical elements of design or construction
which would significantly affect behavior and which would therefore affect construction
requirements. As an example, the lack of a requirement to ensure bonding between the
jacket and the column means that no cost was involved, in material or in on-site fabrication,
for this particular aspect.
Typical technically similar alternatives for strengthening a column include;
a) Confinement by jackets made of
- SIMCON,
- Steel,
- Fiber Reinforced Plastics (FRP), or
- Reinforced concrete (RC)
b) Demolishing the existing reinforced concrete column and building a new
reinforced concrete column.
c) Strengthening not the individual member but the structure by adding a steel tube
or an additional column next to the existing member, reducing the load on the existing
column and increasing the capacity of the structure.
6.2 CONFINEMENT BY JACKETS
Wrapping is an effective method in confining concrete, increasing the usable
compressive strength of both the concrete core and cover regions of the columns, resulting

157
in a greater load carrying capacity with a higher strain capacity at failure. It also provides
additional support against buckling of the longitudinal bars in the original column. Cost
estimates of these alternatives are given in 6.3.4.
6.2.1 Steel Jackets
Confinement by various types of steel elements, including strand, hoops and plates
formed into tubes, has been shown to be effective in enhancing the ductility of reinforced
concrete, allowing the seismic performance of concrete members to be upgraded (Yuping,
et al, 2000). Although the ductility is increased, the axial load capacity does not change
significantly due to the small area (the cover over the existing column) confined by the steel
elements. Another major concern in using steel jackets is the potential for corrosion; other
concerns include intentional or accidental damage to the strand in service, and behavior of
steel under high tensile stress during a fire.
Xanthakos [1996] gives examples of confinement of reinforced concrete bridge
columns by steel hoops as shown in Figure 6.1. In this application, concrete is confined by
prestressing the steel hoops with a special turnbuckle. In another application, steel jackets
were used to strengthen a reinforced concrete column as shown in Figure 6.2 (Xanthakos,
1996). The steel shell is welded around the column and the annular space between the
column and the steel jacket is filled with grout.

158
Figure 6.1 Column retrofit to increase confinement with steelhoops (Xanthakos, 1996)
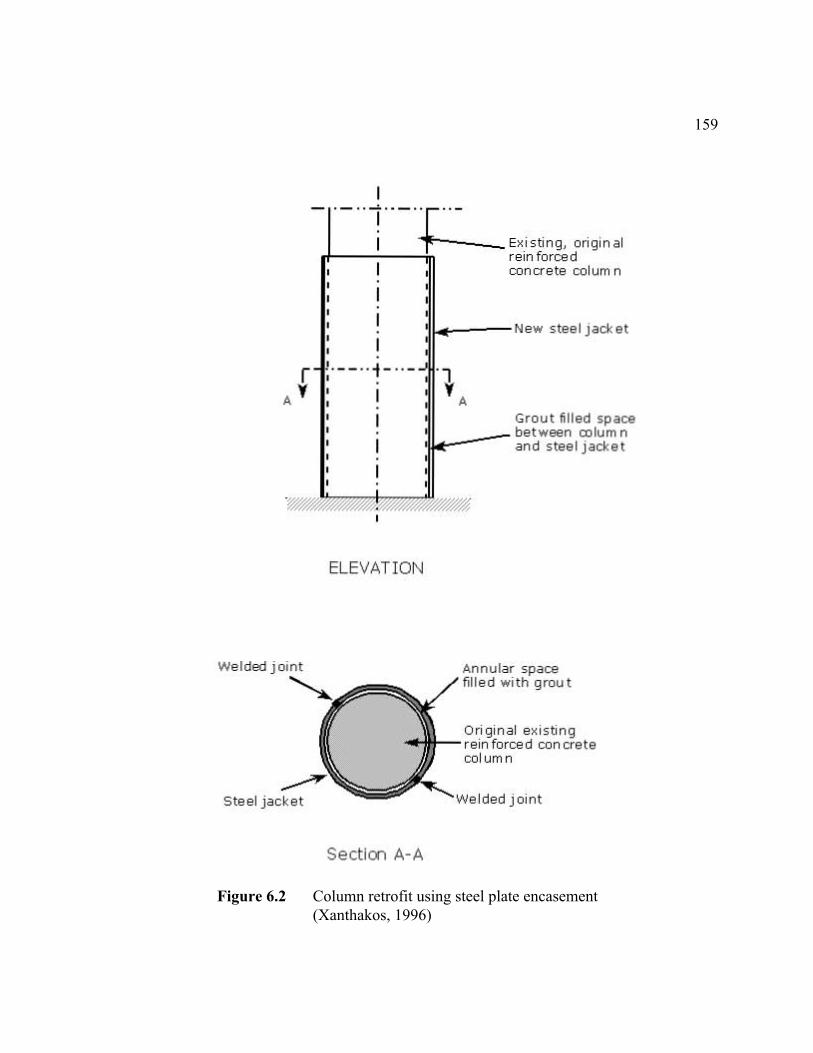
159
Figure 6.2 Column retrofit using steel plate encasement(Xanthakos, 1996)
We lded joint
· - ·· l ·· - ·~Ex.istin g . ori gin a l
rei nforce d I concrste co lum n
I
+ ____ Ne w stse l Jad<et
Grout filled space
•_--- bet ww n column it-- and steel Jacket
ELEVATION
'--... ,.."" Annula r space fill ed wi t h grout
~ Stesl jackst
Sectlcn A-A
Original B"is ting rein forced con cre t e co l um n

160
6.2.2 FRP Jackets
Fiber Reinforced Polymer (FRP) jackets are made by wrapping fibers around the
columns and providing an epoxy coating. These jackets are either (a) in-situ fabricated
jackets that involve hand (see Figure 6.3) or automated machine placement (see Figure 6.4)
of epoxy saturated fabrics on the surface of the existing concrete or (b) prefabricated
composite jacketing shells, applied similarly to steel jackets.
Considerable research has been conducted on FRP strengthening of reinforced
concrete structures (ACI 440, 1996). The disadvantages of FRP typically cited include;
a) lack of universally accepted design procedures,
b) high material cost,
c) vulnerability to mechanical damage, and damage by vandalism (although such
damage is more likely to be localized, and repair may be easier than with steel),
d) notch sensitivity,
e) premature failure at corners while wrapping square columns,
f) the use of toxic materials for bonding, requiring more careful storage than
traditional construction materials,
g) low fire resistance of organic binders,
h) degradation of organic binders under ultraviolet light,
i) low durability of glass fibre reinforcement in alkali environments, and
j) potential for increased galvanic corrosion since carbon fiber is a conductor of
electricity and composites in which it is used may be highly noble relative to some metals.

161
Figure 6.3 The REPLARK method for polymer composite wrapping ofcolumns (Hollaway and Head, 2001)

162
Figure 6.4 Xxsys Technologies for polymer composite wrapping of columns(Hollaway and Head, 2001)
163
Advantages of FRP include high tensile strength, light weight, ease of handling,
reduced construction period, no corrosion of the fibers, ability to prestress, and lack of
anchor problems (ACI 440R, 1996; Hollaway and Leeming, 1999).
Tests conducted by Chaallal and Shahawy [2000] indicate that FRP wrapping
provides approximately a 70% increase in moment capacity and approximately a 30%
increase in the axial load capacity of columns mainly due to the concrete confinement effect.
There is still a need to develop suitable confining models for FRP wraps. The primary
advantage of FRP wrapped columns is the increased ductility of the column.
6.2.3 Reinforced Concrete Jackets
Strengthening of a reinforced concrete column can be achieved using conventional
reinforced concrete elements. Xanthakos [1996] shows this type of strengthening (see Figure
6.5). With this option, the flexural capacity of the column will be increased, similar to
SIMCON jacketing. Xanthakos draws attention to the necessity of dowels of sufficient
length to develop the required connection strength. Another potential problem is the
shrinkage of the new concrete. Since, as shown in the figure, the new concrete is
mechanically bonded to the old concrete, the new concrete will be prevented from shrinking
and therefore may crack. This cracking, in turn, may cause corrosion of reinforcement.
Using reinforced concrete as a strengthening material may be comparatively cheaper
than others because of familiarity of procedures and availability of materials. Due to the
relatively high thickness of this alternative, a substantial penalty may be incurred by the

164
Figure 6.5 Strengthening a column with reinforced concrete jacket(Xanthakos, 1996)

165
owner, however.
In commercial buildings, the lease payment ($ per time period) is based on the lease
rate ($ per square feet) and the usable floor area. The usable floor area is determined as the
gross area less the area of columns, narrow offsets and can include restricted areas such as
dead spots near doors. This factor is, of course, one of the driving factors for the use of high
strength concrete columns in tall buildings in major metropolitan areas. High strength
concrete columns are inherently more expensive per square foot of area occupied than
conventional strength concrete columns. They are economically feasible only when a high
lease rate is charged.
6.2.4 Demolishing the Existing Reinforced Concrete Column and Building a New
Reinforced Concrete Column
In some cases, the existing reinforced concrete column may have been severely
damaged, due to corrosion, frost attack, or excessive loading. In some other cases, the
column might be defective due to construction errors. In these cases, it may not be
economically feasible or technically possible to put a jacket around the column and
strengthen it, and replacement with a new column is required. The existing column loads
will be transferred to temporary shores, and the column will be replaced by a new one. The
potential problems include shrinkage of the new concrete and providing sufficient load and
moment transfer at the end connections. This option is especially attractive for a single
column replacement rather than replacing all floor columns. The familiarity of the design

166
procedures and availability of materials is also another appealing factor for this option.
6.2.5 Adding a Steel Tube or Column Next to the Existing Member
Occasionally, a column, deficient due to the reasons given in 6.2.4, may be chosen
to be left in-place but with an additional column added to relieve the loads on existing one.
The reasons for this option may include, but is not limited to, the limited floor area to place
the temporary shores, or to save the time spent while waiting for the curing of the
replacement reinforced concrete column. In that sense, the simplest material will be a steel
tube because it will not shrink and can be installed in a very short time. It is assumed that
this option is performed inside the building where the corrosion problem is minimal,
however, in this case, the fire protection of steel tube should be considered. Another material
for the additional column can be precast reinforced concrete. The advantage of reinforced
concrete column is its fire resistance. Whether steel or reinforced concrete, the load transfer
connections and requirement of footings and removal of floor slab present challenging
problems in design and construction. Another disadvantage is the usable floor space lost to
the additional column in office buildings.
6.3 COST ANALYSIS OF SIMCON JACKETED COLUMNS
Cost estimates are prepared, in general, by estimating labor costs, equipment costs,
which are based on pro-rated capital costs or rental fees, material costs, overhead costs, profit
and contingency. The overhead costs are normally broken down into project management
167
and site costs, and general and administrative (G&A) costs, which include the costs of
estimating, billing, non-job-specific insurance or liability costs and primary management
costs. Contingency is often included in overhead costs and, for preliminary estimates or
reporting purposes, the combined overhead and contingency costs, plus profit, are given as
a simple mark-up value.
6.3.1 Assumptions in Estimating Project Management Costs
One of the most variable and difficult to estimate costs for general use is the cost
associated with project management. The costs used in this study were estimated based on
available data. The following considerations are listed by Xanthakos [1996] in developing
these costs for retrofitting columns:
1) The strengthening method is not an emergency repair but a planned decision to
upgrade the structure to a particular level of service, at a particular point and time.
2) If the structure is located in an urban area, additional time constraints and
measures to protect the pedestrians will imply additional costs, including restrictions such
as working hours.
3) The proposed improvement is planned during the prime construction months. If
this is not the case, additional costs mut be allocated to cover contingencies such as proper
curing, weather related delays, and so on.
4) Normal accessability is provided to site.
5) If necessary, the structure can be closed to use.

168
6) Removal costs of construction debris are not excessive.
7) Materials and necessary equipment are locally available.
8) The structure is adaptable to the proposed improvement; if heavier loads must be
carried by the columns then modifications of beams and associated elements are possible.
9) OSHA/EPA regulations do not overly restrict operations.
Other factors which can affect the costs include:
1) Costs attributed to a functional deficiency such as load posting or clearance
restriction. Although this is primarily a cost to the owner, or the user, it can also affect the
price quoted by the contractor.
2) A need for sequencing the strengthening considering structural integrity and
safety. Strengthening may need to follow the load path meaning that slabs and beams may
have to be strengthened first followed by columns and finally footings. Again, this is
primarily a cost of retrofitting to the owner which may not be significantly affected by the
specific type of retrofit alternative selected but which could affect the sequence of operations
and access and therefore affect the price quoted by the contractor.
3) Protection of exposed elements during the project may be needed.
4) Characteristics of materials, such as waste and workable life, storage requirements,
shelf life, amount of quantity to be stored, and protective clothing requirements will clearly
affect the cost of materials, the cost of labor and project management costs..
5) Requirements for specially trained crews, particularly when dealing with hazardous
substances.
169
6) Degree of repetition or market demand. This is a significant factor in many cases.
Equipment capitalization costs may be spread over more projects, “learning curve” behavior
and crew productivity may increase, costs associated with uncertainty and risk may be
reduced, and, of course, competition in a larger market may reduce prices.
6.3.2 Work Breakdown Structure of SIMCON Jacketed Reinforced Concrete Column
A Work Breakdown Structure (WBS) for strengthening a reinforced concrete column
with a SIMCON jacket was developed composed of two principle tasks:
Task 1: Analytical study and design, which included
Step 1: Analysis of the structure or elements,
Step 2: Selection of the construction system(s) to be used, and
Step 3: Planning and procurement, and
Task 2: Installation of SIMCON jacket, which included
Step 1: Mobilization,
Step 2: Preparation of existing reinforced concrete column,
Step 3: Preparation of steel fiber mat,
Step 4: Preparation and injection of slurry mixture into the steel fiber mat,
Step 5: Curing, and
Step 6: Demobilization, clean-up and close-out.
Work descriptions of these tasks are as follows:
Step 1.1 Structural Analysis: Analyze the jacket, considering the findings of this

170
study. Determine the required SIMCON jacket properties and thickness.
Step 1.2 Selection of the construction system(s) to be used: Select the formwork type,
including material and bracing requirements to achieve the required
dimensional tolerances. Assuming that most formwork will be custom built,
it may be feasible to use a round fiber formwork such as SonoTubes®
(Krstulovic, 2001) for circular columns. For rectangular or square column
sections, formwork can be manufactured of steel, plywood, composite or
wood faced metal. Due to the low viscosity and lack of coarse aggregate and
the need for close dimensional tolerances, the formwork should be designed
for full hydraulic head plus pumping pressure.
Step 1.3 Planning and procurement: Procure selected materials including formwork,
steel fiber mat and slurry ingredients. Limited production facilities for the
steel fiber mat, procurement of this material may require a considerable lead
time. Initiate the approval process by the engineer of record.
Step 2.1 Mobilization: Set up the job site, job office, provide necessary access control
or fall protection devices, bring in required equipment, establish access for
utilities, trash disposal and sanitation.
Step 2.2 Preparation of existing reinforced concrete column: It was previously shown
that there is little difference in column behavior between a perfectly bonded
and an unbonded SIMCON jacket. Therefore, no special preparation of the
existing concrete column surface is needed. Nevertheless, cleaning the

171
surface of debris, dirt, and any loose concrete should be done as a matter of
good practice.
Step 2.3 Preparation of steel fiber mat: Determine the required dimensions, and cut the
fiber mat. Place the mat around the existing column and hold the mat in-
place around the column using tie wires. Place the formwork around the
column, with access ports for the slurry injection (one at bottom, one at the
middle, and one at the top for a typical, one story column height) (Krstulovic,
2001).
Step 2.4 Prepare the slurry mixture using appropriate quantities of cement, water,
silica sand, HRWR, and silica fume for the column. Mix and inject by
pressure. Vibrate the formwork externally for good compaction.
Step 2.5 Cure the SIMCON jacket: Remove the formwork 36 to 48 hours after slurry
injection and provide acceptable curing such as by applying curing
compound. The time, 36 to 48 hours, in the form is temperature dependent
and is needed due to the retardation commonly encountered using the high
dosages of HRWR used to obtain the low viscosity of the SIMCON slurry
required for infiltration of the mat.
Step 2.6 Demobilization, clean-up and close-out: Clean up the job site. Dismantle and
remove equipment, tools and control devices. Conduct final tasks to ensure
quality. Complete and process required paperwork.
172
6.3.3 Cost Analysis of SIMCON Jacketed Reinforced Concrete Column
Cost data was calculated by summing the labor, equipment, and material costs. Most
of the data, including labor hours, equipment, and material usage were estimated based on
previous SIMCON related research conducted at the Constructed Facilities Laboratory
(CFL), at North Carolina State University (NCSU). Whenever possible, costs were taken
from RSMeans Building Construction Cost Data book (RSMeans, 2002), other costs were
obtained from suppliers.
To analyze the costs associated with SIMCON jacketing of a reinforced concrete
column, several additional assumptions were made, in order to compare costs of other
strengthening technologies. Using data obtained from the California Department of
Transportation (CalTrans) for FRP and steel jackets: (a) the reinforced concrete columns to
be strengthened are bridge columns, (b) the columns have dimensions of 25 in by 25 in (635
mm by 635 mm), and are 20 ft (6.096 m) high, and (c) the crew consists of a foreman, two
skilled workers, and a common laborer. Direct labor hour estimates are shown in Table 6.1.
The total of 20 hours shown in Table 6.1 is the estimated labor hours spent by the
crew on one column. The costs for crew members were taken from RSMeans data book
[2002] and included the costs of workers’ compensation insurance and fixed overhead.
Therefore the direct labor costs were calculated as follows:
20 hr× (1×$43.90 + 2×$41.30 + 1×$31.60) = 20 × ($158.10) = $3,162 per column
Table 6.2 shows the estimated equipment costs for SIMCON jacketing of one bridge
column. While these costs appear to be precise, they are very approximate figures based on
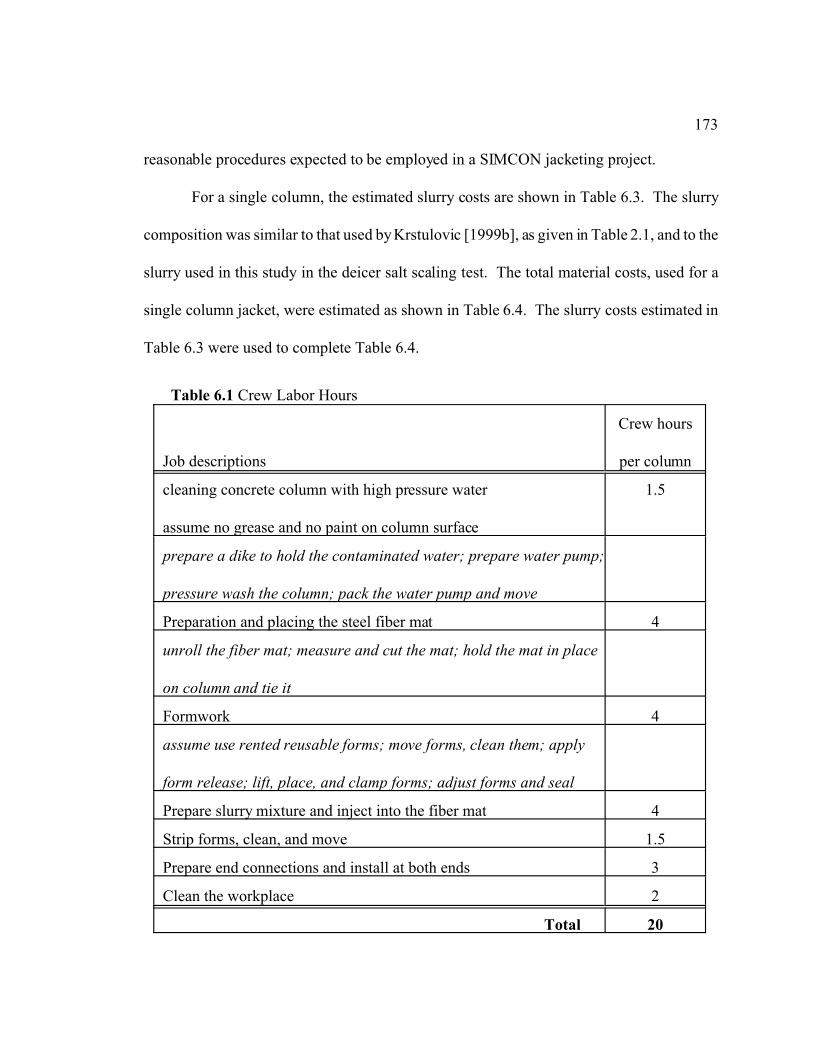
173
reasonable procedures expected to be employed in a SIMCON jacketing project.
For a single column, the estimated slurry costs are shown in Table 6.3. The slurry
composition was similar to that used by Krstulovic [1999b], as given in Table 2.1, and to the
slurry used in this study in the deicer salt scaling test. The total material costs, used for a
single column jacket, were estimated as shown in Table 6.4. The slurry costs estimated in
Table 6.3 were used to complete Table 6.4.
Table 6.1 Crew Labor Hours
Job descriptions
Crew hours
per column
cleaning concrete column with high pressure water
assume no grease and no paint on column surface
1.5
prepare a dike to hold the contaminated water; prepare water pump;
pressure wash the column; pack the water pump and move
Preparation and placing the steel fiber mat 4
unroll the fiber mat; measure and cut the mat; hold the mat in place
on column and tie it
Formwork 4
assume use rented reusable forms; move forms, clean them; apply
form release; lift, place, and clamp forms; adjust forms and seal
Prepare slurry mixture and inject into the fiber mat 4
Strip forms, clean, and move 1.5
Prepare end connections and install at both ends 3
Clean the workplace 2
Total 20
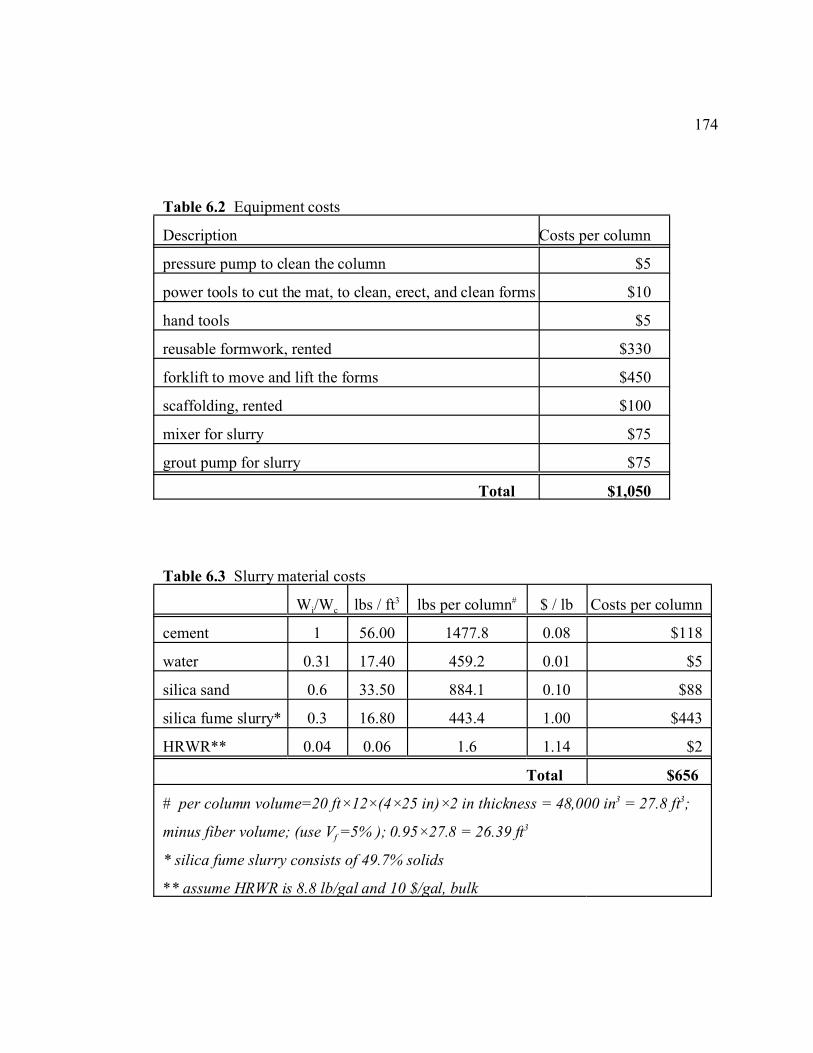
174
Table 6.2 Equipment costs
Description Costs per column
pressure pump to clean the column $5
power tools to cut the mat, to clean, erect, and clean forms $10
hand tools $5
reusable formwork, rented $330
forklift to move and lift the forms $450
scaffolding, rented $100
mixer for slurry $75
grout pump for slurry $75
Total $1,050
Table 6.3 Slurry material costs
Wi/Wc lbs / ft3 lbs per column# $ / lb Costs per column
cement 1 56.00 1477.8 0.08 $118
water 0.31 17.40 459.2 0.01 $5
silica sand 0.6 33.50 884.1 0.10 $88
silica fume slurry* 0.3 16.80 443.4 1.00 $443
HRWR** 0.04 0.06 1.6 1.14 $2
Total $656
# per column volume=20 ft×12×(4×25 in)×2 in thickness = 48,000 in3 = 27.8 ft3;
minus fiber volume; (use Vf =5% ); 0.95×27.8 = 26.39 ft3
* silica fume slurry consists of 49.7% solids
** assume HRWR is 8.8 lb/gal and 10 $/gal, bulk

175
Table 6.4 Material costs
Description Costs per column
water to clean column, and a disposal fee $20
steel fiber mat* $227
tie wire $5
slurry (from Table 6.3) $656
end connections made of steel collars, incl. bolts and anchors $100
Total $1,008
* the price of the steel mat was assumed to be 1.00 $/lb based on discussions with
the manufacturer; one roll is 100 ft long and 4 ft wide; one roll weighs
approximately 500 lbs; for one column (20 ft×100/12 ft )×1.05 = 175 ft2 mat
required; one roll is enough for (400 ft2 / 175 ft2) 2.2 columns; 500 lbs / 2.2
columns= 227 lbs mat for one column
Other alternatives for the end connections of SIMCON jacket clearly exists, and this
structural detail needs further investigation (see Section 5.6.8). For the purposes of this part
of the study, an approximate, but representative value of the end connections was needed.
It was assumed that a steel collar, connected to the SIMCON jacket by bolts acting as shear
studs and connected to the concrete slab or beam by drilled anchors, would be used.
With a new technology like SIMCON, it is difficult to estimate overhead accurately
or assign a reasonable profit. General and administrative (G&A) costs include expenses such
as home office expenses, including estimating costs, billing expenses and salaries of the
executives, as well as a non-project-specific insurance costs. The project overhead costs are
related to the job and include job office expenses, storage, site protection, and control

176
expenses, and project engineer and superintendent salaries. Assuming that additional risk
related costs, such as insurance, legal fees and management costs are assigned specifically
to the project, a customary percent of direct costs (labor plus equipment plus materials)
would appear to be reasonable for the purposes of this study. However, in order to be
somewhat conservative, a value of 5% of direct costs, which is slightly high but within the
expected range for a smaller project, was used. It is important to note, however, that this
value was chosen assuming several columns would be retrofitted rather than just one. A
single, isolated column would be more expensive. Since the comparison to be made in the
next section used values based on retrofit of several columns, this assumption is valid.
Assigning all project specific risks to the project overhead and considering the
significant management time of both the project engineer and a superintendent on-site means
that project overhead will be relatively large. In addition, a number of costs not normally
encountered by smaller contractors, working on small dollar value jobs, will be incurred.
The contract will clearly require a performance and payment bond and will probably include
a bid bond. In addition, job risk, assigned directly to the project, even though it may be
covered in the home office coverage, can be expected to be high for this type of work, at least
initially.
Another factor contributing to the project overhead will be the relatively high
management costs anticipated, again at least initially. While these costs are normally
factored in to project overhead estimates, they are separated in this study to simplify the
estimate process. Considering that, at least initially, and being conservative in nature, on a

177
job with several columns, the project engineer or superintendent will be required full-time
for each column, and, simplistically, one column can be completed, on average, each day,
the direct cost of management can be estimated as 45 $/hr ×8 hr/day = $360 per column.
It is important to note the difference in price between the project management
engineer and the design fee. The project engineer cost is given directly since overhead and
profit are added separately. The design fee includes overhead, including errors and
omissions insurance, business permits, and office expenses, profit, and routine right-to-build
permits.
After excluding management and risk costs, the other project overhead expenses
appear to be routine. In order to be conservative however, a value of 9% of the direct costs
was used. This is the approximate value that might be expected in building construction,
including supervisory costs, and so is reasonable but conservative.
Total mark-up (overhead plus profit) in many routine, moderate sized, commercial
construction projects varies from about 12% to less than 20%. For smaller jobs, the mark-up
can be higher due to cash flow considerations, but would not exceed 25%, except in highly
risky work, which this is not. The profit in most large project, sealed bid work varies
between 1 and 2%, but profitability, as measured by discounted return on expenditures, is
approximately 10 to 15%, or roughly the value of mark-up. Profit for a small, short-time
construction job is given as 10% of total costs by RSMeans [2002]. For a high risk project
and with little competition, profit could be as high as 15 to 20% (Peurifoy, 1975). Since the
SIMCON jacketing is a new technique, it could be seen as high risk, however the
178
construction itself is relatively straightforward and, with a competition expected from
strengthening techniques such as steel jacketing or FRP wrapping, it is not unreasonable to
use 10% profit in the estimate.
These assumptions result in a mark-up of 30% of direct costs of construction. This
value is high, but not completely unreasonable for a small project. Since the intent of this
part of the study was to compare economic feasibility in a very general manner, a
conservative approach is reasonable.
The time estimate for design of the SIMCON jacket was estimated based on analysis
used in this study. The engineering effort will take more time than required for a normal
concrete structure for which readily available design guidelines exist, however, an estimate
of 5 hours was believed to be reasonable. Due to the uncertainty of the estimate, and to be
conservative, one working day (8 hours) was used to estimate the total cost. The engineering
costs for one column is about 15% of total costs, which is not unreasonable, compared to
reinforced concrete design, given the degree of technical knowledge and lack of experience.
The total cost for a SIMCON jacket for a typical column can therefore be broken
down as shown in Table 6.5.
Since these calculations were done for 20 ft high column, for a unit length of column
the rounded approximate cost is $8,000 / 20 ft � $400 / ft (.$1,300 / m). This figure is the
most likely cost for a SIMCON jacketing of a single column. To determine the sensitivity
of the cost, the following calculations were performed:

179
Table 6.5 SIMCON jacket costs for the retrofit a single reinforced concrete column
Construction
Direct Labor
Equipment (from Table 6.2)
Material (from Table 6.4)
$3,160
$1,050
$1,010
Subtotal (DL+E+M) $5,220
Overhead (G&A) (5%) $260
Project Overhead (9% + $360) $830
Profit (10%) $520
Subtotal $6,830
Design Fees (8 hours @ 150$/h) $1,200
TOTAL COST: SINGLE COLUMN $8,030
(Figures are rounded to the nearest $10)
The biggest percentage of the total cost is the direct labor costs in Table 6.5. The
direct labor cost is also usually the most variable cost component in a construction project.
Therefore, the direct labor cost of SIMCON jacketing in Table 6.5 is assumed to be doubled,
conservatively. Another variation in cost may be caused by the increase in fiber mat cost
which could be assumed to be doubled, again, conservatively. With these assumptions, the
total cost for a single column SIMCON jacketing is shown in Table 6.6. For a unit length
of 20 ft high column, the likely high cost is approximately $12,230 / 20 ft � $610 / ft
(.$2,000 / m). Therefore, the cost for a typical column SIMCON jacketing may range from
$1,300 per meter to $2,000 per meter.

180
Table 6.6 The likely high cost for SIMCON jacketing of a single reinforced
concrete column
Construction
Direct Labor
Equipment (from Table 6.2)
Material (from Table 6.4)
$6,320
$1,050
$1,240
Subtotal (DL+E+M) $8,610
Overhead (G&A) (5%) $430
Project Overhead (9% + $360) $1,130
Profit (10%) $860
Subtotal $11,030
Design Fees (8 hours @ 150$/h) $1,200
TOTAL COST: SINGLE COLUMN $12,230
(Figures are rounded to the nearest $10)
Since the SIMCON jacketing is very new technology at the time of this study, its use
has been limited to laboratory research. Therefore, there has been no reliable cost data for
SIMCON related construction based on field applications. With the acceptance and
increased use of the SIMCON as a strengthening technique, more reliable cost data should
be available for better estimates.
6.3.4 Cost Data of Alternative Strengthening Techniques
Approximate cost data were provided by the California Department of Transportation
for selected bridge column strengthening alternatives (personal communication, 2002);

181
1) Carbon fiber jackets for a column or pier cost $1,500 / m for 0.8 m in diameter
to $2,500 / m 1.0 m in diameter in place.
2) Steel shell column casings cost $4/kg - $6/kg complete and in place. In order to
compare the costs, the cost for steel shell casing must be converted to $ per length. To
convert the $ per kg to $ per m figures, CalTrans suggested that each steel casing may be
assumed to be 1/2 in. (12 mm) thick. The steel shell casing costs in this case are $1,000/m -
$1,880/m.
The costs of carbon fiber jacketing and steel shell jacketing alternatives are
comparable to the range of values of $1,300/m-$2,000/m found for SIMCON jacket
suggesting that the SIMCON is an economically feasible alternative.
At the beginning of this chapter, alternatives for strengthening the columns, including
reinforced concrete jacket, replacement, and adding a new column were briefly discussed.
Although these methods appear to be simple and straight forward because of the familiarity
of the materials and procedures, they may present more design and construction challenges
than they solve. In addition, in many cases, they cause a loss of revenue due to lost of usable
floor space because of increased column dimensions or added column. Clearly, the
replacement and adding a new column alternatives are not truly strengthening techniques,
therefore it was not considered for cost comparison.
Among the alternatives, the reinforced concrete jacket may have advantages
comparable to other types of jacketing of a column. The direct labor costs for reinforced
concrete jacketing should be similar to SIMCON jacketing because both procedure involve

182
similar crew jobs. The equipment costs can also be expected similar. The only difference
may occur in material costs due to use of ordinary reinforcement steel and ordinary concrete,
although the mixture of concrete used in reinforced concrete jacket should be appropriately
designed so that it can be easily pumped. While the overhead costs can be similar, the design
fees should be lower than that of SIMCON jacketing because of familiar design procedures
for reinforced concrete. Although the costs for reinforced concrete jacket appear to be lower
than other alternatives, these costs may be offset by increased column sizes and therefore
reduced leaseable floor area. Since it was assumed that the alternatives to SIMCON
strengthening are mainly FRP and steel jackets, the cost of concrete jacketing was not
considered.
6.4 CONCLUSIONS
Based upon the costs assumed in this analysis, the SIMCON jacketing appears to
have a reasonable cost compared to other strengthening alternatives.
Considering the technical limitations and possibility of improved moment or axial
load capacity, the SIMCON jacket alternative appears to be economically viable. In
particular, the marginal cost of the additional moment or load capacity may be much lower
than several available alternatives.

183
CHAPTER VII
CONCLUSIONS AND RECOMMENDATIONS
7.1 CONCLUSIONS
1. The SIMCON specimens, exposed to freezing-and-thawing cycles in the presence of
deicer salt, exhibited very slight scaling, indicating good to excellent resistance.
2. Air entrainment was not found to be required for satisfactory resistance to deicer salt
scaling, probably due to the very low w/c ratio used.
3. Excellent deicer salt scaling resistance was obtained even though the silica fume content
(13% of total cementitious materials), was higher than the limits (10%) recommended in ACI
318 (ACI, 2002).
4. Based on microscopic analyses on the slurry cubes and SIMCON specimens, excellent
consolidation was achieved with simple gravity infiltration.
5. The lack of entrained air in slurry cubes revealed by microscopic analysis indicates that
much higher additions of air entraining agents are required to provide a high air content with
this mixture.
6. The presence of cracks did not affect deicer salt scaling or corrosion.
7. Corrosion was observed only on fibers which were not embedded, the high quality matrix
184
apparently provides satisfactory protection, or passivation, for stainless steel fibers, at least
for the duration (approximately 2 months) of this severe test.
8. Corrosion may at least become a visual problem where the SIMCON is exposed to deicer
salt solutions.
9. Analysis indicates that the SIMCON jacket may greatly improve the maximum moment
capacity of a reinforced concrete column. Based on analysis, SIMCON thickness plays an
important role in axial load capacities. With 2 in. (51 mm) thickness of SIMCON jacket
applied on the column types used in this study, it may be possible to reach more than one and
half times the axial load capacity of reinforced concrete section itself for square column sizes
of 16 in. (410 mm), and circular column sizes of 18 in. (460 mm).
10. The following factors in design of SIMCON jacketed columns were identified and
evaluated:
a) Bond Between SIMCON and Reinforced Concrete Column: There does not appear
to be a significant difference in axial load capacities of bonded and unbonded section
provided that there is no gap left between the SIMCON jacket and slab. Therefore, an
unbonded SIMCON jacket can be used for strengthening due to additional cost by bonding
of the SIMCON and concerns with the reliability of bonding mechanisms in a bonded jacket
b) SIMCON jacket end connections: The end connections appear to be the most
important factor because of their effect on load transfer mechanism. Although some possible
solutions were discussed, the end connection details require more detailed investigation
regarding constructibility and their effects.

185
c) Removal of load on existing reinforced concrete column prior to jacketing:
Analysis indicates that the presence of existing loads on the column during jacketing is an
important factor for the behavior. It is recommended, however, the SIMCON jacket may be
applied without removal of existing loads, with the loss of capacity incorporated in the
design phase with an appropriate strength reduction factor because of the increased cost of
the SIMCON jacketing with jacking and backshoring.
d) Thin wall buckling of SIMCON jacket: The SIMCON jacket is a thin box or tube
subjected to axial compression, so that there is a possibility of thin wall buckling of the
SIMCON jacket. The thin wall buckling problem can be avoided, however, at the design
stage by selecting appropriate SIMCON dimensions
11. The following factors in construction of SIMCON jacketed columns were identified and
evaluated:
a) Routine variations in SIMCON strength: Analysis indicates that the use of 10%
strength acceptance criteria, as currently required in ACI 318 for high strength concrete is
acceptable for the routine variations in SIMCON strength. It is recommended that the
strength of the slurry should be controlled by testing.
b) Routine variations in SIMCON jacket thickness: Based on analysis, the variations
in the SIMCON jacket were found to be important for the maximum moments and axial load
capacities, therefore they should be closely monitored at the construction site.
c) Non-concentric placement of the SIMCON jacket during construction: Based on
analysis, the effects of routine variations in centering of SIMCON are within established

186
range of the effects of dimensional tolerances on the reinforced concrete column.
d) The effects of location and strength of fiber mat seams: The effects of SIMCON
seams with reduced strength are within the limits established for the effects of dimensional
tolerances on the reinforced concrete column. There are potential problems with seams,
however, including separation of seams due to barreling of jacket and rotation of
unreinforced fractured edges in compression. Therefore, additional research is
recommended.
12. The strength reduction factor, (N), 0.65 given in ACI 318 for reinforced concrete
columns may be used as a minimum for the design of SIMCON jacket. It may not be
unreasonable, however, to use a more conservative strength reduction factor such as 0.60 for
SIMCON jacketed column design considering the uncertainties in end connections and seam
behavior, which need additional research, and the importance of columns in structures,
pending additional research.
13. Based upon the costs assumed in this analysis, the SIMCON jacketing appears to have
a reasonable cost compared to other strengthening alternatives.
14. Considering the technical limitations and possibility of improved moment or axial load
capacity, the SIMCON jacket alternative appears to be economically viable. In particular,
the marginal cost of the additional moment or load capacity may be much lower than several
available alternatives.
7.2 RECOMMENDATIONS

187
One of the goals of this study was to identify the research needs before the SIMCON
jacketing is used routinely for strengthening of reinforced concrete columns. Therefore,
based on analysis, the following needs are identified and prioritized:
1. Design and construction of SIMCON jacket end connections.
2. The behavior of SIMCON seams, separation under tension, and buckling in compression.
3. Thin wall buckling behavior of SIMCON jacket.
4. The strength reduction factor, (N),for the design of SIMCON jacket.
5. Reliable cost data for SIMCON related construction based on field construction work
measurements.
6. Durability related to corrosion of fibers in exposure tests.
188
REFERENCES
Aïtcin, P.-C. (1998), “High-Performance Concrete”, E&FN Spon, London.
American Concrete Institute Manual of Concrete Practice (1990), “Standard Specifications
for Tolerances for Concrete Construction and Materials”, ACI 117-90, Detroit, Michigan.
American Concrete Institute Manual of Concrete Practice (1992), “Guide for Making a
Condition Survey of Concrete in Service”, ACI 201.1R-92, Detroit, Michigan.
American Concrete Institute Manual of Concrete Practice (1992), “Guide to Durable
Concrete”, ACI 201.2R-92, Detroit, Michigan.
American Concrete Institute Manual of Concrete Practice (1991), “Standard Practice for
Selecting Proportions for Normal, Heavyweight, and Mass Concrete”, ACI 211.1-91,
Detroit, Michigan.
American Concrete Institute Manual of Concrete Practice (1980), “Control of Cracking in
Concrete Structures”, ACI 224-80, Detroit, Michigan.

189
American Concrete Institute Manual of Concrete Practice (2002), “Building Code
Requirements for Structural Concrete and Commentary”, ACI 318-02, Detroit, Michigan.
American Concrete Institute Manual of Concrete Practice (1992), “State-of-the-Art Report
on High Strength Concrete”, ACI 363R-92, Detroit, Michigan.
American Concrete Institute Manual of Concrete Practice (1996), “State-of-the-Art Report
on Fiber Reinforced Plastic (FRP) Reinforcement for Concrete Structures”, ACI 440R-96,
Detroit, Michigan.
American Concrete Institute Manual of Concrete Practice (1996), “State-of-the-Art Report
on Fiber Reinforced Concrete”, ACI 544.1R-96, Detroit, Michigan.
American Concrete Institute Manual of Concrete Practice (1993), “Guide for Specifying,
Proportioning, Mixing, Placing, and Finishing Steel Fiber Reinforced Concrete”, ACI
544.3R-93, Detroit, Michigan.
AISC Manual of Steel Construction (1995), “Load and Resistance Factor Design, Volume
II, Connections”, American Institute of Steel Construction, Chicago, Illinois.
Alekseev, S.N., Ivanov, F.M., Modry, S., Schiessel, P. (1993), “Durability of Reinforced

190
Concrete in Aggressive Media”, A.A. Balkema Publishers, Vermont.
Annual Book of American Society for Testing and Materials (ASTM) Standards (2002),
“Standard Specification for Deformed and Plain Billet-Steel Bars for Concrete
Reinforcement”, ASTM A 615/A, v.01.04.
Annual Book of American Society for Testing and Materials (ASTM) Standards (2002),
“Test Method for Compressive Strength of Hydraulic Cement Mortars (Using 2-in. Or 50-
mm Cube Specimens)”, ASTM C 109, v.04.01.
Annual Book of American Society for Testing and Materials (ASTM) Standards (2002),
“Standard Test Method for Microscopical Determination of Parameters of the Air-Void
System in Hardened Concrete”, ASTM C 457, v.04.02.
Annual Book of American Society for Testing and Materials (ASTM) Standards (2002),
“Standard Test Method for Resistance of Concrete to Rapid Freezing and Thawing”,ASTM
C 666, v.04.02.
Annual Book of American Society for Testing and Materials (ASTM) Standards (2002),
“Standard Test Method for Scaling Resistance of Concrete Surfaces Exposed to Deicing
Chemicals”, ASTM C 672, v.04.02.

191
Annual Book of American Society for Testing and Materials (ASTM) Standards (2002),
“Standard Specification for Wire-Cloth Sieves for Testing Purposes”, ASTM E 11, v.04.02.
Balaguru, P., Kendzulak, J. (1987), “Mechanical Properties of Slurry Infiltrated Fiber
Concrete (SIFCON)”, Fiber Reinforced Concrete Properties and Applications, SP-105, edited
by S.P. Shah and G.B. Batson, American Concrete Institute, Michigan, pp.247-268.
Balaguru, P.N., Shah, S.P. (1992), “Fiber Reinforced Cement Composites”, McGraw-Hill,
Inc.
Bayasi, Z. (1995), “Composite Slabs Using Slurry Infiltrated Mat Concrete-SIMCON”, in
High Performance Fiber Reinforced Cement Composites 2 (HPFRCC 2), edited by A.E.
Naaman, H.W. Reinhardt, E & FN Spon, London, UK, pp.300-304.
Biladeou, A., Malhotra, V.M. (1997), “Deicing Salt Scaling Resistance of Concrete
Incorporating Supplementary Cementing Materials: CANMET Research”, in Freeze-Thaw
Durability of Concrete, RILEM Proceedings: 30, edited by J. Marchand, M. Pigeon, and M.J.
Setzer, E & FN Spon, London, UK, pp.121-156.
Chaallal, O., Shahawy, M. (2000-July/August), “Performance of Fiber-Reinforced Polymer-
Wrapped Reinforced Concrete Column under Combined Axial-Flexural Loading”, ACI
192
Structural Journal, pp. 659-668.
Chandler, K.A., Bayliss, D.A. (1985), “Corrosion Protection of Steel Structures”, Elsevier
Science Publishing Co., Inc., New York.
Cook, R.D. (1999), “Advanced Mechanics of Materials”, Prentice Hall, Inc.
Cutshall, B.M., Leming, M.L., Johnston, D.W. (1999-July/August), “Comparison of
Strength and Construction Tolerances in Concrete”, ACI Structural Journal, pp. 491-494.
Darwish, M.N. (2000), “Upgrading Reinforced Concrete Columns by Jacketing with Carbon
Fiber-Reinforced Plastic (CFRP) Sheets”, SP193-34, ACI International Conference on
Repair, Rehabilitation, and Maintenance of Concrete Structures, and Innovations in Design
and Construction, Proceedings, 4th International Conference, Seoul, Korea, 2000, edited by
V.M. Malhotra, American Concrete Institute, Michigan.
Dogan, E., Hill, H., Krstulovic, O.N. (2000), “Suggested Design Guidelines for Seismic
Retrofit with SIMCON and SIFCON”, SP185, High Performance Fiber-Reinforced Concrete
in Infrastructural Repair and Retrofit, edited by O.N. Krstulovic and Z. Bayasi, American
Concrete Institute, Michigan.
193
Hackman, L.E., Farrell, M.B., and Dunham, O.O. (1992-December), “Slurry Infiltrated Mat
Concrete (SIMCON)”, Concrete International, pp. 53-56.
Hollaway, L.C., Leeming, M.B. (1999), “Strengthening of reinforced Concrete Structures
Using Externally-Bonded FRP Composites in Structural and Civil Engineering”, CRC Press,
England.
Hollaway, L.C., Head, P.R. (2001), “Advanced Polymer Composites and Polymers in the
Civil Infrastructure”, Elsevier, Oxford, UK.
Homrich, J., Naaman, A. (1987), “Stress-Strain Properties of SIFCON in Compression”,
Fiber Reinforced Concrete Properties and Applications, SP-105, edited by S.P. Shah and
G.B. Batson, American Concrete Institute, Michigan, pp.283-304.
Johnston, C.D. (1992), “Durability of high early strength silica fume concretes subjected to
accelerated and normal curing”,SP-132, Fly Ash, Silica Fume, Slag, and Natural Pozzolans
in Concrete, American Concrete Institute, Michigan, pp.1167-1187.
Kozak, J. (1991), “Steel-Concrete Structures for Multistorey Buildings”, Elsevier Science
Publishing Co. Inc., New York.
194
Krstulovic-Opara, N., Malak, S. (1995-January/February), “Tensile Behavior of Slurry
Infiltrated Mat Concrete (SIMCON)”, ACI Materials Journal, pp.39-46.
Krstulovic-Opara, N. (1996), “SIMCON-A Novel High Performance Fiber-Mat Reinforced
Cement Composite for repair, retrofit and New Construction”, Materials for the New
Millennium-Proceedings of the Fourth Materials Engineering Conference, ASCE,
Washington, pp. 288-297.
Krstulovic-Opara, N., Al-Shannag, M.J. (1999a), “Slurry Infiltrated Mat Concrete
(SIMCON)-Based Shear Retrofit of Reinforced Concrete Members”, ACI Structural Journal,
pp.105-114.
Krstulovic-Opara, N., Al-Shannag, M.J. (1999b), “Compressive Behavior of Slurry
Infiltrated Mat Concrete”, ACI Materials Journal, pp.367-377.
Krstulovic, O.N., LaFave, J.M., Dogan, E., Uang, C.-M (2000), “Seismic Retrofit with
Discontinuous Slurry Infiltrated Mat Concrete (SIMCON) Jackets”, SP185, High
Performance Fiber-Reinforced Concrete in Infrastructural Repair and Retrofit, edited by O.N.
Krstulovic, and Z. Bayasi, American Concrete Institute, Michigan.
Lankard, D. (May 2001), “Scaling Revisited”, Concrete International, pp 43-49.

195
MacGregor, J.G. (1997), “Reinforced Concrete: Mechanics and Design, 3rd ed.”, Prentice-
Hall, Inc., New Jersey.
Marrs, D.L., Bartos, P.J.M. (1996), “Development and Testing of Self-Compacting Low
Strength Slurries for SIFCON”, Production Methods and Workability of Concrete, edited by
P.J.M. Bartos, D.L. Marrs, and D.J. Cleland, E&FN Spon, London, pp.199-208.
Mehta, P.K., Monteiro, P.J.M. (1993), “Concrete, Structure, Properties, and Materials”,
Prentice Hall.
van Mier, J.G.M., Timmers, G. (1992), “Shear Fracture in Slurry Infiltrated Fibre Concrete
(SIFCON)”, High Performance Fiber Reinforced Cement Composites, E & FN Spon,
London, UK, pp.348-360.
Mondragon, R. (1987), “SIFCON in Compression”, in Fiber Reinforced Concrete Properties
and Applications, SP-105, edited by S.P. Shah and G.B. Batson, American Concrete
Institute, Michigan, pp.269-282.
Naaman, A.E. (1992), “SIFCON: Tailored Properties for Structural Performance”, High
Performance Fiber Reinforced Cement Composites, E & FN Spon, London, UK, pp.18-38.
196
Naaman, A.E., Reinhardt, H.W. (eds.) (1995), “High Performance Fiber Reinforced Cement
Composites 2 (HPFRCC 2)”, E & FN Spon, London, UK, pp.423-442.
Neville, A.M. (1997), “Properties of Concrete”, John Wiley & Sons, Inc., New York.
NSF 95-52 (1995), “Civil Infrastructure Systems: An Integrative Research Program,
Program Announcement and Guidelines”, National Science Foundation, Arlington, VA.
Personal Communication with California Department of Transportation on February 2002.
Park, R., Pauley, T. (1975), “Reinforced Concrete Structures”, John Wiley & Sons, Inc.,
New York.
Pigeon, M., Gagné, R., Banthia, N., and Aïtcin, P.-C. (1991), “Freezing and Thawing Tests
of High-Strength Concretes”, Cement and Concrete Research, 21, pp.844-852.
Sedriks, A.J. (1996), “Corrosion of Stainless Steels, 2nd ed.”, John Wiley & Sons, Inc., New
York.
Teng, J.G., Chen, J.F., Smith, S.T., Lam, L. (2002), “FRP Strengthened RC Structures”, John
Wiley & Sons, Inc., New York.

197
Timoshenko, S., Young, D.H. (1968), “Elements of Strength of Materials, 5th Ed.”, Van
Nostrand Reinhold Co., New York.
Timoshenko, S., Gere, J.M. (1961), “Theory of Elastic Stability, 2nd Ed.”, McGraw-Hill Book
Co., New York.
Troitsky, M.S. (1982), “Tubular Steel Structures-Theory and Design”, The James F. Lincoln
Arc Welding Foundation, Cleveland, Ohio.
Vandergerghe, M.P. (1992), “A Practical Look at SIFCON”, High Performance Fiber
Reinforced Cement Composites, E & FN Spon, London, UK, pp.226-234.
Xanthakos, P.P. (1996), “Bridge Strengthening and Rehabilitation”, Prentice Hall, New
Jersey.
Yuping, S., Kenji, S. (2000), “Simplified Design Method for Ultimate Capacities of
Circularly Confined High-Strength Concrete Columns”, SP193-34, ACI International
Conference on Repair, Rehabilitation, and Maintenance of Concrete Structures, and
Innovations in Design and Construction, Proceedings, 4th International Conference, Seoul,
Korea, 2000, edited by V.M. Malhotra, American Concrete Institute, Detroit.
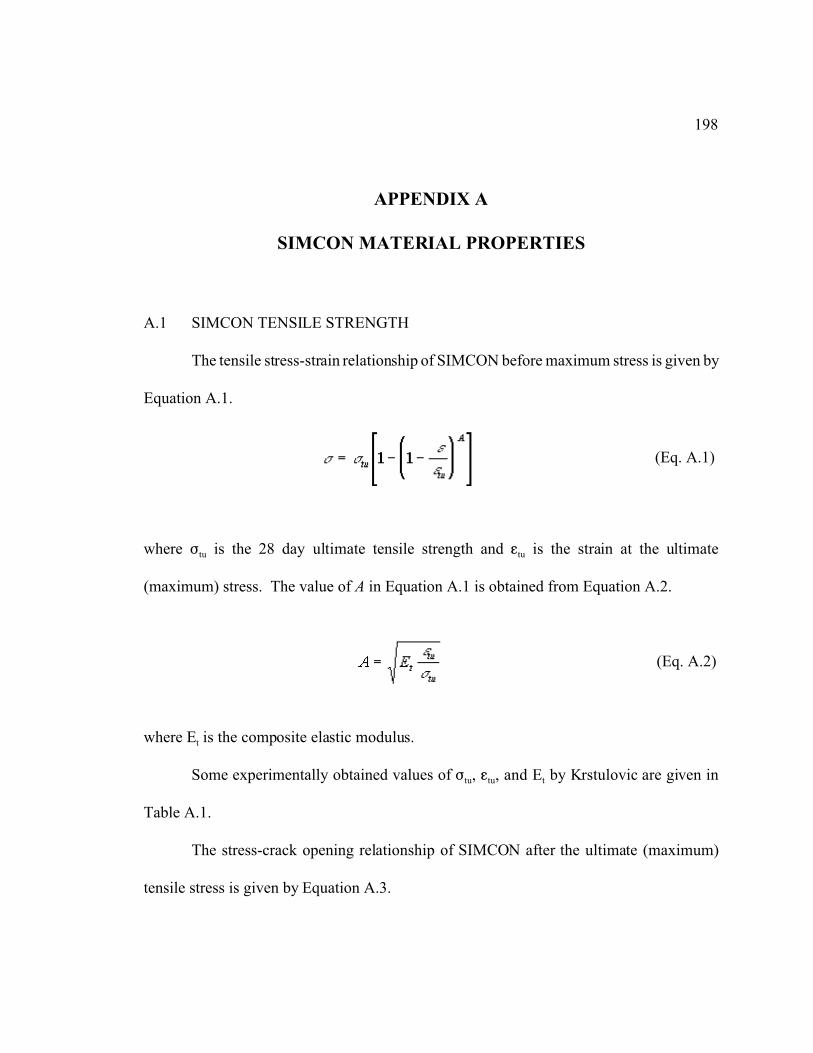
198
(Eq. A.1)
(Eq. A.2)
APPENDIX A
SIMCON MATERIAL PROPERTIES
A.1 SIMCON TENSILE STRENGTH
The tensile stress-strain relationship of SIMCON before maximum stress is given by
Equation A.1.
where Ftu is the 28 day ultimate tensile strength and gtu is the strain at the ultimate
(maximum) stress. The value of A in Equation A.1 is obtained from Equation A.2.
where Et is the composite elastic modulus.
Some experimentally obtained values of Ftu, gtu, and Et by Krstulovic are given in
Table A.1.
The stress-crack opening relationship of SIMCON after the ultimate (maximum)
tensile stress is given by Equation A.3.
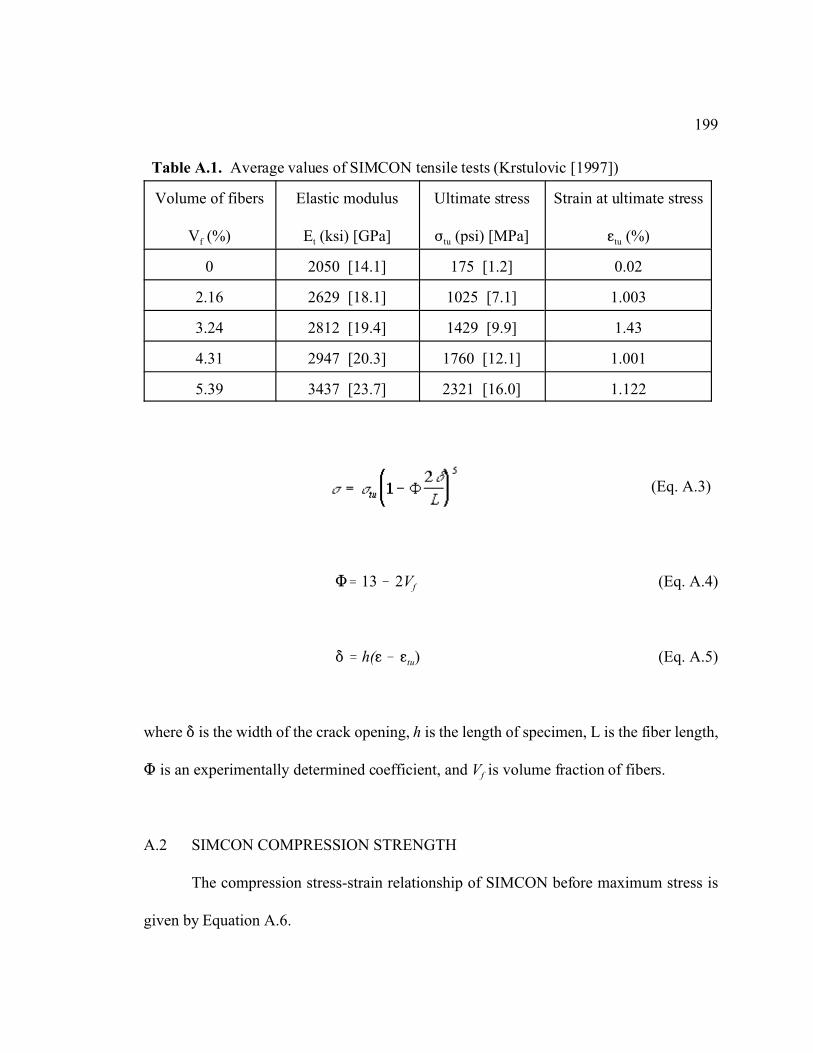
199
(Eq. A.3)
Table A.1. Average values of SIMCON tensile tests (Krstulovic [1997])
Volume of fibers
Vf (%)
Elastic modulus
Et (ksi) [GPa]
Ultimate stress
Ftu (psi) [MPa]
Strain at ultimate stress
gtu (%)
0 2050 [14.1] 175 [1.2] 0.02
2.16 2629 [18.1] 1025 [7.1] 1.003
3.24 2812 [19.4] 1429 [9.9] 1.43
4.31 2947 [20.3] 1760 [12.1] 1.001
5.39 3437 [23.7] 2321 [16.0] 1.122
M' 13 ! 2Vf (Eq. A.4)
* ' h(g ! gtu) (Eq. A.5)
where * is the width of the crack opening, h is the length of specimen, L is the fiber length,
M is an experimentally determined coefficient, and Vf is volume fraction of fibers.
A.2 SIMCON COMPRESSION STRENGTH
The compression stress-strain relationship of SIMCON before maximum stress is
given by Equation A.6.
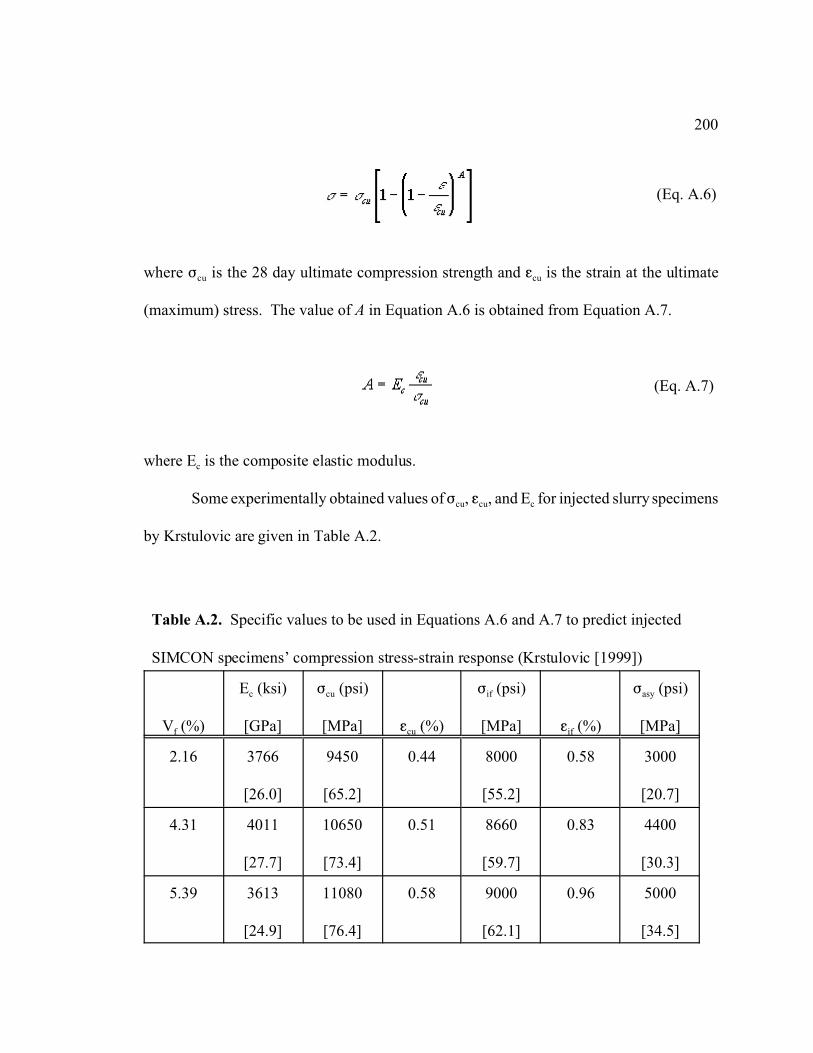
200
(Eq. A.6)
(Eq. A.7)
where Fcu is the 28 day ultimate compression strength and gcu is the strain at the ultimate
(maximum) stress. The value of A in Equation A.6 is obtained from Equation A.7.
where Ec is the composite elastic modulus.
Some experimentally obtained values of Fcu, gcu, and Ec for injected slurry specimens
by Krstulovic are given in Table A.2.
Table A.2. Specific values to be used in Equations A.6 and A.7 to predict injected
SIMCON specimens’ compression stress-strain response (Krstulovic [1999])
Vf (%)
Ec (ksi)
[GPa]
Fcu (psi)
[MPa] gcu (%)
Fif (psi)
[MPa] gif (%)
Fasy (psi)
[MPa]
2.16 3766
[26.0]
9450
[65.2]
0.44 8000
[55.2]
0.58 3000
[20.7]
4.31 4011
[27.7]
10650
[73.4]
0.51 8660
[59.7]
0.83 4400
[30.3]
5.39 3613
[24.9]
11080
[76.4]
0.58 9000
[62.1]
0.96 5000
[34.5]

201
(Eq. A.8)
(Eq. A.9)
(Eq. A.10)
Fif and gif in Table A.2 are the stress and strain at the inflection point on the
descending portion of stress-strain relation. Fasy in Table A.2 is the asymptotic value of the
compressive stress in the postpeak region.
The stress-strain relationship of SIMCON after the ultimate (maximum) compressive
stress is given by Equation A.8, A.9, and A.10.

202
APPENDIX B
SIMCON SCALING TEST SPECIMENS

203
Fi~re B.2 Spec1men A 12CR -6 aft er scaling r eslSlanc e Ie sl
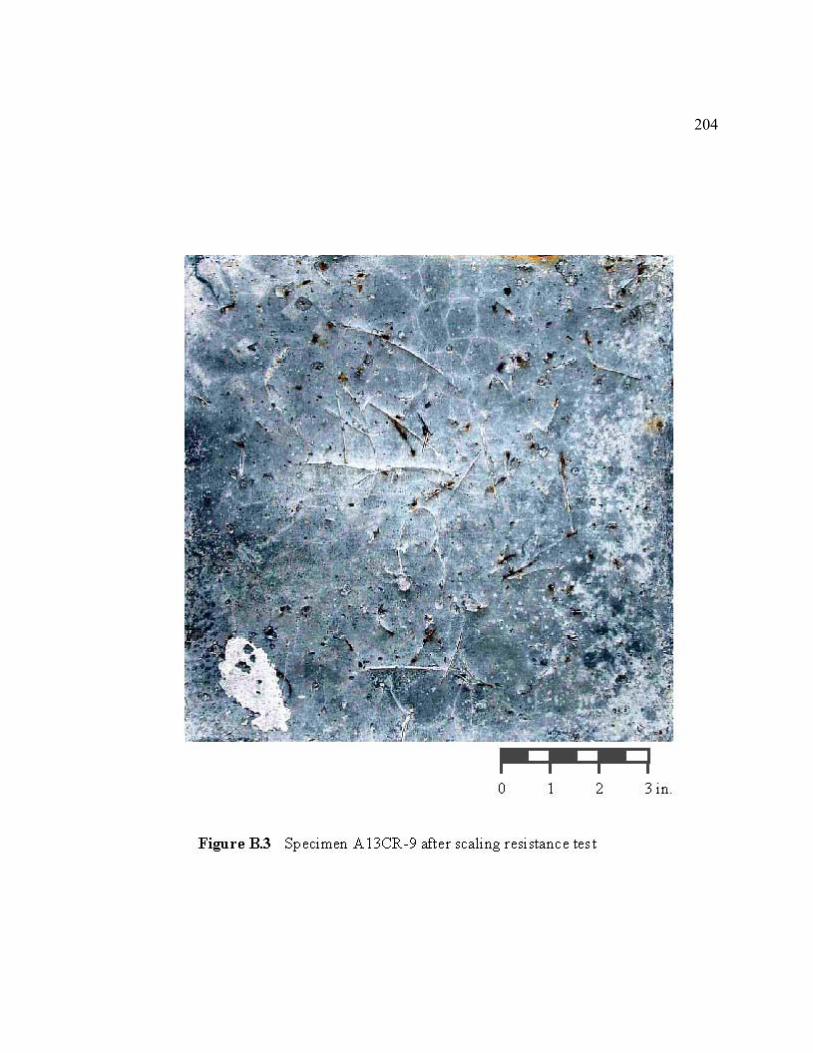
204
Fi~re B.3 Sp ee1men A 13CR -9 after scaling r eslSlane e les I
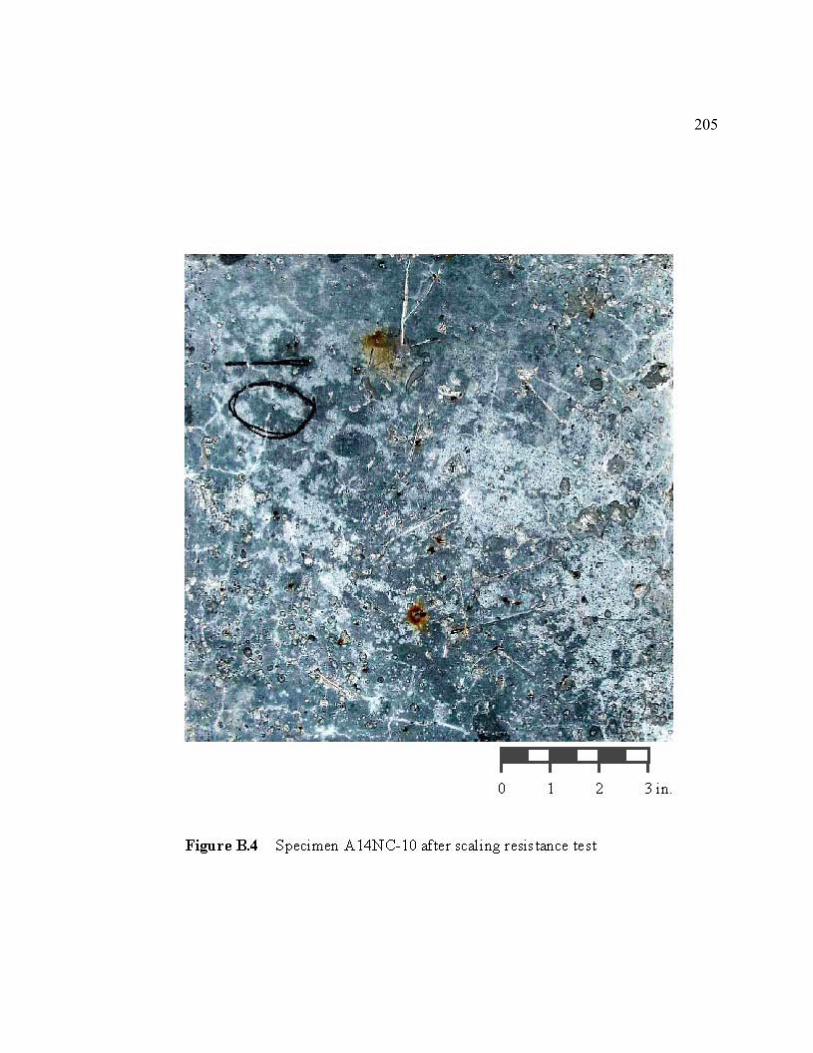
205
Fi~re B.4 Spec1men A 14NC-l0 after scaling r eSiStance te st
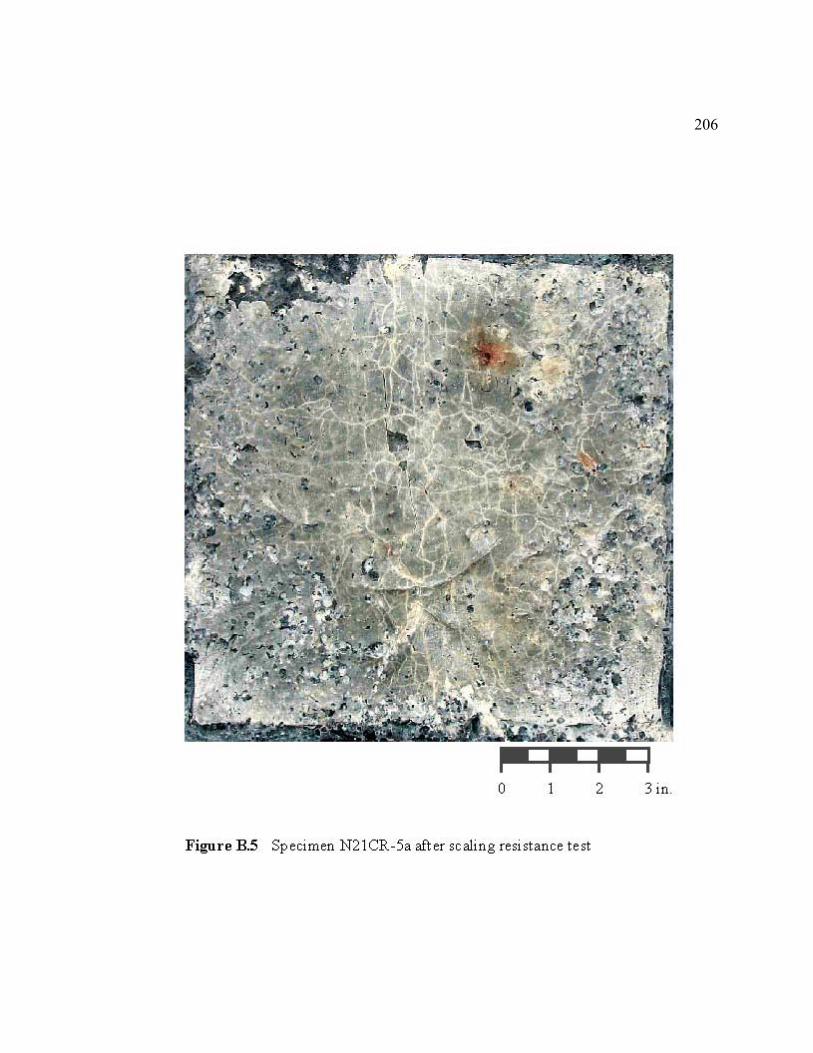
206
Fi~re B.5 Sp ec1men N21CR-5a aft er scaling reslStance t est
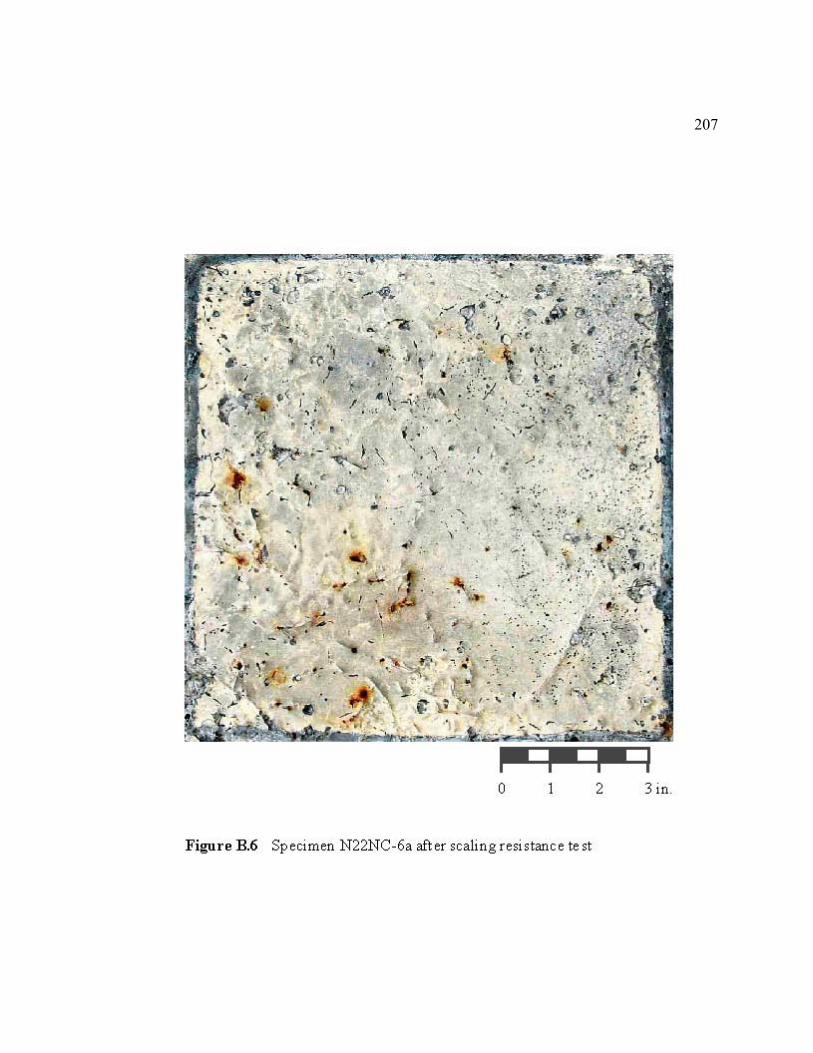
207
o 1 2
Fi~re B.6 Sp eC1m en N22NC-6a aft er scaling r eS! slane e Ie st
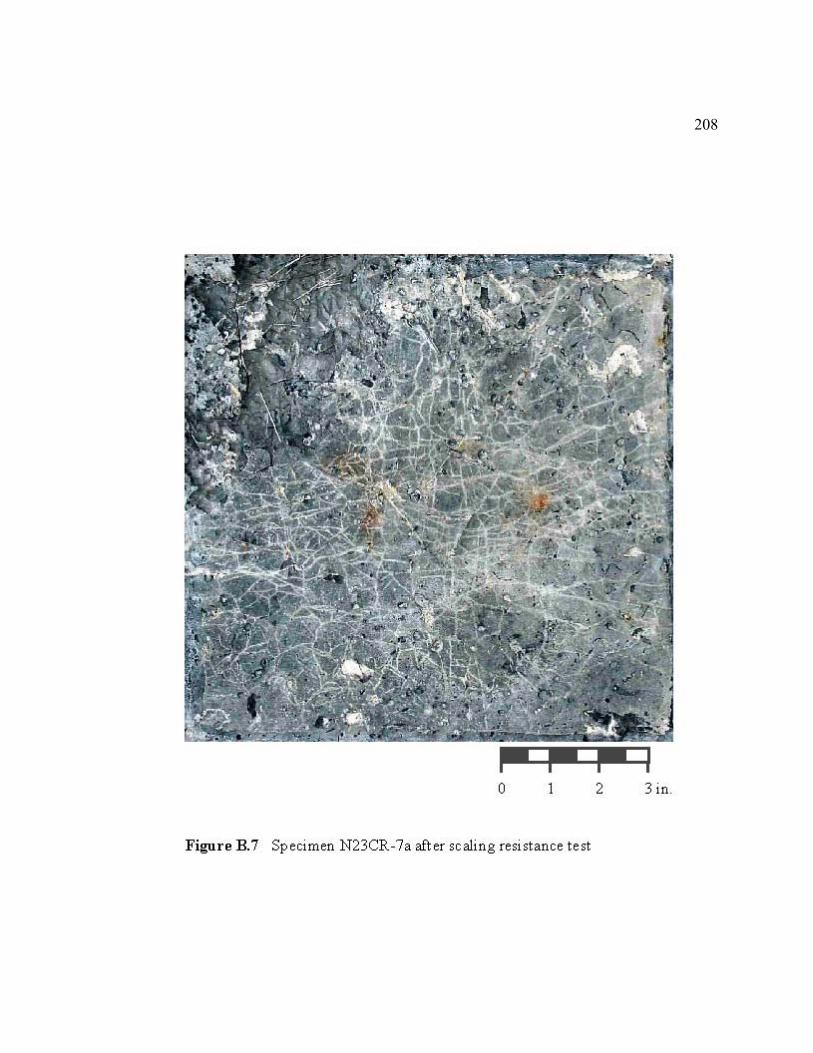
208
Fi~re B.7 Sp ec1men N23CR-7a aft er scaling reslStance t est

209
Fi~re B.8 Spec1men N24NC-8a afl er scaling r eslSlanc e Ie sl

210
APPENDIX C
RESULTS OF EVALUATION OF DESIGN
AND CONSTRUCTION FACTORS
Table C.1 The effect of reinforcement placement on maximum moment capacities of reinforced concrete sections
Section designation1: no change2: d-1/2 in.
Mo, max
(kips.ft) Mo, max,2 / Mo, max,1
SQ01 1 151.54
SQ02 1 294.21
SQ03 1 151.48
SQ04 1 289.18
CIR01 1 151.44
CIR02 1 271.75
BI01 1 156.41
BI02 1 259.27
BI03 1 154.18
BI04 1 259.48
SQ01 2 145.36 0.959
SQ02 2 281.51 0.957
SQ03 2 142.37 0.940
SQ04 2 267.81 0.926
CIR01 2 147.11 0.971
CIR02 2 256.63 0.944
BI01 2 145.80 0.932
BI02 2 240.70 0.928
BI03 2 143.25 0.929
BI04 2 240.93 0.929
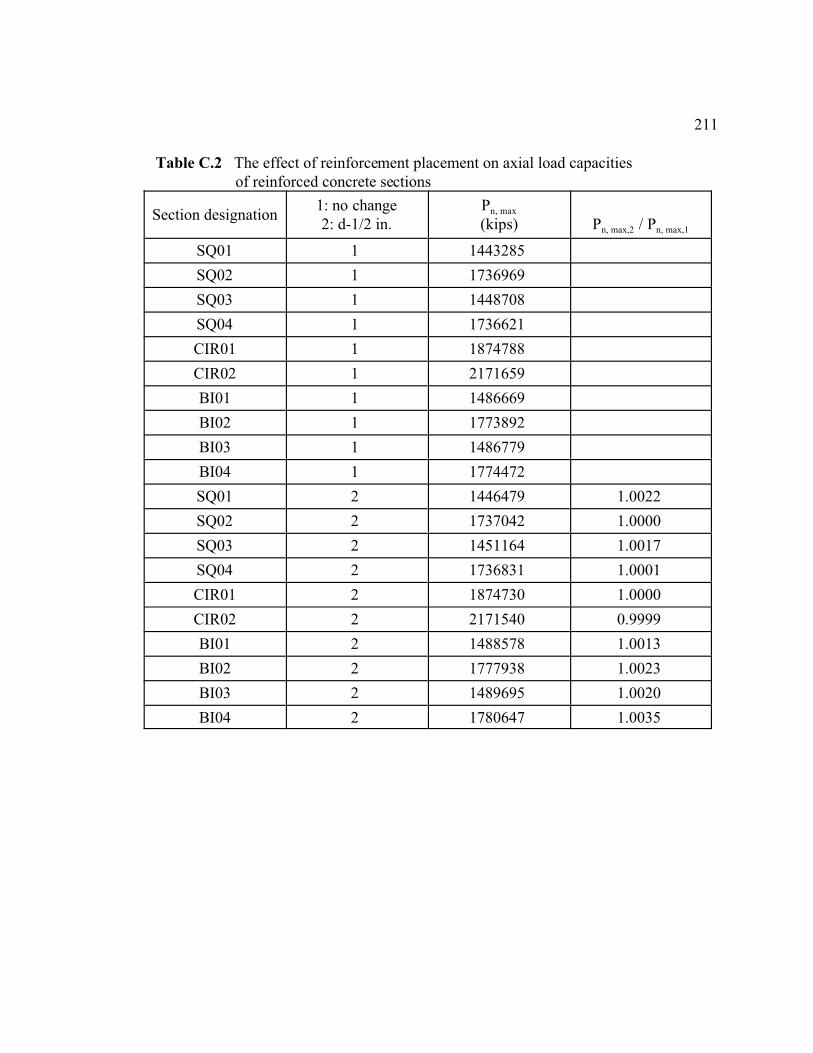
211
Table C.2 The effect of reinforcement placement on axial load capacities of reinforced concrete sections
Section designation1: no change2: d-1/2 in.
Pn, max
(kips) Pn, max,2 / Pn, max,1
SQ01 1 1443285
SQ02 1 1736969
SQ03 1 1448708
SQ04 1 1736621
CIR01 1 1874788
CIR02 1 2171659
BI01 1 1486669
BI02 1 1773892
BI03 1 1486779
BI04 1 1774472
SQ01 2 1446479 1.0022
SQ02 2 1737042 1.0000
SQ03 2 1451164 1.0017
SQ04 2 1736831 1.0001
CIR01 2 1874730 1.0000
CIR02 2 2171540 0.9999
BI01 2 1488578 1.0013
BI02 2 1777938 1.0023
BI03 2 1489695 1.0020
BI04 2 1780647 1.0035
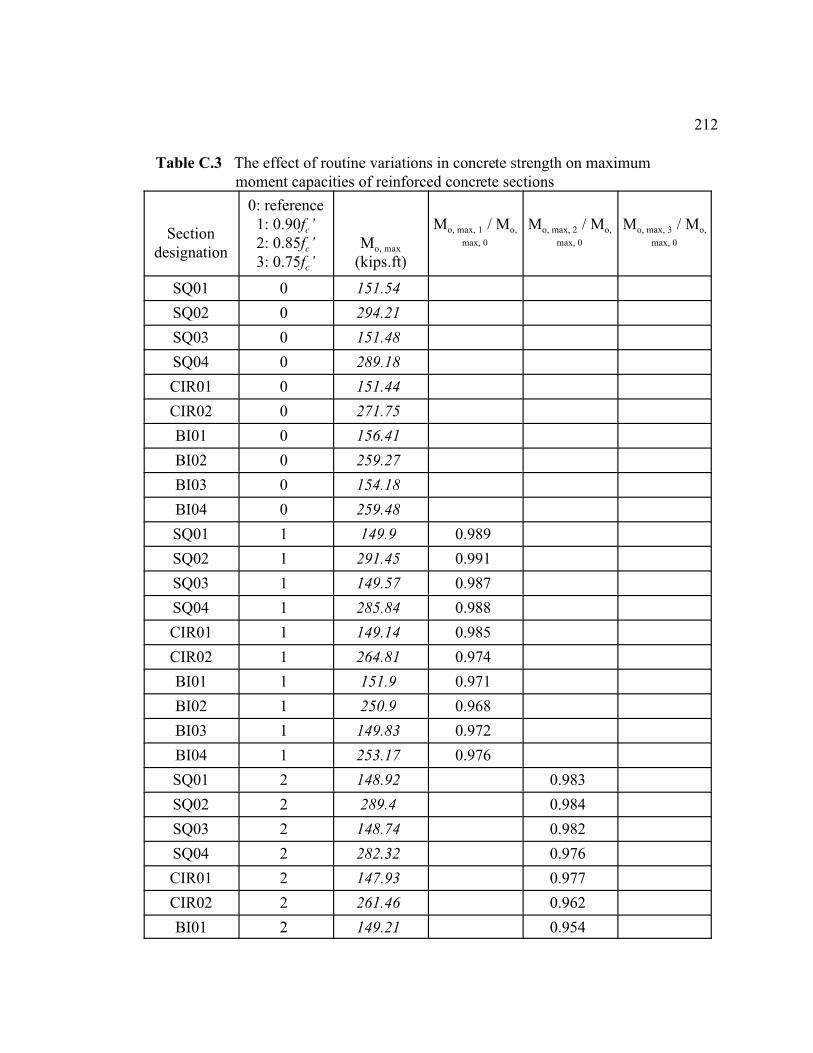
212
Table C.3 The effect of routine variations in concrete strength on maximum moment capacities of reinforced concrete sections
Sectiondesignation
0: reference1: 0.90fc’2: 0.85fc’3: 0.75fc’
Mo, max
(kips.ft)
Mo, max, 1 / Mo,
max, 0
Mo, max, 2 / Mo,
max, 0
Mo, max, 3 / Mo,
max, 0
SQ01 0 151.54
SQ02 0 294.21
SQ03 0 151.48
SQ04 0 289.18
CIR01 0 151.44
CIR02 0 271.75
BI01 0 156.41
BI02 0 259.27
BI03 0 154.18
BI04 0 259.48
SQ01 1 149.9 0.989
SQ02 1 291.45 0.991
SQ03 1 149.57 0.987
SQ04 1 285.84 0.988
CIR01 1 149.14 0.985
CIR02 1 264.81 0.974
BI01 1 151.9 0.971
BI02 1 250.9 0.968
BI03 1 149.83 0.972
BI04 1 253.17 0.976
SQ01 2 148.92 0.983
SQ02 2 289.4 0.984
SQ03 2 148.74 0.982
SQ04 2 282.32 0.976
CIR01 2 147.93 0.977
CIR02 2 261.46 0.962
BI01 2 149.21 0.954

213
Sectiondesignation
0: reference1: 0.90fc’2: 0.85fc’3: 0.75fc’
Mo, max
(kips.ft)
Mo, max, 1 / Mo,
max, 0
Mo, max, 2 / Mo,
max, 0
Mo, max, 3 / Mo,
max, 0
BI02 2 246.94 0.952
BI03 2 147.21 0.955
BI04 2 249.49 0.962
SQ01 3 146.99 0.970
SQ02 3 286.72 0.975
SQ03 3 147.76 0.975
SQ04 3 274.16 0.948
CIR01 3 145.7 0.962
CIR02 3 254.31 0.936
BI01 3 144.06 0.921
BI02 3 238.09 0.918
BI03 3 142.58 0.925
BI04 3 239.34 0.922
Table C.4 The effect of routine variations in concrete strength on axial load capacities of reinforced concrete sections
Sectiondesignation
0: reference1: 0.90fc’2: 0.85fc’3: 0.75fc’
Pn, max
(kips)
Pn, max, 1 /Pn, max, 0
Pn, max, 2 /Pn, max, 0
Pn, max, 3 /Pn, max, 0
SQ01 0 1443285
SQ02 0 1736969
SQ03 0 1448708
SQ04 0 1736621
CIR01 0 1464783
CIR02 0 1747226
BI01 0 1486669
BI02 0 1773892

214
Sectiondesignation
0: reference1: 0.90fc’2: 0.85fc’3: 0.75fc’
Pn, max
(kips)
Pn, max, 1 /Pn, max, 0
Pn, max, 2 /Pn, max, 0
Pn, max, 3 /Pn, max, 0
BI03 0 1486779
BI04 0 1774472
SQ01 1 1325428 0.918
SQ02 1 1624232 0.935
SQ03 1 1330890 0.919
SQ04 1 1623919 0.935
CIR01 1 1345750 0.919
CIR02 1 1630742 0.933
BI01 1 1365939 0.919
BI02 1 1655741 0.933
BI03 1 1366052 0.919
BI04 1 1656325 0.933
SQ01 2 1267038 0.878
SQ02 2 1567864 0.903
SQ03 2 1271982 0.878
SQ04 2 1567568 0.903
CIR01 2 1286234 0.878
CIR02 2 1572500 0.900
BI01 2 1305574 0.878
BI02 2 1596665 0.900
BI03 2 1305688 0.878
BI04 2 1597252 0.900
SQ01 3 1151857 0.798
SQ02 3 1455127 0.838
SQ03 3 1154164 0.797
SQ04 3 1454866 0.838
CIR01 3 1167201 0.797
CIR02 3 1458043 0.834
BI01 3 1184845 0.797
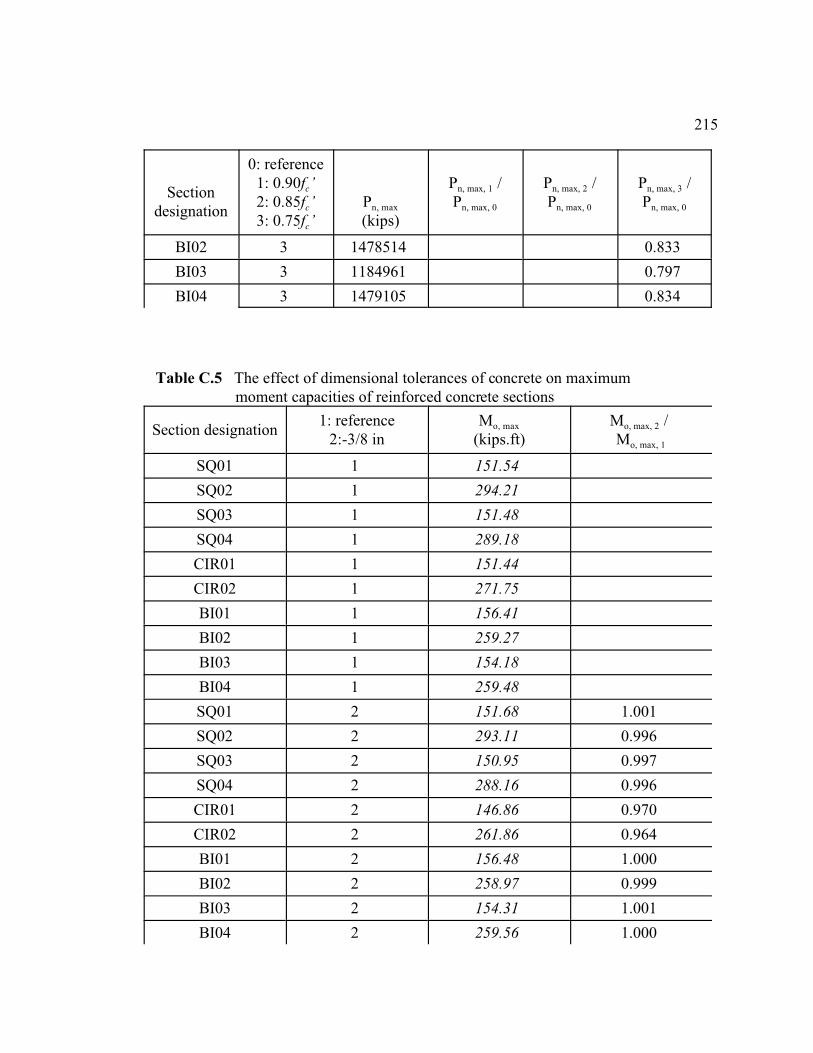
215
Sectiondesignation
0: reference1: 0.90fc’2: 0.85fc’3: 0.75fc’
Pn, max
(kips)
Pn, max, 1 /Pn, max, 0
Pn, max, 2 /Pn, max, 0
Pn, max, 3 /Pn, max, 0
BI02 3 1478514 0.833
BI03 3 1184961 0.797
BI04 3 1479105 0.834
Table C.5 The effect of dimensional tolerances of concrete on maximum moment capacities of reinforced concrete sections
Section designation1: reference
2:-3/8 inMo, max
(kips.ft)Mo, max, 2 / Mo, max, 1
SQ01 1 151.54
SQ02 1 294.21
SQ03 1 151.48
SQ04 1 289.18
CIR01 1 151.44
CIR02 1 271.75
BI01 1 156.41
BI02 1 259.27
BI03 1 154.18
BI04 1 259.48
SQ01 2 151.68 1.001
SQ02 2 293.11 0.996
SQ03 2 150.95 0.997
SQ04 2 288.16 0.996
CIR01 2 146.86 0.970
CIR02 2 261.86 0.964
BI01 2 156.48 1.000
BI02 2 258.97 0.999
BI03 2 154.31 1.001
BI04 2 259.56 1.000

216
Table C.6 The effect of dimensional tolerances of concrete on axial load capacities of reinforced concrete sections
Section designation1: reference
2:-3/8 inPn, max
(kips)Pn, max, 1 /Pn, max, 0
SQ01 1 1443285
SQ02 1 1736969
SQ03 1 1448708
SQ04 1 1736621
CIR01 1 1464783
CIR02 1 1747226
BI01 1 1486669
BI02 1 1773892
BI03 1 1486779
BI04 1 1774472
SQ01 2 1385577 0.960
SQ02 2 1682518 0.969
SQ03 2 1391509 0.961
SQ04 2 1682153 0.969
CIR01 2 1415069 0.966
CIR02 2 1697728 0.972
BI01 2 1428414 0.961
BI02 2 1714605 0.967
BI03 2 1428392 0.961
BI04 2 1714557 0.966
Table C.7 The increase in maximum moment capacities of reinforced concrete sections provided by the SIMCON jacket
Section designation0: rc only
1: bonded SIMCONMo, max (kips.ft) Mo, max,1 / Mo, max,0
SQ01 0 168
SQ02 0 309
SQ03 0 163
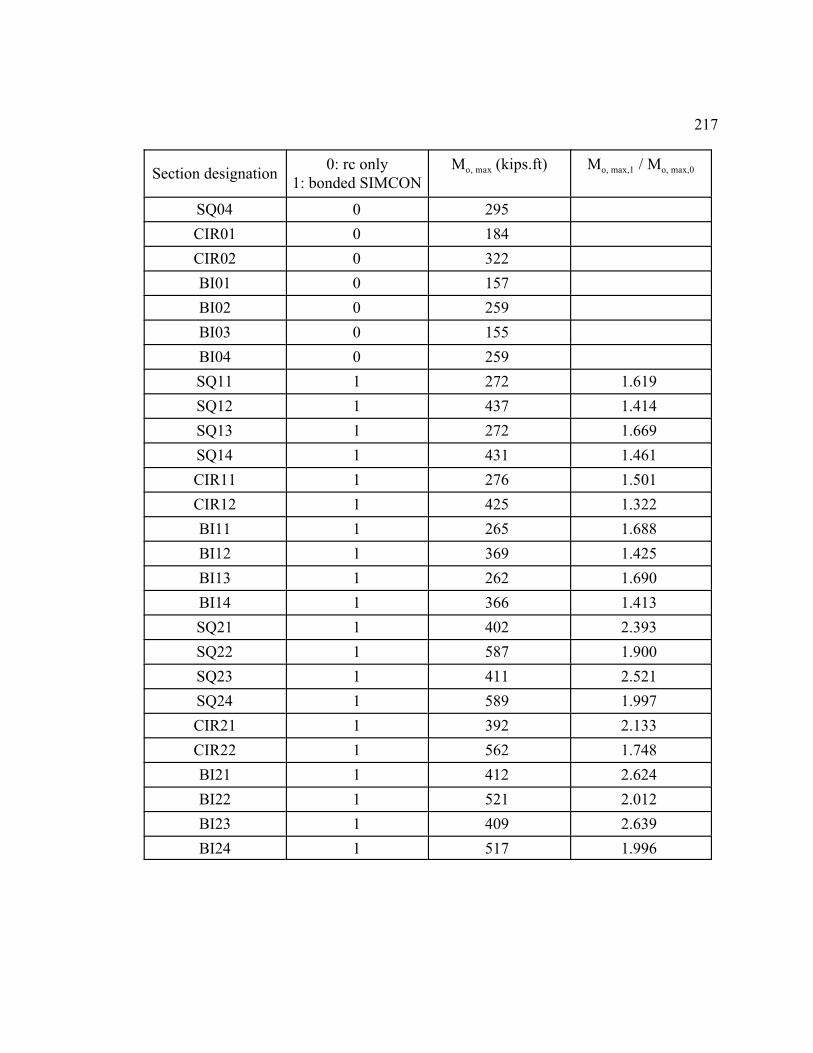
217
Section designation0: rc only
1: bonded SIMCONMo, max (kips.ft) Mo, max,1 / Mo, max,0
SQ04 0 295
CIR01 0 184
CIR02 0 322
BI01 0 157
BI02 0 259
BI03 0 155
BI04 0 259
SQ11 1 272 1.619
SQ12 1 437 1.414
SQ13 1 272 1.669
SQ14 1 431 1.461
CIR11 1 276 1.501
CIR12 1 425 1.322
BI11 1 265 1.688
BI12 1 369 1.425
BI13 1 262 1.690
BI14 1 366 1.413
SQ21 1 402 2.393
SQ22 1 587 1.900
SQ23 1 411 2.521
SQ24 1 589 1.997
CIR21 1 392 2.133
CIR22 1 562 1.748
BI21 1 412 2.624
BI22 1 521 2.012
BI23 1 409 2.639
BI24 1 517 1.996

218
Table C.8 The increase in axial load capacities of reinforced concrete sections provided by the SIMCON jacket
Section designation0: rc only
1: bonded SIMCONPn, max
(kips) Pn, max,1 / Pn, max,0
SQ01 0 1443285
SQ02 0 1736969
SQ03 0 1448708
SQ04 0 1736621
CIR01 0 1464783
CIR02 0 1747226
BI01 0 1486669
BI02 0 1773892
BI03 0 1486779
BI04 0 1774472
SQ11 1 1928317 1.336
SQ12 1 2225476 1.281
SQ13 1 1928139 1.331
SQ14 1 2225128 1.281
CIR11 1 1874788 1.280
CIR12 1 2171659 1.243
BI11 1 1942984 1.307
BI12 1 2239726 1.263
BI13 1 1942974 1.307
BI14 1 2239706 1.262
SQ21 1 2482656 1.720
SQ22 1 2780458 1.601
SQ23 1 2482556 1.714
SQ24 1 2780262 1.601
CIR21 1 2350755 1.605
CIR22 1 2648395 1.516
BI21 1 2492410 1.677
BI22 1 2789978 1.573
BI23 1 2492405 1.676
BI24 1 2789967 1.572

219
Table C.9 The effect of bonding of SIMCON jacket in maximum moment capacities
Section designation 1: bonded; 2: unbonded Mo, max (kips.ft) Mo, max,2 / Mo, max,1
SQ11 1 272
SQ12 1 437
SQ13 1 272
SQ14 1 431
CIR11 1 276
CIR12 1 425
BI11 1 265
BI12 1 369
BI13 1 262
BI14 1 366
SQ21 1 402
SQ22 1 587
SQ23 1 411
SQ24 1 589
CIR21 1 392
CIR22 1 562
BI21 1 412
BI22 1 521
BI23 1 409
BI24 1 517
SQ11 2 230 0.846
SQ12 2 381 0.872
SQ13 2 238 0.876
SQ14 2 358 0.830
CIR11 2 273 0.991
CIR12 2 411 0.967
BI11 2 256 0.966
BI12 2 350 0.948
BI13 2 254 0.970
BI14 2 349 0.954
SQ21 2 355 0.883
SQ22 2 495 0.844
SQ23 2 350 0.852

220
Section designation 1: bonded; 2: unbonded Mo, max (kips.ft) Mo, max,2 / Mo, max,1
SQ24 2 469 0.796
CIR21 2 385 0.982
CIR22 2 523 0.931
BI21 2 387 0.939
BI22 2 471 0.904
BI23 2 385 0.941
BI24 2 469 0.908
Table C.10 The effect of existing load on maximum moment capacities
Sectiondesignation
existing strain:0: 0%; 1: 0.03%;2: 0.06%; 3: 0.1%
Mo, max
(kips.ft)Mo, max,1 / Mo, max,0
Mo, max,2 / Mo, max,0
Mo, max,3 / Mo, max,0
SQ11 0 272
SQ12 0 437
SQ13 0 272
SQ14 0 431
CIR11 0 276
CIR12 0 425
BI11 0 265
BI12 0 369
BI13 0 262
BI14 0 366
SQ11 1 260 0.96
SQ12 1 412 0.94
SQ13 1 264 0.97
SQ14 1 416 0.96
CIR11 1 249 0.90
CIR12 1 378 0.89
BI11 1 260 0.98
BI12 1 365 0.99
BI13 1 258 0.98
BI14 1 362 0.99
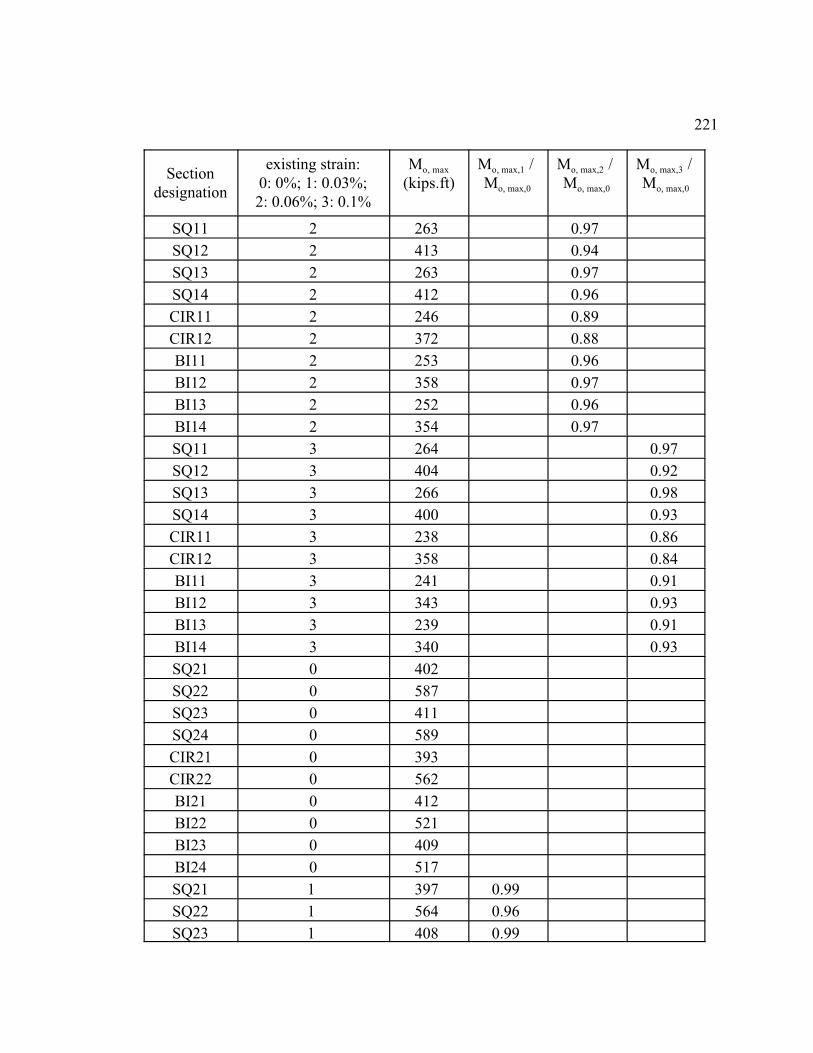
221
Sectiondesignation
existing strain:0: 0%; 1: 0.03%;2: 0.06%; 3: 0.1%
Mo, max
(kips.ft)Mo, max,1 / Mo, max,0
Mo, max,2 / Mo, max,0
Mo, max,3 / Mo, max,0
SQ11 2 263 0.97
SQ12 2 413 0.94
SQ13 2 263 0.97
SQ14 2 412 0.96
CIR11 2 246 0.89
CIR12 2 372 0.88
BI11 2 253 0.96
BI12 2 358 0.97
BI13 2 252 0.96
BI14 2 354 0.97
SQ11 3 264 0.97
SQ12 3 404 0.92
SQ13 3 266 0.98
SQ14 3 400 0.93
CIR11 3 238 0.86
CIR12 3 358 0.84
BI11 3 241 0.91
BI12 3 343 0.93
BI13 3 239 0.91
BI14 3 340 0.93
SQ21 0 402
SQ22 0 587
SQ23 0 411
SQ24 0 589
CIR21 0 393
CIR22 0 562
BI21 0 412
BI22 0 521
BI23 0 409
BI24 0 517
SQ21 1 397 0.99
SQ22 1 564 0.96
SQ23 1 408 0.99
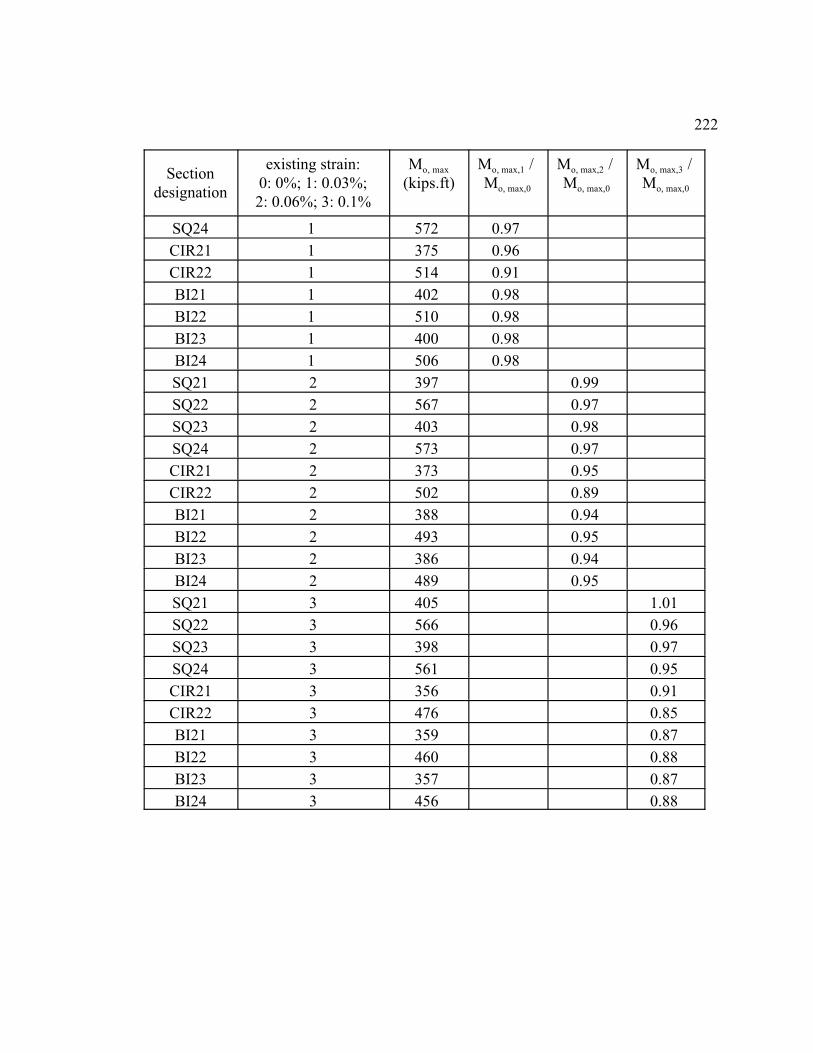
222
Sectiondesignation
existing strain:0: 0%; 1: 0.03%;2: 0.06%; 3: 0.1%
Mo, max
(kips.ft)Mo, max,1 / Mo, max,0
Mo, max,2 / Mo, max,0
Mo, max,3 / Mo, max,0
SQ24 1 572 0.97
CIR21 1 375 0.96
CIR22 1 514 0.91
BI21 1 402 0.98
BI22 1 510 0.98
BI23 1 400 0.98
BI24 1 506 0.98
SQ21 2 397 0.99
SQ22 2 567 0.97
SQ23 2 403 0.98
SQ24 2 573 0.97
CIR21 2 373 0.95
CIR22 2 502 0.89
BI21 2 388 0.94
BI22 2 493 0.95
BI23 2 386 0.94
BI24 2 489 0.95
SQ21 3 405 1.01
SQ22 3 566 0.96
SQ23 3 398 0.97
SQ24 3 561 0.95
CIR21 3 356 0.91
CIR22 3 476 0.85
BI21 3 359 0.87
BI22 3 460 0.88
BI23 3 357 0.87
BI24 3 456 0.88

223
Table C.11 The effect of existing load on axial load capacities
Sectiondesignation
existing strain:0: 0%; 1: 0.03%;2: 0.06%; 3: 0.1%
Pn, max
(kips)Pn, max,1 / Pn, max,0
Pn, max,2 / Pn, max,0
Pn, max,3 / Pn, max,0
SQ11 0 1928317
SQ12 0 2225476
SQ13 0 1928139
SQ14 0 2225128
CIR11 0 1874788
CIR12 0 2171659
BI11 0 1942984
BI12 0 2239726
BI13 0 1942974
BI14 0 2239706
SQ11 1 1903681 0.987
SQ12 1 2200841 0.989
SQ13 1 1903504 0.987
SQ14 1 2200493 0.989
CIR11 1 1852992 0.988
CIR12 1 1818409 0.837
BI11 1 1918096 0.987
BI12 1 2214838 0.989
BI13 1 1918086 0.987
BI14 1 2214818 0.989
SQ11 2 1864565 0.967
SQ12 2 2161724 0.971
SQ13 2 1864388 0.967
SQ14 2 2161376 0.971
CIR11 2 2115280 1.128
CIR12 2 2052648 0.945
BI11 2 1878636 0.967
BI12 2 2175378 0.971
BI13 2 1878626 0.967
BI14 2 2175358 0.971
SQ11 3 1793647 0.930
SQ12 3 2090807 0.939
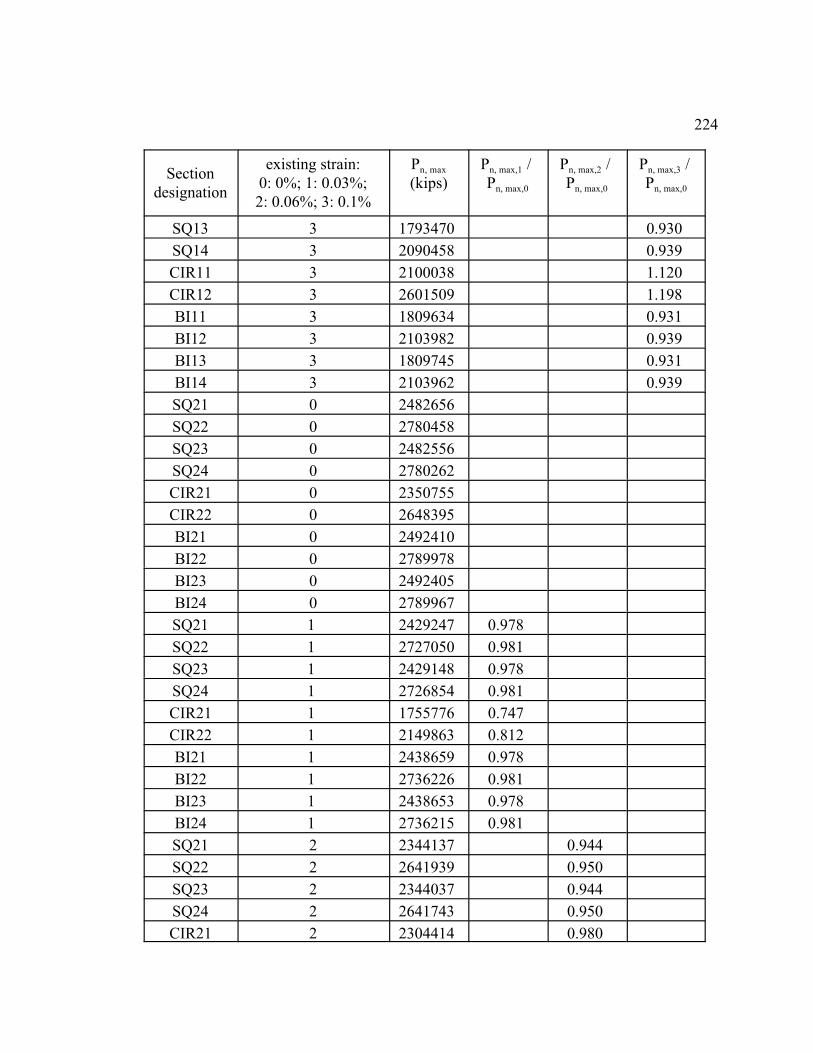
224
Sectiondesignation
existing strain:0: 0%; 1: 0.03%;2: 0.06%; 3: 0.1%
Pn, max
(kips)Pn, max,1 / Pn, max,0
Pn, max,2 / Pn, max,0
Pn, max,3 / Pn, max,0
SQ13 3 1793470 0.930
SQ14 3 2090458 0.939
CIR11 3 2100038 1.120
CIR12 3 2601509 1.198
BI11 3 1809634 0.931
BI12 3 2103982 0.939
BI13 3 1809745 0.931
BI14 3 2103962 0.939
SQ21 0 2482656
SQ22 0 2780458
SQ23 0 2482556
SQ24 0 2780262
CIR21 0 2350755
CIR22 0 2648395
BI21 0 2492410
BI22 0 2789978
BI23 0 2492405
BI24 0 2789967
SQ21 1 2429247 0.978
SQ22 1 2727050 0.981
SQ23 1 2429148 0.978
SQ24 1 2726854 0.981
CIR21 1 1755776 0.747
CIR22 1 2149863 0.812
BI21 1 2438659 0.978
BI22 1 2736226 0.981
BI23 1 2438653 0.978
BI24 1 2736215 0.981
SQ21 2 2344137 0.944
SQ22 2 2641939 0.950
SQ23 2 2344037 0.944
SQ24 2 2641743 0.950
CIR21 2 2304414 0.980

225
Sectiondesignation
existing strain:0: 0%; 1: 0.03%;2: 0.06%; 3: 0.1%
Pn, max
(kips)Pn, max,1 / Pn, max,0
Pn, max,2 / Pn, max,0
Pn, max,3 / Pn, max,0
CIR22 2 2231727 0.843
BI21 2 2354460 0.945
BI22 2 2651202 0.950
BI23 2 2354450 0.945
BI24 2 2651182 0.950
SQ21 3 2189071 0.882
SQ22 3 2486873 0.894
SQ23 3 2188971 0.882
SQ24 3 2486677 0.894
CIR21 3 2528598 1.076
CIR22 3 2396910 0.905
BI21 3 2203400 0.884
BI22 3 2500142 0.896
BI23 3 2203391 0.884
BI24 3 2500122 0.896
Table C.12 The effect of routine strength variations of SIMCON on maximum moment capacities
Sectiondesignation
strength:0: fc’; 1: 0.90 fc’;
2: 0.85 fc’; 3: 0.75 fc’
Mo, max
(kips.ft)Mo, max,1 / Mo, max,0
Mo, max,2 / Mo, max,0
Mo, max,3 / Mo, max,0
SQ11 0 272
SQ12 0 437
SQ13 0 272
SQ14 0 431
CIR11 0 276
CIR12 0 425
BI11 0 265
BI12 0 369
BI13 0 262
BI14 0 366
SQ11 1 248 0.96

226
Sectiondesignation
strength:0: fc’; 1: 0.90 fc’;
2: 0.85 fc’; 3: 0.75 fc’
Mo, max
(kips.ft)Mo, max,1 / Mo, max,0
Mo, max,2 / Mo, max,0
Mo, max,3 / Mo, max,0
SQ12 1 400 0.97
SQ13 1 250 0.95
SQ14 1 406 0.97
CIR11 1 241 0.96
CIR12 1 373 0.98
BI11 1 255 0.97
BI12 1 361 0.98
BI13 1 253 0.97
BI14 1 358 0.98
SQ11 2 240 0.93
SQ12 2 393 0.95
SQ13 2 244 0.92
SQ14 2 400 0.96
CIR11 2 235 0.93
CIR12 2 368 0.96
BI11 2 251 0.95
BI12 2 357 0.97
BI13 2 248 0.95
BI14 2 353 0.96
SQ11 3 229 0.88
SQ12 3 380 0.92
SQ13 3 232 0.88
SQ14 3 387 0.93
CIR11 3 224 0.89
CIR12 3 359 0.94
BI11 3 241 0.92
BI12 3 348 0.94
BI13 3 239 0.91
BI14 3 345 0.94
SQ21 0 402
SQ22 0 587
SQ23 0 411
SQ24 0 589

227
Sectiondesignation
strength:0: fc’; 1: 0.90 fc’;
2: 0.85 fc’; 3: 0.75 fc’
Mo, max
(kips.ft)Mo, max,1 / Mo, max,0
Mo, max,2 / Mo, max,0
Mo, max,3 / Mo, max,0
CIR21 0 393
CIR22 0 562
BI21 0 412
BI22 0 521
BI23 0 409
BI24 0 517
SQ21 1 372 0.94
SQ22 1 536 0.95
SQ23 1 380 0.94
SQ24 1 542 0.95
CIR21 1 350 0.93
CIR22 1 500 0.96
BI21 1 389 0.95
BI22 1 500 0.96
BI23 1 387 0.95
BI24 1 496 0.96
SQ21 2 360 0.91
SQ22 2 521 0.92
SQ23 2 365 0.90
SQ24 2 530 0.92
CIR21 2 338 0.90
CIR22 2 490 0.94
BI21 2 379 0.92
BI22 2 489 0.94
BI23 2 376 0.92
BI24 2 486 0.94
SQ21 3 334 0.85
SQ22 3 492 0.87
SQ23 3 335 0.82
SQ24 3 501 0.87
CIR21 3 314 0.84
CIR22 3 469 0.90
BI21 3 357 0.87

228
Sectiondesignation
strength:0: fc’; 1: 0.90 fc’;
2: 0.85 fc’; 3: 0.75 fc’
Mo, max
(kips.ft)Mo, max,1 / Mo, max,0
Mo, max,2 / Mo, max,0
Mo, max,3 / Mo, max,0
BI22 3 469 0.90
BI23 3 355 0.87
BI24 3 465 0.90
Table C.13 The effect of routine strength variations of SIMCON on axial load capacities
Sectiondesignation
strength:0: fc’; 1: 0.90 fc’;
2: 0.85 fc’; 3: 0.75 fc’
Pn, max
(kips)Pn, max,1 / Pn, max,0
Pn, max,2 / Pn, max,0
Pn, max,3 / Pn, max,0
SQ11 0 1928317
SQ12 0 2225476
SQ13 0 1928139
SQ14 0 2225128
CIR11 0 1874788
CIR12 0 2171659
BI11 0 1942984
BI12 0 2239726
BI13 0 1942974
BI14 0 2239706
SQ11 1 1889208 0.980
SQ12 1 2186368 0.982
SQ13 1 1889031 0.980
SQ14 1 2186019 0.982
CIR11 1 1840284 0.982
CIR12 1 2137155 0.984
BI11 1 1903689 0.980
BI12 1 2200432 0.982
BI13 1 1903680 0.980
BI14 1 2200412 0.982
SQ11 2 1869972 0.970
SQ12 2 2167132 0.974
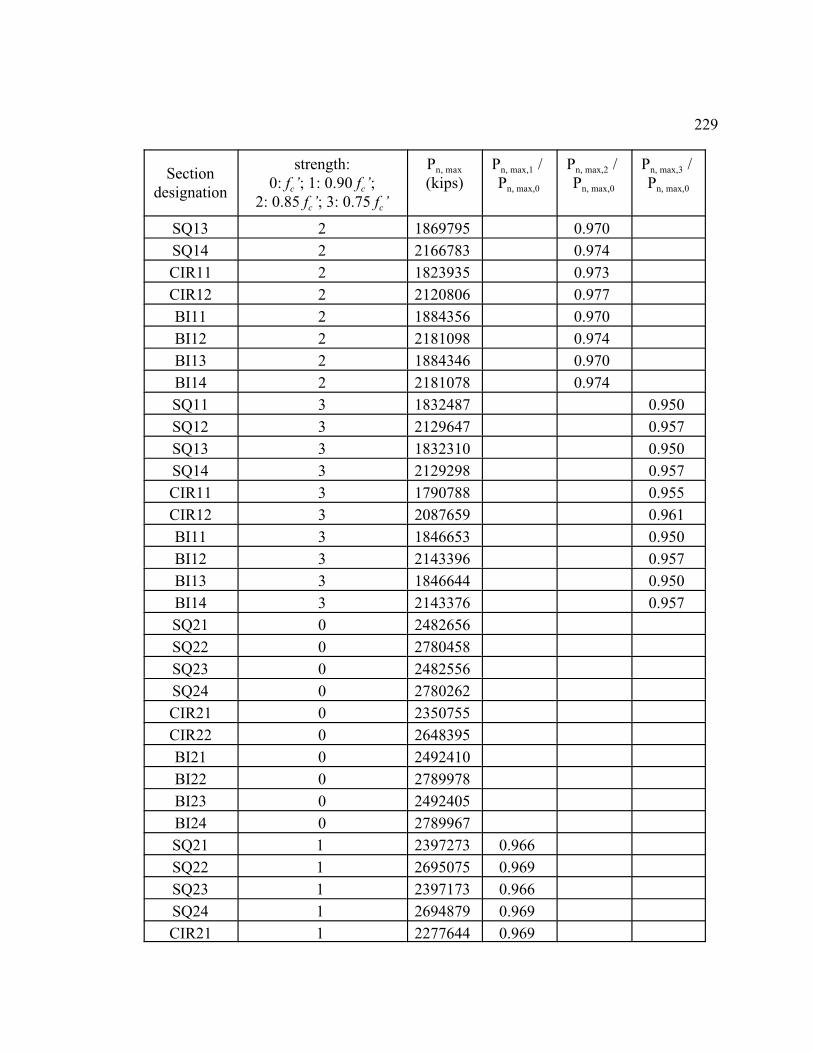
229
Sectiondesignation
strength:0: fc’; 1: 0.90 fc’;
2: 0.85 fc’; 3: 0.75 fc’
Pn, max
(kips)Pn, max,1 / Pn, max,0
Pn, max,2 / Pn, max,0
Pn, max,3 / Pn, max,0
SQ13 2 1869795 0.970
SQ14 2 2166783 0.974
CIR11 2 1823935 0.973
CIR12 2 2120806 0.977
BI11 2 1884356 0.970
BI12 2 2181098 0.974
BI13 2 1884346 0.970
BI14 2 2181078 0.974
SQ11 3 1832487 0.950
SQ12 3 2129647 0.957
SQ13 3 1832310 0.950
SQ14 3 2129298 0.957
CIR11 3 1790788 0.955
CIR12 3 2087659 0.961
BI11 3 1846653 0.950
BI12 3 2143396 0.957
BI13 3 1846644 0.950
BI14 3 2143376 0.957
SQ21 0 2482656
SQ22 0 2780458
SQ23 0 2482556
SQ24 0 2780262
CIR21 0 2350755
CIR22 0 2648395
BI21 0 2492410
BI22 0 2789978
BI23 0 2492405
BI24 0 2789967
SQ21 1 2397273 0.966
SQ22 1 2695075 0.969
SQ23 1 2397173 0.966
SQ24 1 2694879 0.969
CIR21 1 2277644 0.969

230
Sectiondesignation
strength:0: fc’; 1: 0.90 fc’;
2: 0.85 fc’; 3: 0.75 fc’
Pn, max
(kips)Pn, max,1 / Pn, max,0
Pn, max,2 / Pn, max,0
Pn, max,3 / Pn, max,0
CIR22 1 2574515 0.972
BI21 1 2407401 0.966
BI22 1 2704365 0.969
BI23 1 2407391 0.966
BI24 1 2704354 0.969
SQ21 2 2355329 0.949
SQ22 2 2653131 0.954
SQ23 2 2355229 0.949
SQ24 2 2652935 0.954
CIR21 2 2242569 0.954
CIR22 2 2539440 0.959
BI21 2 2366485 0.949
BI22 2 2663228 0.955
BI23 2 2366476 0.949
BI24 2 2663208 0.955
SQ21 3 2273765 0.916
SQ22 3 2571567 0.925
SQ23 3 2273665 0.916
SQ24 3 2571371 0.925
CIR21 3 2172927 0.924
CIR22 3 2469798 0.933
BI21 3 2286705 0.917
BI22 3 2583448 0.926
BI23 3 2286696 0.917
BI24 3 2583428 0.926

231
Table C.14 The effect of routine thickness variations of SIMCON on maximum moment capacities
Sectiondesignation
SIMCON thickness:1: reference
2:0.8 t; 3:0.9 t;4:1.1 t; 5:1.2 t
Mo, max
(kips.ft)Mo, max,2 /Mo, max,1
Mo, max,3 /Mo, max,1
Mo, max,4 /Mo, max,1
Mo, max,5 /Mo, max,1
SQ11 1 272
SQ12 1 437
SQ13 1 272
SQ14 1 431
CIR11 1 276
CIR12 1 425
BI11 1 265
BI12 1 369
BI13 1 262
BI14 1 366
SQ11 2 236 0.91
SQ12 2 386 0.93
SQ13 2 238 0.90
SQ14 2 390 0.93
CIR11 2 229 0.91
CIR12 2 357 0.94
BI11 2 239 0.91
BI12 2 345 0.94
BI13 2 238 0.91
BI14 2 342 0.93
SQ11 3 247 0.95
SQ12 3 400 0.97
SQ13 3 250 0.95
SQ14 3 403 0.97
CIR11 3 241 0.96
CIR12 3 369 0.97
BI11 3 252 0.95
BI12 3 357 0.97
BI13 3 249 0.95
BI14 3 354 0.97

232
Sectiondesignation
SIMCON thickness:1: reference
2:0.8 t; 3:0.9 t;4:1.1 t; 5:1.2 t
Mo, max
(kips.ft)Mo, max,2 /Mo, max,1
Mo, max,3 /Mo, max,1
Mo, max,4 /Mo, max,1
Mo, max,5 /Mo, max,1
SQ11 4 273 1.05
SQ12 4 427 1.03
SQ13 4 276 1.05
SQ14 4 431 1.03
CIR11 4 263 1.05
CIR12 4 395 1.04
BI11 4 277 1.05
BI12 4 382 1.04
BI13 4 275 1.05
BI14 4 379 1.04
SQ11 5 287 1.11
SQ12 5 440 1.07
SQ13 5 290 1.10
SQ14 5 446 1.07
CIR11 5 275 1.09
CIR12 5 409 1.07
BI11 5 290 1.10
BI12 5 396 1.07
BI13 5 288 1.10
BI14 5 393 1.07
SQ21 1 402
SQ22 1 587
SQ23 1 411
SQ24 1 589
CIR21 1 393
CIR22 1 562
BI21 1 412
BI22 1 521
BI23 1 409
BI24 1 517
SQ21 2 340 0.86
SQ22 2 499 0.89
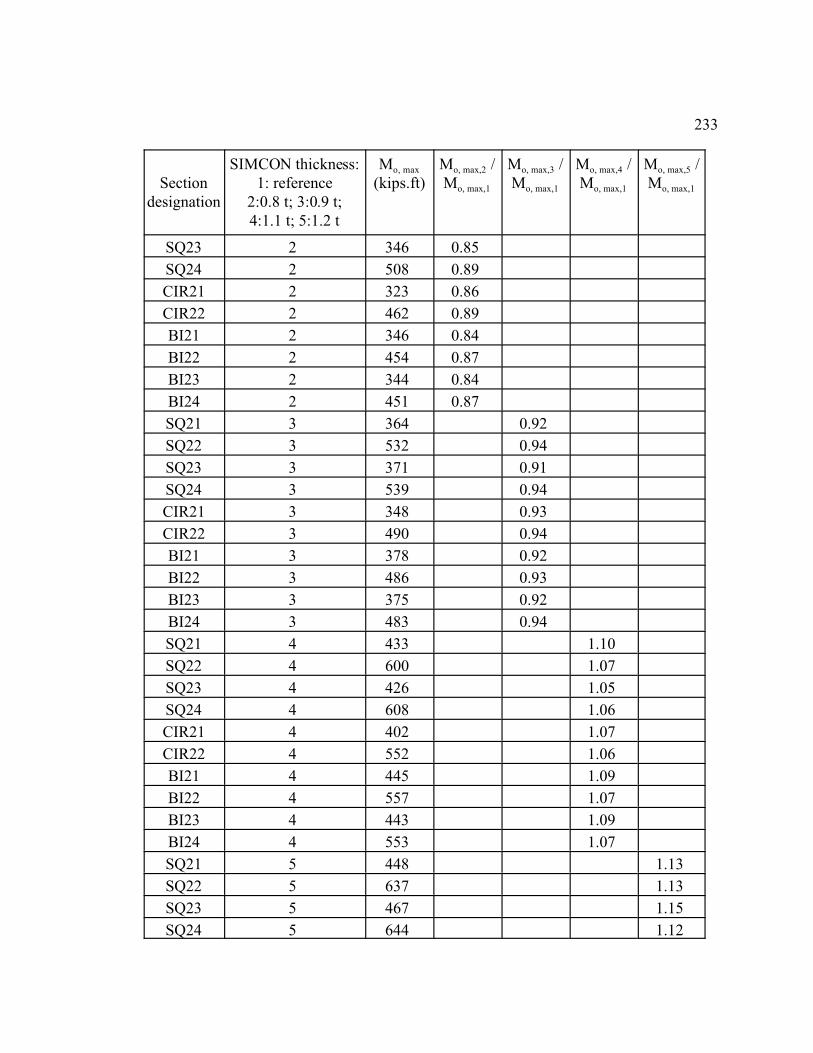
233
Sectiondesignation
SIMCON thickness:1: reference
2:0.8 t; 3:0.9 t;4:1.1 t; 5:1.2 t
Mo, max
(kips.ft)Mo, max,2 /Mo, max,1
Mo, max,3 /Mo, max,1
Mo, max,4 /Mo, max,1
Mo, max,5 /Mo, max,1
SQ23 2 346 0.85
SQ24 2 508 0.89
CIR21 2 323 0.86
CIR22 2 462 0.89
BI21 2 346 0.84
BI22 2 454 0.87
BI23 2 344 0.84
BI24 2 451 0.87
SQ21 3 364 0.92
SQ22 3 532 0.94
SQ23 3 371 0.91
SQ24 3 539 0.94
CIR21 3 348 0.93
CIR22 3 490 0.94
BI21 3 378 0.92
BI22 3 486 0.93
BI23 3 375 0.92
BI24 3 483 0.94
SQ21 4 433 1.10
SQ22 4 600 1.07
SQ23 4 426 1.05
SQ24 4 608 1.06
CIR21 4 402 1.07
CIR22 4 552 1.06
BI21 4 445 1.09
BI22 4 557 1.07
BI23 4 443 1.09
BI24 4 553 1.07
SQ21 5 448 1.13
SQ22 5 637 1.13
SQ23 5 467 1.15
SQ24 5 644 1.12

234
Sectiondesignation
SIMCON thickness:1: reference
2:0.8 t; 3:0.9 t;4:1.1 t; 5:1.2 t
Mo, max
(kips.ft)Mo, max,2 /Mo, max,1
Mo, max,3 /Mo, max,1
Mo, max,4 /Mo, max,1
Mo, max,5 /Mo, max,1
CIR21 5 429 1.14
CIR22 5 586 1.13
BI21 5 481 1.18
BI22 5 595 1.14
BI23 5 479 1.18
BI24 5 592 1.15
Table C.15 The effect of routine thickness variations of SIMCON on axial load capacities
Sectiondesignation
SIMCON thickness:1: reference
2:0.8 t; 3:0.9 t;4:1.1 t; 5:1.2 t
Pn, max
(kips)Pn, max,2 / Pn, max,1
Pn, max,3 / Pn, max,1
Pn, max,4 / Pn, max,1
Pn, max,5 / Pn, max,1
SQ11 1 1928317
SQ12 1 2225476
SQ13 1 1928139
SQ14 1 2225128
CIR11 1 1874788
CIR12 1 2171659
BI11 1 1942984
BI12 1 2239726
BI13 1 1942974
BI14 1 2239706
SQ11 2 1826092 0.947
SQ12 2 2123251 0.954
SQ13 2 1825914 0.947
SQ14 2 2122903 0.954
CIR11 2 1785052 0.952
CIR12 2 2081923 0.959
BI11 2 1842464 0.948

235
Sectiondesignation
SIMCON thickness:1: reference
2:0.8 t; 3:0.9 t;4:1.1 t; 5:1.2 t
Pn, max
(kips)Pn, max,2 / Pn, max,1
Pn, max,3 / Pn, max,1
Pn, max,4 / Pn, max,1
Pn, max,5 / Pn, max,1
BI12 2 2137066 0.954
BI13 2 1842575 0.948
BI14 2 2137046 0.954
SQ11 3 1876922 0.973
SQ12 3 2174081 0.977
SQ13 3 1876745 0.973
SQ14 3 2173733 0.977
CIR11 3 1829697 0.976
CIR12 3 2126568 0.979
BI11 3 1891368 0.973
BI12 3 2188110 0.977
BI13 3 1891358 0.973
BI14 3 2188090 0.977
SQ11 4 1980275 1.027
SQ12 4 2277435 1.023
SQ13 4 1980098 1.027
SQ14 4 2277087 1.023
CIR11 4 1920325 1.024
CIR12 4 2217197 1.021
BI11 4 1995172 1.027
BI12 4 2291914 1.023
BI13 4 1995162 1.027
BI14 4 2291894 1.023
SQ11 5 2032798 1.054
SQ12 5 2329958 1.047
SQ13 5 2032621 1.054
SQ14 5 2329609 1.047
CIR11 5 1966309 1.049
CIR12 5 2263180 1.042
BI11 5 2047931 1.054
BI12 5 2344673 1.047
BI13 5 2047922 1.054

236
Sectiondesignation
SIMCON thickness:1: reference
2:0.8 t; 3:0.9 t;4:1.1 t; 5:1.2 t
Pn, max
(kips)Pn, max,2 / Pn, max,1
Pn, max,3 / Pn, max,1
Pn, max,4 / Pn, max,1
Pn, max,5 / Pn, max,1
BI14 5 2344653 1.047
SQ21 1 2482656
SQ22 1 2780458
SQ23 1 2482556
SQ24 1 2780262
CIR21 1 2350755
CIR22 1 2648395
BI21 1 2492410
BI22 1 2789978
BI23 1 2492405
BI24 1 2789967
SQ21 2 2248571 0.906
SQ22 2 2546374 0.916
SQ23 2 2248472 0.906
SQ24 2 2546178 0.916
CIR21 2 2154700 0.917
CIR22 2 2451572 0.926
BI21 2 2264681 0.909
BI22 2 2561423 0.918
BI23 2 2264671 0.909
BI24 2 2561403 0.918
SQ21 3 2364433 0.952
SQ22 3 2662235 0.957
SQ23 3 2364333 0.952
SQ24 3 2662039 0.957
CIR21 3 2251568 0.958
CIR22 3 2548439 0.962
BI21 3 2376480 0.953
BI22 3 2673222 0.958
BI23 3 2376471 0.953
BI24 3 2673202 0.958
SQ21 4 2604229 1.049
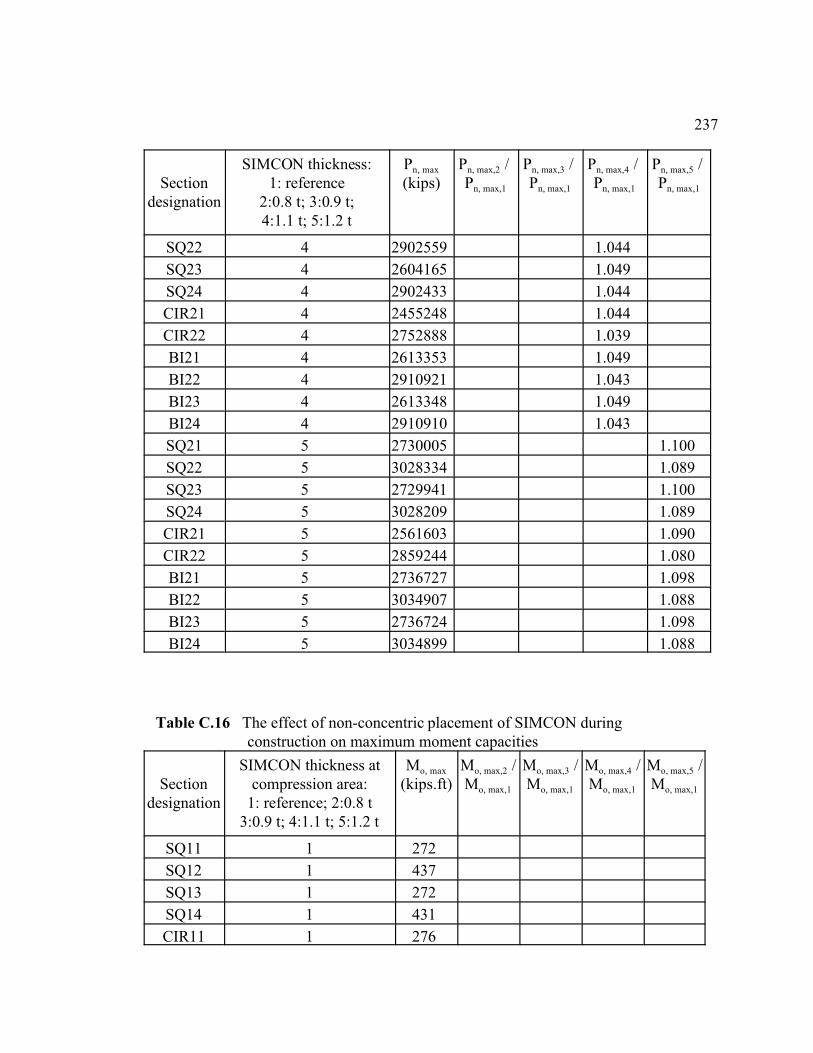
237
Sectiondesignation
SIMCON thickness:1: reference
2:0.8 t; 3:0.9 t;4:1.1 t; 5:1.2 t
Pn, max
(kips)Pn, max,2 / Pn, max,1
Pn, max,3 / Pn, max,1
Pn, max,4 / Pn, max,1
Pn, max,5 / Pn, max,1
SQ22 4 2902559 1.044
SQ23 4 2604165 1.049
SQ24 4 2902433 1.044
CIR21 4 2455248 1.044
CIR22 4 2752888 1.039
BI21 4 2613353 1.049
BI22 4 2910921 1.043
BI23 4 2613348 1.049
BI24 4 2910910 1.043
SQ21 5 2730005 1.100
SQ22 5 3028334 1.089
SQ23 5 2729941 1.100
SQ24 5 3028209 1.089
CIR21 5 2561603 1.090
CIR22 5 2859244 1.080
BI21 5 2736727 1.098
BI22 5 3034907 1.088
BI23 5 2736724 1.098
BI24 5 3034899 1.088
Table C.16 The effect of non-concentric placement of SIMCON during construction on maximum moment capacities
Sectiondesignation
SIMCON thickness atcompression area:
1: reference; 2:0.8 t3:0.9 t; 4:1.1 t; 5:1.2 t
Mo, max
(kips.ft)Mo, max,2 /Mo, max,1
Mo, max,3 /Mo, max,1
Mo, max,4 /Mo, max,1
Mo, max,5 /Mo, max,1
SQ11 1 272
SQ12 1 437
SQ13 1 272
SQ14 1 431
CIR11 1 276
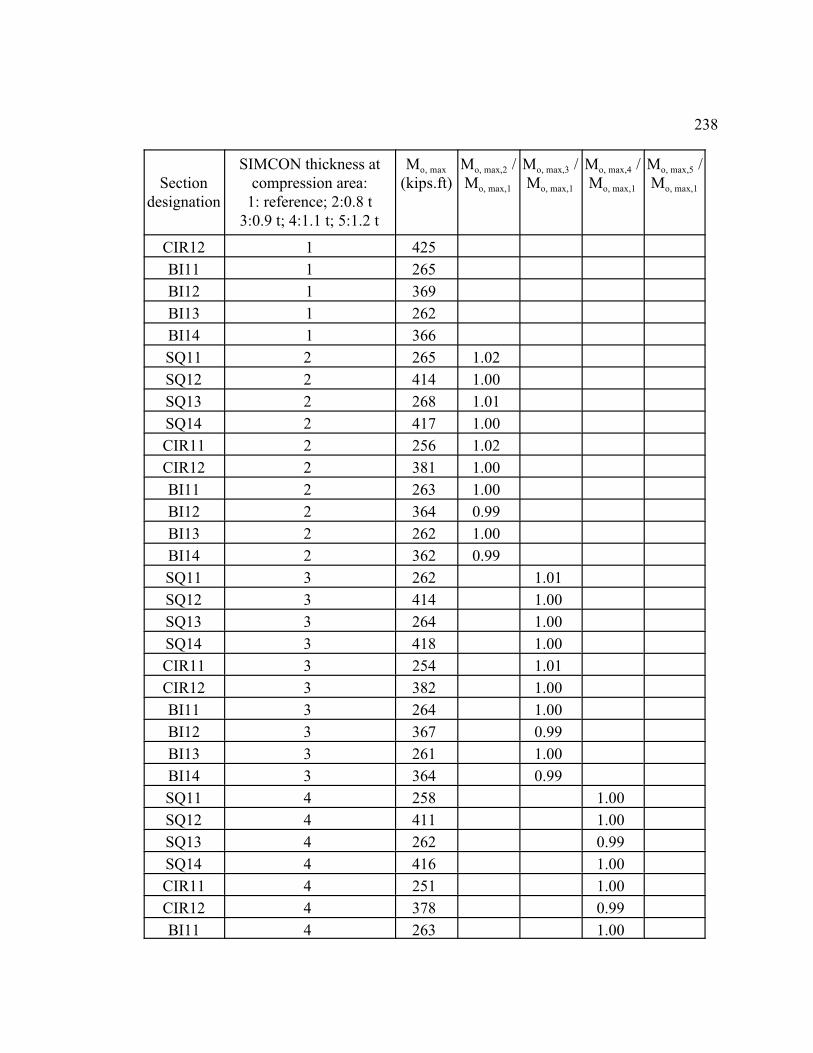
238
Sectiondesignation
SIMCON thickness atcompression area:
1: reference; 2:0.8 t3:0.9 t; 4:1.1 t; 5:1.2 t
Mo, max
(kips.ft)Mo, max,2 /Mo, max,1
Mo, max,3 /Mo, max,1
Mo, max,4 /Mo, max,1
Mo, max,5 /Mo, max,1
CIR12 1 425
BI11 1 265
BI12 1 369
BI13 1 262
BI14 1 366
SQ11 2 265 1.02
SQ12 2 414 1.00
SQ13 2 268 1.01
SQ14 2 417 1.00
CIR11 2 256 1.02
CIR12 2 381 1.00
BI11 2 263 1.00
BI12 2 364 0.99
BI13 2 262 1.00
BI14 2 362 0.99
SQ11 3 262 1.01
SQ12 3 414 1.00
SQ13 3 264 1.00
SQ14 3 418 1.00
CIR11 3 254 1.01
CIR12 3 382 1.00
BI11 3 264 1.00
BI12 3 367 0.99
BI13 3 261 1.00
BI14 3 364 0.99
SQ11 4 258 1.00
SQ12 4 411 1.00
SQ13 4 262 0.99
SQ14 4 416 1.00
CIR11 4 251 1.00
CIR12 4 378 0.99
BI11 4 263 1.00
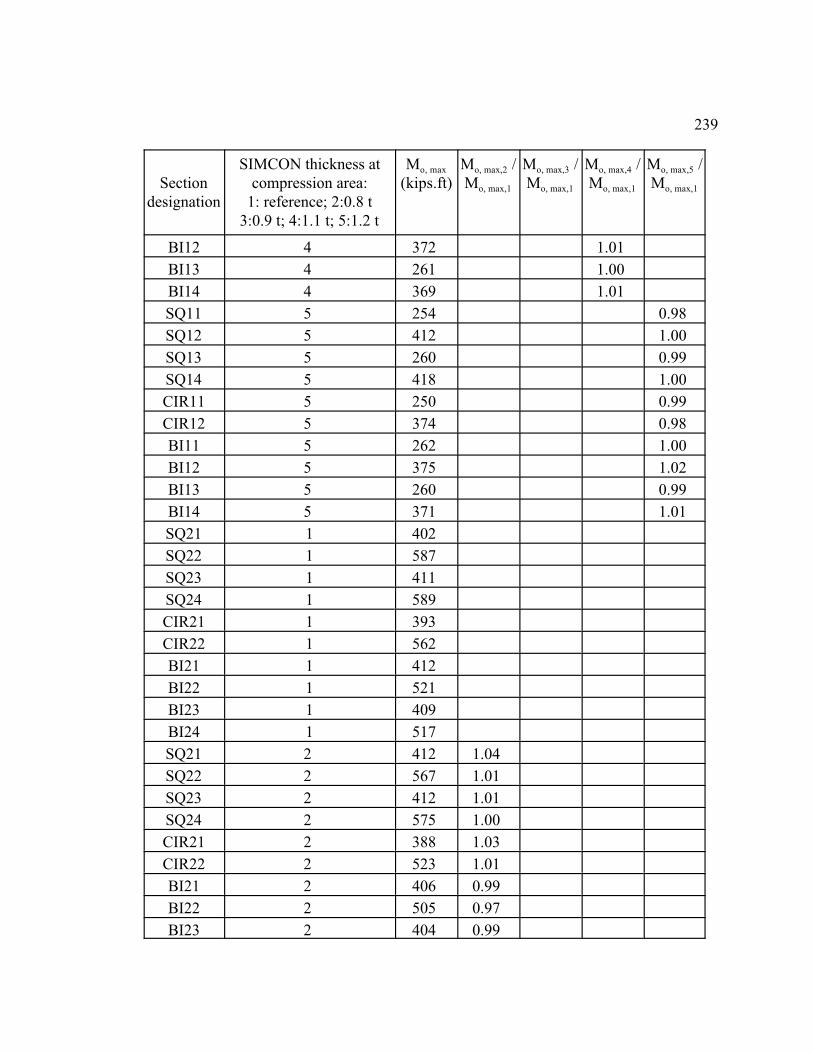
239
Sectiondesignation
SIMCON thickness atcompression area:
1: reference; 2:0.8 t3:0.9 t; 4:1.1 t; 5:1.2 t
Mo, max
(kips.ft)Mo, max,2 /Mo, max,1
Mo, max,3 /Mo, max,1
Mo, max,4 /Mo, max,1
Mo, max,5 /Mo, max,1
BI12 4 372 1.01
BI13 4 261 1.00
BI14 4 369 1.01
SQ11 5 254 0.98
SQ12 5 412 1.00
SQ13 5 260 0.99
SQ14 5 418 1.00
CIR11 5 250 0.99
CIR12 5 374 0.98
BI11 5 262 1.00
BI12 5 375 1.02
BI13 5 260 0.99
BI14 5 371 1.01
SQ21 1 402
SQ22 1 587
SQ23 1 411
SQ24 1 589
CIR21 1 393
CIR22 1 562
BI21 1 412
BI22 1 521
BI23 1 409
BI24 1 517
SQ21 2 412 1.04
SQ22 2 567 1.01
SQ23 2 412 1.01
SQ24 2 575 1.00
CIR21 2 388 1.03
CIR22 2 523 1.01
BI21 2 406 0.99
BI22 2 505 0.97
BI23 2 404 0.99

240
Sectiondesignation
SIMCON thickness atcompression area:
1: reference; 2:0.8 t3:0.9 t; 4:1.1 t; 5:1.2 t
Mo, max
(kips.ft)Mo, max,2 /Mo, max,1
Mo, max,3 /Mo, max,1
Mo, max,4 /Mo, max,1
Mo, max,5 /Mo, max,1
BI24 2 501 0.97
SQ21 3 405 1.03
SQ22 3 567 1.01
SQ23 3 412 1.01
SQ24 3 572 1.00
CIR21 3 382 1.02
CIR22 3 521 1.00
BI21 3 409 1.00
BI22 3 512 0.98
BI23 3 407 1.00
BI24 3 509 0.98
SQ21 4 381 0.96
SQ22 4 566 1.00
SQ23 4 396 0.98
SQ24 4 574 1.00
CIR21 4 374 1.00
CIR22 4 512 0.99
BI21 4 410 1.00
BI22 4 530 1.02
BI23 4 408 1.00
BI24 4 527 1.02
SQ21 5 389 0.99
SQ22 5 565 1.00
SQ23 5 382 0.94
SQ24 5 572 1.00
CIR21 5 374 1.00
CIR22 5 506 0.97
BI21 5 410 1.00
BI22 5 540 1.04
BI23 5 407 1.00
BI24 5 536 1.04
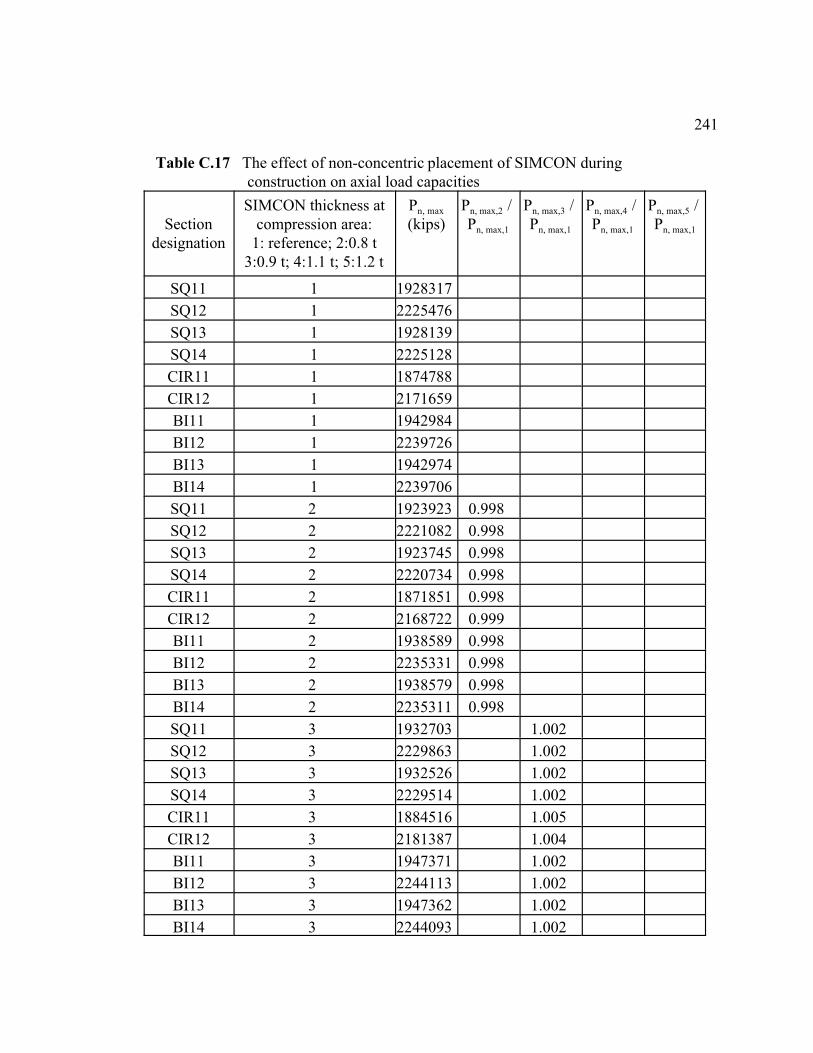
241
Table C.17 The effect of non-concentric placement of SIMCON during construction on axial load capacities
Sectiondesignation
SIMCON thickness atcompression area:
1: reference; 2:0.8 t3:0.9 t; 4:1.1 t; 5:1.2 t
Pn, max
(kips)Pn, max,2 / Pn, max,1
Pn, max,3 / Pn, max,1
Pn, max,4 / Pn, max,1
Pn, max,5 / Pn, max,1
SQ11 1 1928317
SQ12 1 2225476
SQ13 1 1928139
SQ14 1 2225128
CIR11 1 1874788
CIR12 1 2171659
BI11 1 1942984
BI12 1 2239726
BI13 1 1942974
BI14 1 2239706
SQ11 2 1923923 0.998
SQ12 2 2221082 0.998
SQ13 2 1923745 0.998
SQ14 2 2220734 0.998
CIR11 2 1871851 0.998
CIR12 2 2168722 0.999
BI11 2 1938589 0.998
BI12 2 2235331 0.998
BI13 2 1938579 0.998
BI14 2 2235311 0.998
SQ11 3 1932703 1.002
SQ12 3 2229863 1.002
SQ13 3 1932526 1.002
SQ14 3 2229514 1.002
CIR11 3 1884516 1.005
CIR12 3 2181387 1.004
BI11 3 1947371 1.002
BI12 3 2244113 1.002
BI13 3 1947362 1.002
BI14 3 2244093 1.002

242
Sectiondesignation
SIMCON thickness atcompression area:
1: reference; 2:0.8 t3:0.9 t; 4:1.1 t; 5:1.2 t
Pn, max
(kips)Pn, max,2 / Pn, max,1
Pn, max,3 / Pn, max,1
Pn, max,4 / Pn, max,1
Pn, max,5 / Pn, max,1
SQ11 4 1919521 0.995
SQ12 4 2216681 0.996
SQ13 4 1919344 0.995
SQ14 4 2216332 0.996
CIR11 4 1869048 0.997
CIR12 4 2165920 0.997
BI11 4 1934187 0.995
BI12 4 2230929 0.996
BI13 4 1934177 0.995
BI14 4 2230909 0.996
SQ11 5 1937082 1.005
SQ12 5 2234241 1.004
SQ13 5 1936905 1.005
SQ14 5 2233893 1.004
CIR11 5 1894415 1.010
CIR12 5 2191287 1.009
BI11 5 1951751 1.005
BI12 5 2248493 1.004
BI13 5 1951741 1.005
BI14 5 2248473 1.004
SQ21 1 2482656
SQ22 1 2780458
SQ23 1 2482556
SQ24 1 2780262
CIR21 1 2350755
CIR22 1 2648395
BI21 1 2492410
BI22 1 2789978
BI23 1 2492405
BI24 1 2789967
SQ21 2 2474793 0.997
SQ22 2 2773052 0.997

243
Sectiondesignation
SIMCON thickness atcompression area:
1: reference; 2:0.8 t3:0.9 t; 4:1.1 t; 5:1.2 t
Pn, max
(kips)Pn, max,2 / Pn, max,1
Pn, max,3 / Pn, max,1
Pn, max,4 / Pn, max,1
Pn, max,5 / Pn, max,1
SQ23 2 2474694 0.997
SQ24 2 2772926 0.997
CIR21 2 2344133 0.997
CIR22 2 2641004 0.997
BI21 2 2484547 0.997
BI22 2 2782114 0.997
BI23 2 2484541 0.997
BI24 2 2782103 0.997
SQ21 3 2490497 1.003
SQ22 3 2788300 1.003
SQ23 3 2490398 1.003
SQ24 3 2788104 1.003
CIR21 3 2372414 1.009
CIR22 3 2669285 1.008
BI21 3 2501384 1.004
BI22 3 2798126 1.003
BI23 3 2501374 1.004
BI24 3 2798106 1.003
SQ21 4 2468554 0.994
SQ22 4 2766883 0.995
SQ23 4 2468490 0.994
SQ24 4 2766758 0.995
CIR21 4 2338594 0.995
CIR22 4 2635465 0.995
BI21 4 2476662 0.994
BI22 4 2774229 0.994
BI23 4 2476657 0.994
BI24 4 2774218 0.994
SQ21 5 2498318 1.006
SQ22 5 2796120 1.006
SQ23 5 2498218 1.006
SQ24 5 2795924 1.006
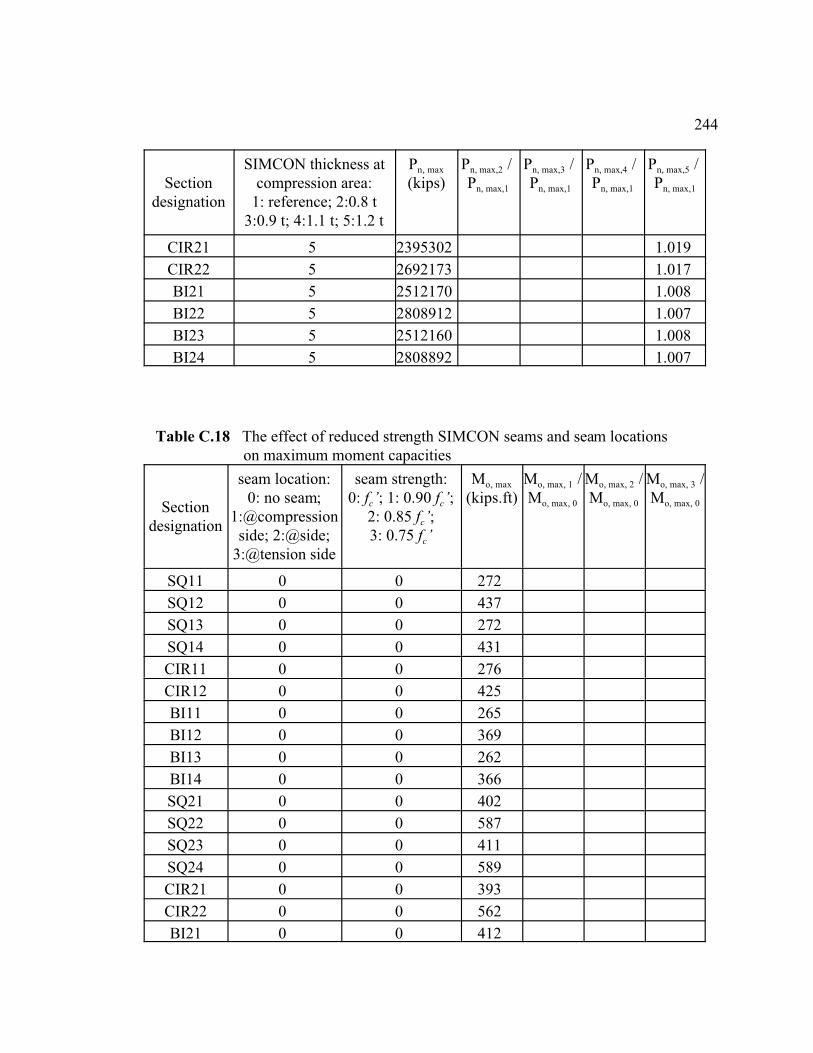
244
Sectiondesignation
SIMCON thickness atcompression area:
1: reference; 2:0.8 t3:0.9 t; 4:1.1 t; 5:1.2 t
Pn, max
(kips)Pn, max,2 / Pn, max,1
Pn, max,3 / Pn, max,1
Pn, max,4 / Pn, max,1
Pn, max,5 / Pn, max,1
CIR21 5 2395302 1.019
CIR22 5 2692173 1.017
BI21 5 2512170 1.008
BI22 5 2808912 1.007
BI23 5 2512160 1.008
BI24 5 2808892 1.007
Table C.18 The effect of reduced strength SIMCON seams and seam locations on maximum moment capacities
Sectiondesignation
seam location:0: no seam;
1:@compressionside; 2:@side;
3:@tension side
seam strength:0: fc’; 1: 0.90 fc’;
2: 0.85 fc’;3: 0.75 fc’
Mo, max
(kips.ft)Mo, max, 1 /Mo, max, 0
Mo, max, 2 /Mo, max, 0
Mo, max, 3 /Mo, max, 0
SQ11 0 0 272
SQ12 0 0 437
SQ13 0 0 272
SQ14 0 0 431
CIR11 0 0 276
CIR12 0 0 425
BI11 0 0 265
BI12 0 0 369
BI13 0 0 262
BI14 0 0 366
SQ21 0 0 402
SQ22 0 0 587
SQ23 0 0 411
SQ24 0 0 589
CIR21 0 0 393
CIR22 0 0 562
BI21 0 0 412

245
Sectiondesignation
seam location:0: no seam;
1:@compressionside; 2:@side;
3:@tension side
seam strength:0: fc’; 1: 0.90 fc’;
2: 0.85 fc’;3: 0.75 fc’
Mo, max
(kips.ft)Mo, max, 1 /Mo, max, 0
Mo, max, 2 /Mo, max, 0
Mo, max, 3 /Mo, max, 0
BI22 0 0 521
BI23 0 0 409
BI24 0 0 517
SQ11 1 1 259 0.9980
SQ12 1 1 412 0.9983
SQ13 1 1 263 0.9970
SQ14 1 1 417 0.9969
CIR11 1 1 249 0.9910
CIR12 1 1 381 0.9983
BI11 1 1 264 1.0000
BI12 1 1 369 0.9996
BI13 1 1 261 0.9965
BI14 1 1 365 0.9973
SQ21 1 1 393 0.9951
SQ22 1 1 563 0.9985
SQ23 1 1 404 0.9945
SQ24 1 1 572 0.9980
CIR21 1 1 370 0.9864
CIR22 1 1 518 0.9970
BI21 1 1 409 0.9988
BI22 1 1 519 0.9969
BI23 1 1 406 0.9966
BI24 1 1 515 0.9969
SQ11 1 2 259 0.9996
SQ12 1 2 411 0.9959
SQ13 1 2 262 0.9936
SQ14 1 2 416 0.9964
CIR11 1 2 249 0.9879
CIR12 1 2 381 0.9970
BI11 1 2 263 0.9983
BI12 1 2 369 0.9983
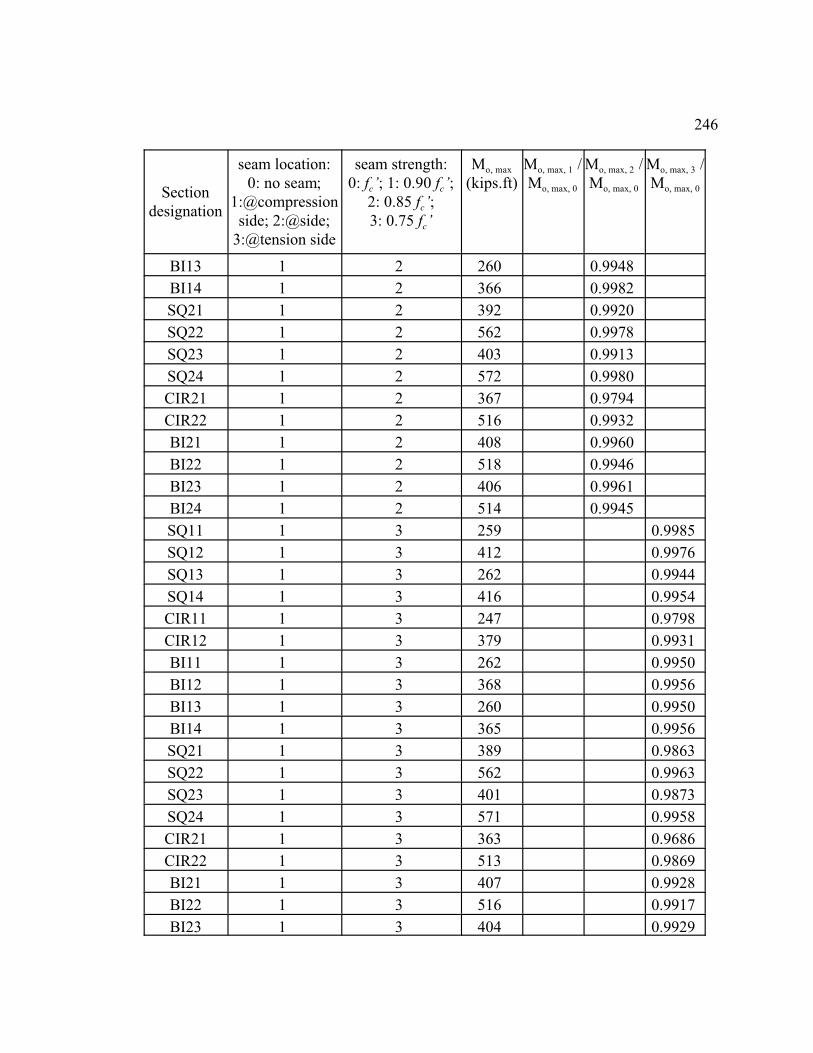
246
Sectiondesignation
seam location:0: no seam;
1:@compressionside; 2:@side;
3:@tension side
seam strength:0: fc’; 1: 0.90 fc’;
2: 0.85 fc’;3: 0.75 fc’
Mo, max
(kips.ft)Mo, max, 1 /Mo, max, 0
Mo, max, 2 /Mo, max, 0
Mo, max, 3 /Mo, max, 0
BI13 1 2 260 0.9948
BI14 1 2 366 0.9982
SQ21 1 2 392 0.9920
SQ22 1 2 562 0.9978
SQ23 1 2 403 0.9913
SQ24 1 2 572 0.9980
CIR21 1 2 367 0.9794
CIR22 1 2 516 0.9932
BI21 1 2 408 0.9960
BI22 1 2 518 0.9946
BI23 1 2 406 0.9961
BI24 1 2 514 0.9945
SQ11 1 3 259 0.9985
SQ12 1 3 412 0.9976
SQ13 1 3 262 0.9944
SQ14 1 3 416 0.9954
CIR11 1 3 247 0.9798
CIR12 1 3 379 0.9931
BI11 1 3 262 0.9950
BI12 1 3 368 0.9956
BI13 1 3 260 0.9950
BI14 1 3 365 0.9956
SQ21 1 3 389 0.9863
SQ22 1 3 562 0.9963
SQ23 1 3 401 0.9873
SQ24 1 3 571 0.9958
CIR21 1 3 363 0.9686
CIR22 1 3 513 0.9869
BI21 1 3 407 0.9928
BI22 1 3 516 0.9917
BI23 1 3 404 0.9929
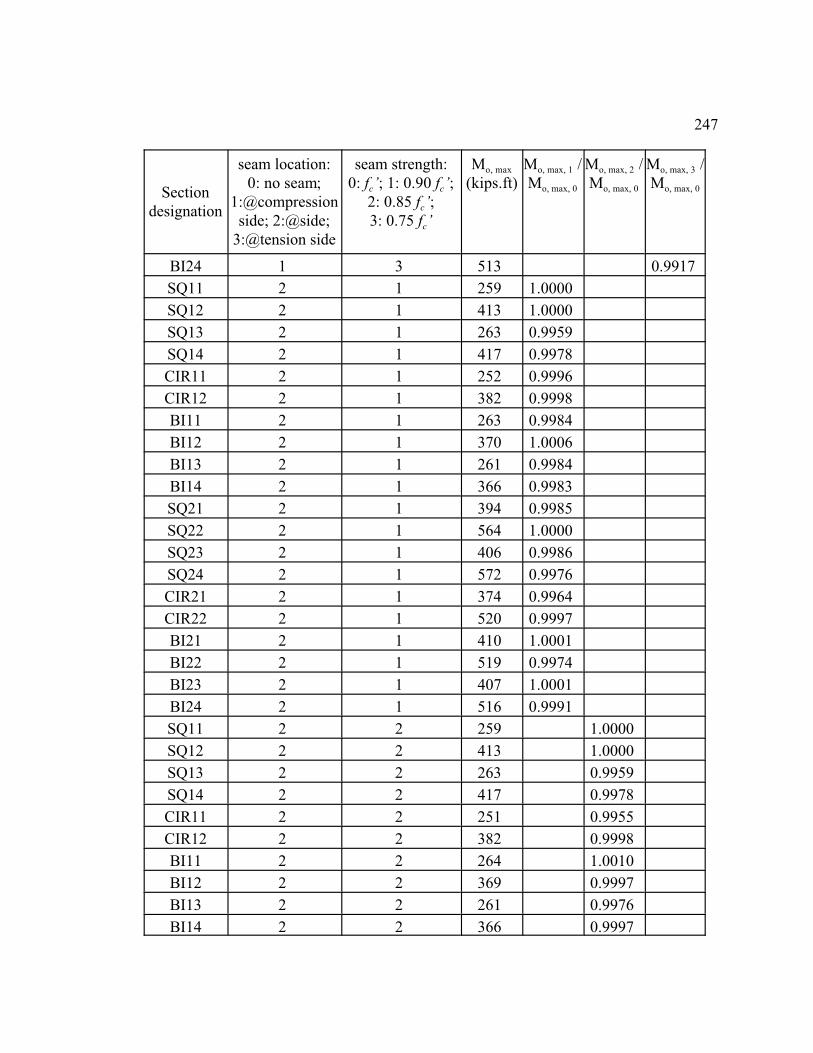
247
Sectiondesignation
seam location:0: no seam;
1:@compressionside; 2:@side;
3:@tension side
seam strength:0: fc’; 1: 0.90 fc’;
2: 0.85 fc’;3: 0.75 fc’
Mo, max
(kips.ft)Mo, max, 1 /Mo, max, 0
Mo, max, 2 /Mo, max, 0
Mo, max, 3 /Mo, max, 0
BI24 1 3 513 0.9917
SQ11 2 1 259 1.0000
SQ12 2 1 413 1.0000
SQ13 2 1 263 0.9959
SQ14 2 1 417 0.9978
CIR11 2 1 252 0.9996
CIR12 2 1 382 0.9998
BI11 2 1 263 0.9984
BI12 2 1 370 1.0006
BI13 2 1 261 0.9984
BI14 2 1 366 0.9983
SQ21 2 1 394 0.9985
SQ22 2 1 564 1.0000
SQ23 2 1 406 0.9986
SQ24 2 1 572 0.9976
CIR21 2 1 374 0.9964
CIR22 2 1 520 0.9997
BI21 2 1 410 1.0001
BI22 2 1 519 0.9974
BI23 2 1 407 1.0001
BI24 2 1 516 0.9991
SQ11 2 2 259 1.0000
SQ12 2 2 413 1.0000
SQ13 2 2 263 0.9959
SQ14 2 2 417 0.9978
CIR11 2 2 251 0.9955
CIR12 2 2 382 0.9998
BI11 2 2 264 1.0010
BI12 2 2 369 0.9997
BI13 2 2 261 0.9976
BI14 2 2 366 0.9997
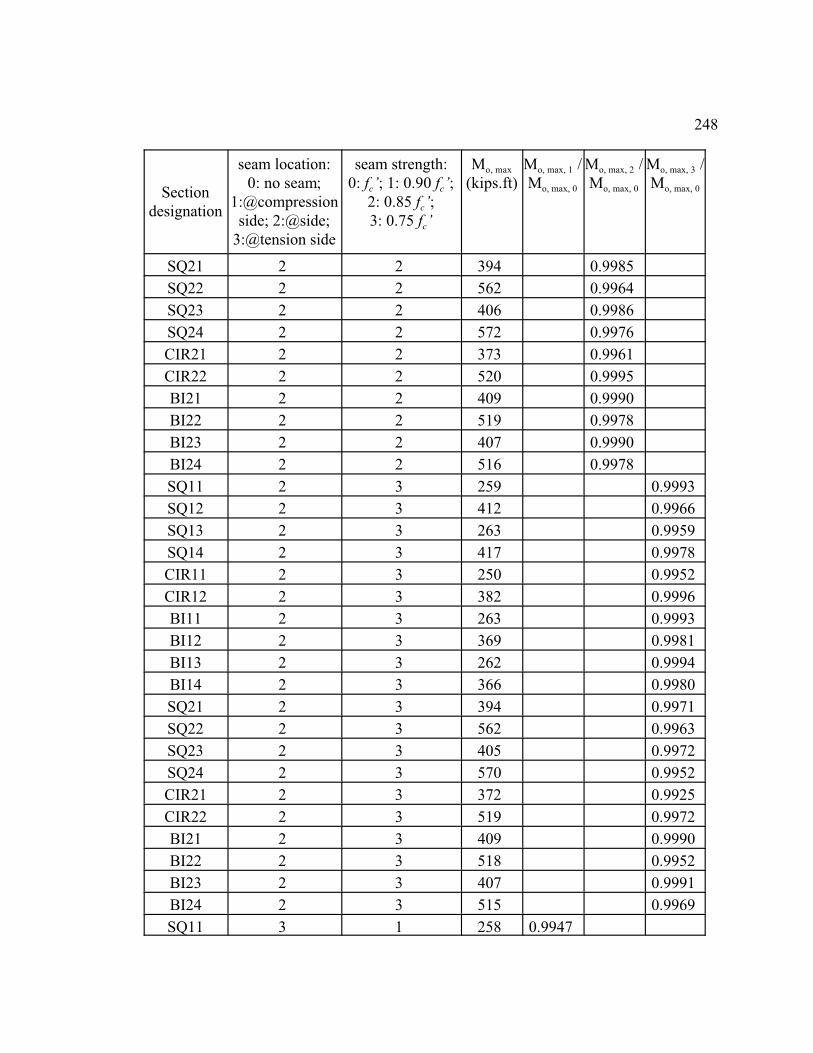
248
Sectiondesignation
seam location:0: no seam;
1:@compressionside; 2:@side;
3:@tension side
seam strength:0: fc’; 1: 0.90 fc’;
2: 0.85 fc’;3: 0.75 fc’
Mo, max
(kips.ft)Mo, max, 1 /Mo, max, 0
Mo, max, 2 /Mo, max, 0
Mo, max, 3 /Mo, max, 0
SQ21 2 2 394 0.9985
SQ22 2 2 562 0.9964
SQ23 2 2 406 0.9986
SQ24 2 2 572 0.9976
CIR21 2 2 373 0.9961
CIR22 2 2 520 0.9995
BI21 2 2 409 0.9990
BI22 2 2 519 0.9978
BI23 2 2 407 0.9990
BI24 2 2 516 0.9978
SQ11 2 3 259 0.9993
SQ12 2 3 412 0.9966
SQ13 2 3 263 0.9959
SQ14 2 3 417 0.9978
CIR11 2 3 250 0.9952
CIR12 2 3 382 0.9996
BI11 2 3 263 0.9993
BI12 2 3 369 0.9981
BI13 2 3 262 0.9994
BI14 2 3 366 0.9980
SQ21 2 3 394 0.9971
SQ22 2 3 562 0.9963
SQ23 2 3 405 0.9972
SQ24 2 3 570 0.9952
CIR21 2 3 372 0.9925
CIR22 2 3 519 0.9972
BI21 2 3 409 0.9990
BI22 2 3 518 0.9952
BI23 2 3 407 0.9991
BI24 2 3 515 0.9969
SQ11 3 1 258 0.9947

249
Sectiondesignation
seam location:0: no seam;
1:@compressionside; 2:@side;
3:@tension side
seam strength:0: fc’; 1: 0.90 fc’;
2: 0.85 fc’;3: 0.75 fc’
Mo, max
(kips.ft)Mo, max, 1 /Mo, max, 0
Mo, max, 2 /Mo, max, 0
Mo, max, 3 /Mo, max, 0
SQ12 3 1 410 0.9936
SQ13 3 1 261 0.9914
SQ14 3 1 416 0.9948
CIR11 3 1 251 0.9956
CIR12 3 1 381 0.9968
BI11 3 1 263 0.9984
BI12 3 1 369 0.9991
BI13 3 1 261 0.9985
BI14 3 1 366 0.9991
SQ21 3 1 393 0.9942
SQ22 3 1 559 0.9924
SQ23 3 1 403 0.9914
SQ24 3 1 567 0.9902
CIR21 3 1 373 0.9937
CIR22 3 1 517 0.9947
BI21 3 1 409 0.9974
BI22 3 1 519 0.9965
BI23 3 1 406 0.9974
BI24 3 1 516 0.9983
SQ11 3 2 257 0.9892
SQ12 3 2 410 0.9922
SQ13 3 2 261 0.9891
SQ14 3 2 414 0.9912
CIR11 3 2 250 0.9954
CIR12 3 2 380 0.9941
BI11 3 2 263 0.9976
BI12 3 2 369 0.9986
BI13 3 2 261 0.9977
BI14 3 2 366 0.9986
SQ21 3 2 391 0.9907
SQ22 3 2 557 0.9877

250
Sectiondesignation
seam location:0: no seam;
1:@compressionside; 2:@side;
3:@tension side
seam strength:0: fc’; 1: 0.90 fc’;
2: 0.85 fc’;3: 0.75 fc’
Mo, max
(kips.ft)Mo, max, 1 /Mo, max, 0
Mo, max, 2 /Mo, max, 0
Mo, max, 3 /Mo, max, 0
SQ23 3 2 401 0.9863
SQ24 3 2 565 0.9854
CIR21 3 2 371 0.9907
CIR22 3 2 517 0.9940
BI21 3 2 407 0.9938
BI22 3 2 518 0.9957
BI23 3 2 405 0.9937
BI24 3 2 516 0.9974
SQ11 3 3 255 0.9848
SQ12 3 3 407 0.9863
SQ13 3 3 259 0.9807
SQ14 3 3 412 0.9865
CIR11 3 3 249 0.9915
CIR12 3 3 379 0.9912
BI11 3 3 262 0.9960
BI12 3 3 368 0.9976
BI13 3 3 260 0.9925
BI14 3 3 366 0.9977
SQ21 3 3 387 0.9810
SQ22 3 3 553 0.9810
SQ23 3 3 384 0.9462
SQ24 3 3 561 0.9788
CIR21 3 3 370 0.9864
CIR22 3 3 514 0.9882
BI21 3 3 406 0.9911
BI22 3 3 517 0.9939
BI23 3 3 404 0.9909
BI24 3 3 514 0.9938

251
Table C.19 The effect of reduced strength SIMCON seams and seam locations on axial load capacities
Sectiondesignation
seam location:0: no seam;
1:@compressionside; 2:@side;
3:@tension side
seam strength:0: fc’; 1: 0.90 fc’;
2: 0.85 fc’;3: 0.75 fc’
Pn, max
(kips)Pn, max,1 / Pn, max,0
Pn, max,2 / Pn, max,0
Pn, max,3 / Pn, max,0
SQ11 0 0 1928317
SQ12 0 0 2225476
SQ13 0 0 1928139
SQ14 0 0 2225128
CIR11 0 0 1874788
CIR12 0 0 2171659
BI11 0 0 1942984
BI12 0 0 2239726
BI13 0 0 1942974
BI14 0 0 2239706
SQ21 0 0 2482656
SQ22 0 0 2780458
SQ23 0 0 2482556
SQ24 0 0 2780262
CIR21 0 0 2350755
CIR22 0 0 2648395
BI21 0 0 2492410
BI22 0 0 2789978
BI23 0 0 2492405
BI24 0 0 2789967
SQ11 1 1 1924020 0.9978
SQ12 1 1 2221180 0.9981
SQ13 1 1 1923843 0.9978
SQ14 1 1 2220831 0.9981
CIR11 1 1 1872485 0.9988
CIR12 1 1 2169356 0.9989
BI11 1 1 1938879 0.9979
BI12 1 1 2235621 0.9982
BI13 1 1 1938870 0.9979
BI14 1 1 2235601 0.9982

252
Sectiondesignation
seam location:0: no seam;
1:@compressionside; 2:@side;
3:@tension side
seam strength:0: fc’; 1: 0.90 fc’;
2: 0.85 fc’;3: 0.75 fc’
Pn, max
(kips)Pn, max,1 / Pn, max,0
Pn, max,2 / Pn, max,0
Pn, max,3 / Pn, max,0
SQ21 1 1 2473085 0.9961
SQ22 1 1 2770887 0.9966
SQ23 1 1 2472985 0.9961
SQ24 1 1 2770691 0.9966
CIR21 1 1 2344734 0.9974
CIR22 1 1 2642374 0.9977
BI21 1 1 2483171 0.9963
BI22 1 1 2780738 0.9967
BI23 1 1 2483165 0.9963
BI24 1 1 2780727 0.9967
SQ11 1 2 1924852 0.9982
SQ12 1 2 2222011 0.9984
SQ13 1 2 1924675 0.9982
SQ14 1 2 2221663 0.9984
CIR11 1 2 1871394 0.9982
CIR12 1 2 2168266 0.9984
BI11 1 2 1939332 0.9981
BI12 1 2 2236074 0.9984
BI13 1 2 1939322 0.9981
BI14 1 2 2236054 0.9984
SQ21 1 2 2475544 0.9971
SQ22 1 2 2773346 0.9974
SQ23 1 2 2475444 0.9971
SQ24 1 2 2773150 0.9974
CIR21 1 2 2343386 0.9969
CIR22 1 2 2641026 0.9972
BI21 1 2 2485014 0.9970
BI22 1 2 2782582 0.9973
BI23 1 2 2485009 0.9970
BI24 1 2 2782570 0.9973
SQ11 1 3 1924928 0.9982
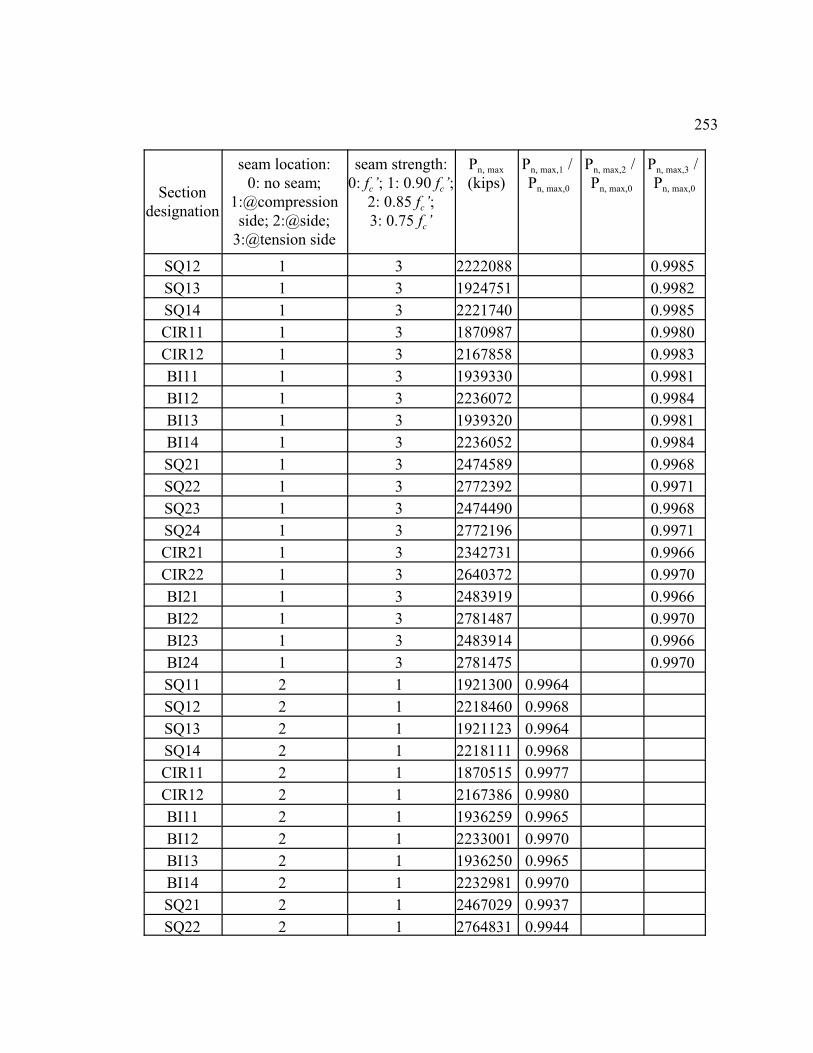
253
Sectiondesignation
seam location:0: no seam;
1:@compressionside; 2:@side;
3:@tension side
seam strength:0: fc’; 1: 0.90 fc’;
2: 0.85 fc’;3: 0.75 fc’
Pn, max
(kips)Pn, max,1 / Pn, max,0
Pn, max,2 / Pn, max,0
Pn, max,3 / Pn, max,0
SQ12 1 3 2222088 0.9985
SQ13 1 3 1924751 0.9982
SQ14 1 3 2221740 0.9985
CIR11 1 3 1870987 0.9980
CIR12 1 3 2167858 0.9983
BI11 1 3 1939330 0.9981
BI12 1 3 2236072 0.9984
BI13 1 3 1939320 0.9981
BI14 1 3 2236052 0.9984
SQ21 1 3 2474589 0.9968
SQ22 1 3 2772392 0.9971
SQ23 1 3 2474490 0.9968
SQ24 1 3 2772196 0.9971
CIR21 1 3 2342731 0.9966
CIR22 1 3 2640372 0.9970
BI21 1 3 2483919 0.9966
BI22 1 3 2781487 0.9970
BI23 1 3 2483914 0.9966
BI24 1 3 2781475 0.9970
SQ11 2 1 1921300 0.9964
SQ12 2 1 2218460 0.9968
SQ13 2 1 1921123 0.9964
SQ14 2 1 2218111 0.9968
CIR11 2 1 1870515 0.9977
CIR12 2 1 2167386 0.9980
BI11 2 1 1936259 0.9965
BI12 2 1 2233001 0.9970
BI13 2 1 1936250 0.9965
BI14 2 1 2232981 0.9970
SQ21 2 1 2467029 0.9937
SQ22 2 1 2764831 0.9944

254
Sectiondesignation
seam location:0: no seam;
1:@compressionside; 2:@side;
3:@tension side
seam strength:0: fc’; 1: 0.90 fc’;
2: 0.85 fc’;3: 0.75 fc’
Pn, max
(kips)Pn, max,1 / Pn, max,0
Pn, max,2 / Pn, max,0
Pn, max,3 / Pn, max,0
SQ23 2 1 2466929 0.9937
SQ24 2 1 2764635 0.9944
CIR21 2 1 2340527 0.9956
CIR22 2 1 2637963 0.9961
BI21 2 1 2477286 0.9939
BI22 2 1 2774854 0.9946
BI23 2 1 2477281 0.9939
BI24 2 1 2774842 0.9946
SQ11 2 2 1922622 0.9970
SQ12 2 2 2219781 0.9974
SQ13 2 2 1922444 0.9970
SQ14 2 2 2219433 0.9974
CIR11 2 2 1869205 0.9970
CIR12 2 2 2166076 0.9974
BI11 2 2 1937000 0.9969
BI12 2 2 2233742 0.9973
BI13 2 2 1922622 0.9969
BI14 2 2 2233722 0.9973
SQ21 2 2 2470984 0.9953
SQ22 2 2 2768786 0.9958
SQ23 2 2 2470884 0.9953
SQ24 2 2 2768590 0.9958
CIR21 2 2 2338652 0.9949
CIR22 2 2 2636292 0.9954
BI21 2 2 2480303 0.9951
BI22 2 2 2777871 0.9957
BI23 2 2 2480298 0.9951
BI24 2 2 2777859 0.9957
SQ11 2 3 1922716 0.9971
SQ12 2 3 2219875 0.9975
SQ13 2 3 1922539 0.9971

255
Sectiondesignation
seam location:0: no seam;
1:@compressionside; 2:@side;
3:@tension side
seam strength:0: fc’; 1: 0.90 fc’;
2: 0.85 fc’;3: 0.75 fc’
Pn, max
(kips)Pn, max,1 / Pn, max,0
Pn, max,2 / Pn, max,0
Pn, max,3 / Pn, max,0
SQ14 2 3 2219527 0.9975
CIR11 2 3 1868579 0.9967
CIR12 2 3 2165450 0.9971
BI11 2 3 1936961 0.9969
BI12 2 3 2233703 0.9973
BI13 2 3 1936951 0.9969
BI14 2 3 2233683 0.9973
SQ21 2 3 2469353 0.9946
SQ22 2 3 2767155 0.9952
SQ23 2 3 2469253 0.9946
SQ24 2 3 2766959 0.9952
CIR21 2 3 2337653 0.9944
CIR22 2 3 2635293 0.9951
BI21 2 3 2478441 0.9944
BI22 2 3 2776008 0.9950
BI23 2 3 2478435 0.9944
BI24 2 3 2775997 0.9950
SQ11 3 1 1915616 0.9934
SQ12 3 1 2212775 0.9943
SQ13 3 1 1915439 0.9934
SQ14 3 1 2212427 0.9943
CIR11 3 1 1866016 0.9953
CIR12 3 1 2162887 0.9960
BI11 3 1 1931209 0.9939
BI12 3 1 2227951 0.9947
BI13 3 1 1931199 0.9939
BI14 3 1 2227931 0.9947
SQ21 3 1 2454112 0.9885
SQ22 3 1 2751914 0.9897
SQ23 3 1 2454012 0.9885
SQ24 3 1 2751718 0.9897

256
Sectiondesignation
seam location:0: no seam;
1:@compressionside; 2:@side;
3:@tension side
seam strength:0: fc’; 1: 0.90 fc’;
2: 0.85 fc’;3: 0.75 fc’
Pn, max
(kips)Pn, max,1 / Pn, max,0
Pn, max,2 / Pn, max,0
Pn, max,3 / Pn, max,0
CIR21 3 1 2331102 0.9916
CIR22 3 1 2628255 0.9924
BI21 3 1 2466026 0.9894
BI22 3 1 2763593 0.9905
BI23 3 1 2466020 0.9894
BI24 3 1 2763582 0.9905
SQ11 3 2 1918025 0.9947
SQ12 3 2 2215184 0.9954
SQ13 3 2 1917848 0.9947
SQ14 3 2 2214836 0.9954
CIR11 3 2 1864593 0.9946
CIR12 3 2 2161464 0.9953
BI11 3 2 1932625 0.9947
BI12 3 2 2229367 0.9954
BI13 3 2 1932615 0.9947
BI14 3 2 2229347 0.9954
SQ21 3 2 2461939 0.9917
SQ22 3 2 2759741 0.9925
SQ23 3 2 2461839 0.9917
SQ24 3 2 2759545 0.9925
CIR21 3 2 2329061 0.9908
CIR22 3 2 2626701 0.9918
BI21 3 2 2471770 0.9917
BI22 3 2 2769338 0.9926
BI23 3 2 2471765 0.9917
BI24 3 2 2769327 0.9926
SQ11 3 3 1917652 0.9945
SQ12 3 3 2214811 0.9952
SQ13 3 3 1917475 0.9945
SQ14 3 3 2214463 0.9952
CIR11 3 3 1863634 0.9941
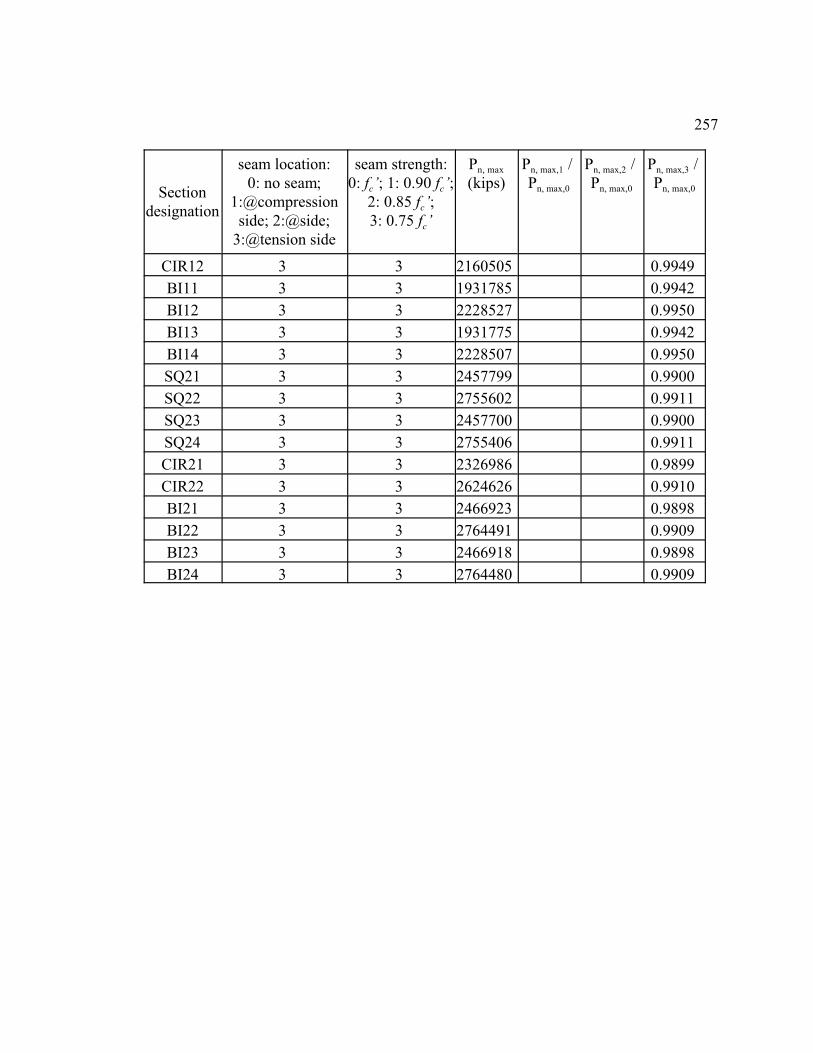
257
Sectiondesignation
seam location:0: no seam;
1:@compressionside; 2:@side;
3:@tension side
seam strength:0: fc’; 1: 0.90 fc’;
2: 0.85 fc’;3: 0.75 fc’
Pn, max
(kips)Pn, max,1 / Pn, max,0
Pn, max,2 / Pn, max,0
Pn, max,3 / Pn, max,0
CIR12 3 3 2160505 0.9949
BI11 3 3 1931785 0.9942
BI12 3 3 2228527 0.9950
BI13 3 3 1931775 0.9942
BI14 3 3 2228507 0.9950
SQ21 3 3 2457799 0.9900
SQ22 3 3 2755602 0.9911
SQ23 3 3 2457700 0.9900
SQ24 3 3 2755406 0.9911
CIR21 3 3 2326986 0.9899
CIR22 3 3 2624626 0.9910
BI21 3 3 2466923 0.9898
BI22 3 3 2764491 0.9909
BI23 3 3 2466918 0.9898
BI24 3 3 2764480 0.9909