abstract - jalt testing & evaluation...
TRANSCRIPT

Article
25
Rasch analysis of a congruent and incongruent collocations test
Christopher Nicklin and Garrett DeOrio
Nippon Medical School
Abstract
In order to investigate the hypothesis that collocations might be easier to acquire productively through the use of illustrations
due to the pictorial superiority effect (Nelson, Reed, & Walling, 1976), the Congruent and Incongruent Collocations (CIC)
test was specifically designed to assess the knowledge of a group of students regarding a group of 15 congruent and 15
incongruent collocational phrases. The CIC test was developed to be administered as a pretest, posttest, and delayed posttest
to a group of second year Japanese medical students (N = 109).
The results of the pretest were analysed using the Rasch dichotomous model (Rasch, 1960), which revealed that the CIC test
was of an appropriate difficulty level for the students with the majority of the items being well targeted. However, not all of
the items fit the expectations of the Rasch model, and a test for invariance showed that the CIC test was not a reliably invariant
instrument for assessing a samples knowledge regarding the group of collocations being tested.
Keywords: Rasch analysis, congruent and incongruent collocations, collocations test, pictorial superiority effect, vocabulary
The effectiveness of pictorial elucidation on vocabulary acquisition has been extensively investigated
(Altarriba & Knickerbocker, 2011; Elley, 1989; Lado, Baldwin, & Lobo, 1967; Lotto & De Groot, 1998;
Palmer, 1982) producing mixed results. Boers, Lindstromberg, Littlemore, Stengers, and Eyckmans
(2008) suggested that pictorial support for vocabulary is effective as a pathway for retention. However,
Boers et al. (2008) also quoted other literature (Fodor, 1981; Gombrich, 1972) that suggested pictorial
support could be fruitless, or even counterproductive, with regards to communicating the meaning of
vocabulary due to the highly ambiguous qualities inherent in pictures. Boers, Piquer Piriz, Stengers, and
Eyckmans (2009) focused specifically on the effect of pictorial elucidation on the recollection of idioms,
concluding that the effect was primarily associated with the recollection of concepts, but not the precise
vocabulary items involved. For example, in their posttest, students were likely to produce playing second
violin as opposed to playing second fiddle (p. 376).
Although Boers et al. (2009) offered no statistical evidence to suggest that pictures aided the retrieval of
idioms for the purposes of production, the same might not be true for all multiword expressions. Whereas
Boers et al. (2009) was concerned with idioms, the current study is concerned with collocations. Sinclair
(1991) characterized collocations as words with a tendency for occurring together, whether in pairs or
groups, and not necessarily in adjacent positions (p. 115). Boers, Demecheleer, Coxhead, and Webb
(2014) distinguished idioms from collocations due to the often semantically non-decomposable nature of
idioms (p. 70). For example, the meaning of the individual words of an idiomatic expression, such as kick
the bucket, could be known to a learner, but the meaning of the intact phrase could still elude them. This
ambiguous nature of idioms is generally less true for collocations, which are typically clearer, for example,
fully aware or broken window. According to Yamashita and Jiang (2010), collocations are often congruent
between languages, meaning that the expression has an equivalent with the same meaning in two or more
languages. For example, the collocations broken window and cold tea are congruent between English and
Japanese, while the idiomatic expressions on the other hand and once in a blue moon are incongruent (p.
649). It was hypothesized by the authors of this study that due to collocations lacking the complex
idiomatic qualities of semantic non-decomposability and non-translatability, collocations might be easier
to acquire productively, and might be more susceptible to the pictorial superiority effect (Nelson, Reed,
& Walling, 1976), which proclaims that pictures have the potential to provide a qualitatively superior code
compared to verbal labels (p. 523) due to the code being processed twice, once as language and once as a

26 Congruent and Incongruent Collocations
Shiken 20(2). November 2016.
non-verbal event (Boers et al., 2009; Paivio, 1990). It was also hypothesized that the pictorial superiority
effect could potentially have a greater effect on the acquisition of congruent collocations as opposed to
incongruent collocations, due to the latter’s relationship with the learners’ L1 making them easier to
acquire.
Due to the lack of a suitable existing test of collocational production with which to test these two
hypotheses, the Congruent and Incongruent Collocations (CIC) test was specifically designed to assess
the knowledge of a group of students regarding a group of 15 congruent and 15 incongruent collocational
phrases. The test was developed to be administered as a pretest, posttest, and delayed posttest to a group
of second year Japanese medical students. Following a pretest, the participants were subjected to a short,
three week teaching treatment under one of two conditions. Under one condition, the group of 30
collocations were presented to the students without pictures at a rate of 10 collocations each week, while
the second condition involved a picture-based teaching treatment of the collocations delivered at the same
rate to determine the extent of the pictorial superiority effect on the acquisition of the group collocations.
A posttest was administered one week after the final treatment, and a surprise, delayed posttest was
administered five months after the initial posttest. At each testing stage, the same test items were used,
but the order of the items was changed so that students were not answering based upon memories of the
previous test. The sole use of the results was to determine the effectiveness of the two teaching conditions
upon the acquisition of the group of collocations by the students, meaning that the results were
inconsequential for the students.
For the CIC test to be a valid instrument for conducting research, there are some basic criteria that it
should meet. First, the difficulty level of the test should be appropriate for the sample. If the test format
is too difficult for the students to understand, the results will not reflect their collocation knowledge,
merely their ability to understand the test. Conversely, if the test is too easy, the scores will be high and
there will be less room for improvement through the teaching conditions. This would be hugely
problematic as the sole reason for the existence of the test is as a measure of the effectiveness of teaching
conditions. Second, each of the test items needs to be well targeted. If items are not well targeted, there is
a danger that they are measuring something other than what is intended to be measured, which in this case
is the sample’s knowledge of a group of congruent and incongruent collocations. Third, there needs to be
evidence that the measures created for the CIC test results can be treated as reliable interval-level
measurements. If not, student development, with regards to improvement on the construct under
investigation as a result of the teaching conditions, cannot be said to be truly measureable, and therefore,
not reliably comparable between pretest, posttest, and delayed posttest. Fourth, as there is the possibility
that the test will be used again in the future to test other samples, the test needs to display invariance
across measuring contexts. If the test does not display invariance, its use would be equivalent to attempting
the measurement of change with a measure that changes (Bond, 2016). To determine whether or not the
CIC test met these four basic criteria, the test was subjected to analysis using the Rasch dichotomous
model (Rasch, 1960), which was chosen due to the dichotomous nature of the recorded answers for the
test items. If Rasch analysis were to reveal failings of these criteria, it is important to investigate more
deeply and question why, in order that the test can improved for future use.
In this paper, by application of Rasch analysis to the results of the CIC pretest, the following research
questions are addressed:
1. Is the CIC test at a suitable level of difficulty for the particular group of students being tested?
2. Are all of the items in the CIC test well targeted to the construct being measured?
3. Do all items in the CIC test fit the expectations of the Rasch model?
4. Does the CIC test display invariance across disparate subsamples?
5. How could the CIC test be improved for future use in other research projects?

Nicklin and DeOrio 27
Shiken 20(2). November 2016.
Method
Participants
The sample in this study was composed of an entire year group of second year students at a private medical
school in Tokyo (N = 109), consisting of 66 (60.60%) male and 43 (39.4%) female members. All of the
students were Japanese and aged between 19 and 31 years old at the time of the pretest (M = 21.36). With
regards to the English ability of the sample, the Test of English as a Foreign Language (TOEFL),
Vocabulary Size Test (VST) (Nation & Beglar, 2007), and raw CIC test scores of the sample were evenly
distributed, with skewness and kurtosis falling within the acceptable boundaries of -2.00 and 2.00 (Brown,
1997; George & Mallery, 2010) (see Table 1).
Table 1
Descriptive Statistics
N Min Max M SE SD Skew SES Kurt SEK
Age 109 19 31 21.36 0.18 1.83 2.41 0.23 8.51 0.46
TOEFL 99 423 623 495.96 3.56 35.41 0.58 0.24 0.87 0.48
VST 99 39 92 61.88 1.04 10.38 -0.11 0.24 0.02 0.48
CIC Pretest 109 2 29 16.75 0.60 6.29 -0.36 0.23 -0.60 0.46
CIC Congruent 109 1 15 9.63 0.36 3.77 -0.46 0.23 -0.83 0.46
CIC Incongruent 109 0 15 6.90 0.30 3.16 0.02 0.23 -0.64 0.46
As mentioned above, the CIC test was developed due to the lack of existing instruments deemed
appropriate for testing the production of congruent and incongruent collocations. In order to create the
CIC test, the Yamashita and Jiang (2010) list of 24 congruent and 24 incongruent collocations was adapted
due to the fact that the list already served the purpose of being representative of collocations that are
congruent and incongruent between English and Japanese. Forty-eight was considered a number too large
for teaching in a small scale treatment, so the collocations were analysed using the British National Corpus
(BNC) and the Corpus of Contemporary American English (COCA) to obtain information pertaining to
frequency. An average of the frequency values taken from the two corpora was calculated to decide which
were the most common across both British and American English. Five weeks of sessions were available
for both treatments, which were broken down into a pretest session, three weeks of teaching, and a posttest
session. A group of ten collocations was deemed a suitable amount to study for one session, and so the
most frequent 30 were chosen for treatment. The test was constructed to provide the learner with an
example sentence adapted from COCA for each collocation, and presented to the test taker with two blank
spaces where the collocation should be. COCA was chosen as it generally presented the larger amount of
example sentences. As the sentence alone was considered to be insufficient for collocation retrieval, a
clue describing the two words was also included. An example test item for the collocation quiet time is:
I need some ________ ________ to prepare for this appointment.
[a period without loud noise, interruptions, or distractions]
Acting as a final piece of information, all of the individual words featured in the 30 collocations were
presented in alphabetical order in a word bank. Through the use of a context sentence and a clue, the test
was designed to give the test taker two chances at retrieval. If the test taker was able to retrieve and
produce the correct collocation, the participant would find the two words waiting for them in the word
bank. If the test taker did not know the collocation, time constraints and the daunting size of the word
bank would prevent the collocation from being worked out logically through use of the word bank.

28 Congruent and Incongruent Collocations
Shiken 20(2). November 2016.
The test went through three iterations before the fourth was administered in the pretest. The first two
versions were tested on thirteen Japanese, Russian, and French students aged between 13 and 19 years old
(M = 15.92), of abilities ranging from B1 to C1 on the Common European Framework of Reference for
Languages (CEFR, Council of Europe, 2001) as determined by results from the Cambridge Preliminary
English test (PET), First Certificate in English (FCE), and Certificate of Advanced English (CAE)
examinations. The test was considered to be successful, as it was understood and competently performed
by the lowest level students, yet provided a challenge for the highest level students, whose feedback
appropriately suggested that the format “twisted” the usual format of such exercises and forced them to
think about what they would say, rather than relying on logically deducing the answer from a presented
set of words. The third version was administered in a pilot study to two intermediate level Japanese
women. A fourth version of the test was developed through an analysis with Lextutor (Cobb, n.d.) in an
attempt to avoid construct-irrelevant difficulty (Messick, 1995), whereby a task involves aspects
extraneous to the target construct, hence making it irrelevantly difficult for certain members of the test
sample. By replacing all proper nouns with pronouns, and replacing words from outside of the top 2000
word families on the general service list (GSL, West, 1953) with words from the list, it was believed that
there was less chance of students being unable to answer questions due to lack of higher level vocabulary
knowledge or cultural knowledge, and wrong answers could be more reliably ascertained to lack of
collocational knowledge as opposed to lack of lexical knowledge. Some off-list words remained on the
test through lack of a low level synonym (e.g. getaway), or a belief that the antiquated nature of the GSL
meant an inability to recognise words that the average 21st Century Japanese medical school English
students would be likely to know (e.g. computer and online).
All 109 pretests were marked by the authors, with one point allotted for each answer where both words of
the required collocation were successfully retrieved. As there were 30 items, the highest possible score
was 30. There were no points allotted for one correct word, and, despite the robust nature of the Rasch
model in the face of missing data (Bond & Fox, 2015), blank answers were treated as incorrect answers.
A separate score out of 15 was recorded for both congruent and incongruent collocations. The three
separate scores were recorded on an Excel 16.0.4 spreadsheet. On a separate spreadsheet, the answers for
each of the 109 test takers on each of the 30 test items were dichotomously coded with a value of 1 for a
correct answer and 0 for an incorrect answer. This spreadsheet was opened in Winsteps 3.75.0 (Linacre,
2012), where it was converted into a data matrix and analysed using the Rasch dichotomous model. In
order to test for invariance, Ben Wright’s challenge was taken up, which involved dividing the sample
into two subsamples according to ability and determining whether the item difficulties remain stable or
not (Bond & Fox, 2015, p. 87). This was achieved by transferring the measures and SEs for the two subsets
into a pre-prepared spreadsheet downloaded from http://www.winsteps.com/BF3/bondfox3.htm.
Results
The summary statistics of the analysis results (see Table 2 and Table 3) revealed an item reliability statistic
of .96 and a person reliability statistic of .84, which suggests that this order of estimates is likely to be
replicated with other samples. However, the item reliability should not be over interpreted as it is possibly
due to a large sample size (Bond & Fox, p. 70). The item separation statistic is a much more telling statistic
(p. 70) as it reveals the extent to which the sample has defined a meaningful variable by the spread of the
items along the measure (Fisher, 1992). According to Linacre (2012), a low item separation of < 3 implies
that the sample is not large enough to confirm the item difficulty hierarchy, or construct validity, of the
test. This sample recorded a ratio of 5.19, which when added to the formula (4G+1)/3, where G =
separation, is used to calculate the number of statistically different performance strata observable in a
given sample. In this case, there are 7.25 significantly different performance strata observable, which
implies that seven levels of performance can be consistently identified for this sample using this test

Nicklin and DeOrio 29
Shiken 20(2). November 2016.
(Wright, 1996). With regards to person separation, this sample recorded a ratio of 2.58, which is above
the person separation threshold of 2.00, suggesting that the test is sensitive enough to distinguish between
high and low performers.
Table 2
Summary Statistics of Persons
Total Model Infit Outfit
Score Count Measure Error Mnsq Zstd Mnsq Zstd
Mean 16.7 30.0 0.25 0.49 1.01 0.0 1.05 0.1
S.D. 6.2 0.0 1.41 0.13 0.29 1.0 0.96 0.9
Max. 29.0 30.0 5.16 1.42 3.05 2.9 9.90 6.0
Min. 2.0 30.0 -3.34 0.42 0.51 -2.7 0.21 -1.2
Real Rmse 0.56 True Sd 1.30 Separation 2.29 Person Reliability .84
Model Rmse 0.51 True Sd 1.32 Separation 2.58 Person Reliability .87
S.E. Of Person Mean = 0.14
Table 3
Summary Statistics of Items
Total Model Infit Outfit
Score Count Measure Error Mnsq Zstd Mnsq Zstd
Mean 60.8 109.0 0.00 0.27 0.98 -0.1 1.26 0.3
S.D. 23.8 .0 1.65 0.15 0.12 0.9 1.62 1.9
Max. 97.0 109.0 6.04 1.05 1.20 1.3 9.90 9.6
Min. 1.0 109.0 -2.48 0.22 0.57 -2.1 0.03 -1.5
Real Rmse 0.32 True Sd 1.62 Separation 5.12 Item Reliability .96
Model Rmse 0.31 True Sd 1.62 Separation 5.19 Item Reliability .96
S.E. Of Item Mean = 0.31
The distribution of the item and person measures as displayed on a Wright map (see Figure 1) illustrated
that the CIC test was relatively well matched for this group of students. If anything, the CIC test might be
considered slightly challenging, as the likelihood of any one of these students answering item 26i (bitter
wind) correctly is less than 50%, while three of the 109 students had a less than 50% chance of getting
any of the items correct. Table 4 shows that item 26i was only answered correctly by one student, while
the highest number of correct answers for any given item was 97 for item 14i (take medicine). The i in 14i
indicates that the collocation in question (take medicine) is an incongruent collocation, and the fact that it
is the easiest item could be read as contradicting the hypothesis that the congruent collocations would be
the easiest for the students. However, the sample consists of a group of medical students, and so it should
come as less of a surprise that the easiest collocation for them is one that is related to their field of study
(take medicine).

30 Congruent and Incongruent Collocations
Shiken 20(2). November 2016.
MEASURE PERSON - MAP - ITEM <more>|<rare> 6 + 26i | | | 67 | 5 + | | | | 4 + 106 | | | |T 3 15 55 T+ | 14 78 79 | | 13i 11 48 87 | 12i 4i 2 + 11i 52 61 68 95 | S|S 12 27 28 42 108 | 37 60 73 83 88 89 102 104 | 1 13 21 29 30 40 51 62 90 109 + 8 20 25 45 59 66 96 | 31 36 38 44 50 65 82 92 | 24i 3 22 74 97 | 16i 1c 28i 26 35 54 85 M| 25i 27i 8c 0 2 32 47 57 77 98 100 +M 21c 30c 53 63 64 105 | 3i 17 39 69 84 101 | 18c 20c 23c 5i 4 23 33 41 56 71 81 86 92 94 103 | 19c 29c 46 58 76 | 7c -1 16 49 72 + 9c 7 10 19 43 91 99 S| 9 | 22c 1 18 70 |S 15i 17c 2i 6c | -2 24 80 + 10c 6 | 34 | 14i T| 75 | -3 + |T 5 107 | | | -4 + <less>|<frequent>
Figure 1. Item-person map for CIC test analysis.

Nicklin and DeOrio 31
Shiken 20(2). November 2016.
Table 4
CIC Test Item Difficulty Estimates with Associated Error Estimates
Total Infit Outfit
Item Collocation Score Measure SE MNSQ ZSTD MNSQ ZSTD
26i Bitter wind 1 6.04 1.05 0.57 -0.30 0.33 -1.50
13i Near collapse 18 2.38 0.29 0.93 -0.30 0.82 -0.30
4i Narrow escape 21 2.14 0.27 0.99 0.00 1.06 0.30
12i Buy insurance 21 2.14 0.27 1.06 0.40 0.93 0.00
11i Ill health 23 1.99 0.27 1.20 1.30 1.29 0.90
24i Broken heart 47 0.62 0.22 1.03 0.40 1.42 1.90
1c Drop bombs 51 0.42 0.22 1.03 0.40 1.20 1.00
28i Strong coffee 52 0.37 0.22 0.97 -0.20 0.93 -0.30
16i Coming year 53 0.32 0.22 0.86 -1.50 0.78 -1.10
27i Kill time 55 0.23 0.22 0.82 -2.10 0.78 -1.10
8c Final year 57 0.13 0.22 0.99 0.00 1.04 0.30
25i Make tea 57 0.13 0.22 0.93 -0.70 0.94 -0.30
30c Broken window 58 0.08 0.22 0.85 -1.70 0.80 -1.00
21c Light touch 59 0.03 0.22 0.86 -1.60 0.82 -0.90
3i Slow learner 64 -0.23 0.23 0.97 -0.20 0.87 -0.60
5i Heavy traffic 67 -0.38 0.23 1.09 0.90 0.98 0.00
18c Lucky winner 67 -0.38 0.23 1.13 1.30 1.11 0.50
20c Great value 67 -0.38 0.23 1.11 1.00 1.06 0.30
23c Wide street 67 -0.38 0.23 0.96 -0.30 1.00 0.10
29c Write a novel 71 -0.59 0.23 0.89 -1.00 0.85 -0.50
19c Front tire 72 -0.65 0.23 1.12 1.10 1.05 0.30
7c Quick action 76 -0.87 0.24 0.94 -0.50 0.87 -0.40
9c Quiet time 79 -1.05 0.25 0.92 -0.70 0.73 -1.00
22c Cold tea 83 -1.30 0.26 1.08 0.60 1.25 0.90
2i Take a shower 86 -1.51 0.27 1.09 0.60 1.05 0.30
17c Buy a computer 86 -1.51 0.27 0.89 -0.70 0.77 -0.60
15i Catch a cold 87 -1.58 0.27 1.10 0.70 1.22 0.70
6c Flat land 88 -1.65 0.28 1.08 0.50 1.05 0.30
10c Heavy stone 93 -2.07 0.30 1.09 0.50 9.90 9.60
14i Take medicine 97 -2.48 0.34 0.95 -0.10 1.19 0.50
Test Items
A Winsteps analysis revealed that the most difficult test item on the CIC test is 26i (bitter wind) with a
measure of 6.04 logits (SE = 1.05) and only one student out of the 109 total answering correctly, while
the easiest item is 14i (take medicine) with a measure of -2.48 logits (SE = 0.34) and 97 students correctly
identifying the collocation (see Table 4). Logits are probabilistic, interval scale representations of the raw
scores that are calculated from ordinal scale raw scores, thus making logits a more reliable form of
measurement. A spread of 8.52 logits for 30 items initially indicates that the difficulty of the items seems
to be well spread. However, Figure 2 shows a gap of over three logits between the most difficult item (26i,
bitter wind, 6.04 logits, SE = 1.05) and the next most difficult item (13i, near collapse, 2.38 logits, SE =
0.29), suggesting that the most difficult item is not well targeted to this group and requires further
investigation.

32 Congruent and Incongruent Collocations
Shiken 20(2). November 2016.
Table 3 reveals that the mean error for the sample was 0.27 while Table 4 shows that all but two of the
items yields standard error (SE) estimates below or equal to 0.30, which reinforces the previous claim that
the CIC test was a suitable level for this group of test takers. The two items falling outside of the 0.30
threshold were item 14i (take medicine, SE = 0.34), which was the least difficult item, and item 26i (bitter
wind, SE = 1.05), which was the most difficult item. Item 14i is only slightly over the 0.30 threshold, but
with an SE of 1.05, item 26i is much larger than the rest of the items, as is visually illustrated in Figure 2,
and should be investigated further.
Figure 2. Pathway for CIC test items.
Winsteps analysis provides “fit” statistics for each test item, which specify how the data fit the Rasch
model in terms of accuracy or predictability. Mean square fit statistics indicate the randomness, or the
amount of distortion of the measuring system, while standardized fit statistics indicate how well the data
fit the model (Linacre, 2002). Standardized fit statistics can be rendered meaningless by a large sample
size, and can even be ignored if the mean square values are acceptable (Linacre, 2012). Table 4 shows
that the majority of the CIC test items displayed acceptable levels of fit, with mean square values between
the recommended 0.75 and 1.30, and standardized forms between the recommended -2.00 and 2.00 (Bond
& Fox, 2015). However, five items displayed statistics that warranted further investigation. The
standardized infit statistic for item 27i (kill time) was -2.10, while the outfit mean square value for item
9c (quiet time) was 0.73, suggesting that both of these items slightly overfit the model. Both the infit mean
square (0.57) and outfit mean square (0.33) values for item 26i (bitter wind) were below 0.75, indicating
that this item also overfit. Overfitting items are too determined and display too little variation, to the extent
that they fit the model too well. The danger of overfitting items is the potential to be misled into assuming
that the quality of our measures is better that it actually is, but in all likelihood there will be no practical
implications whatsoever (Bond & Fox, p. 271). In contrast to the overfitting items, item 24i (broken heart)
and 10c (heavy stone) both underfit the model, displaying outfit mean square statistics of 1.42 and 9.90
respectively. Figure 2 clearly illustrates that item 10c is much more problematic, isolated from the rest of
the items with a worryingly high standardized outfit statistic of 9.60 (see Table 4), which is seven units
above the acceptable upper limit boundary of 2.00. Unlike overfitting items, underfitting items are too
haphazard and unpredictable, and should be further investigated to decipher what went wrong.
1c
2i
3i
4i
5i
6c7c
8c
9c
10c
11i12i13i
14i
15i
16i
17c
18c19c20c21c
22c
23c
24i25i
26i
27i 28i
29c30c
-4
-3
-2
-1
0
1
2
3
4
5
6
7
8
-4 -2 0 2 4 6 8 10 12
Less
Measure
s
M
ore
Overfit t Outfit Zstd Underfit

Nicklin and DeOrio 33
Shiken 20(2). November 2016.
Test Persons
The results of a Winsteps analysis revealed that the test taker with the highest ability on this test was
number 67, who achieved 29 correct answers and a measure of 5.16 logits (SE = 1.42), while the test taker
with the lowest ability was number 107, who achieved a measure of -3.34 logits (SE = 0.76) due to
answering only two of the questions correctly (see Table 5). Similar to the items, the test takers are spread
over 8.50 logits, but there is no large gap of over 3.00 logits between any of the test takers, meaning that
the spread is more even, as can be seen in Figure 1.
Table 5
CIC Test Selected Person Estimates with Associated Error Estimates
Total Infit Outfit
Person Score Measure SE MNSQ ZSTD MNSQ ZSTD
67 29 5.16 1.42 3.05 1.60 9.90 6.00
63 15 -0.16 0.42 0.69 -2.10 0.57 -0.80
105 15 -0.16 0.42 0.69 -2.10 0.56 -0.08
84 14 -0.34 0.42 1.53 2.90 1.87 1.60
81 12 -0.70 0.42 1.41 2.30 2.33 2.20
46 11 -0.88 0.43 0.59 -2.70 0.48 -1.20
107 2 -3.34 0.76 1.24 0.60 2.48 1.30
The mean error of 0.49 could be taken to mean that the sample of test takers was not as well suited to the
test as the test was to the sample test takers, which seems paradoxical. However, this is a result of the fact
that the sample consisted of 109 test takers compared to a group of only 30 items. The larger the number
of cases, the less measurement error occurs. A Winsteps analysis of the items revealed that the measures
of 75 of the 109 test takers produced error measurements > 0.42 and < 0.50, with all but four cases < 0.76.
The largest two were test takers 106 and 67 with SEs of 0.97 and 1.42 respectively, which is clearly visible
in Figure 3.
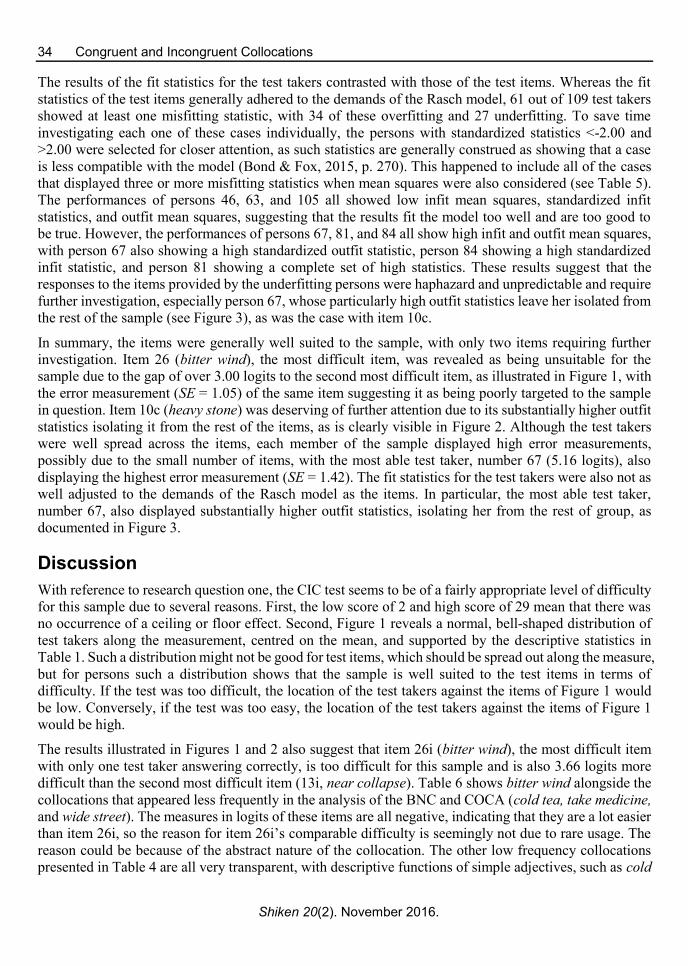
Figure 3. Pathway for CIC test persons.
1
23
4
5
6
7
8
910
1112
13
1415
1617
1819
20 2122
23
24
2526
27 282930
3132
33
34
3536
3738
39
40
41
42
43
4445
46
47
48
49
5051
52
5354
55
5657
58
596061
62
63 646566
67
68
69
70
7172
73
74
75
76
77
7879
80
81
8283
848586
87
88 8990
91
92
9294
95
9697
98
99
100101
102
103
104
105
106
107
108109
-5
-4
-3
-2
-1
0
1
2
3
4
5
6
-2 0 2 4 6 8
Less
Measure
s
M
ore
Overfit t Outfit Zstd Underfit
34 Congruent and Incongruent Collocations
Shiken 20(2). November 2016.
The results of the fit statistics for the test takers contrasted with those of the test items. Whereas the fit
statistics of the test items generally adhered to the demands of the Rasch model, 61 out of 109 test takers
showed at least one misfitting statistic, with 34 of these overfitting and 27 underfitting. To save time
investigating each one of these cases individually, the persons with standardized statistics <-2.00 and
>2.00 were selected for closer attention, as such statistics are generally construed as showing that a case
is less compatible with the model (Bond & Fox, 2015, p. 270). This happened to include all of the cases
that displayed three or more misfitting statistics when mean squares were also considered (see Table 5).
The performances of persons 46, 63, and 105 all showed low infit mean squares, standardized infit
statistics, and outfit mean squares, suggesting that the results fit the model too well and are too good to
be true. However, the performances of persons 67, 81, and 84 all show high infit and outfit mean squares,
with person 67 also showing a high standardized outfit statistic, person 84 showing a high standardized
infit statistic, and person 81 showing a complete set of high statistics. These results suggest that the
responses to the items provided by the underfitting persons were haphazard and unpredictable and require
further investigation, especially person 67, whose particularly high outfit statistics leave her isolated from
the rest of the sample (see Figure 3), as was the case with item 10c.
In summary, the items were generally well suited to the sample, with only two items requiring further
investigation. Item 26 (bitter wind), the most difficult item, was revealed as being unsuitable for the
sample due to the gap of over 3.00 logits to the second most difficult item, as illustrated in Figure 1, with
the error measurement (SE = 1.05) of the same item suggesting it as being poorly targeted to the sample
in question. Item 10c (heavy stone) was deserving of further attention due to its substantially higher outfit
statistics isolating it from the rest of the items, as is clearly visible in Figure 2. Although the test takers
were well spread across the items, each member of the sample displayed high error measurements,
possibly due to the small number of items, with the most able test taker, number 67 (5.16 logits), also
displaying the highest error measurement (SE = 1.42). The fit statistics for the test takers were also not as
well adjusted to the demands of the Rasch model as the items. In particular, the most able test taker,
number 67, also displayed substantially higher outfit statistics, isolating her from the rest of group, as
documented in Figure 3.
Discussion
With reference to research question one, the CIC test seems to be of a fairly appropriate level of difficulty
for this sample due to several reasons. First, the low score of 2 and high score of 29 mean that there was
no occurrence of a ceiling or floor effect. Second, Figure 1 reveals a normal, bell-shaped distribution of
test takers along the measurement, centred on the mean, and supported by the descriptive statistics in
Table 1. Such a distribution might not be good for test items, which should be spread out along the measure,
but for persons such a distribution shows that the sample is well suited to the test items in terms of
difficulty. If the test was too difficult, the location of the test takers against the items of Figure 1 would
be low. Conversely, if the test was too easy, the location of the test takers against the items of Figure 1
would be high.
The results illustrated in Figures 1 and 2 also suggest that item 26i (bitter wind), the most difficult item
with only one test taker answering correctly, is too difficult for this sample and is also 3.66 logits more
difficult than the second most difficult item (13i, near collapse). Table 6 shows bitter wind alongside the
collocations that appeared less frequently in the analysis of the BNC and COCA (cold tea, take medicine,
and wide street). The measures in logits of these items are all negative, indicating that they are a lot easier
than item 26i, so the reason for item 26i’s comparable difficulty is seemingly not due to rare usage. The
reason could be because of the abstract nature of the collocation. The other low frequency collocations
presented in Table 4 are all very transparent, with descriptive functions of simple adjectives, such as cold

Nicklin and DeOrio 35
Shiken 20(2). November 2016.
and wide, and also a verb + noun combination, take medicine, that would presumably be more relevant to
a group of medical students. In contrast, describing wind as bitter is not such a clear description. The
meaning of bitter is usually more associated with taste, as in bitter coffee or bitter lemon. Bitter coffee is
congruent in Japanese, while bitter lemon is not. The possibility of replacing the incongruent collocation
bitter wind in the CIC test makes bitter lemon a candidate, as bitter lemon is also incongruent in Japanese,
while bitter coffee is congruent. Although bitter lemon is less frequent than bitter wind in both the BNC
and COCA (see Table 6), the more descriptive, less abstract use of an adjective in bitter lemon might be
less difficult than bitter wind and, therefore, be better suited to the current difficulty of the test. However,
it could be argued that having such a difficult item is a good thing and the item should be kept. The
difficult item stretches the length of the measure, covering more levels of difficulty, as opposed to
congregating around a similar area. Also, the item was answered correctly by one test taker, meaning that
it was not an impossible item.
Table 6
Selected Collocation Frequencies According to the British National Corpus (BNC) and Corpus of
Contemporary American English (COCA)
Frequency
Item Collocation BNC COCA Average CIC Measure CIC SE
26i Bitter wind 16 43 29.5 6.04 1.05
22c Cold tea 30 27 28.5 -1.30 0.26
14i Take medicine 3 54 28.5 -2.48 0.34
23c Wide street 9 41 25.0 -0.38 0.23
- Bitter Lemon 12 4 8.0 - -
With reference to research question two, 28 of the 30 test items displayed error measurements ≤ 0.30 (see
Table 4), suggesting that they were well targeted to the construct being measured. Of the two remaining
items, item 14i (take medicine), which was the least difficult item, had a slightly large error measurement
of 0.34, while item 26i (bitter wind), which was the most difficult item, had a much larger error
measurement of 1.05, as is clearly visible in Figure 2. This large error measurement suggests that item 26i
is poorly targeted, and perhaps too difficult, for this particular sample.
With reference to research question three, the results suggested that not all of the items in the CIC test fit
the expectations of the Rasch model, with items 24i (broken heart) and 10c (heavy stone) underfitting.
Item 24i produced an outfit mean square statistic of 1.42, which was marginally over the 1.30 threshold
of a good fitting item, and standardized outfit statistic of 1.90, which is on the cusp of the measure of <
2.00 required for acceptability. In contrast, with an outfit mean square statistic of 9.90 and a standardized
outfit statistic of 9.60, item 10c is much more problematic. In order to find out why the outfit statistics for
item 10c were so high, an item characteristic curve (ICC) was created using Winsteps (see Figure 4). The
ICC revealed that every score except one lay within the upper and lower 95% 2-sided confidence intervals.
The single score lying outside of that boundary was recorded by a test taker with ability close to 5.00
logits. The only test taker with a measure above 4.00 was the test taker with the highest ability, number
67. This is surprising, as it means that the highest achiever was one of only 16 people who incorrectly
answered item 10c, the second easiest test item according to the item measures table. The reason for
number 67’s error could be attributed to carelessness, and is the probable cause of the large outfit statistics
for item 10c. In order to investigate further, the data were reiterated in Winsteps, first without the entry
for item 10c, and then without the entry for test taker 67.

36 Congruent and Incongruent Collocations
Shiken 20(2). November 2016.
Figure 4. Actual person performance versus theoretical ICC item 10c.
Without item 10c, none of the remaining 29 items underfit the Rasch model expectations, leading to a test
that is productive for measurement (see Figure 5). Even so, item 26i is still distinctly more difficult than
the rest, sitting isolated at the top of the scale with a large error measurement. Without item 10c, test takers
29, 39, 64, 81, and 84 underfit the model with standardized outfit statistics of 2.01, 2.10, 2.30, 3.10, and
2.90 respectively (see Figure 6). However, it seems rash to remove item 10c from the CIC test based on
the results of one potentially careless error from one test taker, and so a further reiteration was performed
without any data for test taker 67. As expected, after the second reiteration, item 10c comfortably fit the
expectations of the Rasch model, with an infit mean square of 1.04, a standardized infit statistic of 0.30,
an outfit mean square of 1.07, a standardized outfit statistic of 0.30, and an error measurement of 0.31.
However, without test taker 67, item 24i underfits the model (see Figure 7), as well as test takers 36, 44,
64, 81, and 84 with standardized outfit statistics of 2.00, 2.60, 2.10, 3.40, and 2.80 respectively (see Figure
8), so the results are still not perfect. A third reiteration was performed by removing test taker 67 and item
24 from the analysis, the results of which showed all of the remaining items comfortably fitting the
expectations of the Rasch model (see Figure 9), but with test takers 39, 44, 64, 81, and 84 underfitting
with standardized outfit statistics of 2.00, 2.50, 2.10, 3.50, and 2.80 respectively (see Figure 10). In
conclusion, the results of the three reiterations (see Table 7) seem to suggest that as one large problem is
removed, four smaller problems appear. For example, all three reiterations led to previously fitting test
takers 64 and 84 becoming misfit, with 81’s minor misfit, as is visible in Figure 3, becoming more
pronounced. The main problem of easy item 10c being answered incorrectly by high ability test taker 67
could be easily put down to a single lackadaisical answer. Removing the test item or the test taker from

Nicklin and DeOrio 37
Shiken 20(2). November 2016.
the results created more problems than it solved, and did not result in the CIC test fitting the expectations
of the Rasch any better than if they were included. Greater improvements to the test could be made in
other ways than by simply removing items 10c and 24i.
Figure 5. Pathway for CIC test items without item 10c.
1c
2i
3i
4i
5i
6c
7c
8c
9c
11i12i13i
14i
15i
16i
17c
18c19c20c
21c
22c
23c
24i25i
26i
27i 28i
29c
30c
-4
-3
-2
-1
0
1
2
3
4
5
6
7
8
-2 0 2 4
Less
Measure
s
M
ore
Overfit t Outfit Zstd Underfit

38 Congruent and Incongruent Collocations
Shiken 20(2). November 2016.
Figure 6. Pathway for CIC test persons without item 10c.
Figure 7. Pathway for CIC test items without person 67.
1
23
4
5
6
7
8
910
11
1213
1415
16
17
1819
20 21
22
23
24
2526
27 282930
3132
33
34
3536
37
38
39
40
41
42
43
4445
46
47
48
49
50
5152
5354
55
56
57
58
5960
61
62
63 64
6566
67
68
69
70
7172
73
74
75
76
77
7879
80
81
82
83
8485
86
87
88 8990
91
92
9294
95
969798
99
100101
102
103
104
105
106
107
108109
-5
-4
-3
-2
-1
0
1
2
3
4
5
6
7
-4 -2 0 2 4
Less
Measure
s
M
ore
Overfit t Outfit Zstd Underfit
1c
2i
3i
4i
5i
6c
7c
8c
9c
10c
11i12i13i
14i
15i
16i
17c
18c19c20c21c
22c
23c
24i25i
26i
27i 28i
29c30c
-4
-3
-2
-1
0
1
2
3
4
5
6
7
8
9
-2 0 2 4
Less
Measure
s
M
ore
Overfit t Outfit Zstd Underfit

Nicklin and DeOrio 39
Shiken 20(2). November 2016.
Figure 8. Pathway for CIC test persons without person 67.
Figure 9. Pathway for CIC test items without item 24i and person 67.
1
23
4
5
6
7
8
910
11
12
13
14
15
16
17
1819
2021
22
23
24
25
26
27 28
293031
32
33
34
3536
37
38
39
40
41
42
43
4445
46
47
48
49
5051
52
5354
55
56
57
58
5960
61
62
63 64
6566
68
69
70
7172
73
74
75
76
77
7879
80
81
82
83
84
85
86
87
88 8990
91
92
9294
95
9697
98
99
100101
102
103
104
105
106
107
108
109
-4
-3
-2
-1
0
1
2
3
4
5
-2 0 2 4
Less
Measure
s
M
ore
Overfit t Outfit Zstd Underfit
1c
2i
3i
4i
5i
6c
7c
8c
9c
10c
11i12i13i
14i
15i
16i
17c
18c19c
20c21c
22c
23c25i
26i
27i 28i
29c
30c
-4
-3
-2
-1
0
1
2
3
4
5
6
7
8
9
-2 0 2
Less
M
easure
s
M
ore

40 Congruent and Incongruent Collocations
Shiken 20(2). November 2016.
Figure 10. Pathway for CIC test persons without item 24i and person 67.
Table 7
Reiteration Results
Reiteration Misfitting Items Misfitting Persons
Without Item 10c 29, 39, 64, 81, 84,
Without #67 24i 36, 44, 64, 81, 84
Without #67 & Item 24i 39, 44, 64, 81, 84
With reference to research question four, the CIC test did not display invariance across disparate
subsamples because the results of the Ben Wright challenge (see Figure 11) were not entirely successful.
At first glance, the chart looks promising, as all but five test items fit within the 95% confidence band.
However, to be successful, 95% of the items need to lie within this band, and on this chart only 83.33%
fulfil that requirement. Also, the results lie in a linear fashion across the chart, which might be considered
good for correlation statistics, but according to Bond and Fox (2015), a small circle of plotted points
would show greater invariance (pp. 102-103). The results of the Ben Wright challenge suggest that the
CIC test is not a reliably invariant instrument for assessing a samples knowledge regarding the group of
30 collocations.
With reference to research question five, there are three limitations of the CIC test that could be improved
upon for future use. The first limitation is the large gap between item 26i (bitter wind) and the rest of the
items, visible in Figures 1 and 2. Item 26i is an important part of the test as it is the most difficult item,
but it is answerable, as proven by one test taker.
However, the gap needs to be filled with more collocations of a difficulty level just lower to provide a
more even spread across the measurement. The second limitation regards the high error measurements
displayed by the test takers, which could be improved by adding more test items. As mentioned in point
1
2
3
4
5
6
7
8
910
11
1213
14
15
16
17
1819
2021
22
23
24
25
26
27 28
293031
32
33
34
3536
3738
39
40
41
42
43
4445
46
47
48
49
5051
52
5354
55
5657
58
5960
61
62
63 64
6566
68
69
70
71
72
73
74
75
76
77
7879
80
81
82
83
84
85
86
87
888990
91
92
9294
95
969798
99
100101
102
103
104
105
106
107
108
109
-5
-4
-3
-2
-1
0
1
2
3
4
5
-4 -2 0 2 4
Less
Measure
s
M
ore
Overfit t Outfit Zstd Underfit

Nicklin and DeOrio 41
Shiken 20(2). November 2016.
one, these questions should attempt to address the gap between item 26i and the rest of the items, but there
are also other gaps along the measurement that could be bridged, for example, the gap of 1.37 logits
between items 11i (ill health) and 24i (broken heart), and also some easier items at the other end of the
scale below item 14i (take medicine) (see Figure 1). The third, and most serious, limitation is the low
invariance displayed by the CIC test when the two subsets of high and low achievers were compared.
Again, by adding new test items and reiterating the answers, a version of the test can potentially be
developed that has a similar number of items spread more evenly across the measure, without large gaps
in difficulty between them. With a better selection of items, the size of the test could be kept the same by
removing some of the items that seem to be at the same difficulty level, but don’t fit the expectations quite
so well. This in turn could also help improve the invariance of the test, thus making it more reliable.
Figure 11. Item difficulty invariance for CIC test.
Conclusion
The CIC test was developed as a pretest, posttest, and delayed posttest instrument to assess the knowledge
of a group of second year Japanese medical students with regards to their knowledge of a list of 15
congruent and 15 incongruent collocations. Following the initial posttest, the CIC test was intended to
measure the changes in that knowledge as the result of one of two teaching conditions. Following an
analysis of the pretest results, it was determined that the test was of an appropriate difficulty level for the
students with the majority of the items being well targeted. However, not all of the items fit the
expectations of the Rasch model, with one of the easiest items suffering from a presumed careless error
on the part of the test taker with the highest ability. Also, the invariance of the test items fell short when
put to the Ben Wright challenge. In order to improve the test, more items should be tested in order to fill
gaps along the measure and lower the error measurements of future samples.
References
Altarriba, J., & Knickerbocker, H. (2011). Acquiring second language vocabulary through the use of
images and words. In P. Trofimovich & K. McDonough (Eds.), Applying priming methods to L2
learning, teaching and research, (pp. 21-47). Amsterdam, The Netherlands: John Benjamins.
-3
-2
-1
0
1
2
3
-3 -2 -1 0 1 2 3
CIC
Ite
m E
sts
(Lo
w A
bili
ty)
CIC Item Ests (High Ability)

42 Congruent and Incongruent Collocations
Shiken 20(2). November 2016.
Boers, F., Demecheleer, M., Coxhead, A., & Webb, S. (2014). Gauging the effects of exercises on verb-
noun collocations. Language Teaching Research, 18(1), 54-74. doi:10.1177/1362168813505389
Boers, F., Lindstromberg, S., Littlemore, J., Stengers, H., & Eyckmans, J. (2008). Variables in the
mnemonic effectiveness of pictorial elucidation. In F. Boers & S. Lindstromberg (Eds.), Cognitive
linguistic approaches to teaching vocabulary and phraseology, (pp. 189-212). Berlin, Germany:
Mouton de Gruyter.
Boers, F., Piquer Piriz, A. M., Stengers, H., & Eyckmans, J. (2009). Does pictorial elucidation foster
recollection of idioms? Language Teaching Research, 13(4), 367-382.
doi:10.1177/1362168809341505
Bond, T. G. (2016, May). Using Rasch measurement in language/educational research. Presentation at
Temple University Japan, Tokyo.
Bond, T. G., & Fox, C. M. (2015). Applying the Rasch model: Fundamental measurement in the human
sciences (3rd Ed.). New York, NY: Routledge.
Brown, J. D. (1997). Skewness and Kurtosis. Shiken: JALT Testing & Evaluation SIG Newsletter, 1(1),
20-23.
Cobb, T. (n.d.) Web Vocab profile English in the Complete Lexical Tutor. Retrieved March 15, 2015
from http://www.lextutor.ca/vp/eng/.
Council of Europe. (2001). Common European Framework of Reference for language learning and
teaching. Cambridge, UK: Cambridge University Press.
Elley, W. B. (1989). Vocabulary acquisition from listening to stories. Reading Research Quarterly,
24(2), 174-87. doi: 10.2307/747863
Fisher, W. (1992). Reliability, separation, strata statistics. Rasch measurement transactions, 6(3), 238.
Fodor, J. A. (1981). Imagistic representation. In N. Block (Ed.), Imagery. Cambridge, MA: MIT Press.
George, D., & Mallery, M. (2010). SPSS for Windows step by step: A simple guide and reference, 17.0
update. Boston, MA: Pearson.
Gombrich, E. H. (1972). Symbolic images. Edinburgh: Phaidon.
Lado, R., Baldwin, B., & Lobo, F. (1967). Massive vocabulary expansion in a foreign language beyond
the basic course: The effects of stimuli, timing and order of presentation. Washington, DC: U.S.
Department of Health, Education, and Welfare.
Linacre, J. M. (2002). What do infit and outfit, mean-square, and standardized mean? Rasch
Measurement Transactions, 16(2), 878.
Linacre, J. M. (2012). A user’s guide to WINSTEPS. Chicago, IL: winsteps.com.
Lotto, L., & De Groot, A. (1998). Effects of learning method and word type on acquiring vocabulary in
an unfamiliar language. Language Learning, 49(1), 31-69. doi 10.1111/1467-9922.00032
Messick, S. (1995). Validity of psychological assessment: Validation of inferences from person’s
responses and performances as scientific enquiry into score meaning. American Psychologist 50(9),
741-749. Doi 10.1002/j.2333-8504.1994.tb01618.x
Nation, I. S. P., & Beglar, D. (2007). A vocabulary size test. The Language Teacher, 31(7), 9-13.

Nicklin and DeOrio 43
Shiken 20(2). November 2016.
Nelson, D. L., Reed, V. S., & Walling, J., R. (1976). Pictorial superiority effect. Journal of
Experimental Psychology: Human Learning & Memory, 2(5), 523-528. doi
http://dx.doi.org/10.1037/0278-7393.2.5.523
Paivio, A. (1990). Mental representations. New York, NY: Oxford University Press.
Palmer, D. M. (1982). Information transfer for listening and reading. English Teaching Forum, 20(1),
29-33.
Rasch, G. (1960). Probabalistic models for some intelligence and attainment tests. Copenhagen,
Denmark: Danmarks Paedigogiske Institut.
Sinclair, J. (1991). Corpus, concordance, collocation. Oxford, UK: Oxford University Press.
West, M. (1953). A general service list of English words. London: Longman, Green and Co.
Wright, B. D. (1996). Reliability and separation. Rasch measurement transactions, 9(4), 472.
Yamashita, J. & Jiang, N. (2010). L1 influence on the acquisition of L2 collocations: Japanese ESL
users and EFL learners acquiring English collocations. TESOL Quarterly, 44(4), 647-666. doi:
10.5054/tq.2010.235998