abstract - greenpeace usa · 1 estimating carbon emissions from china’s coal-to-chemical industry...
TRANSCRIPT

1
Estimating Carbon Emissions from China’s Coal-to-Chemical Industry during the “13th Five-year Plan” Period
Abstract
China’s coal-and-chemical industry has long been controversial for its high level of carbon emissions. In the recently released “13th Five-year Plan for Energy”, the coal-to-chemical industry was set a number of key construction regions. Meanwhile, global fossil fuel carbon emissions have seen a zero growth rate for three years in a row. The reduction in China’s coal usage over the past three years is a major contributing factor behind this.
Since the Paris Agreement, China has actively committed to cutting carbon emissions. However, data from the coal-to-chemical industry reveals that if project growth cannot be controlled during the “13th Five-year Plan” period, it is likely to lead to a continued increase in carbon emissions. According to the summary analysis of the relevant 13th Five-year Plan content, China’s coal-to-chemical industry is likely to contribute around 409 million tons of carbon emissions per year in 2020 – more than four times the figure of 90 million tons recorded in 2015.
1. Background
In 2015, the 195 parties present at the Paris Climate Conference signed a historic agreement. The Paris Agreement was the first ever global agreement on climate change. China formally joined the Paris Agreement in 2016, fulfilling its commitments on reducing carbon emissions. As the world’s largest greenhouse gas emitter, the Chinese government has played an active role in both the approval and the enforcement of The Paris Agreement. The Agreement contains the following pledge: Hold the increase in the global average temperature to well below 2 °C above pre-industrial levels and pursue efforts to limit the temperature increase to 1.5 °C above pre-industrial levels, recognizing that this would significantly reduce the risks and impacts of climate change.” (Known as the ‘2 °C threshold’). Although there are still some details left to be discussed, the 2 °C and 1.5 °C thresholds are tangible targets for the global implementation of greenhouse gas emission reductions. It should be a guiding principle for industries involved in reducing emissions in all countries. In China’s Nationally Determined Contribution (NDC) 1 submitted to the United Nations, the country has stated a clear determination to peak carbon dioxide emissions around 2030, while making a strong effort to peak earlier. The document also presented a series of new measures, including plans to close coal-fired power plants and high energy-consuming factories. This demonstrates how China is actively cutting carbon emissions while also accelerating the energy transition. The “13th Five-year Plan for Energy” published in early 2017 also made it clear that by 2020 – the end of the 13th Five-year Plan period – China’s domestic carbon emission intensity per unit of GDP will be reduced by 18% from 2015 levels. At the end of 2016, a report by the University of East Anglia2 and the Global Carbon Project
1 China’s National Development and Reform Commission. [2016]. http://qhs.ndrc.gov.cn/gzdt/201507/t20150701_710232.html.
2UEA. Global carbon emissions have low increases in the past three years [R].

2
showed little growth in global fossil fuel carbon emissions in 2015. There is expected to be only a slight rise in 2016, marking near stagnation in carbon emissions over the past three years. The reduction in China’s coal usage over the past three years is a significant contributing factor behind this. China’s coal consumption has also declined in recent years. According to data released by China’s National Bureau of Statistics3, after annual coal consumption fell for the first time, by 2.9%, in 2014, the figure continued to fall in 2015 and 2016 by 3.7% and 4.7% respectively. This continuous decline seems to suggest that China’s coal consumption has already peaked.
The coal-to-chemical industry is one of the major contributors to carbon emissions in China. In 2011 and 2012, carbon dioxide emissions from the coal-to-chemical industry accounted for 2.7-3.2% of the country’s total carbon emissions, while also accounting for 21-24% of the chemical industry’s emissions4. This further illustrates how the coal-to-chemical industry is indeed a carbon-intensive industry.
According to the “13th Five-year Plan for Energy”, after two quiet years for the coal-to-chemical industry, it is very likely that the industry expands during the 13th Five-year Plan period. As of the end of 2015, the main products of China's coal-to-chemical industry include coal liquid fuels, synthetic natural gas, coal to olefins (including methanol to olefins), whose production capacity reached 2.54 million tons per year, 3.1 billion cubic meters per year and 8.62 million tons per year respectively. The 2015 annual output reached 1.15 million tons, 1.88 billion cubic metres and 6.48 million tons. 5
In the current market environment, coal-to-chemical products lack a competitive edge as compared to petrochemical products. Furthermore, due to blind investments made in the past decade, the industry has suffered from the impact of overcapacity. Meanwhile, emissions from coal-to-chemical projects may have a negative impact on China’s carbon reduction policies.
http://www.globalcarbonproject.org/carbonbudget/16/files/UK_UEA_GCPbudget2016_Chinese.pdf. 3China National Bureau of Statistics, http://www.stats.gov.cn/tjsj/zxfb/201702/t20170228_1467424.html
4Gu Zongqin, Carbon reduction is the key to Coal-to-Chemical’s development,
http://www.coalchem.org.cn/guandian/html/800215/170064.html 5China’s National Energy Agency, “13th Five-year plan for Coal-to-Chemical”

3
2. Objectives
Coal-to-chemical has always been an industry characterized by high investment, high water consumption, high pollution and high carbon emissions. China’s is making efforts to establish an effective system for reducing carbon emissions and to build a low-carbon economy and society. As a carbon-intensive industry, coal-to-chemical will be affected by the relevant policies. Its development scale has also come under scrutiny from policy makers, industry figures and other stakeholders. This research paper, based on limited resources and data, strives to provide analysis of the development potential of the coal-to-chemical industry during the 13th Five-year Plan period and to estimate the carbon emissions this will bring about. We hope it will serve as a valuable reference for policy makers and industry leaders.
4
3. Methods
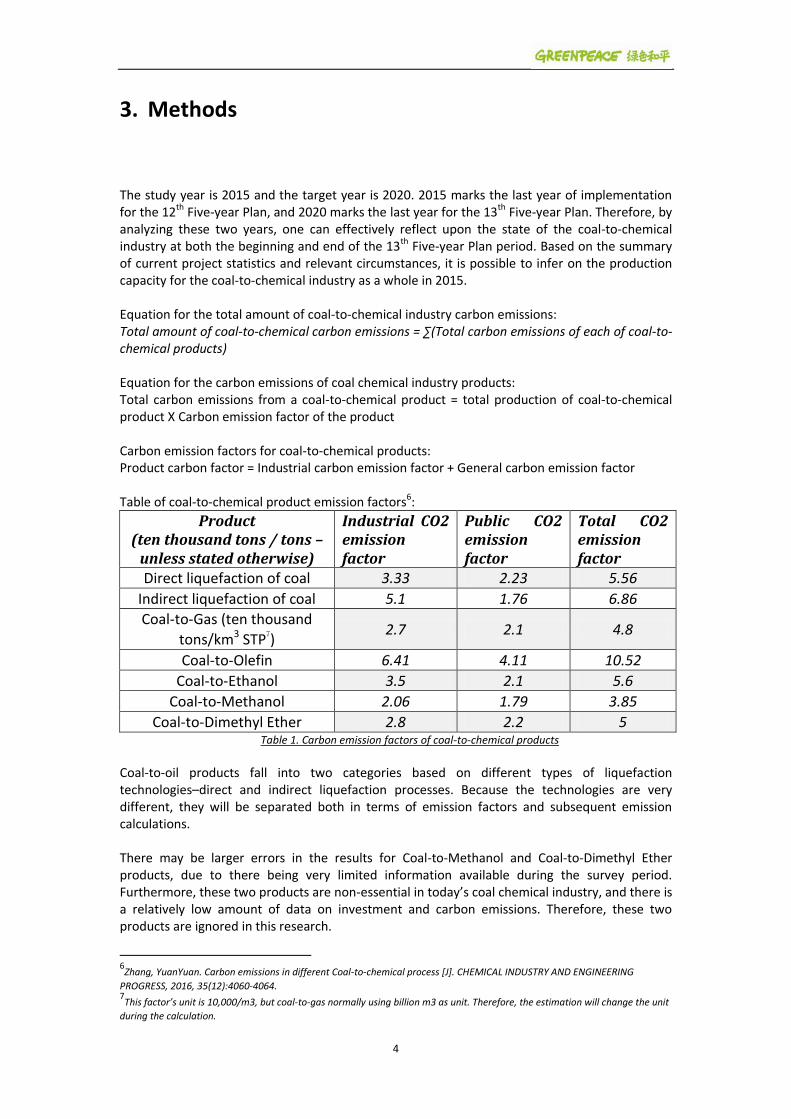
The study year is 2015 and the target year is 2020. 2015 marks the last year of implementation for the 12th Five-year Plan, and 2020 marks the last year for the 13th Five-year Plan. Therefore, by analyzing these two years, one can effectively reflect upon the state of the coal-to-chemical industry at both the beginning and end of the 13th Five-year Plan period. Based on the summary of current project statistics and relevant circumstances, it is possible to infer on the production capacity for the coal-to-chemical industry as a whole in 2015. Equation for the total amount of coal-to-chemical industry carbon emissions: Total amount of coal-to-chemical carbon emissions = ∑(Total carbon emissions of each of coal-to-chemical products) Equation for the carbon emissions of coal chemical industry products: Total carbon emissions from a coal-to-chemical product = total production of coal-to-chemical product X Carbon emission factor of the product Carbon emission factors for coal-to-chemical products: Product carbon factor = Industrial carbon emission factor + General carbon emission factor Table of coal-to-chemical product emission factors6:
Product (ten thousand tons / tons –
unless stated otherwise)
Industrial CO2 emission factor
Public CO2 emission factor
Total CO2 emission factor
Direct liquefaction of coal 3.33 2.23 5.56
Indirect liquefaction of coal 5.1 1.76 6.86
Coal-to-Gas (ten thousand
tons/km3 STP7) 2.7 2.1 4.8
Coal-to-Olefin 6.41 4.11 10.52
Coal-to-Ethanol 3.5 2.1 5.6
Coal-to-Methanol 2.06 1.79 3.85
Coal-to-Dimethyl Ether 2.8 2.2 5 Table 1. Carbon emission factors of coal-to-chemical products
Coal-to-oil products fall into two categories based on different types of liquefaction technologies–direct and indirect liquefaction processes. Because the technologies are very different, they will be separated both in terms of emission factors and subsequent emission calculations.
There may be larger errors in the results for Coal-to-Methanol and Coal-to-Dimethyl Ether products, due to there being very limited information available during the survey period. Furthermore, these two products are non-essential in today’s coal chemical industry, and there is a relatively low amount of data on investment and carbon emissions. Therefore, these two products are ignored in this research.
6Zhang, YuanYuan. Carbon emissions in different Coal-to-chemical process [J]. CHEMICAL INDUSTRY AND ENGINEERING
PROGRESS, 2016, 35(12):4060-4064. 7This factor’s unit is 10,000/m3, but coal-to-gas normally using billion m3 as unit. Therefore, the estimation will change the unit
during the calculation.

5
Therefore, the coal-to-chemical products that will be studied in this research include: coal liquefaction (direct and indirect), synthetic gas, Coal-to-Olefin and Coal-to-Ethanol.
Production statistics of China’s coal chemical industry during the Twelfth Five-year Plan period8
Production
2011 2012 2013 2014 2015
Coal-to-Oil (ten thousand tons) - - 170 357 132
Coal-to-Gas(one hundred million
m3) - -
2.7 0 16
Coal-to-Olefin (ten thousand tons) 43 134 180 147 648
Coal-to-Ethanol (ten thousand tons) 102 14 90 58 102
Table 2: Production statistics of Chinese coal chemical products during the "12th Five - Year Plan" period
Part of the capacity statistics9 during the "12th Five-Year" period of China's coal-to-chemical industry:
Capacity
2011 2012 2013 2014 2015
Coal liquefaction (ten thousand tons) - - 241 163 278
Synthetic natural gas(one hundred
million m3) - - - -
31.0
5
Coal-to-Olefin (ten thousand tons) 100 240 200 634 792
Coal-to-Ethylene Glycol (ten thousand tons) 408 80 85 130
212
Table 3: China coal chemical products production capacity statistics during the 12th Five-year Plan
Because this study projects results at the end of the 13th Five-year plan period (2020), and results will differ significantly in different scenarios, therefore, the study will analyze the development of the coal-to-chemical industry during the 13th Five-year Plan period under three different scenarios. They are:
1. Planned scenario – In 2020, capacity of the main products of China’s coal-to-chemical – includes coal-to-oil and coal-to-gas – will meet the targets set in the “13th Five-year Plan for Energy.” Other products will maintain current capacity. 2. Extreme scenario – In 2020, China’s coal-to-chemical capacity will include projects that have begun operations. It will also include coal-to-oil, coal-to-gas, coal-to-olefins and coal-to-ethanol projects in key construction areas outlined in the “13th Five-year Plan for Energy” that are under construction or planned10. 3. Projected scenario – In 2020, China's coal-to-chemical capacity will include projects that have begun operations. Besides that, it will only include coal-to-oil, coal-to-gas, coal-to-olefins and coal-to-ethanol projects that fall into the key construction areas in the “13th Five-year Plan for
8According to collection from official channels
9According to collection from official channels
10China’s National Development and Reform Commission, “Master plan for petro-chemical development”

6
Energy” that are already under construction. The above data analysis shows that production capacity utilization of the coal-to-chemical industry was relatively low from 2011 to 2015. Coal liquefaction’s capacity utilization was relatively high, but still came under 50% in 2015. The rest of the coal chemical products generally saw no more than a 50% production capacity utilization rate. International oil price fluctuations, the volatility of the price of coal, China's supply-side reform policies, and other market factors had a profound impact on the coal-to-chemical production capacity utilization rate in China. Constrained by various limitations, the estimated capacity utilization rate in 2020 may lead to inaccurate projection. In projecting the operation of China’s coal-to-chemical production in 2020, we used the actual capacity of each project to ensure a conservative prediction for all projects in 202011. Assuming maximum capacity, we will be able to get a conservative estimation of the highest possible carbon emission levels of China's coal-to-chemical products.
2011 2012 2013 2014 2015
Coal–to-Oil Utilization Rate
- - 70.5% 73.6% 47.5%
Coal-to-Gas Utilization Rate
- - - 25.8% 51.5%
Coal-to-Olefin Utilization Rate
42.6% 55.7% 48.8% 23.2% 81.8%
Coal-to-Ethanol Utilization Rate
25% 17.6% 29.9% 44.3% 48.1%
Table 4: China Coal-to-chemical Industry Capacity Utilization Summary (2011-2015)
11
List of projects in different scenarios can be found in the appendix

7
4. Data Analysis
4.1. Current Status
Figure 1: China’s annual CO2 emissions
Figure 1 displays the total amount of CO2 emissions in China since 2000. China's CO2 emissions rose steadily until 2013, and only then was there a significant decline. 2014 and 2015 emission levels were flat.
According to the latest data, China's CO2 in 2015 totaled around 9.73 billion tons, which is smaller than the figures of 9.74 billion in 2014. However, China's carbon emissions in 2015 were still nearly twice as high as the world's second-largest emitter —the U.S., accounting for nearly one-third of the world's total carbon emissions.
Comparing the growth rate of CO2 emissions in China from 2002 and 2015 shows that in the three years from 2013 to 2015, the annual CO2 emissions growth rate has remained low, and there was even inverse growth in 2014. This also serves as indirect evidence that China's CO2 emissions have been significantly inhibited in recent years.
8
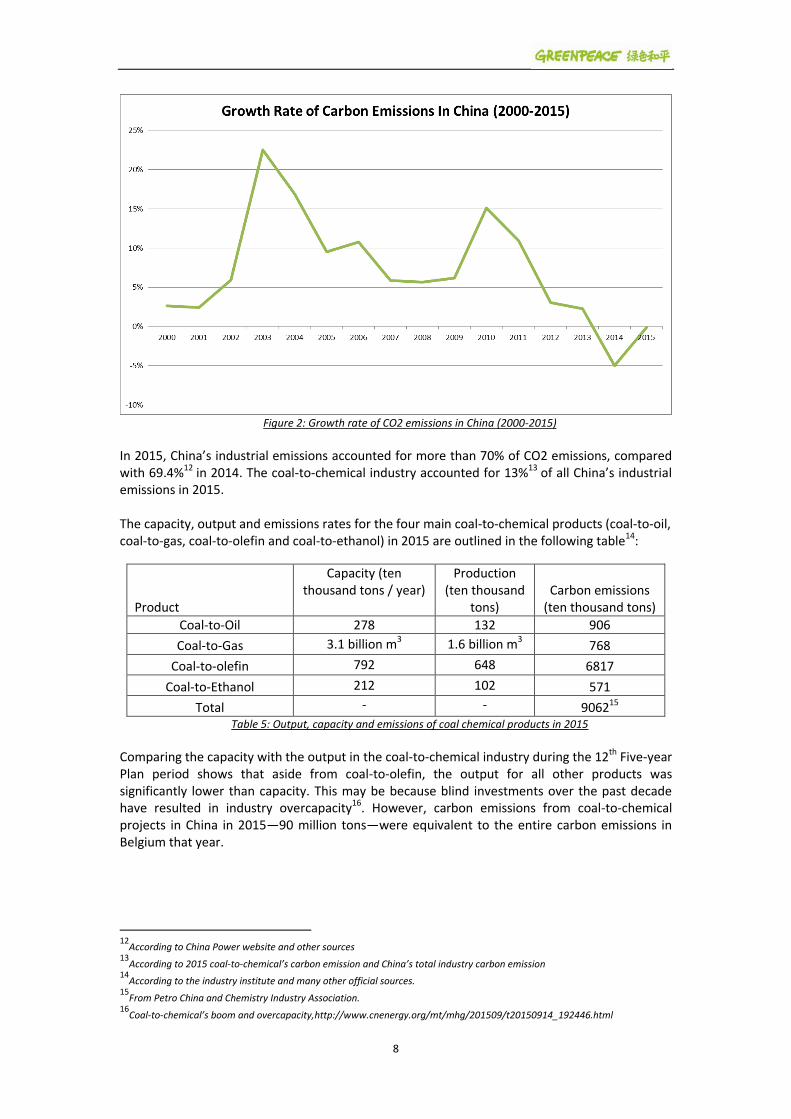
Figure 2: Growth rate of CO2 emissions in China (2000-2015)
In 2015, China’s industrial emissions accounted for more than 70% of CO2 emissions, compared with 69.4%12 in 2014. The coal-to-chemical industry accounted for 13%13 of all China’s industrial emissions in 2015. The capacity, output and emissions rates for the four main coal-to-chemical products (coal-to-oil, coal-to-gas, coal-to-olefin and coal-to-ethanol) in 2015 are outlined in the following table14:
Product
Capacity (ten thousand tons / year)
Production (ten thousand
tons) Carbon emissions
(ten thousand tons)
Coal-to-Oil 278 132 906
Coal-to-Gas 3.1 billion m3 1.6 billion m3 768
Coal-to-olefin 792 648 6817
Coal-to-Ethanol 212 102 571
Total - - 906215 Table 5: Output, capacity and emissions of coal chemical products in 2015
Comparing the capacity with the output in the coal-to-chemical industry during the 12th Five-year Plan period shows that aside from coal-to-olefin, the output for all other products was significantly lower than capacity. This may be because blind investments over the past decade have resulted in industry overcapacity16. However, carbon emissions from coal-to-chemical projects in China in 2015—90 million tons—were equivalent to the entire carbon emissions in Belgium that year.
12
According to China Power website and other sources 13
According to 2015 coal-to-chemical’s carbon emission and China’s total industry carbon emission 14
According to the industry institute and many other official sources. 15
From Petro China and Chemistry Industry Association. 16
Coal-to-chemical’s boom and overcapacity,http://www.cnenergy.org/mt/mhg/201509/t20150914_192446.html
9
Product 2011 2012 2013 2014 2015 Total
Coal-to-Oil 0 0 1166 2447 906 4519
Coal-to-Gas 0 0 1296 0 768 2064
Coal-to-Olefin 448 1406 1894 1549 6817 11666
Coal-to-Ethanol 571 79 504 323 571 1477
Total (ten thousand tons) 1019 1485 4860 4319 9062
Table 6. Carbon emissions from China’s coal chemical industry during the 12th Five-year Plan period (ten thousand tons)
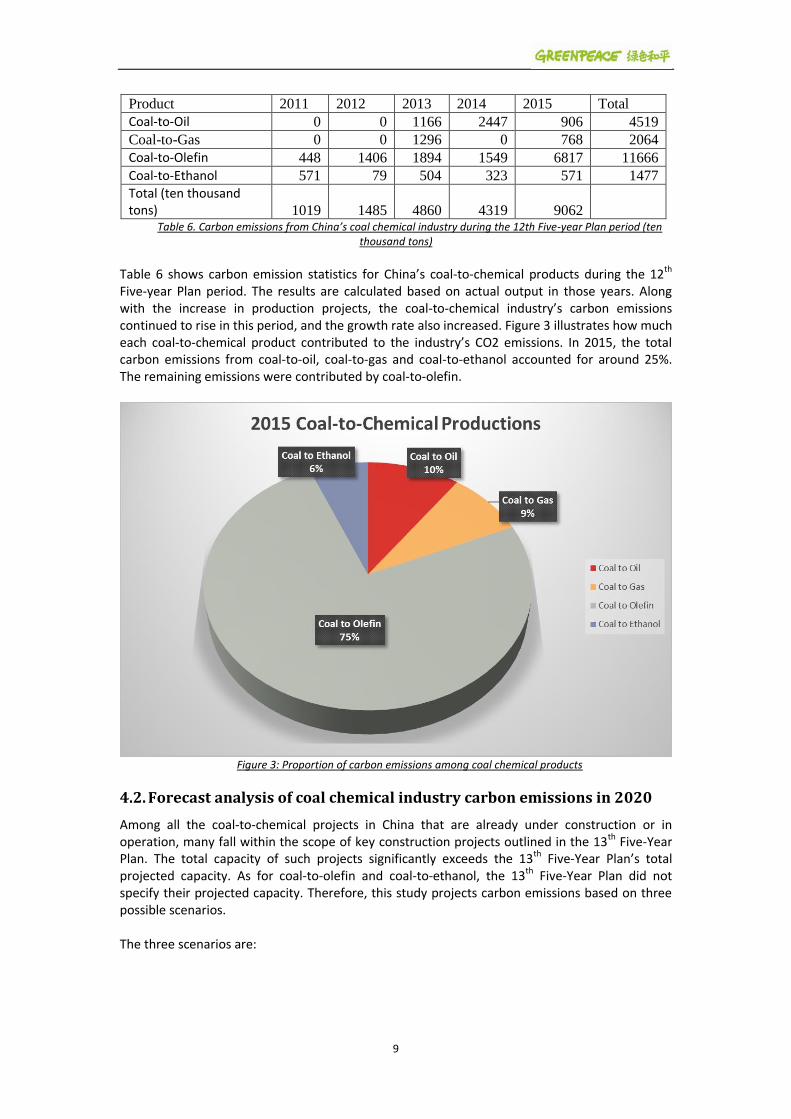
Table 6 shows carbon emission statistics for China’s coal-to-chemical products during the 12th Five-year Plan period. The results are calculated based on actual output in those years. Along with the increase in production projects, the coal-to-chemical industry’s carbon emissions continued to rise in this period, and the growth rate also increased. Figure 3 illustrates how much each coal-to-chemical product contributed to the industry’s CO2 emissions. In 2015, the total carbon emissions from coal-to-oil, coal-to-gas and coal-to-ethanol accounted for around 25%. The remaining emissions were contributed by coal-to-olefin.
Figure 3: Proportion of carbon emissions among coal chemical products
4.2. Forecast analysis of coal chemical industry carbon emissions in 2020
Among all the coal-to-chemical projects in China that are already under construction or in operation, many fall within the scope of key construction projects outlined in the 13th Five-Year Plan. The total capacity of such projects significantly exceeds the 13th Five-Year Plan’s total projected capacity. As for coal-to-olefin and coal-to-ethanol, the 13th Five-Year Plan did not specify their projected capacity. Therefore, this study projects carbon emissions based on three possible scenarios.
The three scenarios are:

10
Table 4. Explanation of Three Scenarios
1. Planned scenario – In 2020, capacity of the main products of China’s coal-to-chemical – includes coal-to-oil and coal-to-gas – will meet the targets set in the “13th Five-year Plan for Energy.” Other products will maintain current capacity. 2. Extreme scenario – In 2020, China’s coal-to-chemical capacity will include projects that have begun operations. It will also include coal-to-oil, coal-to-gas, coal-to-olefins and coal-to-ethanol projects in key construction areas outlined in the “13th Five-year Plan for Energy” that are under construction or planned. 3. Projected scenario – In 2020, China's coal-to-chemical capacity will include projects that have begun operations. Besides that, it will only include coal-to-oil, coal-to-gas, coal-to-olefins and coal-to-ethanol projects that fall into the key construction areas in the “13th Five-year Plan for Energy” that are already under construction.
4.2.1. Planned Scenario
The planned scenario refers to the proposed capacity in the “13th Five-year Plan for Energy” for coal-to-oil and coal-to-gas production—around 13 million tons / year and 17 billion square meters/ year respectively. Neither the “13th Five-year Plan for Energy” nor the “13th Five-year Plan for the Demonstration of the Coal Deep Processing” set quantifiable capacity targets for coal-to-olefin and coal-to-ethanol. Therefore, to make conservative estimates, this study assumes in 2020, coal-to-olefin and coal-to-ethanol projects will maintain current capacity, and that the capacity of additional projects will be negligible. According to the available statistics, coal-to-olefin and coal-to-ethanol projects in operation have capacity of 53.38 million tons / year and 17.54 million tons / year respectively.
Therefore:

11
Product Capacity (ten thousand tons
/ year)
Carbon emissions factor
(ten thousand tons / year)
Carbon emissions (ten thousand tons /
year)
Coal-to-Oil 1300 6.86 8918
Coal-to-Gas 17 billion m3 /
year 480,000 / km3 8160
Coal-to-Olefin 1112 10.52 11698
Coal-to-Ethanol 243 5.6 1361
Total - 30137
Table 7: Estimates of China's coal chemical industry capacity and carbon emissions under the planned scenario in 2020
It is clear that coal-to-oil and coal-to-gas projects’ emissions are prominent. Although coal-to-olefin capacity is relatively small, its large emission factor results in higher levels of carbon emissions. In this scenario, the total emissions from the four products of the coal chemical industry would be 301 million tons. The carbon emissions from coal-to-oil and coal-to-gas that are within the scope of 13th Five-Year Plan would be approximately 170 million tons and the carbon emissions from the current operating projects would be 130 million tons.
The highest proportion of the total carbon emissions comes from coal-to-olefin, which has the largest carbon emission factor and accounts for 39% of the carbon emissions from coal-to-chemical industry. Second is coal-to-oil with 34%. The third is coal-to-gas with 27%.
Figure 5: ratio of CO2 emissions from China's coal chemical industry under the 2020 Planned scenario
In this scenario, assuming that all policies related to China's coal-to-chemical industry stay the same for projects already in operation, a conservative estimate of the situation would be that the industry and all related enterprises are still confident in continuing to develop projects and achieving the production capacity. Thus, this situation will leading to an increase in industry capacity and carbon emissions.
12
4.2.2. Extreme Scenario
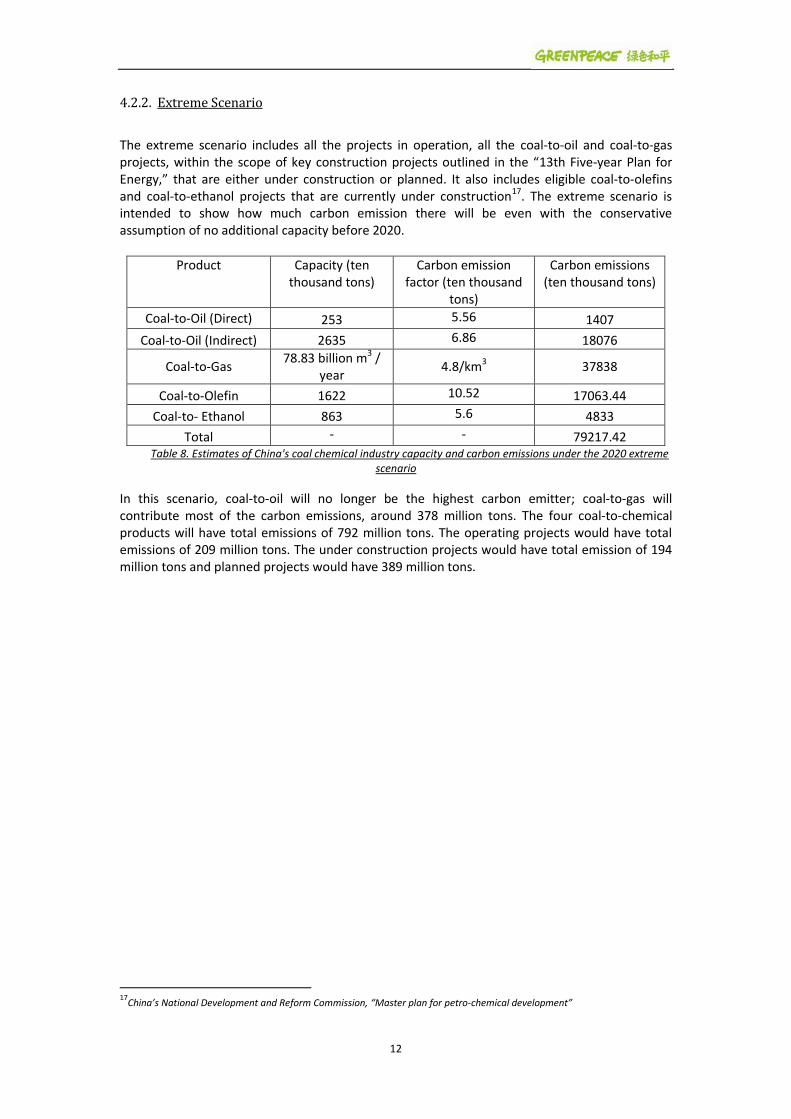
The extreme scenario includes all the projects in operation, all the coal-to-oil and coal-to-gas projects, within the scope of key construction projects outlined in the “13th Five-year Plan for Energy,” that are either under construction or planned. It also includes eligible coal-to-olefins and coal-to-ethanol projects that are currently under construction17. The extreme scenario is intended to show how much carbon emission there will be even with the conservative assumption of no additional capacity before 2020.
Product Capacity (ten thousand tons)
Carbon emission factor (ten thousand
tons)
Carbon emissions (ten thousand tons)
Coal-to-Oil (Direct) 253 5.56 1407
Coal-to-Oil (Indirect) 2635 6.86 18076
Coal-to-Gas 78.83 billion m3 /
year 4.8/km3 37838
Coal-to-Olefin 1622 10.52 17063.44
Coal-to- Ethanol 863 5.6 4833
Total - - 79217.42 Table 8. Estimates of China's coal chemical industry capacity and carbon emissions under the 2020 extreme
scenario
In this scenario, coal-to-oil will no longer be the highest carbon emitter; coal-to-gas will contribute most of the carbon emissions, around 378 million tons. The four coal-to-chemical products will have total emissions of 792 million tons. The operating projects would have total emissions of 209 million tons. The under construction projects would have total emission of 194 million tons and planned projects would have 389 million tons.
17
China’s National Development and Reform Commission, “Master plan for petro-chemical development”

13
Figure 6. Ratio of China's coal chemical industry CO2 emissions in 2020 under the extreme scenario
In this scenario, it is assumed that all eligible coal-to-chemical projects will be able to obtain
sufficient funding and policy support during the "13th Five-Year Plan" period. It is estimated that the total amount of carbon emissions that can be achieved after the start of production in 2020 is about 792 million tons per year, which is more than twice the figure of 301 million tons per year in planned scenario. Because this represents the extreme scenario, conditions of international oil prices, the price of coal, policy support and other factors need to be advantageous for this to happen.
4.2.3. Projected Scenario
The projected scenario includes coal-to-oil, coal-to-gas, coal-to-olefins and coal-to-ethanol projects that are already in operation, adding only the under-construction projects that fall within the scope of key construction projects outlined in the “13th Five-year Plan for Energy.” Using conservative estimates of project developments as well as actual progress of existing projects, this scenario estimates carbon emissions for projects that are more likely to go into operation by 2020.
Product Capacity (ten thousand tons)
Emissions factor (ten thousand tons)
Carbon emissions (ten thousand tons)
Coal-to-Oil (Direct) 253 5.56 1407
Coal-to-Oil (Indirect) 1585
6.86 10873
Coal-to-Gas 18.83 billion m3 /
year 480,000 tons / km3
9038
Coal-to-Olefin 1622 10.52 17063
Coal-to- Ethanol 453 5.6 2537
Total - - 40918.42 Table 9. Estimates of China's coal chemical industry capacity and emissions under the 2020 projected
scenario

14
In this scenario, the two largest contributors to carbon emissions are coal-to-oil and coal-to-olefins. Emissions from coal-to-gas projects have declined compared with other scenarios. This is because under this scenario, the number of coal-to-gas projects is relatively small, and the propulsion rate slows down its success in achieving production status in 2020. In this scenario, total emissions of the four products of the coal-to-chemical industry are around 409 million tons, about 35.76% higher than the planned scenario. The operating projects would have total emissions of 215 million tons and the under construction projects would have total emissions of 193 million tons.
Figure 7. Ratio of CO2 emissions from China's coal chemical industry under in 2020 under the projected
scenario
Estimated total carbon emissions of the projected scenario ranks between that of the planned and extreme scenarios. But given the unpredictability of the market, the assumption that all projects under construction will be put into operation in 2020 uses a conservative estimate of the development prospects of the industry. This also includes under-construction projects that don’t fall within the scope (of key construction projects outlined in the 13th Five-year Plan.) Meanwhile given various factors including projection development speed, market and policy, the projects that are not under construction right now will not be put into operation by 2020. Therefore, the capacity in projected scenario exceeds that in the projected scenario. Its growth also mainly comes from under-construction projects in the planned scope but excesses the planned capacity.

15
5. Conclusion
For more than a decade the coal-to-chemical industry has witnessed blind development with excessive overcapacity and there are still some projects under construction or about to put into production. While some of these projects are part of planned key construction, the total production still exceeds the capacity outlined in relevant policies. Therefore, in the future, the capacity of coal-to-chemical industry production projects is set to exceed that of the planned scenario. If China's coal chemical projects are not restrained, it will have a serious effect on the successful implementation of industry -related policies in the future.
According to conservative estimates, carbon emissions from the coal-to-chemical industry will reach 301 million tons/year by 2020, equivalent to about Poland’s total carbon emissions in 2015 (302 million tons). The extreme scenario figure of 792 million tons/year is more than Germany’s total carbon emissions in 2015 (757 million tons). According to projected estimates, China's coal chemical industry is likely to contribute carbon emissions of about 409 million tons/year by 2020. The above three scenarios all show significant growth in China's coal-to-chemical industry CO2 emissions compared with the 2015 level of 90.62 million tons – the largest increase being more than eight times that figure. In the context of China's ongoing carbon reduction policy, the coal-to-chemical industry's contribution to carbon emissions continues to increase, which is likely to add greater pressure and burden on China's carbon emissions policy objectives.
This report shows that carbon emissions of the projected scenario are higher than the planned scenario the projected scenario includes projects in operation and key projects under construction, while the planned scenario is based on the set capacity for coal-to-oil and coal-to-gas production, 13 million tons and 17 billion cubic meters respectively. So given the same capacity from in-operation projects, the planned scenario’s set capacity clearly restrained the development of coal-to-oil and coal-to-gas products, whereas coal-to-olefin and coal-to-ethanol were not restrained. Therefore, in the projected scenario there will be rapid expansion of capacity for these two products and more contribution to carbon emissions. This study bases its analysis on the capacity of China's coal-to-chemical industry in 2020, and estimates carbon emission using the maximum capacity utilization rate. But actual data shows the probability of a coal-to-chemical project operating at full capacity is not high. Therefore, some of the carbon emissions estimates will be reduced due to the reduction in actual production. But in the lowest carbon emissions scenario, that is, the planned scenario, the coal-to-chemical industry still would contribute more than twice the amount of China's coal-to-chemical carbon emissions in 2015 (90 million tons). According to analysis of existing data, it is expected that if coal-to-chemical projects have not been effectively restrained by 2020, their production capacity will exceed the capacity projected in the 13th Five-year Plan. Therefore, the coal-to-chemical industry’s carbon emissions in 2020 cannot be underestimated.

16
Figure 8. Estimates of carbon emissions by China's coal-to-chemical industry in 2020 under the three
different scenarios
6. Policy Recommendations
China's energy transformation has been at the heart of China's major energy policies aimed at mitigating climate change and cutting greenhouse gas emissions. However, the coal chemical industry’s lack of mature technology and carbon-intensive nature remain important factors restricting its development. 2017 is a crucial year for China to establish a national carbon trading market. In order to establish a mature and effective carbon market before 2020, carbon emissions costs will be gradually incorporated into the scope of relevant policy considerations. As China further increases the pace with which it confronts climate change, carbon market prices will grow, and fluctuate as the price increases. This is a challenge faced by the coal-to-chemical industry and other carbon-intensive sectors. Therefore, Greenpeace suggests: 1. As a carbon-intensive industry, coal-to-chemical project approval should be taken into
consideration as part of China’s bid to reduce carbon emissions. 2. During the approval process regarding coal-to-chemical projects, decision-making
departments should stop authorizing coal-to-olefins and other carbon-intensive projects. Furthermore, approval should not be granted to projects other than those key construction projects identified in the “13th Five-year Plan for Energy”. Based on the 13th Five-year Plan, stop planning any additional capacity for the coal-to-chemical industry.

17
Appendix
Extreme Scenario
Direct coal-to-oil
Project Name Capacity (ten thousand tons/year)
Status
Shenhua Erdos 1.08 million tons of direct coal-to-oil project
108 operation
Yan’an Anyuan Chemical one million tons of coal tar hydrogenation
100 operation
Yanchang Petroleum 450,000 tons of co-processing of coal and petroleum resid
45 operation
Indirect coal-to-oil
Project Name Capacity (hundred million tons tons/year)
Status
Lu’an Shanxi Changzhi 160,000 tons of indirect coal-to-oil project
16 operation
Shenhua Erdos 180,000 tons of indirect coal-to-oil project
18 operation
Shenhua Ningxia Coal Ningdong 4 million tons of indirect coal-to-oil project
400 operation
Yanchang Yulin Coal Chemical 150,000 tons of synthesis gas-to-liquid project
15 operation
Yankuang Yulin one million tons of indirect coal-to-oil project
100 operation
Yitai Erdos 160,000 tons of indirect coal-to-oil project
16 operation
Yunnan Xianfeng 200,000 tons of methanol-to-gasoline project
20 operation
Shanxi Coal Huayu one million tons of methanol-to-clean fuel project
100 under construction
Lu’an Changzhi 1.8 million tons of indirect coal-to-oil project
180 under construction
Yankuang Yulin 4 million tons of indirect coal-to-oil project
100 under construction
Yitai Hangjin Banner 1.2 million tons of fine chemicals project
120 under construction
Yitai Huadian Ganquanbao 2 million tons of coal-to-oil project
200 under construction
Yitai Inner Mongolia 2 million tons of indirect coal-to-oil project
200 under construction
Yitai Yili one million tons of Coal-to-oil project 100 under construction

18
Yufu Energy Guizhou 6 million tons of indirect coal-to-oil project
600 proposed
Qinghua Inner Mongolia 4 million tons of methanol-to-gasoline project
400 proposed
Shenmu Fuyou 500,000 tons of Coal tar-to-naphthenic oil Project
50 proposed
Coal-to-gas
Project Name Capacity (hundred million tons tons/year)
Status
Hebei Construction & Investment Ordos Coal-to-gas project of 4 billion cubic meters
40 proposed
Huaneng Xinjiang Zhundong Coal-to-gas project of 4 billion cubic meters
40 proposed
Huaxing New Energy Ordos Coal-to-gas project of 4 billion cubic meters
40 proposed
Coal-to-gas project of 4 billion cubic meters of Inner Mongolia Mining Xing'an Energy and Chemical
40 proposed
China Coal Tianye Zhundong Coal-to-gas project of 4 billion cubic meters
40 proposed
Xinjiang Beikong Zhundong Coal-to-gas project of 4 billion cubic meters
40 proposed
Xinjiang Guanghui Zhundong Coal-to-gas project of 4 billion cubic meters
40 proposed
Xinjiang Longyu Zhundong Coal-to-gas project of 4 billion cubic meters
40 proposed
Xinmeng Energy Inner Mongolia Coal-to-gas project of 4 billion cubic meters
40 proposed
Zheneng Xinjiang Zhundong Coal-to-gas project of 2 billion cubic meters
20 proposed
CPI Xinjiang Coal-to-gas project of 6 billion cubic meters
60 proposed
CNOOC Ordos Coal-to-gas project of 4 billion cubic meters
40 proposed
CNOOC Shanxi Datong Coal-to-gas project of 4 billion cubic meters
40 proposed
Sinopec Xinjiang Zhundong Coal-to-gas project of 8 billion cubic meters
80 proposed
Datang Keqi Coal-to-Gas Project, Phase I 13.3 operation
Inner Mongolia Huineng Ordos Coal-to-Gas Project, Phase I
4 operation
Xinjiang Qinghua Yili Coal-to-Gas Project, Phase I 13.75 operation
Xinjiang Xintian Yili Coal-to-gas project of 2 billion cubic meters
20 operation
Beikong Jingtai Ordos Coal-to-gas project of 4 billion cubic meters
40 under construction
Inner Mongolia Huineng Ordos Coal-to-Gas Project, Phase II
16 under construction
Suxin Energy Xinjiang Zhundong Coal-to-gas 40 under

19
project of 4 billion cubic meters construction
Xinjiang Qinghua Yili Coal-to-Gas Project, Phase II 41.25 under construction
Coal-to-olefin Project Name Capacity (ten thousand
tons/year) Status
Heilongjiang Longtai Coal-to-olefin Project of 600,000 tons
60 operation
Datang Duolun Coal-to-olefin Project of 460,000 tons
46 operation
Wison Nanjing Methanol-to-olefin Project of 300,000 tons
30 operation
Comprehensive utilization project of Jingbian Energy and Chemical Co., Ltd
60 operation
Ningbo Heyuan Methanol-to-olefin Project of 600,000 tons
60 operation
Ningxia Baofeng coke-oven gas-to-olefins project of 600,000 tons
60 operation
Qinghai Yanhu Coal-to-olefin Project of one million tons
100 operation
Shandong Shenda Methanol-to-olefin Project of one million tons
100 operation
ShandongYangmei Hengtong Methanol-to-olefin Project of 300,000 tons
30 operation
PCEC Coal-to-olefin Project of 700,000 tons 70 operation
Shenhua Baotou Coal-to-olefin Project of 600,000 tons
60 operation
Methanol-to-olefin Project of 500,000 tons of Shenhua Ningxia Coal Industry Group Co., Ltd
50 operation
Coal-to-olefin Project of 500,000 tons of Shenhua Ningxia Coal Industry Group Co., Ltd.
50 operation
Shenhua Urumqi 680 thousand tons of coal-based new materials
68 operation
Shenhua Yulin Methanol-to-olefin Project of 680,000 tons
68 operation
500 thousand tons of engineering plastics project of Inner Mongolia China Coal Mengda New Energy Chemical Co., Ltd.
50 operation
Deep processing and comprehensive utilization of methanol acetic acid of China Coal Shaanxi Yulin Energy & Chemical Co., Ltd
60 operation
Zhongtian Hechuang Erdos Coal-to-olefin Project of 1.3 million tons
130 operation
Sinopec Zhongyuan Methanol-to-olefin Project of 200,000 tons
20 operation
Total CPI Coal-to-olefin Project of 800,000 tons 80 under construction
Huahong Huijin Coal-to-olefin Project of 700,000 tons
70 under construction

20
Deep processing of coal of Qinghai Damei Coal Industry Company Limited
120 under construction
Qinghai Mining Coal-to-olefin Project of 600,000 tons
60 under construction
Sinopec Guizhou Zhijin Coal-to-olefin Project of 600,000 tons
60 under construction
Methanol-to-olefin Project of 600,000 tons of Sinopec Henan Coal Chemical Industry Group Co.,Ltd
60 under construction
Coal-to-ethanol Project Name Capacity (ten thousand
tons/year) Status
Jiangsu Yancheng 1200,000 tons of Coal-to-ethylene glycol project
120 proposed
Inner Mongolia Eastern Modern Energy 1.8 million tons of coal-to-ethylene glycol project
180 proposed
Ningxia Donglai Energy Chemical 250,000 tons of Coal-to-ethylene glycol project
25 proposed
Yigao Erdos 250,000 tons of synthesis gas-to-ethylene glycol project
25 proposed
600,000 tons of coal-to-ethylene glycol project of Zhong'an Union Coal Chemical Co.,Ltd
60 proposed
Hualu Hengsheng 50,000 tons of synthesis gas-to- ethylene glycol project
5 operation
10,000 tons of coal-to-ethylene glycol project of Huayi Group
1 operation
Tongliao Jinmei 200,000 tons of Coal-to-ethylene glycol project
20 operation
Xinhang Energy Erdos 300,000 tons of coal-to-ethylene glycol project
30 operation
Production of ethylene glycol from calcium carbide tail gas (50,000 tons) of Xinjiang Tianye Group Co., Ltd.
5 operation
Xinjiang Tianye 200,000 tons of Coal-to-ethylene glycol project, Phase II
20 operation
220,000 tons of coal-to-ethylene glycol project of Yangquan Coal Group Shenzhou Chemical Fertilizer Co., Ltd.
22 operation
400,000 tons of coal-to-ethylene glycol project of Yangquan Coal Group Shouyang Chemical Co., Ltd
40 operation
Yongjin Chemical Anyang 200,000 tons of Coal-to-ethylene glycol project
20 operation
Yongjin Chemical Puyang 200,000 tons of Coal-to-ethylene glycol project
20 operation
Yongjin Chemical Xinxiang 200,000 tons of Coal-to-ethylene glycol project
20 operation
Yongjin Chemical Yongcheng 200,000 tons of Coal-to-ethylene glycol project
20 operation
200,000 tons of synthesis gas-to- ethylene glycol 20 operation

21
project of Sinopec Hubei Chemical Fertilizer Branch
Yangquan Coal Pingding 400,000 tons of coal-to-ethylene glycol project
40 under construction
Guoneng Baotou 600,000 tons of coal-to-ethylene glycol project
60 under construction
Cornell Inner Mongolia 600,000 tons of coal-to-ethylene glycol project
60 under construction
Weihua Binxian 300,000 tons of coal-to-ethylene glycol project
30 under construction
Yongjin Chemical Luoyang 200,000 tons of Coal-to-ethylene glycol project
20 under construction
Predicted Scenario
Direct coal-to-oil
Project Name Capacity (ten thousand tons/year)
Status
Shenhua Erdos 1.08 million tons of direct coal-to-oil project
108 operation
Yan’an Anyuan Chemical one million tons of coal tar hydrogenation
100 operation
Yanchang Petroleum 450,000 tons of co-processing of coal and petroleum resid
45 operation
Indirect coal-to-oil
Project Name Capacity (ten thousand tons/year)
Status
Lu’an Shanxi Changzhi 160,000 tons of indirect coal-to-oil project
16 operation
Shenhua Erdos 180,000 tons of indirect coal-to-oil project
18 operation
Shenhua Ningxia Coal Ningdong 4 million tons of indirect coal-to-oil project
400 operation
Yanchang Yulin Coal Chemical 150,000 tons of synthesis gas-to-liquid project
15 operation
Yankuang Yulin one million tons of indirect coal-to-oil project
100 operation
Yitai Erdos 160,000 tons of indirect coal-to-oil project
16 operation
Yunnan Xianfeng 200,000 tons of methanol-to-gasoline project
20 operation
Shanxi Coal Huayu one million tons of methanol-to-clean fuel project
100 under construction
Lu’an Changzhi 1.8 million tons of indirect coal-to-oil project
180 under construction
Yankuang Yulin 4 million tons of indirect coal-to-oil project
100 under construction
Yitai Hangjin Banner 1.2 million tons of fine chemicals project
120 under construction

22
Yitai Huadian Ganquanbao 2 million tons of coal-to-oil project
200 under construction
Yitai Inner Mongolia 2 million tons of indirect coal-to-oil project
200 under construction
Yitai Yili one million tons of Coal-to-oil project 100 under construction
Coal-to-gas
Project Name Capacity (hundred million tons/year)
Status
Datang Keqi Coal-to-Gas Project, Phase I 13.3 operation
Inner Mongolia Huineng Ordos Coal-to-Gas Project, Phase I
4 operation
Xinjiang Qinghua Yili Coal-to-Gas Project, Phase I 13.75 operation
Xinjiang Xintian Yili Coal-to-gas project of 2 billion cubic meters
20 operation
Beikong Jingtai Ordos Coal-to-gas project of 4 billion cubic meters
40 under construction
Inner Mongolia Huineng Ordos Coal-to-Gas Project, Phase II
16 under construction
Suxin Energy Xinjiang Zhundong Coal-to-gas project of 4 billion cubic meters
40 under construction
Xinjiang Qinghua Yili Coal-to-Gas Project, Phase II 41.25 under construction
Coal-to-olefin
Project Name Capacity (ten thousand tons/year)
Status
Datang Duolun Coal-to-olefin Project of 460,000 tons
46 operation
Wison Nanjing Methanol-to-olefin Project of 300,000 tons
30 operation
Comprehensive utilization project of Jingbian Energy and Chemical Co., Ltd
60 operation
Ningbo Heyuan Methanol-to-olefin Project of 600,000 tons
60 operation
Ningxia Baofeng coke-oven gas-to-olefins project of 600,000 tons
60 operation
Qinghai Yanhu Coal-to-olefin Project of one million tons
100 operation
Shandong Shenda Methanol-to-olefin Project of one million tons
100 operation
ShandongYangmei Hengtong Methanol-to-olefin Project of 300,000 tons
30 operation
PCEC Coal-to-olefin Project of 700,000 tons 70 operation
Shenhua Baotou Coal-to-olefin Project of 600,000 tons
60 operation
Methanol-to-olefin Project of 500,000 tons of Shenhua Ningxia Coal Industry Group Co., Ltd
50 operation
Coal-to-olefin Project of 500,000 tons of Shenhua 50 operation

23
Ningxia Coal Industry Group Co., Ltd.
Shenhua Urumqi 680 thousand tons of coal-based new materials
68 operation
Shenhua Yulin Methanol-to-olefin Project of 680,000 tons
68 operation
500 thousand tons of engineering plastics project of Inner Mongolia China Coal Mengda New Energy Chemical Co., Ltd.
50 operation
Deep processing and comprehensive utilization of methanol acetic acid of China Coal Shaanxi Yulin Energy & Chemical Co., Ltd
60 operation
Zhongtian Hechuang Erdos Coal-to-olefin Project of 1.3 million tons
130 operation
Sinopec Zhongyuan Methanol-to-olefin Project of 200,000 tons
20 operation
Total CPI Coal-to-olefin Project of 800,000 tons 80 under construction
Huahong Huijin Coal-to-olefin Project of 700,000 tons
70 under construction
Deep processing of coal of Qinghai Damei Coal Industry Company Limited
120 under construction
Qinghai Mining Coal-to-olefin Project of 600,000 tons
60 under construction
Sinopec Guizhou Zhijin Coal-to-olefin Project of 600,000 tons
60 under construction
Methanol-to-olefin Project of 600,000 tons of Sinopec Henan Coal Chemical Industry Group Co.,Ltd
60 under construction
Datang Duolun Coal-to-olefin Project of 460,000 tons
46 put into production
Coal-to-ethanol
Project Name Capacity (ten thousand tons/year)
Status
Hualu Hengsheng 50,000 tons of synthesis gas-to- ethylene glycol project
5 operation
10,000 tons of coal-to-ethylene glycol project of Huayi Group
1 operation
Tongliao Jinmei 200,000 tons of Coal-to-ethylene glycol project
20 operation
Xinhang Energy Erdos 300,000 tons of coal-to-ethylene glycol project
30 operation
Production of ethylene glycol from calcium carbide tail gas (50,000 tons) of Xinjiang Tianye Group Co., Ltd.
5 operation
Xinjiang Tianye 200,000 tons of Coal-to-ethylene glycol project, Phase II
20 operation
220,000 tons of coal-to-ethylene glycol project of Yangquan Coal Group Shenzhou Chemical Fertilizer Co., Ltd.
22 operation
24
400,000 tons of coal-to-ethylene glycol project of Yangquan Coal Group Shouyang Chemical Co., Ltd
40 operation
Yongjin Chemical Anyang 200,000 tons of Coal-to-ethylene glycol project
20 operation
Yongjin Chemical Puyang 200,000 tons of Coal-to-ethylene glycol project
20 operation
Yongjin Chemical Xinxiang 200,000 tons of Coal-to-ethylene glycol project
20 operation
Yongjin Chemical Yongcheng 200,000 tons of Coal-to-ethylene glycol project
20 operation
200,000 tons of synthesis gas-to- ethylene glycol project of Sinopec Hubei Chemical Fertilizer Branch
20 operation
Yangquan Coal Pingding 400,000 tons of coal-to-ethylene glycol project
40 under construction
Guoneng Baotou 600,000 tons of coal-to-ethylene glycol project
60 under construction
Cornell Inner Mongolia 600,000 tons of coal-to-ethylene glycol project
60 under construction
Weihua Binxian 300,000 tons of coal-to-ethylene glycol project
30 under construction
Yongjin Chemical Luoyang 200,000 tons of Coal-to-ethylene glycol project
20 under construction
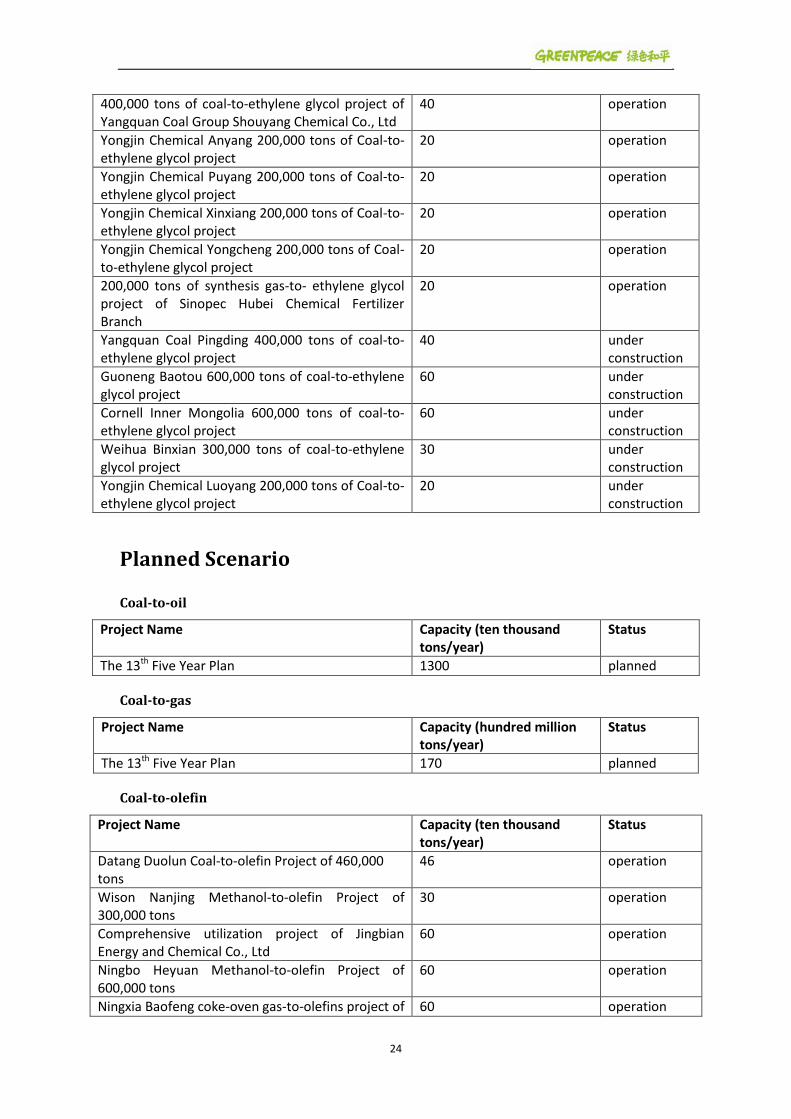
Planned Scenario
Coal-to-oil Project Name Capacity (ten thousand
tons/year) Status
The 13th Five Year Plan 1300 planned
Coal-to-gas
Project Name Capacity (hundred million tons/year)
Status
The 13th Five Year Plan 170 planned
Coal-to-olefin
Project Name Capacity (ten thousand tons/year)
Status
Datang Duolun Coal-to-olefin Project of 460,000 tons
46 operation
Wison Nanjing Methanol-to-olefin Project of 300,000 tons
30 operation
Comprehensive utilization project of Jingbian Energy and Chemical Co., Ltd
60 operation
Ningbo Heyuan Methanol-to-olefin Project of 600,000 tons
60 operation
Ningxia Baofeng coke-oven gas-to-olefins project of 60 operation

25
600,000 tons
Qinghai Yanhu Coal-to-olefin Project of one million tons
100 operation
Shandong Shenda Methanol-to-olefin Project of one million tons
100 operation
ShandongYangmei Hengtong Methanol-to-olefin Project of 300,000 tons
30 operation
PCEC Coal-to-olefin Project of 700,000 tons 70 operation
Shenhua Baotou Coal-to-olefin Project of 600,000 tons
60 operation
Methanol-to-olefin Project of 500,000 tons of Shenhua Ningxia Coal Industry Group Co., Ltd
50 operation
Coal-to-olefin Project of 500,000 tons of Shenhua Ningxia Coal Industry Group Co., Ltd.
50 operation
Shenhua Urumqi 680 thousand tons of coal-based new materials
68 operation
Shenhua Yulin Methanol-to-olefin Project of 680,000 tons
68 operation
500 thousand tons of engineering plastics project of Inner Mongolia China Coal Mengda New Energy Chemical Co., Ltd.
50 operation
Deep processing and comprehensive utilization of methanol acetic acid of China Coal Shaanxi Yulin Energy & Chemical Co., Ltd
60 operation
Zhongtian Hechuang Erdos Coal-to-olefin Project of 1.3 million tons
130 operation
Sinopec Zhongyuan Methanol-to-olefin Project of 200,000 tons
20 operation
Coal-to-ethanol
Project Name Capacity (ten thousand tons/year)
Status
Hualu Hengsheng 50,000 tons of synthesis gas-to- ethylene glycol project
5 operation
10,000 tons of coal-to-ethylene glycol project of Huayi Group
1 operation
Tongliao Jinmei 200,000 tons of Coal-to-ethylene glycol project
20 operation
Xinhang Energy Erdos 300,000 tons of coal-to-ethylene glycol project
30 operation
Production of ethylene glycol from calcium carbide tail gas (50,000 tons) of Xinjiang Tianye Group Co., Ltd.
5 operation
Xinjiang Tianye 200,000 tons of Coal-to-ethylene glycol project, Phase II
20 operation
220,000 tons of coal-to-ethylene glycol project of Yangquan Coal Group Shenzhou Chemical Fertilizer Co., Ltd.
22 operation
400,000 tons of coal-to-ethylene glycol project of Yangquan Coal Group Shouyang Chemical Co., Ltd
40 operation

26
Yongjin Chemical Anyang 200,000 tons of Coal-to-ethylene glycol project
20 operation
Yongjin Chemical Puyang 200,000 tons of Coal-to-ethylene glycol project
20 operation
Yongjin Chemical Xinxiang 200,000 tons of Coal-to-ethylene glycol project
20 operation
Yongjin Chemical Yongcheng 200,000 tons of Coal-to-ethylene glycol project
20 operation
200,000 tons of synthesis gas-to- ethylene glycol project of Sinopec Hubei Chemical Fertilizer Branch
20 operation