abstract - erasmus university rotterdam p. (303557).docx · web view1. introduction4. 2....
TRANSCRIPT
The effects of store differentiation factors on price levels.
Online consumer electronics stores in the Netherlands.
ERASMUS UNVERSITY ROTTERDAM
Erasmus School of Economics
Supervisor: Vijay Ganesh Hariharan
Name: Petru Didenco
Student Number: 303557pd
E-mail: [email protected]

Contents
Abstract............................................................................................................3
1. Introduction............................................................................................4
2. Literature review................................................................................10
3.Data.............................................................................................................17
4. Methodology............................................................................................27
5. Regression results.................................................................................31
6.Managerial and economical implications......................................396.1 Managerial importance...................................................................................................396.2 Economical and scientific contribution.....................................................................39
7. Concluding discussions........................................................................40
Appendix.......................................................................................................42
References.......................................................................................................2
2
Abstract
The fundamental objective of this paper is to identify the factors responsible for
the existing price differences across consumer electronics stores. The research
will be concentrated on 115 online stores functioning in the Netherlands; this
number incorporates both pure e-tailers and so called brick-and-click stores. By
focusing just on the Dutch market I am trying to account for possible market-
specific price shaping factors.
The specific emphasis of this paper is focused on firm characteristics; I
distinguish three dimensions on which firms heterogeneity can be responsible
for the different price levels: type (pure e-tailer or brick-and-click), size and
quality. All of the three dimensions are described by more than one variable.
In this research I use linear regression and find statistical evidence suggesting
that quality aspects such as process handling, aftersales service and online
support do indeed have an influence on average price levels of an e-tailer.
Moreover I find supportive evidence for the hypothesis that brick and clicks are
more expensive than pure play e-tailers. I also find that prices continue to rise
when more employees are hired, keeping the number of offline shops the same.
Additional finding is that product spread is also a factor of influence for price
levels.
I find no evidence that large number of products offered by the retailer has any
influence on the price levels. Also no evidence is found to confirm the effect of
additional payment methods on the average price levels.
3

1. Introduction
Internet as we know it nowadays can be rightfully considered to be one of the
greatest inventions in human history. It allows connecting previously
unimaginable numbers of individuals all around the world. In the early days,
Internet was a luxury available just to the US government, later it also became
possible for universities and libraries to: connect, share, and distribute
knowledge and information. Until the early 90’s it was prohibited to use the
network for purposes other than those directly contributing to or serving the
research. This was mainly because the infrastructure belonged to the United
States government. However in the beginning of the 90’s small commercial
networks started to appear, this networks were relying on their own
infrastructure and thus were fully independent from the government. As more
and more of these networks appeared across the US, there was an urging
necessity to interconnect them for intranet communications. Linking them
together allowed the information to be routed across these networks, now
however, it could be done by firms and individuals unaffiliated with these
companies. In other words the networks became accessible, almost anybody
could make use of the backbone infrastructure.
Around the same phase Internet was commencing to become an approachable
place not just for individuals with IT back background but also for regular public.
New networking protocols such as www (world wide web) were implemented.
The prevalent enhancement to the Internet development however was given by
the creation of the web browser. Information could now be represented in a
much more welcoming graphical way.
By the end of the 90’s Internet has become “the place” for those who wanted to
cover wide territories both geographically and economically. Internet has
become a market of its own.
Enormous amounts of e-shops appeared on the web but also huge amounts went
bankrupt in consequent years as a result of aggressive competition and fast
moving pace. This was later called the burst of the Internet bubble.
4

Currently, Internet retailing plays a significant role in global and local economies.
In 2010 Internet retailing to general public has generated $316.9 billion, a
number more than twice higher than in 20051.
In the Netherlands Internet retailing is accountable for €3 billion worth of sales
(2010) a 15% the upsurge over 2009. Euromonitor prognoses that Internet
retailing will continue to propagate at a persistent 10% yearly rate through the
following years and will eventually reach €5 billion by 2016.2
Dutch Internet retailing: Trends and predictions
Though the growth of Dutch Internet retailing is still robust, it starts to show the
first signs of maturity. Growth rate is beginning to diminish as e-market reaches
its saturation. According to Thuiswinkel.org (non-store retailing association)
Netherlands had more than 20,000 e-shops in 2010.
The fastest growing sectors in online retailing are clothing and footwear; these
sectors exhibited a 28% growth in 2010. Second place by growth belongs to
consumer healthcare with 18.3%. Consumer electronics sales value has
increased by 10.4% between 2009-2010.
Total growth of Internet retailing in the Netherlands consisted of 15.4% increase
for the same period.
Currently population aging is considered to be one of the biggest threats Internet
retailing poses. Population of senior citizens is expected to be 3 million by 2015.
This presents a challenge for e-tailers because they have to somehow break the
intimidation barriers seniors have towards Internet shopping3.
1 Source: Euromonitor Passport GMID2 Source: Euromonitor Report 20103 Source: Euromonitor briefing 10th June 2011
5
Figure1: Dutch Internet Retailing by Category: Values 2005-2010
Source: Euromonitor, www.portal.euromonitor.com
In the beginning of the last decade economists predicted the start of the Internet
retail era that with no doubt would lead to the end of conventional retail stores.
Experts believed that low or almost negligible search costs on the Internet would
imminently lead to the reign of the law of one price. This wasn’t a totally wrong
assumption to make given the openness and wide availability of information on
the web. To be clear this doesn’t only relate to consumers but also to the sellers.
Internet enabled businesses to better learn their environment, both from their
customer and competitor’s point of view.
However, as the years passed we still didn’t see total equalization of prices.
Research (discussed in the literature review section) shows that price levels vary
across both online and offline stores.
There are several reasons that might explain the failure of the law of one price in
this case, here are some of the possible causes: consumer search behavior, shop
6
differentiation, product brand influence, shop image influence, market saturation
and competition levels.
7
Consumer search behavior is an important factor that could be responsible for
price differences across stores. All humans are different and so are their
subjective utility functions and reservation prices for a certain product or
service. In other words we do not always go for the lowest price but instead we
stop searching when our internal conditions are satisfied. One more aspect of the
search behavior is the amount of knowledge a customers have. One’s ability to
search may be limited by the number of shops he/she knows. Usually, in real-life
situations the search process goes no further than a couple of biggest or most
common sellers. Moreover, a survey conducted in US has shown that for
categories such as groceries most of us are one-brand consumers; meaning that
most of the time we shop for groceries at the same store, although it is not
economically rational in any way.
Store differentiation is yet another important factor that could influence pricing
strategies. Although at the first glance it may seem that online stores offering
similar products are by default alike, this is not always the case. Online retailers
have several degrees on which they could differentiate themselves from
competition: friendliness of the site, easiness of navigation, online support,
delivery, aftersales support and return policies. Generally store differentiation
factors can be seen as the quality of the retailer. If in a regular retail store the
customer can address his questions to the sales force personnel, in online store
on the other hand, the site itself provides the most common information about
the product. The extent to which this is done can vary widely across different
online stores. Some stores may help find products that satisfy specific needs of
the potential customer.
Aside from the benefits of having good online support and extensive product
information there is also a disadvantage to it. It can arise from a phenomenon
called customer freeriding. Meaning that customers may exploit or extract all the
information they need and then purchase the product from a discounter or any
other shop that offers a better deal. Thus it is a dangerous practice for e-tailer
and retailers in general to offer too much pre-purchase service, especially if such
service requires significant time or financial investment.
Retailer image is also an important factor for the price formation process.
8

A branded retailer, when compared to an unknown one, can find himself in a
profitable situation when it comes to pricing. Retailers with high awareness tend
to charge higher prices on average (Chen, 2001).
We all know about brand loyalty, but there is also another type of loyalty, store
loyalty. Store level loyalty has been shown to exist both offline and online. Unlike
brand or product loyalty, this type of loyalty is not linked to the product but to
the store itself.
Economic theory suggests that lower search costs should incline clients towards
a more extensive pre-purchase search and make them go for the best bargain.
This is under the assumption that people are economically rational. However
rationality and loyalty do not live together. Severe cases of extreme loyalty may
even be considered as total irrationality. Although loyalty may not be taken into
majority of equations and models, it still is an important component of consumer
utility.
In addition to the things mentioned above I would add that the availability of
information itself does not mean that the information is perfect; more than that,
the search costs are not totally absent from the equation because time too is a
scarce resource.
When measuring price differences at the store level it is very important to
account for product portfolio of a given store because some products have a
manufacturer-enforced price. The manufacturer sets a minimum or maximum
price for a certain product; the seller then agrees to sell that product without
exceeding the agreed limits. Apple Corporation would be a good example of such
a manufacturer; pricing policy that Apple enforces coexists in a close relation
with their brand policy. Image is an important factor in Apple’s pricing, thus a
low price for a laptop for example would negatively influence the overall brand
image.
This paper is organized as follows: In section 2 I describe relevant literature and
most important findings. Section 3 describes data collection process and the
variables used in the model. Section 4 describes methodology used in this paper
9

and shows the model improvement steps. In section 5 I present regression
results and compare my expectations with the actual outcomes. Section 6
describes managerial and economic implications. Section 7 presents conclusions,
discussion and drawbacks.
10
2. Literature review
This research is focused on the effects of store differentiation factors on price
levels of the store. The terms “price levels” and “price dispersion” although
denoting different things, may sometimes be similar depending on the context.
Even in literature these terms are sometimes mixed. For the sake of clarity I will
use “price dispersion” in order to denote difference in price for the same product
or service sold by different retailers. I will use the term “price level” to denote
the average price of the totality of products of a particular retailer.
When speaking about price dispersion and price levels in general there are
several directions or streams, each focusing on important aspects of the topic.
The first branch of the stream is the division into off-line and online markets. In
the days when computers were not as common as today, it was very hard if not
impossible for researchers to collect and analyze large amounts of data. A
medium-sized research of a supermarket chain for example would require huge
effort, time, labor and financial resources. Because of this there are very few
works that account for the time aspect as time comparison would require
repeated data collection, which is costly.
However such research exists, (Eckard, 2004) used a unique government survey
conducted in 1901 to find whether price dispersion existed back then. Aside
from showing that prices for identical products were also different back then,
Eckard has identified the factors that influenced the price levels for several
product categories; He showed that price variation between cities was higher for
more expensive products because such products involved higher search and
transportation costs. From this research we see that price influencing elements
such as search costs and some embryonic service elements existed back then.
Although these elements were not so obvious as nowadays, they have still played
an important role in the price formation process.
11
When Internet became accessible to wider auditory it opened the floodgates of a
huge information dam. Internet shops were popping up very fast. Some of these
shops still exist today while some of them did not survive the shakeout phase of
the Internet bubble. Information technology was evolving at a progressive rate,
computing power and storage capacity were getting both better and cheaper at
the same time. Breakthroughs in data storage and manipulation technologies
allowed the databases to be linked directly to the store site thus giving birth to
price comparison sites. The chain of events mentioned above has conditioned the
start of a new wave of interest from researchers. The main focus of researchers
gradually switched towards online markets.
(Baye and Morgan, 2001) provide a good theoretical background on pricing
strategies and introduce the term “information gatekeeper”, authors consider a
market where the keeper is a profit maximizing firm which collects product
information from the sellers and then offers it to the potential buyers. This
however is not done free of charge, both parties pay for the information. The
seller pays a fee to get the price listings into the system. The buyer on the other
hand pays to get the access to the totality of all price listings. The extent to which
the system is active determines competitiveness levels in this market, which in
its turn affects consumers demand for information. The findings suggest that the
equilibrium is found when:
a) Consumer fees are set at such a level that would motivate all the
consumers in the market to subscribe, i.e. when the entry barriers for
the consumers are extremely low.
b) The prices for the firms willing to advertise are set above the social
optimum level, such that would only induce partial participation by
the firms.
c) Prices listed by the sellers have to be lower than those of
unadvertised sellers.
Surprising thing is that given this setting, which implies that consumers only go
for the lowest price offer, prices still vary, meaning that price dispersion is a
result of equilibrium.
12
(Pan et al., 2003) also conduct a study on price dispersion evolution. This paper
is focused on price dispersion behavior after the burst of Internet bubble.
Authors analyze data from years 2000, 2001 and 2003. The results have shown
that price dispersion did indeed decline between the years 2000 and 2001
however this was considered to be a result of the market shakeout after the
bursting of the Internet bubble. The reason for that is the fact that price
dispersion started to rise again after 2001. The increase was especially large for
a certain category of products such as: notebooks, desktops, PDAs and software.
The results of the two articles mentioned above show once more that price
dispersion is not a question with one answer. Aside from availability of
information and search costs there are many other factors that could influence
the dispersion of prices both online and off-line.
(Chen and Hitt, 2003) built a theoretical model including two interaction effects:
brand sensitivity of the consumers and their limited knowledge about the
products. Besides confirming existent theories authors have several
complementary findings that shed more light on the structure of prices:
1. A branded retailer will on average charge higher prices than a generic
retailer, given that the pricing is not below marginal cost. In some cases
e-tailers may follow the path of price randomization and use mixed
pricing strategy. In this case branded retailers may offer a lower price
for a certain product for a certain period of time. Sellers prefer to use
randomization strategy in a case when search costs are not symmetric
across customers and sellers. On average a branded retailer will charge
higher prices than a generic one although his price is not always the
highest.
2. In this finding authors suggest a possible answer to the problem of
prices in e-markets. Why is price variation so common in this market?
This could be due to the fact that e-markets are not yet mature. Authors
suggest that consumer awareness will never converge because it is a
result of an equilibrium state. Although e-shops may improve
13
awareness levels by advertising themselves, it makes no sense for them
to do so because aside from awareness it also increases competition.
Thus leading to lower prices and as a consequence lower profits.
Online retailers can differentiate themselves on several levels, this includes:
overall look and feel of the site, reliability, shipping process handling, fast
delivery and extensive product information.
As found by (Pan and Ratchford, 2001) market characteristics do indeed
influence prices online. Authors have a four-step approach to the problem that
includes using factor analysis, identifying clusters, regression analysis and
hedonic regressions. Among other things they find out that shops with higher
than average price levels also exhibit higher price dispersion.
In their later work (Pan et al., 2002) find evidence that service quality can only
partially explain the pricing of an e-tailer. Being a brick-and-click seller is also
shown to influence the final price. But the greatest driver of pricing strategy is
the number of competitors.
In economics, high levels of competition are considered to be one of the most
important sources influencing the price. Competitive markets are typically very
beneficial for customers seeking good quality for democratic prices; competitors
on the other hand have to struggle for these customers. In the early days it was
considered that price is the only means of differentiation for online retailers. The
reason for such beliefs was competition. Experts predicted that fierce
competition would force online e-tailers to lower their prices constantly,
however, what we see is that e-tailers have found other ways to differentiate
themselves from their competitors. Such differentiation allowed them not to
lower their prices. Moreover as found by (Venkatisan et al., 2006) e-tailers who
offer better service benefit from higher competition levels through better
differentiation. By using multilevel hierarchical linear models authors find out
that service quality has a positive effect on retailer price levels. Using the same
methods authors discover that relation between competitive intensity and the
14

price levels can be described as an inverted parabola. These finding are nothing
more than empirical proof of mixed pricing strategies.
(Venkatesan et al., 2007) have several findings one of which supports the
competition idea while the other one states that service quality has a significant
impact on pricing. Although the finding about service quality does not come in
contradiction with any of the previous findings, the amount of influence it
executes does. (Venkatesan et al., 2007) also find evidence that there is an
interaction between market and e-tailer characteristics.
Authors find evidence that brick-and-click retailer charge significantly higher
prices than pure e-tailers do.
The second stream of research focuses on the factors that enable both brick-and-
click and pure-play players to charge certain price levels. If we take the 4 p’s
(Product, Price, Place, Promotion) of marketing and try to apply them to an e-
tailer, we will immediately see that Place becomes irrelevant when we move to
the Internet. To compensate, e-tailers have to find new ways to differentiate
themselves. (Cazier et al., 2006) focus their attention on this issue and come up
with a term ”value congruence”. In simple words, value congruence is the
measure of the overlap between the values of customers and the values they
believe an organization has. Sharing and conveyance of these values produces
trust, trust that helps building the relationship between the customer and an e-
tailer. Authors believe that relationships built as a result of value congruence are
stronger and thus will last longer than those created by other means.
Value congruence can be created almost from any differentiation point of a firm
as long as it is steady in time. If values propagated by the firm are changed too
frequently value conflicts may arise. In other words, if a firm promotes high
quality service while offering slightly higher prices, it should stick to this strategy
for a certain amount of time in order to let the “value-match” settle in the minds
of the consumers. When the match is more or less stable, e-tailers can charge
even higher prices without being punished by decreased sales.
15

Service quality and customer satisfaction have been shown to directly influence
customer purchase intentions. (Lee and Lin, 2005) have developed an
instrument to examine and measure the dimensions of service quality in order to
see the effect on the buying decision. After analyzing the data authors come to a
conclusion that customers see service quality as integral thing, they do not
evaluate separate aspects and components prior to making a purchase decision.
Given the focus of this paper and the literature I have developed 2 hypotheses
that reflect the main questions:
H1: Pure e-tailer stores are cheaper than brick-and-click stores.
H2: Stores with better service have higher prices than those with lower service.
The reviewed literature supports all of the hypotheses. However, because I focus
specifically on consumer electronics retailers in the Netherlands, as a
consequence of local market specifics we may witness some unexpected results.
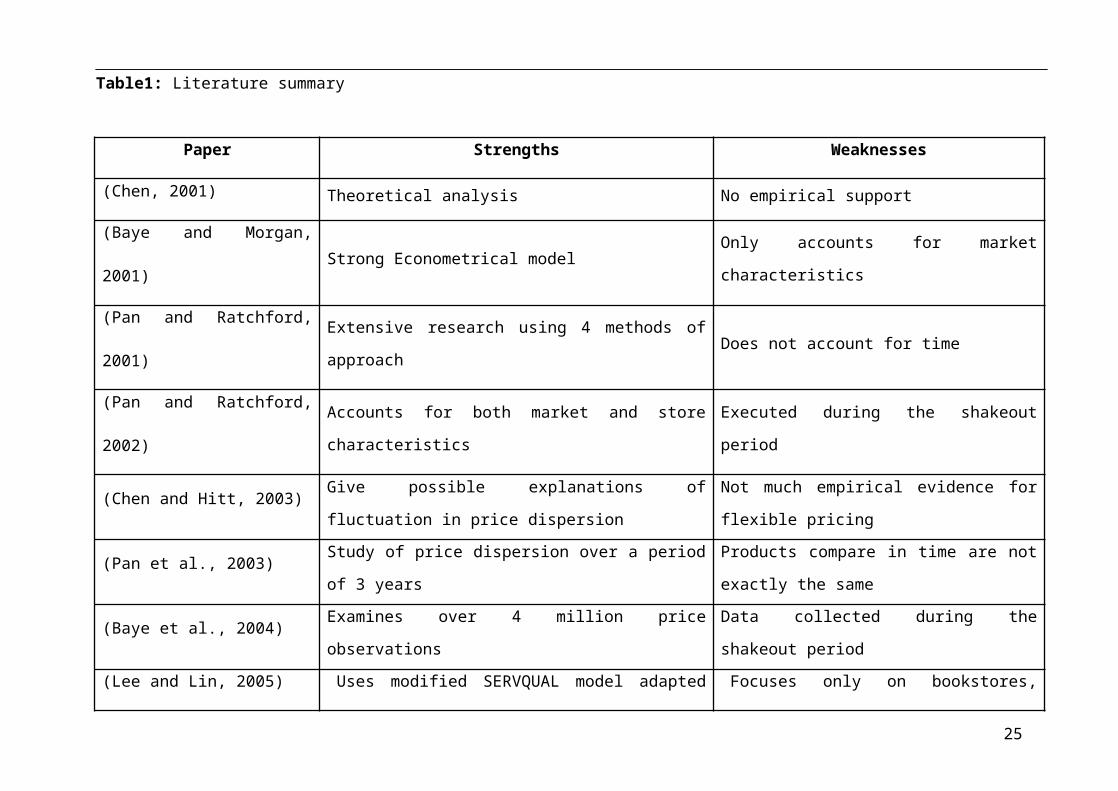
Literature comparison can bee seen in Table1. In general there are no
contradictions in the examined papers except for some minor ones. I arranged
the papers in chronological order so that the time evolution of research could be
seen. The fact that there are no big contradictions between the papers is due
advancement of research. Later papers are usually the extension of previous
work, thus giving more insights and proofs.
16

Table1: Literature summary
Paper Strengths Weaknesses
(Chen, 2001) Theoretical analysis No empirical support
(Baye and Morgan, 2001) Strong Econometrical model Only accounts for market characteristics
(Pan and Ratchford, 2001) Extensive research using 4 methods of approach Does not account for time
(Pan and Ratchford, 2002) Accounts for both market and store characteristics Executed during the shakeout period
(Chen and Hitt, 2003)Give possible explanations of fluctuation in price
dispersion
Not much empirical evidence for flexible
pricing
(Pan et al., 2003) Study of price dispersion over a period of 3 yearsProducts compare in time are not exactly the
same
(Baye et al., 2004) Examines over 4 million price observations Data collected during the shakeout period
(Lee and Lin, 2005) Uses modified SERVQUAL model adapted for online
environment
Focuses only on bookstores, limited
generalizability.
(Cazier et al., 2006) Introduces a direct link between service quality and
customer purchase intensions
Uses a hypothetical website in the experiment
setting.
(Venkatesan et al., 2006) Focuses on market characteristics Does not focus on shopper characteristics
(Venkatesan et al., 2007) Focuses on market characteristics Does not focus on shopper characteristics
17

3.Data
For my research I rely on the pricewatch database of the tweakers.net site. The
tweakers.net project was started in 1998. Since then it has become the biggest
and most popular site in the Netherlands for everything related to computers,
consumer electronics and technology in general. The sections of the site cover a
very wide area of the IT world in the Netherlands, this includes: prices, reviews,
demand & supply, forum, community and even a Job market for IT professionals.
I consider that tweakers.net database fits the best with my purpose of research
because it is specifically focused on consumer electronics. Big advantage of
tweakers.net is that they offer a software package called PWM (pricewatch
manager). With the help of this package Internet retailers can connect their
databases directly to the pricewatch section of the tweakers.net. This has several
advantages over other price comparison sites:
a) The chance of an error is reduced because the prices are updated
directly through the database so there is no need to manually collect
and post prices. This gives both speed and precision.
b) The updates can be much more frequent than it would be possible
using conventional systems. Shops decide when to update prices,
product descriptions, store information etc.
c) Product assortments of entire shops can be categorized and sorted, this
gives the users of the site a bird’s eye view of a particular shop. Each
shop listed on tweakers.net has its own page where users can read all
the contact info, payment and delivery methods available, price rating
and reviews.
d) An e-tailer that uses the pricewatch has the possibility to track its own
historical data. This useful feature gives the managers a possibility to
analyze their past actions or strategies and compare them against the
obtained sales numbers.
e) Depending on the type of the chosen package price manager can offer
the manager competitor’s prices that are sorted and linked to own
18
prices. This allows the e-tailer to dynamically adjust their pricing
policy/strategy.
f) The price manager software is very flexible and can be custom tailored
to the needs of a particular e-tailer. The pricing of price manager is also
flexible thus allowing both big and small players to make use of it.
g) The information available on the site is free to consumers as opposed
to consumentenbond.nl for example.
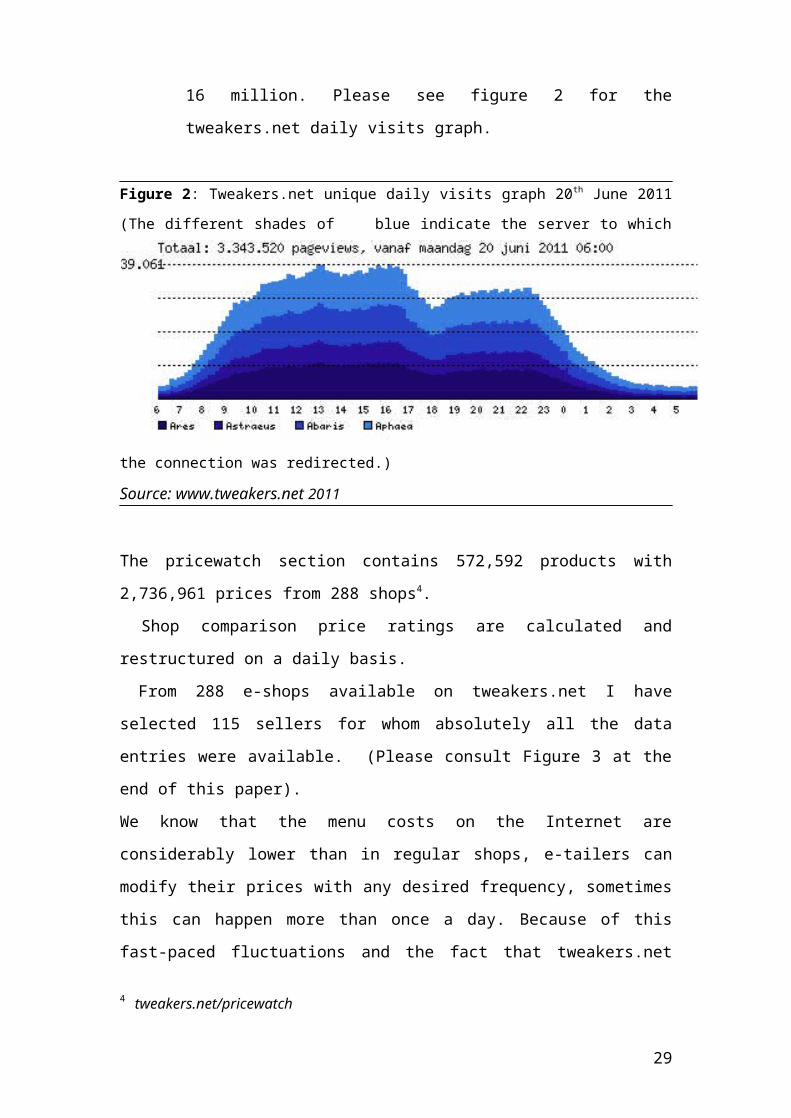
The site generates about 3 ½ millions unique visits a day, which is a
huge number considering that the population of the Netherlands is
roughly 16 million. Please see figure 2 for the tweakers.net daily visits
graph.
Figure 2: Tweakers.net unique daily visits graph 20th June 2011 (The different shades of
blue indicate the server to which the connection was redirected.)
Source: www.tweakers.net 2011
The pricewatch section contains 572,592 products with 2,736,961 prices from
288 shops4.
Shop comparison price ratings are calculated and restructured on a daily basis.
From 288 e-shops available on tweakers.net I have selected 115 sellers for
whom absolutely all the data entries were available. (Please consult Figure 3 at
the end of this paper).
We know that the menu costs on the Internet are considerably lower than in
regular shops, e-tailers can modify their prices with any desired frequency,
4 tweakers.net/pricewatch
19

sometimes this can happen more than once a day. Because of this fast-paced
fluctuations and the fact that tweakers.net renews their price ratings everyday,
my numbers had to be collected in one day in order to preserve the desired
accuracy.
For the purpose of this research and for what I planned I needed a variable that
would serve as an indicator of firm size, unfortunately such information was not
publicly available for all the shops in my dataset. For these reasons I had to
resort to the paid data offered by KvK Netherlands, the Dutch trade organization
(Kamer van Koophandel). From their database I have obtained the number of
employees of each firm who are officially registered as either fulltime or part-
time personnel. The data is for 2011.
In this section I will describe the shop Characteristics I use in my model as well
as the notation for each variable.
Price rating- Is the dependent variable of my model, as the name suggests it
symbolizes the overall shop price rating when paralleled to the
average price throughout all shops. This figure is computed and
revised everyday by tweakers.net. The indicator can be seen as a
percentage rank, for example: a shop with a price rating is of 90 is
10% cheaper than the average shop, a rank of 110 would indicate a
shop 10% more expensive than average.
Delivery rating- Represents customer’s satisfaction levels regarding provision of
the ordered product. It is computed by averaging the total amount
of grades left by the users who wrote a review or just left a grade.
The rating is represented by number of stars from 1 to 5 including
halves. The one thing that may not be clear from the name of the
variable is that it does not only denote the delivery process
executed by the transportation or the post company, but also the
handling process of the shop itself: how fast is the order processed,
how well is it done etc. For example some e-tailers offer extensive
order status tracking possibilities such as: e-mail notifications and
sms messages while others keep the clients in the darkness.
20
Another example is how well the e-tailer handles the stock. In
other words this variable captures the whole order process,
beginning from order placement and ending with the receipt of the
goods.
Both intuitively and logically I expect delivery rating to have a
positive relationship with the price rating because this variable
captures the element of service quality offered by the retailer; and
better service means higher prices.
Aftersales rating- Denotes customer’s satisfaction levels concerning aftersales
service in case of underperforming or malfunctioning product. This
includes warranty repair or return of the product. It is computed
by averaging the total amount of grades given by the users who
wrote a review or just left a grade. The rating is represented by
number of stars from 1 to 5 including halves. This variable is yet
another proxy for capturing aspects of service quality. However
when compared to delivery rating we can see that it is focused on a
totally aspect of service. The aftersales rating can be viewed as an
indicator of the firm’s attitude to existing clients. Aside from
malfunctioning or defective products it includes: servicing of
products that are already out of warranty or just aftersales
consultation in a case when consumers have technical difficulties
with a product. From my own experience I know that some
retailers handle warranty problems on their own while others tend
to push the customers away to the manufacturer motivating it by
saying “we are just a selling products”.
Offering great aftersales service may be costly for the retailer, it
may require to have right facilities, personnel training, warranty
handling outsourcing contracts etc.
For the reasons mentioned above I expect to see a positive
influence of aftersales rating on the price levels.
21
General rating- Although I have gathered the general ratings for the shops I had to
exclude this variable from the model because it was highly
correlated (more than 0.6) with the two ratings mentioned above.
The economical and/or intuitive explanation for such a behavior is
simple, when customers are satisfied by aftersales and handling
services it is natural for them to assign the shop a high overall
rating.
Total nr. of SKUs- Is the total number of products offered by a particular store. I
use this variable as a partial indicator of a firm size. Economical
thinking suggests that firms offering a very large amount of
products would also offer lower prices because of the economies of
scale, better relations with suppliers etc.
I expect to se a negative relation between total number of sku and
the dependent variable in my model.
Offline presence- A dummy variable specifying whether a particular e-tailer
belongs to the pure players or to the brick-and-click group.
Economical theory and existing research (Friberg et al., 2001)
suggest retailer who have a multichannel distribution system will
have higher prices than those who only sell online. I do not expect
to find any contradicting evidence to this.
Higher prices may exist as a result of higher cost of offline presence
(rents, taxes, utility costs etc.).
Thus In my result I expect to see a positive effect of offline
presence on the price levels.
Number of shops- Denotes the number of offline stores available in case it is a
brick-and-click store. This variable is used in the computation of
the relative number of employees, it will be described later in this
section.
22
Certificate- Is a dummy variable specifying whether the e-shop has a
certificate issued either by thuiswinkel.org or qshops.org. The
certificate is an indication of decent confidence towards the store,
meaning that this site respects the fair code of conduct towards the
customers, respects the 14-day return policy and handles all the
customers correspondingly. The certificate is not an assurance
against financial or other dangers, it is there to show customers
that this particular shop can be trusted, that its policies/user
agreements have been reviewed and are not trespassing the law.
I see two scenarios of how the presence of a certificate could or
could not affect price levels of a given shop: 1.Customers may
perceive the shops with certificates as high quality retailers. Thus
empowering e-shops to raise their prices. 2. Majority of market
players would probably choose to be certified, as this does not
involve any significant costs. This in its turn would lead the
absence of differentiation and thus to no means of exploiting the
certificate.
Payment method- A dummy variable showing the acceptance of additional payment
methods apart from Dutch iDeal, regular bank transfer, acceptgiro.
Among such methods are: PayPal, rembours (payment to the
courier by delivery), ClickAndBuy, Visa, MasterCard and payment
in installments.
I have a mixed prediction about the effects of this factor. On the
one hand additional payment methods can be interpreted as a
supplement to service quality and thus cause higher expenditures
for the seller. On the other hand additional payment methods can
lower the entry barriers for the consumers making it easier to
purchase the products. Although such a relationship may seem
vague at a first glance, I believe that lower entry barriers may
eventually lead to more customers, more sales and ultimately to
lower prices.
23
Online support-A dummy variable indicating the presence of online support, this
includes: online chat, Skype, callback service, and free support
lines. By this variable I would like to capture yet another service
aspect of the shop. Regular on-site e-mail forms are not counted,
although this is a variation of online support, it is in most cases not
fast enough. Online support plays a crucial role in a situation when
customer’s search comes to an informational dead-end, when
product information available on the site does not suffice the needs
of the customers.
I predict this factor to have a positive relationship with the
dependent variable because offering this kind of service requires
personnel that is both knowledgeable and trained to handle
customers.
Relative number of employees- As the name implies, this variable represents
the relative number of employees. It is calculated by dividing the
total number of employees officially registered in the firm by the
number of offline shops this firm has +1. I expect this variable to be
a good indicator of the firm magnitude and a cost driver eventually
leading to higher product prices.
Ex ante I expect it to have a positive relationship with the price
rating as more employees generate more labor costs for the firm.
Of course I realize that the opposite can happen because aside from
labor expense workers also generate sales and thus more profits
for the firm. But, given the fact that Netherlands is a developed
country and educated labor force is one of the most expensive
resources I still believe I will se a positive relation between relative
number of employees and price rating.
Low variety- This dummy indicates the level of variety of products available in a
particular store. Variety, or in other words assortment should not
be confused with total sku. Variety shows the width or spread of
the shop. For example, a shop that is specialized in notebooks has a
24

low variety. A shop that sells everything from computer mice to
fridges has a high variety. Everything in between is considered to
have a medium variety.
To highlight the difference from total sku indicator imagine a shop
that sells only laptops but has lots of them, such a shop has low
variety but high total sku. Vice versa, a shop selling a cd, a laptop
and a washing machine has only three SKUs but a large variety.
Of course there are shops that have both lots of products and a
high variety, for example MediaMarkt.
Generally I expect to see a negative relation with price rating
because shops with low variety are specialized shops. This makes it
easier for them to cope with competition and pricing strategies.
High variety- Is the direct opposite of the previously described variable.
I expect to see a positive relationship with the price because high
variety involves more business difficulties such as: competing with
specialized shops, developing relations with the suppliers of wide
range of products, logistical difficulties etc.
Table 2 presents a clearer view of the predictions I made in this section.
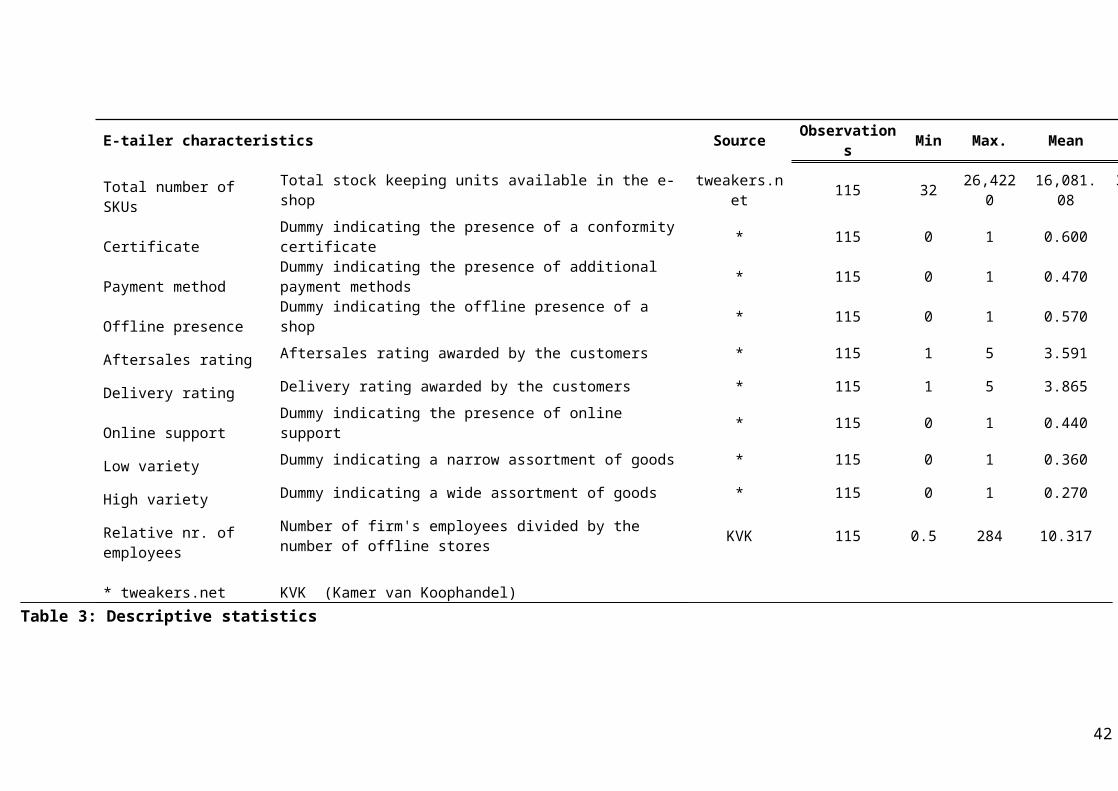
Table 3 presents the descriptive statistics for the dataset; it includes a brief
description of the variables and data sources that were used to collect the data.
25
Variable Expected relationship Justification
Relative number of employees positive Costly labor
Total number of SKUs negative Economies of scale
Certificate negative/positive No differentiation/perception of quality
Payment method negative/positive Lower entry barrier/supplement to service
Aftersales rating positive Costly quality service
Delivery rating positive Costly quality service
Online support positive Trained personnel
Offline presence positive Costly offline presence
Low variety negative Specialization
High variety positive Lower transition efficiencyTable2: Predictions summary
26

27
E-tailer characteristics Source Observations Min Max. Mean
Total number of SKUs Total stock keeping units available in the e-shop tweakers.net 115 32 26,4220 16,081.08 39,370.227
Certificate Dummy indicating the presence of a conformity certificate * 115 0 1 0.600
Payment method Dummy indicating the presence of additional payment methods * 115 0 1 0.470
Offline presence Dummy indicating the offline presence of a shop * 115 0 1 0.570
Aftersales rating Aftersales rating awarded by the customers * 115 1 5 3.591
Delivery rating Delivery rating awarded by the customers * 115 1 5 3.865
Online support Dummy indicating the presence of online support * 115 0 1 0.440
Low variety Dummy indicating a narrow assortment of goods * 115 0 1 0.360
High variety Dummy indicating a wide assortment of goods * 115 0 1 0.270
Relative nr. of employeesNumber of firm's employees divided by the number of offline stores
KVK 115 0.5 284 10.317
* tweakers.net KVK (Kamer van Koophandel)Table 3: Descriptive statistics
28
4. Methodology
The purpose of this paper is to study the relationship between the price levels
and store differentiation factors in Internet retail and especially in the consumer
electronics area. As shown by (Pan et al., 2002) some of the price variation is
indeed explained by the differences in store characteristics. I believe store
heterogeneity effects are underappreciated in in the existing research. This
paper particularly focuses on three levels of store differentiation:
1. Player type – pure player vs. brick-and-click. Given the fact that
Netherlands is not one of the cheapest countries to live and work in, with
relatively high tax rates, social security costs, real estate, transportation
and holding costs. I believe that the expenses associated with offline retail
may have an influence on the price levels and pricing strategies of e-
tailers.
2. Size of the store – measured several levels. Unfortunately not having the
financial data of the firms used in my analysis makes it difficult to
estimate the size basing on figures like turnover, units sold etc. However,
the total amount of SKUs offered by the e-shop, the number of offline
shops (if any) or the number of employees could be good indicators of
company size.
3. Service quality – It is always difficult to measure quality in terms of
numbers especially if we talk about store quality and service quality. This
is especially true online. The feeling of quality is highly subjective and can
be disturbed by numerous factors. In this paper I rely on quality
indicators such as: ratings given by the customers, delivery, support and
aftersales. The paper by (Reibstein, 2002) sees quality and price as almost
two distinctive objects. I however believe that higher store or/and service
quality may result in two things: lower margins or higher prices. Given
the fact that all commercial organizations are profit maximizers by
nature, I believe higher service/quality levels should result in higher
prices paid by customers.
29
For the purpose of this study I use linear regression to identify the factors that
may explain existent differences in price levels between online stores selling
consumer electronics in the Netherlands.
I run several variations of the model, beginning from the plainest one and
progressively expanding it. The general form of the model is represented by (1).
y i=α+β x i+εi (1)
Where y is an n-by-1 vector and x is an n-by-m matrix of retailer specific
characteristics amongst which are the elements of my principal interest that
were declared in the above section.
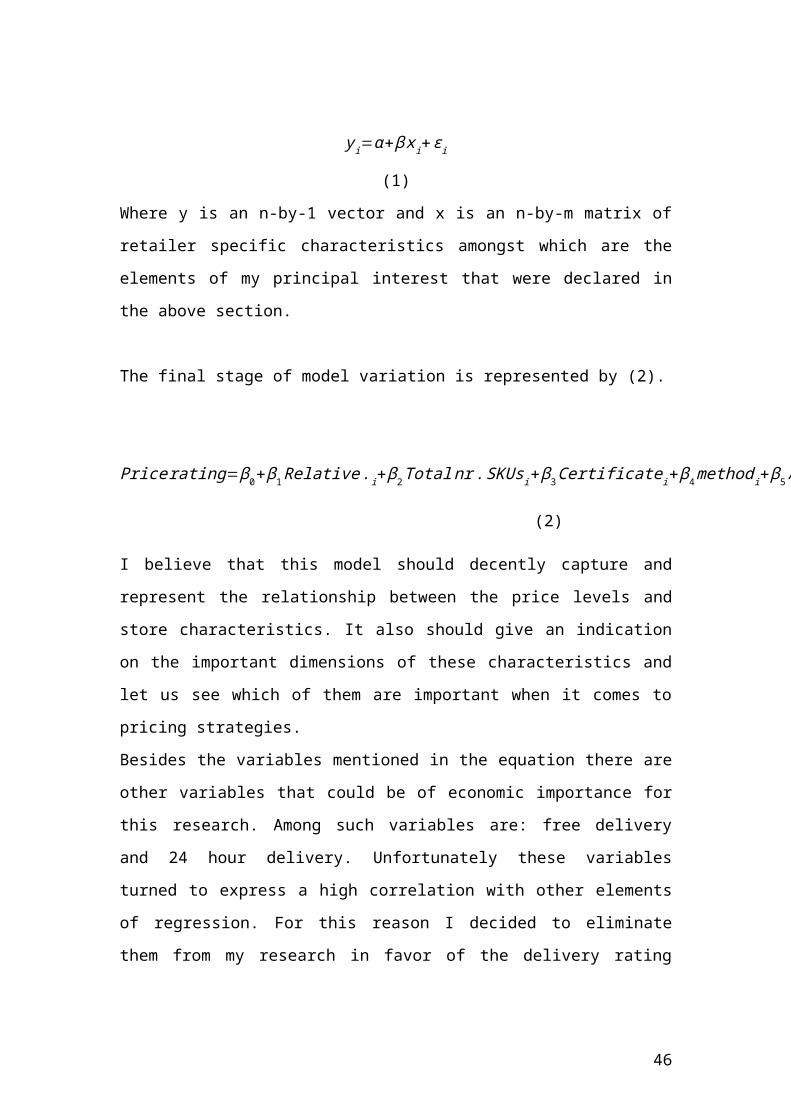
The final stage of model variation is represented by (2).
Price rating=β0+β1Relative .i+ β2Totalnr . SKUs i+β3Certificatei+β4method i+β5 Aftersales rating i+ β6 Delivery rating i+ β7 supporti+β8 presence i+β9variety i+β10High varietyi+εi
(2)
I believe that this model should decently capture and represent the relationship
between the price levels and store characteristics. It also should give an
indication on the important dimensions of these characteristics and let us see
which of them are important when it comes to pricing strategies.
Besides the variables mentioned in the equation there are other variables that
could be of economic importance for this research. Among such variables are:
free delivery and 24 hour delivery. Unfortunately these variables turned to
express a high correlation with other elements of regression. For this reason I
decided to eliminate them from my research in favor of the delivery rating
variable, which essentially should capture the effects of both free and 24 hour
delivery.
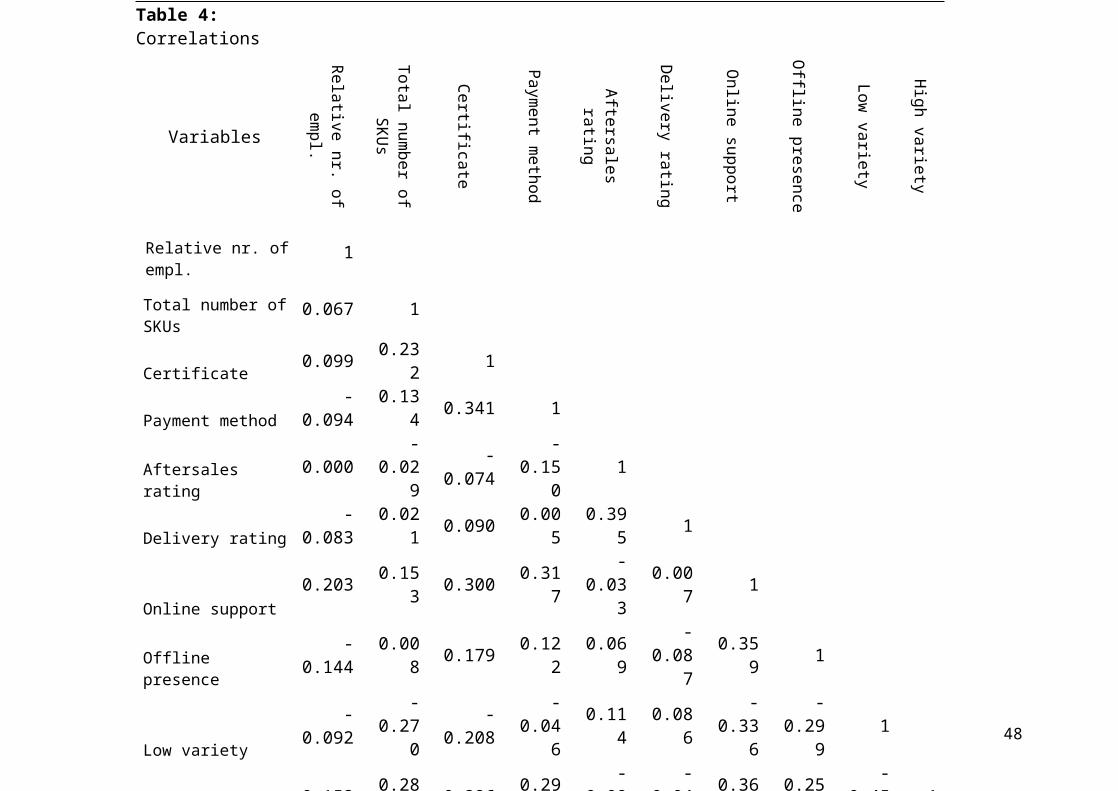
Next section presents the correlation table that depicts the correlations between
all the variables used in this model. Please see Table 4.
30
31

As can bee
seen
from the
table
Table 4: Correlations
Variables
Relative nr. of em
pl.
Total num
ber of SKU
s
Certificate
Payment m
ethod
Aftersales rating
Delivery rating
Online support
Offline presence
Low variety
High variety
Relative nr. of empl. 1
Total number of SKUs
0.067 1
Certificate 0.099 0.232 1
Payment method -0.094 0.134 0.341 1
Aftersales rating 0.000 -0.029 -0.074 -0.150 1
Delivery rating -0.083 0.021 0.090 0.005 0.395 1
Online support 0.203 0.153 0.300 0.317 -0.033 0.007 1
Offline presence -0.144 0.008 0.179 0.122 0.069 -0.087 0.359 1
Low variety -0.092 -0.270 -0.208 -0.046 0.114 0.086 -0.336 -0.299 1
High variety 0.153 0.284 0.296 0.292 -0.090 -0.048 0.365 0.256 -0.452 1
32
above, there are no coefficients with a correlation greater than 0.5 so it should not affect the results. As I will show in the model
comparison table, the signs of the coefficients remain unchanged through the whole process of variable removal and introduction.
33

5. Regression results
In this section I discuss the results obtained from the model. I analyze the
significance levels, coefficient magnitudes and the signs of the coefficients. For
each variable I will describe things just mentioned, interpret the results from an
economic standpoint of view and see whether my predictions/expectations are
supported by the empirical results.
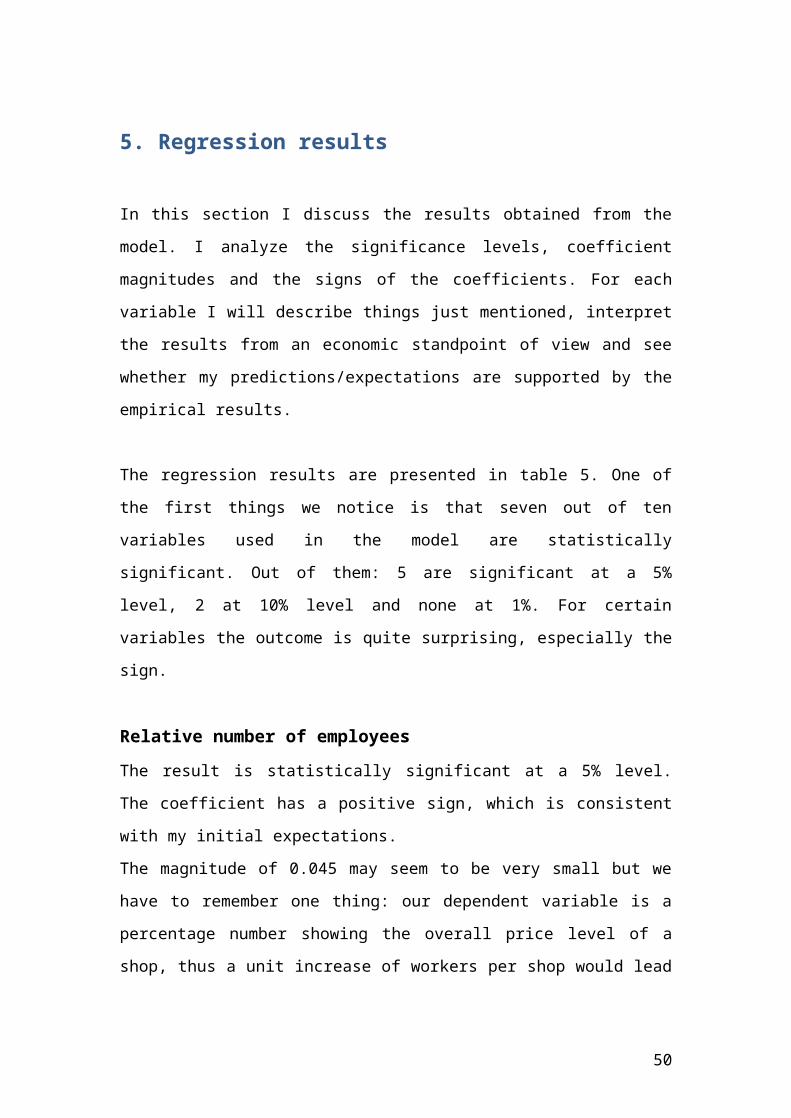
The regression results are presented in table 5. One of the first things we notice
is that seven out of ten variables used in the model are statistically significant.
Out of them: 5 are significant at a 5% level, 2 at 10% level and none at 1%. For
certain variables the outcome is quite surprising, especially the sign.
Relative number of employees
The result is statistically significant at a 5% level. The coefficient has a positive
sign, which is consistent with my initial expectations.
The magnitude of 0.045 may seem to be very small but we have to remember one
thing: our dependent variable is a percentage number showing the overall price
level of a shop, thus a unit increase of workers per shop would lead to almost
0.5% price rating increase all other things being equal.
I believe this to be an interesting finding especially in the case of e-tailers who do
not have large networks of stores around the country. Because their employee
per store ratio is small from the beginning, each additional worker increases the
ratio a lot faster than it would happen for a bigger firm with more stores.
We know that doubling the number of employees does not necessarily mean
double the effort or output either, but labor costs are generally doubled (if it is
not performance pay). Hence the conclusion: smaller e-tailers are more sensitive
to labor costs and thus have more sensitive prices.
The finding that more labor (when not exploited) leads to higher prices does not
contradict any economic theory.
34

Total number of SKU
The resulted numbers are quite astonishing in a bad sense of this word.
Coefficient magnitude is 0.000, more than that it is not statistically significant.
Thus, in my model there is no statistical nor economical evidence that total
amount of products has any influence on the store’s price levels.
This finding is unexpected in two ways: firstly on the theoretical level because
we do not see the effect of economies of scale; secondly it does not match the
finding from existing research i.e. (Baye et al., 2004).
Generally I believe the effect of the number of offered products on price should
still exist although my model does not capture it. One possible reason for that
could be in the fact that I use linear regression while the relation may be a non-
linear one. It could be quadratic or a threshold-based one.
Certificate
I have predicted a positive relation between certificate presence and price levels.
Although the coefficient is high enough to denote a relation and the sign is
positive there is no statistical significance in it.
Increasing the sample size would not produce much change in the significance of
the effect. I conclude that the presence of a certificate does not increase or
decrease store price levels all other thing being equal.
Payment method
We see that the presence of additional payment methods has a negative
relationship with the price rating. Such a sign supports the idea that extra
payment methods may be responsible for an easier online purchase procedure
and thus may lower the entry barrier for the customer. However the effect is not
statistically significant (0.334) in this model, thus we cannot conclude anything
about its actual influence on the dependent variable because there is not enough
evidence.
35

Aftersales rating
As predicted in the Data section we observe a positive effect (0.810) that is
significant both statistically (at 10% level) and economically.
However, given this relation one cannot declare that high or low rating by itself
influences store prices. It is rather the cause of the rating that is positively
affecting store prices. In other words higher prices are the effect of higher
aftersales service levels. The rating itself is just a proxy that reflects customer’s
perception of the service.
We could say that a rating increase of one star leads to a certain increase of the
price but this would not be correct because a star is something subjective,
something hard to measure in absolute terms.
Delivery rating
Given that delivery rating is another proxy for service, but unlike aftersales
rating it focuses on the product handling process, I expected to see a positive
relationship between product handling quality and store price rating. However,
this is not the situation. What we witness is a statistically significant (at 5%
level) effect with a negative sign (-1.197).
Such an unexpected result may be explained by several facts:
The technological factors: More and more firms are moving to
computerized and automated handling systems where less human time
and effort is spent on logistical matters, meaning that in terms of order
handling an additional order may produce little or no marginal cost at all.
As the number of orders increases, a computerized of fully automated
order handling system may start producing economies of scale. This way
the handling investments are cancelled out by the resulting benefits.
Online support
36
Online support is probably one biggest service cost drivers for the retailer. A
good support service requires the presence of trained and competent personnel
that is able to provide solutions for the problems that may develop during the
ordering process, usage of the product or just provide additional information
about a product or service.
I expected to see a positive relation between online support and shop price
rating. The relationship turned to be positive indeed, moreover it is significant
both statistically (0.029) and economically. The magnitude of the effect is
2.720**.
Given the economical reasoning, the obtained result is not surprising, and is
confirming existing research.
Offline presence
The difference between pure players and brick-and-click retailers has been
widely discussed in the literature, also on the price aspect of the problem.
Existing findings suggest that brick-and-click retailer’s prices are higher on
average. I didn’t expect to find any evidence suggesting the opposite.
My results are consistent with existing research and theory. The effect of online
presence on price levels is economically strong (2.659**) and statistically
significant; the relation is a positive one, just as expected.
Having an offline store or showroom increases the average price levels of the
firm by 2.659% all other things being equal.
As already mentioned in the data section, one of the several causes is the cost
involved in having an offline store. Although results may vary on depending on
the country, store type, industry etc. I expect the sign of the relationship to
always remain positive, because having multiple channels of distribution may
bring more sales but at the same time it increases the costs. Those costs are do
not diminish with the increase of the number of shops. Aside from the fixed
offline presence also brings many variable costs. Having more shops means more
expensive logistics, longer lead times, more personnel, higher difficulty of control
and lower efficiency in general.
In the near future pure player will probably continue to offer better prices than
brick-and-clicks.
37
Low variety
A low variety of available products or in other words low spread signifies shop’s
specialization in a particular product category. My expectations were to see a
negative relation between low variety and average price levels. What we see
from the results is indeed a negative relation with a magnitude of 3.078, which is
significant at 5% level. This means that a highly specialized shop, on average,
offers prices that are 3% lower than an average shop al other things being equal.
The economic reasoning behind this is that highly specialized retailers may get
better deals from their suppliers because on average they sell more of the same
brand’s products than an unspecialized retailer of comparable size does.
Depending on the situation highly specialized shops may sometimes get
favorable conditions or even exclusive rights for certain products.
High variety
For high variety I expected to see a positive relation for the reasons opposite to
those named under the low variety description. If we look at the regression
results we can see that my prediction did not materialize. We see that the
relation is negative with a coefficient of 2.582 and a significance of (0.064).
The results are quite unexpected; the negative sign implies that retailers with a
high spread of products offer prices that are 2.58 lower than in an average e-
shop.
One of the possible economic explanations for this may be that the effect of
economies of scope is playing a role here. Under the economies of scope here I
mean the usage of already existing resources and infrastructure to expand
product variety. Given that a firm started with a narrow specialization it is only
natural to expand in order to reach higher margins and thus higher profits.
Usually this happens when a highly specialized seller exhausts the possibilities or
reaches an invisible barrier that prevents him getting more profit.
When expansion starts, the infrastructure, knowledge, business relations are
already existing and working. The utilization of this existing foundation is used
for future growth, hence the economies of scope.
38
The relation between price levels and variety of products is probably not linear;
it is something with two extremes (high variety and low variety), both of which
are beneficial for the retailer.
Please see Table 5 for a more visual representation of the regression results
discussed above.
Table 5: Regression Results
Variable B Std. Error t Sig.
(Constant) 96.663 2.483 38.927 0Relative nr. of empl. 0.045** 0.018 2.448 0.016Total number of SKU 0 0 0.301 0.764Certificate 0.799 1.153 0.693 0.49Payment method -1.124 1.159 -0.97 0.334Aftersales rating 0.810* 0.486 1.667 0.098Delivery rating -1.197** 0.586 -2.041 0.044Online support 2.720** 1.229 2.213 0.029Offline presence 2.659** 1.176 2.261 0.026Low variety -3.078** 1.252 -2.458 0.016High variety -2.582* 1.379 -1.872 0.064
R 0.566R2 0.321Adj.R2 0.255
As can be seen from table 6 the model has an adjusted R2 of 0.255. I consider this
to be a decent result for such a simple model.
From the various combinations I tried, this model has the biggest R2.
39

Table 6: Model Variations
Model 1 2 3 4 5 6 7 8 9 10Firm Characteristics
Relative nr. of empl. 0.053*** 0.052*** 0.050*** 0.048** 0.048** 0.044** 0.029 0.042** 0.040** 0.045**
(.006) (.007) (.009) (.013) (.013) (.022) (.114) (.027) (.031) (.016)
Total number of SKUs 1.03E-05 6.83E-06 7.69E-06 7.74E-06 8.05E-06 4.73E-06 6.71E-06 2.65E-07 4.11E-06
(.475) (.643) (.603) (.601) (.578) (.731) (.619) (.985) (.764)
Certificate 1.217 1.581 1.606 1.964 1.228 0.812 0.632 0.799
(.304) (.209) (.203) (.115) (.305) (.491) (.588) (.490)
Payment method -1.053 -0.905 -0.863 -1.996* -1.868 -1.592 -1.124
(.385) (.460) (.471) (.093) (.107) (.167) (.334)
Aftersales rating 0.448 0.956* 0.912* 0.714 0.828* 0.81*
(.363) (.072) (.071) (.151) (.095) (.098)
Delivery rating -1.515** -1.506** -1.225 -1.192** -1.197**
(.019) (.014) (.151) (.047) (.044)
Online support 4.173*** 3.014** 2.52** 2.72**
(.001) (.016) (.044) (.029)
Offline presence 2.921** 2.404** 2.659**
(.014) (.045) (.026)
Low variety -2.321* -3.078**
(.056) (.016)
High variety -2.582*
(.064)Adj. R2 0.058 0.053 0.054 0.052 0.051 0.089 0.179 0.218 0.238 0.255
* 10% ** 5% *** 1%
40

I find enough supportive evidence both of the hypotheses proposed in this paper.
Namely: H1 that is saying that pure online stores are cheaper than brick-and-
clicks, and H2 saying that stores with better service have higher prices than
those with lower service. I also find that online support is an important
component of service and can significantly influence price levels of a particular
shop.
I find that total number of products alone is not a suitable measure of the firm’s
size. Thus in this model it shows no effect on the price level.
41

6.Managerial and economical implications
6.1 Managerial importance
The findings of this paper may be very useful to the e-tailers, this is especially
true for small e-tailers. Smaller firms are much more sensitive towards market
situation. Market context is very important to small firms because they are the
ones who can respond and mobilize quickly enough given the dynamics of
today’s business environment. By adapting quickly to the situation these small
companies can increase their profits by focusing on their main cost drivers.
In this research I have highlighted several aspects of store characteristics that
can help firms reduce their costs and thus remain competitive on the market.
Moreover I find factors that are responsible that are positively related to the
price but are an important component of the service aspect. These factors can be
used as an indicator of “readiness to pay”. Not all of the consumers are bargain
hunters; some are ready to pay more for higher quality service.
I believe these findings to be a good starting point for the creation or
modification of the selling proposition.
I also believe that this paper may be useful to new entrants to the Dutch market
of Internet retailing. Newly born entrepreneurs can use this information to gain
additional insights on price forming in this particular market. By looking at the
price drivers I mentioned in this paper, entrepreneurs will be able to see where
they can save and where they could improve to gain more customer satisfaction.
6.2 Economical and scientific contribution
Previous works have show that retailer heterogeneity is indeed one of the
components that may be responsible for variable price levels. In this paper I have
specifically focused on retailer heterogeneity characteristics. As a result I have
identified several additional factors driving the online price levels. These factors
are: variety of products, number of employees and number of offline stores and
service.
This paper may be useful for future research of price formation, especially for
retailer differentiation focused research.
42
7. Concluding discussions
There are many factors that are influencing product-pricing strategies. By this
research I try to shed additional light on the relation between store
characteristics and product price. I mainly focus on service aspects of store.
Existing research shows that store heterogeneity is an important driver that
enables retailers to manipulate their price levels.
One unique feature of research is that I use number of employees of each firm to
calculate the relative number of employees per shop. Another point of
differentiation is that I use a term variety or spread, which signifies the e-tailer’s
specialization in a particular product.
Table 7 compares expectations/predictions with actual results.
Table7: Predictions versus results
Variable Expected relationship Statistically Economic
effect
Relative nr. empl. positive positive/significant moderateTotal number SKUs negative positive/not significant smallCertificate negative/positive positive/not significant moderatePayment method negative/positive negative/ not significant considerableAftersales rating positive positive/significant moderateDelivery rating positive negative/significant considerableOnline support positive positive/significant considerableOffline presence positive positive/significant considerableLow variety negative negative/significant considerableHigh variety positive negative/significant considerable
In the obtained results I find no contradiction with existing theory and research.
The findings are consistent with the economic thought and common sense.
43

In this research I use linear regression to identify relationships between the
price levels and store characteristics. Although I get pretty decent results there is
still a lot of room for improvement.
First of all my dataset contains only 115 entries because not all of the
information was available for each shop listed on tweakers.net. As a result I my
model may not represent the entire picture in the market. It would make sense
to combine the data with other price comparison sites from the Netherlands.
This way it would be possible to get a bigger sample.
Second of all, my research is focused specifically on consumer electronics
market, which has its own specifics regarding pricing strategies.
Because I mainly concentrate on store characteristics I do not account for
product heterogeneity. Because Netherlands is a relatively small country both in
area and population terms, it is hard to find exactly the same products in a large
number of shops. Thus checking price dispersion on product level is more
difficult than doing so in the United States for example.
I use store price level ratings in my regression, which is not as precise as price
dispersion at a product level would be
It would be a great improvement to also account for time changes. Tracking the
evolution of price dispersion in time would permit to gain more insights about its
foundations. However this goes well beyond the scope of this particular paper, as
it would require a tremendous amount of time for data collection and analysis.
There are many directions in the price formation research field. All of them focus
on different aspects of the problem. Here are some examples of such focus:
product characteristics, product categories, store characteristics, market
characteristics, online, offline, brick-and click and consumer behavior.
It would be a huge leap-forward if someone would be able to get data that would
allow combining all the enumerated directions into one big research. This would
allow better explaining what is already known and maybe leading to other
breakthroughs
44

Appendix
Internet retailing
Appendix 1: Internet Retailing by Category: % Value Growth 2005-20105
% current value growth 2009/10 2005-10 CAGR 2005/10 TOTALBeauty and Personal Care 6.2 21.6 165.6Clothing and Footwear 28.1 32.8 313.6Consumer Electronics 10.4 12.2 78.0Consumer Healthcare 18.3 31.2 288.4DIY and Gardening 12.5 16.0 109.6Consumer Appliances 3.8 10.8 66.7Home Care 9.0 9.6 58.0Housewares and Home Furnishings 10.8 19.3 141.5Media Products 14.4 25.2 208.1Food and Drink 7.2 14.0 92.4Other Internet Retailing 16.6 20.7 155.7Internet Retailing 15.4 19.6 145.1
Appendix 2: Internet Retailing Forecasts by Category: % Value Growth 2010-20156
% constant value growth 2010-15 CAGR 2010/15 TOTALBeauty and Personal Care 12.4 79.6Clothing and Footwear 10.2 62.5Consumer Electronics 2.9 15.1Consumer Healthcare 13.1 84.7DIY and Gardening 10.3 63.3Consumer Appliances 5.1 28.2Home Care 6.1 34.5Housewares and Home Furnishings
5.9 33.0
Media Products 11.4 71.3Food and Drink 5.0 27.7Other Internet Retailing 17.5 123.9Internet Retailing 10.3 63.3
5 Source: Euromonitor.com6 Source: Euromonitor.com
45
Appendix 3: Internet Retailing Forecasts by Category: Value 2010-20157
EUR million 2010 2011 2012 2013 2014 2015Beauty and Personal Care 35.9 38.2 44.2 52.2 58.5 64.5Clothing and Footwear 752.0 1,030 1.096 1,151 1,190 1,221Consumer Electronics 477.6 500.4 528.7 544.1 546.9 549.8Consumer Healthcare 17.5 20.3 22.3 25.3 27.7 32.3DIY and Gardening 155.0 172.9 191.3 210.0 230.6 253.1Consumer Appliances 143.1 151.1 159.0 167.3 176.1 183.4Home Care 19.6 20.5 21.8 23.2 24.7 26.3Housewares and Home Furnishings 137.7 151.4 159.7 167.1 175.0 183.2Media Products 223.2 249.8 276.6 307.5 342.6 382.3Food and Drink 382.3 405.1 426.9 449.6 467.9 488.1Other Internet Retailing 731.4 712.8 930.3 1,153.8 1,406.3 1,637.8Internet Retailing 3,075.2 3,453.5 3,857.5 4,251.0 4,646.3 5,022.7
Appendix 4: Internet Retailing Company Shares by Value 2006-20108
% retail value rsp excl sales tax 2006 2007 2008 2009 2010bol.com BV 6.9 9.3 11.0 10.6 10.1Wehkamp BV 12.3 11.9 11.0 10.5 10.1Apple Computer Benelux BV 7.6 8.5 10.3 9.5 8.5Dexcom Holdings 7.3 7.9 6.5 5.8 5.2Neckermann BV 7.5 6.8 5.4 4.8 4.6Royal Ahold NV 6.5 6.0 5.1 4.9 4.6Coolblue BV 2.1 2.5 3.0 3.5 3.7Hema BV - - 4.0 3.7 3.7Retail Network Co BV 4.3 4.9 4.1 3.8 3.4IMpact Retail Group 2.8 2.9 2.9 2.8 2.6Office Depot International BVBA 4.3 3.9 3.2 2.9 2.6AS Watson (Health & Beauty Europe) 2.0 2.6 2.4 2.4 2.4Tchibo GmbH 6.0 6.6 5.7 4.5 2.3Dell Inc 3.3 2.9 2.5 2.2 2.0Amazon.com Inc 1.5 1.7 2.0 2.0 2.0Yves Rocher Nederland BV 1.0 1.0 1.6 1.7 1.6Free Record Shop Holding NV 1.7 1.9 1.7 1.6 1.6Blokker Nederland BV 1.5 1.5 1.4 1.5 1.5Intres BV 1.1 1.3 1.4 1.5 1.3Gsmweb.nl Nederland BV 1.4 1.4 1.3 1.3 1.2Alternate Computerversand Nederland CV
2.7 2.4 2.1 - -
Others 16.2 12.2 11.3 18.8 25.1Total 100.0 100.0 100.0 100.0 100.0
7 Source: Euromonitor.com8 Source: Euromonitor.com
46
Home shopping
Appendix 5: Homeshopping by Category: Value 2005-20109
EUR million 2005 2006 2007 2008 2009 2010Beauty and Personal Care 10.1 9.7 9.9 10.5 10.9 11.0
Clothing and Footwear 296.
4276.8 263.1 220.4 182.7 164.9
Consumer Electronics 192.
9173.7 160.3 150.5 134.0 118.4
Consumer Healthcare 0.7 0.7 0.7 0.7 0.8 0.8DIY and Gardening 17.1 16.6 16.8 16.4 15.8 15.0Consumer Appliances 56.3 52.2 48.6 45.1 38.9 35.1Home Care 6.4 6.6 6.6 6.7 6.9 7.1Housewares and Home Furnishings 18.4 17.9 17.1 15.6 14.1 12.6
Media Products 247.
5233.5 216.0 204.0 182.1 165.5
Food and Drink - - - - - -Other Homeshopping 92.7 77.8 60.5 72.1 106.6 100.5
Homeshopping 938.
4865.5 799.5 742.0 692.7 631.0
Appendix 6: Homeshopping by Category: % Value Growth 2005-201010
% current value growth 2009/10 2005-10 CAGR 2005/10 TOTALBeauty and Personal Care 1.0 1.8 9.1Clothing and Footwear -9.8 -11.1 -44.4Consumer Electronics -11.6 -9.3 -38.6Consumer Healthcare 5.2 2.5 12.9DIY and Gardening -4.5 -2.5 -11.9Consumer Appliances -9.7 -9.0 -37.7Home Care 3.7 2.2 11.7Housewares and Home Furnishings -10.6 -7.2 -31.2Media Products -9.1 -7.7 -33.1Food and Drink - - -Other Homeshopping -5.7 1.6 8.5Homeshopping -8.9 -7.6 -32.8
9 Source: Euromonitor.com10 Source: Euromonitor.com
47

Appendix 7: Price ratings
48
Appendix 7: Continued
49

Appendix 7: Continued
50
References
Baye, M. and Morgan, J. (2001) ‘Information Gatekeepers on the Internet and the Competitiveness of Homogeneous Product Markets’, The American Economic Review, 91, 454–474.
Baye, M., Morgan, J. and Scholten, P. (2004) ‘Price Dispersion in the Small and in the Large: Evidence From an Internet Price Comparison Site’, The Journal of Industrial Economics 52, 463–496.
Cazier, J., Shao, B. and Stlouis, R. (2006) ‘E-Business Differentiation Through Value-Based Trust’, Information & Management, 43, 718–727.
Chen, P.Y. (2001) ‘Brand Awareness and Price Dispersion in Electronic Markets’, Twenty-Second International Conference on Information Systems.
Chen, P.Y. and Hitt, L. M. (2003) ‘Understanding Price Dispersion in Internet-Enabled Markets’,
Eckard, E. W. (2004). ‘The ‘Law of One Price’ in 1901’, Economic Inquiry, 42 (1), 101- 110
Friberg, R., Ganslandt, M. and Sandström, M. (2001) Pricing Strategies in E- Commerce: Bricks vs. Clicks. Working Paper Series 559, Research Institute of Industrial Economics
Lee, G.-G. and Lin, H.-F. (2005) ‘Customer Perceptions of E-Service Quality in Online Shopping’, International Journal of Retail & Distribution Management, 33, 161–176.
Pan, X. and Ratchford, B. (2001) ‘Why Aren't the Prices of the Same Item the Same at Me. Com and You. Com?: Drivers of Price Dispersion Among E-Tailers’, eBusiness Research Center.
Pan, X., Ratchford, B. and Shankar, V. (2002) ‘Can Price Dispersion in Online Markets Be Explained by Differences in E-Tailer Service Quality?’, Journal of the Academy of Marketing Science
Pan, X., Ratchford, B. and Shankar, V. (2003) ‘The Evolution of Price Dispersion in Internet Retail Markets’, Advances in Applied Microeconomics, 12, 85–105.
Reibstein, D. (2002) ‘What Attracts Customers to Online Stores, and What Keeps Them Coming Back?’, Journal of the Academy of Marketing Science, 30, 465–473.
Venkatesan, R., Mehta, K. and Bapna, R. (2007) ‘Do Market Characteristics Impact the Relationship Between Retailer Characteristics and Online Prices?’, Journal of Retailing, 83, 309–324.
Venkatisan, R., Metha, K. and Bapna, R. (2006) ‘Understanding the Confluence of Retailer Characteristics, Market Characteristics and Online Pricing Strategies’, Decision Support Systems, 42, 1759–1775.