abstract - dtic · give rise to a depression in e and tg are observed to be stronger for polymers...
TRANSCRIPT


ABSTRACT
Size Dependent Mechanical Behavior of Free-Standing Glassy Polymer Thin Films
Report Title
Mechanical properties of nanoscale free-standing polymer thin films exhibit size-dependence due to surface effects. However, it has remained a challenge to associate the length scales where such differences emerge with bulk polymer properties. Here we utilize molecular dynamics simulations to uncover the dependence of elastic modulus of free-standing films on film thickness and bulk properties. Comparison of glass transition temperature (Tg) and modulus (E) indicates that Tg converges to bulk value slightly faster as film thickness increases. The free surface effects that give rise to a depression in E and Tg are observed to be stronger for polymers with weaker intermolecular interactions. Our simulations suggest that the length scale of perturbation of free surface is only about several nanometers, but the effect is large enough that only films of 100 nm or larger exhibit negligible surface effects.
2

Size-Dependent Mechanical Behavior of Free-
Standing Glassy Polymer Thin Films
Wenjie Xia† and Sinan Keten*
† Department of Civil & Environmental Engineering, Northwestern University, 2145 Sheridan
Road, Evanston, IL 60208-3109. E-mail: [email protected]
* Corresponding Author: Department. of Civil & Environmental Engineering and Department of
Mechanical Engineering, Room A133, Northwestern University, 2145 Sheridan Road, Evanston,
IL 60208-3109. Tel: 847-491-5282, E-mail: [email protected]
KEYWORDS: elastic properties, film, polymer
ABSTRACT
Mechanical properties of nanoscale free-standing polymer thin films exhibit size-dependence due
to surface effects. However, it has remained a challenge to associate the length scales where such
differences emerge with bulk polymer properties. Here we utilize molecular dynamics
simulations to uncover the dependence of elastic modulus (𝐸) of free-standing films on film
thickness and bulk properties. Comparison of glass transition temperature (𝑇!) and 𝐸 indicates
that 𝑇! converges to bulk value slightly faster as film thickness increases. The free surface effects
that give rise to a depression in 𝐸 and 𝑇! are observed to be stronger for polymers with weaker
intermolecular interactions. The most intriguing aspect of our study is the finding that despite
3

the observed decrease in modulus of film up to a thickness over 100 nm, the local stress
distribution reveals that the preserved length scale of perturbation of free surface is only about
several nanometers. (Abstract Figure: Fig. 1 )
INTRODUCTION
Ultra-thin polymer films with thickness in the range of tens of nanometers are becoming
relevant for a wide array of applications in the field of nanotechnology and bioengineering, such
as nanoelectronics 1, nanocomposites 2, coatings 3, polymeric membranes 4 and biosensors 5. For
instance, in nanoelectronics, the thermal and mechanical responses of nanopatterned polymeric
structures obtained from lithography is important in determining the stability and reliability of
these systems 6, 7. In thin supported and free-standing films, the effects of free surfaces on the
molecular structure and dynamics of polymer chains fundamentally changes the behaviors of
these systems compared to bulk, and these effects become significantly more pronounced as the
film thickness reaches below 100 nm. The free surface effects are complex and depend on many
factors such as molecular weight of polymers, thickness of the film, and polymer chemistry, but
a common observation is that the presence of surfaces in polymer thin films may result in a
notable reduction of thermo-mechanical properties by shifting the relaxation time and enhancing
the molecular mobility 8-12. Understanding fundamental mechanisms pertaining to the thermo-
mechanical properties, in particular, the glass transition temperature (𝑇!) and elastic modulus (𝐸)
of sub-100 nm polymer thin films are important for numerous technological applications of soft
nanomaterials, and are being studied through novel experimental and computational techniques
suited for the length scales of interest.
4
Previous studies have shown that intermolecular noncovalent weak interactions between
polymer chains are crucial in determining thermo-mechanical responses of amorphous polymers.
Experimental and theoretical studies have consistently shown that intermolecular forces between
polymer chains can be tailored to tune 𝑇! of bulk amorphous polymer 1, 13. Concerning the
mechanical behaviors, the investigations of energy partitioning have shown that the elastic
modulus and yield response of amorphous polymer are mainly dominated by intermolecular
noncovalent interactions (i.e. van der Waals interaction) 14, 15, and these mechanical properties
are intimately related to segmental dynamics of chains and physical aging phenomena 16-19. Low
molecular weight plasticizing and antiplasticizing additives are often used to soften or stiffen
polymer by changing their free volume and molecular packing 20, 21. Experimental investigations
and simulations have suggested that the interface and free surface effects on thermo-mechanical
behaviors of polymer films can be influenced by numerous factors associated with
intermolecular forces, such as retained solvents 22, 23, monomeric interactions 13, 24, 25 and chain-
tacticity-related density variations 26, 27.
More recent efforts have been engaged in understanding the molecular origins of effects of free
surfaces on thermo-mechanical properties of polymer films. The thickness-dependent behaviors
of glass transition temperature and elastic modulus of polymer films have been characterized via
experiments and simulations. Below 𝑇!, the elastic moduli of polystyrene (PS) and poly(methyl
methacrylate) (PMMA) films and nanostructures decrease dramatically below ~40 nm measured
by a buckling-based metrology 28. Torres et al. show that the 𝑇! and elastic moduli of sub-100
nm methacrylate polymer films both decrease with film thickness, but the decrease in modulus of
films is not correlated with the observed decrease in 𝑇! 11. A study by Declambre et al. shows
that the elastic modulus of free-standing antiplasticized PMMA nanostructure decreases below
5

bulk value when the width is below 50 nm measured by beam bending deformation 29. On the
other hand, recent experimental evidences show surface stiffening as observed in polymer thin
films in the rubbery regime above 𝑇! 30-32, in which the underlying physics of mechanical
behaviors could be fundamentally different from that below 𝑇!.
However, due to the difficulty in measuring mechanical responses of polymer free-standing
thin film with free surfaces only (no substrate) as illustrated in Figure 1 (a), current experimental
techniques of measuring elastic modulus of film inevitably introduce substrate and retained
solvents effects, which have been recently found to be crucial in determining the surface
dynamics at nanoscale 33. More importantly, how intermolecular forces between polymer chains
interplay with free surface that changes influence in 𝑇! and mechanical responses of polymer
films remains challenging to discern, and the physics of this intriguing shift is yet to be fully
explored. Nevertheless, direct comparison of polymers with different chemistry via experiments
and all-atomistic simulations remains a challenge since these parameters cannot be continuously
and independently varied. Simplified potentials in coarse-grained molecular dynamics (CGMD)
simulations of free-standing film with free surfaces provide a clear benefit in this regard in
addition to computational efficiency.
To facilitate a deeper understanding of the interplay between intermolecular forces and free
surface effects on changing the thermo-mechanical responses of polymer thin films, we employ
coarse-grained molecular dynamics simulations to investigate independent effects of these
parameters. For this purpose, we establish a CGMD approach that builds on realistic parameters
derived from all-atomistic MD simulation of PMMA. By employing this CG model as a starting
point, we carry out large-scale MD simulations to assess the free surface effects by examining
thickness-dependence behaviors of 𝑇! and modulus of free-standing thin films with two free
6

surfaces. For modulus of polymer, we focus only on the elastic region at a glassy state below 𝑇!,
where polymers are deformed significantly faster than the intrinsic relaxation time and their
mechanical properties are almost independent of temperature. The interplay between
intermolecular forces and free surface effect on film 𝑇! and modulus is evaluated by varying the
depth of the effective weak interaction potential between monomers. The interfacial and
characteristic length scales that correlate with the scales where 𝑇! and 𝐸 of thin film deviate from
the bulk are examined and compared. A bilayer composite model derived from the spatial stress
distribution is used to explain the physical origin of the size effect on film modulus.
METHODS
Coarse-grained Model Development
In order to simulate films with a characteristic dimension (i.e. thickness) reaching ~100 nm,
we first present a coarse grained (CG) modeling approach based on the output of all-atomistic
simulations of PMMA. The one bead per repeating unit mapping from the all-atomistic model to
CG model and the resultant CG free-standing film configuration are illustrated in Figure 1 (b).
The bonded interaction terms including the bond stretch and angle bending terms of the CG
model are derived to match the corresponding probability distribution functions of all-atom
model. For the intermolecular noncovalent interactions between chains (including interchain and
intrachain interactions), we employ the truncated Lennard-Jones (LJ) 12-6 potential:
12 6
( ) 4LJ cU r r Rr rσ σ
ε⎡ ⎤⎛ ⎞ ⎛ ⎞
= − <⎢ ⎥⎜ ⎟ ⎜ ⎟⎝ ⎠ ⎝ ⎠⎢ ⎥⎣ ⎦
(1)
where 𝜀 is the depth of the potential well, and 𝜎 corresponds to the radial distance where the
potential energy is zero. These two parameters are calibrated to match the experimental density
at 300 K and 𝑇! of bulk PMMA. The resultant values of 𝜎 and 𝜀 are 6.5 Å and 0.3 kcal/mol,
7

respectively, which yield a density of 1.17 g/cm3 at 300 K and a bulk 𝑇! of 388.6 K for our CG
model. The cutoff distance of the intermolecular interaction 𝑅! is chosen to be 15 Å. Detailed
description of the coarse-graining strategy and simulation protocols can be found in our previous
work 34.
Utilizing the atomistically informed CG model as the generic polymer model, we are able to
explore the effect of intermolecular noncovalent interactions between chains on the thermo-
mechanical properties (i.e. 𝑇! and elastic modulus) of film systems with the existence of free
surfaces at nanoscale. Taking the calibrated force-field parameters as a reference, we
systematically vary 𝜀 from 0.2 to 0.4 kcal/mol to generate polymer models with different
intermolecular interaction strength, while keeping 𝜎 the same and thus the density nearly
constant for all simulations. It should be noted that once 𝜀 is varied, it is no longer representative
of the original PMMA CG model. The similar two-bead type of CG models of methacrylate
polymers has been recently reported 35. Comparing with the two-bead models, the bonded
interactions in our one-bead model preserve the general backbone features of methacrylate
polymers, and the different values of 𝜀 can be a representative of different interactions resulting
from the different type of side-chain groups. The simpler single bead model with less number of
degree of freedom and atomic friction gives rise to overall softer mechanical responses than
more realistic two-bead CG models and all-atomistic models 36, so the study here is meant to be
largely comparative and qualitative.
Polymer Free-Standing Thin Film Configuration
CGMD free-standing thin film simulations are carried out using 50 to 500 chains with 100
repeat units per chain, resulting in thin films with thicknesses ranging from ~5 to ~90 nm (along
the z axis). Periodic boundary conditions of the simulation box are applied in x-y plane with
8

dimensions of 9 nm × 9 nm except for ~5 nm thick films, in which we use larger dimensions of
18 nm × 18 nm in x-y plane to improve the sampling. The film thickness is estimated as the
difference between the maximum and minimum z coordinate. In order to create two free surfaces
of the film, the box dimension along the z-axis are taken to be larger than the film thickness and
the boundary condition in that direction is nonperiodic. The initial film structures are built based
on a self-avoiding random walk algorithm and placed at the center of the simulation box along
the z-dimension. Then, the film first undergoes two annealing cycles from 550 K to 210 K and
then equilibrated at 250 K for 2 ns under the isothermal-isobaric ensemble (NPT). The time step
is chosen to be 4 fs.
Glass Transition Calculation
The calculations of glass transition temperatures of both bulk and film samples are carried out
using the method described by Tsige and Taylor 37 from the measurement of mean-squared
displacement (MSD) data of monomers in polymer chains. The MSD of polymer beads is
evaluated as:
20( ) ( ) (0)i ig t r t r= − (2)
where 𝑟!(𝑡) is the position of the 𝑖th bead at time 𝑡 and … denotes the ensemble averages. The
time-averaged values of 𝑔! from 40 ps to 2000 ps are plotted against temperature from 490 K to
190 K at an interval of 20 K, which provides a metric of segmental mobility as a function of
temperature. The MSD data in the lower temperature region and higher temperature region can
be fitted with linear slopes, and the intersection of the two slopes marks the 𝑇!.
Calculation of Elastic Modulus
9

To calculate the elastic modulus, strain-controlled uniaxial tensile deformation is simulated in
the x direction (along the plane of the film), with a constant strain (engineering strain) rate of 0.5
ns-1, while the pressure in the transverse direction (y) is controlled to be zero using the Nose-
Hoover barostat. The z dimension of the simulation box is automatically adjusted to shrink and
wrap to encompass all the beads during the simulations. The stress component in tensile
direction is calculated based on the atomic virial stress tensor 38:
τ ij = − 1V[ mα (vα )i (vα ) j −
∂U∂rαβα>β
∑α∑ (rαβ )i (rαβ ) j
rαβ]
(3)
where V is the volume of the actual polymer system instead of the simulation box, N is the total
number of CG beads or monomers, and 𝑚! and 𝑣! denote the mass and velocity of 𝛼 th
monomer, respectively. The distance between the monomer pair 𝛼 and 𝛽 is denoted by 𝑟!". 𝑈 is
the total potential energy including bond, angle and pair-wise nonbonded interactions. While the
strain rate used in our study is higher than experimental studies, it is reasonably low for MD
simulations, and the glassy modulus dependence on strain rate is relatively weaker than rubbery
modulus measurements 39. Thus, qualitatively, we don’t anticipate strong rate dependence effects
on the comparative analyses presented herein. The elastic modulus is measured as the slope from
0 to 4% strain over 10 replicas.
RESULTS AND DISCUSSION
We first characterize how 𝑇! and elastic modulus 𝐸 depend on the magnitude on the
intermolecular interaction strength (𝜀 ) for bulk polymer systems (no free surfaces). The
simulation results of bulk 𝑇! and 𝐸 are summarized in Table I. Both 𝑇! and 𝐸 systematically
increase with 𝜀. Recently, we have shown that increasing 𝜀 from 0.2 (soft) to 0.4 kcal/mol (hard)
leads to a monotonic increase in bulk 𝑇! 13, which can be ascribed to the fact that a stronger
10

intermolecular interaction leads to a greater activation energy barrier for polymer chains to
achieve cooperative segmental motion. The result of uniaxial tensile tests for glassy bulk
polymer at T = 250 K is shown in Figure 2. From the stress-strain responses, there is a distinct
difference of deformation mechanisms between different 𝜀 values. For stronger intermolecular
interaction (𝜀 = 0.4 kcal/mol), four regimes can be observed: elastic, yield, strain softening and
hardening regions. This is similar to experimental stress-strain observations on glassy polymers
39. However, for weaker intermolecular interaction (𝜀 = 0.2 kcal/mol), there is no obvious strain
softening or hardening regime. The strain softening and hardening regimes with a stronger 𝜀 can
be attributed to an increased activation energy associated with molecular arrangement and
interchain sliding after elastic deformation 18. For the elastic response, the bulk elastic modulus 𝐸
increases with 𝜀, which is consistent with previous findings, since the elastic work is primarily
stored as non-bonded internal energy 14.
In polymer thin films, regions near free surfaces characterized by an enhanced mobility and a
reduced density compared to interior bulk-like regions due to the less constraint on the surfaces
are often called interfacial layers. The thickness of the interfacial layer, or the so-called
interfacial thickness ℎ!"#, of a free-standing film is calculated on the basis of Gibbs dividing
surface (GDS) concept in thermodynamics, which can be used as an indication of free surface
effect on the mobility of polymer films. Figure 3 (a) shows the density profile along the z
position of the film. The value of ℎ!"# is calculated by the equation: ℎ!"# = (ℎ!"# − ℎ!"")/2,
where ℎ!"# is the maximum film thickness defined by the distance between the maximum and
minimum z coordinates of the film and ℎ!"" is the effective thickness between the two GDS
positions as labeled by the vertical dotted lines. Figure 3 (b) shows the result of ℎ!"# as a
function of film thickness for different 𝜀 at 250 K (below bulk 𝑇!). From the result, it can be
11

clearly observed that the polymer film with a lower value of 𝜀 has a larger ℎ!"# and thus a greater
free surface effect on chain mobility for all the film thicknesses. The obtained interfacial
thickness is about 0.5 to 1.0 nm, which is in the similar range as reported by earlier MD studies
of polymer films 13, 40, 41. For each 𝜀, the film with different thickness exhibits almost the same
value of ℎ!"#. By taking the mean value of ℎ!"# over different film thicknesses, we obtain the
average interfacial thickness for each 𝜀, which is listed in Table II.
The thickness dependence of 𝑇!!"#$ of free-standing films with different intermolecular
interactions is shown in Figure 4. The behaviors that the 𝑇!!"#$ increases with film thickness and
then converges to their bulk 𝑇! are observed for all the 𝜀 values and comparable with
experimental observations. The film exhibits a greater 𝑇!!"#$ over different thickness for a larger
value of 𝜀. However, for a polymer with a larger 𝜀, the 𝑇!!"#$ converges to their bulk value faster
with increasing thickness compared to a softer polymer with a lower 𝜀. The free surface induced
reduction in film 𝑇!, which can be attributed to the enhanced mobile layer at a surface as
discussed in earlier studies 42-45, is more significant for weaker intermolecular interaction.
Therefore, the simulation result suggests that the free surface effect on the depression of film 𝑇!
is stronger for weaker intermolecular interaction.
To further quantify film thickness effects on 𝑇! scaling and its relation to intermolecular
interactions as shown in Figure 4, we employ the empirical fitting formula introduced by Kim et
al. 46 to describe 𝑇!!"#$:
( )1 ( / )
bulkgfilm
g T
TT h
hδ=
+(4)
12

where ℎ is the film thickness, 𝑇!!"#$ is obtained from the bulk simulations (Table II), and 𝛿! is
called the characteristic thickness that determines the saturation rate of 𝑇!!"#$ growth. The
dashed lines in the plot represent the best fit of Eq. 4 to the data, and the obtained result of 𝛿! is
summarized in Table II. By employing this simple empirical form that involves only one fitting
parameter, we are able to more quantitatively assess how the relative free surface effects on the
film change with different intermolecular forces. From Table II, it can be observed that the value
of 𝛿! depends on the intermolecular interaction 𝜀 and it decreases with increasing 𝜀, which is
qualitatively consistent with ℎ!"# obtained from thermodynamic analysis of the film, even though
the value of ℎ!"# is smaller than 𝛿! for each 𝜀. This result indicates that the thermodynamic
analysis of free surface (GDS) can be well correlated with the thickness dependence of film glass
transition behavior, and suggests that both ℎ!"# and 𝛿!relate to the depth of the free surface layer
with enhanced mobility for the systems studied herein.
Next, we measure the elastic modulus of free-standing films 𝐸!"#$ with different 𝜀, as well as
different thickness values. Figure 5 (a) shows the snapshots of MD simulations during the tensile
tests of the free-standing film. The thickness dependence of the modulus of the films 𝐸!"#$ at
250 K is shown in Figure 5 (b). Similar to the glass transition behaviors of the films, the free
surface induced decrease in 𝐸!"#$ compared to the bulk value becomes more pronounced as the
thickness decreases.
It appears from our results that both 𝐸!"#$ and 𝑇!!"#$ are influenced by the presence of the
free-surface effects in a free-standing thin films. This finding leads to the following question that
we seek to answer here: does the characteristic length scale at which the deviation of 𝐸!"#$
emerges from the bulk value correlates to that for the glass transition temperature?
13

As a first attempt to elucidate this issue, here we directly compare the free surface effects on
the modulus and 𝑇! of free-standing thin films by employing the functional form of Eq. 4 for
both 𝑇!!"#$ and 𝐸!"#$. Specifically, we describe the thickness-dependence of film modulus as:
(5)
where 𝛿! is the characteristic thickness obtained from the modulus measurement. The best fit of
Eq. 5 is denoted by the dotted lines in Figure 5 (b).
In essence, 𝛿! and 𝛿! can be considered as the comparable figures of merit that quantify the
dependence of elastic modulus and glass-transition temperature on film thickness, which is
directly related to length scale where film properties deviate from bulk values. The simulated
values of 𝛿! as a function of intermolecular interaction strength are listed in Table II. The value
of 𝛿! increases from 4 to 10 nm as 𝜀 decreases from 0.4 to 0.2 kcal/mol. This is reminiscent of
the observation that the free surface effect on 𝑇! is greater for lower 𝜀. The values of 𝛿! are
greater than those values of 𝛿!for the same 𝜀, which indicates that the convergence of the
modulus to the bulk value with an increase in the film thickness occurs more slowly compared
with 𝑇!!"#$ as shown in Figure 5 (c).
Our observations over a broad parameter range hints towards a general applicability of some of
the concepts arising from previous experimental studies. A study by Torres et al. 11 has shown
that polymethacrylate films exhibit a much larger length scale for observed changes in the
modulus at room temperature in comparison to their apparent 𝑇!. Forrest et al. 47 also showed
that the high-frequency mechanical properties of free-standing PS film measured by Brillouin
light scattering (BLS) are not correlated with the film 𝑇! as film thickness is varied. Wang and
Mckenna 31 report that the significant 𝑇! reduction for PS when the film thickness is less than 20
( )1 ( / )
bulkfilm
E
EE hhδ
=+
14

nm using the liquid dewetting method. Additionally, earlier studies by McKenna’s group and
others 32, 48, 49 have shown that the observed changes in rheological properties of polymer films
with varying film thicknesses could not be well correlated with the 𝑇! measurement.
To further interpret our results and quantify the length scale of perturbation of free surface, the
information of distributions of the local stress and relaxation associated with segmental mobility
of polymer chains within the film can provide insight into the nature of the surface effect. Figure
6 (a) shows the plot of both spatial distribution of local stress and segmental relaxation time as a
function of film position 𝑧. The local stress 𝜏(𝑧) = !! [𝜏!!(𝑧)+ 𝜏!!(𝑧)] is measured from the
center to the free surface of the film intermediately after applying a biaxial step strain of 10% in
x and y directions for 𝜀 = 0.2 kcal/mol. It can be clearly seen that the unrelaxed local stress is
zero at the free surface boundary, and increases more or less linearly with the depth into the film,
as labeled by the solid slope in the plot. At ~7 nm away from the free surface, the local stress
saturates to the value in the interior region, which is indicated by the horizontal dashed line.
Since at a constant strain, the stress developed will be related to the local modulus of the film,
this analysis reveals that the free surface effect that gives rise to a linear gradient in the modulus
that near surfaces can penetrate several nanometers into the film.
The local relaxation time 𝜏! plotted in Figure 6 (a) can be defined as the time needed by the
mean-squared displacement of CG beads within the local region to reach the bead size 𝜎 = 6.5 Å:
0 0( , )g t zτ σ= = (6)
Compared to the stress distribution, it can be observed that the length scale of the relaxation
gradient within the surface region is slightly shorter than that of the stress gradient. Considering
the fact that the film elastic modulus converges to the bulk value at a larger film thickness
compared to 𝑇!, this finding may suggest that length scales of film 𝑇! and modulus do not have
15

to be exactly the same because the length scales of the gradient of the local stress and mobility in
the surface region can be different. It should be noted that it is very challenging to accurately
predict the spatial 𝑇! within very small region less than ~1 nm using the current MSD approach.
This is mainly because the segmental mobility of polymer chains can be very high and the
monomers can diffuse out of the spatial region where they initially stay into other layers at a
temperature close or above 𝑇!. However, the local mobility via the measurement of local MSD
should be related to 𝑇! , since both properties are measured based on the information of
segmental dynamics in our study.
On the basis of the local stress distribution across the film, we employ a composite bilayer
model as illustrated in Figure 6 (b) to explain the thickness dependence of 𝐸!"#$. The film with a
total thickness of ℎ can be considered as a composite with two softer surface layers with a
thickness of ℎ!"#$and one stiffer bulk-like interior region based on the spatial stress distribution.
The shape of the profile in spatial stress is similar to that in density, but the values of ℎ!"#$ is
larger than the interfacial thickness ℎ!"# determined from GDS. Based on the observation that
ℎ!"# is nearly independent of film thickness, one can assume that this linear gradient holds for
different film thickness. Following this, the surface layer has an average modulus of 𝐸!"#$ =
𝐸!"#$/2. As the distance from the free surface increases beyond the linear gradient region, the
free surface effect vanishes, and the modulus can be considered to be equal to 𝐸!"#$. If the film
thickness ℎ is less than 2ℎ!"#$, this means that the effects of the two free surfaces are pervasive
throughout the film and there is no interior bulk-like region. This approach is qualitatively
similar to the concept of the glassy bridge reinforced model 50-52 that is introduced to explain the
mechanical reinforcement of nanofilled elastomers. Then, 𝐸!"#$ becomes a linear function of ℎ
and is directly equal to 𝐸!"#$. Therefore, the 𝐸!"#$ can be obtained based on the rule of mixtures:
16

(1 ) 2
24
surfbulk surf
filmbulk
surfsurf
hE h hhE
E h h hh
⎧− ≥⎪⎪
= ⎨⎪ <⎪⎩
(7)
The prediction of Eq. 7 is represented by the solid curves in Figure 5 (b). For thinner films
with thicknesses below ~10 nm, the prediction slightly underestimates the simulation results,
which can be attributed to the less accuracy in the assumption of linear modulus gradient in the
surface region when the film thickness is less or comparable to 2ℎ!"#$. However, without any
input fitting parameters, the behavior of the thickness dependence of 𝐸!"#$ is well captured by
the bilayer composite model. The values of ℎ!"#$ determined from the local stress distribution
increase with decreasing 𝜀 (Table II), which is consistent with our previous empirical scaling
analysis using Eq. 5. Even though the values of ℎ!"#$ arising from the stress perturbation of free
surface are only in the range of 4 to 7 nm for different 𝜀 studied herein, the resultant change in
modulus can be observed in a film with a thickness up to around 100 nm that is significantly
larger compared to ℎ!"#$. These values are also comparable with experimental observations. In
the previous experimental study 11, the thickness of the free-surface layer for PMMA films on
PDMS is reported to be about 3.5 nm. Our simulation prediction of ℎ!"#$ for 𝜀 = 0.4 kcal/mol is
quite close to their value. In a recent study by Brinson et al. 53, they show that the interphase in
the small local region near the substrate with a higher local modulus results in an altered elastic
modulus of film up to hundreds of nanometers, which provides a support to our observation. In
the simulations by Yoshimoto et al. 54, free-standing polymer film exhibits local softening
regions with lower storage modulus at two free surfaces via the measurement of local dynamic
mechanical properties, and the spatial modulus exhibits an nearly linear gradient in the surface
region, which is very similar to what we observe herein. Therefore, our finding physically
17

explains why the 𝐸!"#$ approaches to the bulk value as the film thickness increases by
employing the bilayer composite model, and highlights the importance in determining the length
scale of interphase region arising from free surfaces in polymer films.
CONCLUSION
In this study, we provide a comprehensive CGMD study that quantifies how the glass-transition
temperature and elastic modulus at glassy state of free-standing polymer thin films depend on
intermolecular interactions and film thickness. Both bulk and film systems exhibit a greater value
of 𝑇! and modulus with similar backbone structure but stronger intermolecular interaction.
However, the free surface has a stronger effect on 𝑇! and modulus for the film with a weaker
intermolecular interaction at nanoscale. By comparing the results of 𝑇! and modulus of the film,
we find that the convergence of the modulus to the bulk value with an increase in the film
thickness occurs more slowly compared with 𝑇! . This longer-range free surface effect on
modulus than 𝑇! may be further supported by the observation of a greater length scale of local
stress distribution in the surface region than that of local relaxation time. The observed decrease
in modulus of film exists up to the thickness over ~100 nm. However, the measurement of local
stress distribution induced by a step strain deformation reveals that there exists a soft region with
a length scale on the order of several nanometers, which is much smaller than the critical film
thickness where the film modulus converges to bulk value. The thickness dependence of film
modulus is well captured by employing the concept of bilayer composite model, which
physically explains why the modulus increases with film thickness. Our finding establishes a
comprehensive description of free-standing film elastic properties, providing an analytical
18

description that highlights the importance in determining the length scale of interphase region
arising from free surfaces in polymer thin films.
19

Tables
TABLE I. Comparison of glass-transition temperature (𝑇!) and elastic modulus (E) of bulk
polymer at a glassy state (T = 250 K) for different intermolecular interaction strength (𝜀).
𝜺 (kcal/mol) 𝑻𝒈 (K) E (MPa)
0.2 321.5 (±18.7) 139.2 (±26.3) 0.3 388.6 (±10.1) 288.5 (±35.5) 0.4 411.1 (±21.7) 411.0 (±44.3)
TABLE II. Summary of different resultant surface related properties that are used to quantify
the free surface effects and their relevant length scales as described in the text for different
intermolecular interaction strength (𝜀).
𝜺 (kcal/mol) 𝒉𝒊𝒏𝒕 (Å) 𝜹𝑻 (nm) 𝜹𝑬 (nm) 𝒉𝒔𝒖𝒓𝒇 (nm) 0.2 8.6 3.2 10.3 7.0 0.3 6.9 2.1 6.6 5.0 0.4 5.7 1.0 4.2 4.0
20
Figures and Captions
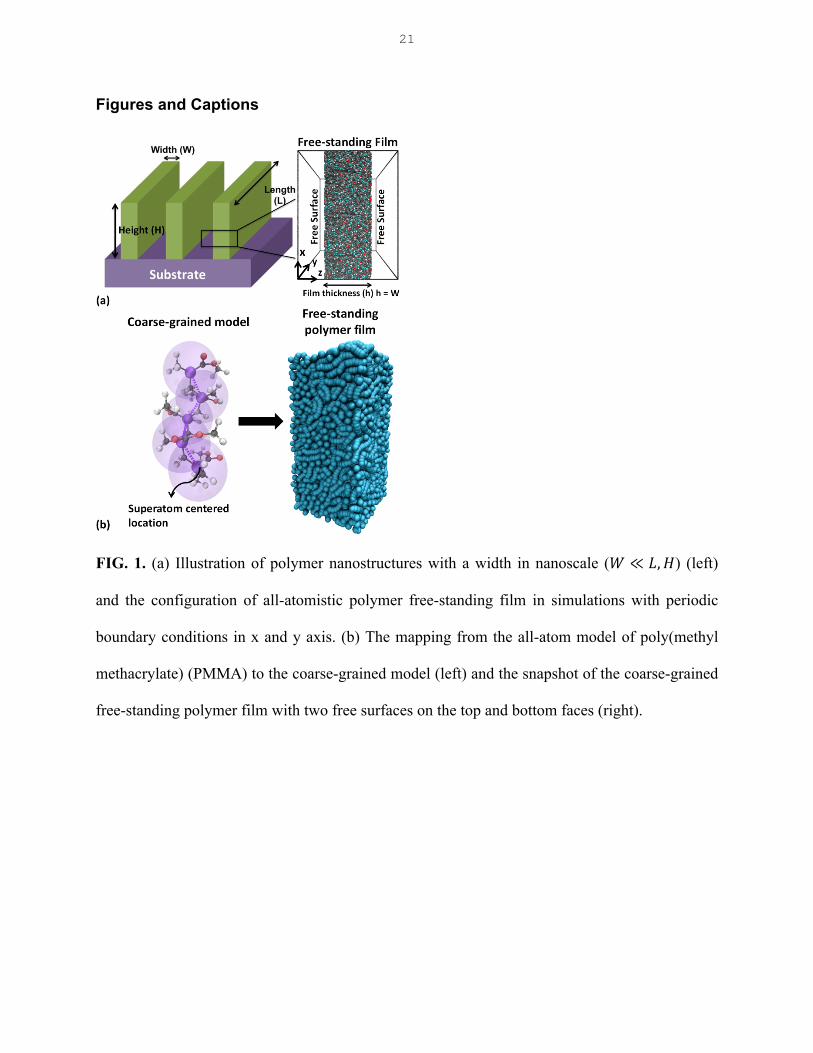
FIG. 1. (a) Illustration of polymer nanostructures with a width in nanoscale (𝑊 ≪ 𝐿,𝐻) (left)
and the configuration of all-atomistic polymer free-standing film in simulations with periodic
boundary conditions in x and y axis. (b) The mapping from the all-atom model of poly(methyl
methacrylate) (PMMA) to the coarse-grained model (left) and the snapshot of the coarse-grained
free-standing polymer film with two free surfaces on the top and bottom faces (right).
21

FIG. 2. Stress-strain response for bulk polymers with different intermolecular interactions (𝜀 =
0.2, 0.3 and 0.4 kcal/mol) under uniaxial tension at 250 K. The elastic modulus is determined by
fitting the data with the slope from 0 to 4% strain over 10 replicates.
22

FIG. 3. (a) The density profile along the height of free-standing thin film (z) for 𝜀 = 0.3 kcal/mol
at 250 K. (b) Interfacial thickness of mobile free surface layer ℎ!"# as a function of film
thickness. The dashed lines indicate the mean value of ℎ!"# over different film thicknesses.
23

FIG. 4. The thickness dependence of the glass transition temperatures of free-standing thin film
𝑇!!"#$ for different 𝜀. The solid line is calculated as the best fit of Eq. 4, which results in the fit
parameter of the characteristic thickness 𝛿! for 𝑇!!"#$.
24


FIG. 5. (a) MD simulation snapshots during the tensile deformation of the free-standing film
with a thickness of 18 nm. The arrows indicate the direction of deformation of the film. (b) The
elastic modulus of free-standing film 𝐸!"#$ as a function of film thickness for different 𝜀. The
dotted line is the fit of empirical scaling formula in Eq. 5. The solid line is prediction of Eq. 7
derived from the bilayer composite model. (c) Comparison of the empirical scaling results for the
normalized 𝑇! (𝑇!!"#$/𝑇!!"#$ ) and 𝐸 𝐸!"#$/𝐸!"#$ as a function of film thickness. (Inset)
Comparison of normalized 𝐸 for different 𝜀.
FIG. 6. (a) Spatial distributions of the stress and relaxation time across the film with a thickness
of ~78 nm from the center to the free surface (𝜀 = 0.2 kcal/mol). The local stress 𝜏 = !!
(𝜏!! + 𝜏!!) is measured in a biaxial deformation with a step strain of 10% in x and y directions.
The local relaxation time is determined based on Eq. 6. The solid slope and dashed vertical lines
correspond to the linear gradient of the stress within the surface layer and the average stress and
relaxation time in the interior region of the film, respectively. The thickness of the surface layer
ℎ!"#$ is defined as the thickness of the linear slope region of the stress at the free surface labeled
by the colored shadow in the plot. (b) The schematic of the bilayer composite model that consists
26

of two soft surface layers with a thickness of ℎ!"#$ and an interior bulk-like layer derived from
the local stress distribution.
ACKNOWLEDGMENTS
The authors acknowledge funding by the Army Research Office and Department of Civil &
Environmental Engineering and Department of Mechanical Engineering at Northwestern
University. A supercomputing grant from Quest HPC System at Northwestern University is
acknowledged.
27
References
1. H. Ito: Chemical Amplification Resists for Microlithography, in Microlithography ·∙ Molecular
Imprinting, (Springer, Heidelberg, Germany, 2005), pp. 37.
2. P.M. Ajayan, L.S. Schadler and P.V. Braun: Nanocomposite science and technology (Wiley, New
York, USA, 2006).
3. P. Bertrand, A. Jonas, A. Laschewsky and R. Legras: Ultrathin polymer coatings by complexation
of polyelectrolytes at interfaces: suitable materials, structure and properties. Macromol. Rapid
Comm. 21(7), 319 (2000).
4. B.W. Rowe, B.D. Freeman and D.R. Paul: Physical aging of ultrathin glassy polymer films tracked
by gas permeability. Polymer. 50(23), 5565 (2009).
5. J.R. Chen, Y.Q. Miao, N.Y. He, X.H. Wu and S.J. Li: Nanotechnology and biosensors. Biotechnol.
Adv. 22(7), 505 (2004).
6. K. Yoshimoto, M.P. Stoykovich, H.B. Cao, J.J. de Pablo, P.F. Nealey and W.J. Drugan: A two-‐
dimensional model of the deformation of photoresist structures using elastoplastic polymer
properties. J. of Appl. Phys. 96(4), 1857 (2004).
7. A. Sharma and G. Reiter: Instability of thin polymer films on coated substrates: Rupture,
dewetting, and drop formation. J. Colloid Interface Sci. 178(2), 383 (1996).
8. C.B. Roth and J.R. Dutcher: Glass transition and chain mobility in thin polymer films. J.
Electroanal. Chem. 584(1), 13 (2005).
9. R.D. Priestley, C.J. Ellison, L.J. Broadbelt and J.M. Torkelson: Structural relaxation of polymer
glasses at surfaces, interfaces and in between. Science. 309(5733), 456 (2005).
10. J.A. Forrest and J. Mattsson: Reductions of the glass transition temperature in thin polymer films:
probing the length scale of cooperative dynamics. Phys. Rev. E. 61, R53 (2000).
28
11. J.M. Torres, C.M. Stafford and B.D. Vogt: Elastic Modulus of Amorphous Polymer Thin Films:
Relationship to the Glass Transition Temperature. ACS Nano. 3(9), 2677 (2009).
12. P.Z. Hanakata, J.F. Douglas and F.W. Starr: Interfacial mobility scale determines the scale of
collective motion and relaxation rate in polymer films. Nat. Commun. 5, 4163 (2014).
13. W. Xia and S. Keten: Coupled Effects of Substrate Adhesion and Intermolecular Forces on
Polymer Thin Film Glass-‐Transition Behavior. Langmuir. 29(41), 12730 (2013).
14. D. Hossain, M.A. Tschopp, D.K. Ward, J.L. Bouvard, P. Wang and M.F. Horstemeyer: Molecular
dynamics simulations of deformation mechanisms of amorphous polyethylene. Polymer. 51(25),
6071 (2010).
15. J. Li, T. Mulder, B. Vorselaars, A.V. Lyulin and M.A.J. Michels: Monte Carlo Simulation of Uniaxial
Tension of an Amorphous Polyethylene-‐like Polymer Glass.Macromolecules. 39(22), 7774 (2006).
16. A.V. Lyulin, N.K. Balabaev, M.A. Mazo and M.A.J. Michels: Molecular Dynamics Simulation of
Uniaxial Deformation of Glassy Amorphous Atactic Polystyrene. Macromolecules. 37(23), 8785
(2004).
17. L.A.G. Gray and C.B. Roth: Stability of polymer glasses vitrified under stress. Soft Matter. 10(10),
1572 (2014).
18. R. Jörg: Fracture in glassy polymers: a molecular modeling perspective. J. Phys.: Condens. Matter.
21(46), 463101 (2009).
19. D. Hudzinskyy, M.A.J. Michels and A.V. Lyulin: Mechanical properties and local mobility of
atactic-‐polystyrene films under constant-‐shear deformation. J. of Chem. Phys. 137(12), (2012).
20. R.F. Landel and L.E. Nielsen: Mechanical properties of polymers and composites, 2nd ed. (CRC
Press, New York, USA, 1993).
21. R.A. Riggleman, J.F. Douglas and J.J. de Pablo: Antiplasticization and the elastic properties of
glass-‐forming polymer liquids. Soft Matter. 6(2), 292 (2010).
29

22. S. Kim, M.K. Mundra, C.B. Roth and J.M. Torkelson: Suppression of the Tg-‐Nanoconfinement
Effect in Thin Poly(vinyl acetate) Films by Sorbed Water.Macromolecules. 43(11), 5158 (2010).
23. J.M. Torres, C.M. Stafford and B.D. Vogt: Manipulation of the Elastic Modulus of Polymers at the
Nanoscale: Influence of UV−Ozone Cross-‐Linking and Plasticizer. ACS Nano. 4(9), 5357 (2010).
24. C.J. Ellison, M.K. Mundra and J.M. Torkelson: Impacts of Polystyrene Molecular Weight and
Modification to the Repeat Unit Structure on the Glass Transition−Nanoconfinement Effect and
the Cooperativity Length Scale.Macromolecules. 38(5), 1767 (2005).
25. W. Xia, D.D. Hsu and S. Keten: Dependence of Polymer Thin Film Adhesion Energy on Cohesive
Interactions between Chains.Macromolecules. (2014).
26. Y. Grohens, M. Brogly, C. Labbe, M.-‐O. David and J. Schultz: Glass Transition of Stereoregular
Poly(methyl methacrylate) at Interfaces. Langmuir. 14(11), 2929 (1998).
27. Y. Grohens, L. Hamon, G. Reiter, A. Soldera and Y. Holl: Some relevant parameters affecting the
glass transition of supported ultra-‐thin polymer films. Eur. Phys. J. E. 8(2), 217 (2002).
28. C.M. Stafford, B.D. Vogt, C. Harrison, D. Julthongpiput and R. Huang: Elastic Moduli of Ultrathin
Amorphous Polymer Films.Macromolecules. 39(15), 5095 (2006).
29. S.P. Delcambre, R.A. Riggleman, J.J. de Pablo and P.F. Nealey: Mechanical properties of
antiplasticized polymer nanostructures. Soft Matter. 6(11), 2475 (2010).
30. P.A. O'Connell and G.B. McKenna: Dramatic stiffening of ultrathin polymer films in the rubbery
regime. Eur. Phys. J. E. 20(2), 143 (2006).
31. J. Wang and G.B. McKenna: Viscoelastic and Glass Transition Properties of Ultrathin Polystyrene
Films by Dewetting from Liquid Glycerol.Macromolecules. 46(6), 2485 (2013).
31. P.A. O'Connell and G.B. McKenna: Rheological Measurements of the Thermoviscoelastic
Response of Ultrathin Polymer Films. Science. 307(5716), 1760 (2005).
30
32. C.M. Evans, S. Narayanan, Z. Jiang and J.M. Torkelson: Modulus, Confinement, and Temperature
Effects on Surface Capillary Wave Dynamics in Bilayer Polymer Films Near the Glass Transition.
Phys. Rev. Lett. 109(3), 038302 (2012).
33. W. Xia, S. Mishra and S. Keten: Substrate vs. free surface: Competing effects on the glass
transition of polymer thin films. Polymer. 54(21), 5942 (2013).
34. D.D. Hsu, W. Xia, S.G. Arturo and S. Keten: Systematic Method for Thermomechanically
Consistent Coarse-‐Graining: A Universal Model for Methacrylate-‐Based Polymers. J. Chem.
Theory Comput. 10(6), 2514 (2014).
35. T.W. Rosch, J.K. Brennan, S. Izvekov and J.W. Andzelm: Exploring the ability of a multiscale
coarse-‐grained potential to describe the stress-‐strain response of glassy polystyrene. Phys. Rev.
E. 87(4), 042606 (2013).
37. M. Tsige and P.L. Taylor: Simulation study of the glass transition temperature in poly(methyl
methacrylate). Phys. Rev. E. 65(2), 021805 (2002).
38. M.P. Allen and D.J. Tildesley: Computer simulation of liquids (Oxford university press, New York,
USA, 1989).
39. A.D. Mulliken and M.C. Boyce: Mechanics of the rate-‐dependent elastic–plastic deformation of
glassy polymers from low to high strain rates. Int. J. Solids Struct. 43(5), 1331 (2006).
40. C. Li and A. Strachan: Effect of Thickness on the Thermo-‐Mechanical Response of Free-‐Standing
Thermoset Nanofilms from Molecular Dynamics.Macromolecules. 44(23), 9448 (2011).
41. W.M. Huang, B. Yang, L. An, C. Li and Y.S. Chan: Water-‐driven programmable polyurethane
shape memory polymer: Demonstration and mechanism. Appl. Phys. Lett. 86(11), (2005).
42. J.S. Sharp, J.H. Teichroeb and J.A. Forrest: The properties of free polymer surfaces and their
influence on the glass transition temperature of thin polystyrene films. Eur. Phys. J. E. 15(4), 473
(2004).
31

43. J.S. Sharp and J.A. Forrest: Free surfaces cause reductions in the glass transition temperature of
thin polystyrene films. Phys. Rev. Lett. 91(23), 235701 (2003).
44. J. Mattsson, J.A. Forrest and L. Borjesson: Quantifying glass transition behavior in ultrathin free-‐
standing polymer films. Phys. Rev. E. 62(4), 5187 (2000).
45. J.L. Keddie, R.A.L. Jones and R.A. Cory: Size-‐Dependent Depression of the Glass-‐Transition
Temperature in Polymer-‐Films. Europhys. Lett. 27(1), 59 (1994).
46. J.H. Kim, J. Jang and W.-‐C. Zin: Estimation of the Thickness Dependence of the Glass Transition
Temperature in Various Thin Polymer Films. Langmuir. 16(9), 4064 (2000).
47. J.A. Forrest, K. Dalnoki-‐Veress and J.R. Dutcher: Brillouin light scattering studies of the
mechanical properties of thin freely standing polystyrene films. Phys. Rev. E. 58(5), 6109 (1998).
48. H. Bodiguel and C. Fretigny: Reduced Viscosity in Thin Polymer Films. Phys. Rev. Lett. 97(26),
266105 (2006).
49. S.A. Hutcheson and G.B. McKenna: Nanosphere Embedding into Polymer Surfaces: A Viscoelastic
Contact Mechanics Analysis. Phys. Rev. Lett. 94(7), 076103 (2005).
50. S. Merabia, P. Sotta and D.R. Long: A Microscopic Model for the Reinforcement and the
Nonlinear Behavior of Filled Elastomers and Thermoplastic Elastomers (Payne and Mullins
Effects).Macromolecules. 41(21), 8252 (2008).
51. D. Long and P. Sotta: Nonlinear and Plastic Behavior of Soft Thermoplastic and Filled Elastomers
Studied by Dissipative Particle Dynamics.Macromolecules. 39(18), 6282 (2006).
52. A. Papon, S. Merabia, L. Guy, F. Lequeux, H. Montes, P. Sotta and D.R. Long: Unique Nonlinear
Behavior of Nano-‐Filled Elastomers: From the Onset of Strain Softening to Large Amplitude
Shear Deformations.Macromolecules. 45(6), 2891 (2012).
32
51. S. Watcharotone, C.D. Wood, R. Friedrich, X. Chen, R. Qiao, K. Putz and L.C. Brinson: Interfacial
and Substrate Effects on Local Elastic Properties of Polymers Using Coupled Experiments and
Modeling of Nanoindentation. Adv. Eng. Mater. 13(5), 400 (2011).
52. K. Yoshimoto, T.S. Jain, P.F. Nealey and J.J. de Pablo: Local dynamic mechanical properties in
model free-‐standing polymer thin films. J. Chem. Phys. 122(14), 144712 (2005).
33