abstract - cdr.lib.unc.edu
TRANSCRIPT

ABSTRACT
The use oftobacco has been an important public health concern within the past several
decades and is still expected to be problematic well into the future. Recently, cigarette smoke
has been associated with a decreased immune response to the influenza vaccine; however, there
is limited data regarding previous smokers and how the immune system functions following the
cessation of smoking. The focus of this study was to determine how the antibody response to the
H1N1pdm09-like strain within the influenza vaccine varied among current smokers. previous
smokers, and nonsmokers as well as between lean and obese individuals within each group. Pre
and post-vaccination serum samples from 60 study subjects from the 2016-2017 influenza season
were analyzed via hemagglutination inhibition assays (HAl) to determine the antibody titers in
response to the H 1 N 1 pdm09-like strain in the influenza vaccine. There was a general trend for
the lean subjects to have higher HAl titers than the obese subjects; however, this trend was
insignificant. Additionally, it was found that the HAl titer differences between current smokers,
previous smokers, and nonsmokers were insignificant. The percent sero-protected (the
percentage of individuals with an HAl titer of 40 or greater) and the titer fold change (a measure
ofthe antibody level change between pre-vaccination and post-vaccination) were both found to
be insignificant between all six groups. Several limitations ofthis study such as a small sample
size may have led to insignificant results; however, although this study did not produce
significant results, this does not mean that smoking does not have an effect on antibody levels.
More studies are needed to analyze this relationship.
2

INTRODUCTION
Background/History
Tobacco has played a significant role in human life for thousands of years. Beginning
roughly 2000 years ago, tobacco was first utilized for ceremonial purposes; however, it was not
until the 1700s that smoking became more common due to the growth of the tobacco industry. 1
Slightly over 200 years had passed before the first links of smoking and lung cancer were
observed in the 1920s. 1 Several decades later, published medical reports certified that tobacco
use could directly cause a number of serious illnesses and worsen others. Currently, patterns
predict that 5 million tobacco related deaths will result each year worldwide and is expected to
rise to 10 million tobacco related deaths by 2030. 1 As seen in these statistics, tobacco has
devastating effects on human health; therefore, many government and nonprofit programs have
focused on preventing cigarette smoking. With this approach, however, one large group is left
out: previous smokers. Only recently, research is beginning to focus on previous smokers. Is it
possible for previous smokers' health to improve to that of a nonsmoker? If so, how long until
health returns? In this study, the focus is on the immune system: if and when it recovers from
smoking. Knowing this information is critical to improving the overall health of previous
smokers.
Elements of cigarette smoke may have the ability to suppress immune function to both
innate and adaptive immunity.2 Cigarette smoke can cause an increase in the number of
macrophages in the lungs, however, with decreased function of phagocytosis. 2 T cells exposed
to cigarette smoke have decreased ability to proliferate, possibly due to increased oxidative stress
from the smoke.3 With decreased T cell proliferation, the nymber ofT cells fighting a particular
infection, including helper T cells, may be lower. Since helper T cells function to stimulate B
3

cells to produce and secrete antibodies, a lower number of helper T cells can potentially lead to a
decreased antibody production from B cells.3
Study Aims
The goal of this study is to determine how antibody levels for both lean and obese
individuals in response to the H1Nlpdm09like virus in the influenza vaccine vary among three
groups: current smokers, previous smokers, and nonsmokers. My hypothesis is that current
smokers will have the lowest antibody levels, followed by previous smokers, and then by
nonsmokers with the highest antibody levels, and that the obese individuals within these three
groups will have lower antibody levels than the lean individuals.
METHODS
Study Population
The Beck Lab, a clinical biochemistry research lab, at UNC Gillings School of Global
Public Health leads an prospective clinical study investigating how obesity affects the immune
response to the influenza vaccine. Participants are recruited from the UNC Family Medicine
Center in Chapel Hill, NC and must be at least 18 years old without a history of
immunosuppressive diseases or a history of taking immunosuppressive medicines in order to
participate.4 The sample population for this study was selected from those who were enrolled in
the study during the 2016-2017 influenza season. Subjects in the sample population were
categorized into one of three groups: current smoker, previous smoker, or nonsmoker (Table 1).
A current smoker is defined in this study according to the CDC definition of a current smoker -
''an adult who has smoked I 00 cigarettes in his or her lifetime and who currently ~mokes
cigarettes."5 A previous smoker was originally defined in this study as one who had stopped
4

smoking for at least 10 years. After 10 years post-smoking, the risk of developing lung cancer is
30% to 50% of that of a continuous smoker, and the risk of developing diabetes is that of a
nonsmoker.6 Due to a limited sample from which to choose study participants, however, 5 of the
20 study participants selected for the category of previous smokers did not report the year in
which they had quit smoking. For the remaining 15 study participants, 14 of the 15 had quit
smoking at least 10 years ago, and one had quit 6 years ago. A nonsmoker is defined in this
study according to the CDC definition of a nonsmoker- "an adult who has never smoked, or
who has smoked less than 100 cigarettes in his or her lifetime.''5 Both current smoker and
nonsmoker designations were defined on the survey distributed to the participants at the time of
enrollment. Study subjects were further categorized by weight status into lean or obese smokers,
previous smokers, and nonsmokers. Subjects were placed into the lean group of smokers,
previous smokers, or nonsmokers if they had a BMI between 18.5 and 24.9. Subjects were
placed into the obese group of smokers, previous smokers, or nonsmokers if they had a BMI
greater than or equal to 30. RedCap is the online tool used to select study subjects. Subjects
were matched as closely as possible across the smoker, previous smoker, and nonsmoker groups
by age, race, gender, and BMI; however, BMI was of least importance because all subjects in the
lean group had a healthy weight BMI and all subjects in the obese group had an obese BMI.
5

Table I. Demographic Characteristics of Study Sample
Variable Current Smokers Previous Smokers
Male 12 (60.0) II (55.0)
Age -yr. /.¥¥":'7¥~%::~::/J" ';?;'i':i~~--·~:r.s.· ..
Range 47.5-73.3
~._,~!i;F,;~~~r·~,~ · · .. Caucasian/White 15 (75.0)
Asian 0 (0.0)
f~.~;lll~i;i''';~,:r;,\;'s:·. Mean Overall
Mean in Obese Group 36.1 ± 3.3
Mean Overall 38.4 ± 12.0
•tt!l!!!i!ltll!~.::.:·· .·.:;k":~~FFttli'~'-il~1l~J·.· Mean in Obese Group 34.8 ± 12.3
*Years smoked for previous smokers arc unknown
Preparation
'(4s:o). · M.1:rt'1, 1; ·.
42.9-76.5
15 (75.0)
I (5.0)
36.8 ± 4.6
*
*
Nonsmokers
< .J*1~;.yT 46.1-75.4
15 (75.0)
;::~~i#~.-.1}~'"'. I (5.0)
36.7 ± 3.7
At the time of subject enrollment, a pre-vaccination blood sample was drawn from each
subject followed by administration ofthe 2016-2017 seasonal trivalent int1uenza vaccine, which
included the A/California/7/2009 (H1N1)pdm09-like virus, the A/Hong Kong/4801/2014
(H3N2)-like virus, and the B/Brisbane/60/2008-like virus. 7 Participants returned within 28-32
days after administration of the influenza vaccine for drawing of a post-vaccination blood
sample.4 Whole blood is collected in heparinzed tubes and left undisturbed at room temperature
for i 5-30 minutes to allow for clotting. The supernatant is known as serum, which is
subsequently removed after the blood has clotted and is stored at -80°C until further use.
All serum samples must be treated with receptor destroying enzyme (ROE) before
beginning the hemagglutination inhibition assay. First, human serum (30 J..tL) was added to 1.5
6

mL sterile eppendorftubes. Following the serum addition, RDE (90 ~-tL) was added to the
eppendorf tubes. The tubes were then incubated at 3 7°C for 18 to 20 hours followed by heat
activation in a water bath at 56°C for 1 hour. After the samples cooled to room temperature,
physiological saline (180 ~-tL) was added to each eppendorf tube resulting in a final serum
dilution of 1:10. All samples must then be frozen for at least 4 hours before use.
A 0.5% red blood cell (RBC) suspension, necessary for both hemagglutination assays and
hemagglutination inhibition assays, was prepared using Turkey red blood cells (RBC) and the
proportionate amount of sterile phosphate buffered saline. The Turkey RBCs were centrifuged
three times at 270 g and 4 oc for 10 minutes per cycle. Following the first and second
centrifugations, the supernatant was discarded and sterile phosphate buffered saline ( 10 mL) was
added. After the final centrifugation, the size of the RBC pellet was estimated to determine the
volume of sterile phosphate buffered saline to add to create a 0.5% packed RBC suspension.
Hemagglutination Assay (HAU)
Serial dilutions of the H 1 N 1 virus were performed down a 96-well V -bottom plate
followed by the addition of the 0.5% RBC suspension to provide a measure of agglutination.
High concentrations ofthe virus will result in agglutination, meaning that enough of the virus is
present to bind to the red blood cells and prevent them from settling down creating a pellet. Low
concentrations of the virus will result in the formation of a red blood cell pellet because not
enough of the virus is present to sufficiently bind the red blood cells and agglutinate them. The
highest dilution (lowest concentration) of virus resulting in agglutination is the endpoint for the
hemagglutination assay. The reciprocal of the endpoint dilution is the HAU titer. The virus is
then diluted to 8 HAU/50 ~-tL of sterile phosphate buffered saline and retested via a ·second
hemagglutination assay to confirm the correct dilution.
7
Hemagglutination Inhibition Assay (HAl)
On a 96-well V -bottom plate, serum samples were added in duplicate to the first eight
wells of the first row. The last four wells of the first row included a positive control, a negative
control, a back titration, and turkey RBCs only, respectively. Serial dilutions of serum samples
and controls were performed down the 96-well V -bottom plate followed by the addition of a
standard amount ofHINl virus (25 r-tL) to all serum containing wells and to the positive and
negative control wells. The plate was incubated for 15 minutes to allow for the antibodies to
bind the virus. After incubation, the 0.5% RBC suspension was added to all wells to provide a
measure of agglutination. For high serum antibody concentrations, the virus will sufficiently be
bound by the antibodies, preventing it from causing agglutination of the red blood cells. A pellet
will result in these wells. For low serum antibody concentrations, not enough antibodies are
present to bind the virus; therefore, the virus is able to bind the red blood cells causing
agglutination. The highest dilution of serum containing antibodies resulting in inhibition of
agglutination and formation of a red blood cell pellet is the endpoint of the hemagglutination
inhibition assay. The reciprocal of the endpoint dilution is the HAl titer.
Analysis
The program GraphPad Prism 6.0 was used to analyze and interpret the data. HAl titers
were recorded for all subjects both pre- and post-vaccination. The HAl titer fold change was
calculated for each subject by dividing the post-vaccination titer by the pre-vaccination titer. A
two-way ANOVA was used to analyze the statistical significance for pre- and post-vaccination
titers across the previous smoker, current smoker, and non-smoker groups for each weight
category. A two-way ANOV A was also used to analyze the statistical significance for pre- and
post-vaccination titers across the lean and obese groups for each 'smoker' category as well as for
8

the statistical significance across each 'smoker' category for the percent sera-protected. A one-
way ANOV A was used to analyze the statistical significance for titer fold change among all six
groups: lean current smokers, obese current smokers, lean previous smokers, obese previous
smokers, lean non-smokers, and obese non-smokers. For all statistical tests, a p-value of <0.05
was deemed significant.
RESULTS
Hemagglutination inhibition assays (HAls) were run on pre- and post-vaccination serum
samples for all 60 subjects in the study. The HAl pre- and post-vaccination titer values were
determined (Table 2 and 3).
Table 2. HAl Titer Data for Lean Individuals in Sample Study Population
08 2833 5
08 2867 80
08 2901 40 m'' ,:-•t .. ~~~~~qjf,¥:~:::7{~;~~~~\~ti~>ic(;:'c(f,::'
08 2923 10 'c -~:fiit~~ftr£~j<::if;~*~'i!::~}~i?f1 c:: ',,•·Vmvm.h"' .L.&&iitilln'
Previous Smokers
08 3100 ci-~~--~i'fY;?~~'~':
08 3060 , :;~~~~~JP5'fJJ'lf§i'~·
08 3001
80
320
10
5 Iff 80
. ·:le 80
'1280 40 81 .. :,
,160 ')"
5 ·40· 80 ~0 160 80 10
· to 160
320
10
I ····· l';z;r;~~; '
I ··.'l''••'
2
I 4
2
2
2
I l
9

08 3056 20 : ';,,c{~•i•a-~;~::::~,~}~-~UA,}i~~i,Z13':;$~ft",',~~ttfft~;·!.~1JYjJO;·,·:,;:
132 10
08 3245 5
80 ,,;;;,;".,'
20 ,}; 4tt::,
5
Table 3. HAl Titer Data for Obese Individuals in Sample Study Population
08 3150
08 3272 :~.¥,Qa:*t.r.J;Jr
Previous Smokers ;1!-~~!:·~~
80
08 2903 80 ;r9IDIIJ~;'01Jf>s,', ;:::l;,,·;~!~"£':tf~i~4>::¥?rit~;¥:;,*~;;;;;,.;(.»' ''L'•'''>Jr::,:"•··
08 2821 20 ·~C:~~:;~;r~~:flP;!;J:t~¥~~ .. ;.·: ·- ::')'fj~<~~ii'~":i'':c•;!•';(;,:jL
08 3171 i11!J~cf(;1 .. ,,,
08 2912 Jf?';Qf!:,.,r':r ;'>,
08 2968 ,~:t:~..,l§r£0'
08 2965 ~str(lttf,-ft~~~~&;i:Y ~;::~~~-~fi<
20
160
5
5
20 ·:~~:;:r•f
160 5 80
'··· 40 40
10 s 80
40
160 '40'' 40
5
4
2 4
I :!
I 1 2 l I 2
I 1 2 l 2
I 'l
First, HAl titers were compared within each weight category. Within the lean subjects,
there is a trend in the HAl titers to increase from current smokers to previous smokers to
10

nonsmokers; however, the trend is insignificant (Figure 1 ). Within the obese subjects, the
previous smokers have the highest average HAl titers of the three "smoker'' groups with current
smokers and nonsmokers having similar average titer values. The differences between the
"smoker" groups for the obese subjects are insignificant (Figure 1 ). Next, HAl titers were
compared within each "smoker" category between lean and obese subjects. Lean current
smokers, lean previous smokers, and lean nonsmokers all had a greater change in titer values
from pre- to post-vaccination than their respective obese subjects, but these changes are
insignificant (Figure 2). The lean nonsmokers also had higher titer values for both pre- and post
vaccination than the obese nonsmokers, but the difference was not significant (Figure 2). The
titer fold change is a measure of how much the titer has changed from pre-vaccination to post
vaccination and can be used to determine if a subject seroconverted to the vaccine. There was a
general trend for the lean current smokers, previous smokers, and nonsmokers to have higher
titer fold changes than their respective obese counterparts; however. there were no significant
differences in the titer fold changes among any of the six groups (Figure 3). Lastly, in order to
be considered protected from the H 1 N 1 influenza virus, an antibody titer of 40 or higher is
needed. There are a higher percentage of lean current smokers, previous smokers, and
nonsmokers that are sera-protected than there are obese current smokers, previous smokers, and
nonsmokers, but this difference is insignificant (Figure 4).
11

a)
b)
40
30
... ~ 1- 20
~
40
30
... ~ 1- 20 C( :I:
HAl H1N1 Antibody Titer Lean
• Pre-Vaccination
• Post-Vaccination • •
HAl H1 N1 Antibody Titer Obese
• Pre-Vaccination
• • • Post-Vaccination
• • •
Figure 1. HAl titers for current smokers, previous smokers, and nonsmokers for the lean (a) and obese (b) groups. No significant difference in HAl titer levels between current smokers, previous smokers, and nonsmokers that are lean (P-value = 0.2496). No significant difference in HAl titer levels between current smokers, previous smokers, and nonsmokers that are obese (Pvalue = 0.4642).
12
a) HAl H1 N1 Antibody Titer Current Smokers
• Pre-Vaccination
• • Post-Vaccination
.. == 1- 10 C( J:
b) HAl H1 N1 Antibody Titer Previous Smokers
40
• • .. ~ 1- 20
~
c) HAl H1 N1 Antibody Titer Non-Smokers
.. ~ 1- 20 C( J:
• •
• Pre-Vaccination
• Post-Vaccination
• Pre-Vaccination
• Post-Vaccination
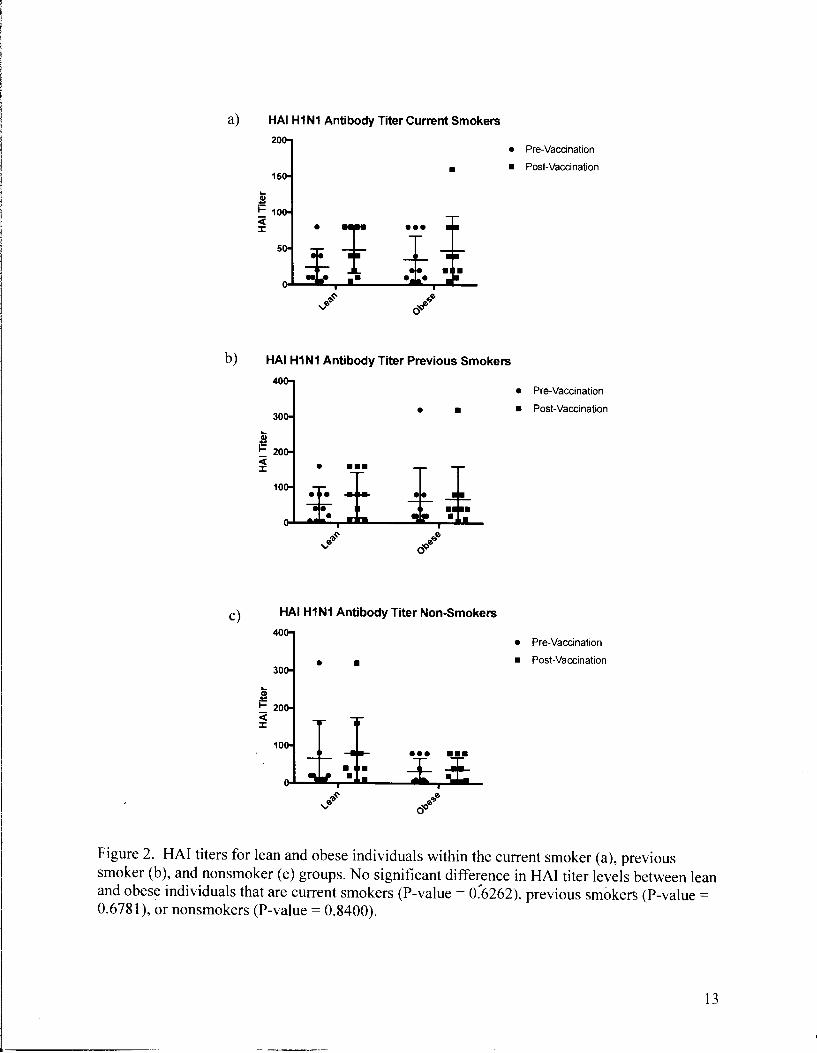
Figure 2. HAl titers for lean and obese individuals within the current smoker (a), previous smoker (b), and nonsmoker (c) groups. No significant difference in HAl titer levels between lean and obese individuals that are current smokers (P-value = o:6262), previous smokers (P-value = 0.6781 ), or nonsmokers (P-value = 0.8400).
13

Ill C)
2
; 1 .s::. 0 "C 0 u.
HAl H1 N1 Titer Fold Change
•
I . . .. ···I····~ .... : .... ~ .... !T! .... +····
Figure 3. Titer fold change for both lean and obese current smokers, previous smokers, and nonsmokers. No significant difference in titer fold change between any of the six groups (Pvalue = 0.5078).
HAl H1 N1 Percent Protected from H1 N1
- 40 Cut-Off
80 Cut-Off
- 160 Cut-Off
Figure 4. Percent sera-protected for both lean and obese current smokers, previous smokers, and nonsmokers. No significant difference between any of the ~ix groups (P-value for all is> 0.05).
14

DISCUSSION
Findings
The influenza virus is one of the most serious viruses of public health concern due to the
ease oftransmission through inhalation of viral particles and direct contact with infected persons.
The most recent worldwide pandemic of influenza occurred in 2009 by the H 1 N 1 strain of the
virus leading to a total death toll between 151,700 and 575,400 people worldwide.8 According to
the CDC, the pandemic H1N1 vaccine, which was distributed as early as November of2009,
prevented an average of 1 million influenza illnesses and saved on average 300 lives in the
United States; however, had the vaccine been available and distributed two weeks earlier, nearly
60% more influenza illnesses could have been avoided. 8 Even more recently during the 2014-
2015 influenza season, the H 1 N 1 pdm09 strain of the influenza virus became pandemic in India.
During this season a total of 33,761 influenza illnesses were reported with a death toll of 2,035
through March 30, 2015.9 Vaccination plays a major role in slowing pandemic or epidemic
outbreaks of influenza by preventing acquisition of the virus. In the current influenza season
from 2016 to 2017, a total of 36,649 specimens positive for influenza have been recorded to date
in the United States and territories. 10 Also in the United States and territories during the 2016-
2017 season, 72 influenza-related pediatric deaths have been recorded to date. 10
Smoking also has a huge impact on global mortality, as it is the leading preventable cause
of death worldwide. 11 In the United States alone, an average of 480,000 deaths occur annually
due io smoking. 11 Cigarette smoke contains high levels of volatile organic compounds including
carbon monoxide, which can be carcinogenic. 12 Carcinogens in tobacco smoke can react with the
DNA causing mutations and chromosomal abnormalities th~t can lead to altered protein/enzyme
function and eventually cancer. It is important to recognize the progress that many smokers have
15
made in recent years to quit smoking. The CDC sponsored a campaign titled Tips From Former
Smokers to aid those wanting to quit to take the right steps to quitting. From 2012 to 2015, this
campaign has helped more than 500,000 people in the United States quit smoking indetinitely. 13
Because of campaigns such as this one among many others, the number of previous smokers has
been increasing over time; therefore, it is necessary to conduct studies such as this one to
discover how their bodies respond post-smoking.
In previous studies it has been observed that smoking has a negative effect on the
antibody response to the influenza vaccine. A review by Sopori found that smoking can reduce
human serum immunoglobulin levels.2 Studies in animals have also found that the antibody
response was significantly decreased in response to specific antigens for those exposed to
cigarette smoke.2 As seen in Figure 1, the trend within the lean group of individuals was for the
antibody response to increase from current smokers to previous smokers to nonsmokers.
Although this trend was insignificant, it does support the data discovered by others for
nonsmokers to have higher antibody levels than current smokers. Within the lean group,
previous smokers fall between current smokers and nonsmokers as expected. It was also
hypothesized for previous smokers to have titers more similar to that of nonsmokers than to
current smokers; however, because of the small sample size, it is difficult to distinguish
significant differences. The obese group of individuals has a different pattern of antibody levels.
Within the obese group, previous smokers have the highest antibody titers whereas both current
smokers and nonsmokers have similar levels. This data does not agree with the trends found in
previous studies. It may be because this data only includes obese individuals whereas other
studies did not specifY the range of BMis included in the stu,dies. Or, the data may be skewed by
16

an outlier in the previous smoker group. Increasing numbers of subjects will aid in determining
statistical relevance.
Obesity also has a negative effect on the antibody response to the influenza vaccine. In a
study by Sheridan et al., BMI was negatively associated with antibody levels in response to the
influenza vaccine around 12 months post vaccination.4 As seen in Figure 2, within current
smokers, within previous smokers, and within nonsmokers, there is an insignificant trend for the
lean subjects to have larger titer increases from pre- to post-vaccination as compared to the obese
subjects. Although the trend is not significant, it does produce results that correspond with those
found by Sheridan et al.. Figure 3 shows a similar, albeit insignificant, trend. Lean individuals
in all cigarette consumption categories have higher titer fold changes than obese individuals in
the respective cigarette consumption categories, again supporting the findings by Sheridan et al..
Figure 4 also shows evidence of a negative relationship between obesity and antibody response
to the influenza vaccine. In order to be considered protected from the HIN1 virus, a titer of 40
or higher is needed. There is an insignificant trend within current smokers, within previous
smokers, and within nonsmokers for the lean subjects to have a higher percent protected from the
HlNl virus than the obese subjects. Although the data support findings by Sheridan et al., it is
insignificant; therefore, more studies should be done to increase the strength of the findings.
Study Limitations and Future Studies
Several limitations are evident within this study. Although 60 subjects were used in this
study, the sample size was still small, as each of the six categories only contained a total of 10
subjects. A small sample size can provide difficulties in finding statistically significant
differences within the study population, especially since ou!liers play a larger r?le in skewing the
data. Also, because of the small sample size, infom1ation was lacking from several previous
17

smokers on when each quit smoking. Originally, previous smokers in this study were to have
quit smoking for at least 10 years, as at that point the body has been shown to exhibit signs of
recovery and repair of damage. Lacking this information potentially means that some of the
subjects in this study may have quit smoking more recently, which may bias the results if their
antibody levels were different.
Another important limitation of this study involves the methods of data collection. In this
study, the subjects were recruited on a volunteer basis. These subjects were already going to the
UNC Family Medicine center to receive an influenza vaccine when asked if they would be
willing to enter the study. A statistically significant difference may be evident between the
people who willingly receive a flu shot versus those who do not. Also, smoking in this study
was self-reported, bringing about the potential for inaccurate reporting or recall bias. This type
of bias may have impacted the classification of individuals into one of the six groups, which in
tum could bias the results.
Hemagglutination inhibition assays (HAis) were only performed using the H 1 N 1 pdm09-
like virus. During the 2016-2017 influenza season, the H3N2 strain was the most common
circulating strain, which was unknown at the start of this study.7 Subjects can respond differently
to different virus strains; therefore, in future studies more strains should be tested. The average
titer fold change for each of the six groups was below 4, which is the change needed to show a
seroconversion to the vaccine. In each of the six groups, however, at least 50% of the
individuals were sero-protected, suggesting that these individuals may have had high titers pre
vaccination and were already sero-protected before administration of the vaccine. The
A/Califomia/7 /2009 (H 1 N 1 )pdm09-like virus has been a pa}i of the influenza vaccine since
2012; therefore, these people may have already developed immunity to this viral strain with
18

previous vaccinations. 14 If this study population is not representative of the general population
for example because these individuals receive the influenza vaccination yearly, this could cause a
bias in the results.
Apart from the small sample size, the other limiting factor that contributes heavily to this
study is due to age. In a study by Lambert et al., it was discovered that adults over the age of 65
have decreased antibody responses to the influenza vaccine than younger adults. 15 Diminished
antibody response to the vaccine as a result of aging, due to the degradation of both the adaptive
and innate divisions of the immune system, is known as immunosenescence. 15 In this study,
thirteen subjects were over the age of 65, causing age to be a potential confounder.
Future studies of smoking status on the response to the influenza vaccine are necessary
to discover new trends and confirm existing trends. The most important characteristic of future
studies for this topic focuses on appropriate sample size and selection. As evident in the results
of this study, a small sample size proved difficult to obtain any significant relationships as
outliers easily skewed the data. Having a larger sample size can prevent such skews from
outliers and provide a more accurate relationship between the two variables - smoking status and
antibody levels. The methods in how individuals are chosen for this study should also be
evaluated and taken into consideration when formulating future studies as volunteer and recall
bias may be factors affected the results currently. Having a larger sample size will also allow
researchers to choose individuals for participation in the study within a narrower age range. As
pre¥ious studies have noted, individuals over 65 years of age can have lower antibody levels than
individuals of younger ages with similar health status. 15 Choosing individuals for future studies
within a narrower age range will help to eliminate age as a gotential confounder to the study.
19

Future studies should also test for other viral strains of influenza. As mentioned above,
the A/Califomia/7 /2009 (HI N I )pdm09-like virus has been present in influenza vaccines since
2012, possibly leading to higher starting antibody levels and lower titer fold changes found in
this study. 14
Other strains of the virus should also be tested such as the A/Hong Kong/ 4801120 14
(H3N2)-like virus. It is the first year that this strain has been used in an influenza vaccine;
therefore, individuals should not have antibody responses to this strain until after vaccination. 16
HAis should be conducted on all strains contained in the influenza vaccine for that
corresponding influenza season to obtain the best results.
20
References
1. "A Brief History of Smoking- Cancer Council NSW." Cancer Council NSW. N.p., 20 Dec. 2011. Web. 12 Oct. 2015.
2. Sopori, Mohan. "Science and Society: Effects of Cigarette Smoke on the Immune System." Nature Reviews Immunology 2.5 (2002): 372-77. Web.
3. Ferson, M., Anne Edwards, Anne Lind, G.W. Milton, and P. Hersey. "Low Natural Killer-Cell Activity and Immunoglobulin Levels Associated with Smoking in Human Subjects." International Journal of Cancer 23.5 (1979): 603-09. Web.
4. Sheridan, P. A., H. A. Paich, J. Handy, E. A. Karlsson, M.G. Hudgens, A. B. Sammon, L.A. Holland, S. Weir, T. L. Noah, and M.A. Beck. "Obesity is Associated with Impaired Immune Response to Influenza Vaccination in Humans.'' International Journal ofObesity 36.8 (2011): 1072-077. Web.
5. Centers for Disease Control and Prevention (CDC). "Tobacco Glossary.'' National Center for Health Statistics. CDC, 17 June 2009. Web. 22 Apr. 2017.
6. Office of the Surgeon General, and Office on Smoking and Health. The Health Consequences of Smoking: A Report ofthe Surgeon General. Rockville, MD: U.S. Dept. of Health and Human Services, Public Health Service, Office of the Surgeon General, 2004.
7. Centers for Disease Control and Prevention (CDC). "Frequently Asked Flu Questions 2016-2017 Influenza Season." Influenza (Flu). CDC, 23 Mar. 2017. Web. 22 Apr. 2017.
8. Centers for Disease Control and Prevention (CDC). ·'First Global Estimates of 2009 H1N1 Pandemic Mortality Released by CDC-Led Collaboration." CDC, 25 June 2012. 22 Apr. 2016.
9. Tharakaraman, Kannan, and Ram Sasisekharan. "Influenza Surveillance: 2014-2015 H1Nl "Swine"-Derived Influenza Viruses from India." Cell Host & Microbe 17.3 (2015): 279-82. Web.
10. Centers for Disease Control and Prevention (CDC). "Weekly U.S. Influenza Surveillance Report.'' Influenza (Flu). CDC, 21 Apr. 2017. Web. 22 Apr. 2017.
11. Centers for Disease Control and Prevention (CDC). "Fast Facts.'' Smoking and Tobacco U'ie. CDC, 29 Mar. 2017. Web. 22 Apr. 2017.
12. Centers for Disease Control and Prevention (CDC). "Chapter 3 Chemistry and Toxicology of Cigarette Smoke and Biomarkers of Exposure and Harm>' Hi.Jw Tobacco Smoke Causes Disease: The Biology and Behavioral Basisfor Smoking-attributable Disease: A Report ofthe Surgeon General. By Office on Smoking and Health. Rockville,
21

MD: U.S. Dept. of Health and Human Services, Public Health Service, Office of the Surgeon General, 2010. N. pag.
13. Centers for Disease Control and Prevention (CDC). "About the Campaign.'' Tips From Former Smokers. CDC, 17 Jan. 2017. Web. 22 Apr. 2017
14. World Health Organization. "Recommended Composition of Influenza Virus Vaccines for Use in the 2012-2013 Northern Hemisphere Influenza Season." Influenza. World Health Organization, 23 Feb. 2012. Web. 22 Apr. 2017.
15. Lambert, Nathaniel D., Inna G. Ovsyannikova, V. Shane Pankratz, Robert M. Jacobson, and Gregory A. Poland. "Understanding the Immune Response to Seasonal Influenza Vaccination in Older Adults: A Systems Biology Approach.'" Expert Review o.f Vaccines 11.8 (2012): 985-94. Web.
16. World Health Organization. "Recommend Composition oflnfluenza Virus Vaccines for Use in the 2016-2017 Northern Hemisphere Influenza Season." Influenza. World Health Organization, 25 Feb. 2016. Web. 22 Apr. 20 I 7.
22