abstract and their symbiotic mesostigmatid...
TRANSCRIPT

ABSTRACT
COEVOLUTIONARY ANALYSIS OF APPALACHIAN XYSTODESMID MILLIPEDES
AND THEIR SYMBIOTIC MESOSTIGMATID MITES
by
Angela Lynn Swafford
April, 2010
Major Department: Biology
Department Chair: Jeffrey McKinnon
Mites (Acari) form symbiotic relationships with many animal taxa including fish,
amphibians, reptiles, birds, mammals, mollusks, and arthropods. They are frequently found
living on millipedes, and it has often been speculated that these two groups of arthropods have,
in some cases, undergone coevolution. However, this hypothesis has never been formally tested.
Millipedes of the family Xystodesmidae Cook, 1985 (Diplopoda: Polydesmida) are often host to
several symbiotic mite species, but very little work has been done to identify these acarines or to
understand their relationship to the millipedes. In an attempt to better understand these
associations, mites and their xystodesmid millipede hosts were collected in the broadleaf forests
of the eastern United States. Mites in the genera Stylochyrus Canestrini and Canestrini, 1882
(Mesostigmata: Ologamasidae) and Schwiebea Oudemans, 1916 (Sarcoptiformes: Acaridae)
were very prevalent among millipedes in the genera Apheloria Chamberlin, 1921; Appalachioria
Marek and Bond, 2009; Boraria Chamberlin, 1943; Brachoria Chamberlin, 1939; Dixioria
Chamberlin, 1947; Nannaria Chamberlin, 1918; Pleuroloma Rafinesque, 1820; Prionogonus

Shelley, 1982; Rudiloria Causey, 1955; and Sigmoria Chamberlin, 1939. Of the mite taxa
collected, the species Stylochyrus rarior (Berlese, 1916) was found on the greatest number of
sampled millipede taxa. The complete mitochondrial genome of S. rarior associated with an
individual of the millipede genus Apheloria (Polydesmida: Xystodesmidae) was sequenced. The
genome is 14,900 nucleotides in length, has all the typical genes of an arthropod mitochondrion,
differs in gene arrangement from that of the ancestral arthropod, and has a gene order that is
unique among mites and ticks. The major difference in S. rarior is the placement of the protein-
coding gene nad1, which is positioned between the ribosomal RNA gene 12S and the protein-
coding gene nad2 (transfer RNA genes and non-coding regions excluded). For use in
coevolutionary analyses, the DNA from two mitochondrial regions (16S/12S and cox1) was
sequenced for all collected xystodesmid millipede and Stylochyrus mite specimens.
Phylogenetic trees were reconstructed for both of these millipede and mite taxa using Bayesian
inference. Pairwise distance data was used in distance-based coevolutionary analyses, and
reconstructed phylogenies were used in tree-based coevolutionary analyses. The phylogenetic
analyses indicate Stylochyrus and xystodesmid millipede evolutionary history is incongruent.
Moreover, the evolutionary relationships among mite individuals and populations have very low
support values and indicate little to no geographic structuring. The coevolutionary analyses
likewise detected no pattern of coevolution among these millipede and mite lineages. Unlike
many arthropod species, Stylochyrus mites appear to be highly vagile.


COEVOLUTIONARY ANALYSIS OF APPALACHIAN XYSTODESMID MILLIPEDES
AND THEIR SYMBIOTIC MESOSTIGMATID MITES
A Thesis
Presented to
the Faculty of the Department of Biology
East Carolina University
In Partial Fulfillment
of the Requirements for the Degree
Master of Science
by
Angela Lynn Swafford
April, 2010

©Copyright 2010
Angela Lynn Swafford
COEVOLUTIONARY ANALYSIS OF APPALACHIAN XYSTODESMID MILLIPEDES
AND THEIR SYMBIOTIC MESOSTIGMATID MITES
by
Angela Lynn Swafford
APPROVED BY:
COMMITTEE DIRECTOR:_______________________________________________________ Jason Bond
COMMITTEE MEMBER: ________________________________________________________
Trip Lamb COMMITTEE MEMBER: ________________________________________________________
Jeff McKinnon COMMITTEE MEMBER: ________________________________________________________
Petra Sierwald DEAN OF THE GRADUATE SCHOOL: ____________________________________________
Paul Gemperline

ACKNOWLEDGEMENTS
I would first like to thank my advisor, Jason Bond, for taking me on as his student,
providing me with funding for my research, and allowing me to have this valuable and unique
learning experience. I would also like to thank all of my committee members (Trip Lamb, Jeff
McKinnon, and Petra Sierwald) for all of their support and guidance. I would like to thank East
Carolina University and the Department of Biology for admitting me to ECU and providing me
with the opportunity to be a graduate teaching assistant. I would like to thank Hans Klompen
and all of his students for letting me come visit, teaching me about mite identification, mite
morphology, and molecular protocols, and providing me with mite literature and other resources.
I would like to thank Greg Spicer and all of his students for allowing me to visit and learn mite
identification procedures and molecular techniques. I would like to thank Tim Christensen and
John Stiller for molecular advice and use of their lab spaces. I would like to thank Michael
Brewer for all of his encouragement and for assisting with fieldwork, lab procedures, and
manuscript editing. I would like to thank Paul Marek for help collecting, processing, and
identifying millipede specimens. I would like to thank Amy Stockman, Matt Walker, and Chad
Spruill for assistance with molecular protocols. I would also like to thank the journal
Invertebrate Systematics and CSIRO publishing for first publishing my paper entitled: The
symbiotic mites of some Appalachian Xystodesmidae (Diplopoda: Polydesmida) and the
complete mitochondrial genome sequence of the mite Stylochyrus rarior (Berlese) (Acari:
Mesostigmata: Ologamasidae). I would like to thank Michael Charleston and Philippe Casgrain
for assistance with using coevolutionary software. I would like to thank Stuart Longhorn for
pointing out sequencing and annotation errors and helping me correct them. I would also like to
thank all of ECU biology faculty, staff members, and graduate students for willingly helping me

whenever I needed it. I appreciate all of the help provided by all of the former and current Bond
Lab members not previously mentioned and all of the additional individuals that assisted with
fieldwork. Lastly, I would like to thank my parents, family, and friends for their continual
support and encouragement.

TABLE OF CONTENTS
ABSTRACT .................................................................................................................... i
TITLE PAGE................................................................................................................. iv
COPYRIGHT PAGE ...................................................................................................... v
SIGNATURE PAGE...................................................................................................... vi
ACKNOWLEDGEMENTS .......................................................................................... vii
TABLE OF CONTENTS............................................................................................... ix
LIST OF FIGURES ....................................................................................................... xi
LIST OF TABLES........................................................................................................ xii
CHAPTER 1: SYMBIOTIC MITES OF XYSTODESMID MILLIPEDES .................... 1
1.1: Introduction................................................................................................. 1
1.2: Methods....................................................................................................... 4
1.2.1: Sampling and Collecting ............................................................... 4
1.2.2: Molecular Protocols ...................................................................... 5
1.2.3: Genome Annotation ...................................................................... 8
1.3: Results and Discussion ................................................................................ 8
1.3.1: Prevalence of Mites on Millipede Hosts ........................................ 8
1.3.2: S. rarior Taxonomy and Mitochondrial Genome Organization .... 11
1.3.2.1: Diagnosis...................................................................... 12
1.3.2.2: DNA processing ........................................................... 12
1.3.2.3: Genome organization.................................................... 14
1.4: Conclusions ............................................................................................... 17

CHAPTER 2: TESTING FOR MILLIPEDE-MITE CODIVERGENCE....................... 18
2.1: Introduction............................................................................................... 18
2.2: Methods..................................................................................................... 22
2.2.1: Sampling and Collecting ............................................................. 22
2.2.2: Molecular Protocols .................................................................... 23
2.2.2.1: Primer design................................................................ 24
2.2.2.2: Millipede extraction and amplification.......................... 25
2.2.2.3: Mite extraction and amplification.................................. 26
2.2.2.4: Sequencing ................................................................... 27
2.2.3: Sequence Alignment and Phylogenetic Analysis ......................... 27
2.2.4: Coevolutionary Analysis ............................................................. 31
2.2.4.1: Distance-based method ................................................. 32
2.2.4.2: Tree-based method........................................................ 34
2.3: Results....................................................................................................... 36
2.3.1: Xystodesmid Millipede Sampling................................................ 36
2.3.2: Sequence Alignment and Phylogenetic Analysis ......................... 36
2.3.3: Coevolutionary Analysis ............................................................. 43
2.4: Discussion ................................................................................................. 57
REFERENCES ............................................................................................................. 62

LIST OF FIGURES
Figure 1.1: Photos of Stylochyrus rarior mites and xystodesmid millipedes ................. 10
Figure 1.2: Mitochondrial genome map for Stylochyrus rarior ..................................... 15
Figure 2.1: Stylochyrus rarior 16S/12S phylogeny ....................................................... 38
Figure 2.2: Stylochyrus rarior 16S/12S + cox1 phylogeny ............................................ 39
Figure 2.3: Xystodesmid 16S/12S phylogeny ............................................................... 40 Figure 2.4: Xystodesmid cox1 phylogeny..................................................................... 41 Figure 2.5: Xystodesmid 16S/12S + cox1 phylogeny .................................................... 42
Figure 2.6: Tanglegram for analysis TM6_16S............................................................. 47
Figure 2.7: Tanglegram for analysis TM7A_16S.......................................................... 48
Figure 2.8: Tanglegram for analysis TM7B_16S .......................................................... 49
Figure 2.9: Tanglegram for analysis TM7C_16S ......................................................... 50
Figure 2.10: Tanglegram for analysis TM7D_16S ....................................................... 51
Figure 2.11: Lowest cost reconstruction (6) from analysis TM6_16S ........................... 52
Figure 2.12: First lowest cost reconstruction (3) from analysis TM7A-16S................... 52
Figure 2.13: Second lowest cost reconstruction (5) from analysis TM7A-16S .............. 53
Figure 2.14: Lowest cost reconstruction (1) from analysis TM7B-16S ......................... 53
Figure 2.15: First lowest cost reconstruction (7) from analysis TM7C_16S .................. 54
Figure 2.16: Second lowest cost reconstruction (8) from analysis TM7C_16S.............. 54
Figure 2.17: Third lowest cost reconstruction (11) from analysis TM7C_16S............... 55
Figure 2.18: Fourth lowest cost reconstruction (12) from analysis TM7C_16S............. 55
Figure 2.19: Fifth lowest cost reconstruction (18) from analysis TM7C_16S................ 56
Figure 2.20: Lowest cost reconstruction (1) from analysis TM7D_16S......................... 56
LIST OF TABLES
Table 1.1: Primer pairs and their locations.................................................................... 13
Table 1.2: Stylochyrus rarior mitochondrial genome organization................................ 16
Table 2.1: Mite and millipede primers.......................................................................... 25
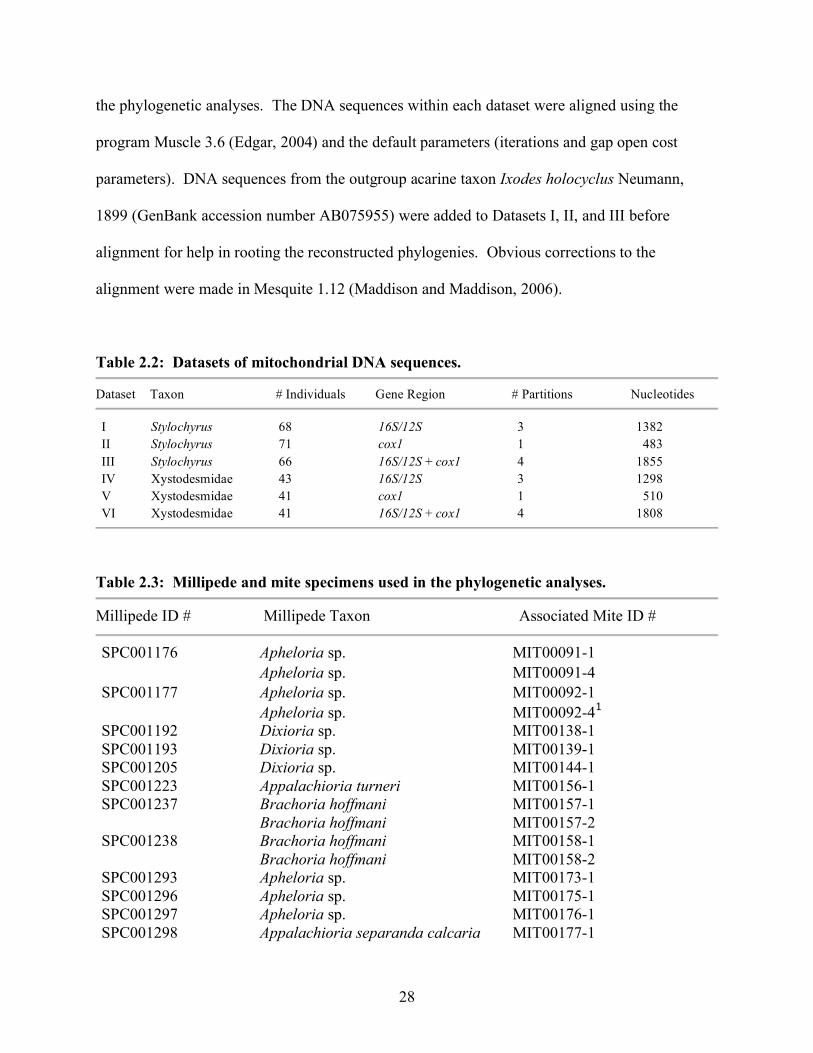
Table 2.2: Datasets of mitochondrial DNA sequences .................................................. 28
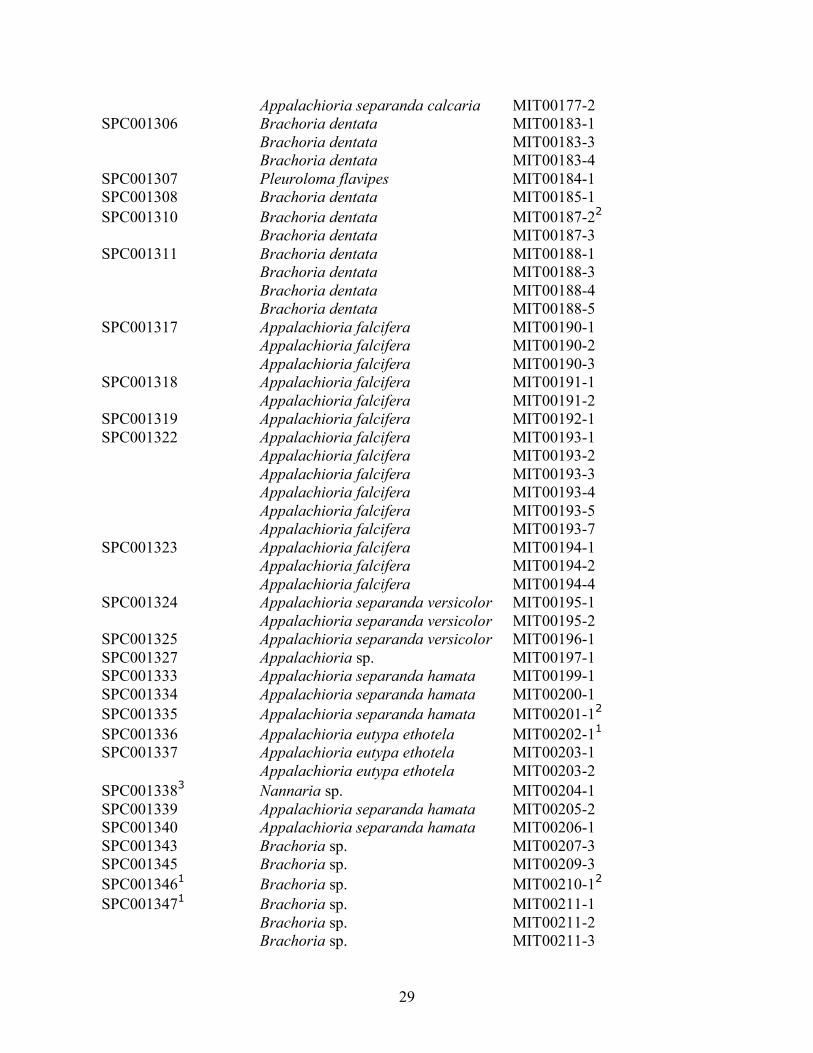
Table 2.3: Millipede and mite specimens used in the phylogenetic analyses ................. 28
Table 2.4: Coevolutionary analyses performed in ParaFit and TreeMap ....................... 35
Table 2.5: Results from the phylogenetic analyses in MrBayes..................................... 37
Table 2.6: Results from the six ParaFit analyses........................................................... 43
Table 2.7: Results from the six TreeMap analyses........................................................ 45

CHAPTER 1: SYMBIOTIC MITES OF XYSTODESMID MILLIPEDES
1.1: Introduction
The order Mesostigmata, which contains approximately 12,000 known species, is a hyper-
diverse arthropod group that comprises both free-living and symbiotic species of mites (Krantz
and Walter, 2009). These mite species are commonly predatory, brown in color, and their first
pair of legs is often used for sensory purposes in addition to walking (Hunter and Rosario, 1988).
Mesostigmatid mites, as well as other acarine taxa, are probably poor dispersers as a
consequence of their small size and lack of wings; therefore, phoresy is common practice among
many groups of mites (Krantz and Walter, 2009). Phoresy is a short-term symbiotic relationship
in which a small animal (the phoretic) increases its ability to disperse by attaching to a larger,
more mobile animal (the carrier) (Farish and Axtell, 1971). A symbiotic relationship is an
association between two or more organisms in which at least one of the organisms benefits; it
can be mutual, commensal, or parasitic. Phoresy is considered to be a commensal type of
symbiotic relationship because the phoretic benefits, but the carrier is usually not affected.
Phoretic associations can be facultative or obligatory, and they can range from having only one
very specific carrier to having a wide variety of taxa employed as carriers (Krantz and Walter,
2009). Animals in a phoretic stage often undergo an arrest of basic functions, such as
development, reproduction, and feeding (Farish and Axtell, 1971). Once a new, suitable
environment is reached, the mites can leave their carrier, and these halted functions can
recommence. Phoresy commonly takes place in mites in the deutonymphal stage of development
and in adults (Krantz and Walter, 2009). Despite the interesting life history characteristics of
species attributed to this group and the close evolutionary associations of many of its members
2
with totally unrelated arthropod and other animal species, relatively few studies have focused on
mesostigmatid mites.
It is now commonplace to employ very large sets of molecular data in evolutionary
systematic studies, including multiple genes sampled across both nuclear and organellar genomes
and sequence data comparisons based upon entire genomes (Boore et al., 2005). Complete
mitochondrial genome DNA sequences are often used because they are easy to isolate from
nuclear DNA and tend to have a constant number of genes across most animal groups (Boore et
al., 2005). The circular mitochondrial genome of animals typically consists of one or two non-
coding control regions and 37 genes: 13 protein-coding genes, 2 ribosomal RNA (rRNA) genes,
and 22 transfer RNA (tRNA) genes. Complete mitochondrial genomes have been sequenced for
over 200 arthropod species. Of these, 23 belong to the subclass Acari (mites and ticks).
Mitochondrial genomes of acarines range in size from 13,103 nucleotides in Tetranychus urticae
Koch, 1836 (Tetranychoidea) (Van Leeuwen et al., 2008) to 24,961 nucleotides in Metaseiulus
occidentalis (Nesbitt, 1951) (Phytoseiidae) (Jeyaprakash and Hoy, 2007). The ancestral
arthropod gene order is considered to be the arrangement found in the horseshoe crab Limulus
polyphemus Linnaeus, 1758 (Lavrov et al., 2000). Some arthropods, including a number of
mites, deviate from this arrangement. A few (such as M. occidentalis) even differ in the number
of mitochondrial genes as a result of duplications or deletions (Fahrein et al., 2007; Jeyaprakash
and Hoy, 2007). The vast amount of differences seen among mite mitochondrial genomes
indicates that there remains considerable work if we are to understand acarine systematics.
Generally speaking, we know very little about the genomes of mesostigmatid mites. The
mitochondrial genome has been completely sequenced for only two species, and the synteny and
size of their genomes are very different (Evans and Lopez, 2002; Navajas et al., 2002;

3
Jeyaprakash and Hoy, 2007). Metaseiulus occidentalis has a surprisingly large mitochondrial
genome that is very divergent from the ancestral arthropod condition (Jeyaprakash and Hoy,
2007). It contains both duplicated and triplicated regions, has short transfer RNAs, and may be
lacking the two protein-coding genes nad3 and nad6 (Jeyaprakash and Hoy, 2007). The entire
mitochondrial genome of Varroa destructor Anderson and Trueman, 2000 (Varroidae) has been
sequenced twice with slightly different results (Evans and Lopez, 2002; Navajas et al., 2002).
Evans and Lopez (2002) concluded that the mitochondrial genome of V. destructor is 15,218
nucleotides in length, whereas Navajas et al. (2002) estimated the size to be 16,477 nucleotides.
It was discovered that the protein-coding genes and ribosomal RNA genes of V. destructor are
located at the same relative positions as in ancestral arthropods (Evans and Lopez, 2002; Navajas
et al., 2002).
Neither M. occidentalis nor V. destructor belong to the family Ologamasidae, which is a
large, widespread family of soil-dwelling, predaceous mites that typically eat small invertebrates
and their eggs (Krantz and Walter, 2009). Most ologamasid mite taxa are not phoretic; however,
deutonymphs of a few genera have been found associated with mammal nests, carabid beetles,
dipterans, and other arthropods (Krantz and Walter, 2009). Stylochyrus rarior (Berlese, 1916) is
an ologamasid mite commonly found in moist, deciduous forests and is sometimes found
associated with millipedes, small mammals, and birds (Kethley, 1983). Only juveniles in the
deutonymphal stage have been found to form symbiotic relationships, while adults are usually
free-living and collected in leaf litter on the forest floor (Kethley, 1983). It is therefore believed
that S. rarior only forms temporary or phoretic symbiotic associations for dispersal purposes
(Kethley, 1983). Deutonymphs have a distal hyaline extension on one of their cheliceral digits,
which is often associated with mites that practice phoresy (Kethley, 1983). However, very little

4
work has been done to understand the phoretic relationships of S. rarior or to determine how
many taxa these mites use as carriers.
The objectives of this study are: 1) to document the prevalence of symbiotic mites on
xystodesmid millipede species of the Appalachian Mountains and 2) to examine the common
mite S. rarior and sequence its entire mitochondrial genome. This work will lay the foundation
for a future genetic study of the coevolution of these millipedes and their associated mites.
1.2: Methods
1.2.1: Sampling and Collecting
Xystodesmid millipedes were collected in October 2007, May to July 2008, and May to June
2009. Most collecting took place at the known localities of the millipede genus Appalachioria
(Marek and Bond, 2006) in order to collect mite and millipede specimens for a future
coevolutionary analysis. All xystodesmid millipedes found were examined for mites in the field.
The millipedes that harbored mites were placed in individual collecting vials, so that there was
no opportunity for the transfer of mites between millipedes. To ensure that few mites were lost
during transport, mites that were visible on the millipedes were removed with soft forceps and
placed in RNAlater (Qiagen Inc., Valencia, CA) in the field. Both millipedes and mites were
transported back to the lab for identification and study. In the lab, millipedes were again
examined for mites. If mites were found, they were placed in RNAlater and stored at -80˚C.
Mites stored in RNAlater can be readily used for DNA extraction and sequencing. Millipede
species were identified by morphology of male genitalia or by comparing the region of their
mitochondrial DNA sequence spanning the 12S and 16S rRNA genes to those of the previously
identified millipedes with Genbank accession numbers DQ4900648 through DQ4900700 (Marek

5
and Bond, 2006). For identification, mites were cleared in lactic acid or lactophenol and then
mounted on microscope slides using Hoyer’s mounting medium. Alcohol-preserved
xystodesmid specimens from the collection at East Carolina University (ECU) were also
examined for the presence of mites. Both the millipede specimens and the alcohol content of
their vials were inspected for mites. All mites and millipedes collected as part of this study have
been assigned unique voucher numbers and are currently stored in the collections at ECU (to be
deposited in the Field Museum of Natural History collection).
1.2.2: Molecular Protocols
A modified DNA extraction method using a Qiagen DNeasy Tissue Kit (Valencia, CA) was used
to isolate genomic DNA from one individual of Stylochyrus rarior. The purpose of changing
this extraction protocol was to ensure that the mite was not destroyed and could later be mounted
on a microscope slide for identification purposes. The first modifications to the normal protocol
consisted of leaving the mite in the digestion mix at 55˚C for 24 hours followed by -40˚C for
another 24 hours. After thawing at room temperature, all the liquid was removed and transferred
to a new tube so that the mite could be recovered. The digestion mix was never vortexed while it
contained the mite specimen. Instead, it was mixed gently by tapping the side of the tube. To
complete the extraction procedure, 100 µL of buffer AE (10mM Tris Cl and 0.5mM
ethylenediametetraacetic acid; warmed to 55˚C) was added to the sample and centrifuged. Then
100 µL of room temperature buffer AE was added to the sample and centrifugation was repeated
to produce approximately 200 µL of genomic DNA. The extracted DNA from this single mite
was used to sequence the entire genome of the mitochondrion.
First a region of the 16S ribosomal gene was amplified and sequenced using the universal

6
primers LR-J-12887 (5’ CCGGTCTGAACTCAGA TCACGT 3’) and LR-N-13398 (5’
CGCCTG TTTATCAAAAACAT 3’). A 50 µL reaction was prepared comprising the following
PCR mixture: 25.75 µL ultra pure water, 5 µL 2.5mM deoxyribonucleotide triphosphate (dNTP)
mixture, 5 µL 10X Taq buffer, 5 µL of each 2.5 µM or 10 µM primer, 1 µL dimethyl sulfoxide
(DMSO), 1 µL bovine serum albumin (BSA), 0.25 µL Takara Ex Taq DNA polymerase, and 2
µL genomic DNA. The following thermal cycle parameters were used: initial denaturation at
95°C for 2 min; 30 cycles of denaturation at 94°C for 1 min, annealing at 48°C for 1 min, and
extension at 72°C for 1 min; and final extension at 72°C for 2 min. The reagent ExoSAP-IT
(USB Corporation, Cleveland, OH) and its corresponding protocol were used to remove excess
dNTPs and primers from the PCR product. This product was then used in a 10 µL sequencing
reaction with the following components: 4.35 µL ultra pure water, 2 µL 5X sequencing buffer, 1
µL BigDye Terminator, 0.65 µL 2.5 µM or 10 µM primer, and 2 µL PCR product. The
following thermal cycle program was used: 26 cycles of 96°C for 10 sec, 50°C for 15 sec, and
60°C for 4 min. This short DNA sequence was used to create primers specific to this individual
mite in the 16S region that could then be used to amplify the entire mitochondrial genome
according to the procedures of Hwang et al. (2001). The primers created were
HPK16Sbb_mit91 (5’ CATATTGATAAAATAGTTTGCGA CCTCGATGTT 3’) and
HPK16Saa_mit91 (5’ TCAATACCTTCGCATAGTCAAAATACCAC GGC 3’). The following
50 µL PCR mixture was used: 24.5 µL ultra pure water, 8 µL 2.5mM dNTP mixture, 5 µL 10X
LA PCR buffer, 5 µL of each 2.5 µM or 10 µM primer, 0.5 µL Takara LA Taq, and 2 µL
genomic DNA. The thermal cycle parameters described by Hwang et al. (2001) were used, and
this product was purified using the ExoSAP-IT procedure.
After the entire mitochondrial genome was amplified and cleaned (minus the short region

7
within 16S), an additional amplification was done using a Qiagen Repli-g Ultrafast Mini Kit to
increase the amount of mitochondrial DNA. Next, two separate digestions were done using the
restriction enzymes Rsa I (5’ GTAC 3’) and Alu I (5’ AGCT 3’). These digested products were
sorted on an agarose gel with a ladder, and fragments between 500 and 1500 nucleotides in size
were excised from the gel and purified using a Qiagen MinElute Gel Extraction Kit. Using a
Zero Blunt PCR Cloning Kit (Invitrogen, Carlsbad, CA), DNA was inserted into vectors and
transformed into E. coli cells, which were then grown overnight on kanamycin agar plates.
Isolated colonies, each containing a cloned S. rarior mitochondrial region, were amplified and
sequenced using the primers M13 Reverse and T7 from the cloning kit. A 25 µL PCR reaction
was done using the following mixture: 12.5 µL Promega GoTaq Green Master Mix (Promega,
Madison, WI), 9.5 µL ultra pure water, 1.5 µL of each 2.5 µM or 10 µM primer, and 1 swab of
an isolated colony. The following thermal cycle parameters were used: initial denaturation at
94°C for 10 min; 30 cycles of denaturation at 94°C for 1 min, annealing at 56°C for 1 min, and
extension at 72°C for 1 min; and final extension at 72°C for 10 min. PCR products were cleaned
up with ExoSAP-IT and sequenced using the same protocol described above. Sequences were
viewed, edited, and assembled in the program Sequencher 4.8 (Gene Codes, Ann Arbor, MI).
In order to complete the whole mitochondrial genome sequence, primers pairs were
designed using Primer3 (Rozen and Skaletsky, 2000) to fill in any gaps existing between the
sequence fragments. Genomic DNA from S. rarior was amplified and sequenced using these
designed primer pairs. Because all gaps were of unknown length, amplifications were done
using Takara LA Taq and the corresponding 50 µL PCR mixture described above. The thermal
cycle parameters for long amplification described in Hwang et al. (2001) were used but with an
annealing temperature of 50°C. The same methods as described earlier were used to purify and

8
sequence the PCR products.
1.2.3: Genome Annotation
The tRNA genes were identified using tRNAscan-SE 1.21 (Lowe and Eddy, 1997); the cove
cutoff score was set to 2 to detect as many potential genes as possible. The tRNA genes that
were not found by this method were identified by comparison with known tRNAs of other
arthropods and by looking for anticodons. Ribosomal RNA genes were annotated by alignment
with available mitochondrial genomes of other Acari. Protein-coding genes were identified by
using the NCBI ORF finder and by running a BLAST search against all mite DNA sequences
available in Genbank. Regions that were not similar to known genes and did not have long open
reading frames were considered to be non-coding control regions.
1.3: Results and Discussion
1.3.1: Prevalence of Mites on Millipede Hosts
A total of 136 xystodesmid millipedes (see Figure 1.1 for photos of representative xystodesmids)
were collected in the Appalachian Mountains of North Carolina, Virginia, Kentucky, and
Tennessee during the sampling period. Of these millipedes, 89 had symbiotic mites. Over 400
mites, representing the two orders Sarcoptiformes (including the genus Schwiebea) and
Mesostigmata (including the genus Stylochyrus), were extracted from these millipedes. All
Stylochyrus and Schwiebea individuals collected were in the deutonymphal stage of
development. Over 100 Stylochyrus rarior deutonymphs (see Figure 1.1 for photos of S. rarior)
were collected from 43 millipedes including the following genera: Apheloria, Appalachioria,
Brachoria, Dixioria, Nannaria, Pleuroloma, Prionogonus, and Sigmoria. For those millipedes

9
that harbored this species of mite, the number of S. rarior per individual millipede ranged from 1
to 13 with an average of 2.49 (SD=2.58). About 51% (22 out of 43) of these millipedes had only
a single individual of S. rarior associated with them. Deutonymphal mites of the genus
Schwiebea were found on Apheloria, Appalachioria, Brachoria, Boraria, Dixioria, Nannaria,
Rudiloria, and Sigmoria. Individuals of Schwiebea were collected from 57 xystodesmid
millipedes and were generally more abundant per millipede than Stylochyrus rarior. The number
of Schwiebea per millipede ranged from 1 to 26 with an average of 5 (SD=5.72). Although these
mites were found in greater numbers on individual millipedes, they were not found on as many
species of millipede as S. rarior. Fifteen millipedes were collected that had both Schwiebea and
Stylochyrus rarior. A few unidentified mesostigmatid mites were also collected in very small
numbers from xystodesmids.
Symbiotic mites were discovered on many different body parts of their millipede carriers.
Some mites were found attached near the anterior end of a millipede, whereas others were found
on the legs or near the bases of the legs. Others seemed to be actively moving along both the
dorsal and ventral surfaces of the millipedes. It is not clear whether this activity is natural or
whether it occurred because of human interference. Stylochyrus was typically active upon a
millipede, while Schwiebea was usually inactive and attached under the head or near the legs of a
millipede. This was as expected because Schwiebea deutonymphs have sucker-like attachment
plates on their ventral surfaces and have been found tightly attached to other arthropods
(Purrington and Drake, 2008). Stylochyrus deutonymphs lack attachment plates, so they must
hang on to a carrier with their legs, claws, or chelicerae.

10
Figure 1.1: Photos of Stylochyrus rarior mites and xystodesmid millipedes. (A) Whole-mount of S. rarior deutonymph in ventral aspect. (B) Anterior portion of S. rarior deutonymph in ventral aspect. (C) Live individual of Apheloria sp. from Kentucky. (D) Live individual of Prionogonus sp. from North Carolina.
Upon examination of the millipede collection at East Carolina University, more mite taxa
were found to be associated with xystodesmids. In addition to Schwiebea and Stylochyrus, the
following two other taxa were found: Viedebanttia Oudemans, 1929 (Sarcoptiformes: Acaridae)
and Heterozerconidae (Mesostigmata). All the mites found were detached from their associate
millipede specimen, which indicates that they fell off in storage. Mites from the ECU millipede
collection could have been lost or even transferred between millipedes, which means that the

11
number and kinds of mites found may not be representative of natural populations. Mites were
found associated with 119 preserved xystodesmid specimens. Of these millipedes, 72 were
associated with Stylochyrus rarior (1 to 9 individuals per millipede), 34 with Schwiebea (1 to
over 20 per millipede), 19 with Viedebanttia (1 to 7 per millipede), and 4 with heterozerconids
(only 1 per millipede). Some of these mite taxa were found associated with the same individual
millipede specimen. All individuals belonging to the genera Stylochyrus, Schwiebea, and
Viedebanttia were juveniles in the deutonymphal stage. The 4 heterozerconid mites were adults.
Heterozerconidae is an acarine family found primarily on juliform millipedes (Gerdeman et al.,
2000). In the United States, heterozerconid mites are not known to be associated with any
species of Polydesmida; therefore, this xystodesmid-associated heterozerconid may be an
undescribed species.
1.3.2: S. rarior Taxonomy and Mitochondrial Genome Organization
Superorder PARASITIFORMES
Order MESOSTIGMATA
Suborder MONOGYNASPIDA
Superfamily RHODACAROIDEA
Family OLOGAMASIDAE Ryke, 1962
Genus Stylochyrus Canestrini and Canestrini, 1882
Type species: Stylochyrus rovennensis Cannestrini and Canestrini, 1882: 31-82
Stylochyrus rarior (Berlese, 1916)
Gamasiphis (Epiphis) rarior Berlese, 1916: 289-338

12
Epiphis rarior Berlese, 1916. – Vitzthum, 1942: 756; Kethley 1983: 2598.
Stylochyrus rarior (Berlese, 1916). – Lee, 1970: 94.
1.3.2.1: Diagnosis. All individuals of S. rarior collected are deutonymphs, are morphologically
identical, and correspond to Kethley’s (1983) descriptions. However, there were a few
discrepancies between Kethley’s (1983) illustrations and diagnosis of S. rarior deutonymphs,
and they are clarified here. All dorsal setae are very short except for s4, Z3, and Z5, which are
substantially longer (more than five times) in length. The fixed digit (not the movable digit) of
the chelicera has an elongate, distal hyaline process and is longer in length than the movable
digit.
1.3.2.2: DNA processing. Extracted genomic DNA from the S. rarior specimen MIT00091-4
was used to amplify and sequence the entire mitochondrial genome (GenBank accession number
GQ927176). This mite was associated with a millipede of the genus Apheloria (SPC001176)
from the Appalachian mountains of Tennessee. After both restriction enzyme digestions were
completed and selected DNA fragments were cloned and sequenced, DNA sequences were
assembled into 13 contigs in Sequencher 4.8. These contigs contained partial sequences of all
the 13 protein-coding genes and the 2 ribosomal RNA genes normally present within a
mitochondrial genome. Fourteen pairs of primers (Table 1.1) were designed to obtain DNA
sequences from the missing regions between these 13 DNA fragments.

13
Table 1.1: Primer pairs and their locations.
Name Primer Sequence Location
Mit162R 5’-CTGTCAAATTAAACCCTCCAGC-3’ nad1 Mit289L 5’- GAAGATAATTCTTGCTCTAGATTGAAA-3' nad2 Mit289R2 5’-CCAATTTACTTTTGACTTCCTCAAATA-3' nad2 Mit194L2 5’-TTAGGGGATAACTAATACGGAGATAAA-3' nad2 Mit194R2 5’-TTTATAGTAATACCAGCCATAATTGGG-3' cox1 Mit160L2 5’-ATCTAATTCCTGCTAAGTGAAGTCTAA-3' cox1 Mit160R 5’-CGACACCCCTATTCTTTGATCT-3' cox1 Mit247L 5’-TATCGCCGAGGTATTCCTCTTA-3' cox1 Mit247R 5’-AAACAAAACAAACTTTATATCAACCA-3' atp8 Mit191L 5’-AGAAATTAATAGGTGGCCAGCA-3' atp6 Mit191R 5’-TTCGACTTGGCTCTTGAATACA-3' nad3 Mit291L 5’-GGAGTGTAAATTCAATCACGGA-3' nad5 Mit291R 5’-CTCTTAAAAATGGAAACCCCG-3' nad5 Mit199L 5’-GGTAGAATGTGGGGTTGGATAG-3' nad4 Mit291R2 5’-CATCAAACACCCAAATAAAATAACC-3' nad5 Mit199L2 5’-GTTAGCTGCAAATTTTGAGAGTGAT-3' nad4 Mit199R 5’-ATTACCCAATCCTCCCCATAAT-3' nad4 Mit209L 5’-GGTTATTATGGGTTAGTGGGGTG-3' cob Mit209R 5’-TTACCTTCATATCGGTCGAGGT-3' cob Mit175L 5’-AACAGCGAGTACAAAAGGAAGG-3' cob Mit175R 5’-CTAACACCCCTCCTCAAGAACA-3' cob Mit16SL 5’-AATAGTTTGCGACCTCGATGTT-3' 16S Mit16SR 5’-TCCATTCTCTTAGCACCCAATT-3' 16S Mit303L 5’-ATCAGGGGGCTTCAATAAAATT-3' 16S Mit303R 5’-CAATTATTCATGAGAGCGACGG-3' 16S Mit12SL 5’-TTTGGCGGTATTTCAATCTTTT-3' 12S Mit12SR2 5’-AACCTTAAAAACAAAACTAAAACTGCC-3' 12S MitND1L 5’-GGTAGTAATTTTAGCTGAAACAAATCG-3' nad1

14
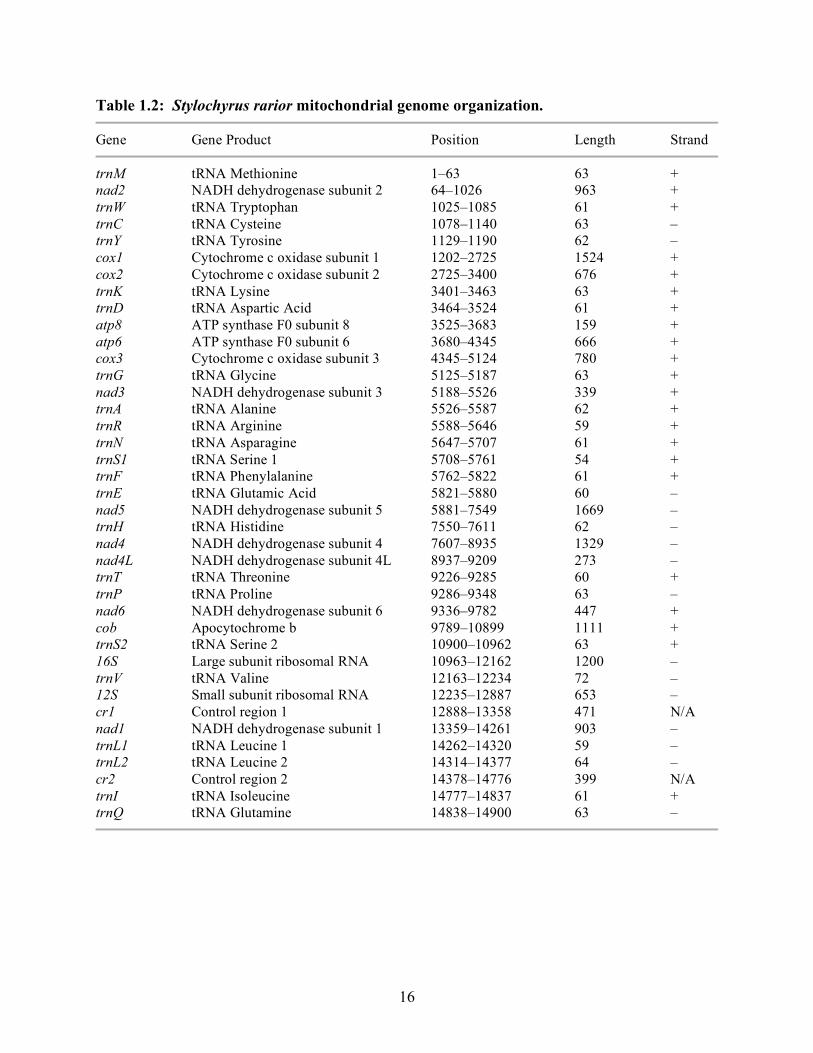
1.3.2.3: Genome organization. The mitochondrial genome of Stylochyrus rarior is circular,
consists of 14,900 nucleotides, and contains 13 protein-coding genes, 22 tRNA genes, 2 rRNA
genes, and 2 non-coding control regions (Figure 1.2, Table 1.2). Genes are encoded on both
DNA strands (Table 1.2) as in other arthropods. The nucleotide composition of this
mitochondrial genome consists of 38.3% adenine, 34.4% thymine, 17.8% cytosine, and 9.5%
guanine. Approximately 72% of this entire mitochondrial genome sequence codes for proteins.
Only 18 tRNA genes were identified and located by the program tRNAscan-SE. The other 4
(trnL2, trnC, trnR, trnS1) were located by comparison to known tRNA sequences of other
arthropods and by determining their appropriate anticodons. There are 2 trnL genes and 2 trnS
genes present. Several of the genes of the mitochondrial genome have short overlapping regions
between them (Table 2).
The order of genes in the mitochondrion of S. rarior differs from the assumed ancestral
arthropod synteny of L. polyphemus. This gene arrangement is also novel among acarines due to
the placement of the protein-coding gene nad1, which is located between 12S and nad2 (tRNAs
and control regions excluded). When compared to L. polyphemus, the positions of the transfer
RNA genes trnF and trnE are swapped in S. rarior. The following two regions have also been
transposed: 16S–trnV–12S and nad1–trnL1–trnL2. There are two non-coding control regions,
one on each side of the nad1–trnL1–trnL2 region.

15
Figure 1.2: Mitochondrial genome map for Stylochyrus rarior.
16
Table 1.2: Stylochyrus rarior mitochondrial genome organization.
Gene Gene Product Position Length Strand
trnM tRNA Methionine 1–63 63 + nad2 NADH dehydrogenase subunit 2 64–1026 963 + trnW tRNA Tryptophan 1025–1085 61 + trnC tRNA Cysteine 1078–1140 63 – trnY tRNA Tyrosine 1129–1190 62 – cox1 Cytochrome c oxidase subunit 1 1202–2725 1524 + cox2 Cytochrome c oxidase subunit 2 2725–3400 676 + trnK tRNA Lysine 3401–3463 63 + trnD tRNA Aspartic Acid 3464–3524 61 + atp8 ATP synthase F0 subunit 8 3525–3683 159 + atp6 ATP synthase F0 subunit 6 3680–4345 666 + cox3 Cytochrome c oxidase subunit 3 4345–5124 780 + trnG tRNA Glycine 5125–5187 63 + nad3 NADH dehydrogenase subunit 3 5188–5526 339 + trnA tRNA Alanine 5526–5587 62 + trnR tRNA Arginine 5588–5646 59 + trnN tRNA Asparagine 5647–5707 61 + trnS1 tRNA Serine 1 5708–5761 54 + trnF tRNA Phenylalanine 5762–5822 61 + trnE tRNA Glutamic Acid 5821–5880 60 – nad5 NADH dehydrogenase subunit 5 5881–7549 1669 – trnH tRNA Histidine 7550–7611 62 – nad4 NADH dehydrogenase subunit 4 7607–8935 1329 – nad4L NADH dehydrogenase subunit 4L 8937–9209 273 – trnT tRNA Threonine 9226–9285 60 + trnP tRNA Proline 9286–9348 63 – nad6 NADH dehydrogenase subunit 6 9336–9782 447 + cob Apocytochrome b 9789–10899 1111 + trnS2 tRNA Serine 2 10900–10962 63 + 16S Large subunit ribosomal RNA 10963–12162 1200 – trnV tRNA Valine 12163–12234 72 – 12S Small subunit ribosomal RNA 12235–12887 653 – cr1 Control region 1 12888–13358 471 N/A nad1 NADH dehydrogenase subunit 1 13359–14261 903 – trnL1 tRNA Leucine 1 14262–14320 59 – trnL2 tRNA Leucine 2 14314–14377 64 – cr2 Control region 2 14378–14776 399 N/A trnI tRNA Isoleucine 14777–14837 61 + trnQ tRNA Glutamine 14838–14900 63 –

17
1.4: Conclusions
Stylochyrus rarior appears to be considerably more common among the xystodesmid millipede
species than other mite taxa. This is one of the reasons why S. rarior was chosen for further
study and use in a future coevolutionary analysis. It is also large in size and soft-bodied, which
allows for easier DNA extractions. S. rarior is the first ologamasid and the first rhodacaroid
mite to have its entire mitochondrial genome sequenced. This genome contains all 37 genes that
are typical of the animal mitochondrion, and it also contains two non-coding regions. The
mitochondrial gene order of S. rarior is different from the ancestral arthropod arrangement and is
unique among the acarines. Acarine mitochondrial genomes often have gene rearrangements,
but it is unclear whether these gene order differences have any phylogenetic significance because
very few mitochondrial genomes of mites and ticks have been completely sequenced. S. rarior
is only the third mesostigmatid mite for which the whole mitochondrial DNA sequence is
known, and it may help to improve the understanding of acarine evolution.
There still remains much to learn about the ecology of phoretic mites and their millipede
carriers. Phoresy could be beneficial to millipede-mites in ways other than just enhanced
dispersal. For example, xystodesmid millipedes do not typically get eaten because they produce
a hydrogen cyanide defense secretion (Marek and Bond, 2006). Perhaps the symbiotic mites of
xystodesmid millipedes could also be protected from predation; it is unknown if phoretic mites
are resistant to these cyanide secretions. Another uncertainty is how the millipedes respond to
the association with their mite commensals; that is, do they benefit by the relationship, is there a
cost, or is the association neutral?

CHAPTER 2: TESTING FOR MILLIPEDE-MITE CODIVERGENCE
2.1: Introduction
Coevolution is a fascinating evolutionary process that has interested biologists for decades. First
coined by Ehrlich and Raven (1964), the term coevolution was only later explicitly defined by
Janzen (1980) as the process in which two populations undergo evolutionary changes in response
to one another. Lincoln et al. (1982) expanded upon this definition to further clarify that
coevolution is the interdependent evolution of two or more ecologically related taxa.
Coevolution usually occurs among taxa that have been closely associated for a long period of
time (Ronquist, 1997).
Most commonly observed in organisms involved in symbiotic relationships (mutualism,
commensalism, and parasitism), coevolution is thought to include five different types of
processes: duplication, failure to speciate, sorting, host switching, and cospeciation. Duplication
is a coevolutionary process in which one organism (the symbiont) speciates while the other
organism (the host) does not (Johnson and Clayton, 2004). One host species will possess several
symbiont species after a duplication event. The reverse of duplication is failure to speciate, a
situation when a host speciates but its symbiont does not (Johnson and Clayton, 2004). In this
scenario, one symbiont species may be found on several host species. Sorting occurs when a
symbiont species becomes extinct or is lost from a host population such that a host species no
longer has an associate (Johnson and Clayton, 2004). A host switch occurs when a symbiont
species moves from one host species to another and can be categorized as either incomplete or
complete. Incomplete host switches occur when individuals of one symbiont species associated
with a single host species colonize a different host species (Johnson and Clayton, 2004). The
symbiont species can then be found on two host species, or it can eventually be lost from the

19
original host species. Incomplete host switching does not involve speciation; however, complete
host switching is usually associated with speciation. A complete host switch involves the
duplication of a symbiont species on one host species followed by the shift of one of the
symbiont species to a new host species (Ronquist, 1997; Charleston, 1998).
Finally, cospeciation is reciprocal speciation that is induced by a very close interaction
between two species (Thompson, 1986) wherein hosts and their symbionts speciate
simultaneously. The following three rules of cospeciation have been developed:
1. Farenholz’s Rule (1913) states that phylogenetic trees of hosts and their
symbionts tend to have identical topologies, indicating that cospeciation has
occurred.
2. Szidat’s Rule (1940) states that primitive hosts will have primitive symbionts,
implying that derived hosts will possess derived symbionts.
3. Eichler’s Rule (1942) states that a host taxon with many species will have a
larger diversity of symbiont species than a host taxon with fewer species. In
other words, the more host species there are, the more symbiont species
expected.
Although it is often easier to define the five coevolutionary events in terms of species and
speciation, any of these events may involve divergences occurring at levels other than species.
The term codivergence is often used in place of cospeciation when the products of divergence
are taxa other than species; therefore, cospeciation can be viewed as a particular type of
codivergence (Light and Hafner, 2008). Among coevolving taxa, there are two categories of
codivergence: strict and widespread. Strict codivergence occurs when there is a one to one ratio
of host to symbiont taxa and the only events that explain their patterns of evolutionary history are

20
codivergences. Widespread codivergence among host and symbiont phylogenies occurs when
codivergences are the most common events but not the only events that explain the observed
associations. Although widespread codivergence among associated taxa is rarely found in
nature, it is still much more common than strict codivergence (Hafner and Nadler, 1990).
Host and parasite associations are often the focus of widespread codivergence studies.
Parasites, those organisms that have detrimental effects on their hosts, are often so intimately
associated with their hosts that they may be very specialized and may only survive on one or a
few host species (Thompson, 1994). However, coevolution can occur in other types of symbiotic
relationships as well. This includes mutualism, in which both the host and the symbiont benefit,
and commensalism, in which the symbiont benefits while the host is not affected.
Mites are known to develop symbiotic relationships with many groups of animals
including fish, amphibians, reptiles, birds, mammals, and some invertebrates, such as mollusks
and arthropods (Fain, 1994). Both parasitic and commensal associations can be formed between
mites and other arthropods (Hunter and Rosario, 1988). Mites have the ability to adapt to many
types of habitats and lifestyles and occupy an extraordinarily wide range of parasitic niches
(Fain, 1994). Therefore, mites are some of the most suitable organisms in which to study
coevolution, especially if they are parasites (Fain, 1994).
There are over fifteen known families (and three orders) of mites that form associations
with myriapod taxa, and yet very little research has been done on millipede-mite associations
(Gerdeman et al., 2000). Depending on the species of millipedes and mites, the type of
symbiotic relationship may vary from commensalism to obligate parasitism (Gerdeman et al.,
2000). Phoretic mites have been found on millipedes in Indonesia (Evans and Sheals, 1959), and
other commensal millipede-mites have been reported from Africa (Tragardh, 1907). Most

21
millipede-mite studies conducted focus only on mites and usually comprise the description of
new mite species, largely ignoring the millipedes that harbor them. That is, most studies simply
report that mites are found living on millipedes, and there tends to be little or no information
about the millipede or the nature of the putative symbiotic relationship. With few exceptions,
such as Narceus Rafinesque, 1820 and Tylobolus Cook, 1904 (Kethley, 1978; Gerdeman et al.,
2000; Gerdeman and Klompen, 2003), the majority of millipede-mite studies have not been
carried out in North America.
Myriapodologists have often speculated that millipedes and their associated mites are
coevolving; however, this has never been tested. Kethley (1978) determined that three species in
the millipede genus Narceus each harbor a different species of the mite genus Narceolaelaps
Kethley 1978. The presence of one symbiont species on each host species raises the possibility
of cospeciation between Narceus and Narceolaelaps. In another example, the mite family
Heterozerconidae consists largely of species that live only on millipedes, indicating a very close
symbiotic link between the heterozerconids and their hosts. These two mite taxa (the genus
Narceolaelaps and the family Heterozerconidae) would be an ideal place to look for evidence of
millipede-mite coevolution. However, the status of the genus Narceus, including how many
species it comprises, is currently unclear (Walker et al., 2009) making it a difficult group to
evaluate. Also, while there are not very many species of heterozerconid mites and their host
millipedes, they are geographically widespread. An attempt to analyze this group would be
costly and time consuming.
The focus of this study is on the millipede genus Appalachioria Marek and Bond 2006
(Polydesmida: Xystodesmidae), which has a manageable distribution and clearly defined species
(and subspecies). Currently, there are four nominal species (two with supspecies) recognized: A.

22
eutypa eutypa Chamberlin, 1939); A. eutypa ethotela (Chamberlin, 1942); A. falcifera (Keeton,
1959); A. separanda calcaria (Keeton, 1959); A. separanda hamata (Keeton, 1959); A.
separanda separanda (Chamberlin, 1947); A. separanda versicolor (Hoffman, 1963); and A.
turneri (Keeton, 1959). Additionally, there are two undescribed species (Marek and Bond, 2006,
2007). These millipedes live in moist leaf litter from broadleaf forests in the eastern United
States, and like most millipedes, are important decomposers (Marek and Bond, 2006). They are
not very vagile and tend to live in isolated populations within mountainous regions (Marek and
Bond, 2006); these two conditions are ripe for coevolution. Commonly found associated with
individuals of Appalachioria, the mite genus Stylochyrus Canestrini and Canestrini, 1882
(Mesostigmata: Ologamasidae) will be the focal mite of this study. Mites in the genus
Stylochyrus are soft-bodied and relatively large in size, making them easier with which to work.
The goal of this study is to test the hypothesis that mites of the genus Stylochyrus and their
associated xystodesmid millipedes, specifically those in the genus Appalachioria, have
codiverged.
2.2: Methods
2.2.1: Sampling and Collecting
Xystodesmid millipedes and their associated mites were collected in the broadleaf forests of
Kentucky, North Carolina, Tennessee, and Virginia. The methods used for collecting and
transporting live specimens and for identifying mites and millipedes are described in Chapter 1
(Swafford and Bond, 2009). Several xystodesmid genera have overlapping ranges (Marek and
Bond, 2006). Therefore, when possible, millipede specimens belonging to different species and
genera were collected at a single locality. In addition, multiple specimens of a single millipede

23
species were collected in the same area when possible. This allowed for the comparison of
individual mites from several millipede species occurring in the same locality and the
comparison of individual mites from a single millipede species. This thoroughness permitted us
to ascertain if the observed patterns of millipede and mite associations are due to coevolutionary
interactions or simply geography.
2.2.2: Molecular Protocols
When compared with nuclear DNA, mitochondrial DNA (mtDNA) has a much lower rate of
recombination, a simpler genetic structure, and faster rates of evolution (Rubinoff and Holland,
2005). These features render mtDNA appropriate to use when studying the evolutionary
relationships of closely related taxa (genus-level and below). A primer set for one mitochondrial
region including portions of the large subunit ribosomal RNA (16S), the transfer RNA Valine
(trnV), and the small subunit ribosomal RNA (12S) has already been developed for xystodesmid
millipedes (Marek and Bond, 2006). According to Light and Hafner (2008), coevolutionary
analyses that compare the same DNA regions in host and symbiont taxa are much more
informative than those that use different genes. Also more types of coevolutionary analyses can
be attempted when the same gene regions have been sequenced for both hosts and symbionts.
For example, tree-based coevolutionary methods can be used on any host-symbiont system for
which phylogenies are available, while distance-based methods can only be used when the same
DNA region is available for both hosts and symbionts (Light and Hafner, 2008). Using the same
gene also allows branch lengths of the host and symbiont gene trees to be compared, which can
test if rates of molecular evolution are identical in the hosts and symbionts and if cospeciation
events occurred simultaneously (Light and Hafner, 2008). For these reasons, only mtDNA

24
sequences were used for the phylogenetic and coevolutionary analyses in this study. For each
xystodesmid millipede and Stylochyrus specimen, two mitochondrial regions were amplified and
sequenced. The two regions chosen were the 16S/12S region described earlier and a portion of
the protein coding gene Cytochrome c oxidase subunit 1 (cox1). By sequencing the
mitochondrial 16S/12S and cox1 regions for both the millipedes and mites collected for this
study, the actual relationships between individual hosts and symbionts can be examined.
2.2.2.1: Primer design. All primers used in this study are listed in Table 2.1. The three
millipede primers (LR-J-12887dip2, LR-J-APHE1, and SR-N-145XXdip2) for the 16S/12S
mitochondrial region were taken from Marek and Bond (2006). All other primers were designed
specifically for this study. Using the complete mitochondrial genome sequence of Stylochyrus
rarior (Berlese, 1916) (Swafford and Bond, 2009), the two end primers (Mit16S_mite and
Mit12SL) for the 16S/12S region of the mites were designed to encompass approximately the
same region as the millipede 16S/12S primers. The three internal primers (LR-J-MIT, LR-J-
MIT2, and SR-N-MIT) for this region were designed in conserved regions after individuals of
Stylochyrus were sequenced with just the end 16S/12S primers. Primers for the cox1 region of
the mites (HCO2198_mit and LCO1490_mit) were created from the S. rarior mitochondrial
genome sequence in the same places as the universal barcoding primers HCO2198 and LCO1490
(Folmer et al., 1994). The two cox1 primers for the millipedes (HCO2198_APP and
LCO1490_APP) were designed in the same manner using the complete mitochondrial genome
sequence of Appalachioria falcifera (Brewer et al., in preparation).

25
Table 2.1: Mite and millipede primers.
Name Sequence Location Purpose
Mit16S_mite AAATTAAAATAAGGGGTCCTTTCG 16S Amp, Seq Mit12SL TTTGGCGGTATTTCAATCTTTT 12S Amp, Seq LR-J-MIT TCCATTCTCTTAGCACCCAATT 16S Seq LR-J-MIT2 GATTCATAGGGTCTTCTTGTCCCACT 16S Seq SR-N-MIT GTACATATCGCCCGTCGCTCTCATG 12S Seq HCO2198_mit TGAAGTTACGGTCAGTTAGGAGTATA cox1 Amp, Seq LCO1490_mit TTTCTACTAATCACAAAGATATTGG cox1 Amp, Seq LR-J-12887_dip2 CCGGTCTGAACTCAGATCATGT 16S Amp, Seq SR-N-145XX_dip2 GGACGTCAAGTCAAGGTGCAG 12S Amp, Seq LR-J-APHE1 GTTTCACCTTCATACCAGC 16S Seq HCO2198_APP TAAACCTCCGGGTGACCAAAAAACCA cox1 Amp, Seq LCO1490_APP ACTCTACTAATCATAAGGATATTGG cox1 Amp, Seq
The Purpose column indicates which primers were used for amplifications (Amp) and which ones were used for sequencing (Seq).
2.2.2.2: Millipede extraction and amplification. Genomic DNA was extracted from 3-5 legs
from each millipede using the Qiagen DNeasy Tissue Kit (Qiagen Inc., Valencia, CA). The
mitochondrial 16S/12S region was amplified using the polymerase chain reaction (PCR) and the
primers LR-J-12887dip2 and SR-N-145XXdip2 from Marek and Bond (2006). For each
extraction, either a 50 µL or a 25 µL reaction was prepared. The following PCR mixture was
used for a 50 µL reaction: 26.75 µL ultra pure water, 5 µL 2.5mM dNTP mixture, 5 µL 10X Taq
buffer, 5µL of each 2.5 µM or 10 µM primer, 1 µL dimethyl sulfoxide (DMSO), 1 µL bovine
serum albumin (BSA), 0.25µL Ex Taq DNA polymerase, and 1 µL genomic DNA. The
following PCR mixture was used for a 25 µL reaction: 12.785 µL ultra pure water, 2.5 µL
2.5mM dNTP mixture, 2.5 µL 10X Taq buffer, 2.5µL of each 2.5 µM or 10 µM primer, 0.5 µL
DMSO, 0.5 µL BSA, 0.125µL Ex Taq DNA polymerase, and 1 µL genomic DNA. For all
reactions, the following thermal cycle parameters were used: initial denaturation at 95˚C for 2
min; 30 cycles of denaturation at 94˚C for 30 sec, annealing at 52˚C for 30 sec, and extension at
72˚C for 2 min; and final extension at 72˚C for 2 min. Using the extracted DNA, the cox1 region

26
was also amplified and sequenced using the primers HCO2198_APP and LCO1490_APP. For
each extraction, a 25 µL reaction was prepared using the following PCR cocktail: 13.375 µL
ultra pure water, 2.5 µL 2.5mM dNTP mixture, 2.5 µL 10X Taq buffer, 2.5µL of each 2.5 µM or
10 µM primer, 0.5 µL DMSO, 0.125µL Ex Taq DNA polymerase, and 1 µL genomic DNA. The
following thermal cycle parameters were used: initial denaturation at 95˚C for 2 min; 30 cycles
of denaturation at 94˚C for 1 min, annealing at 49˚C for 1 min, and extension at 72˚C for 1 min;
and final extension at 72˚C for 2 min.
2.2.2.3: Mite extraction and amplification. A DNeasy Kit and the modified protocol
described in Swafford and Bond (2009) was used to extract DNA from entire mites. The
mitochondrial 16S/12S region was amplified using the primers Mit16S_mite and Mit12SL and
either a 50 µL or a 25 µL PCR reaction mixture. The following PCR mixture was used for a 50
µL reaction: 25.75 µL ultra pure water, 5 µL 2.5mM dNTP mixture, 5 µL 10X Taq buffer, 5µL
of each 2.5 µM or 10 µM primer, 1 µL DMSO, 1 µL BSA, 0.25µL Ex Taq DNA polymerase,
and 2 µL genomic DNA. The following PCR mixture was used for a 25 µL reaction: 12.875 µL
ultra pure water, 2.5 µL 2.5mM dNTP mixture, 2.5 µL 10X Taq buffer, 2.5µL of each 2.5 µM or
10 µM primer, 0.5 µL DMSO, 0.5 µL BSA, 0.125µL Ex Taq DNA polymerase, and 1 µL
genomic DNA. The following thermal cycle parameters were used: initial denaturation at 95˚C
for 2 min; 30 cycles of denaturation at 94˚C for 1 min, annealing at 50˚C for 1 min, and
extension at 72˚C for 2 min; and final extension at 72˚C for 2 min. The cox1 mitochondrial
region was also amplified for S. rarior using the primers HCO2198_mit and LCO1490_mit.
Either 50 µL or 25 µL PCR reaction mixtures were made comprising the same components and
amounts as in the mite 16S/12S mixtures. The following thermal cycle parameters were used:

27
initial denaturation at 95˚C for 2 min; 30 cycles of denaturation at 94˚C for 1 min, annealing at
48˚C for 1 min, and extension at 72˚C for 1 min; and final extension at 72˚C for 2 min.
2.2.2.4: Sequencing. The following purification and sequencing procedures were carried out
for both millipedes and mites and both gene regions. Excess dNTPs and primers were removed
from the PCR products using ExoSAP-IT (USB Corporation, Cleveland, OH). Direct
sequencing reactions were carried out using the amplification primers and internal primer sets
when necessary (Table 1). Sequencing consisted of a 10 µL sequencing reaction with the
following components: 4.35 µL ultra pure water, 2 µL 5X sequencing buffer, 1 µL BigDye
Terminator, 0.65 µL 2.5 µM or 10 µM primer, and 2 µL purified PCR product. The following
thermal cycle program was used: 26 cycles of 96°C for 10 sec, 50°C for 15 sec, and 60°C for 4
min. The products from the sequencing reactions were purified using a Sephadex (Sigma-
Aldrich, St. Louis, MO) procedure and were then rehydrated and loaded on an ABI 3130 Genetic
Analyzer. The sequences were viewed and edited in the program Sequencher 4.8 (Gene Codes,
Ann Arbor, MI).
2.2.3: Sequence Alignment and Phylogenetic Analysis
The resulting sequences were organized into six data matrices or datasets (Table 2.2). Datasets I,
II, and III comprise Stylochyrus sequences; Datasets IV, V, and VI comprise xystodesmid
millipede sequences. The variation in number of individuals in each dataset is the consequence
of individuals that do not have an associate (either mite or millipede) due to extraction,
amplification, or sequencing issues. These individuals were later removed from the
coevolutionary analyses. Table 2.3 gives a list of all millipede and mite specimens included in
28
the phylogenetic analyses. The DNA sequences within each dataset were aligned using the
program Muscle 3.6 (Edgar, 2004) and the default parameters (iterations and gap open cost
parameters). DNA sequences from the outgroup acarine taxon Ixodes holocyclus Neumann,
1899 (GenBank accession number AB075955) were added to Datasets I, II, and III before
alignment for help in rooting the reconstructed phylogenies. Obvious corrections to the
alignment were made in Mesquite 1.12 (Maddison and Maddison, 2006).
Table 2.2: Datasets of mitochondrial DNA sequences.
Dataset Taxon # Individuals Gene Region # Partitions Nucleotides
I Stylochyrus 68 16S/12S 3 1382 II Stylochyrus 71 cox1 1 483 III Stylochyrus 66 16S/12S + cox1 4 1855 IV Xystodesmidae 43 16S/12S 3 1298 V Xystodesmidae 41 cox1 1 510 VI Xystodesmidae 41 16S/12S + cox1 4 1808
Table 2.3: Millipede and mite specimens used in the phylogenetic analyses.
Millipede ID # Millipede Taxon Associated Mite ID #
SPC001176 Apheloria sp. MIT00091-1 Apheloria sp. MIT00091-4 SPC001177 Apheloria sp. MIT00092-1 Apheloria sp. MIT00092-41 SPC001192 Dixioria sp. MIT00138-1 SPC001193 Dixioria sp. MIT00139-1 SPC001205 Dixioria sp. MIT00144-1 SPC001223 Appalachioria turneri MIT00156-1 SPC001237 Brachoria hoffmani MIT00157-1 Brachoria hoffmani MIT00157-2 SPC001238 Brachoria hoffmani MIT00158-1 Brachoria hoffmani MIT00158-2 SPC001293 Apheloria sp. MIT00173-1 SPC001296 Apheloria sp. MIT00175-1 SPC001297 Apheloria sp. MIT00176-1 SPC001298 Appalachioria separanda calcaria MIT00177-1
29
Appalachioria separanda calcaria MIT00177-2 SPC001306 Brachoria dentata MIT00183-1 Brachoria dentata MIT00183-3 Brachoria dentata MIT00183-4 SPC001307 Pleuroloma flavipes MIT00184-1 SPC001308 Brachoria dentata MIT00185-1 SPC001310 Brachoria dentata MIT00187-22 Brachoria dentata MIT00187-3 SPC001311 Brachoria dentata MIT00188-1 Brachoria dentata MIT00188-3 Brachoria dentata MIT00188-4 Brachoria dentata MIT00188-5 SPC001317 Appalachioria falcifera MIT00190-1 Appalachioria falcifera MIT00190-2 Appalachioria falcifera MIT00190-3 SPC001318 Appalachioria falcifera MIT00191-1 Appalachioria falcifera MIT00191-2 SPC001319 Appalachioria falcifera MIT00192-1 SPC001322 Appalachioria falcifera MIT00193-1 Appalachioria falcifera MIT00193-2 Appalachioria falcifera MIT00193-3 Appalachioria falcifera MIT00193-4 Appalachioria falcifera MIT00193-5 Appalachioria falcifera MIT00193-7 SPC001323 Appalachioria falcifera MIT00194-1 Appalachioria falcifera MIT00194-2 Appalachioria falcifera MIT00194-4 SPC001324 Appalachioria separanda versicolor MIT00195-1 Appalachioria separanda versicolor MIT00195-2 SPC001325 Appalachioria separanda versicolor MIT00196-1 SPC001327 Appalachioria sp. MIT00197-1 SPC001333 Appalachioria separanda hamata MIT00199-1 SPC001334 Appalachioria separanda hamata MIT00200-1 SPC001335 Appalachioria separanda hamata MIT00201-12 SPC001336 Appalachioria eutypa ethotela MIT00202-11 SPC001337 Appalachioria eutypa ethotela MIT00203-1 Appalachioria eutypa ethotela MIT00203-2 SPC0013383 Nannaria sp. MIT00204-1 SPC001339 Appalachioria separanda hamata MIT00205-2 SPC001340 Appalachioria separanda hamata MIT00206-1 SPC001343 Brachoria sp. MIT00207-3 SPC001345 Brachoria sp. MIT00209-3 SPC0013461 Brachoria sp. MIT00210-12 SPC0013471 Brachoria sp. MIT00211-1 Brachoria sp. MIT00211-2 Brachoria sp. MIT00211-3

30
Brachoria sp. MIT00211-4 SPC001348 Brachoria dentata MIT00212-1 SPC001349 Brachoria dentata MIT00213-12 Brachoria dentata MIT00213-22 SPC001354 Dixioria sp. MIT00217-23 SPC001355 Brachoria mendota MIT00218-1 Brachoria mendota MIT00218-2 SPC001361 Prionogonus divergens MIT00221-1 SPC001362 Brachoria dentata MIT00222-1 Brachoria dentata MIT00222-2 Brachoria dentata MIT00222-3 SPC001364 Brachoria dentata MIT00224-1
The superscripts indicate which specimens could not be sequenced for both gene regions. A 1 means that only 16S/12S was sequenced, a 2 means that only cox1 was sequenced, and a 3 means that sequencing was not possible for that specimen. If no superscript is present, then it can be assumed that both 16S/12S and cox1 were successfully sequenced.
The aligned DNA sequences for each of the datasets (I – VI) were used to reconstruct
phylogenies using MrBayes 3.1 (Ronquist and Huelsenbeck, 2003). MrModeltest 2.3 (Nylander,
2004) was first used to find the appropriate DNA substitution models for each dataset using the
hierarchical likelihood ratio test (hLRT). The datasets that included more than one gene region
(I, III, IV, and VI) were partitioned, and each partition was separately analyzed by MrModeltest.
In MrBayes, two analyses of four Markov Chain Monte Carlo (MCMC) chains were
simultaneously run until they converged. Convergence was reached when the average standard
deviation of split frequencies fell below 0.01. Each analysis was run for at least 1,000,000
generations, and one tree was sampled every 100 generations. If convergence had not yet
occurred, then extra generations were added until the average standard deviation of split
frequencies did fall below 0.01. Plots of generations versus parameter values for the two runs
were viewed in Tracer 1.3 (Rambaut and Drummond, 2003) to help estimate burn-in. After
discarding the trees before burn-in, the parameter values and likelihood scores for all topologies
were averaged and a consensus tree containing posterior probabilities was produced. All

31
phylogenies were viewed and rooted in FigTree 1.2 (Rambaut, 2009). Stylochyrus trees were
rooted using the outgroup I. holocyclus. Xystodesmid trees were rooted with the non-apheloriine
xystodesmid Pleuroloma flavipes Rafinesque, 1820 because all the rest of the specimens
included in the analyses belong to the tribe Apheloriini. The reconstructed molecular
phylogenies and the data matrices of aligned DNA sequences from both the mites and millipedes
were used in the coevolutionary analysis.
2.2.4: Coevolutionary Analysis
To determine if coevolution has occurred between xystodesmid millipedes and Stylochyrus, two
methods were employed: a distance-based method and a tree-based method. These two methods
have their various benefits and drawbacks. Advantages of tree-based methods are that characters
of any kind (morphological, molecular, a combination of both, etc.) can be used to reconstruct
phylogenies and all coevolutionary processes are weighted and evaluated. However, analyses
using tree-based methods, can present a number of problems. For example, these methods
require that phylogenies are completely resolved, do not account for phylogenetic uncertainty,
and cannot account for symbionts associated with multiple hosts, and therefore, may
underestimate host switching (Hughes et al., 2007). According to De Vienne et al. (2007), it
may be better to avoid using only tree-based methods because they sometimes may predict a
cospeciation event between a host and symbiont when it did not really occur
(pseudocospeciation). For example, a host switch between closely related host species followed
by speciation of the symbiont could result in identical tree topologies of hosts and symbionts (De
Vienne et al., 2007). Alternatively, distance-based methods may be more accurate in estimating
the actual number of codivergence events. They do not require phylogenetic trees, and they can

32
handle situations in which there is not a one to one ratio of symbionts to hosts. However,
distance-based methods focus only on codivergence events and do not test for the presence of
other coevolutionary processes. Also, when performing distance-based coevolutionary analyses,
molecular data from the same (homologous) gene region in hosts and symbionts must be used.
Because both methods have their advantages and disadvantages, it is best to use both
types of coevolutionary analyses. However, according to the protocol for studying codivergence
suggested by Light and Hafner (2008), it is not necessary to construct phylogenies or even
attempt a tree-based method of analysis when a distance-based method concludes that there is a
random association between host and symbiont taxa. Because phylogenetic trees were produced
in this study and to ensure completeness, both distance-based and tree-based analyses were still
performed. Small subsets of data were initially used to test out these two approaches and
evaluate for significant coevolution. If codivergence was detected, then the analyses were
repeated with the full datasets and all gene regions. Computational analyses of coevolution were
evaluated using a number of various software packages, including those for both distance-based
and tree-based methods.
2.2.4.1: Distance-based method. The computer program ParaFit (Legendre et al., 2002) tests
for the presence of codivergence (or cospeciation) among hosts and their symbionts; it requires
the assembly of several data matrices and files. First, aligned sequences from host millipedes
and symbiotic mites were edited and ordered in Mesquite 1.12. A matrix (matrix A) of host and
symbiont associations was created, in which the number 1 was used to specify a host-symbiont
link, and 0 was used to indicate that a symbiont was not present on a host. Uncorrected pairwise
distances were calculated in PAUP* 4.0b10 (Swofford, 1998) for both millipede and mite

33
datasets. Principal coordinates were computed from these distance matrices using the program
DistPCoA (Legendre and Anderson, 1998). Principle coordinate values were corrected using
method 1 (Lingoes) in DistPCoA. The host principal coordinate matrix (matrix C) was
transposed so that ParaFit could analyze it, and the symbiont principal coordinate matrix (matrix
B) produced by DistPCoA was left unmodified. The ParaFit analysis creates a fourth matrix,
randomizes host-symbiont associations a total of 9999 times, and compares these permutations to
the observed data. To determine if there is significant widespread codivergence, the
ParaFitGlobal (PFGlobal) statistic was calculated. By removing individual host-symbiont links
one at a time, ParaFit was also used to test how likely it is that a particular association is due to a
codivergence event. The PFGlobal statistic should decrease if an association that contributes
greatly to the overall host-symbiont relationship is removed. If a removal increases the global
test statistic or does not affect it, then that individual association cannot be due to a codivergence
event. The values of the two statistics ParaFitLink1 (PFLink1) and ParaFitLink2 (PFLink2)
were calculated.
The procedure described above was carried out with six different subsets of the
aforementioned datasets. Table 2.4 lists the species of millipede host, the specimen numbers of
the hosts and symbionts, and the genes used in the six analyses. Four of these analyses were
done using only the 16S/12S dataset. One analysis used only information from the cox1 region,
and one analysis combined the 16S/12S and cox1 datasets. The 16S/12S DNA region is not
protein coding and is more variable between individuals than the cox1 protein-coding region. It
was therefore used in the majority of the ParaFit analyses. Table 3 also includes the number of
host-symbiont associations or links (H-S) used in each analysis.
34
2.2.4.2: Tree-based method. TreeMap (Page, 1994; Charleston, 1998) determines which
coevolutionary events best explain the associations between hosts and symbionts. The algorithm
assigns costs to four coevolutionary processes (duplication, complete host switching, lineage
sorting, and codivergence) and uses a jungle method to show all possible ways that a symbiont
phylogeny can be mapped onto a host phylogeny; then it chooses the route that minimizes the
overall cost of these events. TreeMap also includes a test of significance that determines if the
host and symbiont trees are identical as a consequence of random chance. The symbiont tree is
randomized 100 times, and then it is determined how many of these trees fit the suggested
numbers and types of coevolutionary events of a reconstruction as well as the original symbiont
tree.
The input for TreeMap consists of a tanglegram text file. A tanglegram includes both the
host and symbiont phylogenies and the individual host-symbiont associations. The analyses
completed in TreeMap 2.0 (Table 2.4) consisted of building a jungle, determining the best
reconstruction of events, and significance testing. The default event costs were used and are as
follows: codivergence = 0, duplication = 2, lineage sorting (loss of symbiont) = 1, and complete
host switching = 1. The default parameters for jungle making and significance testing were also
used. All analyses used molecular phylogenies produced from the 16S/12S gene region only. To
make the associations in the tanglegrams easier to visualize and read, TreeMap 3.0b was used to
untangle the tanglegrams. By performing a heuristic search to find the least number of
tanglegram links that cross, nodes of the symbiont or host tree were rotated (without changing
their topologies) to minimize these crossings.

35
Table 2.4: Coevolutionary analyses performed in ParaFit and TreeMap.
Analysis ID H-S Gene Host Species Host ID Associated Symbiont ID
PF6_16S 6 16S/12S Apheloria sp. SPC001176 MIT00091-1 Appalachioria eutypa ethotela SPC001336 MIT00202-1 Brachoria mendota SPC001355 MIT00218-2 Dixioria sp. SPC001205 MIT00144-1 Pleuroloma flavipes SPC001307 MIT00184-1 Prionogonus divergens SPC001361 MIT00221-1 TM6_16S 6 16S/12S Used the same host and symbiont specimens as PF6_16S PF7AB_16S 8 16S/12S Appalachioria eutypa ethotela SPC001336 MIT00202-1 Appalachioria falcifera SPC001319 MIT00192-1 Appalachioria separanda calcaria SPC001298 MIT00177-1, MIT00177-2 Appalachioria separanda hamata SPC001334 MIT00200-1
Appalachioria separanda versicolor SPC001325 MIT00196-1
Appalachioria sp. SPC001327 MIT00197-1 Appalachioria turneri SPC001223 MIT00156-1 TM7A_16S 7 16S/12S Used the same host and symbiont specimens as PF7AB_16S, excluding MIT00177-2 TM7B_16S 7 16S/12S Used the same host and symbiont specimens as PF7AB_16S, excluding MIT00177-1 PF7CD_16S 8 16S/12S Appalachioria eutypa ethotela SPC001336 MIT00202-1 Appalachioria falcifera SPC001319 MIT00192-1 Appalachioria separanda calcaria SPC001298 MIT00177-1, MIT00177-2 Appalachioria separanda hamata SPC001339 MIT00205-2
Appalachioria separanda versicolor SPC001325 MIT00196-1
Appalachioria sp. SPC001327 MIT00197-1 Appalachioria turneri SPC001223 MIT00156-1 TM7C_16S 7 16S/12S Used the same host and symbiont specimens as PF7CD_16S, excluding MIT00177-2 TM7D_16S 7 16S/12S Used the same host and symbiont specimens as PF7CD_16S, excluding MIT00177-1 PF12_16S 12 16S/12S Appalachioria eutypa ethotela SPC001336 MIT00202-1 Appalachioria falcifera SPC001318 MIT00191-1 Appalachioria falcifera SPC001319 MIT00192-1 Appalachioria falcifera SPC001322 MIT00193-1 Appalachioria falcifera SPC001323 MIT00194-1 Appalachioria separanda calcaria SPC001298 MIT00177-1 Appalachioria separanda hamata SPC001334 MIT00200-1 Appalachioria separanda hamata SPC001339 MIT00205-2 Appalachioria separanda hamata SPC001340 MIT00206-1
Appalachioria separanda versicolor SPC001325 MIT00196-1
Appalachioria sp. SPC001327 MIT00197-1 Appalachioria turneri SPC001223 MIT00156-1 TM12_16S 12 16S/12S Used the same host and symbiont specimens as PF12_16S

36
PF7AB_cox1 8 cox1 Appalachioria eutypa ethotela SPC001337 MIT00203-1 Appalachioria falcifera SPC001319 MIT00192-1 Appalachioria separanda calcaria SPC001298 MIT00177-1, MIT00177-2 Appalachioria separanda hamata SPC001334 MIT00200-1
Appalachioria separanda versicolor SPC001325 MIT00196-1
Appalachioria sp. SPC001327 MIT00197-1 Appalachioria turneri SPC001223 MIT00156-1 PF7AB_16Scox1 8 16S/12S+cox1 Used the same host and symbiont specimens as PF7AB_cox1
The column H-S indicates the number of host-symbiont links. All symbionts are individuals belonging to the mite species Stylochyrus rarior.
2.3: Results
2.3.1: Xystodesmid Millipede Sampling
Individuals of the following xystodesmid genera were associated with Stylochyrus rarior and
were successfully collected: Apheloria Chamberlin, 1921, Appalachioria, Brachoria
Chamberlin, 1939, Dixioria Chamberlin, 1947, Pleuroloma Rafinesque, 1820, and Prionogonus
Shelley, 1982. This also includes the following species and subspecies of Appalachioria: A.
eutypa ethotela, A. falcifera, A. separanda calcaria, A. separanda hamata, A. separanda
versicolor, A. turneri, and one undescribed species. See Swafford and Bond (2009) and their
accompanying online accessory material for specific millipede-mite associations and geographic
data.
2.3.2: Sequence Alignment and Phylogenetic Analysis
Among the Stylochyrus datasets (I, II, and III) and the xystodesmid datasets (IV, V, and VI), the
16S/12S regions were found to be more variable than the cox1 regions. The number of variable
characters for each of the datasets are as follows: I: 213, II: 79, III: 229, IV: 349, V: 140, VI:
489. The substitution models inferred under the hLRT for each gene region from Stylochyrus are

37
HKY+I+G (16S), HKY (trnV), HKY+G (12S), and HKY+I+G (cox1). The models chosen for
the xystodesmids are GTR+I+G (16S), HKY (trnV), HKY+I+G (12S), and GTR+I+G (cox1).
The total generations run in MrBayes, number of trees discarded as burn-in, and average
likelihood values are given for each dataset in Table 2.5. After 8 million generations, the two
runs of Dataset II were nowhere near converging, so the analysis was discontinued.
Consequently, only five of the six data sets were used to reconstruct phylogenies for this study
(Figures 2.1 to 2.5). The thickened black branches indicate posterior probabilities equal to 1.0,
while the thickened gray branches denote posterior probabilities between 0.90 and 0.99. The two
Stylochyrus phylogenies (Figure 2.1 and 2.2) differ in topology, and the majority of the posterior
probabilities are very low (less than 0.90). Geographic data (county and state) are listed for each
S. rarior specimen included in the phylogenies. The three xystodesmid phylogenies (Figures 2.3
to 2.5) differ slightly in topology, and most nodes are well supported (posterior probability
greater than 0.90).
Table 2.5: Results from the phylogenetic analyses in MrBayes.
Dataset Generations Trees Discarded Mean Likelihood Values (Burn-in) Arithmetic Harmonic
I 4,005,000 5000 -4694.23 -4777.36 II 8,000,000 N/A N/A N/A III 5,673,800 5000 -6237.19 -6323.88 IV 4,000,000 5000 -5093.38 -5155.68 V 2,000,000 2500 -2577.88 -2628.41 VI 1,060,000 2500 -7673.68 -7725.5
There are no results for Dataset II because the MrBayes runs would not converge.

38
Figure 2.1: Stylochyrus rarior 16S/12S phylogeny. Phylogeny reconstructed using Bayesian inference for Dataset I (Stylochyrus 16S/12S data). The outgroup Ixodes holocyclus branch is abbreviated for ease of illustration (actual branch length is 0.9974).

39
Figure 2.2: Stylochyrus rarior 16S/12S + cox1 phylogeny. Phylogeny reconstructed using Bayesian inference for Dataset III (Stylochyrus 16S/12S + cox1 data). The outgroup Ixodes holocyclus branch is abbreviated for ease of illustration (actual branch length is 1.5830).

40
Figure 2.3: Xystodesmid 16S/12S phylogeny. Phylogeny reconstructed using Bayesian inference for Dataset IV (xystodesmid 16S/12S data). The outgroup Pleuroloma flavipes branch is abbreviated for ease of illustration (actual branch length is 0.18102).

41
Figure 2.4: Xystodesmid cox1 phylogeny. Phylogeny reconstructed using Bayesian inference for Dataset V (xystodesmid cox1 data).

42
Figure 2.5: Xystodesmid 16S/12S + cox1 phylogeny. Phylogeny reconstructed using Bayesian inference for the xystodesmid 16S/12S + cox1 dataset (Dataset VI). The outgroup Pleuroloma flavipes branch is abbreviated for ease of illustration (actual branch length is 0.19799).

43
2.3.3: Coevolutionary Analysis
The data generally showed no pattern of codivergence among the millipede and mite lineages.
All six ParaFit analyses had a PFGlobal statistic equal to zero, and all P-values were greater than
0.05; thus none of the analyses found any significant codivergence. All PFLink1 statistics had a
value of zero. The values of PFLink2 were 0.13 and below (some even had negative values).
Table 2.6 summarizes the results for each of the ParaFit analyses.
Table 2.6: Results from the six ParaFit analyses.
Analysis ID PFGlobal P-value Host ID Symbiont ID PFLink1 P-value PFLink2 P-value
PF6_16S 0.00002 0.45310 SPC001176 MIT00091-1 0.00000 0.68030 0.00767 0.67620 SPC001336 MIT00202-1 0.00002 0.23860 0.13301 0.26630 SPC001355 MIT00218-2 0.00000 0.67380 0.00065 0.67350 SPC001205 MIT00144-1 0.00000 0.46460 0.03360 0.48280 SPC001307 MIT00184-1 0.00000 0.20750 0.03068 0.22460 SPC001361 MIT00221-1 0.00000 0.70400 0.00060 0.70380 PF7AB_16S 0.00000 0.58830 SPC001336 MIT00202-1 0.00000 0.53360 0.04501 0.53660 SPC001319 MIT00192-1 0.00000 0.26330 0.00908 0.27410 SPC001298 MIT00177-1 0.00000 0.80610 -0.00589 0.80430 SPC001298 MIT00177-2 0.00000 0.79060 -0.00813 0.79180 SPC001334 MIT00200-1 0.00000 0.18130 0.01203 0.19230 SPC001325 MIT00196-1 0.00000 0.68730 -0.00523 0.69110 SPC001327 MIT00197-1 0.00000 0.71970 -0.00509 0.72270 SPC001223 MIT00156-1 0.00000 0.49930 0.00229 0.49960 PF7CD_16S 0.00000 0.59350 SPC001336 MIT00202-1 0.00000 0.54320 0.04280 0.54470 SPC001319 MIT00192-1 0.00000 0.26970 0.00879 0.28240 SPC001298 MIT00177-1 0.00000 0.79340 -0.00560 0.79460 SPC001298 MIT00177-2 0.00000 0.77160 -0.00745 0.77360 SPC001339 MIT00205-2 0.00000 0.19690 0.01035 0.20460 SPC001325 MIT00196-1 0.00000 0.67940 -0.00505 0.68210 SPC001327 MIT00197-1 0.00000 0.70280 -0.00480 0.70620 SPC001223 MIT00156-1 0.00000 0.48750 0.00268 0.48820 PF12_16S 0.00000 0.12660 SPC001336 MIT00202-1 0.00000 0.09240 0.12757 0.09630 SPC001318 MIT00191-1 0.00000 0.17510 0.00926 0.16260 SPC001319 MIT00192-1 0.00000 0.14990 0.00987 0.13870 SPC001322 MIT00193-1 0.00000 0.07800 0.00918 0.07410 SPC001323 MIT00194-1 0.00000 0.17920 0.01420 0.16810 SPC001298 MIT00177-1 0.00000 0.97900 -0.01048 0.97920 SPC001334 MIT00200-1 0.00000 0.21000 0.00845 0.19760 SPC001339 MIT00205-2 0.00000 0.28070 0.00611 0.26480 SPC001340 MIT00206-1 0.00000 0.35210 0.01161 0.33860 SPC001325 MIT00196-1 0.00000 0.96100 -0.01917 0.96600
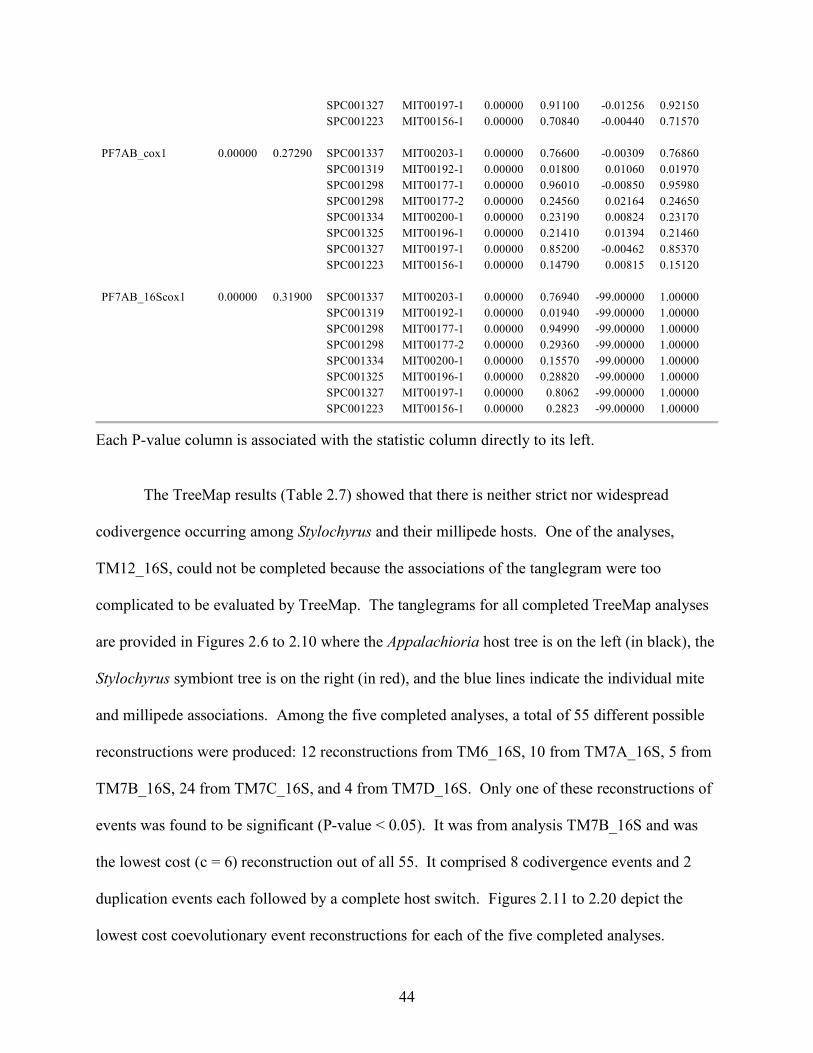
44
SPC001327 MIT00197-1 0.00000 0.91100 -0.01256 0.92150 SPC001223 MIT00156-1 0.00000 0.70840 -0.00440 0.71570 PF7AB_cox1 0.00000 0.27290 SPC001337 MIT00203-1 0.00000 0.76600 -0.00309 0.76860 SPC001319 MIT00192-1 0.00000 0.01800 0.01060 0.01970 SPC001298 MIT00177-1 0.00000 0.96010 -0.00850 0.95980 SPC001298 MIT00177-2 0.00000 0.24560 0.02164 0.24650 SPC001334 MIT00200-1 0.00000 0.23190 0.00824 0.23170 SPC001325 MIT00196-1 0.00000 0.21410 0.01394 0.21460 SPC001327 MIT00197-1 0.00000 0.85200 -0.00462 0.85370 SPC001223 MIT00156-1 0.00000 0.14790 0.00815 0.15120 PF7AB_16Scox1 0.00000 0.31900 SPC001337 MIT00203-1 0.00000 0.76940 -99.00000 1.00000 SPC001319 MIT00192-1 0.00000 0.01940 -99.00000 1.00000 SPC001298 MIT00177-1 0.00000 0.94990 -99.00000 1.00000 SPC001298 MIT00177-2 0.00000 0.29360 -99.00000 1.00000 SPC001334 MIT00200-1 0.00000 0.15570 -99.00000 1.00000 SPC001325 MIT00196-1 0.00000 0.28820 -99.00000 1.00000 SPC001327 MIT00197-1 0.00000 0.8062 -99.00000 1.00000 SPC001223 MIT00156-1 0.00000 0.2823 -99.00000 1.00000
Each P-value column is associated with the statistic column directly to its left.
The TreeMap results (Table 2.7) showed that there is neither strict nor widespread
codivergence occurring among Stylochyrus and their millipede hosts. One of the analyses,
TM12_16S, could not be completed because the associations of the tanglegram were too
complicated to be evaluated by TreeMap. The tanglegrams for all completed TreeMap analyses
are provided in Figures 2.6 to 2.10 where the Appalachioria host tree is on the left (in black), the
Stylochyrus symbiont tree is on the right (in red), and the blue lines indicate the individual mite
and millipede associations. Among the five completed analyses, a total of 55 different possible
reconstructions were produced: 12 reconstructions from TM6_16S, 10 from TM7A_16S, 5 from
TM7B_16S, 24 from TM7C_16S, and 4 from TM7D_16S. Only one of these reconstructions of
events was found to be significant (P-value < 0.05). It was from analysis TM7B_16S and was
the lowest cost (c = 6) reconstruction out of all 55. It comprised 8 codivergence events and 2
duplication events each followed by a complete host switch. Figures 2.11 to 2.20 depict the
lowest cost coevolutionary event reconstructions for each of the five completed analyses.

45
Table 2.7: Results from the six TreeMap analyses.
Analysis ID Reconstruction P-value Sampling Error (+/-) Co Sw Du Lo Total Cost
TM6_16S 1 1 0.0071 2 4 4 0 12 2 1 0.0071 2 4 4 0 12 3 1 0.0071 2 4 4 0 12 4 1 0.0071 2 4 4 0 12 5 1 0.0071 2 4 4 0 12 6 0.29 0.045 6 2 2 1 7 7 1 0.0071 2 4 4 0 12 8 1 0.0071 2 4 4 0 12 9 0.32 0.0466 6 1 2 4 9 10 0.29 0.045 6 0 2 8 12 11 1 0.0071 2 4 4 0 12 12 1 0.0071 2 4 4 0 12 TM7A_16S 1 0.43 0.0495 4 4 4 0 12 2 0.44 0.0496 4 4 4 0 12 3 0.37 0.0483 6 3 3 1 10 4 0.18 0.0384 6 2 3 3 11 5 0.39 0.0488 6 3 3 1 10 6 0.33 0.047 6 3 3 1 10 7 0.42 0.0494 4 4 4 0 12 8 0.46 0.0498 4 4 4 0 12 9 0.42 0.0494 6 1 3 8 15 10 0.9 0.03 4 0 4 18 26 TM7B_16S 1 0.01* 0.0099 8 2 2 0 6 2 0.27 0.0444 6 1 3 7 14 3 0.25 0.0433 6 1 3 7 14 4 0.25 0.0433 6 1 3 7 14 5 0.29 0.0454 6 0 3 12 18 TM7C_16S 1 1 0.0071 2 5 5 0 15 2 1 0.0071 2 5 5 0 15 3 1 0.0071 2 5 5 0 15 4 1 0.0071 2 5 5 0 15 5 1 0.0071 2 5 5 0 15 6 1 0.0071 2 5 5 0 15 7 0.95 0.0218 4 4 4 1 13 8 0.91 0.0286 4 4 4 1 13 9 0.74 0.0439 4 3 4 3 14 10 0.79 0.0407 4 3 4 3 14 11 0.92 0.0271 4 4 4 1 13 12 0.92 0.0271 4 4 4 1 13 13 1 0.0071 2 5 5 0 15 14 1 0.0071 2 5 5 0 15 15 1 0.0071 2 5 5 0 15

46
16 1 0.0071 2 5 5 0 15 17 1 0.0071 2 5 5 0 15 18 0.98 0.014 4 4 4 1 13 19 0.95 0.0218 4 2 4 8 18 20 0.93 0.0255 4 2 4 8 18 21 1 0.0071 2 5 5 0 15 22 1 0.0071 2 1 5 16 27 23 1 0.0071 2 1 5 16 27 24 0.98 0.014 4 0 4 19 27 TM7D_16S 1 0.12 0.0325 6 3 3 0 9 2 0.44 0.0496 6 2 3 4 12 3 0.42 0.0494 6 1 3 8 15 4 0.71 0.0454 4 0 4 15 23 TM12_16S N/A N/A N/A N/A N/A N/A N/A N/A
The Co column indicates the number of codivergence events. The Sw column indicates the number of complete host switches. The Du column indicates the number of duplication events. The Lo indicates the number of sorting events (losses). Reconstructions in bold indicate those with the lowest cost for an individual analysis. The asterisk indicates a P-value that is significant. TM12_16S has no results because the analysis could not be completed.
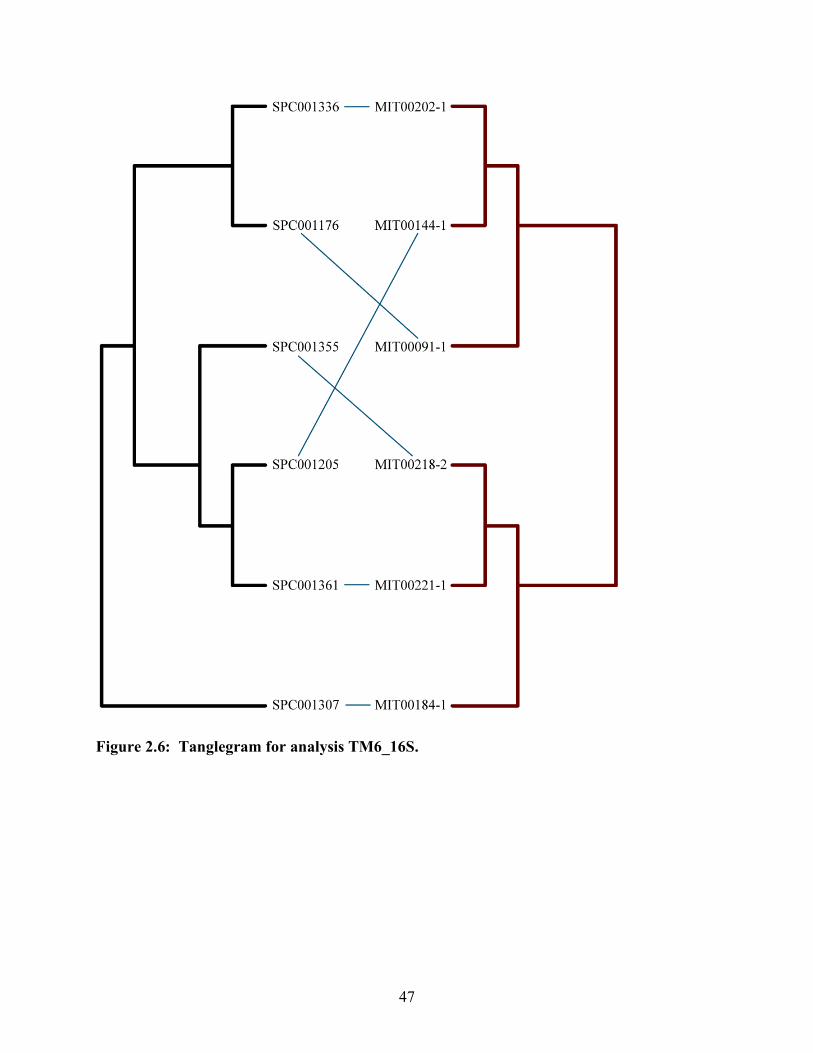
47
Figure 2.6: Tanglegram for analysis TM6_16S.

48
Figure 2.7: Tanglegram for analysis TM7A_16S.

49
Figure 2.8: Tanglegram for analysis TM7B_16S.

50
Figure 2.9: Tanglegram for analysis TM7C_16S.

51
Figure 2.10: Tanglegram for analysis TM7D_16S.

52
Figure 2.11: Lowest cost reconstruction (6) from analysis TM6_16S.
Figure 2.12: First lowest cost reconstruction (3) from analysis TM7A-16S.

53
Figure 2.13: Second lowest cost reconstruction (5) from analysis TM7A-16S.
Figure 2.14: Lowest cost reconstruction (1) from analysis TM7B-16S.

54
Figure 2.15: First lowest cost reconstruction (7) from analysis TM7C_16S.
Figure 2.16: Second lowest cost reconstruction (8) from analysis TM7C_16S.
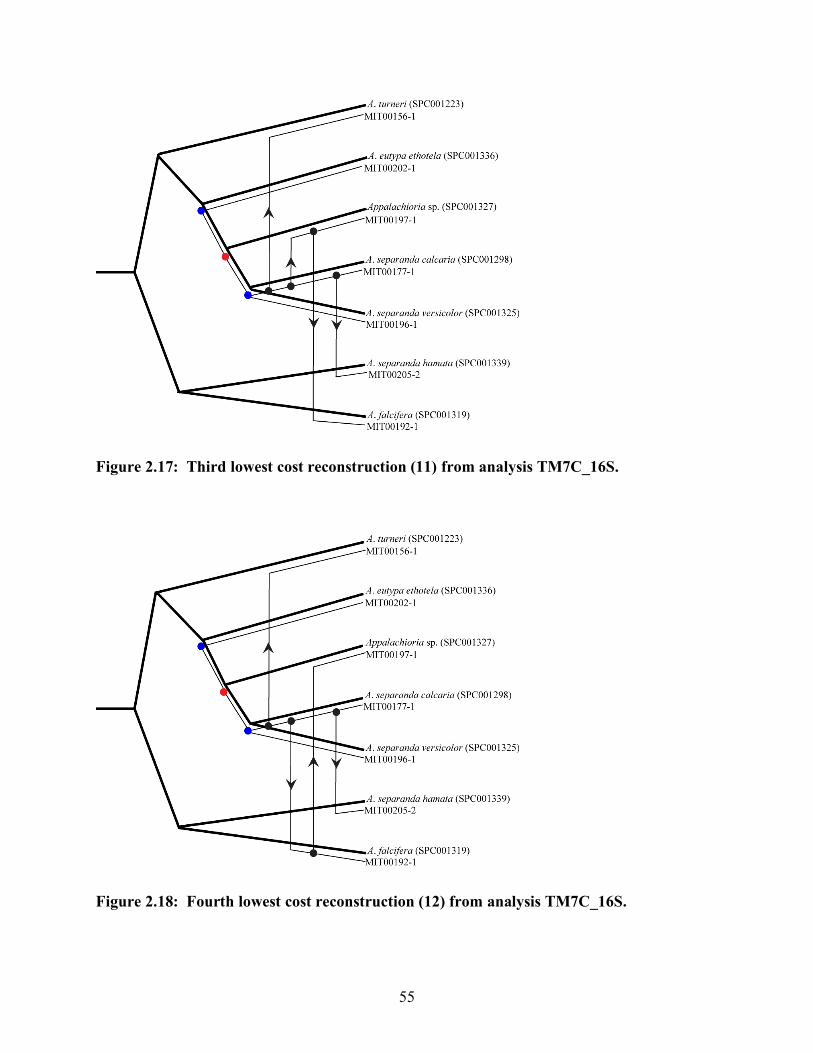
55
Figure 2.17: Third lowest cost reconstruction (11) from analysis TM7C_16S.
Figure 2.18: Fourth lowest cost reconstruction (12) from analysis TM7C_16S.

56
Figure 2.19: Fifth lowest cost reconstruction (18) from analysis TM7C_16S.
Figure 2.20: Lowest cost reconstruction (1) from analysis TM7D_16S.

57
2.4: Discussion
The results of both the phylogenetic and coevolutionary analyses demonstrate a complete lack of
coevolutionary signal between Appalachioria and Stylochyrus. As expected, the millipedes are
highly structured geographically; however, there is no corresponding structure among the mites.
In addition, these millipede-mite associations are not consistent with the three rules of
cospeciation. Host and symbiont phylogenies are incongruent, there is no pattern of association
between primitive hosts and primitive symbionts, and there are not equal numbers of host and
symbiont species. Consequently, our data fail to support the hypothesis of codivergence between
Stylochyrus and Appalachioria.
Despite the lack of coevolutionary signal, the composition of the data used in this study
potentially impacts the results of the Bayesian and coevolutionary analyses. For example,
Dataset II consisted of sequences from the protein-coding region cox1, which is much slower
evolving than the non-coding 16S/12S region. There was very little variation in the cox1
sequences from Stylochyrus (only 79 of the 483 characters were variable), which is likely why
convergence of the simultaneous runs in MrBayes did not occur. The phylogeny produced for
Dataset IV, is identical to the one estimated by Marek and Bond (2007), except for the placement
of Prionogonus divergens (Chamberlin, 1939). It is placed as the sister taxon to the Dixioria
species in this study, whereas, it is located within the Sigmoria Chamberlin, 1939 clade in Marek
and Bond (2007). The phylogeny from Dataset V and the phylogeny from Marek and Bond
(2007) have a few more discrepancies. It makes sense that the tree from Dataset IV is more
similar to Marek and Bond’s tree (2007) because the only molecular data they used was from the
16S/12S mitochondrial region. The support values for the Dataset V phylogeny are lower, so it
does not appear to be as reliable of an estimate as the other two reconstructed phylogenies in this

58
study or the one from Marek and Bond (2007), which included more taxa and both molecular
and morphological characters.
If coevolution was occurring, then mites associated with species of Appalachioria should
be more closely related to each other than mites from other xystodesmid genera. The
phylogenies produced from Datasets I and III show that this is clearly not the case. Mites from
the same locality and even the same millipede specimen do not appear to be closely related. For
example, neither the mites from A. separanda calcaria specimen SPC001298 (MIT00177-1 and
MIT00177-2) nor the mites from A. falcifera specimen SPC001317 (MIT00190-1, MIT00190-2,
and MIT00190-3) are located on branches near each other on the phylogenies. The phylogenies
from Datasets I and III have slightly different topologies; however, the latter has lower support
values. The branch lengths on the millipede trees are much longer than those on the mite trees,
which suggests that the millipede taxa diverged before the mite taxa.
Since no significant codivergence was found in the ParaFit analyses, it can be concluded
that evolution is not occurring simultaneously in these millipede and mite taxa. In fact, the
pattern of mite symbionts among the host millipedes is no different than random (PFGlobal = 0).
Several associations from some of the analyses produced negative PFLink2 values. This
indicates that widespread codivergence would have been more likely to occur with that link
excluded. If coevolution had been found for the 16S/12S region, then more analyses
incorporating more individuals and including cox1 and the concatenated datasets would have
been warranted. Because a phylogeny for Dataset II could not be produced, cox1 was excluded
from the TreeMap analyses. Also, the support values (posterior probabilities) for the Stylochyrus
rarior phylogenies are very low. Consequently, it is likely that the results from the TreeMap 2.0
analyses are not very reliable. In addition, TreeMap is not capable of evaluating tanglegrams

59
that include large numbers of taxa or complex associations due to many host switching events.
Analysis TM12_16S consisted of only 12 associations but was still too convoluted for TreeMap
to evaluate, which further indicates that codivergence is unlikely. The five completed TreeMap
analyses produced different results, which is inconsistent with the presence of coevolution. If
coevolution had occurred then it would be expected that just changing a few specimens would
not affect the results of these analyses. Because the majority of the reconstructions were not
found to be significant, the patterns and associations of Stylochyrus mites on xystodesmid
millipedes are considered to be no different than if they were chosen at random.
In addition to the lack of coevolution with xystodesmid millipedes, these mites seem to
have no apparent geographic structuring at the population level. Stylochyrus individuals present
at a single locality do not always form an exclusive group. Support values in the mite tree are
very low, which is likely because the mite mitochondrial sequences are just too similar for
evolutionary relationships to be accurately resolved. As well as being genetically similar,
individuals of Stylochyrus mites are morphologically similar across the range sampled in this
study. There are many groups of other terrestrial arthropods, including pseudoscorpions,
millipedes, and spiders, that show strong geographic structuring (Wilcox et al., 1997; Bond and
Sierwald, 2002; Stockman and Bond, 2007). These highly structured arthropod groups tend to
include many morphologically identical species (cryptic species) that are often not very vagile.
For example, Stockman and Bond (2007) analyzed the California spider genus
Promyrmekiaphila Schenkel, 1950 and discovered that this group shows extreme population
structuring; almost all populations from separate localities have very divergent mtDNA
sequences. The members of Promyrmekiaphila all look identical, but the amount of genetic
variation present suggests that there are several cryptic species (Stockman and Bond, 2007).

60
Similar results were found in the Jamaican millipede species complex Anadenobolus excisus
(Karsch 1881) (Bond and Sierwald, 2002) and the neotropical pseudoscorpion complex
Cordylochernes scorpioides (Linnaeus, 1758) (Wilcox et al., 1997). Unlike these arthropod
taxa, S. rarior appears to be highly vagile and has low population variation across its sampled
range.
Many mite taxa cannot sufficiently disperse to new habitats on their own due to their
small size and inability to fly. Therefore, phoresy, the formation of temporary symbiotic
associations for dispersal, is commonly practiced among mites. The range of S. rarior is very
large and encompasses a total of 11 states: Illinois, Indiana, Iowa, Kentucky, Missouri, New
York, North Carolina, Ohio, Tennessee, Virginia, and West Virginia (Kethley, 1983; Swafford
and Bond, 2009). S. rarior likely maintains this large range due to its phoretic dispersal
capabilities (Kethley, 1983). However, even though xystodesmid millipedes have cyanide
defense secretions that may provide protection for mites, millipedes are generally not very
vagile, which makes them unlikely to be adequate mite carriers. From this we might infer that S.
rarior uses other animals for dispersal purposes. In two other cases, S. rarior individuals were
found associated with animals other than millipedes (Kethley, 1983); these include associations
with a house sparrow and a single small mammal nest (Kethley, 1983). Other than these two
vertebrate associations and the xystodesmid millipede associations, the majority of documented
individuals of S. rarior are found in the absence of hosts and living mainly among oak leaf litter
(Kethley, 1983). Alternatively, most phoretic mites are thought to be very specialized to a
particular animal carrier (Bloszyk et al., 2006; Purrington and Drake, 2008). For example, there
are two species of mites in Poland that are only found associated with a single species of
centipede even though there are 30 species of centipedes in the area (Bloszyk et al., 2006). In

61
addition, many mites belonging to the suborder Astigmata attach to very specific places on their
beetle carriers (Purrington and Drake, 2008). This suggests that coevolution between phoretics
and their carrier is possible. However, this is not the case with S. rarior because it does not
appear to be specific in its selection of carrier animals.

REFERENCES
Berlese A. 1916. Centuria terza di Acari nuovi. Redia 12: 289-338. Bloszyk J, Klimczak J, Lesniewska M. 2006. Phoretic relationships between Uropodina (Acari:
Mesostigmata) and centipedes (Chilopoda) as an example of evolutionary adaptation of mites to temporary microhabitats. European Journal of Entomology 103: 699-707.
Boore JL, Macey JR, Medina M. 2005. Sequencing and comparing whole mitochondrial
genomes of animals. Lawrence Berkeley National Laboratory. Paper LBNL-55278. Online at http://repositories.cdlib.org/lbnl/LBNL-55278.
Bond JE, Sierwald P. 2002. Cryptic speciation in the Anadenobolus excisus millipede species
complex on the island of Jamaica. Evolution 56(6): 1123-1135. Canestrini G, Canestrini R. 1882. I Gamasi Italiani. Atti della Societa Veneto-Trentina di
Scienze Naturali 8: 31-82. Charleston MA. 1998. Jungles: a new solution to the host/parasite phylogeny reconciliation
problem. Mathematical Biosciences 149: 191-223. De Vienne DM, Giraud T, Shykoff JA. 2007. When can host shifts produce congruent host and
parasite phylogenies? A simulation approach. Journal of Evolutionary Biology 20(4): 1428-1438.
Edgar RC. 2004. MUSCLE: multiple sequence alignment with high accuracy and high
throughput. Nucleic Acids Research 32(5): 1792-1797. Ehrlich PR, Raven PH. 1964. Butterflies and plants: a study in coevolution. Evolution 18: 586-
608. Eichler W. 1942. Die Entfaltungsregel und andere Gesetzmabigkeiten in den
parasitogenetischen Beziehungen der Mallophagen und anderer standiger Parasiten zu ihren Wirten. Zoologischer Anzeiger 132: 254-262.
Evans GO, Sheals JG. 1959. Three new mesostigmatid mites associated with millipedes in
Indonesia. Entomologische Berichten Amsterdam 19: 107-111. Evans JD, Lopez DL. 2002. Complete mitochondrial DNA sequence of the important honey bee
pest, Varroa destructor (Acari: Varroidae). Experimental and Applied Acarology 27: 69-78.
Fahrein K, Talarico G, Braband A, Podsiadlowski L. 2007. The complete mitochondrial
genome of Pseudocellus pearsei (Chelicerata: Ricinulei) and a comparison of mitochondrial gene rearrangements in Arachnida. BMC Genomics 8: 386.

63
Fain A. 1994. Adaptation, specificity and host-parasite coevolution in mites (Acari). International Journal for Parasitology 24(8): 1273-1283.
Farenholz H. 1913. Ectoparasiten und Abstammungslehre. Zoologischer Anzeiger 41: 371-374. Farish DJ, Axtell RC. 1971. Phoresy redefined and examined in Macrocheles
muscaedomesticae (Acarina: Macrochelidae). Acarologia 13: 16-29. Folmer O, Black M, Hoeh W, Lutz R, Vrijenhoek R. 1994. DNA primers for amplification of
mitochondrial cytochrome c oxidase subunit I from diverse metazoan invertebrates. Molecular Marine Biology and Biotechnology 3(5): 294-299.
Gerdeman BS, Klompen H. 2003. A new North American heterozerconid, Narceoheterozercon
ohioensis n. g., n. sp., with first description of immatures of Heterozerconidae (Acari: Mesostigmata). International Journal of Acarology 29(4): 351-370.
Gerdeman BS, Klompen H, Tanigoshi L. 2000. Insights into the biology of a mite-millipede
association. Fragmenta Faunistica 43: 223-227. Hafner MS, Nadler SA. 1990. Cospeciation in host-parasite assemblages: comparative analysis
of rates of evolution and timing of cospeciation events. Systematic Zoology 39(3): 192-204.
Hughes J, Kennedy M, Johnson KP, Palma RL, Page RDM. 2007. Multiple cophylogenetic
analyses reveal frequent cospeciation between pelecaniform birds and Pectinopygus lice. Systematic Biology 57(2): 232-251.
Hunter PE, Rosario RMT. 1988. Associations of Mesostigmata with other arthropods. Annual
Review of Entomology 33: 393-417. Hwang UW, Park CJ, Yong TS, Kim W. 2001. One-step PCR amplification of complete
arthropod mitochondrial genomes. Molecular Phylogenetics and Evolution 19(3): 345-352.
Janzen DH. 1980. When is it coevolution? Evolution 34(3): 611-612. Jeyaprakash A, Hoy MA. 2007. The mitochondrial genome of the predatory mite Metaseiulus
occidentalis (Arthropoda: Chelicerata: Acari: Phytoseiidae) is unexpectedly large and contains several novel features. Gene 391: 264-274.
Johnson KP, Clayton DH. 2004. Untangling coevolutionary history. Systematic Biology 53(1):
92-94. Kethley JB. 1978. Narceolaelaps n. g. (Acari: Laelapidae) with four new species parasitizing
spiroboloid millipedes. International Journal of Acarology 4(3): 195-210.

64
Kethley J. 1983. The deutonymph of Epiphis rarior Berlese, 1916 (Epiphidinae n. subfam., Rhodocaridae, Rhodacaroidea). Canadian Journal of Zoology. 61(11): 2598-2611.
Krantz GW, Walter DE, eds. 2009. A Manual of Acarology. Third Edition. Lubbock, Texas:
Texas Tech University Press. Lavrov DV, Boore JL, Brown WM. 2000. The complete mitochondrial DNA sequence of the
horseshoe crab Limulus polyphemus. Molecular Biology and Evolution 17(5): 813-824. Lee DC. 1970 The Rhodacaridae (Acari: Mesostigmata); classification, external morphology
and distribution of genera. Records of the South Australian Museum (Adelaide) 16(3): 1-219.
Legendre P, Anderson MJ. 1998. Program DistPCoA. Departement de Sciences Biologiques,
Universite de Montreal, Montreal. Legendre P, Desdevises Y, Bazin E. 2002. A statistical test for host-parasite coevolution.
Systematic Biology 51(2): 217-234. Light JE, Hafner MS. 2008. Codivergence in heteromyid rodents (Rodentia: Heteromyidae) and
their sucking lice of the genus Fahrenholzia (Phthiraptera: Anoplura). Systematic Biology 57(3): 449-465.
Lincoln RJ, Boxshall GA, Clark PF. 1982. A Dictionary of Ecology, Evolution and Systematics.
Cambridge: Cambridge University Press. Lowe TM, Eddy SR. 1997. tRNAscan-SE: a program for improved detection of transfer RNA
genes in genomic sequence. Nucleic Acids Research 25: 955-964. Maddison WP, Maddison DR. 2006. Mesquite: a modular system for evolutionary analysis.
Version 2.0. http://mesquiteproject.org. Marek PE, Bond JE. 2006. Phylogenetic systematics of the colorful, cyanide-producing
millipedes of Appalachia (Polydesmida, Xystodesmidae, Apheloriini) using a total evidence Bayesian approach. Molecular Phylogenetics and Evolution 41: 704-729.
Marek PE, Bond JE. 2007. A reassessment of apheloriine millipede phylogeny: additional taxa,
Bayesian inference, and direct optimization (Polydesmida: Xystodesmidae). Zootaxa 1610: 27-39.
Navajas M, Le Conte Y, Solignac M, Cros-Arteil S, Cornuet JM. 2002. The complete sequence
of the mitochondrial genome of the honeybee ectoparasite mite Varroa destructor (Acari: Mesostigmata). Molecular Biology and Evolution 19(12): 2113-2317.
Nylander JAA. 2004. MrModelTest Version 2. Program distributed by the author.
Evolutionary Biology Centre, Uppsala University.

65
Page RDM. 1994. Parallel phylogenies: reconstructing the history of host-parasite assemblages.
Cladistics 10: 155-173. Purrington FF, Drake CJ. 2008. Phoretic deutonymphs of Schwiebea sp. (Acari: Astigmata:
Acaridae) travel in commodious nitid dorsal pits of adult Lagocheirus araneiformis stroheckeri Dillon (Coleoptera: Cerambycidae: Lamiinae) in Florida, USA. Entomological News 119(4): 415-419.
Rambaut A. 2009. FigTree version 1.2.2, < http://tree.bio.ed.ac.uk/software/figtree/>. Rambaut A, Drummond AJ. 2003. Tracer version 1.3, <http://evolve.zoo.ox.au.uk/>. Ronquist F. 1997. Phylogenetic approaches in coevolution and biogeography. Zoologica
Scripta 26(4): 313-322. Ronquist F, Huelsenbeck JP. 2003. MrBayes 3: Bayesian phylogenetic inference under mixed
models. Bioinformatics 19(12): 1572-1574. Rozen S, Skaletsky HJ. 2000. Primer3 on the WWW for general users and for biologist
programmers. pp. 365-386. In: Krawetz S, Misener S, eds. Bioinformatics Methods and Protocols: Methods in Molecular Biology. Totowa, New Jersey: Humana Press.
Rubinoff D, Holland BS. 2005. Between two extremes: Mitochondrial DNA is neither the
panacea nor the nemesis of phylogenetic and taxonomic inference. Systematic Biology 54(6): 952-961.
Stockman AK, Bond JE. 2007. Delimiting cohesion species: extreme population structuring and
the role of ecological interchangeability. Molecular Ecology 16: 3374-3392. Swafford L, Bond JE. 2009. The symbiotic mites of some Appalachian Xystodesmidae
(Diplopoda: Polydesmida) and the complete mitochondrial genome sequence of the mite Stylochyrus rarior (Berlese) (Acari: Mesostigmata: Ologamasidae). Invertebrate Systematics 23(5): 445-451, <http://www.publish.csiro.au/paper/IS09036.htm>.
Swofford D. 1998. PAUP*: Phylogenetic analysis using parsimony (* and other methods).
Beta version 4.0b10, Sinauer Associates, Sunderland, Massachusetts. Szidat L. 1940. Deitrage zum Aubfau eines naturlichen Systems der Trematoden. I. Die
Entwicklung von Echinocercaria choanophila U. Szidat zu Cathaemasia hians und die Ableitung der Fasciolidae von den Echinostomidae. Zeitschrift fur Parasitenkunde 11: 239-283.
Thompson JN. 1986. Patterns in coevolution. In: Stone AR, Hawksworth DJ, eds. Coevolution
and Systematics. Oxford: Clarendon Press, 119-143.

66
Thompson JN. 1994. The Coevolutionary Process. Chicago: The University of Chicago Press. Tragardh I. 1907. Description of two myriopodophilous genera of Antennophorinae, with notes
on their development and biology. Arkiv fur Zoologi 3(28): 1-33. Van Leeuwen T, Vanholme B, Van Pottelberge S, Van Nieuwenhuyse P, Nauen R, Tirry L,
Denholm I. 2008. Mitochondrial heteroplasmy and the evolution of insecticide resistance: non-Mendelian inheritance in action. Proceedings of the National Academy of Sciences USA 105(16): 5980-5985.
Vitzthum HG. 1942. Acarina XI, DA System der Acari. pp. 751-926. In: Bronn HG, ed.
Klassen und Ordnungen des Tierreiches. Vol. 5, Section 4, Book 5. Leipzig: Akademische Verlagsgesellschaft Becker and Erler Kom. Ges.
Walker MJ, Stockman AK, Marek PE, Bond JE. 2009. Pleistocene glacial refugia across the
Appalachian Mountains and coastal plain in the millipede genus Narceus: evidence from population genetic, phylogeographic, and paleoclimatic data. BMC Evolutionary Biology 9: 25.
Wilcox TP, Hugg L, Zeh JA, Zeh DW. 1997. Mitochondrial DNA sequencing reveals extreme
genetic differentiation in a cryptic species complex of neotropical pseudoscorpions. Molecular Phylogenetics and Evolution 7(2): 208-216.
