abstract€¦ · abstract . ou, yingjie. evolution of emergent technologies for producing nonwoven...
TRANSCRIPT

ABSTRACT
OU, YINGJIE. Evolution of Emergent Technologies for Producing Nonwoven Fabrics for Air Filtration (Under the direction of Dr. William Oxenham, and Dr. Kristin Thoney-Barletta).
Nonwovens is a fast growing industry driven by technological research and
development (R&D), and one of the major application areas for nonwovens is air filtration.
Research on nonwovens technologies has mainly focused on the science and technology areas,
but there is very little published research on technology management issues within the
nonwovens industry. The purpose of the study is to utilize Tech mining to quantify and map
out the technical developments and innovations in nonwovens technologies, with particular
emphasis on nonwoven fabrics for use in the subsequent manufacture of air filters.
In order to measure the R&D activities and evaluate the recent developments in
nonwovens technologies and air filtration manufacturing, a systematic search strategy was
employed to collect data from relevant sources, such as journal publications, patent literature,
and trade journals. Initially, a bottom-up approach was used to retrieve relevant information
regarding the target application area – air filtration. The results yielded information on
developments in nanofibers, which is the newest technology trend in making air filter medium.
Then, a top-down search focused on the technology and nonwoven processes was conducted.
Using this approach, application areas for nanofibers, other than air filtration, were analyzed.
The results from the analyses using text mining and visualization tools revealed the
technological pathways and potential growth within the nonwovens air filtration industry.
Moreover, the development of micro and nanofibers and their associated nonwoven
technologies were illustrated. Applications for air filtration range from the filters for HVAC
systems and respirators, to air sampling and filters for compressed air in industrial settings.
With an increase in pollution and consumers’ awareness, high efficiency filters, such as HEPA,

are in higher demand. Nanofibers, along with microfibers, present the capability of improving
filter performance, and the process can be achieved in multiple ways. The versatility of
electrospinning has become the most mentioned method for making nanofibers in academia,
while meltblown is more commonly used to produce fibers at micro and submicron scale in
industry. Bicomponent process enables production of micro and nanofibers. Nanofibers have
also been used in other application areas, including electronics, energy purposes, and medical
applications.
This study fills a research gap by providing fresh insights into the development of
nonwovens technologies and a specific application area, air filtration, from a technology
management perspective. It contributes to the overall understanding of nonwovens filtration
medium manufacturing and innovations. Ultimately, this study should have implications for
researchers and manufacturers looking to target selected technologies, such as nanofibers, for
making nonwovens filtration products.

© Copyright 2016 Yingjie Ou
All Rights Reserved

Evolution of Emergent Technologies for Producing Nonwoven Fabrics for Air Filtration
by Yingjie Ou
A dissertation submitted to the Graduate Faculty of North Carolina State University
in partial fulfillment of the requirements for the degree of
Doctor of Philosophy
Textile Technology Management
Raleigh, North Carolina
2016
APPROVED BY:
_______________________________ _______________________________ Dr. William Oxenham Dr. Kristin Thoney-Barletta Committee Chair Committee Co-Chair _______________________________ _______________________________ Dr. Behnam Pourdeyhimi Dr. David Dickey

ii
DEDICATION
To my beloved family, my father--Yongquan Ou, my mother--Guide Xu, and Jon!

iii
BIOGRAPHY
Yingjie Ou was born and raised in Nanjing, China. She received her Bachelor’s degree in
marketing from Nanjing University of Technology. Having never moved away from home, she
always wanted to experience study abroad. While working as a marketing manager for a bank
in China after college, she started to apply to graduate programs in the U.S. Finally, this
dauntless Southeastern girl chose University of North Carolina, Greensboro (UNCG) because
she thought it was in the “North”. She stayed and obtained her master’s degree from UNCG in
Consumer, Apparel, and Retails Studies. Her master’s work on consumers’ perceptions and
technology acceptance intrigued her interest in technology. Shortly afterwards, she decided to
pursue her doctorate degree in Textile Technology Management, a perfect combination of her
interest and background.

iv
ACKNOWLEDGMENTS
I would like to thank my chair Dr. William Oxenham, and co-chair Dr. Kristin Thoney-
Barletta, for their continuous guidance throughout this dissertation process. Their feedback and
patience helped me develop the perseverance to accomplish my studies, and I am especially
thankful for their mentorship.
I greatly appreciate my committee members, Dr. Pourdeyhimi and Dr. David Dickey,
for their suggestions for this study. Special thanks to Dr. Pourdeyhimi for his generous support
for the past three years, and I am more than grateful for all the opportunities that were brought
by the Nonwovens Institute. I learned the most useful tips regarding Principle Component
Analysis from Dr. David Dickey’s class on data mining, and his insights on “big data” have
fostered the study.
I have enjoyed being part of the Nonwovens Institute student group, which has
provided a stimulating learning environment. All the faculty members and colleagues that I
encountered have made my PhD program at College of Textiles one of the best memories in
my life. My appreciation also goes to Dr. Genevieve Garland for inspiring me on the
dissertation topic involving “Tech Mining”.
Many thanks to all my classmates and friends that have encouraged me, motivated me,
challenged me, and kept me sane to finish this study. I believe our friendships will be cherished
for life.
My deepest appreciation goes to my family, and I feel extremely lucky to have them in
my life. Without them, I wouldn’t be able to accomplish this. Thank you for cheering me to
make everything possible!

v
TABLE OF CONTENTS
TABLE OF CONTENTS .......................................................................................................... v LIST OF TABLES ................................................................................................................... ix
LIST OF FIGURES ................................................................................................................ xii
CHAPTER 1 Introduction ..................................................................................................... 1 1.1 Statement of the Problem ................................................................................................ 1
1.2 Purpose of the Study ....................................................................................................... 2 1.3 Significance of the Study ................................................................................................ 4
1.4 Scope and Limitations of Study ...................................................................................... 4 1.5 Definitions of the Key Terms .......................................................................................... 6
1.6 Summary ....................................................................................................................... 14
CHAPTER 2 Literature Review .......................................................................................... 15
2.1 The Development of Nonwovens and its General Process ........................................... 15
2.1.1 Definition of Nonwovens ................................................................................... 15
2.1.2 The Development of Nonwovens ....................................................................... 16
2.1.3 The Nonwovens Market..................................................................................... 17
2.1.4 The Nonwovens Process ................................................................................... 18
2.2 Spunbond Technology ................................................................................................... 20
2.2.1 The History and Development of the Spunbond Technology ............................ 20
2.2.2 Description of the Spunbond Process ............................................................... 25
2.2.3 The Parameters Affecting the Spunbond Process ............................................. 31
2.2.4 The Characteristics of Spunbond Webs or Products ........................................ 36
2.2.5 The Spunbond Technology Market and its Associated Applications ................ 37
2.2.6 Flash Spinning Process: A Modified Spunbond Process .................................. 37
2.3 Meltblown Technology ................................................................................................. 38
2.3.1 The History and Development of the Meltblown Technology ........................... 38
2.3.2 Description of the Meltblown Process .............................................................. 42
2.3.3 The Parameters Affecting the Meltblown Process ............................................ 46 2.3.4 The Characteristics of Meltblown Webs or Products ....................................... 51
2.3.5 The Meltblown Technology Market and its Associated Applications ............... 53 2.4 Comparison between Spunbond and Meltblown Technologies .................................... 55
2.4.1 Similarities between Spunbond and Meltblown Technologies .......................... 55

vi
2.4.2 Differences between Spunbond and Meltblown Technologies .......................... 55
2.5 Spunbond (S) Meltblown (M) Spunbond (S) Technology ............................................ 57 2.6 Nanofiber Manufacturing Using Nonwoven Technologies .......................................... 58
2.6.1 Electrospinning ................................................................................................. 60 2.6.2 Bicomponent Fibers .......................................................................................... 65
2.6.3 Other Methods for Manufacturing Nanofibers ................................................. 86 2.7 Filtration and Separation Medium Market .................................................................... 86
2.7.1 Filtration and Separation ................................................................................. 86 2.7.2 Filter Medium ................................................................................................... 89
2.7.3 Categories of Filter Medium ............................................................................. 92 2.8 Technology Management ............................................................................................ 101
2.8.1 Background Information on Technology Management .................................. 101
2.8.2 The Definition of Technology Management .................................................... 102
2.8.3 The Development of Technology Management ............................................... 103
2.8.4 The Characteristics and Issues Associated with Technology Management ... 105
2.9 Data Types and Sources .............................................................................................. 107
2.10 Text Mining ............................................................................................................... 108
2.10.1 Information Retrieval and Extraction................................................................. 109
2.10.2 Bibliometric Analysis .......................................................................................... 110
2.10.3 Natural Language Processing ............................................................................ 111
2.10.4 Content Analysis ................................................................................................. 111
2.10.5 The Process of Text Mining ................................................................................ 114
2.11 Tech Mining .............................................................................................................. 118
2.11.1 Three Phases of Text Mining .......................................................................... 119
2.11.2 VantagePoint................................................................................................... 119
2.12 Patents and Patent Analysis....................................................................................... 120
2.12.1 Definition of Patents and Role of Patents in Technology Management ......... 120 2.12.2 Global Patent Activity and Development ........................................................ 122
2.12.3 Patent Classification ....................................................................................... 124 2.12.4 Patent Information Categories ....................................................................... 125
2.12.5 Patent Analysis................................................................................................ 126 CHAPTER 3 Research Methodology ................................................................................ 134

vii
3.1 Research Purpose ................................................................................................... 134
3.2 Research Objectives ............................................................................................... 134 3.3 Research Design ..................................................................................................... 135
3.3.1 Data Collection ............................................................................................... 138 3.3.2 Data Analysis Techniques ............................................................................... 147
3.4 Summary ................................................................................................................ 149 CHAPTER 4 Data Collection - Search Query Formulation and Results .......................... 150
4.1 Search Queries and Results for Air Filtration and the Making of Air Filters ........ 150 4.1.1 Search Queries in WOS .................................................................................. 150
4.1.2 Search Queries in EV ...................................................................................... 161 4.1.3 Search Queries in DII ..................................................................................... 164
4.1.4 Search Queries in ABI/INFORM™ Complete ................................................ 174
4.2 Search Queries and Results for Selected Nonwoven Technologies for Filter Media Manufacturing ................................................................................................................... 177
4.2.1 Search Queries in WOS .................................................................................. 178
4.2.2 Search Queries in EV ...................................................................................... 180 4.2.3 Search Queries in DII ..................................................................................... 182
4.2.4 Search Queries in ABI/INFORMTM Complete ................................................ 187
4.3 Search Queries and Results of Selected Nonwoven Technologies Used in Air Filtration ............................................................................................................................ 189
4.4 Summary ................................................................................................................ 190
CHAPTER 5 Data Analysis and Results ........................................................................... 191
5.1 Preliminary Search Query and Analysis of Results ............................................... 191
5.1.1 The Sample Search Query ............................................................................... 191
5.1.2 Preprocessing ................................................................................................. 191
5.1.3 Comparison ..................................................................................................... 192
5.2 Research Profiling on the State of the Art of Air Filtration ................................... 199 5.2.1 Research Activity Trend Analyses ................................................................... 199
5.2.2 Top Players ..................................................................................................... 204 5.2.3 Document Types .............................................................................................. 215
5.2.4 Publication Sources with the Most Relevant Publications ............................. 216
5.2.5 Journals that Have Been Cited the Most ........................................................ 218 5.2.6 Influence Measures / Citation Analysis .......................................................... 219

viii
5.2.7 Hot Topics and Research Concentration Analyses ......................................... 228
5.2.8 Research Networking Analysis ....................................................................... 254 5.3 Research Profiling on the State of the Art of Selected Nonwoven Technologies .. 260
5.3.1 Research Activity Trend Analyses ................................................................... 261 5.3.2 Top Players ..................................................................................................... 267
5.3.3 Top Publication Sources ................................................................................. 273 5.3.4 Hot Topics and Research Concentration Analyses ......................................... 276
5.4 Research Profiling of the Use of Selected Nonwoven Technologies for Air Filter Media ................................................................................................................................ 284
5.4.1 Research Activity Trend Analyses ................................................................... 284
5.4.2 Top Players ..................................................................................................... 288 5.4.3 Top Journals ................................................................................................... 294
5.4.4 Influence Measures / Citation Analysis .......................................................... 296
5.4.5 Hot Topics and Research Concentration Analyses ......................................... 300
5.5 Clustering Results Comparison across the Sources ............................................... 307
CHAPTER 6 In-depth Analyses and Discussions ............................................................. 309 6.1 Technology Evolutionary Path and Sub-System Analysis ..................................... 309
6.1.1 Evolution of Air Filtration Patents ................................................................. 309
6.1.2 Evolution of Selected Nonwoven Technology for Producing Micro and Nanofibers Patents ........................................................................................................ 313
6.1.3 Sub-Systems and Pathways in Air Filtration .................................................. 318
6.1.4 Sub-Systems and Pathways in Selected Nonwoven Technologies .................. 334
6.1.5 Relationships among Nonwoven Technologies in Air Filtration .................... 341
6.2 Forecasting ............................................................................................................. 344
6.3 Summary of Research Purposes ............................................................................. 353 CHAPTER 7 Conclusions and Future work ...................................................................... 357
7.1 Conclusions ............................................................................................................ 357 7.2 Future Work and Directions ................................................................................... 361
REFERENCES ..................................................................................................................... 363
APPENDICES ...................................................................................................................... 384

ix
LIST OF TABLES
Table 2-1. Early major technological innovations in the spunbond process and products (Adapted from literature by Batra & Pourdeyhimi, 2012; Bhat & Malkan, 2007; Fedorova, 2006; Hill, 1990) ..................................................................................................................... 22 Table 2-2. List of polymers and their viscosity values at operating temperatures ................. 33 Table 2-3. Types of filter media based on rigidity (Purchas, 1981; Wakeman & Tarleton, 2005, p. 79) ............................................................................................................................. 90 Table 2-4. Different filter media types, their filtering mechanism and application areas ...... 91 Table 2-5. Evaluation standard by ASHRAE ......................................................................... 95 Table 2-6. EN 779 by CEN ..................................................................................................... 95 Table 2-7. Patent search tasks (Bonino et al., 2010) ............................................................. 128 Table 4-1. Expanded lexical queries-highly relevant queries ............................................... 151 Table 4-2. TF*IDF scores (top keywords ranked from highest to lowest) ........................... 152 Table 4-3. Examples of hit ratio and noise ratio calculations using candidate terms ........... 156 Table 4-4. Breakdown of identified candidate terms (and their variations) by similar functions ................................................................................................................................ 158 Table 4-5. Expanded queries using combinations of different function modules ................ 159 Table 4-6. Search queries for air filtration in WOS .............................................................. 160 Table 4-7. Search queries for air filtration in EV ................................................................. 162 Table 4-8. Top International Patent Classification codes identified from the core query .... 165 Table 4-9. IPC category B01D 39/00 and its sub-categories ................................................ 168 Table 4-10. IPC category B01D 46/00 and its sub-categories .............................................. 169 Table 4-11. Nonwoven related International Patent Classification codes (out of top 500 IPC codes) .................................................................................................................................... 171 Table 4-12. Search queries for air filtration in DII ............................................................... 172 Table 4-13. Search queries for air filtration in ABI .............................................................. 176 Table 4-14. Search queries for nanofibers and other nonwoven technologies in WOS ............................................................................................................................................... 179 Table 4-15. Search queries for nonwoven technologies in EV ............................................. 181 Table 4-16. Top 50 IPC based on nanofiber seed query ....................................................... 183 Table 4-17. Search queries for nonwoven technologies in DII ............................................ 186 Table 4-18. Search queries for nonwoven technologies in ABI ........................................... 188 Table 4-19. Search queries of nonwoven technologies, especially the use of nanofibers, for air filtration in four databases ............................................................................................... 189 Table 5-1. Sample search queries in WOS and EV (from 1990 to 2015) ............................. 191 Table 5-2. Top affiliations from WOS .................................................................................. 194 Table 5-3. Top affiliations from EV ..................................................................................... 194 Table 5-4. Leading authors with 3 or more publications from WOS (1990-2015) .............. 195 Table 5-5. Leading authors with 3 or more publications from EV (1990-2015) .................. 196 Table 5-6. Sources with 2 or more publications in WOS (1990-2015) ................................ 197 Table 5-7. Sources with 2 or more publications in EV (1990-2015) .................................... 197 Table 5-8. Top 10 countries and their publications in WOS ................................................ 205

x
Table 5-9. Top 10 countries and their publications in EV .................................................... 207 Table 5-10. Top 10 countries and their numbers of patents in DII ....................................... 209 Table 5-11. Top 25 organizations based on air filtration publications in WOS ................... 210 Table 5-12. Top 25 organizations based on air filtration publications in EV ....................... 211 Table 5-13. Top 25 organizations based on air filtration patents in DII ............................... 212 Table 5-14. Top organizations in DII on air filtration patents using the U.S. as the priority country .................................................................................................................................. 213 Table 5-15. Top organizations on air filtration publications in ABI .................................... 214 Table 5-16. Top 25 sources based on publication volume in WOS ...................................... 217 Table 5-17. Top 25 sources based on publication volume in EV ......................................... 218 Table 5-18. Top cited journals from air filtration search in WOS ........................................ 219 Table 5-19. Times cited per record in WOS among top three countries from 1990-2015 ... 222 Table 5-20. Citation information on air filtration publications in WOS ............................... 222 Table 5-21. Top 20 affiliations based on total times cited and their corresponding average times cited per record ............................................................................................................ 224 Table 5-22. Top 20 affiliations based on the average times cited per record and their corresponding total time cited ............................................................................................... 225 Table 5-23. Macro-Disciplines of air filtration in WOS ....................................................... 230 Table 5-24. Top 10 countries in terms of nonwoven technologies for making micro and nanofibers in WOS ................................................................................................................ 268 Table 5-25. Top 10 countries in terms of nonwoven technologies for making micro and nanofibers in EV ................................................................................................................... 268 Table 5-26. Top 10 countries in terms of nonwoven technologies for making micro and nanofibers in DII ................................................................................................................... 268 Table 5-27. Top 10 countries in terms of nonwoven technologies for making micro and nanofibers in ABI .................................................................................................................. 269 Table 5-28. Top 25 organizations from WOS ...................................................................... 270 Table 5-29. Top 25 organizations from EV .......................................................................... 270 Table 5-30. Top 25 organizations from DII .......................................................................... 271 Table 5-31. Top 25 organizations from DII with U.S. listed as priority countries ............... 272 Table 5-32. Top 25 journals with the most publications on nano and microfiber and their associated nonwoven technologies in WOS ......................................................................... 273 Table 5-33. Top 25 journals with the most publications on nano and microfiber and their associated nonwoven technologies in EV ............................................................................. 274 Table 5-34. Top 25 journals with the most publications on nano and microfiber and their associated nonwoven technologies in ABI ........................................................................... 275 Table 5-35. Top countries from publications on air filtration using micro and nanofibers made from selected nonwoven technologies in WOS .......................................................... 288 Table 5-36. Top countries from publications on air filtration micro and nanofibers made from selected nonwoven technologies in EV ................................................................................ 289 Table 5-37. Top countries from patents on air filtration using micro and nanofibers made from selected nonwoven technologies in DII ....................................................................... 289

xi
Table 5-38. Top organizations with the most publications on air filtration using micro and nanofibers made from selected nonwoven technologies in WOS ........................................ 290 Table 5-39. Top organizations with the most publications on air filtration using micro and nanofibers made from selected nonwoven technologies in EV ............................................ 291 Table 5-40. Top assignees based on patents for air filtration using micro and nanofibers made from selected nonwoven technologies in DII ....................................................................... 293 Table 5-41. Top assignees based on patents for air filtration using micro and nanofibers made from selected nonwoven technologies in DII (U.S. priority country) .................................. 293 Table 5-42. Publication sources on air filtration using selected nonwoven technologies in WOS ...................................................................................................................................... 294 Table 5-43. Publication sources on air filtration using selected nonwoven technologies in EV............................................................................................................................................... 295 Table 5-44. Publication sources cited the most on air filtration using selected nonwoven technologies .......................................................................................................................... 296 Table 5-45. Citation information on using selected nonwoven technologies for air filtration publications in WOS ............................................................................................................. 297 Table 5-46. Top 20 affiliations based on total citations and their corresponding average times cited per record ..................................................................................................................... 298 Table 5-47. Top 20 affiliations based on the average times cited per record and their corresponding total citations ................................................................................................. 299 Table 6-1. IPC codes with the most records in air filtration search ...................................... 310 Table 6-2. Air filtration IPC codes with the highest CAGR ................................................. 310 Table 6-3. Air filtration IPC codes appearing in and after 2005 .......................................... 311 Table 6-4. IPC codes with most records in nonwoven technology search ........................... 314 Table 6-5. Selected nonwoven technology IPC codes (4 digits) with highest CAGR ......... 315 Table 6-6. Selected nonwoven technology IPC codes (8 digits) with highest CAGR ......... 315 Table 6-7. Selected nonwoven technology IPC codes appearing after 2005 ........................ 316 Table 6-8. Descriptions of sub-systems from air filtration WOS records ............................ 320 Table 6-9. Descriptions of sub-systems from air filtration EV records ................................ 323 Table 6-10. Descriptions of sub-systems from air filtration DII records .............................. 328 Table 6-11. Descriptions of sub-systems from nonwoven technology DII records ............. 336

xii
LIST OF FIGURES
Figure 2-1. The market segments based on volume of nonwoven roll goods in 2012 (retrieved from http://www.edana.org/discover-nonwovens/facts-and-figures) ..................................... 18 Figure 2-2. Lutravil® spunbond system (Dahiya, Kamath, Hegde, Huang, & Gao, 2004, retrieved from http://www.engr.utk.edu/mse/Textiles/Spunbond%20Technology.htm) ....... 23 Figure 2-3. Docan® spunbond system (Dahiya, Kamath, Hegde, Huang, & Gao, 2004, retrieved from http://www.engr.utk.edu/mse/Textiles/Spunbond%20Technology.htm) ....... 23 Figure 2-4. Reicofil® spunbond system (Dahiya, Kamath, Hegde, Huang, & Gao, 2004, retrieved from http://www.engr.utk.edu/mse/Textiles/Spunbond%20Technology.htm) ....... 23 Figure 2-5. The open spunbond process with belt collector by Hills (retrieved from Fedorova, 2006) ....................................................................................................................................... 24 Figure 2-6. The melt blowing process (Retrieved from http://www.engr.utk.edu/mse/pages/Textiles/Melt%20Blown%20Technology.htm) ............ 42 Figure 2-7. Schematic of metering pump (retrieved from http://www.engr.utk.edu/mse/pages/Textiles/Melt%20Blown%20Technology.htm) ............ 43 Figure 2-8. SMS spunbond composite technology (Zimmer AG) .......................................... 58 Figure 2-9. The electrospinning process (Retrieved from http://www.intechopen.com/source/html/8656/media/image1.png) ....................................... 63 Figure 2-10. Cross sectional configurations of different types of bicomponent fibers (Dasdemir et al., 2012) ............................................................................................................ 66 Figure 2-11. Schematic diagram of melt blown setup for bicomponent fibers ...................... 72 Figure 2-12. Hill’s open system for bicomponent spunbond nonwovens (Fedorova, 2006) .. 75 Figure 2-13. (A) spinneret for electrospinning core/sheath bicomponent fiber;(B)TEM image of two as spun fibers and their overlap;(C)TEM image of Ti02(anatase) hollow fibers that were obtained by calcining the composite nanotubes in air at 500℃;(D) SEM image of aligned array of anatase hollow fibers collected across the gap between a pair of electrodes (Li et al., 2004)........................................................................................................................ 76 Figure 2-14. (a) SEM image of PLA/PCL bicomponent fiber; (b) Drug releasing performance (Buschle-Diller et al., 2007).................................................................................................... 77 Figure 2-15. (a) SEM image of PAN/PU “self-crimping bicomponent nanofiber”; (b) schematic of PAN/PU crimp fiber (Lin, Wang & Wang, 2005) ............................................. 79 Figure 2-16. (a) Optical Microscopy image of cross section of segment PA6/PET bicomponent fiber; (b) Micrograph of the appearance of fiber split before post-drawing (x200) (Zhao et al., 2012) ....................................................................................................... 82 Figure 2-17. (a) SEM image of PA6/PLA island in sea bicomponent fiber with half removing PLA; (b) SEM image of bicomponent fiber cross-section; (c) PA6 fiber diameter after removing PLA as a function of number of island (Fedorova et al., 2007) ............................. 83 Figure 2-18. (a) strain at break of homocomponent PET, PA6, PE and bicomponent core/sheath PET/PE, PA6/PE fibers ;(b) interfacial fracture energies between core and sheath polymers;(c) SEM images of cross-section of these two types of bicomponent fibers (Dasdemir et al., 2012) ............................................................................................................ 84

xiii
Figure 2-19. Effect of the second component on the crystallinity of (a) core and (b) sheath components (Dasdemir et al., 2012) ....................................................................................... 85 Figure 2-20. WAXD pattern of homocomponent and bicomponent nonwoven fibers (Dasdemir et al., 2012) ............................................................................................................ 85 Figure 2-21. Straining during air filtration process (Retrieved from ...................................... 96 Figure 2-22. Impingement during air filtration process (Retrieved from http://www.vokesair.com/system/uploads/attachments/0000/0649/Impingement1_large.jpg )................................................................................................................................................. 97 Figure 2-23. Direct interception during air filtration process (Retrieved from http://www.vokesair.com/system/uploads/attachments/0000/0675/Interception1_large.jpg) 97 Figure 2-24. Brownian diffusion during air filtration process (Retrieved from http://www.vokesair.com/system/uploads/attachments/0000/0662/Diffusion1_large.jpg) .... 98 Figure 2-25. Diagram of processing and analysis of patent information (Liu & Yang, 2008)............................................................................................................................................... 126 Figure 2-26. Procedures of unstructured patent data analysis (Tseng et al., 2007) .............. 130 Figure 3-1. Venn diagram of the search approach ................................................................ 138 Figure 4-1. Venn diagram of the hit ratio and noise ratio calculations (adapted from Huang et al., 2015) ............................................................................................................................... 155 Figure 4-2. Search interface of ABI/INFORM Complete .................................................... 174 Figure 4-3. Selection of the type of source in ABI/INFORM Complete ............................. 175 Figure 5-1. Retrieved volume vs. publication years from WOS (top) and EV (bottom) ...... 192 Figure 5-2. Countries with 2 or more publications from WOS (top) and EV (bottom) ....... 193 Figure 5-3. Comparison in document types in WOS (top) and EV (bottom) ....................... 198 Figure 5-4. Air filtration publications in WOS .................................................................... 199 Figure 5-5. Air filtration publications in EV ........................................................................ 200 Figure 5-6. Air filtration patent families trend in DII from basic patent years ..................... 202 Figure 5-7. Air filtration patent applications trend in DII from priority years ..................... 203 Figure 5-8. Air filtration publications in ABI ....................................................................... 204 Figure 5-9. Publications on air filtration among the top 10 countries in WOS .................... 205 Figure 5-10. Publications on air filtration among top 10 countries in EV ............................ 207 Figure 5-11. Patents on air filtration among top 10 countries in DII .................................... 208 Figure 5-12. Document types in WOS .................................................................................. 215 Figure 5-13. Document types in EV ..................................................................................... 216 Figure 5-14. Citations in WOS among the top 10 countries with the most publications ..... 221 Figure 5-15. Comparison of the average times cited per record in WOS among top three countries ................................................................................................................................ 221 Figure 5-16. Overall times cited for research organizations ................................................. 226 Figure 5-17. Countries with the 60 highest cited papers on air filtration in WOS ............... 227 Figure 5-18. Mega-Disciplines of air filtration in WOS ...................................................... 229 Figure 5-19. “Science Overlay Map” on air filtration publications in WOS ........................ 231 Figure 5-20. Growth trends of Macro-Disciplines on air filtration publications in WOS .... 231 Figure 5-21. Topical clustering based on abstracts and titles in WOS ................................. 233 Figure 5-22. Shifts in research topics based on abstracts and titles in WOS ....................... 234

xiv
Figure 5-23. Close-up of shifts in research topics based on abstracts and titles in WOS (1) 235 Figure 5-24. Close-up of shifts in research topics based on abstracts and titles in WOS (2) 236 Figure 5-25. ClusterSuite results from VantagePoint (based on air filtration search from WOS) .................................................................................................................................... 238 Figure 5-26. Clustering from PCA analysis based on WOS air filtration search records .... 239 Figure 5-27. Nonwoven web formation technology terms identified from abstracts across the publication years in WOS and EV combined dataset ........................................................... 253 Figure 5-28. Nonwoven web formation technology terms identified from abstracts across the publication years in DII ........................................................................................................ 254 Figure 5-29. Top organization collaboration auto-correlation map from air filtration search in WOS ...................................................................................................................................... 256 Figure 5-30. Macro-Disciplines of top organizations in WOS ............................................. 257 Figure 5-31. Cross-correlation of top 25 organizations from air filtration search in WOS based on their published sources........................................................................................... 258 Figure 5-32. Citation correlation map on top organizations and papers cited >=50 times in WOS ...................................................................................................................................... 260 Figure 5-33. Close-up on the correlations between publications by University of Cincinnati and 3M Company .................................................................................................................. 260 Figure 5-34. Close-up on the correlation between National Taiwan University and Technical University of Denmark ......................................................................................................... 260 Figure 5-35. Publication trend in nonwoven technologies for making micro and nanofibers in WOS ...................................................................................................................................... 262 Figure 5-36. Publication trend in nonwoven technologies for making micro and nanofibers in EV ......................................................................................................................................... 263 Figure 5-37. Patent trend in nonwoven technologies for making micro and nanofibers based on basic patent years ............................................................................................................. 265 Figure 5-38. Patent trend in nonwoven technologies for making micro and nanofibers based on priority years .................................................................................................................... 266 Figure 5-39. Publication trend in nonwoven technologies for making micro and nanofibers in ABI ........................................................................................................................................ 267 Figure 5-40. “Science Overlay Map” on nonwoven technologies for making micro and nanofibers in WOS ................................................................................................................ 277 Figure 5-41. Clustering based on the nanofiber seed query search in WOS ........................ 278 Figure 5-42. Clustering from PCA analysis based on DII selected nonwoven technologies related records ....................................................................................................................... 283 Figure 5-43. Publications on air filtration using micro and nanofibers made from selected nonwoven technologies in WOS ........................................................................................... 284 Figure 5-44. Publications on air filtration using micro and nanofibers made from selected nonwoven technologies in EV .............................................................................................. 285 Figure 5-45. Patents on air filtration using micro and nanofibers made from selected nonwoven technologies in DII based on basic patent years ................................................. 286 Figure 5-46. Patents on air filtration using micro and nanofibers made from selected nonwoven technologies in DII based on priority years ........................................................ 287

xv
Figure 5-47. Publications on air filtration using micro and nanofibers made from selected nonwoven technologies in ABI ............................................................................................. 287 Figure 5-48. Citations in WOS among the top 10 countries with the most publications on using selected nonwoven technologies for air filtration ....................................................... 297 Figure 5-49. Clustering on publications regarding the use of selected nonwoven technologies for air filter manufacturing in WOS ...................................................................................... 301 Figure 5-50. Clustering on publications regarding the use of selected nonwoven technologies for air filter manufacturing in WOS by years ....................................................................... 302 Figure 5-51. Clusters from PCA analysis on the combined dataset of air filtration and selected nonwoven technology searches in WOS ................................................................. 304 Figure 5-52. Clusters from PCA analysis on the combined dataset of air filtration and selected nonwoven technology searches in EV .................................................................... 305 Figure 5-53. Clusters from PCA analysis on the combined dataset of air filtration and selected nonwoven technology searches in DII .................................................................... 306 Figure 6-1. Sub-system auto-correlation map of air filtration records in WOS ................... 319 Figure 6-2. Development trends of topics from WOS air filtration records ......................... 321 Figure 6-3. Sub-system auto-correlation map of air filtration records in EV ....................... 325 Figure 6-4. Development trends of topics from EV air filtration records ............................ 326 Figure 6-5. Sub-system auto-correlation map of air filtration records in DII ....................... 330 Figure 6-6. Development trends of topics on DII air filtration records ................................ 331 Figure 6-7. Sub-system auto-correlation map of selected nonwoven technology records in DII............................................................................................................................................... 336 Figure 6-8. Development trends of the topics in nonwoven technology subs-systems ........ 339 Figure 6-9. Technology auto-correlation map from WOS and EV combined records ......... 343 Figure 6-10. Technology auto-correlation map from DII records ........................................ 344 Figure 6-11. Forecast of air filtration publications in WOS ................................................. 346 Figure 6-12. Forecast of air filtration publications in EV ..................................................... 347 Figure 6-13. Forecast of air filtration patenting activities in DII (based on priority years) . 347 Figure 6-14. Forecast of air filtration trade journal publications in ABI .............................. 348 Figure 6-15. Forecast of selected nonwoven technology publications in WOS ................... 349 Figure 6-16. Forecast of selected nonwoven technology publications in EV ....................... 349 Figure 6-17. Forecast of selected nonwoven technology patents in DII (based on priority years) ..................................................................................................................................... 350 Figure 6-18. Forecast of selected nonwoven technology publications in ABI ..................... 350 Figure 6-19. Forecast of selected nonwoven technology for air filtration publications in WOS............................................................................................................................................... 351 Figure 6-20. Forecast of selected nonwoven technology for air filtration publications in EV............................................................................................................................................... 352 Figure 6-21. Forecast of selected nonwoven technology for air filtration patents in DII (based on priority years) ................................................................................................................... 352 Figure 6-22. Forecast of selected nonwoven technology for air filtration trade journal publications in ABI ............................................................................................................... 353

1
CHAPTER 1 Introduction
1.1 Statement of the Problem
Nonwovens is a fast growing industry filled with technological innovations and
development. The purpose of the study was to utilize Tech Mining to examine past trends in
nonwoven technologies and nonwoven filtration manufacturing, and to predict the future of
such nonwoven technologies and markets. In order to evaluate the development in nonwoven
technologies and nonwoven filtration manufacturing, extensive use was made of sources such
as journal publications and patent literature.
Academia and industry are both conducting research within the nonwovens area,
however industry has been the major driving force for the research and development on this
subject. The main reason for this is that nonwovens machinery tends to be very large and
expensive and thus beyond the space and budget allocated to academic organizations. Thus,
while fundamental and theoretical studies may emanate from academia, most of the major
innovations and developments arise from manufacturers or specialist organizations, with ready
access to machinery.
Patents and trade secrets are the main ways for industry to prevent its newly invented
technology from being shared or infringed on. There is not a lot that can be published with
respect to trade secrets, except acknowledging their existence. However, patents are accessible
worldwide, and they can contribute a lot to our study. As previous research indicated (Garland,
2013), the nonwovens industry has become highly dependent on patents as a way of protecting
technological innovations, and this, in turn, potentially allows the inventors to benefit from
their discoveries. The number of patents that are filed every year in air filtration medium has

2
increased significantly, and for this application, the number of patents filed by industrial
companies is a lot higher than academia (Garland, 2013). Apart from patents, publications in
science and technology journals, as well as trade journals, are also documented sources that
are believed to be potentially useful in this study.
It is known that different technologies will impart differing features into the products
produced, resulting in varying properties and performance. Hence, how to select an appropriate
technology, or which technology to use for specific applications, needs deliberation. There are
overlaps in the technologies, and the question remains of how to integrate them together to
achieve the desired characteristics for each individual application or product. This study serves
as an attempt to solve the question by matching the desired properties of products with the
most suitable technology.
1.2 Purpose of the Study
The goals of this study were:
• to gain an overview of the state-of-the-art regarding certain nonwoven technologies
and their potential areas of application;
• to match a selected technology with an application;
• to determine other applications where nonwoven technology will prove beneficial
when compared to existing techniques;
• to provide a forecast on the potential growth in the use of the technology.
Specific objectives and questions guiding the study were:
Research Objective 1: Utilize tech mining to provide a summary of the trends and
developments over the past 30 years in the areas of selected nonwoven technologies, mainly
those related to producing micro, submicron, and nanofibers, as well as air filtration fabric

3
manufacturing, by conducting analyses from searches within multiple databases/sources,
including S&T publications, patents and trade journals.
Research Question 1: What is the state-of-the-art in utilization of nonwovens for air
filtration purposes?
Research Question 2: What is the state-of-the-art of emergent nonwoven technologies
that are used for producing nanofibers? What about micro and submicron fibers?
Research Question 3: Can tech mining (i.e. text mining used for technology
management, mostly in high technology areas) be utilized as an effective tool to
facilitate decision making in the area of nonwoven filtration products?
Research Objective 2: Explore and match the desired requirements of the applications or
products with the most suitable technology.
Research Question 4: What are the desired attributes and specifications for certain
specific air filtration applications and why is a certain technology selected for such an
application?
Research Objective 3: Justify if emergent nonwoven technologies can replace the current
technology in use to enhance a product by offering better performance.
Research Question 5: Other than existing applications, what are the other potential
applications that nonwoven technologies can be applied to?
Research Objective 4: Predict the potential growth of nonwoven air filtration R&D activities
and reveal potential future trends of air filtration applications.
Research Question 6: What is the future of emergent nonwoven technologies and their
application in air filtration?

4
It was anticipated that researching the objectives would provide a basis for
recommendations to members of nonwovens supply chains, such as fabric manufacturers, and
post roll goods purchasers.
1.3 Significance of the Study
Existing research on nonwovens technologies has mainly focused on the science and
technology areas. However, very little research has concentrated on technology management
issues within the nonwovens industry, particularly using text mining to investigate these issues.
The nonwovens industry is a large textile segment with huge growth potential, and the R&D
activities happening within the nonwovens industry can be measured by patents and other
publications. The results from the analyses using tech mining, the text mining technique for
high technology areas, revealed the R&D trends and growth. This study filled a research gap
by providing insights into the development in the nonwovens technologies and their
application areas from a technology management perspective. It contributed to the overall
understanding of nonwovens technologies for micro and nanofiber manufacturing, specifically
their use for nonwoven air filtration medium manufacturing. Ultimately, this study offered
implications for researchers and manufacturers looking to target novel nonwoven technologies
for making air filtration fabrics.
1.4 Scope and Limitations of Study
The study added value to the knowledge of technology evolution and trends within the
nonwovens industry, and provides more information regarding how the desired properties of
an application can be achieved by matching it with the most suitable technology; however there
are limitations due to the nature of the study.

5
First of all, the study was conducted only on melt-extrusion nonwovens technology and
its related products. Other nonwovens technologies might not follow the same trend or they
may possess different development cycles. Without studying a variety of different types of
nonwoven technologies, it is risky to make generalizations based on just a few studies. In other
words, additional research is needed to verify whether findings from our study can accurately
represent other nonwoven technologies.
Secondly, so far there is not a specific and effective method to check the quality of
search results retrieved from different databases, and researchers often utilize experts’ opinions
as a way to double check and verify the relevance and the quality of the results of search
queries. Therefore, coverage of the search results was difficult to evaluate. Even with the
hybrid search approach used in this study, the recall and precision of the search results can be
optimized. But there might be some information missing and some irrelevant information
remaining in the data. However, since the purpose of the study was to have a better
understanding of the state-of-the-art on the development of nonwovens technologies, the
overall technology trend would not be affected to a great extent, even with some missing pieces
of information.
Third, the choice of databases and software could affect the results of the study. The
choice of the databases for data collection is dependent on the sources and categories of
information, whether science and technology publications, patents, or business trade journals
and magazines, as well as the accessibility and availability. Moreover, the study utilized only
the tech mining software VantagePoint. If a different software platform was used, the findings
might be different.

6
1.5 Definitions of the Key Terms
This section defines the key terms used throughout the study.
Air Laid/Airlaid/Airlaying
Process
A technology used in the nonwovens industry that
forms webs by dispersing fibers in a fast moving
air stream and then condensing them onto a
moving screen by means of pressure or vacuum
from the air stream (EDANA, 2015; INDA, 2015).
Bicomponent Fibers A.k.a. conjugate fibers, hetero fibers, and
composite fibers. These fibers are produced by
“extruding two polymers from the same spinneret
with both polymers contained within the same
filament" (Dasdemir, Maze, Anantharamaiah, &
Pourdeyhimi, 2012).
The two polymers inside the bicomponent fibers
may have a core-sheath, a side by side, a matrix or
islands in the sea configuration. The main uses of
bicompoenent fibers are as follows: a) One
component with a much lower melting
temperature serves as a binder while the other
component maintains the structural integrity of the
web; b) Producing finer denier fibers by splitting
the two components using mechanical method,

7
such as hydroentangling, or dissolving (EDANA,
2015; INDA, 2015).
Dry Laid/Dry Laying/Drylaid/
Dry-laid Process
A technology which forms nonwoven webs from
dry fibers using carding equipment (INDA, 2015).
Air laying (formation of random webs with a
stream of air) is also considered to be part of dry
laying by EDANA (EDANA, 2015). Mechanical
methods (carded webs), aerodynamic methods
(air-lay webs), and combined mechanical-
aerodynamic methods are the three drylaid web
forming methods (Jirsak & Wadsworth, 1999).
Electrospinning A.k.a. electrostatic web forming or laying
(EDANA, 2015; INDA, 2015). A process using
electrostatic forces to produce fine fibers from a
polymer solution or melt (Kim & Reneker, 1999;
Wang, Drew, Lee, Senecal, Kumar & Samuelson,
2002). The fibers are formed by ejection from a
charged jet when the electric force between a
suspended droplet solution or melt at a capillary tip
and collector surpasses the surface tension of the
solution or melt (Lee & Obendorf, 2007). It is a
simple and effective process to form a web of
8
fibers, especially microfibers and nanofibers (Lee,
Kim, Ryu, Kim & Choi, 2003).
Filter Fabric A cloth or material “used to separate particles from
their suspension in air or liquids” (EDANA, 2015,
p.20; INDA, 2002, p.23).
Filter Media/Medium “A filter medium is any material that, under the
operating conditions of the filter, is permeable to
one or more components of a mixture, solution, or
suspension, and is impermeable to the remaining
components.” (Purchas & Sutherland, 2002, p.1)
“Material that makes up the filter element. Media
can be made of a variety of materials, woven
metal, sand, fiber, ceramics, etc.” (INDA, 2002,
p.23)
It can provide “a clear separation of particulates
(or sometimes other components)” from a fluid
with the lowest energy consumption possible
(Wakeman & Tarleton, 2005).
Filtration “A mechanism or device for separating one
substance from another”, and it can “separate
contaminants from a fluid or separate value-added
materials, such as minerals, chemicals, or
foodstuffs in a process operation” (Butler, 1999).

9
Flash Spinning/Flashspinning A type of dry-spinning, which flashes out multiple
filaments from one orifice by obtaining a polymer
solution from a mixture of an organic solvent and
polymer dissolved at a high temperature (Kubo &
Watanabe, 1994).
It is regarded as a modified spunlaid method since
a solution of a polymer and solvent is being
extruded from the spinneret at the same time as the
solvent evaporation happens when leaving the
spinneret. The individual filaments are disrupted
into a highly fibrillar form and formed into a web
when deposited onto a moving screen (EDANA,
2015; INDA, 2015).
Melt blowing/
Meltblowing/Melt-
blowing/Melt blown/
Meltblown
“A nonwoven web forming process that extrudes
and draws molten polymer resins with heated, high
velocity air to form fine filaments. The filaments
are cooled and collected as a web onto a moving
screen. In some ways the process is similar to the
spunbond process, but melt blown fibers are much
finer and generally measured in microns. Melt
blowing is a spunlaid process.” (INDA, 2002,
p.36)

10
Microfibers Fibers with a diameter of 1 µm to 10 µm (Batra &
Pourdeyhimi, 2012).
Nanofibers Fibers at nanoscale, with size ranging from about
1nm to 100nm, according to ISO and ASTM
standards (Klaessig, Marapese & Abe, 2011).
or
A fiber diameter within a range of 100 to 300nm is
generally accepted as nanofibers by the nonwoven
and textile industry (Batra & Pourdeyhimi, 2012).
Nonwoven/Nonwovens “A manufactured sheet, web, or batt (with)
directionally or randomly oriented fibres bonded
by friction and/or cohesion and/or adhesion,
excluding paper and products that are woven,
knitted, tufted stitchbonded incorporating binding
yarns or filaments, or felted by wet-milling,
whether or not additionally needled.
The fibres may be of natural or man-made origin.
They may also be staple or continuous filaments or
be formed in situ.” (EDANA, 2015, p.33)
“A fabric made directly from a web of fiber,
without the yarn preparation necessary for
weaving and knitting” (INDA, 2002, p.40).

11
Patent “…a grant to the patentee…of the right to exclude
others from making, using, offering for sale, or
selling the invention throughout the United
States…for a term beginning on the date on which
the patent issues and ending 20 years from the date
on which the application was filed…” (quoted
from U.S. Patent Law Title 35 United States Code
§ 154)
Polymer Laid A.k.a. spunlaid web forming, melt spun/spinning
web forming, or spunmelt nonwovens. One of
three major web forming technologies in
nonwovens, other than wet laid and dry laid
(Wilson, 2007). See Spunlaid.
Spunbond/Spunbonded “A spunlaid technology in which the filaments
have been extruded, drawn and laid on a moving
screen to form a web. The term is often
interchanged with ‘spunlaid’, but the industry had
conventionally adopted the spunbond or
spunbonded term to denote a specific web forming
process.” (INDA, 2015, p.53).
Spunbond Melt Blown
Composite
A type of nonwoven fabric made of alternating
layers of spunbond (S) and melt blown (M) webs
and combining them into one multi-layered

12
nonwoven web. Examples include SM, SMS,
SMMS, SMSMS, SSMS, etc. (Butler, 1999;
INDA, 2015). It is considered to be multi-denier
spinning (Butler, 1999).
Spunlaid A nonwoven web forming process which involves
melting and extruding the polymeric melt or
solution through spinnerets into filaments and
forming a continuous web by laying the filaments
down on a moving screen (INDA, 2015).
“Melt spun forming processes include spunbond,
flash spinning and melt blown. The most common
polymers used are polypropylene, polyester and
polyethylene.” (INDA, 2015, p.54)
Tech Mining First used by Allan Porter, it refers to text mining
of publications within high technology areas. More
specifically, tech mining strives to inform science,
technology and innovation (ST&I) management
by applying text mining within science and
technology related information (Porter, 2007).
Tech mining specializes in “exploiting this
information to see patterns, detect associations,
and foresee opportunities” (Porter & Cunningham,
2005, p. 18).

13
Technology Management “Technology management addresses the effective
identification, selection, acquisition, development,
exploitation and protection of technologies
(product, process and infrastructural) needed to
achieve, maintain [and grow] a market position
and business performance in accordance with the
company’s objectives.” (European Institute of
Technology and Innovation Management, EITIM)
Text Mining A.k.a. “text analytics”, “text data mining”, and
“text analysis”. It is a data mining technique used
to process and analyze textual data to help
researchers deal with information overload, to
extract useful pieces of textual information, to
monitor the development related to technological
innovations, and to reveal the patterns or trends
“hidden” in textual documents (Cohen & Hersh,
2005; Wu et al., 2011; Kostoff et al., 2001).
Wet Laid/Wetlaid “A fibre web produced by the wetlaying
technique” (EDANA, 2015, p.51). The wetlaying
technique is “Forming a web from an aqueous
dispersion of fibres by applying modified paper
making techniques” (EDANA, 2015, p.51).

14
“To distinguish nonwovens from papers, a wet laid
material will be defined as nonwoven if:
More than 50%, by mass, of its fibrous content is
made up of fibers (excluding chemically digested
vegetable fibers) with a length to diameter ratio
greater than 300:
or
More than 30%, by mass of its fibrous content is
made of fibers in “a” above and meet one or both
of the following criteria:
Length to diameter ratio of more than 600.
The density of the fabric is less than 0.4 g/cc.”
(INDA, 2015, p.62)
1.6 Summary
This chapter proposed the purpose of the study and briefly provided relevant
background information. Questions and objectives of the research, significance of the study,
scope and limitations of the study, and key terms were also discussed. The next chapter
presents a review of literature pertinent to the study.
15
CHAPTER 2 Literature Review
In order to maintain the cohesive flow of this dissertation, the literature review has been divided
into two parts. Part one (Chapter 2 (A)) focuses on nonwoven technologies and filtration
applications. Part two (Chapter 2 (B)) concentrates on technology management reviews and
issues, and introduces the concept of tech mining into the study.
Chapter 2 (A) Literature Review on Nonwoven Technologies and Filtration
The growth of the nonwovens industry is significantly higher than the average growth rate of
the conventional textile industry. Nonwoven fabrics are engineered fabrics, and the end
products can be either disposable, single use, short-term use, or durable, depending on the
manufacturing process and techniques used (Wilson, 2007). The nonwovens industry has a
wide range of end-product applications, including medical, hygiene, automotive, and even
construction, because various raw materials are used, and different processes and technologies
are applied during manufacturing.
2.1 The Development of Nonwovens and its General Process
2.1.1 Definition of Nonwovens
INDA, North America’s Association of the Nonwoven Fabrics Industry, defined
nonwoven fabrics as “a fabric made directly from a web of fiber, without the yarn preparation
necessary for weaving and knitting” (INDA, 2015). Typically, the nonwoven manufacturing
process is composed of the following steps: raw material preparation, web formation, web
consolidation and bonding, and finishing (Batra & Pourdeyhimi, 2012). Similarly, the
European Disposables and Nonwovens Association (EDANA) (2015) considers nonwovens to
be “a manufactured sheet, web, or batt of directionally or randomly oriented fibers bonded by

16
friction and/or cohesion and/or adhesion” (p.33). EDANA (2015) specifically mentions that
paper is not a nonwoven product based upon its definition that in nonwoven products, “more
than 50% by mass of its fibrous content is made up of fibers (excluding chemically digested
vegetable fibers) with a length to diameter ratio greater than 300” (Wilson, 2007). The
definitions given by INDA and EDANA have been mostly commonly used throughout the
years (Jirsak & Wadsworth, 1999).
2.1.2 The Development of Nonwovens
More than 50 years ago, nonwovens were commonly referred to as cheap substitutes
for traditional textiles and were manufactured from drylaid carded webs using converted textile
processing machinery. The nonwovens industry first started in the 1950s in Eastern Europe,
and the process of stitchbonding is the prototype of nonwovens (Wilson, 2007). The
developments in the paper and synthetic fiber industry also have influenced the nonwovens
industry (Wilson, 2007). Nowadays, the nonwovens industry has expanded its developments
into engineering and natural science fields, other than the textile, paper and polymer processing
industries.
Generally, there are three processes to form a web in the nonwovens industry: the wet
process, the dry process, and the melt process. Both the wet and the dry process transform
fibers into nonwoven webs while the melt process converts the polymer to nonwoven webs.
The wet process is similar to the papermaking process and is defined as “forming a web from
an aqueous dispersion of fibres by applying modified paper making techniques” (EDANA,
2015, p.51). Therefore, it is used to form paper-like nonwoven products and glass nonwovens.
The dry process uses either an air laid, dry laid (carding) or combined mechanical-aerodynamic
process to manufacture nonwoven products (Jirsak & Wadsworth, 1999). The melt process

17
makes nonwoven webs from resin, and two major technologies involved are the meltblown
and spunbond processes.
2.1.3 The Nonwovens Market
The EDANA-INDA Worldwide Outlook report listed the average annual growth rate
of nonwoven roll goods production from 2001 to 2011 at 6.8%, which had gone down a little
from the previous 10 years, and the report forecasted that nonwovens production of roll goods
worldwide will reach over ten million tonnes by 2016, with a higher annual growth rate of
7.6% on average (EDANA & INDA, 2012). According to the 2011 report, the production of
nonwoven roll goods was 7.31 million tonnes globally, the quantity reached 167 billion square
meters, and the global nonwovens industry generated 26.4 billion dollars in revenue (EDANA
& INDA, 2012).
Due to the versatility of nonwovens, there is a huge range of nonwoven products on the
market, ranging from geo textiles to diapers and other hygiene products. According to EDANA
(2012), the biggest market based on the volume of nonwoven roll goods is hygiene products,
occupying 32.5% of the total market size; followed by nonwovens used for construction
purposes, which accounts for 17.8% (with building/roofing and civil engineering/underground
combined); then wipes with 16.1%; upholstery/table linen/ households with 4.9%; automotive
with 4.8%; and filtration at 4% (EDANA, 2012) (See Figure 2-1 for the breakdown of the
application based nonwoven market segments). Since the current study was focused on
nonwoven filtration applications, more information on this area will be provided later in the
chapter. Although 4% is a small part of the entire nonwovens market, this still accounts for
over one billion dollars in revenue.

18
Figure 2-1. The market segments based on volume of nonwoven roll goods in 2012 (retrieved from http://www.edana.org/discover-nonwovens/facts-and-figures)
2.1.4 The Nonwovens Process
As mentioned earlier, the typical nonwovens process consists of the following four
steps: raw material preparation, web formation, bonding, and finishing. The wide range of raw
materials, different web formation processes combined with various bonding and finishing
techniques produces a large variety of nonwoven fabrics which enables the creation of many
different final applications.
2.1.4.1 Raw Materials
Raw material selection and preparation is the first stage for nonwovens production.
Both natural and man-made materials can be used to manufacture nonwovens, with man-made
fibers making up 90% of total nonwovens production output (Wilson, 2007). Man-made fibers
can be categorized into the following three groups based upon the sources of materials; those

19
made from “natural polymers”, from “synthetic polymers”, and from “inorganic materials”
(Wilson, 2007). Wilson (2007) also cited a study by Tecnon Ltd, pointing out that the most
commonly used fibers for nonwovens are polypropylene (PP) (63%), polyester (PET) (23%),
and viscose rayon (8%).
2.1.4.2 Web Formation
As mentioned previously, there are three main types of technologies being used in the
web formation process in nonwovens: dry laid, wet laid, and polymer laid (Jirsak &
Wadsworth, 1999; Wilson, 2007). Additionally, the fiber lengths used for those processes vary.
For instance, the fibers can “range from 0.25 inch to 6 inches for crimped fibers” or be
“continuous filament” if using spunbond technology (INDA, 2015). Polymer laid web forming
is also known as spunlaid web forming, melt spun/spinning web forming, or spunmelt
nonwovens. By extruding the polymeric melt or solution through spinnerets into filaments, it
forms a continuous web which is bonded into a fabric (INDA, 2015). The melt spun web
forming processes include spunbond, meltblown, and flash spinning (INDA, 2015). Wilson
(2007) counts aperture film and composites made of the aforementioned materials to be part
of polymer laid nonwovens (Wilson, 2007). However, the inventor for flash spinning
technology, DuPont, considered its product Tyvek, made by the flash spinning method, to be
a spunbond product. Further input concerning flash spinning comes from Jirsak and
Wadsworth (1999) who indicate that flash spinning is dry spinning based spunbond method.
2.1.4.3 Web Bonding
For bonding, INDA (2015) describes that for nonwovens fabrics, “the assembly of
textile fibers is held together” by “mechanical interlocking”, “fusing of the fibers”, or “bonding
with a cementing medium”, referring to mechanical, thermal or chemical bonding processes,

20
respectively, and the bonding process influences the potential final application. Also, it is now
common that the web forming and bonding are often connected in one continuous production
line (Jirsak & Wadsworth, 1999).
2.1.4.4 Fabric Finishing
The last stage is finishing. During this process, fabric functionality can be altered by
applying finishing treatments to enhance the performance of the nonwoven fabrics.
Although the spunbond and meltblown processes have a relatively shorter history
within the nonwovens industry, they are both considered to be widely used technologies in
nonwovens manufacturing due to their high production volume and speed (Batra &
Pourdeyhimi, 2012). These two technologies and their processes of manufacturing nonwoven
products will be discussed in detail in this chapter.
2.2 Spunbond Technology
2.2.1 The History and Development of the Spunbond Technology
According to INDA (2002), spunbond can be defined as “a spunlaid technology in
which the filaments have been extruded, drawn and laid on a moving screen to form a web”.
This terminology is often used interchangeably with “spunlaid”; however the nonwovens
industry has adopted the spunbond or spunbonded terms to explain this specific web forming
process (INDA, 2015). The spunbond process involves melting the polymers, then extruding
the polymer resin through the spinning packs to form fibers, followed by drawing the filaments
using high velocity air and collecting these onto the conveyor belt to form webs. This is
followed by some bonding technique, and an optional finishing procedure, before finally
slitting and winding them into rolled goods.

21
The spunbond process was developed simultaneously in Europe and in the United
States in the 1940s through 1950s, and it did not gain much popularity until the mid-1960s to
early 1970s. The first few patents related to the spunbond process dated back to the 1940s. One
patent was by Slather and Thomas of Corning Company for glass wool production in 1940,
and another one was by Callender for the mineral wool production process in 1945 (Fedorova,
2006; Lim, 2010; Zhang, 1996). Table 2-1 displays the development of the major spunbond
systems and products from 1950s to 1990s. The U. S. company DuPont in the late 1950s and
the German company Freudenberg in the 1960s both commercialized the spunbond nonwovens
process using synthetic polymers as raw materials (Bhat & Malkan, 2007; Fedorova, 2006;
Hill, 1990; Lim, 2010). Other major technological innovations and breakthroughs in spunbond
technologies began to appear starting in the mid-1960s, including different spunbond
processes, such as Lutravil® (by Freudenberg, Germany), Docan® (by Lurgi Kohle & Mineral
öltechnik GmbH, Germany), Reicofil® (by Reifenhäuser, Germany), RFX® (by Amoco Fibers
and Fabrics, USA), S-TEX® (by Sodoca, France), Ason spunbond technology (developed by
Ason Enginnering Inc., U.S., and acquired by Oerlikon Neumag in 2002). This resulted in new
products (Bhat & Malkan, 2007; Fedorova, 2006; Lim, 2010). Figures 2-2 through 2-4 show
some of the spunbond systems, and while they vary in some aspects, they all have an integrated
manufacturing process, composed of filament extrusion/spinning, drawing, lay-down, bonding
and winding (McCulloch, Pourdeyhimi, & Zamfir, 2003).

22
Table 2-1 Early major technological innovations in the spunbond process and products (Adapted from literature by Batra & Pourdeyhimi, 2012; Bhat & Malkan, 2007; Fedorova, 2006; Hill, 1990) Year
Company
Spunbond Technological Breakthroughs (systems and products)
Descriptions
1965 Freudenberg Lutravil®, and produced Viledon M®
Spunbond process which can process mixed polyamides (Bhat & Malkan, 2007; Fedorova, 2006)
1965
DuPont (sold to Fiberweb in late 1980s)
Reemay® Spunbond nonwovens made of polyester (Bhat & Malkan, 2007; Fedorova, 2006; Hill, 1990)
1965 DuPont Tyvek® High-density polyethylene by flash-spinning method (Bhat & Malkan, 2007; Fedorova, 2006; Hill, 1990)
1968
DuPont (sold to Fiberweb in late 1980s)
Typar® Spunbond polypropylene products (Bhat & Malkan, 2007; Fedorova, 2006; Hill, 1990; US Patent no. 3,563,838)
1970
Lurgi Kohle & Mineral öltechnik GmbH
Docan® Based on long spinning at a high speed, and production equipment that is four floors high. (Bhat & Malkan, 2007)
1984 Reifenhäuser Reicofil® Webs from polypropylene (Bhat & Malkan, 2007; Fedorova, 2006)
Late 1990s
Ason Engineering Inc. (Acquired by Oerlikon Neumag in 2002)
Formerly Ason spunbond, now Oerlikon Neumag spunbond process
Uses water mists for quenching, and air mixed with water mists (cool mist air) for drawing; claim high speed spinning process: up to 6,000 m/min or higher for polypropylene, 8,000 m/min or higher for polyester. (Batra & Pourdeyhimi, 2012; Fedorova, 2006)

23
Figure 2-2. Lutravil® spunbond system (Dahiya, Kamath, Hegde, Huang, & Gao, 2004, retrieved from http://www.engr.utk.edu/mse/Textiles/Spunbond%20Technology.htm)
Figure 2-3. Docan® spunbond system (Dahiya, Kamath, Hegde, Huang, & Gao, 2004, retrieved from http://www.engr.utk.edu/mse/Textiles/Spunbond%20Technology.htm)
Figure 2-4. Reicofil® spunbond system (Dahiya, Kamath, Hegde, Huang, & Gao, 2004, retrieved from http://www.engr.utk.edu/mse/Textiles/Spunbond%20Technology.htm)

24
A large number of innovations and R&D activities related to spunbond technology
happened in the 1990s and 2000s. In addition to the equipment suppliers mentioned previously,
other spunbond equipment suppliers began to provide complete spunbond lines in the 1990s,
such as Kobelco, Nordson, STPI, Hills, ICBT (now Rieter), and Inventa-Fisher (Fedorova,
2006; Hagewood, 2006). Moreover, hygiene and medical nonwoven suppliers, led by
Kimberly-Clark, began to focus more on the spunbond meltblown spunbond composite
materials (Hagewood, 2006). There was also an expansion and consolidation of roll goods
manufacturers globally in the 1990s (Hagewood, 2006). Reifenhauser and Nordson started to
utilize the bicomponent technology from Hills to produce bicomponent spunbond and
meltblown nonwovens (Fedorova, 2006; Hagewood, 2006). The Hills open spunbond system
and Hills bicomponent technology has become popular in the specialty fibers and nonwovens
market due to the added value. Oerlikon Neumag become a new player in the spunbond lines
supplier market, while Kobelco and Inventa-Fisher left the market (Hagewood, 2006). Among
the companies offering machinery for spunlaid nonwovens in the market, Reifenhäuser is the
leader in supplying spunbond lines, occupying around 70% of the spunbond equipment market
(Bhat & Malkan, 2007).
Figure 2-5. The open spunbond process with belt collector by Hills (retrieved from Fedorova, 2006)

25
2.2.2 Description of the Spunbond Process
Malkan and Wadsworth (1992) list four simultaneous stages of the integrated spunbond
process: filament extrusion, drawing, laydown, and bonding. During the spunbond process (see
Figure 2-5), a thermoplastic polymer is prepared, melted, extruded through the spinneret,
quenched, drawn and deposited on the moving belt or screen in the form of a web composed
of randomly dispersed continuous filaments, and then this is followed by various bonding
methods (Batra & Pourdeyhimi, 2012). The typical spunbond system components include a
polymer feed, an extruder, a metering pump, a die block (spin beam) assembly, a filament
spinning and quenching zone, a drawing and deposition zone, a collecting belt, a bonding zone,
and a slitting and winding unit (Zhang, 1996).
The process starts with polymer preparation by drying and crystallizing (required for
PET only) polymer granules or chips in large enclosed silos with warm air passing through
(Batra & Pourdeyhimi, 2012). Then the polymer feedstock is transported, in a granular, powder
or pellet form, from the storage silos to the dosing station where pigments, stabilizers, resin
modifiers or other additives can be added; and the polymer chips are delivered into an extruder
afterwards. The importance of polymer preparation is to provide the extrusion system with dry
polymer chips and to mix the materials in proper amounts by adding pigments and additives
for achieving certain specific product properties (Martin, 2009).
Normally, a single extruder is used for the extrusion process in spunbond. A few
companies utilize vented twin screw extruders in the process since they can dry the polymer
as it melts (Fedorova, 2006). Martin (2009) states that single screw extruders are not good
choices for dispersive mixing, but still can obtain good distributive mixing, and they are cheap
and easy to maintain, compatible with a wide range of extrusions via the ability to generate

26
pressure at the die; on the other hand, co-rotating twin screw extruders, continuous internal
mixers, and batch mixers (the Banbury mixer) can provide good dispersive mixing, but they
are complex, expensive, and limited to pellets because of the lack of pressure generation
needed at the die. The extrusion system design is of great importance as it supplies a molten
polymer flow through the die at a constant temperature and economic rate, affecting the quality
of the polymer melt and thus the fiber formation; and it also has to be flexible enough for
homogenizing a large variety of materials (Martin, 2009; McKelvey, 1962). The raw material
is conveyed along the extruder barrel through the turning of the screw. The polymer chips
inside the extruder are pressurized and melted along the barrel due to the heating and friction
between the melt/granulate and the screw/barrel, which transfers mechanical energy to thermal
energy (Batra & Pourdeyhimi, 2012; Fedorova, 2006; Turbak, 1993; Zhang, 1996). Typically,
a high length to diameter (L/D) extruder is recommended, since it increases the polymer
residence time for melting and mixing, allowing the melt temperature to achieve its equilibrium
(Cheng, 1994). Moreover, semi-crystalline polymers need more energy during the melting
process than amorphous polymers (Martin, 2009). After the blend of raw materials is melted
and homogenized inside the extruder, it is pumped through a resin filter system (Cheng, 1994).
The filter separates the molten polymer from foreign and contaminating particles, such as
metals and solid polymer particles. Screen changers are used in coarse filtration and small
areas, and they are commonly used for PP (Hagewood, 2006). On the other hand, “candle”
filters are used in fine filtration and large areas, and PET and multicomponent machines quite
often use such filters (Hagewood, 2006). After filtering, the polymer melt goes to a metering
pump, which provides the spinneret a precise volumetric flow of the molten polymer at a
constant rate while building up high pressure inside the spin beam (Batra & Pourdeyhimi,

27
2012). A constant polymer flow rate is critically important to maintain a uniform basis weight
of the final product. The number of pumps in the spunbond system depends on the type and
the width of the spunbond machine. Inadequate quality of the polymer melt affects the
subsequent performance of the fiber spinning operation, causing spinneret holes to become
blocked, filament breakage, lower machine efficiency, a high chance of machine downtime,
and poor final product quality (Cheng, 1994; Martin, 2009). As a result, all parts of the
extrusion system must be designed, built and combined together to make sure that the molten
polymer is transferred to the spinning beam assembly with the minimum degradation, yet
maintaining the highest purity and homogeneity.
The molten polymer then moves from the metering pump to a die block assembly. The
die block assembly in the spunbond process is connected to the discharge side of the metering
pump. As one of the most important parts of the spunbond process, the die block assembly
contains a polymer feed distribution and a spinneret (Fedorova, 2006; Zhang, 1996). According
to Zhang (1996), the polymer feed distribution is used to “balance the flow and the residence
time across the width of the die” (p.8). The feed distribution system consists of a system of
plates, which distributes the polymer flow across the width of the die evenly in order to provide
a uniform molten polymer flow to each orifice and a uniform temperature to the polymer flow
(Batra & Pourdeyhimi, 2012; Fedorova, 2006). Past research determined that there was
variation in the viscosity of the melt due to the temperature differences in the spin beam. Thus,
in order to provide uniform heating to the spin beam, a cavity filled with circulated fluid, heated
using internal electric immersion heaters or external heaters, is designed inside the spin beam
(James, 1997; Sievering & Waltermann, 1997). The polymer feed distribution system passes
the polymer melt to the spinneret. The spinneret is a single block of metal with several thousand
28
orifices (e.g. 6,000 holes/m), and they are usually in circular or rectangular shapes (Batra &
Pourdeyhimi, 2012; Zhang, 1996). Commercial spunbond lines can contain multiple groups of
spinnerets to offer a wider coverage of filaments, depending on the desired width of the fabric
(Fedorova, 2006; Zhang, 1996). The polymer melt is pushed through small orifices in the
spinneret plate to form a series of continuous filaments.
The extruded filaments move downward into a quench chamber to cool down and
become solidified by being exposed to a stream of cool air. During quenching, the factors
affecting the cooling and solidification of the filaments are air flow rate, air temperature, and
humidity (Fedorova, 2006). A one-sided or two-sided stream of quenching air can be arranged
(Fedorova, 2006). Another stream of high velocity compressed air parallel to the direction of
the filaments comes in, which enables the attenuation of the fibers. The attenuation process not
only provides filaments with higher strength by increasing the molecular orientation, but also
it results in the modification of other filament properties, including smaller fiber diameters
(Fedorova, 2006). Moreover, Rwei, Jue & Chen (2004) states that filament strength is usually
dependent upon the weakest link between two crystallites. So the tenacity and elastic properties
(initial modulus) of the fibers are mainly determined by the fiber bulk orientation rather than
the crystallinity, which emphasizes the importance of the attenuation process. But previous
studies have indicated that filament attenuation starts right after the filaments exit the spinneret
(Bhat & Malkan, 2002). The most common way is to attenuate the filaments by air, and other
methods for filament attenuation include using takeup (draw-off) rolls or an electrostatic field
(Fedorova, 2006). Takeup rolls are not commonly used because of the high cost (Fedorova,
2006). Filaments attenuated with rolls are considered as fully drawn yarn (FDY) and tend to
have a very narrow diameter distribution (Fedorova, 2006). Attenuation of filaments using air

29
jets costs less, but results in a wider distribution of the fiber diameters (Fedorova, 2006). For
example, Docan uses a closed system for quenching and aspirator slots (multiple aspirators can
be used in a row and each aspirator can hold 15 to 100 filaments) with compressed air in their
attenuation process, resulting in filament speeds between 3,000 to 8,000 m/min (Batra &
Pourdeyhimi, 2012; Fedorova, 2006). In the 1980s, Reicofil by Reifenhauser developed an
enclosed system, containing the spinneret, quenching zone and drawing zone, to provide
drawing force twice facilitated by full width adjustable slots and a pressurized quench chamber
air for filament attenuation. However, this system cannot process melt spinning at a high speed
(above 2000 m/min) (Batra & Pourdeyhimi, 2012; Fedorova, 2006). Later in the Ason
spunbond process (developed in the late 1990s, and then acquired by Oerlikon Neumag in
2002), the traditional quenching and drawing system was adapted by placing water mist at the
die exit, so the water mist is used to quench the filaments, and the air for drawing is mixed
with water mist to draw the filaments. Also, the placement of the draw system and web
collection system can be adjusted up and down (Batra & Pourdeyhimi, 2012; Fedorova, 2006).
Afterwards filaments are deposited onto a moving perforated belt to form a random
nonwoven web. An air vacuum is equipped underneath the belt and can help fiber filament
drawing, web formation and eliminates the air used for filament cooling and stretching
(Malkan, 1995). One important part during the laydown stage is to make sure the individual
filaments are separated before laying down on the belt, so the webs can obtain the maximum
uniformity, ropiness free, and cloudiness free (Fedorova, 2006; Gilmore, 1992). One method
is to impose an electrostatic charge to separate the filaments (Gilmore, 1992). It was discovered
by Kinney of DuPont in 1958 to develop uniform spunbond webs by imposing a certain level
of electrostatic charge and a certain air flow rate in the attenuator (Gilmore, 1992; Kinney,

30
1967). The triboelectric charge is obtained by rubbing filaments going downwards onto a
dielectric material (Kinney, 1967). However, Kinney’s triboelectric charging method can only
be applied to coarse filament nonwovens because the drawing tension between spin beam and
triboelectric charging bar is drastically reduced (Batra & Pourdeyhimi, 2012; Gilmore, 1992).
An electrostatic charge to filaments method using the corona discharge technique was claimed
(Gilmore, 1992; U.S. Patent no. 3,163,753). Kinney (1967) also demonstrated the corona
charging technique using round attenuator guns in another patent (U.S. Patent no. 3,341,394),
and this technique is an improvement in safety and the loss of tension issue compared to the
triboelectric charging method (Gilmore, 1992; Batra & Pourdeyhimi, 2012). Later, Monsato
filed a patent utilizing corona charging as well (Lim, 2010). The process imparts the
electrostatic charge onto the filaments when passing through a corona produced between high
voltage electrodes and grounded bar/plate, a.k.a. “target electrode” (Batra & Pourdeyhimi,
2012; Gilmore, 1992). Moreover, for heavy basis weight spunbond webs, another technique
for filament separation and laydown is mechanical oscillation using deflector plates, and later
using the attenuator gun or “curtains” of filaments bundles themselves, offering a better
“MD/CD tensile ratio” (Fedorova, 2006; Gilmore, 1992). The collecting belt surface is
perforated so that the air stream can pass through the belt to prevent deflection, and most of
the time the filaments are laid down randomly along the moving direction of the collecting
belt, causing the filaments to more likely maintain a machine direction orientation (Fedorova,
2006). Also, Zhang (1996) agrees that the air flows and screen speed both determine the fiber
orientation relative to the MD direction, and the output rate of the extruder and the speed of
the collecting belt affects the basis weight of the web. Fedorova (2006) also points out that the
appearance of the formed web can be changed by altering “the collecting belt speed, the period

31
of traverse, and the width of the filament curtain being traversed” (p.39). Other means for
filament separation and laydown include air foils, full-width draw rolls, mechanical oscillation,
slot attenuators, and centrifugal forming (Gilmore, 1992). The belt conveys the web to the
bonding station to implement the web bonding process.
The next step is to bond the webs made of loose continuous filaments into fabrics.
Either one or more mechanical, thermal, or chemical bonding methods can be used in this step,
and more details of bonding methods will be discussed in the following section 2.2.3.2. The
bonded fabric may add some optional finishing process to provide a new property or
appearance, such as using washing, dyeing, thermal stabilization, printing, embossing,
perforating, laminating, stretching, and kiss roll technology (Batra & Pourdeyhimi, 2012).
Slitting and winding is the final stage of the spunbond process. During this process, the
fabric is trimmed from both sides to eliminate rough, non-uniform edges, and prevent
interweaving, and then the fabric is slit to required width(s) and wound into rolls according to
the customer’s requirements.
2.2.3 The Parameters Affecting the Spunbond Process
As mentioned earlier, a typical spunbond system contains the following elements: a
polymer feed, an extruder, a metering pump, a die block assembly, a filament spinning, a
filament drawing and deposition system, a collecting belt, a bonding zone and a winding unit
(Zhang, 1996). The spunbond process is being greatly affected by the following five
operations: filament extrusion, drawing, quenching, lay down, and bonding (Fedorova, 2006).
All of these have been discussed previously. Beside those operation-related factors, there are
some other factors which are also very important.

32
2.2.3.1 Polymer Types
The selection of polymer is determined by the end-use. To achieve the desired product
properties, specific attributes associated with the polymer resins must be considered, including
melt flow rate, additives, molecular weight, and molecular weight distribution (Cheng, 1994).
Cheng (1994) also states that a “relatively low melt temperature at moderately high output
rate” is desired for the spunbond extrusion process, as it can provide a quality and stable
polymer melt (p.167). Jirsak and Wadsworth (1999) suggest using medium melt-viscosity
polymers (those widely used for melt spinning) for the spunbond process. Generally,
thermoplastic polymers with high molecular weight and broad molecular weight distribution
such as polypropylene (PP) and polyester (PET) are the most frequently selected types used in
spunbond technology (Batra & Poudeyhimi, 2012). Most commercial spunbond nonwoven
fabric are made from isotactic PP, accounting for 79% of the total output globally, and PET
comprises 15% of the total output (INDA, 2008). A small percentage is made from polyamide,
and a growing amount is made from high-density polyethylene (HDPE) (Hagewood, 2006;
INDA, 2008). Moreover, the nonwovens industry is experimenting new polymers with
spunbond technology in order to create new properties for spunbond nonwovens. Novel
polymers, including renewable bio-polymers like Poly Lactic Acid (PLA), elastomers, and co-
polymers (PE/PP, PE/PET, Co-PET/PET, PA/PET, PET/PP), are all being examined (Batra &
Poudeyhimi, 2012; Fedorova, 2006; Hagewood, 2006). PP and PET are widely used due to
“commercial viability”, and they are also compatible with most spunbond systems (Batra &
Poudeyhimi, 2012) For example, PP is commonly used because it has a low price, a large
abundance and possesses properties such as low density, chemical resistance, hydrophobicity,
and sufficient strength. Batra and Poudeyhimi (2012) listed a group of polymers typically used

33
for the spunbond process, their operating temperature, and viscosity values. This list is shown
in Table 2-2. The operating temperature listed below refers to the highest temperature the
process reaches before any degradation happens, and it is often a lot higher than the melting
temperature of the polymer (Batra & Poudeyhimi, 2012). Since the viscosity and the
temperature control the molten polymer flow, the desired polymers should have low melt flow
index (MFI) (about 20–40 g/10 min) and a polydispersity ratio (M w/M n) of around 3.5–7.
Table 2-2 List of polymers and their viscosity values at operating temperatures
Note. Source from Introduction to Nonwovens Technology, p. 205, by S. K. Batra and B. Poudeyhimi, 2012, Lancaster, PA: DEStech Publications.
The properties of the spunbond nonwoven webs and fabric, such as temperature
resistance, and chemical and light stability, are determined by the polymer and additives used
(Bhat & Malkan, 2002). Hence, the selection of raw material is determined by the required
end-use product properties.
2.2.3.2 Bonding Methods Used in the Spunbond Process
Mechanical, thermal, and chemical bonding techniques can all be applied to spunbond
webs (Batra & Pourdeyhimi, 2012). Spunbond webs can be stiff or flexible, subject to the
bonding method (Jirsak & Wadsworth, 1999). Factors affecting the selection of bonding
methods include the final fabric application, the web basis weight, and the limitations of the
processes. Mechanical bonding refers to needlepunching and hydroentangling techniques,
focusing on fiber entanglement and fiber-to-fiber friction in order to impart strength to the web.

34
Thermal and chemical bonding techniques utilize fiber-to-fiber attachment to bond the spun
web. Moreover, multiple bonding techniques can be used in combination for the spunbond
webs. Each bonding method imparts unique characteristics to the nonwoven products.
As one method for mechanical bonding, the needle-punching process uses barbed
needles to penetrate the moving web, forming entangled fibers. It is a flexible bonding method
with high productivity, with no heat or water involved and low cost. However, the delivery
speed needs to be improved. Needle design, punch density, penetration depth and number of
runs are the factors that influence the needling processs. Needlepunch can be used for almost
all types of fibers, especially heavy weight raw materials. Therefore, they are suitable for
geotextiles, roofing and coating substrate applications (Watzl, 2005). Jirsak and Wadsworth
(1999) note that because the process of needle punching provides additional drawing of
filaments, only partially drawn filaments with heavy basis weight webs are ideal for this
bonding method.
In the hydroentangling process, the web is bonded through entanglement, using fine,
high-pressure water jets. Hydroentangling energy is highly related to the bonding performance,
and it has a positive relationship with the strength of the fabric. Watzl (2005) implied that
hydroentangling could be the future of spunbond nonwovens, as it provides fabric with higher
strength, better hand, softness, and drape. The number of hydro entanglement beams, water
pressure, forming wire texture, and hole density are the main parameters of the process. The
hydroentangled spunbond method is often used to produce such products as wipes, technical
packaging, clothing, and home textiles.
Thermal bonding is a process in which fibers in a web are partially melted and fused
together on fiber-fiber crossovers, and bonds are formed after cooling. Either hot air, infrared

35
light, ultra sound, or hot rolls can be used in thermal bonding. Hot rolls are also referred to as
calendering, and it is the most frequently used bonding technique during the spunbond process
(Batra & Pourdeyhimi, 2012). Flat or embossed rolls during calendering can create area or
point bonded fabrics, respectively. Area bonding will create a smooth fabric with a stiff, paper-
like structure with higher tensile strength and modulus and lower tear resistance, while point
bonded webs result in an engraved pattern on the nonwoven fabrics with low tensile strength.
For example, PP webs can be thermal point bonded at 140 °c. The web goes through three
stages between the rollers: compressing and heating the web, bonding the web and cooling the
bonded web (Michielsen, Pourdeyhimi, & Desai, 2006). Light to medium-weight webs (up to
80 gsm) use this technique a lot. Hygiene and healthcare nonwovens are the main application
market segments for calendered spunbond nonwovens. Calendering is generally used to bond
low basis weight webs (below 200 g/m2) (Fedorova, 2006). The main factors of the calender
bonding processing are roller temperature and diameter, nip pressure, and the production speed
(affecting contact time in the nip of the calender) (Pourmohammadi, 2007). In addition,
localized blasts of superheated steam can be used to bond PP spunbond webs (Batra &
Pourdeyhimi, 2012).
Chemical bonding is less frequently used as the bonding method of spunbond webs.
During chemical bonding, the web is sprayed on or saturated with a latex or polymer solution
and then thermally cured. For instance, roofing materials can use this process (Batra &
Pourdeyhimi, 2012; Smorada, 2002).
In addition, spunbond technology can be used to produce bicomponent or
multicomponent fibers. More information regarding bico-technology will be covered later in
the nano-scale nonwoven fiber webs section.

36
2.2.4 The Characteristics of Spunbond Webs or Products
The features of spunbond nonwovens include near random structure and planar
isotropic properties caused by the random lay down of the fibers; high strength-to-weight ratios
in comparison with other nonwoven, woven, and knitted structures; high liquid retention
capacity because of high void content; high opacity (white webs) per unit area; high in-plane
shear resistance; air permeability; a layered or shingled structure; wear properties; good fray
and crease resistance; low drapeability; softness and comfort (Bhat & Malkan, 2007; Malkan
& Wadsworth, 1992; Rupp, 2008). The spinning speeds of spunbond can range from 1,000 to
8,000 m/min, depending on the processing polymer characteristics, desired properties of the
resulting fiber, and process productivity (Batra & Pourdeyhimi, 2012; Fedorova, 2006;
Hagewood, 2004).
Since most spunbond webs have layered or shingled structures, it causes the basis
weight to increase as the number of layers increases (Malkan & Wadsworth, 1992). Depending
on the number of layers of spunbond webs, the basis weight of spunbonded products can vary
from 5 to 1000 grams per square meter (g/m2) (Batra & Pourdeyhimi, 2012), and the typical
basis weights are from 10 g/m2 to 200 g/m2 (Jirsak & Wadsworth, 1999). The width ranges
from 2.1 to 7 meters, and the web thickness can be as thin as 0.1 mm to as thick as 4.0 mm,
with a typical range from 0.2 to 1.5 mm (Jirsak & Wadsworth, 1999). The fiber diameters
range from 1 to 50 µm, and a preferred range is from 15 to 35 µm (Dahiya, Kamath, Hedge,
Huang & Gao, 2004).
The attenuation process is considered to be one of the most essential stages in the
spunbond process due to its impact on polymer molecular orientation and therefore on filament
strength (Fedorova, 2006). Compared to melt blown webs, spunbond webs often have higher

37
strength since the filaments are attenuated starting from the quench zone after being extruded
from the spinnerets, where they become solidified by being exposed to cool air, and the
filaments continue to gain higher molecular orientation when passing through the drawing
process.
2.2.5 The Spunbond Technology Market and its Associated Applications
Spunbond nonwovens occupy the majority of nonwoven production (Jirsak &
Wadsworth, 1999). Spunbond nonwovens can be disposable or durable, depending upon the
end use. Also, the spunbond process is regarded as the most cost effective way to make
nonwoven fabric (Hagewood, 2006). Not only has the spunbond technology gained popularity
in North America, Europe, and Japan, it also started to penetrate into countries throughout
Asia, the Middle East, and South America in the 2000s (INDA, 2008).
The major types of applications for spunbond nonwovens are automotive, civil
engineering, hygiene, medical fabrics and wipes, disposable clothing, filtration for air and
liquid, battery separators and packaging (Batra & Pourdeyhimi, 2012; Bhat & Malkan, 2007;
Fedorova, 2006; Jirsak & Wadsworth, 1999). For example, spunbond polypropylene media is
often used as a support material for nonwoven media, particularly in pleated cartridge filters.
2.2.6 Flash Spinning Process: A Modified Spunbond Process
As mentioned earlier, the question remains whether flash spinning is a melt spinning
process or dry spinning process. INDA’s definition of flash spinning is “A modified spunlaid
technology in which a polymer/solvent solution is extruded under conditions that rapid solvent
evaporation at the spinneret occurs. The individual filaments are disrupted into a highly
fibrillar form and are collected on a moving screen to form a web.” (INDA, 2015, p.24) In
Concise Encyclopedia of Plastics, Rosato, Rosato & Rosato (2000) consider flash spinning to

38
be “a radical departure from the conventional melt-spinning methods to produce nonwoven
fabrics”, and “can result in a film thickness of 4 µm” (p.268). Another difference they mention
about is the spinneret used for this process has a single hole (Rosato, Rosato & Rosato, 2000).
According to Kubo and Watanabe (1994), the spinning stage during the flash spinning is a type
of dry spinning, instead of melt spinning. Bhat & Malkan (2007) also describe flash spinning
as an alternative way to produce spunlaid webs using dry spinning method. The flash spinning
could flash out multiple thin, fibrillated, and continuous interconnected filament networks from
one orifice by releasing a blended polymer solution, from a mixture of an organic solvent and
polymer dissolved at a high temperature and high pressure, under a controlled environment
(Bhat & Malkan, 2007; Jirsak & Wadsworth, 1999). This is quite different from the spunbond
and meltblown technologies, because only one filament or fiber can be extruded from each of
the orifices of the spinnerets for spunbond and meltblown processes, and the extrusion during
spunbond and meltblown processes often comes from the molten polymer resin, not solvent.
Flash spinning is the most complicated way to produce spunbond fabrics due to the condition
required to spin a solution at high temperature and pressure (Jirsak & Wadsworth, 1999).
2.3 Meltblown Technology
2.3.1 The History and Development of the Meltblown Technology
Also known as melt blowing, the melt blown process is “A one-step process in which
high-velocity fluid, normally air, blows molten thermoplastic resin from an extruder die tip
onto a conveyor, or take-up screen, or substrate to form a fine fibered self-bonded web” (Staff
Report, 1989, p.8). However, such definition should encompass unbonded fibers as well as
self-bonded webs since the melt blowing process has successfully produced unbonded
precursor carbon fibers from pitch (McCulloch, 1999).

39
The melt blown process was initiated in the 1950s by the Naval Research Laboratory,
whose goal was to make microfibers to collect radioactive particles in high altitude
atmospheric research. It later was introduced into industry by Exxon in the late-1960s (Butler,
1999; McCulloch, 1999). At that time, Exxon wanted to convert its newly commercialized
polyolefin resins, polypropylene and polyethylene, into discontinuous or continuous “hot
drawn” filaments, and eventually make them into nonwoven webs (McCulloch, 1999). Exxon
successfully produced polypropylene microfibers at a low cost and developed its first 10 inch
melt blowing line (McCulloch, 1999). By 1970, Exxon developed a triple extrusion beam line
for operation and increased the production line to range from 3 to 40 inches wide (Butler, 1999;
McCulloch, 1999). With many patents being applied for and granted, Exxon decided to license
out the technology to other companies, including Kimberly-Clark, 3M, Johnson & Johnson,
Web Dynamics, Ergon, James River, Riegel, Dewy and Almy, rather than commercializing it.
They named this process the “melt blowing process” (McCulloch, 1999). Tonen Tapyrus,
manufactured by a Japanese affiliate of Exxon in 1974, was one of the first commercial melt
blown products (Butler, 1999; McCulloch, 1999). Kimberly-Clark is another company who is
active in designing and improving meltblown equipment. It invented a melt blowing slot die
which can minimize orifice plugging (U.S. Patent no. 4,720,252). It also has patented its
spunbond meltblown spunbond (SMS) technology and CoForm® technology for medical
fabric, surgical gown and wipes applications (McCulloch, 1999). CoForm® technology uses a
blend of melt blown fibers and short wood pulp fibers to produce a series of absorbent materials
by adjusting the ratio of the two fiber feeds to meet the product requirement, and spunbond
fabric is often combined with Coform® fabric to gain more product strength and versatility.
One of 3M’s products Thinsulate®, a thermal insulation material made of polypropylene (PP)

40
or polyester staple with meltblown webs, was developed from a microfiber technology process.
It is now widely used in such products as outdoor sportswear, underwater clothing, and cable
insulation (McCulloch, 1999). McCulloch (1999) also reported that Biax FiberFilm has
utilized melt blowing technology to manufacture building insulation from recycled polyester
bottles.
To meet growing demand for production, Exxon also licensed out the manufacturing
of the commercial melt blown lines to Accurate Products and Reifenhauser, in the U.S. and
Germany, respectively, to supply equipment to meltblown fabric manufacturers for quality
meltblown products (McCulloch, 1999). The design and fabrication of the equipment for
manufacturing nonwoven products are of huge importance because all of the key components
of the equipment affect the quality of the webs and fabrics, and the nonwoven product
developments. Producing commercial products successfully requires precisely engineered,
user-friendly equipment. Exxon was quite selective in choosing the best manufacturers who
met these specifications. Accurate Products was the first to develop a 40 inch melt blowing die
in order to meet Exxon’s requirements in 1972 (McCulloch, 1999). Reifenhauser started the
design and manufacture of a meltblown production line in 1989. It has improved the designs
for melt blowing dies, as well as stretching and heat setting for coarse fibered melt blown webs,
at a very high productivity rate (McCulloch, 1999).
Besides Exxon, Accurate Products, and Reifenhauser, other companies have invested
in the melt blowing process and equipment manufacturing in search of finer and novel
materials. J & M Laboratories (acquired by Nordson in 1998) manufactured its own melt
blowing systems called polymer melt blown technology (PMB) and adhesive melt blown
technology (AMB). PMB makes continuous flat-web nonwoven fabrics from raw polymers

41
like polypropylenes, polyesters, polyethylenes, and polyamides (McNally, 1998). The AMB
system separates the conventional melt blowing die into a few 1 to 2 inch side-by-side units,
and installs an internal valve in every unit with a quick change spin pack. This enables the
system to spin adhesive fibers and control the fiber laydown onto substrates easily, providing
bonding and laminating for woven and nonwoven products. It was the most effective method
of substrate bonding at the time (McNally, 1998). Later in 1998, J and M Laboratories came
up with its MultiFil™ Composite Filament System, which claims to be able to convert from
meltblown to spunbond in minutes by reconfiguring a beam, and a variety of composites can
be manufactured depending on the number of beams installed in the system (McCulloch, 1999;
McNally, 1998). Chisso Corporation has developed equipment for making conjugate melt
blown webs, and for producing islands-in-the-sea type webs (U.S. Patent no. 5,290,626 and
5,511,960). FiberWeb N.A. utilized its patented process to produce continuous and easily
splittable hollow fibers of low orientation with multicomponent dies (U.S. Patent no.
5,783,503).
According to McCulloch (1999), the melt blowing process could use any thermoplastic
resin, as long as its viscosity when exiting the die is relatively low, such as adhesives which
are fibrous forming; also the thermoplastic resins could be solid or in solution or slurry; it can
use any blowing fluid, including steam, air and others; the die can be either horizontal or
circular (Exxon); the die tip can be designed as a single orifice surrounded by air with multiple
rows of orifices, such as the one used by Biax FiberFilm, or a single row of muiltiple orifices
with air plates on either side, used by Accurate and J & M Laboratories, or capillaries, adopted
by Exxon, Lohkamp, Mende, MPC; the high velocity air can be supersonic or subsonic; the
fibers produced can be continuous or discontinuous; and the fiber diameter can range from less

42
than 1 micron to 100 micron and beyond. The main reason that the melt blowing process has
attracted so much attention in the industry is because of the capability of producing filaments
with much smaller diameters than those of normal textile filaments, which results in the
improved uniformity of webs and microporous structure (Batra & Pourdeyhimi, 2012).
Major meltblown producers in North America include Hollingsworth and Vose,
Kimberly-Clark, 3M, Fleetguard Filter, PGI Nonwovens, BBA Nonwovens, First Quality
Nonwovens and Johns Manville (Dahiya, Kamath, Hedge, Huang & Gao, 2004).
2.3.2 Description of the Meltblown Process
The meltblown (MB) process is similar to the spunbond (SB) process which converts
resins to nonwoven fabrics in a single integrated process. The schematic of the melt blowing
process is shown in Figure 2-6. Normally a melt blowing process is comprised of the following
stages: polymer melting and transport and filtration of the polymer melt; polymer extrusion
and filament forming (with hot air); web forming; and bonding (Jirsak & Wadsworth, 1999).
Figure 2-6. The melt blowing process (Retrieved from http://www.engr.utk.edu/mse/pages/Textiles/Melt%20Blown%20Technology.htm)

43
Similar to the extruder used in the spunbond process, the extruder for the melt blowing
process has a heated barrel with a rotating screw inside. Its main function is to melt the polymer
pellets or granules and feed them to the next step. The forward movement of the pellets in the
extruder is along the hot walls of the barrel between the flights of the screw. The melting of
the pellets in the extruder is due to the temperature and the friction of the viscous flow as well
as the mechanical action between the screw and the walls of the barrel. The typical extrusion
system for the meltblown process has to be designed for high temperature, and the viscosity of
the polymer melt at the die appears to be very low (Cheng, 1994).
The metering pump is a positive-displacement and constant-volume device for uniform
melt delivery to the die assembly. It ensures consistent flow of clean polymer mix under
process variations in viscosity, pressure, and temperature. The metering pump also provides
polymer metering and the required process pressure. The metering pump typically has two
intermeshing and counter-rotating toothed gears. The positive displacement is accomplished
by filling each gear tooth with polymer on the suction side of the pump and carrying the
polymer around to the pump discharge. The molten polymer from the gear pump goes to the
feed distribution system to provide uniform flow to the die nosepiece in the die assembly (or
fiber forming assembly).
Figure 2-7. Schematic of metering pump (retrieved from http://www.engr.utk.edu/mse/pages/Textiles/Melt%20Blown%20Technology.htm)

44
The die assembly is the most important element of the melt blown process. It has three
distinct components: polymer-feed distribution, die nosepiece, and air manifolds. The feed
distribution in a melt-blown die is more critical than in a film or sheeting die for two reasons.
First, the melt-blown die usually has no mechanical adjustments to compensate for variations
in polymer flow across the die width. Second, the process is often operated in a temperature
range where thermal breakdown of polymers proceeds rapidly. The feed distribution is usually
designed in such a way that the polymer distribution is less dependent on the shear properties
of the polymer. This feature allows the melt blowing of widely different polymeric materials
with one distribution system. The feed distribution balances both the flow and the residence
time across the width of the die. There are basically two types of feed distribution that have
been employed in the melt-blown die: T-type (tapered and untapered) and coat hanger type.
So far the coat hanger type feed distribution is more commonly used because it gives both even
polymer flow and even residence time across the full width of the die.
From the feed distribution channel, the polymer melt goes directly to the die nosepiece.
The web uniformity hinges largely on the design and fabrication of the nosepiece. Therefore,
the die nosepiece in the melt blowing process requires very tight tolerances, which have made
their fabrication very costly. The die nosepiece is a wide, hollow, and tapered piece of metal
having several hundred orifices or holes across the width. The polymer melt is extruded from
these holes to form filament strands which are subsequently attenuated by hot air to form fine
fibers. In a die's nosepiece, smaller orifices are usually employed compared to those generally
used in either fiber spinning or spunbond processes. A typical die nosepiece has approximately
0.4-mm diameter orifices spaced at 1 to 4 per millimeter (25 to 100 per inch). There are two
types of die nosepieces used: the capillary type and the drilled hole type. For the capillary type,

45
the individual orifices are actually slots that are milled into a flat surface and then matched
with identical slots milled into a mating surface. The two halves are carefully aligned to form
a row of openings or holes. By using the capillary type, the problems associated with precise
drilling of very small holes are avoided. In addition, the capillary tubes can be precisely aligned
so that the holes follow a straight line accurately. The drilled-hole type has very small holes
drilled by mechanical drilling or electric discharge matching (EDM) in a single block of metal.
During processing, the whole die assembly is heated section-wise using external heaters to
attain desired processing temperatures. It is important to monitor the die temperatures closely
in order to produce uniform webs. Typical die temperatures range from 2l5°C to 340°C.
The air manifolds supply the high velocity hot air through the slots on the top and
bottom sides of the die nosepiece. The high velocity air is generated using an air compressor.
The compressed air is passed through a heat exchange unit such as an electrical or gas heated
furnace, to heat the air to desired processing temperatures. The air exits from the top and
bottom sides of the die through narrow air gaps. Typical air temperatures range from 230°C to
360°C at velocities of 0.5 to 0.8 of the speed of sound.
As soon as the molten polymer is extruded from the die holes, streams of high velocity
hot air from the top and bottom sides of the die nosepiece start to attenuate the polymer flows
to form microfibers. As the hot air stream containing the microfibers progresses toward the
collector screen, it draws in a large amount of surrounding ambient air that cools and solidifies
the fibers. The solidified fibers subsequently get laid randomly onto the collecting screen, often
forming into a self-bonded nonwoven web. The fibers are generally laid randomly (and also
highly entangled) because of the turbulence in the air stream, but there is a small bias in the
machine direction due to some directionality imparted by the moving collector. The collector

46
speed and the collector distance from the die nosepiece can be varied to produce a variety of
melt-blown webs. Usually, a vacuum is applied to the inside of the collector screen to withdraw
the hot air and enhance the fiber laying process.
The melt-blown web is usually wound onto a cardboard core and processed further
according to the end-use requirement. The combination of fiber entanglement and fiber-to-
fiber bonding generally produce enough web cohesion so that the web can be readily used
without further bonding. However, additional bonding and finishing processes may be applied
to these melt-blown webs. Thermal bonding is the most commonly used technique, and this
can be either area bonding or point/pattern bonding. Bonding is usually used to increase web
strength and abrasion resistance. As the bonding level increases, the web becomes stiffer and
less fabric-like. Although most nonwovens are considered finished when they become rolled
goods at the end of the production line, many still receive additional chemical or physical
treatment such as calendering, embossing, and flame retardance.
2.3.3 The Parameters Affecting the Meltblown Process
A variety of parameters influence the meltblown process. These include: the flow rates
and temperatures of the polymer melt and air; the raw material selection; the die-to-collector
distance; and the collector speed (Batra & Pourdeyhimi, 2012; Jirsak & Wadsworth, 1999). As
mentioned earlier the die design (nozzle geometry) is also considered to be the key equipment
design parameter.
2.3.3.1 The Extrusion Output Rate
The extrusion output rate also plays an important role in the melt blowing process. The
screw speed, screw design, barrel temperature setting, and pressure at the end of screw all
affect the extrusion output rate. When the screw speed increases, the extrusion output rate

47
increases. When the pressure gets higher at the end of the screw, the extrusion output rate
increases.
2.3.3.2 The Specific Output Rate (Polymer Throughput Rate) and Air Flow Rate
Both the specific output rate and air flow rate control the fiber diameter, fiber
entanglement, the basis weight and the attenuating zone (Dahiya, Kamath, Hedge, Huang &
Gao, 2004).
The specific output rate which is regarded as the most important parameter in the melt
blowing process is the amount of polymer melt being extruded through one of the holes of the
spin pack per minute. The typical specific output rate is 0.2 to 0.8 g/h/m for most applications,
including filtration media, SMS fabric, battery separators, etc. The specific output rate is higher
in some applications such as wipes and oil sorbents. In these cases, the value is from 0.8 to 3.0
g/h/m. The specific output rate has an impact on not only the crystallizing point (solidification)
but also the fiber velocity relative to the attenuation air velocity. Therefore, the higher the
specific output rate, the greater the cooling time that is needed; the higher the chances of
causing shot in the webs; and the bigger the fiber diameter (unless more attenuation air is
applied) (Cheng, 2006). The specific output rate also affects the web softness and quality, as it
impacts the spin line temperature. Higher specific output rate means there will be more residual
heat in the fiber which will influence the fiber laydown yielding stiffer webs of lower quality
(Cheng, 2006).
Variations in the specific output can be caused by dirty or partially obstructed die hole
and pressure variation across the die tip (Cheng, 2006). To prevent dirty or partially obstructed
die holes, inspection is needed before installation, and it is important to make sure the holds
48
are not plugged from contaminants from the polymer stream or charred polymer/pigment in
the capillary (Cheng, 2006).
In meltblowing, to manufacture finer and shorter fibers, higher air flow rate and lower
polymer flow rate is needed (Batra & Pourdeyhimi, 2012). The melt blowing process can be
grouped into three distinct regimes based on the air flow rate: very high air flow (1300-
1600m/h/m), which produces fibers with diameters from 1 to 10 micron meters on average (the
most commonly used commercial meltblown process at that time); ultra high air flow (300-
2000m/h/m), enabling making ultrafine fibers with an average diameter of less than 1 micron;
lower air flow (12-30m/h/m), producing fibers of 10 to 200 micron in diameter (mainly for
adhesive melt) (McCulloch, 1999; Saine, Sinangil, Allen, & McCulloch, 1998; Shambaugh,
1988). Shambaugh (1988) also note that lower air flow rate produces continuous filaments;
and the increase in the air flow rate causes the filaments to break into fibers and shots, leading
to coarse final product; but with further increase in air flow rate, the shots get attenuated by
the high-velocity air, and the quality and performance of final product are not affected.
2.3.3.3 Temperatures of Polymer Melt and Process Air
Melt temperature determines the homogeneity of the polymer melt inside the extruder
as well as the viscosity of the polymers at the die. A lot of factors contribute to melt temperature
operation, such as initial polymer temperature, final melting temperature, local polymer
temperature, barrel temperature, and the screw speed. In order to increase the melt temperature,
the extruder barrel temperature (last few zones), the die temperature, and the temperature of
the parts between the extruder and the die all have to increase. Overall, a higher melt
temperature results in thinner fibers, but is more likely to cause shots in the webs; results in a

49
shorter die tip life caused by degradation of polymers and additives; and obviously this
necessitates more energy consumption due to heating and cooling (Cheng, 2006).
The temperature of air for meltblowing processing has a limited adjustment range, and
its effect starts from the die tip before reaching equilibrium. Typically, the temperature of the
high velocity air is the same or a little higher than the temperature of the die and the molten
polymer, depending on thermocouple location (Cheng, 2006). When the air temperature is
lower, it helps with filaments cooling down to prevent shots (Cheng, 2006).
These two temperature variables combined with air flow rate determine the uniformity
of the web, fabric appearance and hand, shot, rope and fly formation (Dahiya, Kamath, Hedge,
Huang & Gao, 2004).
2.3.3.4 The Die-to-Collector Distance (DCD)
At a given throughput rate in the melt blowing process, the surface speed of the
collecting surface affects the basis weight of the web (Batra & Pourdeyhimi, 2012). The die-
to-collector distance (DCD) is another important factor because it can impact the autogenous
bonding among fibers in the meltblown webs, which enables the fibers to become self-bonded,
and thus influence the web properties (Batra & Pourdeyhimi, 2012). A small DCD leaves
shorter time for the filaments to cool down, and causes additional bonding among the filaments
or fibers before complete solidification (McCulloch, 1999). A shorter DCD can result in better
balance of the process air stream and suction capability from the vacuum underneath the
forming drum or belt. Thus the webs are stiffer, more compact and uniform, have smaller pores,
leading to better barrier properties and light basis weight fabric. One example is the meltblown
layer inside the spunbond meltblown spunbond composites. On the other hand, a high DCD
can provide better filament cooling and less tendency to disturb fiber lay down. So the

50
meltblown webs made with a high DCD are bulkier and softer, and have lower web uniformity,
which is great for the use of heavy basis weight fabrics such as sorbents.
2.3.3.5 Raw Material Variables
Most polymers can be used for the melt blowing process, but in reality most fiber
forming polymers do not have low enough melt viscosities for fine fiber formation. The type
of raw materials used determines the intrinsic properties of the polymer melt. Raw material
variables encompass polymer type, molecular weight, molecular weight distribution, melt
viscosity, polymer additives, and polymer pellet size and form (Dahiya, Kamath, Hedge,
Huang, & Gao, 2004). The main raw material used for the melt blown process is low molecular
weight PP, which has a high melt flow rate (MFR) and a low viscosity (Batra & Pourdeyhimi,
2012). MFR or melt flow index (MFI) denotes the mass of a polymer (in grams) that can
extrude or flow through an orifice of a standard die at a given temperature and load in a ten-
minute time span (Gahan & Zguris, 2000), and MFR or MFI is inversely proportional to the
viscosity of the polymer. Therefore, a high MFR indicates low viscosity of a polymer, and it
is also can measure molecular weight indirectly, with a high melt flow rate corresponding to
low molecular weight. Several reasons for choosing PP as the most commonly used raw
material for melt blowing process; the first reason is the low cost and versatility, PP costs one
third or half of polyester and nylon and can produce a wide variety of products; secondly PP
is easy to process, it does not need drying, and easy to flow through the orifices and to draw
down due to a high MFR; third, it requires a relatively low processing temperature, it is also
hydrophobic, and it has a low specific gravity; the last one is the high value in terms of price
and performance (Batra & Pourdeyhimi, 2012; Dutton, 2008). Past research has shown that the
MFR of PP has increased to 1200-1500 in the 1970s and 1980s from 12 initially (Dutton,

51
2008). The increase in MFR of PP can reduce the melt temperature for the extrusion and
increase the throughput rate (Dutton, 2008).
Co-polymers can also be used in the meltblown process, including copolyesters,
polyurethane, polyamide polyethers, ethylene/chlorotrifluoro-ethylene (Gahan & Zguris,
2000).
2.3.3.6 Bonding Methods used in Meltblown
Melt blown webs can be self-bonded, a.k.a. autogenous bonding, and sometimes
coupled with thermal point bonding (Batra & Pourdeyhimi, 2012). Autogenous bonding
happens when the collecting surface and the die tip are so close that the drawn fibers reaching
the collector belt have not solidified yet. Therefore they will stick to one another, resulting in
a tacky surface and self-bonded webs (Batra & Pourdeyhimi, 2012). If the melt blown webs
are already self-bonded, no additional bonding method is needed. So the degree of autogenous
bonding can be controlled by the die-to-collector distance, and it also affects whether the melt
blown fabric is flexible or stiff (Batra & Pourdeyhimi, 2012).
Besides autogenous bonding, thermal point bonding can be used for melt blown webs,
regardless if the webs are self-bonded or not (Batra & Pourdeyhimi, 2012). Batra and
Pourdeyhimi (2012) also pointed out that ultrasonic bonding is a better bonding method for
heavy basis weight melt blown webs. Sometimes bonding is followed by calendering to reduce
the thickness of the melt blown webs if smaller pore sizes and low porosity are desired (Batra
& Pourdeyhimi, 2012).
2.3.4 The Characteristics of Meltblown Webs or Products
The melt blown process is similar to the spunbond process, as they both utilize melt
spun web forming techniques, but fibers or filaments produced using the melt blown process

52
are generally measured in microns as they have a much smaller diameter (even in sub-micron
scale) and do not have as much strength as spunbond fibers. Jirsak and Wadsworth (1999) state
that the typical meltblown micro-fibers have an average diameter in the range of 2 to 4 µm.
Some other sources describe the diameter of meltblown fibers to be as small as 0.5 µm and as
large as 30 µm (Bhat & Malkan, 2007; Malkan & Wadsworth, 1993), while McCulloch (1999)
and Vargas (1989) indicate that meltblown fibers with a diameter of 90 to 100+ µm can be
used for coarse filtration purposes. However, researchers have successfully used meltblown
technology to produce polymeric fibers with average diameters less than 0.5 µm (Ellison,
Phatak, Giles, Macosko, & Bates, 2007). Due to the fineness and enormous number of fibers,
meltblown webs have random or nearly random fiber orientation, a high surface-to-mass ratio,
and have low porosity with smaller pore size distribution, implying they pack better, have
significant bonding strength through fiber entanglement and offer high opacity. Previous
studies state that decreasing the DCD and using a lower air rate and higher temperature can
produce stiffer meltblown webs (Bresee & Ko, 2003; Cheng, 2006). Moreover, meltblown
webs offer good thermoinsulating properties and higher filtration efficiency due to the high
surface area and small pores (Jirsak & Wadsworth, 1999). Just like spunbond webs, melt-
blown webs are mostly layered or shingled. Thus the more layers the meltblown webs have,
the higher the basis weights are. The basis weight of meltblown webs ranges from 8 g/m2 to
350 g/m2, with a typical value at around 20-200 g/m2 (Jirsak & Wadsworth, 1999). Since the
fiber produced from the melt blowing process can be discrete or continuous, there is a broad
range in the fiber length. The drawbacks for meltblown webs and fabrics are low or moderate
strength (Jirsak & Wadsworth, 1999), and low abrasion resistance from mechanical
entanglement and frictional forces. The use of high MFR, low molecular weight polymers and

53
the hot drawn process, which disables the polymer from gaining molecular orientation, result
in weak fibers.
Spunbond meltblown composite materials, such as Spunbond Meltblown Spunbond
(SMS) and Spunbond Meltblown Meltblown Spunbond (SMMS), provide a better solution to
some applications because they can utilize the advantages from both processes and compensate
for some of the weaknesses of using only spunbond or only meltblown webs.
2.3.5 The Meltblown Technology Market and its Associated Applications
Melt blown technology is almost exclusively being adopted to manufacture microfibers
or even fibers of sub-micron sizes, rather than conventional-sized textile fibers, and it is quite
cost effective and versatile. For instance, meltblown products are ideal candidates for liquid
and air filtration media at low temperature settings because of their small pore sizes and low
porosity (Batra & Pourdeyhimi, 2012). Due to its unique characteristics, the meltblown process
is widely used to produce many types of filter medium (including surgical face mask, liquid
filtration media, gaseous filtration media, cartridge filters, cleanroom filters, face masks
(protection against dust, bacteria and viruses)), which is the largest application segment for
meltblown fabrics, as well as disposable medical products, sorbent, wipes, diapers, adult
incontinence products, and feminine hygiene products (Batra & Pourdeyhimi, 2012; Dutton,
2008). From the early 1970s, Johnson & Johnson began to use meltblown fibers to replace
glass fibers in facemasks and respirators, and this was considered to be a successful application
for melt blowing technology (McCulloch, 1999). FiberWeb was granted a patent (U.S. Patent
no. 5,645,057) on producing a very fine (0.8 to 1.3 micron) meltblown web for filtration
purposes (McCulloch, 1999). Meltblown webs have achieved great success in blood filtration
other than conventional air and liquid filter applications (McCulloch, 1999).

54
Another initial application for meltblown webs was battery separators (McCulloch,
1999). Exxon first invented a three-ply calendered PP laminate using the melt blowing process.
This was followed by: Riegel Products’s PP melt blown separator for lead-acid, maintenance-
free batteries in the 1970s; Toa Nenryo’s invention for alkaline batteries separators using
meltblown webs by solving problems associated with re-wettability and fabric abrasion
resistance; Entek’s microporous web produced from highly loaded ultra-high molecular weight
polyethylene (M.W.P.E.); and Asahi’s nylon microfiber web for the Ni-Cd battery
(McCulloch, 1999).
Self-bonded or thermal bonded PP meltblown fabrics can also be used as sorbents
(especially oil sorbents) for industrial uses. This application arises because PP is hydrophobic
and oleophilic, and the webs which are made of very fine fibers, have many small pores and
high surface areas. Hence the fabric can capture and retain oil and many chemicals.
Approximately 20,000-30,000 tonnes of melt blown PP fabrics were consumed in the clean up
after the BP catastrophe in the Gulf of Mexico in April 2010, which resulted in an increased
volume of sales for disposable sorbents. To expand the applications of meltblown webs, Ergon
Nonwovens, Sorbent Products, and Kimberly-Clark started to impart hydrophilicity to
meltblown webs by adding hydrophilic additives or topical treatments from 1970s (McCulloch,
1999).
McCulloch (1999) considered cigarette filters to be one of the earliest filtration
applications for melt blown webs. Exxon tried to manufacture meltblown PP into cigarette tow
using its circular die, but this failed due to poor quality control and higher cost. Filtrona, the
only global independent cigarette filter supplier, gained success using meltblown webs in the

55
cigarette filters market, and started to produce EVA/PP sheath core bicomponent webs to meet
the requirements of cigarette filters in the early-1990s (McCulloch ,1999; USP 5,509,430).
2.4 Comparison between Spunbond and Meltblown Technologies
2.4.1 Similarities between Spunbond and Meltblown Technologies
Both spunbond and meltblown technologies are considered to be melt extrusion
processes in nonwovens. The spunbond and the melt blown processes are similar to each other,
because both of them transform polymer resins to nonwoven webs and then nonwoven fabrics
in one single process, which integrates the preparation, web formation, bonding and finishing
procedures into final roll goods or products (Batra & Pourdeyhimi, 2012) However, they are
still different in some aspects.
2.4.2 Differences between Spunbond and Meltblown Technologies
The first difference is the polymer used for the two processes. Spunbond process uses
polymers with a low MFR or MFI while meltblown requires polymers with a high MFR or
MFI. Within one type of polymer, there are different grades, and the values of MFR are
associated with the polymer grade. Thus a polymer with a certain grade (MFR) is chosen for a
certain process. The typical MFR for meltblown nonwovens is 800-1500g/10min, which is a
lot higher than the typical MFR value for spunbond (24-35g/10min) (Jirsak & Wadsworth,
1999). The higher the MFR, the lower the viscosity of the polymer, and the lower the molecular
weight of the polymer. For instance, PP is used both for spunbond and meltblown processes,
however the type of PP used for these two processes have different grades. For Spunbond, the
PP typically have a MFR of 18-35g/10min, and it has a high molecular weight. During the
meltblown process, PP with a high MFR and a low molecular weight is needed. Dutton (2008)
found that the MFR of PP used for meltblowing increased drastically throughout the years,

56
resulting in a higher throughput rate and a lower melt temperature required for the extrusion
(Dutton, 2008). From one previous study on characterizing rheology in meltblown process, the
desired polymer has to possess a fairly low melt viscosity (Drabek & Zatloukal, 2013).
The next two differences are related to the drawing stage of the web forming processes,
which results in the different filament strengths as spunbond webs and fabrics are much
stronger than melt blown webs and fabrics.
The second difference is about the temperature and volume of the air used to draw the
filaments. Melt blown process uses a large volume of hot air, typically equal to or slightly
higher than the melt temperature of the polymer, to draw the fiber into fine continuous or
discontinuous filaments, while the spunbond process uses a cold drawn process. During
spunbond web formation, filaments are formed as the molten polymer exits the spinnerets, and
they are quenched by a smaller amount of air at near ambient temperature to solidify them
before reaching the drawing zone.
The third difference is when the filament is being drawn by the attenuation force. In
the meltblown process, the drawing starts as soon as the molten polymer exits the die. So the
attenuation force is being applied at the die tip, which indicates that no polymer orientation
exists for building strong physical properties. Instead microfibers are formed with the hot air
attenuation force and higher drawing ratio. The lack of quenching causes the filaments to be
tacky when reaching the conveyor belt. In contrast, during the spunbond process, the major
attenuation force is not applied until the molten polymer has been quenched and partially
solidified by cool air. Because the major drawing force is applied at some distance from the
die or spinneret after the quenching, it allows the polymer to have good molecular orientation
and the filaments to have high strength.

57
Moreover, the filamants from spunbond and meltblown processes have different
lengths. Spunbond filaments are continuous while meltblown filaments can be discrete or
continuous. High air flow rate and low polymer flow rate can produce finer and shorter
meltblown fibers, while continuous filaments are produced using the low air flow rate for the
process (Zhang, 1996).
The last main difference lies in the bonding method. Melt blown webs can be self-
bonded, which is called autogenous bonding, and sometimes they use ultrasonic bonding for
high basis weight meltblown webs, or thermal point bonding, or calendering (Batra, &
Pourdeyhimi, 2012). So when autogenous bonding exists in melt blown webs, no additional
web bonding technique is required to bond such self-bonded webs. On the other hand, at least
one bonding method is required for spunbond nonwoven fabrics, which can be either thermal,
hydroentangling, needlepunching, or spraying, used alone or combined.
2.5 Spunbond (S) Meltblown (M) Spunbond (S) Technology
Spunbond melt blown composite materials have gained a lot of popularity since they
could utilize the physical properties of spunbond and melt blown webs and combine them into
one multi-layered nonwoven web, and it is considered to be multi-denier spinning (Butler,
1999). There are different types of spunbond (S) melt blown (M) composite materials, such as
SM, SMS, SMMS, SMSMS, or SSMS. For example, SMS has a meltblown layer in the middle
with spunbond layers on top of and underneath it. Melt blown webs have lower strength,
excellent uniformity, and much finer denier filaments, while spunbond webs have higher
strength. Hence the middle layer of melt blown webs can enhance the uniformity of the
composite at low weights, serving as a good barrier fabric; and the spunbond layers outside
add support, comfort and abrasion resistance (Butler, 1999; Dutton, 2008). Butler (1999) also

58
mentioned that the composite fabric is commonly used as barrier leg cuffs and diaper back
sheets because the composite fabric is hydrophobic.
Multiple beam installations are required to make spunbond and melt blown composites
by incorporating spunbond and melt blown processes into a one integrated process, as shown
in Figure 2-8. An alternative to produce multi-denier fabrics is to laminate separate spunbond
and melt blown webs.
Figure 2-8. SMS spunbond composite technology (Zimmer AG) 2.6 Nanofiber Manufacturing Using Nonwoven Technologies
Although there are various size ranges regarding nanoscale across various industries
and countries (Klaessig, Marapese, & Abe, 2011), both ISO and ASTM International have the
same range for nanoscale. ISO/TS 80004-1:2010 Nanotechnologies – Vocabulary – Part 1:
core terms defines nanoscale as “(the) size range(s) from approximately 1 nm to 100 nm”.
ASTM E2456-06: Standard Terminology Relating to Nanotechnology specifies that the
dimension would be between approximately 1 and 100 nm and the goal for the standard is “to

59
differentiate those properties different from properties found in either molecules or the bulk
(interior) of larger, micron-sized systems”. Also according to the National Science Foundation
(NSF), nanofibers should possess one dimension of 100 nm or less. However, the size range
of nanofibers used commonly in the textile industry is different. Previously, the textile and
nonwovens industry considered fibers’ diameters of less than one micron to be nanofibers
(Hegde, Dahiya & Kamath, 2005), and in recent years, nanofibers in nonwovens are referred
to the fibers whose diameters range from 100 to 300 nm (Batra & Pourdeyhimi, 2012).
In fiber-based industries (textiles, nonwovens, etc.), nanotechnology is either used as a
chemical coating to be applied onto the conventional fiber structures or for producing fibers at
nano scale (Walker, 2012). Nanofibers can be used in many applications, such as filter
medium, energy storage (e.g. battery separators), absorption cores in hygiene products,
adsorption layers in protective clothing, performance apparel, medical textiles (e.g. tissue
engineering), acoustic insulation products and drug delivery (Fedorova & Pourdeyhimi, 2007;
Walker, 2012). Walker (2012) also mention that nanofibers have been tested in those products
in search of performance enhancement. Their versatility is attributed to their unique
characteristics, such as high surface area and porosity. In this study, nonwovens filtration
medium and the technologies associated with the filtration medium manufacturing are the
focus of the research.
There are different ways to manufacture micro and nano-scale fibers, including melt
blowing, electrospinning and the use of bicomponent fibers (Fedorova & Pourdeyhimi, 2007).
Melt blowing usually produces fine fibers (sub-micron and microfibers) with diameters
ranging from 500 – 900 nm, with a wide distribution, such as the Arium® technology by PGI
(Walker, 2012). Electrospinning has been found to be a viable technique to produce nanofibers,

60
and the bicomponent process is another popular method of producing micro and nanofibers in
nonwovens.
2.6.1 Electrospinning
Electrospinning is defined as a process using electrostatic forces and viscoelastic
behavior of the polymer to produce fine fibers from a polymer solution or melt (Kim &
Reneker, 1999; Wang, Drew, Lee, Senecal, Kumar & Samuelson, 2002; Subbiah et al., 2005).
It has gained popularity due to the technical simplicity and adaptability in spinning a wide
range of polymeric fibers as well as the consistency in producing submicron and nano-scale
fibers (Subbiah et al., 2005; Walker, 2012).
2.6.1.1 History and Development of Electrospinning Nanofiber
Electrospinning has a long history which dates back to the 1930s. EDANA and INDA
also name this process electrostatic web forming or laying (EDANA, 2015; INDA, 2015). In
1934, Formhals patented his first invention for producing artificial filaments using electric
charges (Formhals, 1934, U.S. Patent no. 1,975,504). Taylor discovered the conical shape of
the jet when a polymer droplet was produced at the tip of a needle within an electric field in
the late 1960s, and the conical shape of the jet was named after him (Taylor, 1964; Taylor,
1969). He found that the ideal angle to keep the viscous fluid in equilibrium with the
electrostatic forces applied is 49.3°. The Taylor cone determines “the onset of the extensional
velocity gradients in the fiber forming process” (Fedorova & Pourdeyhimi, 2007, p. 21-22;
Subbiah et al., 2005, p. 558).
Subbiah et al. (2005) summarized the earlier studies, which examined the structural
morphology of nanofibers and the impact of process parameters on the structure of the fibers.
The summary includes the following: Baumgarten (1971) used electrospinning to produce

61
acrylic microfibers with diameters of 500 to 1100 nm, and noticed a specific dependence of
fiber diameter on the viscosity of the solution. Larrondo and Mandley (1981a, 1981b) noted
that melt spun polyethylene and polypropylene fibers have larger diameters than those spun
from solvent, the diameters of melt spun fibers decrease with the increase in melting
temperature, and the fiber diameter decreases by 50% as the voltage doubles. Hayati, Bailey,
and Tadros (1987) discoverd the relationship between the stability and atomization of the fibers
and the fluid conductivity and the electric field used in experiments, indicating that semi
conductive and insulating fluid (e.g. paraffinic oil) can produce stable streams from the jets,
while the highly conductive fluid with high voltage applied causes unstable streams from the
jets and a much wider distribution in fiber diameters. Doshi and Reneker (1995) found that the
concentration of the solution and the applied voltage both influence the forming of electrospun
fibers (polyethylene oxide nanofibers), and the jet diameters decrease as the distance from the
top of the cone to the collecting device increases. Jaeger, Bergshoef, Batlle, Holger, & Vancso
(1998) also examined the thinning of electrospun nanofibers spun from polyethylene oxide and
water, noticing the diameter of the jet decreases as it travels downward from the orifice. They
also determined that the electric current can heat up the jet when the conductivity in the
solutions ranges from 1000 to 5000 µs.cm-1. The fluid instability during the electrospinning
process have been studied by Warner et al. (1998) and Moses et al. (2001a, 2001b). Gibson,
Gibson & Rivin (1999) observed electrospun webs with much less resistance to the moisture
vapor diffusional transport. Spivak and Dzenis (1999) confirmed that the electrospinning
process should employ the Ostwalt–deWaele power law. Deitzel et al. (2001a, 2001b) reported
that the shape of the surface where the jet originates changes due to the increase in applied

62
voltage and bead defects. Shin et al. (2001) looked into the electrohydrodynamics of the
process to develop an apparatus which could better control the experimental parameters.
2.6.1.2 Electrospinning Nanofiber Processing
Figure 2-9 is a diagram of the electrospinning process, which includes a high voltage
power supply, a syringe pump which can transport the solution or melt from the syringe to the
spinneret, and a conductive collecting device, which is often a flat plate or rotating drum.
Depending on the desired nanofiber properties, modifications regarding the process can be
made to produce the fibers. The process starts from forcing a jet of the polymer solution or
melt through a syringe pump by developing “a pendant drop of the polymer” at the tip of the
spinneret orifice, and at the same time, an electrode immersed by the polymer solution or melt
inside the syringe applies a high voltage (~10 kV) to the polymer solution or melt, resulting in
free charges in the polymer solution or melt (Ellison et al., 2007; Subbiah et al., 2005). When
the polymer fluid moves to the tip of the spinneret orifice, it forms into a hemispherical shaped
droplet at the tip (Subbiah et al., 2005). Due to the existence of electric force, the fibers are
formed by ejection from a charged conical shaped jet, and it happens when the electric force
between the suspended droplet solution or melt at the tip of the spinneret and collector
surpasses the surface tension of the solution or melt (Lee & Obendorf, 2007; Taylor, 1969;
Reneker & Chun, 1996). The solvent evaporates quickly as the jet travels towards the
collecting device a few centimeters away, which is usually a grounded screen, and leaves only
a dry fiber (Ellison et al., 2007; Subbiah et al., 2005). Deitzel et al. (2001a) observed that the
difference of the fluid ejected out depends on the viscosity of the fluids. For a solution with
low viscosity, the jet breaks up into droplets, but for a solution with high viscosity, the jet
remains intact when traveling towards the collector (Subbiah et al., 2005).

63
Subbiah et al. (2005) listed the process parameters affecting the electrospinning
process, including “solution feed rate, applied voltage, nozzle-to-collector distance, spinning
environment, and material properties” (p. 564). A variety of factors associated with material
properties, such as the solution or melt concentration, viscosity, surface tension, conductivity,
and solvent vapor pressure all have the ability to affect the structure and properties of
electrospun nanofibers.
Figure 2-9. The electrospinning process (Retrieved from http://www.intechopen.com/source/html/8656/media/image1.png)
2.6.1.3 The Characteristics of Electrospinning Nanofibers and their Applications
Electrospinning can produce ultrafine and nanofibers with polymers of high
conductivity, high chemical resistance, and high tensile strength, and the average diameter of
electrospun fibers is from 100 nm–500 nm (Subbiah et al., 2005). Therefore, they are generally
considered to be nanofibers according to the definition of nanofibers used in textile industries.

64
Compared to meltblown micro and submicron fibers, electrospun nanofibers have a
narrower distribution of fiber diameters (Walker, 2012). As mentioned earlier, the typical
characteristics of nanofibers are small fiber diameters, small pore sizes, and high surface areas.
Regarded as “a variation of the electro-spray process” (Fedorova, 2006, p.7), electrospinning
has become the most researched method to make nanofibers, and such intensive use of
electrospinning in academic research has enabled more capabilities for nanofibers (Gupta,
Saquing, Afshari, Tonelli, Khan, Kotek, 2009; Li & Xia, 2004; McCann, Li, & Xia, 2005;
Norris, Shaker, Ko, & MacDiarmid, 2000). However, most electrospinning is conducted in
R&D labs and in small scale manufacturing, and there is limited commercial production owing
to the low production rate (Chung, 2011; Pourdeyhimi, 2011). Ultraweb® by Donaldson
(claimed as the first nanofiber commercial application in 1981) is one of the few commercially
available products manufactured at an industrial scale using electrospinning
(http://www.donaldson.com/en/about/technology/index.html). According to Walker (2012), a
few other companies incorporate nanofibers into their filtration products using industrial scale
electrospinning process, including Clarcor, Ahlstrom, Mann+Hummel and Northern
Technical. Elmarco provides electrospinning equipment at industrial scale, and FineTex is a
mill supplying nanofiber fabrics, especially membranes, for making performance apparel.
Electrospun nanofibers can potentially be used for many applications, including
filtration (high efficiency filter media), catalyst substrates, adsorbent materials, tissue
scaffolds, drug delivery and other medical uses, optical fibers, and protective clothing (Deitzel
et al., 2001; Gibson, Gibson, & Rivin, 1999). They have especially attracted attention for the
use in filter media, due to their unique features, such as small pore size, high surface area, and

65
possible three-dimensional structure (Buer, Ugbolue, & Warner, 2001; Deitzel et al., 2001a,
2001b; Subbiah et al., 2005).
2.6.2 Bicomponent Fibers
Bicomponent fibers can be used to make fibers at both micro and nano scale.
Bicomponent fibers are manufactured by "extruding two polymers from the same spinneret
with both polymers contained within the same filament", and they are also known as conjugate
fibers, hetero fibers or composite fibers (Dasdemir, Maze, Anantharamaiah, & Pourdeyhimi,
2012). They were invented to meet the requirements of combining two materials into one single
fiber in order to provide both components’ properties by hosting two components along the
fiber length (Fedorova, 2006). In other words, bicomponent fibers combine two components’
properties together to achieve multi-functional performances according to the requirements of
market demands and applications.
The only difference in extrusion processing used by bicomponent and homocomponent
fibers is that two separate extrusion systems are installed in the bicomponent processing line
(Fedorova, 2006). Instead of being homogeneously blended and evenly distributed along the
fiber, the two components have a distinct interface along the fiber axis, and the two parts may
have different configurations or patterns (Sun et al., 2004). A bicomponent fiber can be
classified by its cross sectional geometry or pattern. Overall, there are three main categories of
bicomponent fibers, including: (A) side-by-side (S/S); (B) sheath-core (S/C); and (C-F) matrix-
fibril (M/F) (such as islands-in-the-sea, citrus or segmented-pie, etc.) (Dasdemir et al., 2012),
as shown in the Figure 2-10. In addition to the typical bicomponent fibers, there are many
profiled filaments made from bicomponent fibers, which can be produced by sacrificing one
component from the fiber by chemical or physical methods. This widely broadens the

66
applications as well as the types of bicomponent fibers, especially the production of ultra-fine
and nanofibers.
(A) (B) (C) (D) (E) (F)
Figure 2-10. Cross sectional configurations of different types of bicomponent fibers (Dasdemir et al., 2012)
2.6.2.1 History and Development of Bicomponent Fiber Processing
DuPont manufactured the first bicomponent fiber commercially in the mid-1960s. It
was a highly coiled elastic fiber made from two nylon polymers, and it was a side-by-side
hosiery yarn named Cantrese. From the 1970s, different types of bicomponent fibers began to
appear in Asia, especially in Japan. It was also the time the nonwovens industry started to adopt
bicomponent fiber technology to make microfibers (Batra & Pourdeyhimi, 2012).
Bicomponent fiber production relies heavily on complex and expensive spin packs, which
allow more than one polymer to be extruded from the same spinneret. However, the methods
used for manufacturing at that time were not technically efficient nor cost effective. An
innovative technique for bicomponent fiber production was developed in 1989, which utilizes
thin flat plates with holes and grooves to route the polymers, making the entire process flexible
and cost much less (Kikutani, Radhakrishnan, Arikawa, Takaku, Okui, Jin, Niwa, & Kudo,
1996).

67
2.6.2.2 Bicomponent Fibers Types
New types of bicomponent fibers have been developed through innovation in the
nonwovens area. Based on the distribution of polymer components and cross section geometry,
fibers can be classified into various categories, see Figure 2-10. Each type of bicomponent
fiber in Figure 2-10 has its special features, and the end use of the bicomponent fiber is mainly
dependent upon the selection of the polymers, fiber morphology and its cross sectional shape.
For example, side-by-side fibers can mainly produce a self-crimping effect due to the different
physical or chemical properties of the two components in the same fiber.
The following categories of bicomponent fibers are commercially available now, and
each type will be discussed in further details in this section.
(A)Side-by-side (S/S)
This type of bicomponent fibers contains two components lying side by side, and they
are made by simultaneously spinning two components together so that they are distributed
longitudinally, both occupying the surface.
With proper polymer selection, this configuration can be very effective for producing
self-crimping or self-bulky fibers due to different chemical compositions or differences in
some properties such as molecular weight or degree of crystallization of the two components.
The difference in the shrinkage between the components, the difference between the modulus
of the components, the overall cross-sectional fiber shape and individual cross-sectional shapes
of each component, the thickness of the fiber, the change in composition, and the melt viscosity
difference all affect the crimping of the cross-sectional configurations of side-by-side fibers
(Hegde et al., 2004). Hegde et al. (2004) state that side-by-side fibers commercially available
are all made with this characteristic.

68
Bouchillon (1992) discussed the advantages of side by side fibers, as they possess bulk,
good resiliency and stretch/recovery properties. Other properties of nonwoven fabrics
composed of side-by-side fibers can be obtained by using additives (Shim, 2014). But side by
side fibers may not offer the strength that the sheath/core bicomponent fibers can provide for
nonwoven fabrics (Sun et al., 2004). Hence they can be used for apparel and shoe components,
toys, sleeping bags, pillows, furniture, upholstery and automotive parts (Bouchillon, 1992).
(B) Sheath-core (S/C)
A sheath-core bicomponent fiber is a fiber where one component forms a surface sheath
and the other component forms the core. Unlike side by side fibers, both of which exist on the
fiber surface, only one component is exposed to the surface, while the other one is embedded
inside as the core (Shim, 2014). Due to a large variety of applications, this configuration is the
most commonly available type of bicomponent fiber commercially (Dasdemir et al., 2012).
Different configurations of sheath-core fibers exist, such as concentric, eccentric, halo,
based on the location of the core component, and they also possess different core shapes (Shim,
2014). The most common sheath-core cross sectional shapes are concentric, where the core is
at the center, and eccentric, where the core is located off the center (see Figure. 2-10 (B)).
Concentric and eccentric core sheath configurations are made for different uses. The eccentric
configuration is used for providing self-crimping properties, while concentric configuration
imparts the fiber and fabric with higher strength (Dasdemir et al., 2012).
There are a number of factors which influence sheath-core fiber configurations,
including melt temperature, viscosity, surface tension and flow rate. Sheath core bicomponent
fibers can utilize particular physical properties, because the strength and conductivity can be
obtained by the core component while the aesthetics, textile, adhesive, and other properties can

69
be achieved by the sheath component (Shim, 2014). For example, if a sheath component has a
low melting point and a core component has a high melting point, they can serve as a self-
bonded fiber where only the sheath layer melts and the fibers stick to one another. Another
example is to select sheath polymers for aesthetic reasons such as luster and core polymers of
conductive or recycled materials. In addition, sheath core bicomponent fibers can reduce cost
if expensive additives which modify the surface characteristics are added only to the sheath
layer, instead of using the additives for the entire fiber (Hedge et al., 2004).
Overall, the major application areas of these fibers are related to nonwovens products
because the bonding (self-bonding) can be enhanced in thermally bonded nonwovens, the cost
can be reduced, the strength and flexibility can be increased, and the surface properties can be
improved (Dasdemir et al., 2012).
(C) Segmented-pie (Matrix/fibril)
There is a variety of matrix/fibril structures in terms of bicomponent fibers, and
segment-pie is one of them. A segment pie or pie wedge fiber is a round cross section made of
adjacent triangular wedges, where wedges of polymer A are separated by layers of polymer B
(Shim, 2014). One configuration variable of segment pie fibers is the number of segments.
There can be as few as 3, 4 segments, or as many as 32 or even 64 segments. This structure
displayed in Figure 2-10 (C) is commonly referred to as a "segmented pie structure" with 8
segments. To produce segment pie fibers, various fiber properties need to be controlled,
including splittability and dyeability. This splitting and entanglement makes the resultant
fabric have a higher tensile strength. The polymer distribution speed and melt viscosity of the
two polymers determine the precision of the fiber configuration (Shim, 2014).

70
The most popular application of segment pie bicomponent fibers is to produce micro
or submicron fibers by splitting the bicomponent fibers. These can be split by chemical,
mechanical and thermal treatments (Shim, 2014). For instance, when using mechanical
treatment, the fibers are made into a web and carded, and then the fiber web is passed through
a high-pressure jet of air or water to split the fibers into micro or submicron fibers. Each
individual segment becomes micro denier fibers or ultra-fine fibers on its own, and normally
possesses a triangular cross sectional area. The typical size is 0.1 to 0.3 denier. Polymer
combination has an essential role on optimal splittability, and the most commonly selected
polymers are polyester and nylon, which have low interfacial adhesion (Shim, 2014). The
specific applications for splittable segment pie fibers include, but are not limited to, synthetic
suede, heat insulators, battery separators, high performance wipes and specialty papers (Shim,
2014).
(D) Islands in the sea (I/S) (Matrix/fibril)
Another type of matrix/fibril bicomponent strucuture is islands in the sea fibers, and
they are mostly made into micro, sub-micron or nano fibers. An islands in the sea fiber contains
a sea component and an island component, in which the island component contains fine strands
embedded in the sea component (See Figure 2-10 (D)). The island strands remain individual
fibers and could yield micro, sub-micron, and nanoscale fibers when the sea component is
melted, split, or dissolved (Batra & Pourdeyhimi, 2012; Hegde et al., 2004). One benefit
brought by using water-soluble polymer as the sea component in an I/S bicomponent fiber is
eco-friendliness, which attracts research in the area, and several commercial water-soluble
polymers are available in the market, such as Exceval (PVOH polymer) by Kuraray and
EastOne (water dispersible solphonated polyester) by Eastman Chemical (Batra &

71
Pourdeyhimi, 2012). Additionally, islands-in-the-sea bicomponent fibers were the earliest type
of bicomponent nonwoven microfibers being developed, and the inventor Toray manufactured
such commercial I/S bicomponent fibers of 0.1 denier with polyester as the islands and a
soluble polymer as the sea (Batra & Pourdeyhimi, 2012).
The applications for islands in the sea fibers are ultra-high filtration media, artificial
arteries, specialty wipes, artificial leather and other specialized applications (Shim, 2014).
(E) Tipped (Matrix/fibril)
A tipped bicomponent fiber is a fiber where the second polymer is positioned on the
tip of a trilobal, delta or multilobal cross section fiber in small quantity (Refer to Figure 2-10
(E)). It is used to produce fibers with special aesthetic, bonding or other properties. Tipped
trilobal fibers can be split into fine fibers and provide soft hand (Shim, 2014).
(F) Segment ribbon (Matrix/fibril)
Segment ribbon is another bicomponent configuration (See Figure 2-10 (F)). It is the
most readily splittable configuration, and it can produce flat ribbon like fibers using splitting
methods (Hegde et al., 2004).
2.6.2.3 Bicomponent Fiber Processing
The extrusion processing has been widely used for bicomponent manufacturing, for
example spunbond (Batra & Pourdeyhimi, 2012), or melt blowing (Zhao et al., 2002; Zhao, &
Wadsworth, 2003), and to a lesser extent electrospinning has also been applied to bicomponent
processing (Gupta & Wilkes, 2003). Meanwhile, both meltblowing and electrospinning have
drawbacks when producing micro and nano fibers. Due to the low strength, meltblown and
electrospun webs are generally used as a layer over a substrate which offers matching
mechanical properties and functions well together with them (Bresee & Ko, 2003; Bresee,

72
Qureshi & Pelham, 2005; Grafe & Graham, 2003; Li & Xia, 2004). For another instance, for
electrospinning, the productivity is very low, though electrospun nanofiber mats are made with
substantially finer fibers than meltblown or spunbonded webs (Sun, Zussman, Yarin,
Wendorff, & Greiner, 2003; Li & Xia, 2004). Spunbond, as another bicomponent process, has
been used to produce bicomponent fibers with cross sections like I/S and segmented pie with
higher strength and uniformity (Fedorova, & Pourdeyhimi, 2007).
2.6.2.3.1 Meltblowing Processing for Bicomponent Fiber
Similar to the homocomponent meltblowing process, bicomponent meltblowing also
processes fibers being stretched by high speed air immediately after they are blown out (Figure
2-11) (Sun et al., 2004; Zhao et al., 2002; Zhao, & Wadsworth, 2003). The difference between
a homocomponent meltblown line and a bicomponent meltblown line is the installation of two
extruders for each polymer to be melted that merge and push the polymer streams through the
same spinneret.
Figure 2-11. Schematic diagram of melt blown setup for bicomponent fibers

73
The importance of the die and its design in meltblown technology has already been
discussed in section 2.3.2. For the bicomponent meltblown process, the meltblown die is still
an essential part because it controls the polymer distribution, and previous studies have implied
that the distribution of each polymer across the die can be affected by the shape of the polymer
distribution system. Consequently, for bicomponent fibers to achieve a constant polymer ratio
across the die width, adjusting the spinneret temperature at different locations is recommended
in order to optimize the process (Zhao, et al., 2002). The same research group experimented
with PP/PET bicomponent fibers. They found that the fiber shrinkage of PP is smaller than that
of PET in bicomponent fibers when the drawing air force decreases. This is especially evident
in samples made of 100% PET and bicomponent fibers with a higher percentage of PET
although the attenuation pattern is similar to that of monocomponent fibers. They also found
differences in drawing between PP and PET due to the higher extensional viscosity of PET,
and the attenuation pattern for the bicomponent fiber is in between those monocomponent
fibers (Zhao & Wadsworth, 2003; Zhao, Wadsworth, Sun, & Zhang, 2003).
2.6.2.3.2 Spunbond Processing for Bicomponent Fiber
Spunbond can produce a wide range of bicomponent fibers (for instance segmented pie
or I/S bicomponent fibers) by extruding polymer melt through dies, quenching with cold air,
attenuating using high velocity air streams to form bicomponent filaments, and obtaining
splittable or soluble nanofibers and microfibers by mechanical actions (including
hydroentangling, carding, twisting, and drawing) or chemical actions (such as dissolving one
component) (Fedorova & Pourdeyhimi, 2007; Hagewood, 2004; Sun et al., 2004).
Hydroentangling I/S bicomponent fibers can provide bonding to the web, release the islands,
and fibrillate the sea component into finer fiber. The same is true for the fibrillation of the

74
sheath layer of a S/C spunbond hydroentangled-fibrillated fabric (Fedorova & Pourdeyhimi,
2007; Anantharamaiah, Verenich, & Pourdeyhimi, 2008). Past research has also proved that
differential swelling or shrinkage of the two components in reaction to the surroundings,
including heat, steam, humidity, and ambient fluid, can split the bicomponent fibers (Batra &
Pourdeyhimi, 2012). Spunbond splittable or soluble nanofibers and microfibers generally have
a diameter of 0.1-5µm, are uniform and have sufficient strength for a lot of applications
(Fedorova & Pourdeyhimi, 2007; Hagewood, 2004; Sun et al., 2004). Evolon® made by
Freudenberg is one commercially available product manufactured with the spunbond
segmented pie technique.
The following figure (Figure 2-12) shows the process. Each of the polymers is melted
in an extruder, then the molten polymers pass through the filters, the spin beam, and the spin
pack distribution system separately and form a conjugate stream when entering the spinneret
orifices. Once exiting the spinneret orifices, the bicomponent fibers are quenched, attenuated,
and deposited on the moving belt, which is the same as in the case of homocomponent fibers.
As a consequence, bicomponent fibers made with the melt blowing and spunbond processes
also have different dimension attenuations and polymer macrostructures. The Hill’s open
spunbond system for the bicomponent fiber (Fedorova, 2006) is shown in Figure 2-12.

75
Figure 2-12. Hill’s open system for bicomponent spunbond nonwovens (Fedorova, 2006)
2.6.2.3.3 Electrospinning for Bicomponent Fibers
Fibers at nanoscale offer substantial application potential ranging from biomedicine,
energy harvest and storage, to military applications. Electrospinning has been a widely used
technology for producing nanofibers because of its easy processing, low cost, and flexibility
in raw materials. Based on the same fundamental principle, various equipment designs for
electrospinning have been reported. For instance, sheath-core bicomponent fibers require a
carefully designed and fabricated spinneret (Moghe & Gupta, 2008).
Li and Xia (2004) proposed hollow nanofibers made by electrospun bicomponent fibers
with two immiscible polymers. A coaxial, two-capillary spinneret was employed in this work,
by which core/sheath structure fibers can be produced. The core and sheath polymer solutions
underwent the same bending instability and were drawn by identical electric fields. After
removing the core component, hollowed structures were obtained. The core component used

76
in that study was a mineral oil other than dissolvable polymers, which later was extracted by
octane, and the sheath component was the blended polymers with PVP (Polyvinylpyrrolidone)
and Ti (OiPr) 4. From the SEM images in Figure 2-13, it can be seen that continuous and
hollow fibers with uniform and circular morphology were formed. Besides randomly arranged
fiber webs, aligned arrays were also processed through modifying the collector.
Figure 2-13. (A) spinneret for electrospinning core/sheath bicomponent fiber;(B)TEM image of two as spun fibers and their overlap;(C)TEM image of Ti02(anatase) hollow fibers that
were obtained by calcining the composite nanotubes in air at 500℃;(D) SEM image of aligned array of anatase hollow fibers collected across the gap between a pair of electrodes
(Li et al., 2004)
Similar to the above processing, Loscertales et al. (2002) reported design of coaxial
capillaries for core/sheath bicomponent fibers. His research also demonstrated that by
adjusting processing parameters, a stable coaxial jet can be developed. In addition,
bicomponent core/sheath particles can be produced due to varicose breakup as electrospray.
Besides traditionally geometrical bicomponent electrospinning fibers, there also are
fibers with solution mixed bicomponents. Buschle-Diller et al. (2007) produced PLA (poly(L-
lactic acid)) and PCL (poly(e-caprolactone)) bicomponent electrospinning fibers incorporated
with three types of antibiotics. Results on drug delivery properties are shown in Figure 2-14.
Therefore by forming bicomponent fibers, surface and drug releasing performance can be

77
modified to achieve sensible drug delivery. As the portion of PCL increased, fiber surface was
enhanced. Also, in terms of drug releasing performance as a function of time, bicomponent
fibers with certain component ratios can reach very stable states.
Figure 2-14. (a) SEM image of PLA/PCL bicomponent fiber; (b) Drug releasing performance (Buschle-Diller et al., 2007)
2.6.2.4 Performance of Bicomponent Fibers
The performance of bicomponent fibers is dominated by the component polymers’
properties, and the interaction between the polymers (Dasdemir et al., 2012). Combining
polymers within fibers can modify the properties of fibers and further impart unique features
which cannot be achieved from monopolymers, such as improved mechanical performance
(Radhakrishnan, Kikutani & Okui, 1997), antibacterial function (Buschle-Diler, Cooper, Xie,
Wu, Waldrup & Ren, 2007), electrical conductivity (Lund, Jonasson, Johansson, Haagensen
& Hagström, 2012), or a mixture of those aspects (Shi, Ito & Kikutani, 2006). Moreover,
another main application of bicomponent fibers is to produce finer microfibers and nanofibers
through fiber splitting techniques or single component dissolving techniques (Fedorova, &
Pourdeyhimi, 2007; Sun et al., 2004). It is highly possible to produce specialty fibers by

78
selecting cross-sectional designs which corresponds with the end-use application (Batra &
Pourdeyhimi, 2012; Dasdemir et al., 2012; Sun et al., 2004). The difficulty in dyeing is another
challenge for sub-micron and nano-scale fibers due to the high surface area (Batra &
Pourdeyhimi, 2012). One solution to this problem mentioned by Batra and Pourdeyhimi (2012)
in their book is to use large and small fibers in combination as a hybrid nonwoven structure
(USP 7,883,772 (2011); USP 7,981,226 (2011); USP 7,981,336 (2011)).
The important factors influencing bicomponent fiber processing will be discussed in
the following sections.
2.6.2.4.1 Crimp Effect of Bicomponent Fibers
Ideally the main reason to utilize bicomponent fibers is to achieve multi-functional
purposes and to enhance the performance by imparting properties of both polymers onto the
new bicomponent fibers. However, due to the complexity of the properties of each polymer
and their interactions, the desired fiber structure and its end-use application dictate the
selection of polymers in bicomponent fibers.
The research on crimping morphology of bicomponent fibers have attempted to identify
and understand the factors affecting the structure in a quantitative way. Denton (1982) has
suggested a geometrical model of bicomponent fiber and it is shown in the following equation:
—where R is the radius of fiber crimp curvature; A1 is the cross-section of component
1 (corresponding to the other component 2); µ1 is the distance from center of component 1 to
the center of the fiber in cross-section; I0 is the second moment of area of fiber cross-section;
and ∆ is the fractional differential shrinkage between the components.

79
From the equation above, we can tell that the radius of crimped fiber curvature is
proportional to the shrinkage difference between two components. The result is also related to
the cross-section shape of the fiber and individual components, implying the crimp
morphology can be changed by different cross section designs.
The crimping effect is the main purpose to utilize side-by-side bicomponent fibers by
combining polymers on different sides with different shrinkages (Denton, 1982; Lin, Wang &
Wang, 2005; Rwei, Lin & Su, 2005; Luo, Xu & Wang, 2009). Lin, Wang & Wang (2005)
conducted a study on using both of the two polymers, polyurethane (PU) and polyacrylonitrile
(PAN) to produce “self-crimping” electrospun bicomponent fibers. PU is an elastomeric
polymer with a glass transition temperature much lower than room temperature and it displays
elastic and flexible performances. On the other hand, PAN nanofiber is a thermoplastic
polymer, stiffer than PU at room temperature. Therefore, stretching PAN/PU fiber will result
in different shrinkages as well as create crimping morphology. Also, crimping can be further
improved by heating or a combination of heat and wet treatment after the drawing process. The
crimping effect can be modified by changing fractions of the two polymer components (Figure
2-15).
Figure 2-15. (a) SEM image of PAN/PU “self-crimping bicomponent nanofiber”; (b) schematic of PAN/PU crimp fiber (Lin, Wang & Wang, 2005)

80
PTT(polytrim ethylene terephthalate)/PET(polyethylene terephthalate) composed side
by side bicomponent fibers also indicate that self-crimping is caused by two polymers with
different shrinkage performances (Luo et al., 2009; Radhakrishnan et al., 1997; Rwei, Lin &
Su, 2005). In Luo et al.’s study (2009) PTT/PET filaments with varied cross-section shapes
and crimping conformations were produced and analyzed. The results indicate that not only
polymer types, but also component ratios, elastic performance, and spinning parameters all
influence the crimp structure of filaments.
Another previous study (Rwei, Lin & Su, 2005) illustrates the PBT (polybutylene
terephthalate)/PET side by side fibers’ crimping conformation. Rwei et al. (2005) compared
the crimp effects of three types of filaments with varied components but the same volume
fractions. The conclusion was that PTT/PET fibers have the highest crimp potential, followed
by PET/PBT fibers, and PET/CD fibers have the lowest crimp potential. CD refers to Cation
Dyeable and is a chemically modified PET. Moreover, the researchers also studied the
relationship between the shape of the filaments and the crimp potential, and they found that
triangle shaped side by side fibers have more crimping than round/circle shaped ones (Rwei,
Lin, & Su, 2005).
It has also been noticed that the same type of polymer components with different
characteristics, such as viscosity, molecular weight and crystallinity, can be used for crimping
fibers. Oh (2006) investigated the crimp morphology and shrinkage of PET side-by-side
bicomponent filaments made from polymer with different viscosities. By increasing the
drawing ratio, decreasing the heat-set temperature and the drawing temperature, two types of
PET (regular PET and modified PET) presented a larger shrinkage difference, leading to a
higher crimp contraction (Oh, 2006).

81
2.6.2.4.2 Splitting Used for Bicomponent Fibers
Splitting was discussed earlier in the section for spunbond bicomponent processing,
and it will be explained in full details here. As a technique to produce ultra-fine fibers, splitting
bicomponent fiber technology was commercialized in 1960s in Japan for synthetic suede
fabrics (Makoto et al., 1971). Bicomponent fibers can be split into fine fibers made of the
respective components. If the composite fiber is formed from incompatible polymers, then two
individual component microfilaments are formed after splitting (U.S. Patent 5,783,503 and
5,759,926). The fiber splitting technique was commercially achieved in spunbond webs and
carded webs with S/S, segmented pie, and island-in-the-sea types of cross section
configurations (Sun et al., 2004).
In order to split the bicomponent fiber, the two components in the fiber should possess
immiscible or incompatible properties, different solubility and other distinct physical
properties (Marmon et al., 1998), so that the components can separate or split into individual
filaments after the fiber-splitting treatment. Sun et al. (2004) proposed that the melt rheologies
of the two components should be considered as well, so that one component does not totally
get enclosed in the other one during melt spinning, causing difficulty in splitting. They also
stated that there should be a balance of adhesion and incompatibility between the components
of the bicomponent fiber because the adhesion should be sufficient to enable each component
to form unsplit nonwoven webs without any separation during manufacturing and at the same
time the polymers adhesion between the components should be weak enough to be split during
separation treatment.
The two main approaches to splitting bicomponent fibers are mechanical methods and
chemical methods. In terms of mechanical methods, drawing, needle punching, beating,

82
twisting, carding, and hydroentangling have all been studied (Anantharamaiah, Verenich, &
Pourdeyhimi, 2008; Fedorova, 2006; Fedorova & Pourdeyhimi, 2007; Louks et al., 2000; Sun
et al., 2004). For chemical methods, solvent dissolving or swelling are commonly mentioned
in past research (Batra & Pourdeyhimi, 2012; Sun et al., 2003; Zhang et al., 2004). To split
bicomponent fibers mechanically, poor interface adhesion between the components is desired.
The typical polymer components with incompatible and immiscible properties include
PO(polyolefin)/PA(polyamide), PO/PET, and PA/PET (Sun et al., 2004; Pike, 1999).
Zhao et al. (2012) split spunbond PA6/PET segmented-pie fiber using spunlace
technology and obtained micro fibers with a reduced linear density at 0.17-0.23 denier.
However, some fibers began to separate during processing before applying specific splitting
treatment (Figure 2-16). As a result, it is still challenging to achieve fine filaments using
mechanical methods since the balance of the adhesion and incompatibility between the
components of the bicomponent fiber is hard to control.
Figure 2-16. (a) Optical Microscopy image of cross section of segment PA6/PET bicomponent fiber; (b) Micrograph of the appearance of fiber split before post-drawing
(x200) (Zhao et al., 2012)
Dugan (2002) developed mechanically split multicomponent polyolefin fibers in his
experiment. To attain the split fiber, one component he used is branched alkyl olyfin polymer

83
and the other component is straight-chain alkyl olefin polymer. The resulting fine fibers are
claimed to be an excellent choice for filter media products.
Chemical splitting methods are mainly referred to as the dissolving method, in which
at least one component in bicomponent fibers is sacrificed and removed in solution. Zeronian
et al. (1999) split fine PET fibers from alkaline hydrolysis PBT in core/sheath bicomponent.
However since the PET reacted a little to the solution which was used to dissolve the PBT
materials, the resulting fiber surface was not as smooth and uniform as its homocomponent
counterpart.
Another study used chemical methods to split PA6/PLA (poly (lactic) acid) island in
sea spunbond bicomponent fibers (Fedorova, 2006; Fedorova & Pourdeyhimi, 2007) (Figure
2-17). PA6 was the “island” component, while PLA was the “sea” component, which was
dissolved in a 3% caustic soda water solution at 100℃. The diameter of 75% of the final
“island” fine fibers range from 2.3 to 0.5µm.
Figure 2-17. (a) SEM image of PA6/PLA island in sea bicomponent fiber with half removing PLA; (b) SEM image of bicomponent fiber cross-section; (c) PA6 fiber diameter after
removing PLA as a function of number of island (Fedorova et al., 2007)
2.6.2.4.3 Mechanical Performance
Mechanical performance also has an important impact on the selection of polymer type.
Dasdemir et al. (2012) compared the strain at break between PET/PE and PA6/PE bicomponent
fibers and their homocomponent counterparts. In comparison with homocomponent polymers,

84
bicomponent fibers had relatively low failure strain. In addition, the interfacial fracture energy
between two components was tested. PA6 had higher interfacial fracture energy with PE than
PET, which is consistent with the trend of ultimate strain. By comparing SEM images of the
cross-sectional areas, cracking was shown between core PET and sheath PE (Figure 2-18).
Figure 2-18. (a) strain at break of homocomponent PET, PA6, PE and bicomponent core/sheath PET/PE, PA6/PE fibers ;(b) interfacial fracture energies between core and
sheath polymers;(c) SEM images of cross-section of these two types of bicomponent fibers (Dasdemir et al., 2012)
2.6.2.4.4 Polymers Interaction in Bicomponent Fibers
Different polymers in bicomponent fibers often have interactions during processing,
which will affect final fiber orientation and crystallinity. Dasdemir et al. (2012) investigated
interactions between components and proved that the interactions could influence crystallinity,
crystalline structures, and thermal performance of bicomponent fibers compared with the
homocomponent ones. According to their results, the crystallinity of cores of PET/PE, PA6/PE
and PA6/PP bicomponent fibers increased while it decreased in PP/PE fiber. Figure 2-19
illustrates the crystallinity of sheath in all of the bicomponent fibers decreased. They also
studied the effect of interaction on crystalline structure of bicomponent fibers using X-ray

85
diffraction, which showed that the intensity of the crystalline peaks for the sheath component
decreased significantly. The reason for this might be that the polymers which underwent stress
relaxation were not oriented at all. Moreover, thermal properties have been tested. The melting
temperatures of core polymers and sheath polymer increased and decreased, respectively
(Figure 2-20). The study revealed that PP/PE, which was the best pairing for bicomponent
fibers, exhibited a higher tensile strength compared to other polymer combinations because of
their degree of incompatibility and interfacial adhesion.
Figure 2-19. Effect of the second component on the crystallinity of (a) core and (b) sheath components (Dasdemir et al., 2012)
Figure 2-20. WAXD pattern of homocomponent and bicomponent nonwoven fibers (Dasdemir et al., 2012)

86
2.6.3 Other Methods for Manufacturing Nanofibers
There are other various methods to produce nanofibers, including phase separation,
template synthesis, self-assembly, Forcespinning® (Lozano & Sarkar, 2009; McEachin &
Lozano, 2012; Sarkar, Gomez, Zambrano, Ramirez, Hoyos, Vasquez, & Lozano, 2010), and
centrifugal spinning (Voelker, Zettler, Fath, & Berbner, 1996; Weitz, Harnau, Rauschenbach,
Burghard, & Kern, 2008; Zhang & Lu, 2014).
2.7 Filtration and Separation Medium Market
2.7.1 Filtration and Separation
According to Gregor (2015), the filtration and separation industry has been growing
steadily at the rate of two to six percent per year above the GDP during the past 20 years, even
when the economy was going downhill.
Separation and barrier fabrics are used to separate one substance from another and
sometimes to even provide some protection. Based on the nature of substances, separations can
happen in the following circumstances: solids-liquids separations, solids-solids separations,
solids-gases separations, liquids-liquids separations, liquids-gases separations, and gases-gases
separations (Hutten, 2007). Based on the definition, both gas and liquid are considered to be
fluid (Hutten, 2007). Similarly, Sutherland (2008) groups separation, in a broader range, into
the following two categories depending on the phases: completely mixed phases and distinct
phases. Completely mixed phases consist of vaporization (distillation, evaporation and drying,
and sublimation), condensation, sorption (absorption, and adsorption), and phase transfer
(diffusion, and leaching and extraction) (Sutherland, 2008, p. 2). Distinct phases include solid
from solid (screening and elutriation, and classification), solid from fluid [filtration,
sedimentation, flotation, scrubbing (wet or dry), and electrostatic precipitation], liquid from

87
liquid (sedimentation and coalescing), liquid from gas (demisting and sedimentation), and gas
from liquid (defoaming and sedimentation) (Sutherland, 2008, p. 2). According to Hutten
(2007) and Sutherland (2008), rarely does solids-solids separations use nonwovens as the
filtration media, instead screening and elutriating large particles from a solid mixture with
smaller particles, classification, and magnetic separation are used as the common methods for
solids-solids separations. However, the other types of separation processes mentioned above
involve nonwovens. In the case of solids-liquids separations, Wakeman and Tarleton (2005)
mention several components, pre-treatment, solid concentration, solid separation, and post-
treatment, used for the process.
The purpose of separation is different from that of filtration. Filtration is regarded as
one type of separation (Sutherland, 2008). In his book Filters and Filtration Handbook,
Sutherland (2008) defines filtration as “the act of separating one or more distinct phases from
another in a process which uses physical differences in the phases (such as particle size or
density or electric charge)” (p.1). For the nonwovens industry, Butler (1999) defines filtration
as “a mechanism or device for separating one substance from another”, and filtration can
“separate contaminants from a fluid or separate value-added materials, such as minerals,
chemicals, or foodstuffs in a process operation”. Moreover, within a filtration system or filter,
filter media is considered to be the most vital part because of its placement in the fluid flow
and it controls the success or failure of the filter (Sutherland, 2008; Wakeman & Tarleton,
2005). Nonwovens have been widely used for such purposes. Other than being used as
filtration media, nonwovens are used in other separations, including adsorption, absorption,
extraction coalescence, electrostatic effects, and antimicrobial activity (Hutten, 2007).

88
Typically, filtration is to trap the particulate matter in the tortuous matrix structure of
the filter medium so that those impurities from the moving fluid can be removed (Hutten,
2007), and it also can separate valuable minerals, or chemicals, from suspension in a fluid
(a.k.a. harvesting) (Butler, 1999; Purchas & Sutherland, 2002). The purpose of filtration that
we focus on here is to filter the contaminants or other unwanted matters out of the fluid (such
as gas or liquid), so the filter media traps those unwanted matters and the rest of the substance
penetrating through the filter is clean and pure without being contaminated.
Particles can pass through the barrier (filter medium) if they are smaller than the pore
size of the filter in use, while larger particles will be trapped on the surface or inside the barrier
(Sutherland, 2008). Due to the different sizes of contaminants, different methods for filtration
to retain particles are needed. Generally, filters can be grouped into surface filters and depth
filters. Surface filters, also known as cake filtration, collect and keep contaminants on the
outside of the filter medium; in order to enhance the capacity, the filtration medium can be
pleated to increase the surface area. Cake filtration collects particles deposited on the surface
of filter medium that are larger than the pore sizes of the filter (Wakeman & Tarleton, 2005).
Two mechanisms, complete blocking and bridging, combined, contribute to the occurrence of
cake filtration (Wakeman & Tarleton, 2005). Complete blocking is a sieving process which
takes place if the particles are larger than the pore sizes of a filter. Bridging refers to the process
to form a cake from the particles whose sizes are smaller than the pore sizes of a filter. The
permeability and porosity of the filtering zone strongly influences the filter efficiency. The
permeability of the cake depends on the particle size, shape, thickness (depth) of solids, and
on the liquid properties, such as viscosity (Wakeman & Tarleton, 2005). In contrast, deposition
takes place inside the filter medium if the size of the particles is smaller than the pore sizes in

89
the filter medium and the concentration of solid particles is low. This process of separation is
depth filtration (Wakeman & Tarleton, 2005). Depth filtration separates a suspended particle
or liquid droplet from the carrying fluid within the depth or thickness of the filter medium,
which can be caused by mechanical or surface chemical effects (Wakeman & Tarleton, 2005).
2.7.2 Filter Medium
The filter medium is to provide “a clear separation of particulates (or sometimes other
components)” from a fluid with the lowest energy consumption possible (Wakeman &
Tarleton, 2005). Purchas and Sutherland (2002) suggested the following definition for filter
medium:
“A filter medium is any material that, under the operating conditions of the filter, is
permeable to one or more components of a mixture, solution, or suspension, and is
impermeable to the remaining components.” (Purchas & Sutherland, 2002, p.1)
Also, they described the filter medium as “the porous material in a filter that does the
actual filtering” in the book’s glossary (Purchas & Sutherland, 2002). A wide range of material
can be used as filter media, such as woven fabrics, fibrous materials, polymeric and ceramic
sheets, sintered metals, perforated sheets, and nonwoven media, and they are listed based on
rigidity in Table 2-3 (Purchas, 1981; Wakeman & Tarleton, 2005). However, it is still not a
complete list because some other materials including sand are not listed. Moreover, Hutten
(2007) prefers the definition given by Purchas and Sutherland (2002) since particle entrapment
is only a type of separation processes, and he lists other types of media used for separation
processes, including adsorbent media, absorbent media, coalescing media, electro-filtration,
antimicrobial media, extraction, filter support, and composite structures (See Table 2-3 for
details).

90
Table 2-3 Types of filter media based on rigidity (Purchas, 1981; Wakeman & Tarleton, 2005, p. 79)

91
Table 2-4 Different filter media types, their filtering mechanism and application areas
Filter media types
Description of the mechanism Materials commonly used & applications
Particle entrapment
Separates one or more phases from a moving fluid by entrapping the solid particles in the tortuous matrix structure of a filter medium
Both liquid filtration and gas filtration
Adsorbent media Removes liquid and soluble contaminants from fluid by surface adsorption/surface effects
Active carbon, activated alumina, zeolites, ion exchange resins, baking soda (sodium bicarbonate). Filtering drinking water; gas masks and respirators; automotive cabin filter; HVAC systems
Absorbent media Absorbs contaminants into the porous structure of the medium, but leaves an undesired property in the use of filter medium due to weaker and softer structure, worse filtration performance and shorter filter life caused by absorbency
Oil spills at sea can be removed using porous materials made of polyolefin. Diaper fluff, hygienic pads, wipes are not included due to lack of separation.
Coalescing media A particulate filtration, using fine fibers to trap and hold the liquid particles onto fibers. Also needs to transport the entrapped liquid particles out from gas or liquid phase by flotation or gravity settling mechanism
Dispersed hydrocarbon from water; oil mist from air; moisture and vapor from air; moisture from aviation fuel
Electro-filtration Electrostatically charged media attracts particles in the gas phase; electrokinetic media imparts a positive electronic charge to attract anionic particles in a polar fluid stream
Electrostatic filter media: air filtration for enhancing initial filtration efficiency and lower pressure drop Eletrokinetic filter media: liquid application, e.g. Zeta Plus® by Cuno Inc.
Antimicrobial media
Uses an agent to inhibit the bacteria, fungi, and yeast from growing in the filter, and prevents the migration of biological microorganisms into the filtrate or filtered product.
The antimicrobial agent can be applied in the finishing process or incorporated into the fiber.
Extraction media
Provides structural support for the extraction process
e.g. coffee filters, teabags, and tea filters
Filter support Does not filter or serves as a prefilter layer to support structure of the medium and improve the efficiency of filter medium (gradient density filter medium)
SMS: spunbond as a supporting web; needle punched webs, cellulose webs, and metal mesh materials offer strength to the structure
Composite structures
Uses at least two different web forming techniques combined; and involves more than one separation process in one medium.
SMS
Note. Adapted from Handbook of Nonwoven Filter Media, p. 6-9, by I.M. Hutten, 2007, Oxford; Burlington, MA: Butterworth-Heinemann.

92
Hutten (2007) pointed out that, for nonwoven filter media, a driving force, normally a
pressure differential, has to exist to force the fluid to move and pass through the medium. The
pressure differential could come from gravity, a compressor, a vacuum, a pump, a fan, a
blower, capillary action, a thermal gradient forcing diffusion, or voltage potentials. The filter
medium has to meet specific requirements under different settings.
2.7.3 Categories of Filter Medium
EDANA published a list of classification based on nonwovens end use market in 2004,
and according to the classification, “Filtration Liquid, Air and Gas” is one main category, with
three sub-categories: “HEVAC/HEPA/ULPA filters”; “liquid - oil, beer, milk, liquid coolants,
fruit juices, etc.”; and “activated carbon” (www.edana.org) (Batra & Pourdeyhimi, 2012).
Additionally, under the main category “home”, “vacuum cleaner bags”, “kitchen and fan
filters”, “tea and coffee bags”, “coffee filters”, and “kettle descaler bags” are the sub-categories
associated with filtration; and under the main category “automotive”, “oil filters” and “cabin
air filters” are two of the 21 sub-categories (www.edana.org) (Batra & Pourdeyhimi, 2012).
The last category is “masks”, which is grouped under the subcategory of “surgical” within the
main category “medical” (Batra & Pourdeyhimi, 2012). Similarly, INDA also developed an
end use classification during the same year, and “air filtration” and “liquid filtration” are the
two out of 17 main classifications (www.inda.org) (Batra & Pourdeyhimi, 2012). “Dust
collection, high efficiency and ‘absolute’ filters for clean rooms, hospitals. Heating,
ventilating, and air conditioning filters, facemasks, carburetor air filter, vacuum cleaner bags,
and passenger car cabin filters” are listed in the “air filtration” category, and the “liquid
filtration” includes “metal fabrication coolant oil, process liquid, swimming pools and spas,
edible oil, cooking oil, tea bags, coffee filters, micron-rated bags and blood filters (medical)”

93
(Batra & Pourdeyhimi, 2012, p.xxvi). Generally, based on different purposes and properties of
substance to be filtered, filtration and separation fabrics can be grouped into two categories,
including liquids and gases. According to Sutherland (2008), “dry” filtration, filtration used
for dry substance such as gases, accounts for only about 15% of the total filtration market,
which is one sixth the market volume of “wet” filtration, filtration involving liquid substances.
2.7.3.1 Gas Filtration and Separation
2.7.3.1.1 Air Filtration
Air filtration is used in various situations, ranging from facial masks, air conditioning
units, to automobiles, and industrial settings. By removing harmful particles from the air before
they become in contact with and threaten individuals and manufacturing processes, air
filtration serves for protection purposes as it can control airborne contaminants.
Air filtration is used everywhere. Sutherland (2008) listed a series of applications for
air and other gas filtration, including:
• respirators and breathing air systems;
• compressed air production, especially for pneumatic and hospital air systems;
• critical working environment ventilation, such as in clean rooms;
• general building ventilation and air conditioning;
• air filtration for vehicle cabins;
• mobile engine air intakes and exhausts;
• large stationary engine air intakes;
• process air cleaning, where the air is to be a process input, or coolant;
• process exhausts, especially those from chemical reactions; and
• demisting of gas streams to remove water or oil droplets (p. 37-38).

94
In order to capture unwanted particles or droplets onto the air filter media, the particle
either collides with, or is removed by, the filter media fibers, and the captured particle has to
adhere to the media fibers. Overall, air filter media needs to meet a few main requirements and
these are high filtration efficiency, large dust holding capacity, and low pressure drop.
Environmental conditions and energy costs can be taken into consideration as well. The desired
filters should have an extremely low pressure drop and very high filtration efficiency. The
filtration efficiency of the nonwoven media can be affected by several physical properties,
including fiber diameter, fiber shape, fiber surface area, fiber density, porosity, filter thickness,
pore size distribution and most penetrating particle size (Shim, 2014). Gregor (1998)
summarized the "triboelectric effect" being used as the main method to achieve a low pressure
drop in filtration if two polymers of different electro negativities are in contact. The Textiles
and Nonwovens Development Center (TANDEC) at the University of Tennessee has
developed a different approach, using an electrostatic charging process to prevent a high
pressure drop in the filtration process to boost the filtration performance (U.S. Patent no.
5,401,446).
Air filtration efficiency is measured using two different standards in the U.S. and
Europe. In the U.S., the American Society for Heating, Refrigerating and Air Conditioning
Engineers (ASHRAE) and the United States Environmental Protection Agency (EPA) jointly
developed standards for air filter efficiency. The Air filters’ efficiency can be evaluated using
a Minimum Efficiency Reporting Value (MERV) rating based on particle size. In Table 2-5,
the classification has three groups based on particle sizes; 3 to 10 micrometers, 1 to 3
micrometers, and .3 to 1 micrometer. Filters with a MERV rating of 13 or higher are used for
removal of fine particles in industrial, hospitals/healthcare, and hazardous applications (Shim,

95
2014). In Europe, Eurovent 4/5 and EN 779 are used as the standard for air filters. EN 779 was
developed by CEN (European Committee for Standardization, translated in English),
containing two major groups, “coarse” and “finer” filters, and nine classes of filters (Table
2-6).
Table 2-5 Evaluation standard by ASHRAE
Table 2-6 EN 779 by CEN
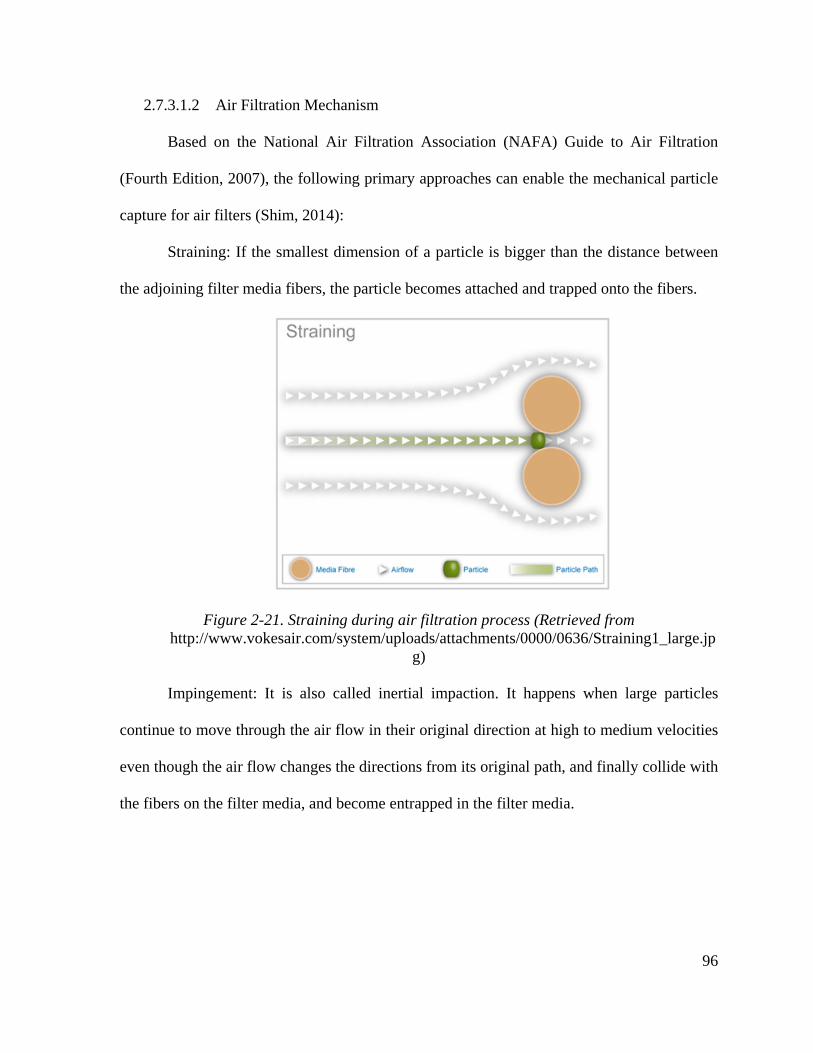
96
2.7.3.1.2 Air Filtration Mechanism
Based on the National Air Filtration Association (NAFA) Guide to Air Filtration
(Fourth Edition, 2007), the following primary approaches can enable the mechanical particle
capture for air filters (Shim, 2014):
Straining: If the smallest dimension of a particle is bigger than the distance between
the adjoining filter media fibers, the particle becomes attached and trapped onto the fibers.
Figure 2-21. Straining during air filtration process (Retrieved from http://www.vokesair.com/system/uploads/attachments/0000/0636/Straining1_large.jp
g)
Impingement: It is also called inertial impaction. It happens when large particles
continue to move through the air flow in their original direction at high to medium velocities
even though the air flow changes the directions from its original path, and finally collide with
the fibers on the filter media, and become entrapped in the filter media.

97
Figure 2-22. Impingement during air filtration process (Retrieved from http://www.vokesair.com/system/uploads/attachments/0000/0649/Impingement1_large.jpg )
Direct interception: This applies to particles with sizes similar to the pore size of the
filter media. Those particles will follow the air stream and get trapped by the fibers on the filter
media when the forces of attraction between the fibers and the particles are greater than the
force of the air stream to drive out the particles.
Figure 2-23. Direct interception during air filtration process (Retrieved from http://www.vokesair.com/system/uploads/attachments/0000/0675/Interception1_large.jpg)

98
Brownian diffusion: This mechanism happens mostly to nano particles, and it is
applicable to fine filter fibers and very low air velocities. Nano particles move away from areas
of higher concentration in an irregular direction when air passes through the filter, and this
changeable path increases the chance that the fine particles get in contact with the fibers and
become trapped by them.
Figure 2-24. Brownian diffusion during air filtration process (Retrieved from http://www.vokesair.com/system/uploads/attachments/0000/0662/Diffusion1_large.jpg)
Electrostatic capture: The particles will be attracted onto the filter media when the
particles and the filter media are charged with opposing electricity, and the particles will stay
trapped. It can apply to all particle sizes traveling at low to medium velocities. Electret charges
are more frequently seen in synthetic electro-mechanical air filter media production.
2.7.3.1.3 Types of Nonwoven Media in Air Filters
Based on the materials used for nonwoven air filter media, they can be categorized into
natural, man-made cellulose and synthetic fibers. Among all of them, polypropylene, polyester,

99
and glass are most commonly used (Shim, 2014). Cotton, wood pulp, polyester, polypropylene,
glass, nylon, acrylics, rayon and other materials have been utilized for air filter media
production (Montefusco, 2005). Air filter media made of synthetic fibers are considered to be
a better choice, as they perform better, are less likely to be corroded, are easier to bond, are
more flexible, are moldable and uniform, are more thermally and are electrically stable (Shim,
2014). Other advantages include that they use less media while offering a great performance;
longer life and fewer change outs for high-capacity pleated filters; no need to use binders in
synthetic filters, which prevents off-gassing (Fedel, 2013). Nanofibers, where the fiber
diameter is less than .3 micrometers, are also finding increased usage in filter (Shim, 2014).
Nonwoven air filter media can be categorized based on web forming technologies, such
as wet laid, air laid, spunbond, meltblown and composites (Montefusco, 2005). HEPA filters
for clean rooms, HVAC, automotive air intake, and gas turbine and cabin air filters are
examples of wet laid air filters (Montefusco, 2005). Wet laid nonwovens can produce air filters
at low basis weights and still provide uniformity for the fabric. The meltblown process enables
the filters to utilize smaller fiber diameters which provide good barrier properties at relatively
low costs (Shim, 2014). For most air filters, the fine fibers in meltblown webs can remove dust
and small particles efficiently, with electrostatic charged filter providing better filtration (Tsai
& Wadsworth, 1995). The charging techniques, the material properties, and the basis weight
of the fibrous material all affect the charge retention life of the filter. However, the electrostatic
charge decay cannot be ignored for electret filters (Tsai, Huang, & Wadsworth, 1999). A past
study has demonstrated that meltblown PP fibers have a steady charge retention at ambient
environment over time (Tsai & Wadsworth, 1995). For spunbond webs, they are often used as
supporting material for filtration media. Spunbond processed air filters generally possess a

100
large dust holding capacity owing to the strength of spunbond webs, however the pore size
distribution is not as uniform as that of wet laid or meltblown webs (Shim, 2014). Air laid
nonwovens air filters also provide a large dust holding capacity as the material has high loft,
and they are normally used as pre-filters, barrier fabrics and in automotives (Shim, 2014). To
bond the nonwoven webs mentioned above, either needle punching, thermal bonding or resin
bonding can be used (Montefusco, 2005).

101
Chapter 2 (B) Literature Review on Technology Management
In Chapter 2 (B), technology management, data types and sources, text mining, tech mining,
and patents and patent analysis are discussed.
2.8 Technology Management
2.8.1 Background Information on Technology Management
Technology management has three components: the management of technology
creation, technology storage, and technology use (Ernst, 2003). Overall, technology
management is a challenging area because it involves two distinct components, the
management part, which involves decision making based on decision makers’ beliefs and
values, and the technological knowledge part, which can help shape and reflect the perceptions
and the goals of the decision makers. As von Winterfeldt (2013) suggests, any decision
involving “important consequences”, “uncertainty”, “conflicting objectives”, “multiple
stakeholders”, or “complexity of the decision environment” needs great deliberation built on
scientific information, which is found in scientific journals, scholarly books, and patents.
Decisions regarding technology management are often difficult, since they require information
collection, expert opinions, evaluation and analysis, as well as assessment following the
decision being made. The debate on whether technology management is a science (Burgelman,
Christensen & Wheelwright, 2004) or art (Scabrough & Swan, 2001) was topical in the 2000s.
Nonetheless, Hatchuel (2005) considered technology management to be neither science nor
art, but rather a science of action, relying on analysis based decisions (Chanaron & Grande,
2006). Dankbaar (1993) considered technology management to be a synonym for the
management of technological change. Similarly, Chanaron and Grande (2006) point out that
technology management means a combination of “the management of innovation”, “the

102
management of change (e.g. ‘the management of technology’)”, as well as the “management
by or through technology”, where they describe innovation as any change caused by
technology to fulfill the organization’s economic goal (p. 956). They conclude that technology
management is “a set of tools that creates value by generating new markets and opportunities
and/or by reducing production and transaction costs” (Chanaron & Grande, 2006, p. 956). Now
management of technology, technological management and technology management are often
used interchangeably in the previous literature (See Chanaron & Jolly, 1999; Chanaron &
Grande, 2006).
Since technology is extremely important to the growth of companies and their business,
the expenditure on research and development (R&D) in industry has been on the rise
(Bowonder, Yadav & Kumar, 2000). For any organization, an accurate evaluation of existing
technologies and a forecast of the impact of emerging technologies could create a competitive
advantage that might allow them to be more successful in the market in which they compete.
Therefore, for any company, the role of technology management is to optimize the output of
R&D activities, resulting in strategic wins and profit gains (Ernst, 2003).
2.8.2 The Definition of Technology Management
There are many definitions of technology management in the literature. Phaal, Farrukh
and Probert (2004) quoted the following definition proposed by the European Institute of
Technology and Innovation Management (EITIM):
“Technology management addresses the effective identification, selection, acquisition,
development, exploitation and protection of technologies (product, process and
infrastructural) needed to achieve, maintain [and grow] a market position and business
103
performance in accordance with the company’s objectives.” (EITIM, http://www-
eitm.eng.cam.ac.uk/)
As an interdisciplinary field, technology management, with main interests in science,
technology and innovation matters, was redefined by Chanaron and Grange in 2006 as follows:
“Technological management (technology management) can be defined as a managerial
approach based on optimizing the permeability and plasticity of the productive and
entrepreneurial system with respect to technological dynamics. In reactive mode, it is
structured around the flexible appropriation of technological evolutions. In proactive mode, it
contributes to the emergence of alternative forms of technical progress.”(p. 959)
To treat technology management as a strategy for any product or service, the two
criteria which need to be met are the demand pull and the technology push (Chanaron &
Grange, 2006). The demand pull refers to meeting “the needs or the demand for new products
and services”, and the technology push emphasizes “the scientific and technical creation of
new applications” (p. 959).
2.8.3 The Development of Technology Management
As early as 1999, Chanaron and Jolly discussed the difference between R&D
management, management of technology (MOT) and technology management. The
management of technology (MOT) started in the mid-1980s from the concept of research and
development (R&D) management, and the concentration was on the management of
technological portfolios from a technical perspective with very limited focus on the impact of
technology associated with management issues (Chanaron & Jolly, 1999; Chanaron & Grande,
2006). The goal of MOT was to use management methods to achieve the organization’s
objectives by linking science, engineering, and management disciplines together (Khalil,

104
1998). Moreover, Khalil, & Bayraktar (1990) indicated that the faster pace and wider range of
innovations in technology, as well as increased budget and personnel for R&D, all accounted
for the rapid development in MOT. However, the influence brought by technologies and
innovations in management related disciplines were overlooked (Chanaron & Jolly, 1999). It
was not until the 1990s, when management science scholar advocates, such as Badawy (1998),
Dankbaar (1993), Khalil, & Bayraktar (1990); Khalil (1998), and Mason et al. (1996), started
placing more emphasis on management disciplines within the field of MOT. MOT began to
value the collaborations between different sectors of a company, such as R&D, manufacturing,
and business. Therefore, the importance of integrating technology strategy with business
strategy gained attention (Badawy, 1998). Later MOT expanded into technology management,
with the goal of assessing the technological impact on all sorts of management functions within
an organization, including business strategy, marketing, accounting and finance,
organizational behavior, and even social issues. In other words, technology management aims
to view technology from “an integrated management perspective” (Chanaron & Jolly, 1999).
Chanaron and Grande (2006) summarized the development of MOT and technology
management in three phases. The first phase started from 1982 and lasted until 1992, with the
focus of management on optimization, which was to “deliver to the right place, at the right
price and respect an agreed deadline”, and technology management aimed to select and manage
choice. The second phase was from 1992 to 2002, and the focus of management switched to
“re-engineering” and efficiency. Thus, control over core competencies and outsourcing
provided a solution to technology management, whose major problem at that time was to
deploy and integrate information systems. The third phase started in 2002 and was anticipated
to end in 2012. Lean management became the focus of management, which corresponded with

105
technology management’s goal of shortening life cycles by increasing the rate and capacity to
innovate, and can be achieved by flexibility, adaptability, and agility of an organization
(Chanaron & Grande, 2006).
Overall, the involvement regarding management disciplines within the field of
technology management has gained more attention throughout the years.
2.8.4 The Characteristics and Issues Associated with Technology Management
One essential feature of technology management is the evolving nature regarding the
subject itself (Badawy, 1998), which enables the changes throughout the evolution of the
technology. The changes related to technology have brought new products, new applications,
new services, etc., and it links the management of technology and management of innovation
together. Hence, innovation was not only the cause for widespread MOT research in the 1980s,
but also the result of effective technology management. Innovation has been defined from
different perspectives in different industries. To define innovation, Damanpour and
Gopalakrishnan (2001) stated that, either non-discrete innovative ideas, concepts, and services,
or discrete innovative products and outcomes, all share one trait in common: the “newness”.
Another trait which controls the success of innovations is the “time-to-market” element, as the
speed for innovation has increased for both companies and nations (Chanaron & Grange,
2006). A third important trait is the capacity for technological innovations because it
determines the competitiveness of companies and nations, though industries, academic
organizations, and government organizations have rarely incorporated it into strategy
(Chanaron & Grange, 2006). Effective technology management can track and manage the
current innovations, and it can also predict the emerging and disruptive technologies in the

106
future. Nonetheless, there are some issues preventing the performance of technology
management.
Chanaron and Jolly (1999) emphasized a few points associated with technology
management:
1. The goal of technology management is to understand the impact of
technological variables on business and management disciplines, which might
not necessarily involve resource allocation. Technology engages all disciplines,
and it should “not (be) restricted to the field of technical functions”. For
instance, when releasing a new product to the market, the R&D department in
an organization has to work together with design, accounting, finance,
marketing, and information technology (IT) personnel to ensure the success in
launching the new product.
2. No matter whether the company deals with more advanced or less advanced
technology, technology management is needed where the diffusion of
technology or innovation happens.
3. Academic and R&D personnel, business managers and other people involved
in the process need to be aware of the evolution in both management and
technology, and become educated in both in order to integrate technological
changes when making decisions at strategic and operational levels (Chanaron
& Jolly, 1999).
In addition, two other main issues related to technology management were presented
in Chanaron and Grange’s research (2006). One is the measurement of organizational
performance, mainly the tools and procedures used for the innovation process. The other one
107
is the anticipation of future market trends, including technologies, prices and profits of
products or services, as well as players in the market (Chanaron & Grange, 2006).
Furthermore, the effectiveness of technology management largely depends on the
quality of data collected from the development of current technologies and the prediction of
future technologies (Tschirky, 1994; Iansiti, 2000). The complexity of weeding through data
to discover information regarding technology development impedes the quality of technology
management (Lichtenthaler, 2003).
2.9 Data Types and Sources
As mentioned earlier, the quality of data collected is the key to the success of
technology management activities as well as R&D projects. Data is typically categorized as
either quantitative or qualitative. Simply put, quantitative data is made up of numbers while
qualitative data refers to data displayed in textual content. Hox and Boeije (2005) define
quantitative data as “data that can be described numerically in terms of objects, variables, and
their values”, and qualitative data as “data involving understandings of the complexity, detail,
and context of the research subject, often consisting of texts, such as interview transcripts and
field notes, or audiovisual material” (p. 593). They also summarize the purposes of using data
into five groups:
(1) the description of contemporary and historical attributes, (2) comparative research
or replication of the original research, (3) reanalysis (asking new questions of the data
that were not originally addressed), (4) research design and methodological
advancement, and (5) teaching and learning. (Hox & Boeije, 2005, p. 593)
There are two types of data used in research. Primary data is data originally obtained
by the current researchers and “collected for a specific research goal” (e.g. data collected

108
directly from experiments, quasi-experiments, surveys, interviews, observations, and focus
groups). Secondary data is not created or collected by the current researchers, but reused by
the current researchers for a different research study (e.g. news articles, online reviews, patents
and other publications) (Hox & Boeije, 2005, p. 593).
Hox and Boeije (2005) point out that primary data collection has advantages in the
areas of theoretical construct, customized research design, and tailored data collection strategy,
all of which are to address the specific research question in a cohesive manner. The drawbacks
of primary data collection are the potential high cost and longer time needed to collect the data.
Compared to primary data, secondary data is usually less time consuming and less expensive
to obtain, and may have a larger volume. However it has disadvantages too. Since secondary
data was collected for a different purpose, it might not serve the current research purpose
completely. Interpreting qualitative secondary data with missing or implicit information on the
informants and the contexts might be difficult (Hox & Boeije, 2005). Moreover, due to the lack
of access to the original sources, there may be problems in verifying the accuracy of the data,
and there may be bias in the data. To utilize secondary data for a research study, the following
issues have to be resolved: the reliability of the data sources, the retrievability of the data, and
the evaluation on the methodical quality of the data (Hox & Boeije, 2005). Whether to obtain
primary data or secondary data depends on the scenario and the goals of the research.
2.10 Text Mining
Data mining is a research method developed to cope with information overflow, and to
uncover novel, insightful and actionable information within a substantial amount of digital
data. It is used in many fields due to the accessibility, abundance and availability of data. Text
mining is one part of data mining. It deals only with textual data.

109
Due to the rapid growth of information, text mining has been adopted as an effective
data mining technique used to process and analyze textual data to help researchers deal with
information overload, to extract meaningful, useful, and actionable pieces of textual
information and knowledge, to monitor the development related to technological innovations,
and to reveal the patterns or trends “hidden” in textual documents, including research literature,
patents, and business trade journals (Daim, Rueda, Martin, & Gerdsri, 2006; Miner, 2012; Wu
et al., 2011). Text mining is also known as “text analytics”, “text data mining”, “textual
analysis”, and “text analysis” (Cohen & Hersh, 2005; Frey, Botan & Kreps, 1999; Kostoff et
al., 2001; Wu et al., 2011). Therefore, with the increasing amount of accessible digital textual
information, text mining has been widely used in biomedical research and other high
technology research areas (nanotechnology, new energy, etc.).
Often the goal of text mining within those research areas is to enable researchers to
identify and extract useful information on certain topics from a large collection of text
documents retrieved from databases more efficiently, to discover and map out relationships
covered underneath the huge amount of accessible information, to process large amounts of
information (using computer software) at a faster pace, and to present and visualize the results
using algorithmic, statistical and data management methods (Porter & Cunningham, 2005).
Text mining is being developed from a variety of research areas, including information
retrieval and extraction, bibliometric analysis, natural language processing, and content
analysis.
2.10.1 Information Retrieval and Extraction
Hearst (1999) proposed the most commonly used definition of text mining, a process
“about discovering previously unknown information that is implicit in the text but not
110
immediately obvious”, from which information retrieval was excluded (Miner, 2012, p.4).
Cohen and Hersh (2005) did not include information retrieval as part of text mining in the
biomedical field either. However, Miner (2012) suggested information retrieval should be
treated as part of text mining, as it is one of the two processes used to obtain information from
a collection of documents.
According to Miner (2012), the two processes to obtain information are information
retrieval and information extraction. They are similar but different from each other.
Information retrieval utilizes a set of key words to form a logical query to look for a set of
relevant documents, which is an early step in text mining (Miner, 2012). Information retrieval
is rooted in designing a system to reduce the ambiguity of language use, and lexical, syntactic
and semantic analysis are the main methods to achieve that. The other process, information
extraction, involves information being extracted from specific documents and the related data
being analyzed (Miner, 2012). Both of the two processes need information summarization to
either reduce the body of text or arrange the documents logically, such as in indexes, abstracts,
and groupings of documents (Miner, 2012).
2.10.2 Bibliometric Analysis
Bibliometric methods are derived from library science, mainly to conduct statistical
analysis of publication records associated with authors, countries, research institutes, journals,
subject categories, and research topics (Ding et al. 2001; Keiser & Utzinger 2005; Xie et al.,
2008; Zitt & Bassecoulard 1994), including keyword frequency/occurrence analysis, citation
analysis, and co-word analysis. It has become a popular way to do text mining by utilizing
bibliometric information, such as source title, author supplied keywords, keywords plus, and
abstracts (Arrue & Lopez, 1991; Qin, 2000; Li et al., 2009). Nonetheless, some research has

111
suggested that a new way to evaluate the research trends is to study the download frequencies.
Text mining evolved from bibliometrics, and a lot of bibliometric methods are used for text
mining.
2.10.3 Natural Language Processing
The difference between text mining and natural language processing (NLP) is the
scope. NLP attempts to understand the meaning of text as a whole, while text mining and
knowledge extraction focus on solving a specific problem (e.g. a technical problem in a specific
research area). In past research, some NLP methods and techniques (e.g. latent semantic
analysis) have been used in the text mining process to facilitate problem solving. Such NLP
techniques can be applied when selecting articles most likely to contain information of interest
from databases using text (Hersh et al., 2004; Yeh, 2003; Cohen & Hersh, 2005). NLP
facilitates text mining to “uncover patterns and provide predictive information, based on a
more sophisticated understanding of language” (Yu, Jannasch-Pennell, & DiGangi, 2011, p.
735).
2.10.4 Content Analysis
Regarded as one major approach of textual analysis (Frey, Botan & Kreps, 2000),
content analysis has been widely used to analyze and understand deeper and holistic
information from a large amount of readily available textual data, ranging from traditional
printed texts to digital texts online. So it can be performed manually or using computer
software. From the late 1950s, the application of computer languages used in subjects like
psychology and social sciences stimulated the development of the use of computer and
computer languages for literal data processing (Krippendorf, 2012). Digital tools and

112
techniques (such as NVivo developed by QSR International) enable content analysis to process
texts faster and more accurately.
Titscher et al. (2000) considered content analysis to be "the longest established method
of text analysis among the set of empirical methods of social investigation" (p.55). In the field
of communication related studies, content analysis can employ different forms of texts,
including written texts, referring to books, magazines, and newspapers; oral texts, for example
speeches, vocal performances; iconic texts, such as paintings, drawings, pictures, icons; audio-
visual texts, for example television programs, videos, and movies; and hypertexts, presenting
text on the Internet and the text can be any combination of the types of texts mentioned above.
Content analysis relies on a wide variety of research approaches and techniques to process the
qualitative data, including both texts and artifacts (non-linguistic documents).
Generally there is quantitative content analysis and qualitative content analysis (Frey,
Botan & Kreps, 2000). Usually most content analysis utilizes quantitative techniques, and this
is also known as classical content analysis. Berelson (1952) defined content analysis as "a
research technique for the objective, systematic, and quantitative description of the manifest
content of communication" (p.18). From the late 1960s, content analysis focused more on
“inference”, “objectivity”, and “systematization”, and somehow moved away from
“quantification” (Franzosi, 2004). Holsti (1969) defined content analysis as “any technique for
making inferences by objectively and systematically identifying specified characteristics of
messages. … Our definition does not include any reference to quantification.” (p.14)
Krippendorf (2012) described content analysis as “a research technique for making replicable
and valid inferences from data to their context”. Other researchers view content analysis as a

113
systematic coding process to perform text analysis by transforming raw qualitative data into
standardized quantifiable data (Babbie, 2001; Ryan & Bernard, 2000).
The analysis starts with identifying units of words and phrases to be coded. Then the
units are broken down and classified into categories, clusters, or “a unit-by-variable matrix”.
This is followed by coding, and ends with testing the hypotheses by examining the matrix or
the relationships between categories and clusters quantitatively (Frey, Botan & Kreps, 2000;
Ryan & Bernard, 2000, p.785). Frey, Botan and Kreps (2000) suggested using nominal
measurement procedures to produce the content categories, and classify the units into
categories by coding. The matrix is constructed after applying codes which have been
discovered and described earlier, to transform qualitative data to standardized data
(Kohlbacher, 2006; Ryan & Bernard, 2000).
Since content analysis has long been regarded as a quantitatively dominated research
approach (Lasswell, 1948; Berelson, 1952), the qualitative aspect did not gain much attention
until the 1970s and 1980s. The objective of content analysis is to turn qualitative data into
quantitative data to allow the researcher to analyze the data statistically or using numerical
description and characterize the contents in a reliable and valid way. However, researchers
realized that the latent contents embedded in texts could provide different interpretations, and
the contents meant more than just counting and measuring the occurrences of text
quantitatively (Frey, Botan & Kreps, 2000; Kracauer, 1952; Mayring, 2000; Titscher et al.,
2000). Overall, content analysis is about the semantics of the text, not about the form in which
the meaning is being presented. The quantitative approach of content analysis may cause
distortion in the quality of the text and affect the reconstruction of the contents. On the other
hand, qualitative content analysis can help prevent those issues. Thus more research has been

114
conducted using qualitative content analysis since then (e.g. Altheide, 1996; Mostyn, 1985).
Qualitative content analysis has become the most commonly used research method in doing
qualitative analysis on texts/documents, which is a process of "a searching-out of underlying
themes in the materials being analyzed" (Bryman, 2004, p.392). Mayring (2000) proposed a
systematic, rule-based text interpretation for the qualitative content analysis, which could be
adapted based on the subject of analysis and its context, and it also could maintain the
advantages of quantitative content analysis (Mayring, 2000).
Text mining is similar to content analysis in a lot of aspects. For example, text mining
is qualitative by nature (Janasik, Honkela, & Bruun, 2009; Lin et al., 2009), and it also has
been used quantitatively in the past (Cohen & Hersh, 2005; Kostoff & DeMarco, 2001; Kostoff
et al., 2006; Singh, Hu, & Roehl, 2007). Moreover, they resemble the same criteria when
solving research questions: reliability and validity (Krippendorff, 2012).
2.10.5 The Process of Text Mining
As a relatively less organized and unstandardized analytical technique for knowledge
discovery, text mining is still being developed based on “trial-and-error experiments based on
personal experiences and preferences” (Miner, 2012, p. 73). Based on previous studies, several
steps are involved in text mining.
2.10.5.1 Raw Document/Data Collection
Typically, text mining starts with collecting raw documents. For instance, to obtain a
collection of raw documents on a topic of interest for science and technology literature based
text mining, a query approach is used to retrieve publications on the topic from a bibliographic
database using keywords associated with core research on the topic. Most of the time, the
information retrieval process aims to collect the “problem-specific” documents either manually

115
or using automated techniques such as a web crawler (e.g. collects relevant news excerpts from
multiple websites periodically) or a scripting language (Miner, 2012). The collection of the
raw documents could be unstructured, structured, or semi-structured, and it is usually called
corpus. Both the quality and quantity of the data collected will affect the entire text mining
process. All the documents are collected or transformed in a compatible format (mostly txt
files) that the text mining software can process.
2.10.5.2 Preprocessing Collected Documents
During this process, all the unstructured and semi-structured data will be converted to
structured data, and all the structured data are stored in a “term-document matrix” (TDM)
(Miner, 2012). TDM is constructed using rows and columns, which corresponds with
documents and terms. Each cell in TDM is the intersectional area where each row and column
meets, and it is called index, which indicates and measures the relationship between them (e.g.
recording the frequency of a term occurs in a particular document). According to Miner (2012),
the preprocessing step involves information extraction related techniques, such as text
categorization and term extraction, so the irrelevant records can be eliminated.
2.10.5.3 Information Extraction
TDM, coupled with structured data from the data collection, can be used to extract
patterns to solve specific problems. Four types of information extraction methods are
commonly used in text mining, including prediction (such as time-series analysis and
classification), clustering, association rule based analysis, and trend analysis (Miner, 2012).
Classification is the most commonly used knowledge discovery technique in analyzing
large data sets, and it is called text categorization in the area of text mining (Miner, 2012).
Classification assigns the records into a predetermined set of categories or target attributes.

116
More specifically, each record is supposed to have a category or target attribute and a set of
attributes (variables that determines which category/target attribute the record belongs to), and
it matches the category or target attribute of each record based on the set of attributes via a
target function. Classification can be used in descriptive models and predictive models (Tan,
Steinbach, & Kumar, 2006). In descriptive models, classification is used to distinguish between
records and summarize them based on different categories (Tan, Steinbach, & Kumar, 2006).
On the other hand, classification is to predict which category or target attribute the unknown
records belong to, based on a classification model built on the descriptive attributes of the
known records (Tan, Steinbach, & Kumar, 2006). So, the goal of text categorization is to be
able to assign the correct concept for each document.
Clustering is to group the objects and events into clusters in an unsupervised manner.
An unsupervised manner means there is no prior knowledge or pattern that can guide the
clustering process. So the documents are grouped by similarity because relevant documents
always have something in common or similar with one another within a huge collection of
documents. Moreover, clustering can enhance search effectiveness due to the similarity in the
content of the documents (Feldman & Sanger, 2007). Compared to clustering, text
categorization is a supervised process, since a model is derived upon the descriptive features
of the categories using pre-categorized training data, and then used to classify an unknown
document.
Association analysis is often used to reveal relationships among different concepts
within large data sets, and association rules are used to represent such relationships among
concepts. Hence, association rules are used to recognize and pinpoint the frequent sets or pairs
of “objects” that frequently appear together in a specific scenario. It has been used frequently

117
in marketing analysis. A basic association rule is X → Y, indicating that X and Y are a set of
frequent items, therefore there is a strong relationship between X and Y (Tan, Steinbach, &
Kumar, 2006). Support and confidence can measure the strength of the association. Support is
the number or percentage of documents that include all the items in X and Y. In other words,
it measures the frequency that a rule can be applied to a data set (Tan, Steinbach, & Kumar,
2006). Confidence measures how often the rule is true, so it represents, within the dataset of X
items, the proportion that also includes Y (Tan, Steinbach, & Kumar, 2006).
Trend analysis is a special case of association analysis, and the data elements are in an
order or being spread over a certain period of time. Therefore, when doing trend analysis, it is
key to identify the time-dependent changes for an object or event. For example, within one
research field, trend analysis can determine how the research areas or focuses have changed
over time by comparing two data collections from the same database or journal but covering
different time spans.
2.10.5.4 Descriptive and Advanced Text Analysis
Descriptive analysis refers to basic analysis on extracted terms, such as keywords,
authors, organization, and research areas. After identifying key terms and performing
descriptive analysis, other data mining techniques can be used to analyze extracted entities and
their relationships. Advanced text mining analysis can provide a much deeper understanding
of the document collection than just utilizing classic search queries (Feldman et al., 2008). In
addition, the text mining process includes storage of intermediate document representations,
techniques for analysis of these representations and visualization of the results (Feldman et al.,
2008).

118
There is a broad range of research using text mining as an approach or a tool, and it is
especially popular in the area of consumer studies, where it is used to identify consumer
preferences by mining unstructured customer feedback and reviews. In addition, text mining
has been used in technology management to help organizations and researchers make better
decisions by extracting information from structured documents, such as patents, S&T
publications, conferences proceedings, and business reports.
2.11 Tech Mining
Tech mining is a term first used by Allan Porter, and it applies to text mining of
publications within high technology areas. More specifically, tech mining strives to inform
science, technology and innovation (ST&I) management by applying text mining within
science and technology related information (Porter, 2007). Tech mining specializes in
“exploiting this information to see patterns, detect associations, and foresee opportunities”,
which can benefit an organization in all respects (Porter & Cunningham, 2005, p. 18). Tech
mining is based on technical information sources, and its purpose is to enhance S&T
management by concentrating on changing technologies. Porter (2007) suggested managing
R&D by employing expertise with empirical knowledge from tech mining, where the empirical
knowledge is a mix of numerical and text. Tech mining can be used for a lot of kinds of
technology analyses (including technology monitoring, competitive technological intelligence,
technology forecasting, technology roadmapping, technology assessment, technology
foresight, technology process management, and science and technology indicators), and it can
result in both qualitative and quantitative findings (Porter & Cunningham, 2005).

119
2.11.1 Three Phases of Text Mining
Tech mining has three decision phases: intelligence, analysis and design, and choice
(Porter & Cunningham, 2005). During the intelligence phase, the technology management
issues are identified, and the data collection is being planned, and the data is collected and
reviewed. Tech mining can be applied to the 13 technology management issues and 39
technology management questions suggested by Porter and Cunningham (2005), and they
proposed analysis measures and innovation indicators for each question in the tech mining
process. After identifying the technology management questions and finishing the data
collection plan, the data is retrieved, reviewed, and refined. In the analysis and design phase,
useful information will be extracted from the data collection and analyzed using statistical
methods. One common analysis method is to find a pattern over time in the form of regression
analysis. The results of tech mining can be presented as lists, mapped relationships and trend
curves. The choice phase is where the forecaster selects and decides what information to
present in the forecast and then interprets the forecast results (Porter & Cunningham, 2005). In
addition, tech mining adopts expert opinion techniques in the final forecast (Porter &
Cunningham, 2005).
2.11.2 VantagePoint
VantagePoint software was developed by a group of researchers at Georgia Tech, in
collaboration with Search Technology, Inc., with major support from the US Army Tank-
automotive and Armaments Command (TACOM) and the Defense Advanced Research
Projects Agency (DARPA) in the 1990s. The software became commercially available in the
2000s (www.theVantagePoint.com). The software is based on technology opportunities
analysis (TOA) at Georgia Tech. It extracts information of particular technological innovations

120
from abstracts within a collection of search queries on a given topic in various publication,
patent, citation, and/or project databases.
2.12 Patents and Patent Analysis
Due to more complicated innovation processes, shorter innovation cycles and higher
market demand, the use of patent analysis has received more attention in high-technology
industries (Yoon & Park, 2004). Patent information has been used to solve specific R&D
problems in the past (Rivette & Kline, 1999), and to reduce R&D time and costs by 60% and
40% on average according to a report from World Intellectual Property Organization. Patents
are more than knowledge protection and knowledge creation, and patent information can also
be used as a strategy to plan R&D and to make decision on R&D by offering insights for
managers (Baglieri & Cesaroni, 2013; Ernst, 2003; Lee et al., 2009a, 2009b). As a combination
of text mining and bibliometrics, patent analysis is being adopted as a computerized analytic
tool to “satisfy the need for conceptual or qualitative analyses of technological change and
empirically explains most aspects of technological innovation” (Lee et al., 2011, p.692).
2.12.1 Definition of Patents and Role of Patents in Technology Management
According to Title 35 of the U.S. Code, Section 154 (35 USC 154), a patent is defined
as:
“…a grant to the patentee…of the right to exclude others from making, using, offering for sale,
or selling the invention throughout the United States…for a term beginning on the date on
which the patent issues and ending 20 years from the date on which the application was
filed…”
A patent could be either a technical publication or a legal document of intellectual
property (Gordon et al., 2012; Grupp & Schmoch, 1999). According to a report published by

121
USPTO in 1977, “about 8 out of 10 U.S. patents contain technology not disclosed in the non-
patent literature” (p. 37). Gordon et al. (2012) also mentioned the pros and cons of a patent
from different standpoints, as “it can be a valuable asset to the owner or a nuisance to a
competitor. It can be a business property that might be used either offensively or defensively”.
Although the main purpose of a patent is that it “protects the inventing firm from other
firms’ appropriation of that technology” (Grupp & Schmoch, 1999), patents maintain different
internal and external functions in technology management (Ernst, 2003). Within an
organization, patents can support decision making regarding R&D investment, be used to
manage human resources in R&D and knowledge, and protect products, processes and services
from being copied by others. Externally, patents can be used to identify and assess external
technology creation for merger and acquisition or alliance purposes. So they are used for cross-
licensing, patent sales, market partnership and other activities to optimize the patent portfolio
for an organization.
The objective of technology management is to optimize the output of R&D to fulfill a
firm’s strategic and commercial goals (Ernst, 2003). Patents not only protect any unauthorized
use or practice of a technological innovation, but also cover information for technology
management (Ernst, 2003). In other words, the information from patents can provide evidence
to help create a competitive advantage in the market or to identify a trend to promote
technological innovation, and of course assist decision making for R&D activities.
Similarly, Porter and Cunningham (2005) described that patent analysis can be used in
different occasions, from R&D management, technological intelligence, identifiable of
desirable IP, mergers and acquisitions, competitor intelligence, international market analyses
and human resources management (Porter & Cunningham, 2005).

122
Therefore, patent information can be used as a strategy to identify business
opportunities and to make business plans. It is also of great use from a technical point of view
as it presents the latest advance in technology.
2.12.2 Global Patent Activity and Development
According to WIPO (2014), after passing two million in 2011, the global patent
applications has grown to around 2.57 million in 2013, which increased 9% from 2012. In
2013, the top five offices with the most patent applications occupy 81% of the total patent
application worldwide, and they are (listed in descending order): State Intellectual Property
Office of the People’s Republic of China (SIPO), the United States Patent and Trademark
Office (USPTO), the Japan Patent Office (JPO), the Korean Intellectual Property Organization
(KIPO), and the European Patent Office (EPO). SIPO maintains the biggest growth in terms
of patent application volume compared to the other offices, and the gap between SIPO and
other patent offices has widened quite a bit since 2011. Compared to 2012, China (26.4%) and
Australia (12.7%) has the fastest growth in patent applications. The amount of patents in force
increased from 8.72 million in 2012 to 9.45 million in 2013 worldwide, and the USPTO held
the most patents in force (around 2.39 million), which was 26% of the total number of patents
in force. The top five fast growing fields in filing patents are: computer technology; electrical
machinery, apparatus, energy; measurement; digital communication; and medical technology,
all of which makes up 28% of the total patent applications.
U.S. patent applications have grown from 100,000 in 1980 to 571,672 in 2013 (WIPO,
2014). However, the growth in patent applications has not been linear over the years. Before
1984, there was an average growth rate of 0.3%, and after 1984, the growth rate was 6.9%. A
past study indicated that the patent growth trend is similar to s-shaped growth because of

123
limited patents issued at the beginning of a technology, followed by an increase in the number
of patents filed and issued related to that technology until reaching the maturity stage and then
declining (Daim et al., 2006).
Moreover, for European and Japanese patent offices, there were also increasing trends
in patent filing. EPO (EPO, 2015) reported that the amount of patent applications at their office
went up to 274,174 in 2014. The Japanese Patent Office received 350,000 applications in 2010,
up from 191,000 applications in 1980, with a peak of 440,000 in 2001 (WIPO 2014).
According to WIPO (2014), patents are territorial rights, which means patents can only
offer protection in the region or country where they are filed and granted. For example,
Kimberly-Clark’s ion triggered airlaid nonwoven is the most advanced technology used in the
market of flushable toilet wipes. However, the patent is only filed as a U.S. patent. Since it
costs much more to import nonwoven goods than producing them locally, Kimberly-Clark has
to purchase an alternative dispersible nonwoven material from another company for
manufacturing flushable toilet wipes in Europe (Mango, 2012).
A patent has a lifecycle as well, from application, to application published, to being
granted, and finally to expiration (Bonino et al., 2010). Compared to the past, it takes much
longer and is more expensive to obtain a patent nowadays. For example, in the U.S., the
estimated waiting period for a newly filed patent to receive a first office action is about 26.9
months. The U.S. Patent and Trademark Office (USPTO) had about 1.2 million patent
applications pending in the office by the end of 2011, and just under 700,000 patent
applications were in the process of receiving a first office action. The most recent change in
U.S. patent law was the adoption of the “first to file” patent application system (which is what
the rest of the world uses) instead of using “first to invent”. While “first-to-invent” places more

124
emphasis on the identification of the original inventor, “first to file” means that, no matter who
the inventor was or when the actual invention took place, the right to receive a patent for a
given invention belongs to the first person to file a patent application for that invention.
However, this might be unfair for small and medium size businesses since big companies have
the budget and the resources to file for patent applications at a faster pace.
2.12.3 Patent Classification
Patent database classifications are used to group patents related to similar inventions
together under one class, where one patent can be grouped under several classes in terms of
application areas. Various classification codes are used in different databases. The US Patent
Classification (USPC) and International Patent Classification (IPC) are commonly used. These
confusing and arbitrary patent classification codes have caused many problems related to
patent searches. Consequently, the European Patent Office (EPO) and the United States Patent
and Trademark Office (USPTO) launched a new patent classification system in January 2013.
The new Cooperative Patent Classification (CPC) is “the result of the efforts of the EPO and
the USPTO to develop a common classification system that will be used by the two offices in
the patent procedure” to solve problems brought by the inconsistency and confusion among
different classification code systems (EPO, 2013). The new CPC codes feature specific tags in
the new Y-class as an index to indicate a focus on emerging technologies (Scheu et al. 2006;
Veefkind et al. 2012).
Moreover, as mentioned earlier, depending on where the patent application is being
filed, the search should be conducted within a patent database based on the location. If the
patent is filed in U.S., the U.S. Patent and Trademark Office (USPTO) is the best source. If the
patent is filed in Europe, then the European Patent Office databases should be searched. In
125
addition, the Derwent World Patents Index (WPI) is a database covering international
patenting. Patentscope, TotalPatent, and Google patent search are several popular patent search
engines that can also be used for patent search covering databases including WIPO, USPTO,
and EPO.
2.12.4 Patent Information Categories
The way data is collected and organized results in structured data and unstructured data.
Miner (2012) described unstructured data as “raw textual data with no inherent structure”, and
he used “a Word document rather than a tabular Excel document” as an analogy. Other
examples of structured data are patents databases and S&T databases, since all the publications
within those databases share a similar structure. Unstructured data could come from an online
forum, blogs or any text content from the internet (Porter & Cunningham, 2005).
However within a patent document, there is structured information as well as
unstructured information. Structured patent information presents the same format and
semantics across the document, such as patent number, filing date, citations, and assignees
(Tseng et al., 2007). Unstructured patent information includes abstract, claims, and description
of the invention, and these do not have a uniform format or content (Tseng et al., 2007). Tseng
et al. (2007) also point out the difference between patent graphs and patent maps. (though both
of them are sometimes called patent maps). Patent graphs are the visualization of patent
analysis from structured patent information, while patent maps are the visualization results
from unstructured patent information (Tseng et al., 2007).
Another way to categorize the information within patents is to separate it into
bibliographic and numeric data. Bibliographic data refers to such information as personal data,
and technical data, and numeric data includes date data, number data and amount data.

126
Analyzing patent information yields both qualitative and quantitative results. The relationship
between the qualitative and quantitative results can be analyzed, and the following figure
(Figure 2-26) demonstrates the relationship (Liu & Yang, 2008).
Figure 2-25. Diagram of processing and analysis of patent information (Liu & Yang, 2008)
2.12.5 Patent Analysis
Depending on the user of patent information, patent search, analysis and monitoring
are the three main types of patent analysis activities (Bonino et al., 2010). To conduct a patent
analysis effectively, business, legal and science-based technological knowledge aspects all
have to be taken into consideration. Patent monitoring covers intelligence activities both for
competitors’ R&D direction and the overall technological landscape (Bonino et al., 2010). For
the purpose of our study, patent search and analysis are the two activities most needed.

127
2.12.5.1 Types of Patent Search
Patent analysis starts from patent search. Patent search is a long and repetitive process.
It starts from identifying search features, coming up with search keywords, selecting
classification areas, and developing initial search queries. Before the digital age, the original
patent search was a patent classification search, as the classification and indexing system was
the only guide for searching for patents. It was labor intensive and time consuming, and the
patents misclassified could not be identified and included. The current digital patent search
process is much faster and can yield more complete search results.
Not only do patent lawyers care about patents due to legal matters, other people also
search for and study patents for different purposes. These people include R&D managers,
academic researchers, and policy makers. There are five types of patent searches according to
Hunt, Nguyen, and Rodgers (2007), including patentability search, validity search,
infringement search, clearance search, and state-of-the-art search. Akers and Khorsandian
(2003) categorize patent search into the following four groups: state of the art; patentability;
freedom to operate; and validity. The following Table 2-7 described other similar patent search
categories listed from a previous study. “Technology survey” and “portfolio survey” serve the
same purpose as the “state-of-the-art” search (Bonino et al., 2010). The aforementioned three
categorizations on patent search are quite similar, and they are all based upon the intended use
of patents. Nonetheless, Porter and Cunningham (2005) point out that patents and Science and
Technology (S&T) publications belong to two different stages in technology development, as
R&D publications often precede patents and have different focuses. R&D publications are
more academic and fundamental research oriented, while patents are more industry and applied

128
research oriented. The patent search for our study is state-of-the-art search, since the goal is to
get a complete overview of the current state of the technology and its related applications.
Table 2-7 Patent search tasks (Bonino et al., 2010).
2.12.5.2 Patent Analysis and its Basic Techniques
Unlike patent search, mostly done for legal purposes (patentability, validity, clearance,
and infringement), patent analysis is to make an assessment focusing on the technology from
a business or R&D perspective using the same data source and even the same technique as
patent search (Hunt et al., 2007). Patent analysis is commonly used by various personnel,
including R&D managers, academic researchers, and policy makers. In general, patent analysis
can result in indicators to measure the relationship between technology development and
economic growth from a macro point of view (Grandstrand, 1999), compare technological
innovations or changes globally, and forecast technological knowledge flows and how the
technological knowledge could influence productivity (Martino, 1993). Moreover, patent
analysis can help guide distributing R&D investment, make technology plans, and compare
the competitiveness among firms (Breitzman & Mogee, 2002).

129
There are various techniques in doing patent analysis. Patent analyses started with using
bibliometric analysis, data mining techniques, or database management tools (e.g. On-Line
Analytical Processing modules) to process structured data, such as dates, classification codes,
and assignees (Tseng et al., 2007). Bibliometrics can be used to determine the stage in the life
cycle of a technological change (Martino, 2003), and mostly provide a numerical value to
measure texts and information (Daim et al., 2006; Miner, 2012). According to Daim et al.
(2006), bibliometrics is used to “explore, organize and analyze large amounts of historical data
helping researchers to identify ‘hidden patterns’ that may help researchers in the decision
making process” (Daim et al., 2006, p. 983). As a basic approach in patent analysis,
bibliometrics has gone through some change, and citation analysis is based upon the
bibliometric approach. Citation analysis is considered to be the most prevalent technique for
patent analysis (Fattori et al., 2003; Yoon and Park, 2004; Tseng et al., 2007). It counts the
frequency of citing a patent in subsequent patents, and higher citations generally mean the
patent is of higher importance. Patent citation analysis creates indexes based on different
criteria to measure the quality of technical assets and economic value. The same approach can
also be applied to S&T publications. Text mining techniques have been introduced to perform
patent analysis on unstructured data (such as abstracts, claims, descriptions, and other parts of
patents including full texts) in the 2000s (Tseng et al., 2007). Due to the limitation on citation
analysis and structured data, unstructured patent data analysis is complementary with
bibliometric analysis. Tseng et al. (2007) proposed a methodology for full text patent analysis,
see Figure 2-27. Previous research also suggested that the results from patent analysis are more
representative by using only the first 300 words from unstructured data such as abstracts,
claims, and descriptions, instead of full text documents (Fall et al., 2003).

130
Figure 2-26. Procedures of unstructured patent data analysis (Tseng et al., 2007)
2.12.5.3 Patent Analysis Applications
Patent analysis is performed to assist in making strategic decisions involving a single
patent or a patent portfolio. It can be business based, to evaluate a patent or a patent portfolio’s

131
value, or it can be technical based, to investigate technological features or the technical solution
employed.
Patent analysis has long been considered as a useful analytic tool for technology
monitoring and forecasting, as the analysis of patents can aid in the evaluation of the
competitiveness of the company. It uses statistical methods to “convert patent information into
useful knowledge and can be applied at different levels, i.e. country, industry, enterprise, and
technological field” (Wu et al., 2010). Patent analysis can help with the decision making
process, and as a strategy, patent analysis has different applications, from intellectual property
management to company valuation and competitive intelligence. Several typical patent
analysis applications are discussed in the following sections.
a). Intellectual Property Management: Patent Portfolio
Within a company or any organization, there are possibly many patents. However, the
number of patents which have high-impact is typically relatively low. Hence, developing a
patent portfolio and focusing on the high-impact patents is a priority because they can bring
more benefits to the company. Breitzman and Mogee (2002) pointed out that the patent
portfolio is quite important, as it can help identify those high-impact patents after conducting
patent searches within or outside the company and evaluating them by analytical software.
The first step of developing a patent portfolio is to build, list and maintain all the patents
for a company, which involves patent search (Breitzman & Mogee, 2002). Patent search can
be complicated due to changes happening to the company and the assignee. Moreover, the
databases used for searching patents vary among countries. After building up a portfolio with
all the patents related to the company, grouping patents by product, technology or business

132
unit is a good way to organize the portfolio and to identify the strength and weakness of the
company’s business.
Having a patent portfolio makes it much easier to manage a company’s knowledge
assets, identify its core business, distribute its resources, and gain a leading position in the
market.
b). R&D Management and Technology Assessment
Patents can be used to measure a company’s commitment to R&D and technological
innovation, as they are considered indicators of R&D activity. Highly cited patents can reveal
a company’s core technological competence, as citation analysis indicated (Breitzman &
Mogee, 2002).
Co-citation analysis, another co-occurrence technique for patent analysis discussed
earlier, can identify areas of core competencies. Co-citation involves clustering, and if some
clusters are highly inter-related both internally and with other clusters, then those areas are the
core business for a company, and more R&D investment should be put into those areas
(Breitzman & Mogee, 2002).
c). HR Management
Understanding the role of employees and their productivity level can provide a good
opportunity to enhance performance within an organization.
d). Competitive Intelligence
As one of the most common applications of patent analysis, competitive intelligence is
used to monitor the competitors by keeping track of and comparing their patent activities in
order to create a competitive advantage over other players in the market.

133
Patent analysis can serve as an effective tool to assist decision makers in creating
strategic plans for R&D activity and investment distribution, if used appropriately. Starting
from background information regarding patents and different patenting systems, as well as the
role of patents in technology management, this section discussed various types and applications
of patent analysis in intellectual property management and identifying core R&D areas from a
strategic perspective.

134
CHAPTER 3 Research Methodology
In this chapter, the research design is discussed. The data collection procedures used in this
study, including the selection of databases, the search strategy, the composition of search
queries, and the evaluation of the search results, are explained in detail. Moreover, the data
analysis tool, tech mining, is also covered in this section.
3.1 Research Purpose
The purpose of the study is to obtain a summary of the state-of-the-art of nanofibers,
submicron fibers, microfibers, and the associated nonwoven technologies used in the industry,
especially in air filtration products; further to match applications with the selected technology.
The potential application areas and the forecast of the growth involving such technologies are
explored as well.
3.2 Research Objectives
In order to gain more knowledge of the R&D activities in academia and industry
regarding the use of selected technologies within in the nonwovens area, the following research
objectives serve as the guidance for the study:
1. Utilize tech mining to provide a summary of the trends and developments over the past
30 years in the areas of nonwoven technologies, mainly related to the making of micro,
sub-micron, and nanofibers, as well as nonwoven filtration fabric manufacturing by
conducting an analysis of data obtained from searches within multiple
databases/sources, including S&T publications, patents and trade journals.
2. Explore and match the desired requirements of the applications or products with the
most suitable technology.

135
3. Justify where certain nonwoven technologies can replace the current technology in use
to enhance a product by offering better performance.
4. Predict the potential growth of the nonwoven filtration market and reveal potential
future trends of filtration applications.
3.3 Research Design
Whether to use quantitative, qualitative, or an integration of both research methods
depends on the specific research goal and instrumentation. Instead of employing only one
research methodology (quantitative or qualitative), this study is conducted using mixed
methods, in which both quantitative and qualitative research approaches are involved.
Qualitative research methods can reveal deeper, holistic, detailed and psychological responses
via theory building and explanation (Glaser & Strauss, 1967; Mintzberg, 1979; Shah & Corley,
2006). On the other hand, quantitative research often tests theories by setting up a hypothesis,
constructing a measure on the variables of interest, and making generalizations to other
scenarios empirically (Echambadi, Campbell & Agarwal, 2006). Mixed methods have been
proposed to “build and refine theory” and gain an understanding of the “phenomenon of
interest” by utilizing both qualitative methods (building a model) and quantitative methods
(testing the aforementioned model) (Cialdini, 1980; Fine & Elsbach, 2000; Jick, 1979; Shah &
Corley, 2006; Weick, 1979). To be more specific, text mining and questionnaires have
generally been employed as a quantitative approach, while expert opinion has been considered
to be a qualitative research method because it is often conducted using a group panel or
interviews.
Very limited research has been done on the evolution of nonwoven technologies and
matching such technologies with nonwoven filtration manufacturing, and almost none has

136
investigated the concept using text mining, especially tech mining, as the main research
approach. This study will help generate an in-depth understanding of the development of
technologies and the matching applications, and further make a prediction of the future trends
by offering insights on the topic. Findings will ultimately produce useful implications for
researchers, users and manufacturers in the nonwovens industry.
The research questions we proposed in Chapter 1 include:
1. What is the state-of-the-art of nonwoven technologies?
2. What is the state-of-the-art in utilization of nonwovens for air filtration purposes?
3. Can tech mining, (i.e. text mining used for technology management, mostly in high
technology areas), be utilized as an effective tool to facilitate decision making in the area
of nonwoven filtration products?
4. What are the desired attributes and specifications for certain specific applications and why
is certain technology selected for such an application?
5. Other than the existing applications, what are the other potential applications that
nonwoven technologies can be applied to?
6. What is the future of nonwoven technologies and their applications in air filtration?
In this study, tech mining, including patent analysis, is used to identify and determine
the current stage of development of nonwoven technologies, as well as nonwoven air
filtration products, by tracking and mapping out the trends and patterns based on the R&D
activities over the past 30 years. Moreover, the matching between certain technologies and
the desired properties in a nonwoven product is examined to justify the selection of the
technology. In addition, prediction of future evolutionary pathways is provided.
In the current study, several sets of search queries are conducted within different

137
databases to provide input to be used for the stated research goals associated with the
development of air filtration, with a focus on the technology associated with filter media
manufacturing. The study explores a systematic approach coupled with a variety of analyses
through the application of Tech mining.
First, searches based around “air filtration” are conducted in a variety of different
databases, including those that focus on S&T, patents, and trade journals. During this search,
it is apparent that “nanofibers” and “electrospinning (a technique for making nanofibers)”
are terms which are frequently referenced during the “air filtration” search. It is thus
considered worthwhile to conduct a second phase of searches on “nanofibers” and other
emergent technologies used for air filtration media production (hollow fiber, bicomponent
fiber, etc.) within the same data sources. Microfibers and sub-micronfibers are widely used
in nonwoven air filtration products, thus technology terms, such as meltblowing, is included
as well.
“Nanoparticles” is also a nano related term that frequently appears in the air filtration
search results, however this is not included in subsequent searches for two reasons. First,
although nanoparticles can be dispersed in a solution or a polymer melt that is subsequently
processed into a nanofiber, they are heavily associated with the concept of an additive, such
as that used, for example, in a finishing process (dispersed as a coating on the filter media
substrate), which is not a major filter fabric media manufacturing process. The second
reason for the term’s exclusion is that nanoparticles are often referred to fine contaminants
to be captured or removed, and not the filter media.
After the separate searches and analyses on air filtration and micro, sub-micron,
and nanofibers were completed, the two sets of search queries were combined together to

138
facilitate the study of micro, sub-micron, and nanofibers, and other emergent technologies,
on air filtration media. The following Venn diagram illustrates the overlap of the two
research areas.
Figure 3-1. Venn diagram of the search approach
3.3.1 Data Collection
The data collection used in this study is secondary data collection, and it will be mainly
affected by the following factors: the coverage of the topic being selected, the databases
available to the researcher, and the text-mining software used to analyze the data. All of these
factors will have a great influence on the coverage and quality of the search results, as well as
the type and level of details of the information collected for data analysis.
air filtration
hollow fiber
micro, sub-micron, & nanofiberother
emergent techniques
bi/multi-component
fiber
electrospinning
meltblowing
centrifuge spinning
flashspining

139
Although text mining has not been used widely in the nonwovens industry, it has great
potential as an exploratory technique to assist in the decision making process, based on both
qualitative and quantitative findings, by detecting the trends and growth patterns in the
development of the technology and its associated applications.
3.3.1.1 Database Selection
Science and technology (S&T) publications, patents, and trade journals are the primary
and most accessible sources of technology information. To choose a database for data
collection, characteristics of the database should be considered, such as suitable coverage,
comprehensiveness of coverage, biases, content quality, record structure and keyword
availability (Porter & Cunningham, 2005).
Since one objective of the study is to provide an overview of the development of
nonwoven technologies, science and engineering databases are included. The Science Citation
Index (SCI), which is included in Web of Science (WOS), will be studied because it is
associated with fundamental research. The WOS is an external database owned by Thomson
Reuters® covering a broad range of subjects, from hard science, like chemistry, to social
science. Previous research points out that SCI is not the best database for conducting literature
searches in the research areas of chemistry, medicine and engineering, yet it excels in life and
physical science coverage (Youtie, Shapira, & Porter, 2008). However, SCI will be included
in the choice of the databases for this research due to the availability and positive past
experience.
Two other engineering focused databases, Ei Compendex and Inspec are included as
other sources for a broader and more complete literature search, especially in engineering
related areas. Both are part of the Engineering Village, which is an all-encompassing

140
engineering literature and patents database, consisting of 12 databases ranging from Ei
Compendex and Paperchem, to U.S. Patents and E.U. Patents. Engineering Village contains
various sources including news articles, trade journals, S&T journals, conference proceedings,
government reports, patents and other engineering information. Compendex covers the most
complete engineering literature globally. It contains peer reviewed and indexed publications
(3,800+ journals, 117 trade magazines, and 80,000+ conference proceedings), with over 17
million records from 73 countries across 190 engineering disciplines from 1,988 publishers.
Inspec is a bibliographic S&T literature database with almost 15 million abstracts. It indexes
records on physics, electrical engineering, electronics, communications, control engineering,
computing, information technology, manufacturing, production and mechanical engineering.
SCI, Compendex and Inspec are chosen as the target databases on S&T publications
for our study due to the breadth and depth of the science and engineering literature content.
Moreover, they are all free to access from North Carolina State University, and SCI has both
citing and cited references.
The nonwovens industry is driven by the demands and needs from the market side and
the technology side. Because of the huge growth of applied research conducted in the
nonwovens industry, it is extremely important to look for data within patents since these are
regarded as one of the primary data sources of applied research. The Derwent Innovation Index
is a web based database covering patent information worldwide (also owned by Thomson
Reuters®), and it is also freely available via library access from North Carolina State
University. Conducting patent searches using keywords in Derwent provides more complete
search results compared to using solely universally accepted patent classification codes (e.g.

141
IPC), since all the titles and contents have been rewritten so they are easier for the audience to
understand.
Another data source that cannot be ignored in the development of nonwoven
technologies and applications is business related data, such as trade journals, industry
magazines and other business information sources. For retrieving information associated with
trade journals, industry reports, and business news, ABI/Inform Complete is a useful database.
It has a wide collection of companies and business related data globally, such as business and
economics periodicals, country-and industry-focused reports, full-text journals, dissertations,
and working papers. Also the data can be downloaded in text format, which is compatible with
the Tech Mining software.
3.3.1.2 Search Strategy
Search strategy is highly dependent upon three elements: knowledge of the subject
under study, knowledge of the databases of choice, and knowledge of the Science,
Technology and Innovation information that is needed (Santo et al., 2006). The factors
which are critical in a successful search are:
• the identification of the key terms to search;
• search query formulation;
• the selection of the databases to use, and which indexes should be included
for each of the selected databases (covered in 3.3.1.1);
• how search algorithms for the selected databases work, and differences
between algorithms among different databases;
• the time span for the searches.
All of the above eventually contribute to the quality of the data and the results

142
ultimately yielded. It is important to ensure that the searches within a variety of databases
yield as complete coverage as possible, and this carries the accepted penalty of a certain
level of noise.
In order to perform text mining from a collection of raw textual data, information
retrieval via search engines is needed. Although online information searching has become a
prevalent activity in daily life, not all online search results are relevant and useful to the topic
of interest. A search strategy should be aligned with the search purpose and available resources
(Porter & Cunningham, 2005). Therefore, how to search for information of interest online
strategically is extremely important for this study, because specific technical information in
digital format is needed for processing, analyzing, and interpreting to achieve the research
goals. Keyword/term search is the main search approach for science and technology literature
searches (Porter & Cunningham, 2005). The same approach can be applied to the companies
and business data retrieval. Hence, search queries containing keywords/terms will be
formulated to retrieve information from S&T and business databases to ensure the search result
quality in this study. To retrieve complete and accurate patent information for our research,
not only should the search queries contain keywords/terms, but they also should include patent
classification codes to ensure the relevance of the patents. In the present study, the focus is not
on the search algorithms, but on how to come up with an appropriate search strategy to collect
relevant information to solve the research questions as effectively as possible.
To reduce the reliance on the experts, a hybrid search approach – complementary
Boolean search strategy - is utilized based on a previous study by Huang et al. (2015). This
is a systematic combined search approach for retrieving information on emerging science
and technology areas, with decent recall and precision rates. More specifically, the

143
following four consecutive search steps are constructed to shape the entire search strategy
(Huang et al., 2015).
Core lexical query: Similar to using simple search terms, this query is often composed
of the most obvious and relevant keywords to conduct an initial search, and involves checking
with experts about the selection and identification of keywords. However, this step can be
too dependent upon the inputs given by the experts (Huang et al., 2011; Huang et al., 2015).
Expanded lexical query: Researchers expand the use of search terms based on their
initial core collection (e.g. from one core journal, or from a search query only using prefixed
key terms), and usually adopt a semi-automated process to identify a list of keywords with
relatively high relevancy (Zucker et al., 2007; Kostoff et al., 2006). Such an iterative process
results in the extraction of a keywords list, which has he following properties: (1) formed from
a candidate list of keywords generated from the core query and ranked by frequency, and (2)
relevant enough to the subject of interest. This approach can reduce the input from experts,
though sometimes the expanded keyword list is examined by the domain experts again (Huang
et al., 2011; Mogoutov & Kahane, 2007). The expanded query group could refer to one search
query or a set of search queries, composed of high frequency key terms or contingency terms.
Contingency terms refer to key terms that occur together. For example, keyword A is
considered relevant when other specific keywords, e.g. keyword B, exist. Also, Hit-Ratio and
Noise Ratio metrics are incorporated to determine whether to include a particular key term or
not (Arora, 2013; Huang et al., 2015).
Specialized journal search: By identifying a set of target journals (e.g. ten journals with
the highest impact factors in one specific research area), researcher can collect publications
within those journals to conduct citation and network analysis. But Huang et al. (2011) pointed

144
out that only using top journals does not provide a wide coverage compared to the other
approaches, and the results can be biased since the top journals only cover a small fraction of
the entire literature on a subject.
Cited reference analysis: This step is based on the specialized journal search step.
Based on the collection of target journal publications, researchers try to identify the highly
cited publications and check if they are already included in the existing dataset. If they are not,
then those highly cited publications are added to the existing dataset.
Huang et al. (2015) actually used only the first two approaches, core and expanded
lexical queries, instead of all four approaches in their publication. In this study, because there
is not an identified journal that only focuses on air filtration media, or micro and nanofibers, a
specialized journal search would result in too much noise. Cited reference analysis cannot be
adopted either because, among the four data sources, only WOS provides citation data that can
be retrieved. The details of how the hybrid search approach can be incorporated into this study
will be explained in Chapter 4.
3.3.1.3 Search Query Formulation
A search query is formulated based on the search strategy which is developed from the
topic of interest. Identified keyword(s)/term(s) are included within a search query. Based on
previous findings, search query formulation has a major influence on search result quality
(Ingwersen, 1982; Kajanan et al., 2014; Kelly & Cool, 2002; Teevan, Dumais, & Horvitz,
2007). When a search query or term is not relevant enough to the topic of interest, the quality
of search results via any search engine would not be high either. Two components that affect
formulating an effective query are the breath of the query and the language used in the query
(Porter and Cunningham, 2005). The breadth of the query is to look for the balance point

145
between recall and precision. Broad inclusion (recall) covers as many relevant records as
possible, and narrow focus (precision) includes as few irrelevant records as possible (Porter &
Cunningham, 2005). The nature of the language used in the query can be either scientific
language or the “natural” language common to both scientists and nonscientists.
Moreover, Boolean operators and wildcards are often used in search queries. For
example, in WOS, a maximum of 49 Boolean operators can be used in a single search query.
AND, OR, NOT, NEAR, and SAME are the most commonly used Boolean operators in WOS,
and each of them has a specific function. Usually AND and OR are used in the search queries.
AND is used to find records containing all of the terms separated by the operator, while OR is
used to find records containing any of the terms separated by the operator (Web of Science,
2014).
In addition, quotation marks are often also used in the search query. Quotation marks
limit the search to finding only an exact phrase and enhance the accuracy of the search query
in the Web of Science. When a phrase without quotation marks was used to conduct a search
within WOS, the search engine retrieves records which contain all of the words entered in the
search, regardless if the words appear close together or not. For instance, if instead of “melt
blowing”, melt blowing is used as a topic in the search query, then the results would include
documents with both melt and blowing mentioned as the topic. This retrieves records with the
exact phrase “melt blowing”, as well as records containing melt… blowing, or blowing… melt
in the topic, which might be completely irrelevant to “melt blowing”.
The following three steps were listed as the procedures to define and refine keywords
from preliminary searches of a previous study (Porter, Youtie, Shapira, & Schoeneck, 2008):

146
1. A pilot ‘field scope’ was developed, drawing upon and combining search terms and
insights from prior efforts to define the field bibliometrically.
2. Multiple experts were asked to review the pilot field scope and to delete, modify, add,
or retain terms.
3. The reviewed candidate terms were again explored by testing and assessing results
against publication data.
A similar approach is adopted in this study. First, a pilot “field scope” is developed by
using the initial search results obtained by using bibliometric based analysis (e.g. citation
analysis or counting the “hits” of one publication). Afterwards, experts are brought in to
review, refine and modify the initial search results by narrowing and eliminating irrelevant
terms, as well as adding more relevant information (refer to 3.3.1.4 for details).
3.3.1.4 Assessment and Evaluation of the Quality of the Search Results
The relevancy and depth of coverage are issues associated with information retrieval.
Previous studies relied on experts and their opinions to determine whether the search results
regarding the keywords/key terms found in the study met with the target coverage and
relevance or not (Porter et al., 2008; Kuzhabekova & Kuzma, 2014). This is a widely adopted
method to determine the search quality, and it also will be used in the initial phase of this study.
Expert opinion is also known as “expert judgment” and “expert panel”, and it is used
frequently in many fields, ranging from medical related fields to end user products. This
technique relies on the knowledge from the experts to identify potential problems; to achieve
more accuracy in results; and to provide better quality evaluations and assessments. This
technique can be used at any time or stage in the life cycle of a product or service, applied on
either an individual basis or group basis, via either questionnaires, group discussions, or one-

147
to-one interviews, depending on the research purpose, time, availability, and cost. The
advantage of obtaining expert opinions on a group basis is that it allows for discussions of
different opinions. The disadvantages are that scheduling a time when everyone is available
may be difficult and that domain experts might dominate the discussion. The biggest challenge
of using this technique is to ensure that the responses and perspectives are impartial and the
experts have no involvement or interest in the particular product/service to be assessed. It also
cannot replace other forms of statistical assessments and evaluations. The main purpose of
using the technique is to screen out potential problems at a preliminary stage.
Experts from both academia (6) and industry (4) were invited, and a brief one-on-one
interview combined with a simple survey (mainly rating and review the initial results based on
1-5 Likert scale, refer to Appendix B) was conducted either on the NCSU campus or remotely
at their convenience. Most participants were recruited from the Industrial Advisory Board
members (60 member companies) of the Nonwovens Institute and NCSU. Four experts were
recruited from different nonwoven manufacturing sections, including nonwoven equipment
suppliers, nonwoven roll goods manufacturers, and nonwoven filtration product producers.
Other experts were recruited from academic institutes, including professors, research
associates, and graduate students in related fields. An email or an oral announcement were
used for recruitment, and no compensation were provided (see Appendix A). All the
participants are kept anonymous and were provided a summary of further findings if needed.
3.3.2 Data Analysis Techniques
Text mining is a data analysis method for processing textual data. Compared to
traditional manual content analysis, the benefits brought by text mining are the high efficiency
and accuracy when retrieving, classifying, and clustering large sets of document. The particular

148
text mining technique used for technology management within high technology areas was
named “tech mining” by Porter. Tech mining serves as an effective decision making tool for
not only management functions but also R&D departments with a focus on science, technology
and innovation (Porter, 2007).
The tech mining software VantagePoint is used in this study. It is a text-mining tool
which specializes in analyzing textual datasets on high technology areas and topics collected
from various databases, such as patent and S&T literature databases. First and foremost, the
file formats of the exported datasets from data collection and the formats and filters of the text-
mining software that are used in importing datasets must be compatible (Masiakowski &
Wang, 2012). In VantagePoint, like any other text-mining software, the dataset is imported
into the software which uses filters to recognize the defined fields. The import filter can change
the raw data into structured fields which can be cleaned, analyzed and reported on through a
variety of visual representations of the data. VantagePoint has a large selection of import filters
built in for the most commonly used databases (including SCI, Compendex, Inspec, Derwent,
and ABI/Inform Complete) and also has the option to customize an import filter. VantagePoint
provides different options for representation of data, including lists, trend curves, and
relationship mapping. Furthermore, the data analyses can divide the data into categories,
classifications, or clusters based on content and association rules. Then, comparisons among
and across different categories, classifications, or clusters can be made. In our study, each of
the research objectives is fulfilled using different techniques.
For research objective 1, both numeric and textual data yielded from the analyses will
reveal trends, and the relationships among the identified keywords, so that relavant R&D
activities and the usage of selected technologies can be explained. For research objective 2 and

149
3, clusters built upon Principal Component Analysis can reveal applications, and match the
technology associated keywords or concepts (derived from the initial search results) with the
applications. A model based on logistic functions is used to project the development and
growth in order to accomplish research objective 4.
For validation of the datasets, a few approaches are taken. One is to compare the search
results from two different databases under the same category (S&T journals, patents, and
business and trade journals), and identify the similarities and differences among the datasets
from different databases. Also, one sub-dataset from each of WOS and EV is compared in
detail to explain the differences among data sources. To validate the forecasting models
developed, forecast results are compared with actual data for a few years (2011-2015) not
included in developing the forecasting models.
3.4 Summary
This chapter introduced the research design employed in this study. Information
retrieval, tech mining, and expert opinion were chosen as the main data collection and analysis
techniques used for the research. A description of the data collection procedures was provided
to explain the process. The next chapter will present an interpretation of the data.

150
CHAPTER 4 Data Collection - Search Query Formulation and Results
4.1 Search Queries and Results for Air Filtration and the Making of Air Filters
In this section, the search queries used for retrieving data from a variety of sources for this
study are presented. The entire process on how the search queries are constructed and modified
is also discussed here. The process to finalize the search query set on air filtration was
extremely repetitive and time consuming, and each of the queries went through multiple trials
and iterations. For all of the databases, queries with similar structures were used to retrieve
records to ensure consistency. First, the steps on how the search queries were developed are
explained, and then the queries for each database are listed.
4.1.1 Search Queries in WOS
4.1.1.1 The Iterative Process of Finalizing Search Queries in WOS
For the air filtration search, the seed query is TS= ("air filter*" OR "air filtration*") in
WOS, and it retrieved 1,844 records. “TS” as a search criterion in WOS means “Topic”, which
restricts the search fields to “Title”, “Abstract”, “Author Keywords”, and “Keywords Plus®”
in each record associated with the publications. The core lexical query for the air filtration
search needed to be synonyms or extremely related to the subject - air filter or air filter
media/medium. Therefore, the core query developed contained keywords such as “air filt*”,
“HEPA”, and “ULPA” (where * indicates missing letter(s)). Thus in WOS, a query using “air
filt*” yields results containing air filter, air filters, air filtration, air filtered, air filtering, etc.
Moreover, other synonyms considered to be added to the core query included “air purifier”,
“air purification”, “air cleaner”, and “air cleaning”. However, “air purifier”, “air purification”,
“air cleaner”, or “air cleaning” do not necessary involve filter media, so filt* was included to

151
narrow down the results. The core query generated 2,891 records from WOS. The core query
used in WOS is as follows:
TS=("air filt*" OR ((HEPA OR "high efficiency particulate air") and filt*) OR ((ULPA OR "ultra low penetration air") and filt*) OR "air purifier*" OR ("air purifi*" AND filt*) OR ("air cleaner*") OR ("air clean*" AND filt*))
Expanded lexical queries were needed to add more appropriate and relevant
information on air filter/filtration to the core query, and two sets of expanded queries were
involved: high relevant term queries that often co-occur together, and contingency term queries
(Huang et al, 2015). Thus a set of queries very closely related to the topic of air filtration were
included as highly relevant expanded lexical queries, and they were made up of multiple words
occurring together (see Table 4-1). Experts in nonwovens and air filtration (a total of 10
experts: 3 professors, 4 industrial advisors, and 3 graduate students) were asked to assess the
identified search terms on a Likert scale according to the relevancy of the search key terms
based upon their knowledge.
Table 4-1 Expanded lexical queries-highly relevant queries
Highly relevant queries of air filtration for WOS TS=("aerosol filter*" OR "aerosol filtration*") TS=("gas filter*" OR "gas filtration*")
TS=((HVAC OR "heating, ventilating, and air conditioning") AND filt*) TS=(filt* AND (respirator OR respirators OR "respiratory device")) TS=("fibrous filt*")
TS=("electret filt*") TS=(("coalesc* filt*") NOT (wastewater OR "waste-water" OR emulsi* OR liquid- liquid
OR query OR track)) TS=("pleat* filter*")
TS=(“antibacterial filt*” OR “antimicrobial filt*” OR “anti-bacterial filt*” OR “anti- microbial filt*”)
For the expanded contingency term queries, the candidate terms were identified based
on TF*IDF scores (square root TF values are used instead of TF values here). TF stands for
term frequency, counting the frequency one word can be found in a collection of documents.

152
IDF means inverse document frequency, and it is to remove the influence of one word
appearing too many times only in one document. IDF is calculated based on dividing the total
number of documents by the number of documents containing the term, and the logarithmical
value is used. Initially, data cleaning and preprocessing were applied to the seed query (TS=
("air filter*" OR "air filtration*")) to remove the duplicated and non-relevant records, and the
number of records was reduced to 1,638 from 1,844. Later, based on the updated collection of
data, the fields “Keywords (author’s)” and “Keywords Plus” were merged into one list, and
TF*IDF values were calculated. Table 4-2 shows the top keywords based on the sqrt TF*IDF
values ranked from highest to lowest.
Table 4-2 TF*IDF scores (top keywords ranked from highest to lowest)
Ranking # Records
Keywords (author's) + Keywords Plus (After
Cleaning)
sqrtTF*IDF Values
1 156 filter 13.34 2 130 indoor air 13.34 3 242 Air Filter 13.04 4 78 HVAC air filter 12.68 5 70 Particulate matter 12.4 6 92 exposure 12.36 7 49 Invasive aspergillosis 12.29 8 89 Airborne 12.18 9 78 performance 11.68 10 72 Aerosol 11.65 11 76 Particle 11.63 12 46 VOC 11.47 13 53 Nanofiber 11.05 14 44 Electro-Spinning 11 15 43 Asthma 10.95 16 50 deposition 10.93 17 42 AIR POLLUTANT 10.79 18 52 Efficiency 10.76 19 36 aspergillesis 10.75 20 45 air 10.59 21 47 infection 10.57

153
Table 4-2 (continued) 22 43 MEDIA 10.55 23 42 Nanoparticle 10.38 24 38 Pressure drop 10.34 25 35 Fibrous filter 10.3 26 41 Pollution 10.25 27 32 Children 10.11 28 34 Bioaerosol 10.03 29 33 Fungi 10.03 30 37 Health 10.01 31 36 Environment 9.95 32 36 outbreak 9.95 33 35 contamination 9.89 34 35 fiber 9.88 35 35 dust 9.88 36 35 REMOVAL 9.88 37 28 ULTRAFINE PARTICLE 9.84 38 28 Adsorption 9.77 39 31 Ozone 9.75 40 30 Air sample 9.67 41 31 SYSTEM 9.59 42 24 antibacterial 9.53 43 29 Bacteria 9.52 44 22 Electret filter 9.46 45 25 Activated Carbon 9.44 46 28 Model 9.43 47 24 Prevention 9.35 48 28 HEPA filter 9.35 49 25 BONE-MARROW 9.26 50 20 Radioactivity 9.18 51 27 SAMPLES 9.17 52 26 TRACE-ELEMENT 9.17 53 24 membrane 9.17 54 24 RISK FACTOR 9.17 55 25 EFFICACY 9.08 56 25 Microorganism 9.08 57 25 Soil 9.08 58 19 CHARGED FIBER 9.08 59 24 Water 8.99 60 24 SURFACE 8.99 61 22 Penetration 8.98

154
Table 4-2 (continued) 62 23 DISEASE 8.88
63 23 Polycyclic aromatic hydrocarbons 8.88
64 22 transmission 8.87 65 19 Antimicrobial 8.87 66 22 FABRICATION 8.78 67 22 QUALITY 8.78 68 22 Filtration efficiency 8.67 69 21 emission 8.67 70 21 Epidemiology 8.67 71 21 home 8.67 72 21 Risk 8.67 73 23 Non-woven 8.67 74 13 TiO2 8.66 75 19 PRODUCTS 8.66 76 17 allergen 8.65 77 20 lead 8.56 78 20 SIMULANTS 8.56 79 20 WORKERS 8.56 80 14 clean room 8.54 81 12 Corona discharge 8.54 82 18 Mortality 8.54 83 20 Escherichia coli 8.44 84 19 Aerosol particle 8.44 85 19 OUTDOOR 8.44 86 17 Air cleaner 8.42 87 18 COLLECTION 8.31 88 18 ORGANIC-COMPOUNDS 8.31 89 16 silver nanoparticle 8.29 90 14 Photocatalysis 8.27 91 17 particulate air filter 8.18 92 17 submicrometer filtering 8.18 93 17 construction 8.18 94 17 Heavy metal 8.18 95 17 IMPACT 8.18 96 17 NEUTROPENIC PATIENTS 8.18 97 15 residential 8.15 98 16 pollutant 8.04 99 17 Air quality 8.04 100 16 Tuberculosis 8.04

155
Then, for each of the candidate terms, the Hit Ratio was calculated and the Noise Ratio
was computed using manual checking (manual review to determine the relevancy of each
record after sampling from a collection of records). Figure 4-1 shows the relationships of
different groups, based on the search results, in a Venn diagram that is used for the Hit Ratio
and Noise Ratio calculations. Group X refers to the number of records retrieved from the core
query, Y refers to the collection of records retrieved from the set of queries (consisting of co-
occurring words) that are highly relevant to the topic, and Z is the collection of records
retrieved using the candidate terms in a search query. Unfortunately, the majority of the listed
candidate terms were excluded because they either received a Hit Ratio lower than 30% or a
Noise Ratio of higher than 50%. The rules for Hit Ratio and Noise Ratio are: Accept the
candidate terms if the Hit Ratio is at least 70%; manual check is needed when the Hit Ratio is
in-between 30% and 70%, then accept the candidate term if the Noise Ratio is lower than 50%,
otherwise reject the term; reject the candidate term if the Hit Ratio is lower than 30%. In Table
4-3, “High” in the “Noise Ratio” column indicates that the Noise Ratio is higher than 50%.
The reason why this might have occurred could be that those terms are not only seen in the air
filtration area, but also in other areas. These results implied low relevancy and high noise if
those terms were used separately, which would not serve the purpose of this study.
Figure 4-1. Venn diagram of the hit ratio and noise ratio calculations (adapted from Huang
et al., 2015)

156
Table 4-3 Examples of hit ratio and noise ratio calculations using candidate terms Candidate Terms
# of Records
Y& Z
X& Y& Z
Hit Ratio (%)
Preliminary Conclusion
(Y&Z) NOT X
Noise Ratio
Final Decision
TS=("indoor air")
12,796 104 57 54.81 Manual Check
47 High
Exclude
TS=("air pollutant*")
12,001 13 6 46.15 Manual Check
7 High
Exclude
TS=("pressure drop")
24,065 393 84 21.37 Exclude 309
TS=("air sample" OR "air samples" OR "air sampling")
6,955 33 5 15.15 Exclude 28
TS=("activated carbon*")
41,790 70 15 21.43 Exclude 55
TS=("trace- element*")
56,393 21 0 0 Exclude 21
TS=("risk factor*")
519,169 7 3 42.86 Manual Check
4 High
Exclude
TS=("charged fiber*")
70 12 1 8.33 Exclude 11
TS=("polycyclic aromatic- hydrocarbon*" OR "polyaromatic hydrocarbon*")
44,013 15 2 13.33 Exclude
TS=("filtration efficiency" OR "filter efficiency")
1,345 293 80 27.30 Exclude
TS=("submicro meter filtering")
2 0 0 Exclude
TS=("air quality")
26,920 99 40 40.40 Manual Check
59 High
Exclude
TS=("bone- marro*)
199,008 1 1 100 Already Included
The low Hit Ratio scores and high Noise Ratios suggested that the proposed Hit Ratio
and Noise Ratio tests did not seem to work well with most of the individual candidate terms.
Since only a few candidate terms could be identified as contingency terms using this method,

157
the concern was low recall, resulting from missing data. Therefore, an alternative method to
identify additional keywords was used. This method was to use module based search queries,
composed of a few clusters of similar words or phrases and the Boolean operator AND, and
then apply the Hit Ratio and Noise Ratio tests to the records retrieved from each search query
made up of modules. The inspiration came from the modular search strategy, that was adopted
in previous tech mining studies (Garechana, 2012; Guo et al., 2015; Ma et al., 2015; Porter et
al, 2008; Zhou et al, 2014). Here, the candidate terms are selected based on descending
TF*IDF values, and then they are grouped into different modules by similar functions. To
capture air filtration related R&D information, search queries constructed by combining those
modules together could possibly expand the search without including too much noise. Those
expanded queries were tested by checking the relevancy of the retrieved records (still based on
the Hit Ratio and Noise Ratio). Meanwhile, when testing the expanded queries and checking
the Hit Ratio and Noise Ratio, adding or removing an individual keyword was suggested in the
literature as a way to increase the recall and reduce the noise (Garechana, 2012; Guo et al.,
2015; Ma et al., 2015; Poter et al, 2008). Table 4-4 shows the details of the functional modules
identified keywords from seed query results, and Table 4-5 lists the expanded search queries
used for the air filtration area.

158
Table 4-4 Breakdown of identified candidate terms (and their variations) by similar functions.
Acronym Annotation for the functional modules
Identified keywords
C target contaminants, pollutants, or transmitted diseases related terms
particulate* OR VOC* OR “organic-compound*” OR "air pollutant*" OR infection OR bioaerosol* OR bio-aerosol* OR fungi OR contamina* OR dust* OR "ultrafine particle*" OR ozone OR microorganism* OR bacteria OR radioactiv* OR microorganism* OR micro-organism* OR disease* OR "polycyclic aromatic-hydrocarbon*" OR "polyaromatic hydrocarbon*" OR emission* OR allergen OR lead OR "aerosol particle*" OR "heavy metal*" OR virus*
F filtration or capture mechanism related terms except filt*
expos* OR deposit* OR remov* OR adsorp* OR transmi* OR collect*
M air filter or filter media related terms
medi* OR membrane*
P filtration performance or evaluation parameter related terms
performance OR "pressure drop" OR efficiency OR efficacy OR surface OR penetration OR "quality factor" OR flow
T filter media manufacturing process related technology
nanofiber* OR nano-fiber* OR nanofibre* OR nano-fibre* OR electrosp?n* OR "electro-sp?n*" OR "electrostatic*-sp?n*" OR nanoparticle* OR nano-particle* OR "activated carbon*" OR (charg* NEAR/2 (fiber* OR fibre*)) OR TiO2 OR "titanium dioxide" OR photocatalysis OR phtocatalytic
A for air filtration ambient environment, not other filtration (water, liquid)
"indoor air" OR airborne
N material for filter fabrics non-woven* OR nonwoven* E charging and discharge process
for filter media charg* OR discharge*
filt* filter/filtration/filtered/filtering filt*
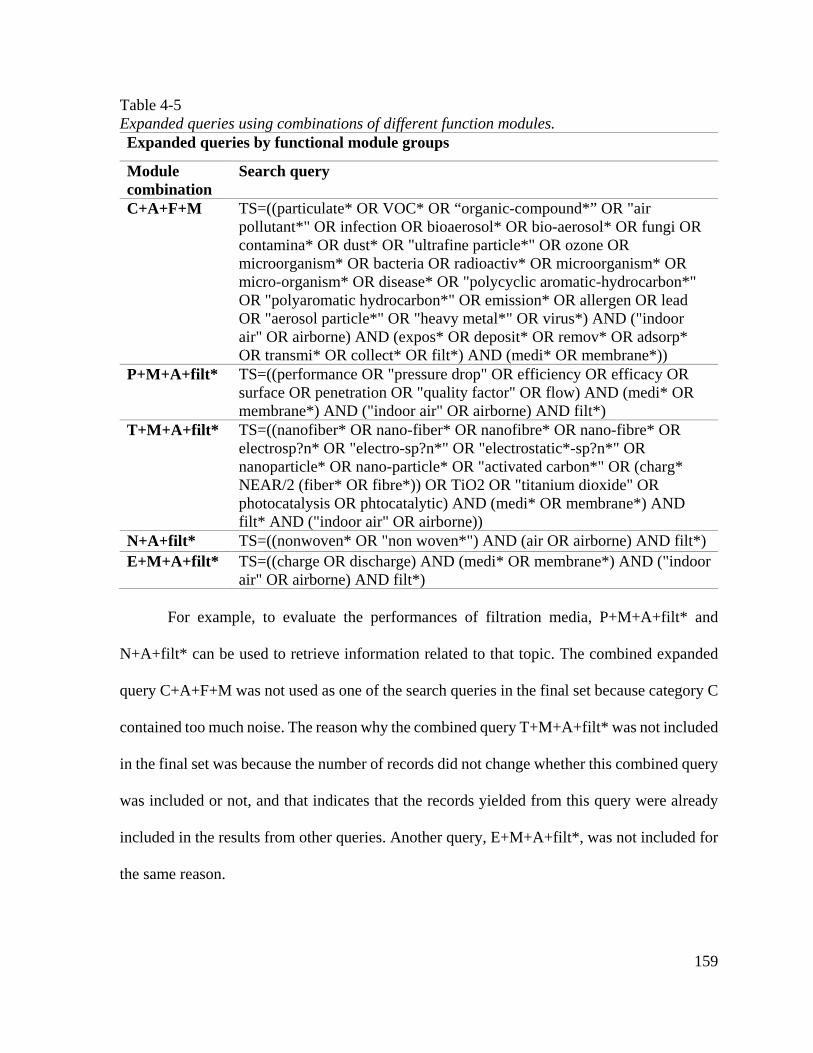
159
Table 4-5 Expanded queries using combinations of different function modules. Expanded queries by functional module groups
Module combination
Search query
C+A+F+M TS=((particulate* OR VOC* OR “organic-compound*” OR "air pollutant*" OR infection OR bioaerosol* OR bio-aerosol* OR fungi OR contamina* OR dust* OR "ultrafine particle*" OR ozone OR microorganism* OR bacteria OR radioactiv* OR microorganism* OR micro-organism* OR disease* OR "polycyclic aromatic-hydrocarbon*" OR "polyaromatic hydrocarbon*" OR emission* OR allergen OR lead OR "aerosol particle*" OR "heavy metal*" OR virus*) AND ("indoor air" OR airborne) AND (expos* OR deposit* OR remov* OR adsorp* OR transmi* OR collect* OR filt*) AND (medi* OR membrane*))
P+M+A+filt* TS=((performance OR "pressure drop" OR efficiency OR efficacy OR surface OR penetration OR "quality factor" OR flow) AND (medi* OR membrane*) AND ("indoor air" OR airborne) AND filt*)
T+M+A+filt* TS=((nanofiber* OR nano-fiber* OR nanofibre* OR nano-fibre* OR electrosp?n* OR "electro-sp?n*" OR "electrostatic*-sp?n*" OR nanoparticle* OR nano-particle* OR "activated carbon*" OR (charg* NEAR/2 (fiber* OR fibre*)) OR TiO2 OR "titanium dioxide" OR photocatalysis OR phtocatalytic) AND (medi* OR membrane*) AND filt* AND ("indoor air" OR airborne))
N+A+filt* TS=((nonwoven* OR "non woven*") AND (air OR airborne) AND filt*) E+M+A+filt* TS=((charge OR discharge) AND (medi* OR membrane*) AND ("indoor
air" OR airborne) AND filt*)
For example, to evaluate the performances of filtration media, P+M+A+filt* and
N+A+filt* can be used to retrieve information related to that topic. The combined expanded
query C+A+F+M was not used as one of the search queries in the final set because category C
contained too much noise. The reason why the combined query T+M+A+filt* was not included
in the final set was because the number of records did not change whether this combined query
was included or not, and that indicates that the records yielded from this query were already
included in the results from other queries. Another query, E+M+A+filt*, was not included for
the same reason.

160
4.1.1.2 The Search Queries and the Number of Retrieved Records in WOS
In this section, the search queries used for retrieving air filtration related publications
in WOS are listed in Table 4-6, which also includes the number of records resulting from each
search query.
Table 4-6 Search queries for air filtration in WOS
Query number
# of records
Query
Core lexical query (group A)
#1 2,891 TS=("air filt*" OR ((HEPA OR "high efficiency particulate air") and filt*) OR ((ULPA OR "ultra low penetration air") and filt*) OR "air purifier*" OR ("air purifi*" AND filt*) OR ("air cleaner*") OR ("air clean*" AND filt*))
Expanded queries (high relevance group B)
#2 383 TS=("aerosol filter*" OR "aerosol filtration*") #3 682 TS=("gas filter*" OR "gas filtration*") #4 532 TS=("fibrous filt*") #5 114 TS=("electret filt*") #6 63 TS=("pleat* filter*" OR "pleat* filtration") #7 65 TS=(“antibacterial filt*” OR “antimicrobial filt*” OR “anti-bacterial filt*” OR
“anti-microbial filt*”) #8 38 TS=(("coalesc* filt*") NOT (wastewater OR "waste-water" OR emulsi* OR
liquid-liquid OR query OR track)) #9 451 TS=(filt* AND (respirator OR respirators OR "respiratory device")) #10 251 TS=((HVAC OR "heating, ventilating, and air conditioning") AND filt*) Expanded queries (contingency group C)
#11 439 TS=((performance OR "pressure drop" OR "pressure drops" OR efficiency OR efficacy OR surface OR penetration OR "quality factor" OR flow) AND (medi* OR membrane*) AND ("indoor air" OR airborne) AND filt*)
#12 206 TS=((nonwoven* OR non-woven*) AND (air OR airborne) AND filt*) #13 5,289 #1 OR #2 OR #3 OR #4 OR #5 OR #6 OR #7 OR #8 OR #9 OR #10 OR #11
OR #12 Exclusion terms queries
#14 2,208,816 TS=(Kalman OR tracker OR "target tracking" OR GPS OR "optical fiber*" OR "photo optical" OR optics OR bandpass OR band-pass OR acoustical OR noise OR resonator OR resonance OR "non-linear filter*" OR "nonlinear filter*" OR "linear filter*" OR communication OR "liquid crystal display" OR LCD OR waveguide OR "personal sampl*" OR effluent* OR sewage)
#15 103,876 TI=(wastewater* OR "waste-water*" OR "water treatment*" OR "water filt*" OR water-in-oil OR emulsion OR seawater OR sea-water OR saline OR desalination OR stormwater OR "liquid filt*" OR geotextile* OR geo-textile* OR ultrafiltration)
#16 4,974 #13 NOT (#14 OR #15)

161
After removing duplicated and non-relevant records, and by only including journal
articles and conference papers, 4,675 out of the 4,974 records retrieved were used.
4.1.2 Search Queries in EV
4.1.2.1 The Process of Finalizing Search Queries in EV
EV is another data source with an emphasis on S&T information. With different search
algorithms than WOS, EV utilizes controlled terms by default, and does not recognize the use
of some wildcards. This means that while translating queries from WOS to EV is possible, it
requires a lot of effort. For example, because EV does not recognize the asterisk, each variation
of the word has to be spelled out. Instead of using filt* in queries, different variants, filter,
filters, filtration, and filtering, need to be listed. Another example is the use of the NEAR/x
operator. It works with individual words in EV but not with a cluster of words. So instead of
using “(submicron OR sub-micron) NEAR/2 (fiber OR fibers)”, the query looks like this:
(submicron NEAR/2 fiber) OR (submicron NEAR/2 fibers) OR (sub-micron NEAR/2 fiber)
OR (sub-micron NEAR/2 fibers). The most similar search field to “TS” in WOS is “KY” (“key
terms”) in EV, which includes “subject”, “title”, and “abstract” in each record. Due to the
different search algorithms in WOS and EV, it is not realistic to replicate the search queries
from WOS in EV in completely the same manner. However, the same structure of search
queries can be adopted with modifications, so that the queries are as consistent as possible.
4.1.2.2 The Search Queries and the Number of Retrieved Records in EV
By following the same search query structure used in WOS, and mastering the search
algorithms of EV, the queries in Table 4-6 have been modified in Table 4-7 to be used for
record retrieval in EV. The numbers of records retrieved are also listed in Table 4-7. This
search yielded a lot more hits than the search in WOS.

162
Table 4-7 Search queries for air filtration in EV Query number
# of records Query Compendex Inspec
Core lexical query (Group X) #1 10,131 ("air filter" OR "air filters" OR "air
filtration" OR "air filtrations" OR ((HEPA OR "high efficiency particulate air") and (filter OR filters OR filtration OR filtrations)) OR ((ULPA OR "ultra low penetration air") and (filter OR filters OR filtration OR filtrations)) OR "air purifier" OR "air purifiers" OR ("air purification" AND (filter OR filters OR filtration OR filterations OR filtering)) OR ("air purified" AND (filter OR filters OR filtration OR filterations OR filtering)) OR "air cleaner" OR "air cleaners" OR ("air cleaning" AND (filter OR filters OR filtration OR filtrations OR filtering)) OR ("air cleaned" AND (filter OR filters OR filtration OR filtrations OR filtering))) WN KY
8,782 1,349
Expanded query (Group Y) #2 373 (("aerosol filter" OR "aerosol filters" OR
"aerosol filtration" OR "aerosol filtrations") WN KY)
267 106
#3 1,052 (("gas filter" OR "gas filters" OR "gas filtration" OR "gas filtrations") WN KY)
738 314
#4 604 (("fibrous filter" OR "fibrous filters" OR "fibrous filtration") WN KY)
483 121
#5 136 (("electret filter" OR "electret filters" OR "electret filtration") WN KY)
95 41
#6 106 (("pleat filter" OR "pleated filter" OR "pleat filters" OR "pleated filters" OR "pleat filtration" OR "pleated filtration") WN KY)
82 24
#7 53 (("antibacterial filter" OR "antibacterial filters" OR "antimicrobial filter" OR "antimicrobial filters" OR "anti-bacterial filter" OR "anti-bacterial filters" OR "anti-microbial filter" OR "anti-microbial filters" OR "antibacterial filtration" OR "antimicrobial filtration" OR "anti-bacterial filtration" OR "anti-microbial filtration") WN KY)
38 15

163
Table 4-7 (continued)
#8 108 ((("coalescence filter" OR "coalescence filters" OR "coalescence filtration" OR "coalescing filter" OR "coalescing filters" OR "coalescing filtration" OR "coalescer filter" OR "coalescer filters" OR "coalescer filtration") NOT (wastewater OR "waste-water" OR emulsion OR emulsified OR liquid-liquid OR query OR track)) WN KY)
93 15
#9 298 ((((filter OR filtering OR filtered OR filtration OR filtrations) AND (respirator OR respirators OR "respiratory device"))) WN KY)
180 118
#10 542 (((HVAC OR "heating, ventilating, and air conditioning") AND (filter OR filters OR filtering OR filtration)) WN KY)
428 114
Expanded query (Group Z) #11 284 ((performance OR "pressure drop" OR
"pressure drops" OR efficiency OR efficacy OR surface OR penetration OR "quality factor" OR flow) AND (media OR medium OR membrane OR membranes) AND ("indoor air" OR airborne) AND (filter OR filters OR filtration)) WN KY
220 64
#12 394 (nonwoven OR nonwovens OR non-woven OR non-wovens) AND (air OR airborne) AND (filter OR filters OR filtration OR filtering OR filtered)) WN KY
295 99
#13 12,858 #1 OR #2 OR #3 OR #4 OR #5 OR #6 OR #7 OR #8 OR #9 OR #10 OR #11 OR #12
10,707 2,151
Exclusion terms queries #14 3,749,217 (Kalman OR tracker OR "target tracking"
OR GPS OR "optical fiber" OR "optical fibers" OR "photo optical" OR optics OR bandpass OR band-pass acoustical OR noise OR resonator OR resonance OR "non-linear filter" OR "non-linear filters" OR "nonlinear filter" OR "nonlinear filters" OR "linear filter" OR "linear filters" OR communication OR "liquid crystal display" OR LCD OR waveguide OR "personal sample" OR "personal samples" OR "personal sampler" OR "personal samplers" OR "personal sampling" OR "personal samplings" OR effluent OR effluents OR sewage) WN KY
2,054,649 1,724,568

164
Table 4-7 (continued) #15 88,432 (wastewater OR wastewaters OR "waste-
water" OR "waste-waters" OR "water treatment" OR "water treatments" OR "water filtration" Or "water filter" OR "water filters" OR "water filtered" OR "water filtering" OR water-in-oil OR emulsion OR sea-water OR saline OR desalination OR fouling OR "liquid filter" OR "liquid filters" OR "liquid filtration" OR "liquid filter" OR "liquid filters" OR "liquid filtering" OR "liquid filtered" OR geotextile OR geotextiles OR geo-textile OR geo-textiles OR ultrafiltration) WN TI
68,741 19,691
#16 10,863 #13 NOT (#14 OR #15) 8,898 1,965
Because both Compendex and Inspec have overlaps in their coverage, data cleaning
and preprocessing was a necessary step before performing any analyses. After removing
duplicated and non-relevant records from the data set, there are 9,016 records from EV.
4.1.3 Search Queries in DII
4.1.3.1 The Process of Finalizing Search Queries in DII
When conducting searches in the Derwent Innovation Index, indexes (classification
codes) and key terms are both needed. First, 26,961 records were retrieved from the seed query
TS=("air filter" OR "air filters" OR "air filtration" OR "air filtrations").
Based on the retrieved records, the International Patent Classification codes were
ranked from highest to lowest. Some of the top 50 classification categories (see Table 4-8) are
not related to air filtration media or the making of air filter media, and some are air filtration
application based, such as F02M for automobile filtration and F24F for HVAC systems and
units. Among all those categories, B01D 39/00 Filtering material is the only category with a
focus on air filtration media, and it is ranked 19th out of the top 50 classification codes. Under
the main category B01D 39/00 Filtering material, there are a variety of sub-categories that are
more specific on the filtering media. See Table 4-9 for detailed information. B01D 46/00

165
concentrates on the filtration mechanisms of air filters, which were determined by both
processes and materials, and it is closely related to filtration media as well. Table 4-10 lists all
the categories associated with B01D 46/00.
Table 4-8 Top International Patent Classification codes identified from the core query
TOPIC: ("air filter" OR "air filters" OR "air filtration" OR "air filtrations") Ranking IPC
codes # of records
% of 26961
Descriptions of IPC codes
1 B01D-046/00
2392 8.87% Filters or filtering processes specially modified for separating dispersed particles from gases or vapours (filtering elements B01D 24/00-B01D 35/00; filtering material B01D 39/00; their regeneration outside the filters B01D 41/00)
2 F24F-013/28
1665 6.18% Arrangement or mounting of filters
3 F02M-035/024
1477 5.48% using filters, e.g. moistened under 035/02
4 F02M-035/02
1436 5.33% Air cleaners under 035/00 Combustion-air cleaners, air intakes, intake silencers, or induction systems specially adapted for, or arranged on, internal-combustion engines
5 B01D-046/52
1343 4.98% Particle separators, e.g. dust precipitators, using filters embodying folded material
6 B01D-046/42
1226 4.55% Auxiliary equipment or operation thereof
7 B01D-046/10
927 3.44% Particle separators, e.g. dust precipitators, using filter plates, sheets, or pads having plane surfaces
8 B01D-039/16
847 3.14% of organic material, e.g. synthetic fibres
9 B01D-050/00
767 2.85% Combinations of devices for separating particles from gases or vapours
10 F24F-001/00
765 2.84% Room units, e.g. separate or self-contained units or units receiving primary air from a central station
11 B60H-003/06
728 2.70% Filtering (under B60H-003/00 Other air-treating devices under Heating, cooling or ventilating devices)

166
Table 4-8 (continued) 12 B01D-
039/14 723 2.68% Other self-supporting filtering material
13 F24F-003/16
660 2.45% by purification, e.g. by filtering; by sterilisation; by ozonisation
14 B01D-046/24
626 2.32% Particle separators, e.g. dust precipitators, using rigid hollow filter bodies
15 F02M-035/10
575 2.13% Air intakes; Induction systems (using kinetic or wave energy of charge in induction systems for improving quantity of charge F02B
16 F24F-011/02
516 1.91% Arrangement or mounting of control or safety devices
17 F02M-035/04
489 1.81% specially arranged with respect to engine; Mounting thereon
18 F24F-013/00
483 1.79% Details common to, or for air-conditioning, air-humidification, ventilation or use of air currents for screening
19 B01D-039/00
429 1.59% Filtering material for liquid or gaseous fluids
20 F02M-035/08
413 1.53% with means for removing dust from cleaners; with means for indicating clogging; with by-pass means
21 B01D-053/04
382 1.42% with stationary adsorbents
22 F24F-001/02
335 1.24% self-contained, i.e. with all apparatus for treatment installed in a common casing
23 B01D-046/02
318 1.18% Particle separators, e.g. dust precipitators, having hollow filters made of flexible material
24 A61M-005/14
305 1.13% Infusion devices, e.g. infusing by gravity; Blood infusion; Accessories therefor
25 B01D-046/12
281 1.04% in multiple arrangements under 46/10
26 B60K-013/02
280 1.04% concerning intake
27 F02M-035/16
272 1.01% characterised by use in vehicles (predominant vehicle aspects, see the relevant classes for the vehicles)
28 A61L-009/00
268 0.99% Disinfection, sterilisation or deodorisation of air

167
Table 4-8 (continued) 29 F24F-
005/00 267 0.99% Air-conditioning systems
or apparatus not covered by group F24F 1/00 or F24F 3/00
30 A61L-009/16
263 0.98% using physical phenomena
31 B01D-053/02
253 0.94% by adsorption, e.g. preparative gas chromatography (under Separation of gases or vapours; Recovering vapours of volatile solvents from gases; Chemical or biological purification of waste gases, e.g. engine exhaust gases, smoke, fumes, flue gases or aerosols)
32 F24F-007/00
250 0.93% Ventilation
33 B60H-001/00
248 0.92% Heating, cooling or ventilating devices
34 F24F-007/06
242 0.90% with forced air circulation, e.g. by fan
35 B01D-039/20
239 0.89% of inorganic material, e.g. asbestos paper or metallic filtering material of non-woven wires
36 A62B-007/10
236 0.88% with filter elements (under A62B-007/00 Respiratory apparatus (for medical purposes A61M 16/00))
37 F02M-035/104
236 0.88% Intake manifolds
38 H05K-007/20
236 0.88% Modifications to facilitate cooling, ventilating, or heating
39 F02M-035/14
215 0.80% Combined air cleaners and silencers
40 A61L-009/20
204 0.76% Ultra-violet radiation
41 A61L-009/01
202 0.75% Deodorant compositions
42 B01D-046/04
192 0.71% Cleaning filters under 46/02
43 B01D-046/30
189 0.70% Particle separators, e.g. dust precipitators, using loose filtering material
44 B01D-035/30
185 0.69% Filter housing constructions
45 B01D-000/00
183 0.68% SEPARATION

168
Table 4-8 (continued) 46 F02M-
035/022 175 0.65% acting by gravity, by centrifugal, or by
other inertial forces, e.g. with moistened walls
47 B01D-053/86
173 0.64% Catalytic processes
48 B01D-039/08
166 0.62% Filter cloth, i.e. woven, knitted or interlaced material
49 A61L-009/22
164 0.61% Ionisation (under A61L 009/00 Disinfection, sterilisation or deodorisation of air (purifying air by respirators A62B, A62D 9/00; chemical or biological purification of waste gases B01D 53/34; air-conditioning systems incorporating sterilisation F24F 3/16))
50 B03C-003/28
163 0.61% Plant or installations without electricity supply, e.g. using electrets (under B03C 3/00 Separating dispersed particles from gases or vapour, e.g. air, by electrostatic effect)
Table 4-9 IPC category B01D 39/00 and its sub-categories
IPC codes Descriptions B01D 39/00 Filtering material for liquid or gaseous fluids B01D 39/02 ·Loose filtering material, e.g. loose fibres B01D 39/04 · ·Organic material, e.g. cellulose, cotton B01D 39/06 · ·Inorganic material, e.g. asbestos fibres, glass beads or fibres B01D 39/08 ·Filter cloth, i.e. woven, knitted or interlaced material (metallic B01D
39/10) B01D 39/10 ·Filter screens essentially made of metal B01D 39/12 · ·of wire gauze; of knitted wire; of expanded metal B01D 39/14 ·Other self-supporting filtering material B01D 39/16 · ·of organic material, e.g. synthetic fibres B01D 39/18 · · ·the material being cellulose or derivatives thereof B01D 39/20 · ·of inorganic material, e.g. asbestos paper or metallic
filtering material of non-woven wires Note. The dot before the descriptions indicates the grade of the classification, and more dots indicate a lower grade.

169
Table 4-10 IPC category B01D 46/00 and its sub-categories
IPC codes Descriptions B01D 46/00
Filters or filtering processes specially modified for separating dispersed particles from gases or vapours (filtering elements B01D 24/00-B01D 35/00; filtering material B01D 39/00; their regeneration outside the filters B01D 41/00) [2006.01]
B01D 46/02
·Particle separators, e.g. dust precipitators, having hollow filters made of flexible material [2006.01]
B01D 46/04
· ·Cleaning filters
B01D 46/06
· ·with means keeping the working surfaces flat
B01D 46/08
· · ·the working surfaces forming a star shape
B01D 46/10
·Particle separators, e.g. dust precipitators, using filter plates, sheets, or pads having plane surfaces
B01D 46/12
· ·in multiple arrangements
B01D 46/14
· ·arranged in a star shape
B01D 46/16
· ·arranged on non-filtering conveyors
B01D 46/18
·Particle separators, e.g. dust precipitators, using filtering belts
B01D 46/20
· ·the belts combined with drums
B01D 46/22
· ·the belts travelling during filtering
B01D 46/24
·Particle separators, e.g. dust precipitators, using rigid hollow filter bodies
B01D 46/26
· ·rotatable
B01D 46/28
·Particle separators, e.g. dust precipitators, using filter brushes
B01D 46/30
·Particle separators, e.g. dust precipitators, using loose filtering material
B01D 46/32
· ·the material moving during filtering
B01D 46/34
· · ·not horizontally, e.g. using shoots
B01D 46/36
· · ·as a substantially horizontal layer, e.g. on rotary tables, drums or conveyor belts
B01D 46/38
· · ·as fluidised bed

170
Table 4-10 (continued) B01D 46/40
·Particle separators, e.g. dust precipitators, using edge filters, i.e. using contiguous impervious surfaces
B01D 46/42
·Auxiliary equipment or operation thereof
B01D 46/44
· ·controlling filtration
B01D 46/46
· · ·automatic
B01D 46/48
· ·Removing dust other than cleaning filters
B01D 46/50
· ·Means for discharging electrostatic potential
B01D 46/52
·Particle separators, e.g. dust precipitators, using filters embodying folded material
B01D 46/54
·Particle separators, e.g. dust precipitators, using ultra-fine filter sheets or diaphragms
Note. The dot before the descriptions indicates the grade of the classification, and more dots indicate a lower grade.
After scanning through the top 100 IPC classification codes, six categories related to
B01D 39/00 that are about the making of filter media fabrics constitute a search query to
constrain the results to the subject of filter media.
IP=(B01D-039/00 OR B01D-039/08 OR B01D-039/14 OR B01D-039/16 OR B01D-039/18 OR B01D-039/20)
Besides the category of B01D-039/00 and its chosen sub-categories; B01D-046/00 and
its chosen subcategories (using the same process that was used for B01D 39/00) are also
included in the patent search to restrict the results yielded only from key terms.
IP=(B01D-046/00 OR B01D-046/02 OR B01D-046/10 B01D-046/12 OR B01D-046/42 OR B01D-046/48 OR B01D-046/50 OR B01D-046/52 OR B01D-046/54)
Since the focus of the study was the technology involved in air filtration manufacturing,
another area that needed to be considered for inclusion was nonwovens and the techniques
involved for making them, because air filter media is a major application for nonwoven fabrics.
Although no nonwovens related IPC category was found in the top 50, 18 nonwovens

171
categories were found in the top 500 IPC classification, see Table 4-11 for the most frequently
seen nonwovens related categories (ranked from highest to lowest in number of records).
Table 4-11
Nonwoven related International Patent Classification codes (out of top 500 IPC codes)
Ranking Nonwoven related categories
Descriptions of IPC codes
1 D04H-001/42
characterised by the use of certain kinds of fibres insofar as this use has no preponderant influence on the consolidation of the fleece
2 D04H-003/16
with bonds between thermoplastic filaments produced in association with filament formation, e.g. immediately following extrusion
3 D04H-001/54
by welding together the fibres, e.g. by partially melting or dissolving
4 D04H-013/00
Other non-woven fabrics
5 D04H-003/00
Non woven fabrics formed wholly or mainly of yarns or like filamentary material of substantial length
6 D04H-001/728
by electro-spinning
7 D04H-001/72
the fibres being randomly arranged
8 D04H-001/00
Non-woven fabrics formed wholly or mainly of staple fibres or like relatively short fibres
9 D04H-001/4382
Stretched reticular film fibres; Composite fibres; Mixed fibres; Ultrafine fibres; Fibres for artificial leather
10 D04H-001/46
by needling or like operations to cause entanglement of fibres
11 D04H-003/14
with bonds between thermoplastic yarns or filaments produced by welding
12 D04H-001/559
the fibres being within layered webs
13 D04H-001/56
in association with fibre formation, e.g. immediately following extrusion of staple fibres
14 D04H-001/541
Composite fibres e.g. sheath-core, sea-island or side-by-side; Mixed fibres
15 D04H-001/70
characterised by the method of forming fleeces or layers, e.g. reorientation of fibres
16 D04H-001/58
by applying, incorporating or activating chemical or thermoplastic bonding agents, e.g. adhesives
17 D04H-001/40
from fleeces or layers composed of fibres without existing or potential cohesive properties
18 D04H-003/007
Addition polymers

172
After going through all the IPC categories listed under D04H, other relevant sub-
categories on nonwoven technology processes are included in the search in addition to the ones
mentioned in Table 4-11. The following IPC codes were added into our search queries.
IP=(D04H-001/00 OR D04H-001/04 OR D04H-001/40 OR D04H-001/42 OR D04H-001/4382 OR D04H-001/44 OR D04H-001/46 OR D04H-001/54 OR D04H-001/541 OR D04H-001/559 OR D04H-001/56 OR D04H-001/58 OR D04H-001/70 OR D04H-001/72 OR D04H-001/724 OR D04H-001/728 OR D04H-003/00 OR D04H- 003/002 OR D04H-003/004 OR D04H-003/005 OR D04H-003/007 OR D04H-003/009 OR D04H-003/016 OR D04H-003/14 OR D04H-003/16 OR D04H-005/00 OR D04H-013/00)
4.1.3.2 The Search Queries and the Number of Retrieved Records in DII
The retrieved records in DII are based on the search queries using both keywords and
IPC codes, shown in Table 4-12. The keywords are used to retrieve records that are relevant,
serving the purpose of recall, while the IPC codes limit the retrieved patents to only certain
categories being selected, increasing the precision of the search query set. The search queries
using keywords were the same set used in WOS. Because DII and WOS are both part of
Thomson Reuter’s Web of Science database, they share the same search algorithms.
Table 4-12
Search queries for air filtration in DII Query number
# of records
Query
Core lexical query (Group X) #1 57,823 TS=("air filt*" OR ((HEPA OR "high efficiency particulate
air") and filt*) OR ((ULPA OR "ultra low penetration air") and filt*) OR "air purifier*" OR ("air purifi*" AND filt*) OR ("air cleaner*") OR ("air clean*" AND filt*))
Expanded queries (Group Y) #2 153 TS=("aerosol filter*" OR "aerosol filtration*") #3 5,226 TS=("gas filter*" OR "gas filtration*") #4 418 TS=("fibrous filt*") #5 245 TS=("electret filt*") #6 934 TS=("pleat* filter*" OR "pleat* filtration") #7 402 TS=(“antibacterial filt*” OR “antimicrobial filt*” OR “anti-
bacterial filt*” OR “anti-microbial filt*”)

173
Table 4-12 (continued) #8 344 TS=(("coalesc* filt*") NOT (wastewater OR "waste-water" OR
emulsi* OR liquid-liquid OR query OR track)) #9 1,876 TS=(filt* AND (respirator OR respirators OR "respiratory
device")) #10 748 TS=((HVAC OR "heating, ventilating, and air conditioning")
AND filt*) Expanded queries (Group Z) #11 296 TS=((performance OR "pressure drop" OR "pressure drops" OR
efficiency OR efficacy OR surface OR penetration OR "quality factor" OR flow) AND (medi* OR membrane*) AND ("indoor air" OR airborne) AND filt*)
#12 3,810 TS=((nonwoven* OR non-woven*) AND (air OR airborne) AND filt*)
#13 68,530 #1 OR #2 OR #3 OR #4 OR #5 OR #6 OR #7 OR #8 OR #9 OR #10 OR #11 OR #12
Exclusion Terms Queries #14 >100,000 TS=(Kalman OR tracker OR "target tracking" OR GPS OR
"optical fiber*" OR "photo optical" OR optics OR bandpass OR band-pass OR acoustical OR noise OR resonator OR resonance OR "non-linear filter*" OR "nonlinear filter*" OR "linear filter*" OR communication OR "liquid crystal display" OR LCD OR waveguide OR "personal sampl*" OR effluent* OR sewage)
#15 >100,000 TS=(wastewater* OR "waste-water*" OR "water treatment*" OR "water filt*" OR water-in-oil OR emulsion OR seawater OR sea-water OR saline OR desalination OR stormwater OR "liquid filt*" OR geotextile* OR geo-textile* OR ultrafiltration)
#16 61,915 #13 NOT (#14 OR #15) International Patent Classification codes (for restricting to the relevant records) #17 20,914 IP=(B01D-039/00 OR B01D-039/08 OR B01D-039/14 OR
B01D-039/16 OR B01D-039/18 OR B01D-039/20) #18 32,573 IP=(B01D-046/00 OR B01D-046/02 OR B01D-046/10 B01D-
046/12 OR B01D-046/42 OR B01D-046/48 OR B01D-046/50 OR B01D-046/52 OR B01D-046/54)
#19 26,466 IP=(D04H-001/00 OR D04H-001/04 OR D04H-001/40 OR D04H-001/42 OR D04H-001/4382 OR D04H-001/44 OR D04H-001/46 OR D04H-001/54 OR D04H-001/541 OR D04H-001/559 OR D04H-001/56 OR D04H-001/58 OR D04H-001/70 OR D04H-001/72 OR D04H-001/724 OR D04H-001/728 OR D04H-003/00 OR D04H- 003/002 OR D04H-003/004 OR D04H-003/005 OR D04H-003/007 OR D04H-003/009 OR D04H-003/016 OR D04H-003/14 OR D04H-003/16 OR D04H-005/00 OR D04H-013/00)
#20 12,747 #16 AND (#17 OR #18 OR #19)

174
Based on the citation information provided by DII, patents that were highly cited by
the retrieved patents were checked to make sure they were also included in the search, unless
the time frame was out of the range specified in this research. Fortunately, all of the highly
cited patents were included. After the text file was imported and cleaned in VantagePoint, a
total of 12,746 records were used to perform further data analyses.
4.1.4 Search Queries in ABI/INFORM™ Complete
4.1.4.1 The Process of Finalizing Search Queries in ABI/INFORM™ Complete
The search queries used in the ABI/INFORM™ Complete Database are almost the
same as the ones used in WOS. For testing purpose, air filt* was used to examine the variants
of air filter being captured, and air filter, air filters, and air filtration were all included.
Therefore, this database recognizes the use of wildcards. Moreover, Boolean operators are used
by this database, as the operators were listed on the interface of the search page. Additionally,
the time span of the search and the type of source on the search page can be defined (see Figure
4-2 and Figure 4-3). Using the search field “Anywhere” was compared to using the search field
“Anywhere except full-ALL”. “Anywhere” was chosen as the search field to conduct search
queries within ABI, since “Anywhere except full-ALL” yielded a much smaller amount of
records and omitted a lot of relevant publications in trade journals.
Figure 4-2. Search interface of ABI/INFORM Complete

175
Figure 4-3. Selection of the type of source in ABI/INFORM Complete
The same search queries used in WOS were used in ABI, except one search query
which needed modifications due to the error yielded. The error was suspected to be caused by
the incompatibility of using double wildcards in one phrase. However, the specific reason why
this one original search query could not be run in the ABI database is not known. In WOS, the
search query was
(("coalesc* filt*") NOT (wastewater OR "waste-water" OR emulsi* OR liquid-liquid OR query OR track))
and in ABI, the query was modified into
("coalescing filt*" OR "coalescence filt*" OR "coalescer filt*") NOT (wastewater OR "waste-water" OR emulsi* OR liquid-liquid OR query OR track).
4.1.4.2 The Search Queries and the Number of Retrieved Records in ABI
The many records yielded from this database indicate that there is an abundance of
information on air filtration available from business sources, although the information might
not be viewed as important as ST&I publications due to the lack of valuable R&D and other
technical information (see Table 4-13).

176
Table 4-13 Search queries for air filtration in ABI
Query number
# of records
Query
Core lexical query (Group X) #1 15,274 "air filt*" OR ((HEPA OR "high efficiency particulate air")
and filt*) OR ((ULPA OR "ultra low penetration air") and filt*) OR "air purifier*" OR ("air purifi*" AND filt*) OR ("air cleaner*") OR ("air clean*" AND filt*)
Expanded queries (Group Y) #2 52 "aerosol filter*" OR "aerosol filtration*" #3 602 "gas filter*" OR "gas filtration*" #4 79 "fibrous filt*" #5 16 "electret filt*" #6 1 "pleat* filter*" OR "pleat* filtration" #7 60 “antibacterial filt*” OR “antimicrobial filt*” OR “anti-
bacterial filt*” OR “anti-microbial filt*” #8 234 ("coalescing filt*" OR "coalescence filt*" OR "coalescer
filt*") NOT (wastewater OR "waste-water" OR emulsi* OR liquid-liquid OR query OR track)
#9 1,247 filt* AND (respirator OR respirators OR "respiratory device") #10 7,403 (HVAC OR "heating, ventilating, and air conditioning") AND
filt* Expanded queries (Group Z) #11 3,892 (performance OR "pressure drop" OR "pressure drops" OR
efficiency OR efficacy OR surface OR penetration OR "quality factor" OR flow) AND (medi* OR membrane*) AND ("indoor air" OR airborne) AND filt*
#12 958 (nonwoven* OR non-woven*) AND (air OR airborne) AND filt*
#13 23,493 #1 OR #2 OR #3 OR #4 OR #5 OR #6 OR #7 OR #8 OR #9 OR #10 OR #11 OR #12
Exclusion terms queries #14 4,869,509 Kalman OR tracker OR "target tracking" OR GPS OR "optical
fiber*" OR "photo optical" OR optics OR bandpass OR band-pass OR acoustical OR noise OR resonator OR resonance OR "non-linear filter*" OR "nonlinear filter*" OR "linear filter*" OR communication OR "liquid crystal display" OR LCD OR waveguide OR "personal sampl*" OR effluent* OR sewage
#15 157,472 wastewater* OR "waste-water*" OR "water treatment*" OR "water filt*" OR water-in-oil OR emulsion OR seawater OR sea-water OR saline OR desalination OR stormwater OR "liquid filt*" OR geotextile* OR geo-textile* OR ultrafiltration
#16 13,323 #13 NOT (#14 OR #15)

177
4.2 Search Queries and Results for Selected Nonwoven Technologies for Filter Media
Manufacturing
After the initial set of searches using air filtration related keywords was performed,
there was one type of technology that stood out. Electrospinning appeared to be the most
frequently seen key term that was associated with the technology used for air filtration based
on the air filtration seed query: air filter* OR air filtration*. Electrospinning has been discussed
previously in Chapter 2, and the reason for its popularity is rooted in the size of the fiber
diameters being produced. Electrospinning is mainly used to produce nanofibers, which is part
of nanotechnology. Nanofibers surfaced as a top candidate term from the air filtration seed
query. Nanofibers are considered to be part of the nanostructure chemistry and materials field
(Porter et al., 2008), and they are also an emerging technology that can be incorporated into
air filtration applications. Nanotechnologies have been studied from a technology management
perspective using tech mining in the past decade (Kostoff et al, 2006; Porter et al., 2008).
However, the use of nanofibers or the making of nanofibers has not yet been explored from
the technology management perspective. Hence, a top-down approach, with an emphasis on
the particular use of nanofibers and any type of technology that can produce nanofibers and
ultrafine fibers in the nonwovens area, has been adopted to conduct another set of searches to
retrieve and identify more interesting and novel information associated with nanofibers.
Meanwhile, most of the nonwoven air filtration media in the market comprises micro and/or
submicron fibers. Thus, the technologies associated with making micro, and submicron fibers
are included in our study as well.
178
4.2.1 Search Queries in WOS
4.2.1.1 The Iterative Process of Finalizing Search Queries in WOS
The query formulation process on nonwoven technologies is similar to the one on air
filtration, but less fuzzy because nonwoven technologies are more technical. Based on the
literature review in Chapter 2, several methods for producing nano, submicron, and microfibers
were all included in the search queries. Moreover, the keywords used in other Tech Mining
based nanotechnology studies (Alencar et al., 2007; Kostoff, et al., 2006; Porter et al., 2008)
were reviewed. The same group of experts were asked for their feedback on the relevance of
the search terms, using a survey that asked participants to rate terms on a Likert scale.
Since nanofilters were used as one of the terms for Alencar et al.’s (2007) study on nanopatents,
whether to include nanofiltration as a keyword in this study took some consideration and
evaluation. According to Sutherland (2011), nanofiltration is a membrane process that can
separate molecular species from solution, and the separation capability is between that of
ultrafiltration and reverse osmosis (Sutherland, 2011). Consequently, nanofiltration was not
included because it refers to liquid filtration and does not require incorporating nanoscale
materials.
The same process used in the air filtration search query formulation was also utilized
here. TFIDF calculations based on the nanofiber seed query (TS=(TOPIC: ("nano-fiber*" OR
"nano-fibre*" OR nanofiber* or nanofibre*)) revealed the top candidate terms, and the final
search terms were identified using Hit Ratio and Noise Ratio tests. The difference between the
nanofiber search and the air filtration search is that the first round of Hit Ratio and Noise Ratio
tests used in the nanofiber search were able to identify and eliminate non-relevant terms

179
because the majority of key terms are more technically oriented and used exclusively in
nanotechnology. The details of this process are not repeated here.
4.2.1.2 The Search Queries and the Number of Retrieved Records in WOS
The nonwoven technology search queries are shown in Table 4-14, with the number of
records retrieved from each search query. Compared to air filtration, nonwoven technology has
a lot more research and development activities based on the higher number of retrieved records.
Table 4-14 Search queries for nanofibers and other nonwoven technologies in WOS Query number
# of records
Query
Core lexical query (Group X) #1 38,146 TS=(nanofiber* OR nanofibre* OR "nano-fiber*" OR "nano-fibre*" OR
nanofibrous OR "nano-fibrous" OR nanofibril OR nanofibrils OR "nano-fibril" OR "nano-fibrils")
Expanded query (Group Y) #2 5,155 TS=((nm OR nanometer* OR "nano-meter*" OR nanometre* OR "nano-
metre*" OR nanoscale OR nanoscaled OR nano-scale OR nano-scaled OR nanosize OR nanosized OR nano-size OR nano-sized OR nano) NEAR/2 (fiber* OR fibre*))
#3 305 TS=((ultrafine OR "ultra-fine" OR ultrathin OR "ultra-thin") NEAR/2 (fiber* OR fibre*) AND (nm OR nanometer* OR "nano-meter*" OR nanometre* OR "nano-metre*" OR nanoscale OR nanoscaled OR nano-scale OR nano-scaled OR nanosize OR nanosized OR nano-size OR nano-sized OR nano))
#4 491 TS= ((submicro OR submicron OR "sub-micro" OR "sub-micron" OR submicrometer OR "sub-micrometer" OR "sub-micro-meter") NEAR/2 (fiber* OR fibre*))
Expanded query (Group Z) #5 30,593 TS=(((electrosp?n* OR "electro-sp?n*" OR "electrostatic*-sp?n*" OR
meltblow* OR "melt-blow*" OR "centrifug* sp?n*" OR Forcesp?n* OR "rotary sp?n*" OR "rotary jet sp?n*" OR "flash sp?n*" OR "solution-blow*" OR "template synthesis" OR "templating synthesis" OR "phase separation" OR phase-separation OR "self assembl*" OR self-assembl* OR "bi-component*" OR bicomponent* OR "multi-component*" OR multicomponent* OR "bi-constituent" OR biconstituent OR "conjugate spinning*" OR "island*-in-the-sea" OR "sea*-island*" OR "segmented pie" OR "sheath-core" OR "core-sheath" OR sacrificial) AND (fiber OR fibers OR fibre OR fibres)) OR "splittable fiber*" OR "splittable fibre*" OR "hollow fiber*" OR "hollow fibre*")
#6 235,026 TS=(nanotube* OR nanowire*) #7 283,348 #1 OR #2 OR #3 OR #4 OR #5 OR #6

180
4.2.2 Search Queries in EV
4.2.2.1 The Process of Finalizing Search Queries in EV
Similar to the process of retrieving publications on air filtration, modifications were
applied to the search queries used in EV before conducting data retrieval. The rule of thumb is
to follow the search algorithms that work with the search engine. Recall that the NEAR/x
operator does not work in the same way in EV and WOS. In EV, NEAR/x can only be paired
with individual phrases or words, but this operator does not work with clusters of phrases or
words.
4.2.2.2 The Search Queries and the Number of Retrieved Records in EV
The detailed queries and the number of records yielded from the queries are listed in
Table 4-15. The searches conducted in EV yielded the largest number of records on nonwoven
technologies used for air filtration media manufacturing compared to WOS, DII, and ABI, in
spite of duplicates in Compendex and Inspec. The higher number of retrieved records from EV
indicated that there are more R&D activities in the applied science fields, such as engineering,
than in fundamental science. The reason behind this is that both air filtration and nonwoven
technologies, including nanofibers, are application based research areas.

181
Table 4-15 Search queries for nonwoven technologies in EV

182
Table 4-15 (continued)
4.2.3 Search Queries in DII
4.2.3.1 The Process of Finalizing Search Queries in DII
By conducting the nanofiber seed query, over 8000 records were retrieved from the
Derwent Innovation Index (time span: 1990-2015). The top 50 IPC codes are listed in Table
4-16 from the highest percentage to the lowest, and several IPC main categories appear quite
often on the top 50 list.

183
Table 4-16 Top 50 IPC based on nanofiber seed query TOPIC: ("nano-fiber*" OR "nano-fibre*" OR nanofiber* or nanofibre*) IPC codes records % of 8178 D01D-005/00 1354 16.56% Formation of filaments, threads, or the like D04H-001/728 730 8.93% by electro-spinning C01B-031/02 556 6.80% Preparation of carbon (by using ultra-high pressure, e.g.
for the formation of diamonds, B01J 3/06; by crystal growth C30B); Purification
B82B-003/00 521 6.37% Manufacture or treatment of nano-structures by manipulation of individual atoms or molecules, or limited collections of atoms or molecules as discrete units
B82Y-040/00 441 5.39% Manufacture or treatment of nano-structures B82Y-030/00 418 5.11% Nano-technology for materials or surface science, e.g.
nano-composites D01F-001/10 355 4.34% General methods for the manufacture of man-made
filaments or the like D01D-005/04 341 4.17% Dry spinning methods D04H-001/72 293 3.58% the fibres being randomly arranged B82B-001/00 291 3.56% Nano-structures formed by manipulation of individual
atoms or molecules, or limited collections of atoms or molecules as discrete units
C08K-003/04 236 2.89% Carbon (under C08K 3/00 Use of inorganic ingredients) D01D-001/02 235 2.87% Preparation of spinning solutions D04H-001/4382
222 2.72% Stretched reticular film fibres; Composite fibres; Mixed fibres; Ultrafine fibres; Fibres for artificial leather
D01F-009/12 217 2.65% Carbon filaments; Apparatus specially adapted for the manufacture thereof
B01D-039/16 205 2.51% of organic material, e.g. synthetic fibres C01B-031/00 188 2.30% Carbon; Compounds thereof D04H-001/42 187 2.29% characterised by the use of certain kinds of fibres insofar
as this use has no preponderant influence on the consolidation of the fleece
D01F-009/08 177 2.16% of inorganic material (working or processing of metal wire B21F; from softened glass, minerals, or slags C03B 37/00; incandescent bodies F21H, H01K 1/02, H01K 3/02)
C08K-007/06 172 2.10% Elements D01F-009/127 165 2.02% by thermal decomposition of hydrocarbon gases or
vapours H01M-002/16 164 2.01% characterised by the material D01D-005/08 151 1.85% Melt-spinning methods D04H-001/70 136 1.66% characterised by the method of forming fleeces or layers,
e.g. reorientation of fibres C08L-101/00 131 1.60% Compositions of unspecified macromolecular compounds

184
Table 4-16 (continued) D04H-003/16 129 1.58% with bonds between thermoplastic filaments produced in
association with filament formation, e.g. immediately following extrusion
H01M-004/62 128 1.57% Selection of inactive substances as ingredients for active masses, e.g. binders, fillers
B29C-047/00 125 1.53% Extrusion moulding, i.e. expressing the moulding material through a die or nozzle which imparts the desired form; Apparatus therefor
B32B-005/26 125 1.53% another layer also being fibrous or filamentary H01M-008/10 123 1.50% Fuel cells with solid electrolytes D04H-013/00 117 1.43% Other non-woven fabrics B32B-005/02 116 1.42% characterised by structural features of a layer comprising
fibres or filaments H01M-004/36 111 1.36% Selection of substances as active materials, active masses,
active liquids H01M-004/58 104 1.27% of inorganic compounds other than oxides or hydroxides,
e.g. sulfides, selenides, tellurides, halogenides or LiCoFy; of polyanionic structures, e.g. phosphates, silicates or borates
H01M-008/02 104 1.27% Details D01F-006/00 100 1.22% Monocomponent man-made filaments or the like of
synthetic polymers; Manufacture thereof H01M-004/86 98 1.20% Inert electrodes with catalytic activity, e.g. for fuel cells H01M-004/88 97 1.19% Processes of manufacture B32B-027/12 94 1.15% next to a fibrous or filamentary layer D01D-013/00 93 1.14% Complete machines for producing man-made threads A61K-009/70 92 1.13% Web, sheet or filament bases B01D-069/12 92 1.13% Composite membranes; Ultra-thin membranes B01D-039/14 91 1.11% Other self-supporting filtering material C08J-005/04 91 1.11% Reinforcing macromolecular compounds with loose or
coherent fibrous material B01J-035/06 90 1.10% Fabrics or filaments H01M-004/38 90 1.10% of elements or alloys C08J-005/18 88 1.08% Manufacture of films or sheets D01D-004/00 87 1.06% Spinnerette packs; Cleaning thereof (D01D 5/24, D01D
5/253, D01D 5/28 take precedence) H01M-004/02 86 1.05% Electrodes composed of, or comprising, active material C08K-003/00 83 1.02% Use of inorganic ingredients D06M-011/00 82 1.00% Treating fibres, threads, yarns, fabrics or fibrous goods
made from such materials, with inorganic substances or complexes thereof; Such treatment combined with mechanical treatment, e.g. mercerising

185
Some observations based on the results are summarized. Nanofibers, as part of
nanotechnology, are listed under the main International Patent Classification code of
nanotechnology B82, however they do not have a dedicated category for themselves. Based on
the results from the nanofiber seed query, B82B 03/00 is one of the top patent classifications,
and it is under B82B Nano-structures formed by manipulation of individual atoms, molecules,
or limited collections of atoms or molecules as discrete units; manufacture or treatment thereof.
Another nanotechnology related category, B82Y Specific uses or applications of nano-
structures; measurement or analysis of nano-structures; manufacture or treatment of nano-
structures also shows up as the top category.
Besides nanotechnology related classifications, there are nonwoven related
classification codes listed among the top 50 IPC codes, such as D04H 1/728, D04H 1/72 and
a few other D04H sub-categories. Fiber formation related classifications are also among the
top 50 IPC, such as D01D 5/00 and D01D 5/04. They confirm that, other than electrospinning,
other nonwoven processes (i.e. bicomponent, meltblowing) should be included as part of the
nonwoven technology search. A few other top categories are carbon filament manufacturing
process involved D01F; materials related classifications C01B and C08K, as well as layered
structure related classifications B32B. Moreover, three sub-categories under B01D Separation
(two are under B01D 39/00 filtering material, B01D 39/16 and B01D 39/14, and one named
B01D 69/12 Composite membranes; Ultra-thin membranes) are also included, indicating
filtration and separation is a large application for nano and ultrafine fibers. Subcategories under
H01M Process or means, e.g. batteries, for the direct conversion of chemical energy into
electrical energy are also often seen on the top 100 list, and it marks another application area
for nano and ultrafine fibers.

186
The classification codes included for DII searches are the ones related to
nanotechnology (for obvious reason), nonwovens (related to our study), and fiber formation
focused categories. By using the set of search queries engaging only keywords (the same search
queries used in WOS) and limiting the retrieved records to only relevant IPC codes, the results
from DII should be able to capture a decent picture of patent activities on nonwovens.
4.2.3.2 The Search Queries and the Number of Retrieved Records in DII
The search queries used in DII are listed in Table 4-17.
Table 4-17
Search queries for nonwoven technologies in DII Query number
# of records
Query
Core lexical query (Group X) #1 8,411 TS=(nanofiber* OR nanofibre* OR "nano-fiber*" OR "nano-fibre*"
OR nanofibrous OR "nano-fibrous" OR nanofibril OR nanofibrils OR "nano-fibril" OR "nano-fibrils")
Expanded query (Group Y) #2 10,212 TS=((nm OR nanometer* OR "nano-meter*" OR nanometre* OR
"nano-metre*" OR nanoscale OR nanoscaled OR nano-scale OR nano-scaled OR nanosize OR nanosized OR nano-size OR nano-sized OR nano) NEAR/2 (fiber* OR fibre*))
#3 191 TS=((ultrafine OR "ultra-fine" OR ultrathin OR "ultra-thin") NEAR/2 (fiber* OR fibre*) AND (nm OR nanometer* OR "nano-meter*" OR nanometre* OR "nano-metre*" OR nanoscale OR nanoscaled OR nano-scale OR nano-scaled OR nanosize OR nanosized OR nano-size OR nano-sized OR nano))
#4 177 TS= ((submicro OR submicron OR "sub-micro" OR "sub-micron" OR submicrometer OR "sub-micrometer" OR "sub-micro-meter") NEAR/2 (fiber* OR fibre*))
#5 23,400 TS=(((electrosp?n* OR "electro-sp?n*" OR "electrostatic*-sp?n*" OR meltblow* OR "melt-blow*" OR "centrifug* sp?n*" OR Forcesp?n* OR "rotary sp?n*" OR "rotary jet sp?n*" OR "flash sp?n*" OR "solution-blow*" OR "template synthesis" OR "templating synthesis" OR "phase separation" OR phase-separation OR "self assembl*" OR self-assembl* OR "bi-component*" OR bicomponent* OR "multi-component*" OR multicomponent* OR "bi-constituent" OR biconstituent OR "conjugate spinning*" OR "island*-in-the-sea" OR "sea*-island*" OR "segmented pie" OR "sheath-core" OR "core-sheath" OR sacrificial) AND (fiber OR fibers OR fibre OR fibres)) OR "splittable fiber*" OR "splittable fibre*" OR "hollow fiber*" OR "hollow fibre*")

187
Table 4-17 (continued) #6 30,795 TS=(nanotube* OR nanowire*) #7 68,088 #1 OR #2 OR #3 OR #4 OR #5 OR #6 International Patent Classification codes (for restricting to the relevant records) #8 31,794 IP=(B82B-001/00 OR B82B-003/00 OR B82Y-30/00 OR B82Y-
040/00) #9 26,466 IP=(D04H-001/00 OR D04H-001/04 OR D04H-001/40 OR D04H-
001/42 OR D04H-001/4382 OR D04H-001/44 OR D04H-001/46 OR D04H-001/54 OR D04H-001/541 OR D04H-001/559 OR D04H-001/56 OR D04H-001/58 OR D04H-001/70 OR D04H-001/72 OR D04H-001/724 OR D04H-001/728 OR D04H-003/00 OR D04H- 003/002 OR D04H-003/004 OR D04H-003/005 OR D04H-003/007 OR D04H-003/009 OR D04H-003/016 OR D04H-003/14 OR D04H-003/16 OR D04H-005/00 OR D04H-013/00)
#10 28,114 IP=(D01D-001/00 OR D01D-001/02 OR D01D-005/00 OR D01D-005/04 OR D01D-005/08 OR D01F-001/10 OR D01F-006/00 OR D01F-006/92 OR D01F-008/00 OR D01F-008/04 OR D01F-008/10 OR D01F-008/16 OR D01F-008/18 OR D01F-009/00 OR D01F-009/08 OR D01F-009/10 OR D01F-009/12 OR D01F-009/127 OR D01F-009/14 OR D01F-009/22 OR D01F-011/00 OR D01F-011/04)
#11 16,865 #7 AND (#8 OR #9 OR #10)
4.2.4 Search Queries in ABI/INFORMTM Complete
4.2.4.1 The Process of Finalizing Search Queries in ABI
As mentioned in the search process for air filtration, the search algorithms behind ABI
are quite similar to WOS because they both adopt the use of wildcards in search queries. The
exact same set of search queries were used in ABI as in WOS, however the search field used
was different. The search field was “Anywhere” in ABI, while the search field was limited
only to “Topic” in WOS.
4.2.4.2 The Search Queries and the Number of Retrieved Records in ABI
The number of retrieved records is much smaller from this database than the records
yielded from WOS and EV on the topic of nonwoven technologies, as shown in Table 4-18.

188
Table 4-18 Search queries for nonwoven technologies in ABI Query number
# of records
Query
Core lexical query (Group X) #1 4,621 nanofiber* OR nanofibre* OR "nano-fiber*" OR "nano-fibre*"
OR nanofibrous OR "nano-fibrous" OR nanofibril OR nanofibrils OR "nano-fibril" OR "nano-fibrils"
Expanded query (Group Y) #2 1,151 (nm OR nanometer* OR "nano-meter*" OR nanometre* OR
"nano-metre*" OR nanoscale OR nanoscaled OR nano-scale OR nano-scaled OR nanosize OR nanosized OR nano-size OR nano-sized OR nano) NEAR/2 (fiber* OR fibre*)
#3 69 (ultrafine OR "ultra-fine" OR ultrathin OR "ultra-thin") NEAR/2 (fiber* OR fibre*) AND (nm OR nanometer* OR "nano-meter*" OR nanometre* OR "nano-metre*" OR nanoscale OR nanoscaled OR nano-scale OR nano-scaled OR nanosize OR nanosized OR nano-size OR nano-sized OR nano)
#4 99 (submicro OR submicron OR "sub-micro" OR "sub-micron" OR submicrometer OR "sub-micrometer" OR "sub-micro-meter") NEAR/2 (fiber* OR fibre*)
Expanded query (Group Z) #5 6,257 ((electrosp?n* OR "electro-sp?n*" OR "electrostatic*-sp?n*" OR
meltblow* OR "melt-blow*" OR "centrifug* sp?n*" OR Forcesp?n* OR "rotary sp?n*" OR "rotary jet sp?n*" OR "flash sp?n*" OR "solution-blow*" OR "template synthesis" OR "templating synthesis" OR "phase separation" OR phase-separation OR "self assembl*" OR self-assembl* OR "bi-component*" OR bicomponent* OR "multi-component*" OR multicomponent* OR "bi-constituent" OR biconstituent OR "conjugate spinning*" OR "island*-in-the-sea" OR "sea*-island*" OR "segmented pie" OR "sheath-core" OR "core-sheath" OR sacrificial) AND (fiber OR fibers OR fibre OR fibres)) OR "splittable fiber*" OR "splittable fibre*" OR "hollow fiber*" OR "hollow fibre*"
#6 23,349 nanotube* OR nanowire* #7 32,745 #1 OR #2 OR #3 OR #4 OR #5 OR #6 OR #7
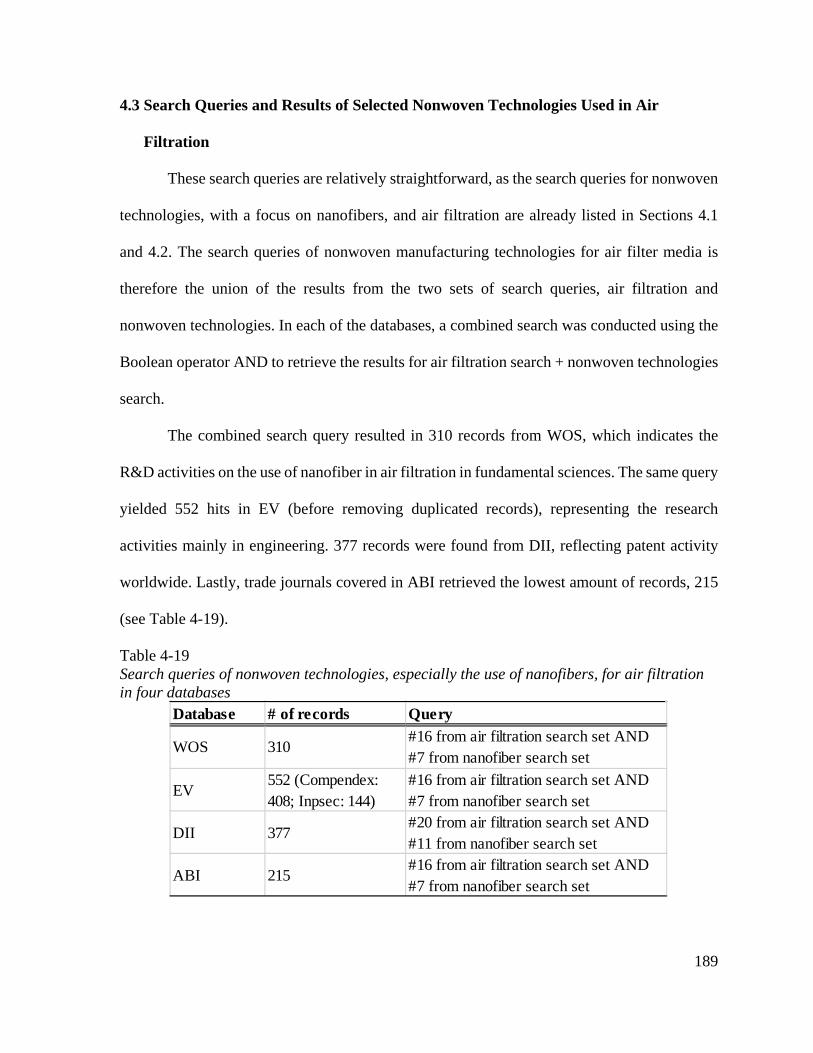
189
4.3 Search Queries and Results of Selected Nonwoven Technologies Used in Air
Filtration
These search queries are relatively straightforward, as the search queries for nonwoven
technologies, with a focus on nanofibers, and air filtration are already listed in Sections 4.1
and 4.2. The search queries of nonwoven manufacturing technologies for air filter media is
therefore the union of the results from the two sets of search queries, air filtration and
nonwoven technologies. In each of the databases, a combined search was conducted using the
Boolean operator AND to retrieve the results for air filtration search + nonwoven technologies
search.
The combined search query resulted in 310 records from WOS, which indicates the
R&D activities on the use of nanofiber in air filtration in fundamental sciences. The same query
yielded 552 hits in EV (before removing duplicated records), representing the research
activities mainly in engineering. 377 records were found from DII, reflecting patent activity
worldwide. Lastly, trade journals covered in ABI retrieved the lowest amount of records, 215
(see Table 4-19).
Table 4-19 Search queries of nonwoven technologies, especially the use of nanofibers, for air filtration in four databases
Database # of records Query
WOS 310#16 from air filtration search set AND #7 from nanofiber search set
EV552 (Compendex: 408; Inpsec: 144)
#16 from air filtration search set AND #7 from nanofiber search set
DII 377#20 from air filtration search set AND #11 from nanofiber search set
ABI 215#16 from air filtration search set AND #7 from nanofiber search set

190
4.4 Summary
This chapter reviewed the search approaches and conducted search query formulation
via a series of iterative steps. The final sets of queries and results from different databases were
explained in this section, and the next chapter will discuss the results.

191
CHAPTER 5 Data Analysis and Results
5.1 Preliminary Search Query and Analysis of Results
To further justify the selection of databases and to distinguish the focuses of WOS and EV, a
single sample search query was conducted in both databases. The example search query was a
very simple query. The goal was to identify the differences in results yielded from WOS and
EV databases, and to explain the choice of databases and their algorithms. The example search
query for WOS and EV is shown in Table 5-1. It is formulated to examine the use of nanofibers
in air filtration applications. Apparently, from the difference in the number of records retrieved,
differences among results in other areas are expected.
5.1.1 The Sample Search Query
Table 5-1 Sample search queries in WOS and EV (from 1990 to 2015)
Number of Records
Retrieved
Database
Search query
92 WOS TS=((nanofiber* OR nanofibre* OR "nano-fiber*" OR "nano-fibre*") AND ("air filter*" OR "air filtration*"))
112
EV
((nanofiber OR nanofibers OR nanofibre OR nanofibres OR "nano-fiber" OR "nano-fibers" OR "nano-fibre" OR "nano-fibres") AND ("air filter" OR "air filters" OR "air filtering" OR "air filtration" OR "air filtrations")) WN KY
5.1.2 Preprocessing
The data cleanup process involved removing duplicated and irrelevant records from
each database, and deleting other document types such as book chapters, dissertations, and
editorial summaries, so that only journal articles and conference proceeding papers were left.
After data cleaning, 86 and 95 records from WOS and EV remained, respectively.

192
There were 49 records that could be found in both the databases. After combining the
records retrieved from the two databases, the total amount of records retrieved was 129 (49
records found in two databases, 80 records found in only one database). A more detailed
comparison between WOS and EV is presented in the next section.
5.1.3 Comparison
By comparing the two datasets retrieved from WOS and EV, the results in Figure 5-1
indicated that WOS has had a slower average compound annual growth rate (CAGR) overall,
26.69% per year from 2002 until 2014, and EV has had an average CAGR of 49.67% during
the same time frame. Fewer than 10 records were retrieved from both EV and WOS each year
until 2014 and 2013. Moreover, the records from each year have been steadily increasing in
WOS, except for a small decline from 2007 to 2008. On the other hand, EV displayed a less
steady growth from each previous year, showing a few more decreases and increases over the
years (2004, 2006, 2008, and 2011).
Figure 5-1. Retrieved volume vs. publication years from WOS (top) and EV (bottom)
0
50
100
0
10
20
30
1999 2000 2001 2002 2003 2004 2005 2006 2007 2008 2009 2010 2011 2012 2013 2014 2015
Num
ber o
f Pu
blic
atio
ns
Publication Years# Records/year Cumulative Records
0
50
100
0
10
20
1999 2000 2001 2002 2003 2004 2005 2006 2007 2008 2009 2010 2011 2012 2013 2014 2015
Num
ber o
f Pu
blic
atio
ns
Publication Years# Records/year Cumulative Records

193
Among the retrieved collection of data, the first record that utilized nanofiber in air
filtration did not appear until 1999 in WOS (only one record in WOS, then the second record
in 2002, and the third record in 2004, followed by continuous growth to 24 records in 2015).
In EV, the oldest record was from 2002 (there was only one record in 2002 and 14 records in
2015). After 2002, there was a faster growing trend for both WOS and EV.
Figure 5-2 shows the countries with two or more publications from the records retrieved
from WOS and EV. The top two countries switch positions due to the difference in coverage
of the two databases. Out of the top countries lists, nine are listed in both sources (Egypt,
China, Czech Republic, South Korea, Poland, Saudi Arabia, Singapore, Turkey, USA).
Figure 5-2. Countries with 2 or more publications from WOS (top) and EV (bottom)
35
20
9 6 6 5 4 4 3 2 2
2825
7 6 5 5 5 4 3 3 3 2 2 2

194
Table 5-2 and Table 5-3 list the top affiliations from the query, and there are 12 and 13
organizations with 3 or more publications from WOS and EV, respectively. Though the
number of hits retrieved are slightly different, Donghua University in China is the top
university in terms of the publication volume in both WOS and EV, followed by King Saud
University in Saudi Arabia. One major difference is that two companies, Donaldson and
Elmarco, are included in the list from EV, but the list from WOS only include universities.
Eight organizations are seen on the both lists from WOS and EV (marked bold). Out of the
eight organizations, three are from China (Donghua University, Hong Kong Polytechnic
University, and Tianjin Polytechnic University), one from the U.S., one from Saudi Arabia,
one from Egypt, one from Turkey, and one from Singapore; which shows a global presence.
Table 5-2 Top affiliations from WOS
# Records Top Affiliations (3 or more publications) 12 Donghua Univ, Shanghai, China 6 King Saud Univ, Riyadh, Saudi Arabia 4 Chonbuk Natl Univ, Jeonju, South Korea 4 Cornell Univ, Ithaca, USA 4 Hong Kong Polytech Univ, Hong Kong, China 4 Tanta Univ, Tanta, Egypt 3 Bilkent Univ, Ankara, Turkey 3 N Carolina State Univ, Raleigh, USA 3 Natl Univ Singapore, Singapore, Singapore 3 Tianjin Polytech Univ, Tianjin, China 3 Tomas Bata Univ Zlin, Zlin, Czech Republic 3 Tsinghua Univ, Beijing, China
Table 5-3 Top affiliations from EV
# Records Top Affiliations (3 or more publications) 10 Donghua Univ, Shanghai, China 6 King Saud Univ, Riyadh, Saudi Arabia 5 Cornell Univ, Ithaca, USA 4 Bilkent Univ, Ankara, Turkey

195
Table 5-3 (continued) 4 Hong Kong Polytech Univ, Hong Kong, China 4 Natl Univ Singapore, Singapore, Singapore 3 Donaldson Co Inc, Minneapolis, USA 3 Elmarco S.r.o., Liberec, Czech Republic 3 Guangdong Univ of Tech, Guangzhou, China 3 Politecnico di Torino, Torino, Italy 3 Tanta Univ, Tanta, Egypt 3 Technical Univ of Liberec, Liberec, Czech Republic 3 Tianjin Polytech Univ, Tianjin, China
The leading authors with 3 or more publications from WOS and EV are compiled in
Table 5-4 and Table 5-5, resulting in 16 authors and 21 authors, respectively. Most of the
leading authors are affiliated with the top organizations. By comparing the leading authors
from WOS and EV, 11 authors are listed on both sources (marked bold), and the top 3 from
each list are the same, though the number of records corresponding to them are not the same.
Table 5-4 Leading authors with 3 or more publications from WOS (1990-2015)
# Records Authors 11 Ding, Bin 8 Yu, Jianyong 6 Al-Deyab, Salem S 6 Wang, Na 4 El-Newehy, Mohamed 4 Hung, Chi-Ho 4 Leung, Wallace Woon-Fong 4 Sun, Gang 3 Kim, Cheol Sang 3 Kimmer, Dusan 3 Ramakrishna, Seeram 3 Sambaer, Wannes 3 Sundarrajan, Subramanian 3 Uyar, Tamer 3 Wang, Han 3 Zatloukal, Martin
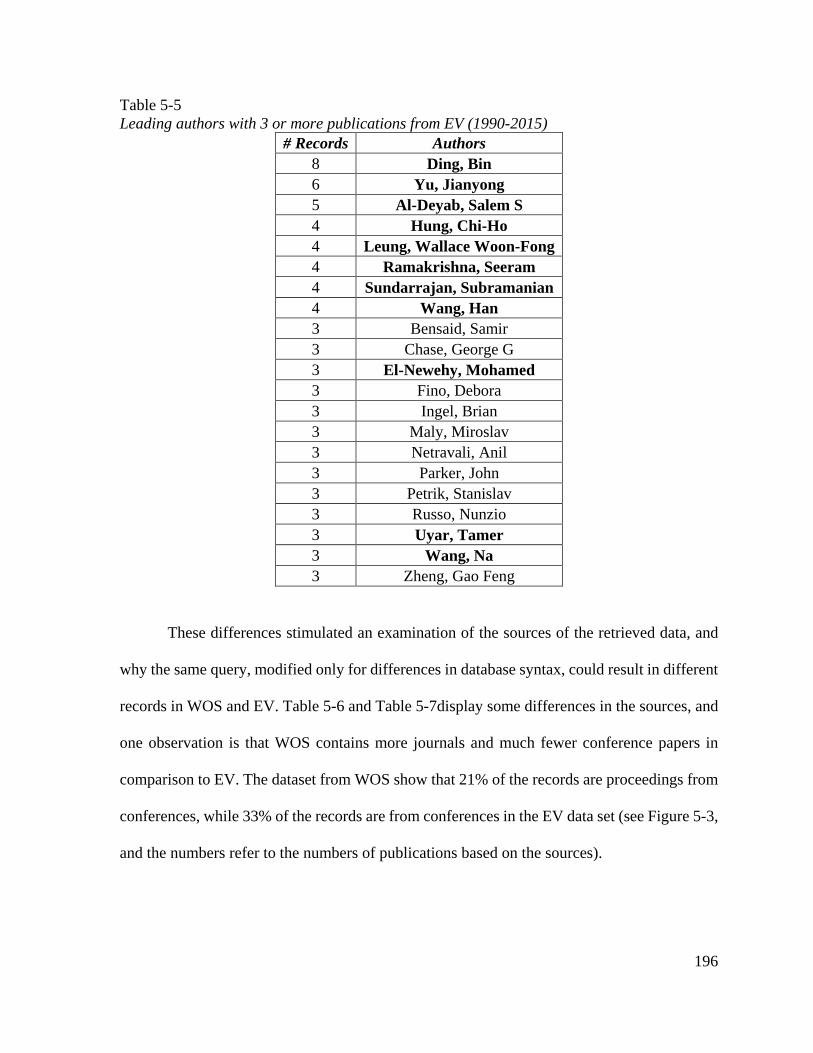
196
Table 5-5 Leading authors with 3 or more publications from EV (1990-2015)
# Records Authors 8 Ding, Bin 6 Yu, Jianyong 5 Al-Deyab, Salem S 4 Hung, Chi-Ho 4 Leung, Wallace Woon-Fong 4 Ramakrishna, Seeram 4 Sundarrajan, Subramanian 4 Wang, Han 3 Bensaid, Samir 3 Chase, George G 3 El-Newehy, Mohamed 3 Fino, Debora 3 Ingel, Brian 3 Maly, Miroslav 3 Netravali, Anil 3 Parker, John 3 Petrik, Stanislav 3 Russo, Nunzio 3 Uyar, Tamer 3 Wang, Na 3 Zheng, Gao Feng
These differences stimulated an examination of the sources of the retrieved data, and
why the same query, modified only for differences in database syntax, could result in different
records in WOS and EV. Table 5-6 and Table 5-7display some differences in the sources, and
one observation is that WOS contains more journals and much fewer conference papers in
comparison to EV. The dataset from WOS show that 21% of the records are proceedings from
conferences, while 33% of the records are from conferences in the EV data set (see Figure 5-3,
and the numbers refer to the numbers of publications based on the sources).

197
Table 5-6 Sources with 2 or more publications in WOS (1990-2015)
# Records Source 8 Separation and Purification Technology 5 Journal of Colloid and Interface Science 3 Journal of Engineered Fibers and Fabrics 3 Journal of Nanoscience and Nanotechnology 3 Polymer 3 RSC Advances 2 ACS Applied Materials & Interfaces 2 Acta Polymerica Sinica 2 Digest Journal of Nanomaterials and Biostructures 2 Fibers and Polymers 2 Journal of Materials Chemistry A 2 Journal of Membrane Science 2 Journal of Nanomaterials 2 Polymer Engineering and Science
Table 5-7 Sources with 2 or more publications in EV (1990-2015)
# Records Source 8 Separation and Purification Technology 3 Journal of Membrane Science 3 Journal of Nanoscience and Nanotechnology 2 Advanced Materials Research
2 American Filtration and Separations Society Fall Conference 2014 - Next Generation Filter Media Conference: Embracing Future Challenges
2 Chemical Engineering Journal 2 Fibers and Polymers 2 Filtration and Separation 2 Journal of Colloid and Interface Science 2 Journal of Materials Chemistry A 2 Journal of Nanomaterials 2 Key Engineering Materials 2 Polymer Engineering and Science 2 RSC Advances

198
Figure 5-3. Comparison in document types in WOS (top) and EV (bottom)
As suggested by previous studies (Porter & Cunningham, 2005), different databases
cover different Science and Technology (S&T) publications. When further comparing the
sources, another reason for the differences is that different databases not only cover different
journals and conference proceedings, but also they sometimes cover different timespans for
the same journal. More importantly, different databases have different algorithms, different
ranking systems, different indexing methods, and different search criteria, which all contribute
to the differences in the results.

199
For comparing WOS and EV particularly, other previous studies have mentioned
differences in search results from those two databases, and their explanation was that WOS
places more focus on fundamental science, while EV emphasizes more on applied science.
Consequently, the best option for our study is to include both WOS and EV as our sources on
S&T information by acknowledging the different results from these two databases.
5.2 Research Profiling on the State of the Art of Air Filtration
5.2.1 Research Activity Trend Analyses
The trends from a variety of databases are covered in this section, and the differences
in trends are compared across databases.
5.2.1.1 Analysis of Results from WOS
The overall publications on air filtration by year retrieved from WOS are shown in
Figure 5-4. The growth over the past two decades is mostly steady, except for a few small
drops. The publication volume increased from 34 records in 1990 to 320 in 2014. The CAGR
for the annual publications in WOS is 13.88% from 1990 to 2014 (2015 was not included due
to time lag for publications to be indexed into the database), and the biggest increase was
155.88% from 1990 to 1991, while the biggest decrease was 27.49% from 1999 to 2000.
Figure 5-4. Air filtration publications in WOS
0
1000
2000
3000
4000
5000
050
100150200250300350
1990 1992 1994 1996 1998 2000 2002 2004 2006 2008 2010 2012 2014
Num
ber o
f Pub
licat
ions
Publication Years# Records Cumulative Records

200
5.2.1.2 Analysis of Results from EV
The overall trend for air filtration publications in EV has more ups and downs (see
Figure 5-5). The two biggest decreases occurred from 1994 to 1995 and from 2009 to 2010,
and the publication decreased 31.03% and 28.96% from the previous years, respectively. The
two biggest increases took place from 2008 to 2009 and from 1995 to 1996, and the growth
rates were 78.11% and 76.43%, respectively. The CAGR of the publications from 1990 to 2014
retrieved from EV is a bit lower than WOS, at 11.47%. However, the volume of total number
of publications was higher in EV than WOS.
The trend in Figure 5-5 shows the publications in EV started from 100 records in 1990
and grew to 592 records in 2014. 2009 was the most productive year with 960 records for the
past 26 years.
Figure 5-5. Air filtration publications in EV
5.2.1.3 Analysis of Results from DII
The time span for the air filtration search in the Derwent Innovation Index (DII) was
also set to be the same duration, from 1990 to 2015. DII assigns a unique number, the “Derwent
010002000300040005000600070008000900010000
0
200
400
600
800
1000
1200
1990 1992 1994 1996 1998 2000 2002 2004 2006 2008 2010 2012 2014
Num
ber o
f Pub
licat
ions
Publication Years
# Records Cumulative Records

201
Accession Number”, to each of the records included with the year being indexed in it. The time
stamped on the Accession Number also corresponds to the search field of the time span that
DII provides. DII rewrites the obscure original patent documents and assigns at least one
Manual Code to each document for their classification within DII. Another important note
about Derwent is that one record is one patent family in DII, which is “a set of either patent
applications or publications taken in multiple countries to protect a single invention by a
common inventor(s) and then patented in more than one country” (EPO, 2015). The search is
conducted over the specified time frame in the “basic patent year” field in DII (the year when
a patent document is indexed into the DII), not the “application year” or “priority year” (see
Figure 5-6). From the trend based on basic patent years, 12,722 patent families were found,
and the average CAGR was at 8.98% from 1990 to 2014.
When “priority year” (the year of the first date when a patent application is filed) is
selected for the trend analyses, the retrieved data can date back to 1982 and go forward until
2016 (current year). The quantity in “priority year” is higher than the number of records from
“basic patent years” since it represents the number of patent documents, not the number of
patent families. The reason for the longer span (35 years in total) is because of the time lag
between a patent being filed and when Derwent indexes the patent document into their
database. The period with the largest growths on patent filing (see Figure 5-7) over the past
three decades was from 1985 to 1990, with the CAGR at 500.00% from 1985 to 1986, and at
494.74% from 1987 to 1988. After that stage, the number of patent applications is still growing,
but at a slower speed. The search query resulted in two records in 1982 and grew to 1,148
records in 2014. Overall, the publication volume was a total of 14,807 records, and the average
CAGR was 51.92% from 1982 to 2014.

202
The overall patent application trend analysis manifested the commercialization of air
filtration. To measure the growth of the commercial development of air filtration, IPC codes
were also included in the Figure 5-7 to showcase the scope and expansion of patents, as IPC
codes represent a sub-technology field. The yellow bars displayed the numbers of IPC codes
(8 digits) each year in order to track the changes of the IPC codes in scope. For example, 752
patent applications were filed in 2008, covering 1,270 IPC codes. Back in 1990, 233 records
were found in air filtration related patent applications, and they were distributed among only
302 IPC codes. The expansion in the IPC codes implied the expansion in the air filtration
research area, and it also indicated in-depth R&D activities in each sub-technology fields.
Figure 5-6. Air filtration patent families trend in DII from basic patent years
0
2000
4000
6000
8000
10000
12000
14000
0
200
400
600
800
1000
1200
1400
1600
1990 1992 1994 1996 1998 2000 2002 2004 2006 2008 2010 2012 2014
Num
ber o
f Pat
ent F
amily
DII Basic Patent Years
# Records Cumulative Records

203
Figure 5-7. Air filtration patent applications trend in DII from priority years
5.2.1.4 Analysis of Results from ABI
The CAGR for the publications on air filtration in ABI is 24.60% on average from 1990
to 2014. The number of publications grew from 29 records in 1990 to 938 records in 2014.
After decreasing in 1991 to almost half of the publications in 1990, the publication volume on
air filtration in ABI grew more than two times from 1991 to 1992. Such a cycle repeats
throughout the years, and the publications on air filtration in ABI are the least stable among
the four databases (see Figure 5-8).
0
2000
4000
6000
8000
10000
12000
14000
16000
0
200
400
600
800
1000
1200
1400
19821984198619881990199219941996199820002002200420062008201020122014
Num
ber o
f Pat
ent A
pplic
atio
ns o
r IPC
s
Patent Priority Years
# Records Number of IPCs Cumulative Records

204
Figure 5-8. Air filtration publications in ABI
5.2.2 Top Players
5.2.2.1 Countries that Produce the Most Publications
First, a comparison was conducted at the national level by listing the top publishing
countries from different databases. Then, the focus switched to the research organizations.
5.2.2.1.1 Analysis Results from WOS
Figure 5-9 illustrates the trends on research activities among the top 10 countries, based
on cumulative record hits from WOS publication data, for the previous 26 years. It is very
obvious that the United States is the leading country on air filtration research publications with
the highest cumulative records (1,503 records in total) and a CAGR of 10.61% (from 1990 to
2014), followed by China (401 records in total), who is catching up with a CAGR of 15.88%
(from 1998 when the first record occurred to 2014). The third most active country in air
filtration is Germany (246 records with a CAGR of 12.95%). From 1990 to 2015, the U.S. has
produced almost one third (32.15%) of the air filtration publications worldwide.
0
2000
4000
6000
8000
10000
12000
14000
0100200300400500600700800900
1000
1990
1991
1992
1993
1994
1995
1996
1997
1998
1999
2000
2001
2002
2003
2004
2005
2006
2007
2008
2009
2010
2011
2012
2013
2014
2015
Num
ber o
f Pub
licat
ions
Publication Years
# of Records Cumulative Records

205
Figure 5-9. Publications on air filtration among the top 10 countries in WOS
Table 5-8 Top 10 countries and their publications in WOS Ranking Country # Records Percent
(Country/Total) CAGR (from the first
record to 2014) 1 USA 1503 32.15% 10.61% 2 China 401 8.58% 15.88% 3 Germany 279 5.97% 12.95% 4 Japan 246 5.26% 10.80% 5 France 204 4.36% 12.81% 6 UK 192 4.11% 10.91% 7 Canada 189 4.04% 13.96% 8 South
Korea 187 4.00% 15.02%
9 Russia 145 3.10% 12.56% 10 Poland 128 2.74% 10.50%

206
5.2.2.1.2 Analysis of Results from EV
There is only one country that is different in EV than WOS in the top 10. Italy moved
up two spots to 10th in EV, while Poland dropped out of the top 10 list in EV (13th in EV, and
10th in WOS). However, the number of records is drastically different for some countries. In
WOS, 401 records were published by organizations and researchers in China, while 1,251
records were retrieved from EV. 1,503 and 2,505 records associated with U.S. organizations
and authors were retrieved from WOS and EV, respectively, but the percentage of the total
number of records retrieved from each database is almost the same: 32.15% in WOS vs.
27.78% in EV. 246 records from WOS and 609 records from EV were identified to be
published by Japanese organizations. Figure 5-10 illustrates the trends among the top 10
countries based on the data collected from EV. China still has a high CAGR (17.90%, the
second among top 10 country), and the first record was found in 1991. Despite the U.S. being
the most prolific country based on the overall volume, the CAGR is relatively low at 5.54%
(third lowest among the top 10 countries). South Korea appears to be the country with the
highest growth rate (CAGR of 18.54%, and a total number of 268 records), but the first record
from South Korea dated back to 1995 (the latest first record among the top 10 countries). The
first South Korean record in WOS was identified in 1993, and the total amount of records from
South Korea in WOS was 187. However, the CAGR in WOS was somewhat close (15.02%).
Table 5-9 showcases the top ten countries’ publication activities based on the air filtration
records from EV, the percentage of each country’s publications out of the total publications
and CAGR are listed as well.

207
Figure 5-10. Publications on air filtration among top 10 countries in EV Table 5-9 Top 10 countries and their publications in EV Ranking
Country # Records Percent
(Country/Total) CAGR (since the first
record to 2014) 1 USA 2505 27.78% 5.54% 2 China 1251 13.88% 17.90% 3 Japan 609 6.75% 5.70% 4 Germany 518 5.75% 8.25% 5 UK 362 4.02% 4.33% 6 Russia 311 3.45% 7.25% 7 Canada 272 3.02% 9.86% 8 South Korea 268 2.97% 18.54% 9 France 257 2.85% 10.63% 10 Italy 242 2.68% 11.44%
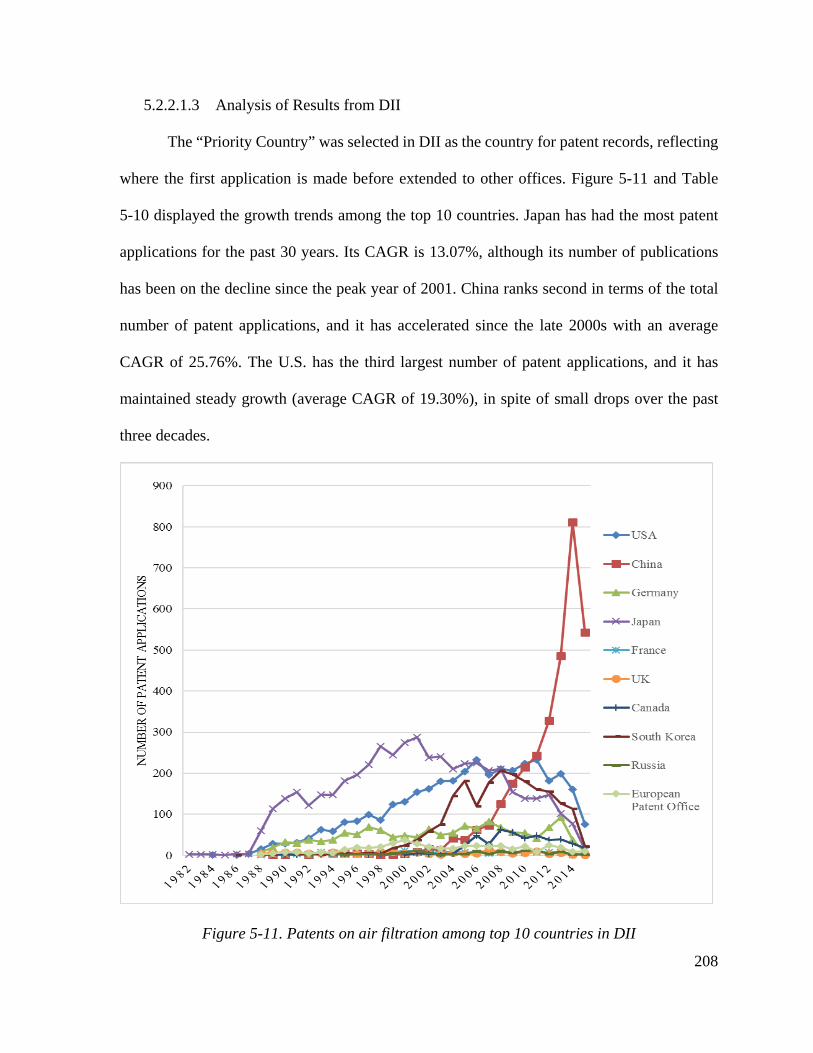
208
5.2.2.1.3 Analysis of Results from DII
The “Priority Country” was selected in DII as the country for patent records, reflecting
where the first application is made before extended to other offices. Figure 5-11 and Table
5-10 displayed the growth trends among the top 10 countries. Japan has had the most patent
applications for the past 30 years. Its CAGR is 13.07%, although its number of publications
has been on the decline since the peak year of 2001. China ranks second in terms of the total
number of patent applications, and it has accelerated since the late 2000s with an average
CAGR of 25.76%. The U.S. has the third largest number of patent applications, and it has
maintained steady growth (average CAGR of 19.30%), in spite of small drops over the past
three decades.
Figure 5-11. Patents on air filtration among top 10 countries in DII

209
Table 5-10 Top 10 countries and their numbers of patents in DII Ranking Country #
Records Percent
(Country/Total) CAGR (from the first record till
2013) 1 Japan 4538 30.65% 13.07% 2 China 3040 20.53% 28.08% 3 USA 2019 13.64% 19.30% 4 South Korea 1682 11.36% 18.85% 5 Germany 1169 7.89% 9.89% 6 European Patent Office 242 1.63% 9.04% 7 Canada 184 1.24% 12.62% 8 UK 131 0.88% 1.57% 9 France 122 0.82% 7.77% 10 Russia 120 0.81% 10.50%
5.2.2.1.4 Analysis of Results from ABI
The country information from this database is not clearly known due to the lack of
identifiable publication country. However, the majority of the trade journals from the source
are written in English (only two records in Spanish).
5.2.2.2 Organizations that Produces the Most Publications
Although air filtration research is conducted all over the world, the level of research
activities varies among institutions. The organizations who publish on air filtration will be
compared in this section.
5.2.2.2.1 Analysis of Results from WOS
Table 5-11 lists the top 25 organizations in air filtration research activities according to
WOS. More than half of them are based in the United States, and the rest are from the Asia
Pacific region and Europe. Among the 13 organizations in the United States, there are nine
universities, one company, and three government agencies, including the National Institute of
Occupational Safety and Health (NIOSH) which has the highest number of publications.
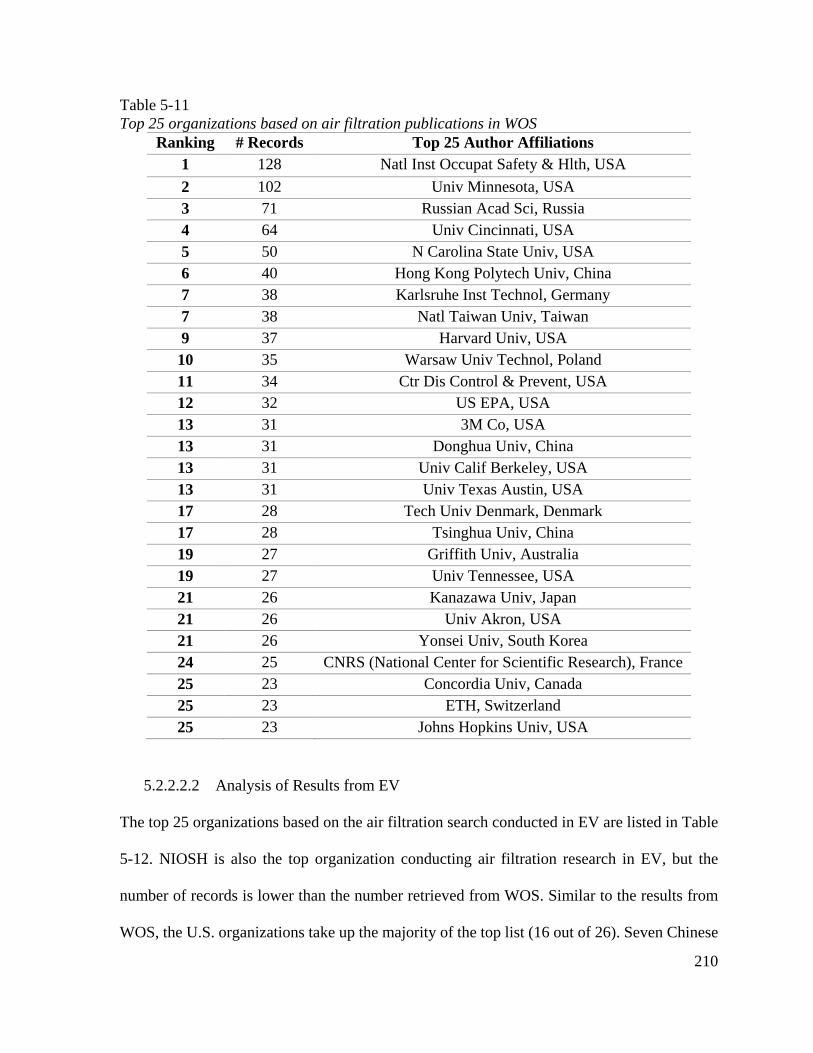
210
Table 5-11 Top 25 organizations based on air filtration publications in WOS
Ranking # Records Top 25 Author Affiliations 1 128 Natl Inst Occupat Safety & Hlth, USA 2 102 Univ Minnesota, USA 3 71 Russian Acad Sci, Russia 4 64 Univ Cincinnati, USA 5 50 N Carolina State Univ, USA 6 40 Hong Kong Polytech Univ, China 7 38 Karlsruhe Inst Technol, Germany 7 38 Natl Taiwan Univ, Taiwan 9 37 Harvard Univ, USA 10 35 Warsaw Univ Technol, Poland 11 34 Ctr Dis Control & Prevent, USA 12 32 US EPA, USA 13 31 3M Co, USA 13 31 Donghua Univ, China 13 31 Univ Calif Berkeley, USA 13 31 Univ Texas Austin, USA 17 28 Tech Univ Denmark, Denmark 17 28 Tsinghua Univ, China 19 27 Griffith Univ, Australia 19 27 Univ Tennessee, USA 21 26 Kanazawa Univ, Japan 21 26 Univ Akron, USA 21 26 Yonsei Univ, South Korea 24 25 CNRS (National Center for Scientific Research), France 25 23 Concordia Univ, Canada 25 23 ETH, Switzerland 25 23 Johns Hopkins Univ, USA
5.2.2.2.2 Analysis of Results from EV
The top 25 organizations based on the air filtration search conducted in EV are listed in Table
5-12. NIOSH is also the top organization conducting air filtration research in EV, but the
number of records is lower than the number retrieved from WOS. Similar to the results from
WOS, the U.S. organizations take up the majority of the top list (16 out of 26). Seven Chinese

211
research organizations are on the list from EV, while only three universities (Hong Kong
Polytech University, Donghua University, and Tsinghua University) made it to the top
organizations in WOS. Moreover, Chinese universities are ranked higher on this list. Two
Chinese universities are ranked second and third in EV, compared to 13th and 17th in WOS.
The rest of the top 25 list in EV has one Japanese university, one Danish university, and one
Polish university.
Table 5-12 Top 25 organizations based on air filtration publications in EV Ranking # Records Top 25 Author Affiliations
1 75 National Institute for Occupational Safety and Health, United States
2 69 Tsinghua Univ., China 3 59 Donghua Univ., China 4 58 University of Minnesota, United States 5 54 North Carolina State University, United States 6 44 Chinese Academy of Sciences, China 6 44 Hong Kong Polytechnic University, China 6 44 University of Texas Austin, United States 9 40 Kanazawa Univ, Japan 9 40 Tianjin University, China 11 38 Univ of California Davis, United States 12 37 Pennsylvania State University, United States 12 37 Univ. of Cincinnati, United States 14 34 University of Akron, United States 15 33 Massachusetts Institute of Technology, United States 15 33 Research Triangle Institute, United States 15 33 Tongji University, China 18 32 Technical Univ of Denmark, Denmark 18 32 Warsaw University of Technology, Poland 20 31 Hunan University, China 21 27 Virginia Commonwealth University, United States 22 25 Auburn University, United States 22 25 University of Tennessee, United States 24 24 University of California Berkeley, United States 25 23 University of California Riverside, CA, United States 25 23 University of Wisconsin Madison, United States

212
5.2.2.2.3 Analysis of Results from DII
The category corresponding to the organizations in DII are patent assignees in patent
applications, referring to the ownership of the patent documents. The top 25 organizations are
listed in Table 5-13, and all of them are companies around the world.
Table 5-13 Top 25 organizations based on air filtration patents in DII
Ranking # Records Patent Assignees 1 349 MANN & HUMMEL GMBH 2 340 MATSUSHITA DENKI SANGYO KK 3 203 TOYOBO KK 4 196 TORAY IND INC 5 191 LG ELECTRONICS INC 6 183 3M INNOVATIVE PROPERTIES CO 7 168 DONALDSON CO INC 8 162 DAIKIN KOGYO KK 9 150 NIPPON MUKI KK 10 137 SANYO ELECTRIC CO LTD 11 134 JAPAN VILENE CO LTD 12 111 WOONG JIN COWAY CO LTD 13 106 TOYOTA BOSHOKU KK 14 95 MITSUBISHI ELECTRIC CORP 15 93 MITSUBISHI PAPER MILLS LTD 16 92 SAMSUNG ELECTRONICS CO LTD 17 91 MATSUSHITA ELECTRIC WORKS LTD 18 86 FREUDENBERG KG CARL 18 86 NIPPONDENSO CO LTD 18 86 NITTO DENKO CORP 21 75 NITTA KK 22 75 SHARP KK 23 68 WINIAMANDO INC 24 56 MATSUSHITA SEIKO KK 25 56 TSUCHIYA SEISAKUSHO KK
However, when examining a sub-dataset by only including patents that list the U.S. as
the priority country, the top assignees change dramatically. Priority countries are referring to
those countries where the patent is first filed before being filed in other countries. Only the

213
following three companies are seen on both lists: Donaldson, 3M, and Mann & Hummel
(marked bold). Compared to the global top assignees, none of the Japanese assignees are seen
in Table 5-14.
Table 5-14 Top organizations in DII on air filtration patents using the U.S. as the priority country
Ranking # Records Patent Assignees 1 164 DONALDSON CO INC 2 163 3M INNOVATIVE PROPERTIES CO 3 47 CUMMINS FILTRATION IP INC 4 43 HOLLINGSWORTH & VOSE CO 5 37 PALL CORP 6 34 GENERAL ELECTRIC CO 7 34 KIMBERLY-CLARK WORLDWIDE INC 8 31 DU PONT DE NEMOURS & CO E I 9 23 HONEYWELL INT INC 10 23 PROCTER & GAMBLE CO 11 21 MANN & HUMMEL GMBH 12 20 BALDWIN FILTERS INC 13 20 BHA ALTAIR LLC 14 20 GORE & ASSOC INC W L 15 17 CAMFIL AB 16 17 EXXONMOBIL CHEM PATENTS INC 17 17 NELSON IND INC 18 16 DANA CORP 19 15 AAF-MCQUAY INC 20 15 CAMFIL FARR INC 21 15 JOHNS-MANVILLE CORP 22 14 BHA GROUP INC 23 14 CARRIER CORP 24 13 CLARCOR AIR FILTRATION PROD INC 25 12 AHLSTROEM CORP A
5.2.2.2.4 Analysis of Results from ABI
The top organizations on air filtration from ABI are listed in Table 5-15. From the
results, government agencies, professional organizations, and companies are all seen on the

214
list. No universities were identified from this source. However, the list only covered around
20% of the organizations from the entire retrieved ABI dataset.
Table 5-15 Top organizations on air filtration publications in ABI Ranking # of Records Organizations
1 67 US EPA, Environmental Protection Agency 2 62 National Institute for Occupational Safety & Health 3 40 American Society of Heating Refrigerating & Air
Conditioning Engineers 4 24 Honeywell International 5 21 Car Care Council 6 20 Carrier Corp 7 18 Ford Motor Co 8 17 3M Co 8 17 Camfil Farr 8 17 Donaldson Co 8 17 Trane Co 12 16 Food & Drug Administration--FDA 13 15 General Motors Corp 14 14 Nissan Motor Co Ltd 14 14 Toyota Ltd 16 13 Deere & Co 16 13 Stihl Inc 18 12 Association of Home Appliance Manufacturers 18 12 Federal-Mogul Corp 18 12 Wal-Mart Stores Inc 21 11 Purafil Inc 22 10 Air Conditioning Contractors of America 22 10 Department of Energy 22 10 General Electric Co 22 10 National Air Duct Cleaners Association 22 10 Pall Corp 22 10 Sharper Image 22 10 Sheet Metal & Air Conditioning Contractors National
Association

215
5.2.3 Document Types
For the records retrieved from the Derwent Innovation Index, there is only one type of
document – patents. For the ABI/INFORM Complete database, only published trade journals
articles were collected. However, for S&T publications retrieved from WOS and EV, there are
multiple types of documents, and only journal articles and conference proceedings are included
as the target source of information in the analyses. To compare the types of documents being
included from these two databases, the breakdown of the sources from WOS and EV is shown
in Figure 5-12 and Figure 5-13, respectively. In both WOS and EV, journal articles are the
main source of the information collected, but the ratio of journal articles to conference
proceedings is different. WOS has a bigger percentage of journal articles than EV. WOS has
more than four times more journal articles than conference proceeding papers. EV has a lot
more records from conference proceedings. Out of the entire collection of retrieved records
from EV, about one third are from conference proceedings and about two thirds are from
journal articles.
Figure 5-12. Document types in WOS
389383%
78217%
Journal Article Conference Proceeding

216
Figure 5-13. Document types in EV
5.2.4 Publication Sources with the Most Relevant Publications
Table 5-16 and Table 5-17 list the sources that have the most relevant publications on
air filtration. The majority of them are S&T journals, and conference proceedings are the other
type of publication on the list. Among the top five journals that have the most publications on
air filtration in WOS (Table 5-16) and EV (Table 5-17), four of them are the same (in bold).
This implies some consistency in the search results, as well as the focus of the research areas.
When comparing WOS and EV, the types of the retrieved publications from each
database vary to some degree, which was expected due to the difference in database coverage.
Among the top 25 publications from WOS, only two of them are conference proceedings (in
italic), and the rest are all journals. In EV, five out of the top 25 sources are conference
proceedings, which is not surprising because overall conference proceedings make up 32% of
the total publications. SAE technical papers is a collection of peer-reviewed journal articles
specializing in the automotive, aerospace, and commercial vehicle industries. The high number
of publications on air filtration from this journal might suggest that nonwoven air filters are
widely used in the automotive industry.
609568%
292032%
Journal Article Conference Proceeding

217
Table 5-16 Top 25 sources based on publication volume in WOS Ranking #
Records Source
1 148 AEROSOL SCIENCE AND TECHNOLOGY 2 102 JOURNAL OF AEROSOL SCIENCE 3 91 ATMOSPHERIC ENVIRONMENT 3 91 JOURNAL OF OCCUPATIONAL AND ENVIRONMENTAL
HYGIENE 5 86 FILTRATION & SEPARATION 6 74 ANNALS OF OCCUPATIONAL HYGIENE 7 69 POWDER TECHNOLOGY 8 68 BUILDING AND ENVIRONMENT 9 51 ENVIRONMENTAL SCIENCE & TECHNOLOGY 9 51 SEPARATION AND PURIFICATION TECHNOLOGY 11 49 JOURNAL OF RADIOANALYTICAL AND NUCLEAR
CHEMISTRY 12 46 AMERICAN INDUSTRIAL HYGIENE ASSOCIATION
JOURNAL 12 46 INDOOR AIR 14 45 INDOOR AIR 2005: PROCEEDINGS OF THE 10TH
INTERNATIONAL CONFERENCE ON INDOOR AIR QUALITY AND CLIMATE, VOLS 1-5
15 42 AMERICAN JOURNAL OF INFECTION CONTROL 16 37 AEROSOL AND AIR QUALITY RESEARCH 16 37 CHEMICAL ENGINEERING SCIENCE 18 35 JOURNAL OF THE AIR & WASTE MANAGEMENT
ASSOCIATION 19 33 INDOOR AND BUILT ENVIRONMENT 20 29 COLLOID JOURNAL 20 29 JOURNAL OF ENVIRONMENTAL MONITORING 22 28 JOURNAL OF HOSPITAL INFECTION 23 27 HEALTH PHYSICS 24 26 ADVANCES IN FILTRATION AND SEPARATION TECHNOLOGY,
VOL 11 1997 25 25 COMBUSTION EXPLOSION AND SHOCK WAVES 25 25 JOURNAL OF HAZARDOUS MATERIALS

218
Table 5-17 Top 25 sources based on publication volume in EV Ranking #
Records Source
1 346 SAE TECHNICAL PAPERS 2 257 JOURNAL OF AEROSOL SCIENCE 3 188 ATMOSPHERIC ENVIRONMENT 4 140 AEROSOL SCIENCE AND TECHNOLOGY 5 137 FILTRATION AND SEPARATION 6 119 ADVANCED MATERIALS RESEARCH 7 90 ENVIRONMENTAL SCIENCE AND TECHNOLOGY 8 89 ANNALS OF OCCUPATIONAL HYGIENE 9 88 PROCEEDINGS OF THE AIR & WASTE MANAGEMENT
ASSOCIATION'S ANNUAL MEETING & EXHIBITION 10 84 BUILDING AND ENVIRONMENT 11 77 ASHRAE TRANSACTIONS 12 76 JOURNAL OF OCCUPATIONAL AND ENVIRONMENTAL
HYGIENE 13 75 JOURNAL OF THE AIR AND WASTE MANAGEMENT
ASSOCIATION 14 72 POWDER TECHNOLOGY 15 66 APPLIED MECHANICS AND MATERIALS 16 59 INDOOR AIR 2014 - 13TH INTERNATIONAL CONFERENCE ON
INDOOR AIR QUALITY AND CLIMATE 17 58 CHEMICAL ENGINEERING SCIENCE 18 55 ASHRAE JOURNAL 19 52 JOURNAL OF HAZARDOUS MATERIALS 20 50 SEPARATION AND PURIFICATION TECHNOLOGY 21 47 PROCEEDINGS OF THE ASME TURBO EXPO 22 46 CHEMICAL ENGINEERING JOURNAL 23 46 DIESEL PROGRESS 24 42 9TH INTERNATIONAL CONFERENCE AND EXHIBITION -
HEALTHY BUILDINGS 2009, HB 2009 25 42 INDUSTRIAL AND ENGINEERING CHEMISTRY RESEARCH
5.2.5 Journals that Have Been Cited the Most
WOS is the only database that provides sufficient citation information that can be
downloaded and processed. Therefore, citation related analyses on air filtration can only be
done in WOS, but not the other data sources. The most cited journals are in Table 5-18.

219
Table 5-18 Top cited journals from air filtration search in WOS Ranking #
Records Cited Journal
1 976 JOURNAL OF AEROSOL SCIENCE 2 899 AEROSOL SCIENCE AND TECHNOLOGY 3 863 ATMOSPHERIC ENVIRONMENT 4 762 ENVIRONMENTAL SCIENCE & TECHNOLOGY 5 544 AMERICAN INDUSTRIAL HYGIENE ASSOCIATION
JOURNAL 6 480 CHEMICAL ENGINEERING SCIENCE 7 473 ANNALS OF OCCUPATIONAL HYGIENE 8 454 INDOOR AIR 9 366 ENVIRONMENTAL HEALTH PERSPECTIVES 10 360 JOURNAL OF THE AIR & WASTE MANAGEMENT
ASSOCIATION 11 358 POWDER TECHNOLOGY 12 343 SCIENCE OF THE TOTAL ENVIRONMENT 13 302 JOURNAL OF OCCUPATIONAL AND ENVIRONMENTAL
HYGIENE 14 302 NEW ENGLAND JOURNAL OF MEDICINE 15 292 AICHE JOURNAL 16 292 APPLIED AND ENVIRONMENTAL MICROBIOLOGY 17 289 JOURNAL OF COLLOID AND INTERFACE SCIENCE 18 286 SCIENCE 19 273 NATURE 20 269 BUILDING AND ENVIRONMENT 21 253 FILTRATION & SEPARATION 22 244 AMERICAN JOURNAL OF INFECTION CONTROL 23 222 ANALYTICAL CHEMISTRY 24 221 THE LANCET 25 219 INDUSTRIAL & ENGINEERING CHEMISTRY RESEARCH
5.2.6 Influence Measures / Citation Analysis
At the international level, the influence of a particular country on a research area
depends upon not just the quantity but also the quality of the work. This also holds true for
research organizations. The more frequently a research publication gets cited, the higher the
influence it has. Out of the publications on air filtration retrieved from WOS, 60 papers are

220
cited over 100 times, and over 90% (55 out of 60) of those highly cited papers are published
by the top 10 countries with the most publications.
Figure 5-14 compares the citations among the top 10 countries based on the publication
volume retrieved from WOS from 1990 to 2015. The vertical box indicates the average number
of times that one publication is cited for each of the 10 countries. The results indicate that
publications from China are cited less frequently on average (6.74 times per record) than most
of the other countries in the top ten, though the country ranked second in total publication
volume. This might be caused by the shorter time window for the papers to be cited because
the first retrieved record from China was published in 1998 and the country’s total records per
year did not reach 10 until 2003. The U.S. received the highest average citations per record
(15.51 times). The U.S. was followed by the UK (14.52 times), though the UK ranked 6th in
total publication volume. Germany was third in both publications and the average times cited,
receiving almost the same average times being cited per record (14.21 times) as the UK.
From previous studies (Guo et al., 2013; Guo et al., 2015), the time window for citation
has an influence because the chance to be cited is higher for a paper published ten years ago
versus one published one year ago. To further examine the effect of the time window on the
number of publications being cited, another comparison was conducted among the three
countries with the highest publication volume, the U.S., China, and Germany (see Figure
5-15). The number of times cited per record for all of the years in detail is shown in Table 5-
20. Overall, the time window did have an effect on the average times cited per record (see
Table 5-19). However, the long time window of a publication does not guarantee that it will
be the highest cited publication.

221
Figure 5-14. Citations in WOS among the top 10 countries with the most publications
Figure 5-15. Comparison of the average times cited per record in WOS among top three countries
0
5000
10000
15000
20000
25000
0
2
4
6
8
10
12
14
16
18
USA China Germany Japan France UK Canada SouthKorea
Russia Poland
Average Times Cited per Record Total Times Cited

222
Table 5-19 Times cited per record in WOS among top three countries from 1990-2015
Years USA China Germany 1998 11.22 7.50 16.00 1999 8.16 25.25 13.15 2000 21.08 11.67 20.08 2001 32.18 12.50 45.22 2002 30.55 11.40 8.20 2003 20.32 24.30 29.50 2004 22.98 7.36 37.00 2005 16.72 12.52 21.20 2006 16.95 22.23 28.18 2007 21.39 7.44 49.29 2008 18.68 7.31 13.87 2009 27.70 3.96 7.00 2010 13.24 8.83 15.40 2011 11.34 6.67 8.50 2012 5.71 5.18 3.33 2013 4.93 4.19 7.09 2014 2.53 3.84 5.48 2015 1.31 1.11 1.26
Table 5-20 Citation information on air filtration publications in WOS
Top Countries Based on
Publications
USA China Germany Japan France UK Canada South Korea
Russia Poland
Number of Records 1503 401 279 246 204 192 189 187 145 128
# Records Cited Over 1
Time
1207 80.31%
235 58.60%
212 75.99%
182 73.98%
174 85.29%
161 83.85%
156 82.54%
145 77.54%
83 57.24%
89 69.53%
Total Times Cited
23308 2704 3965 3036 2634 2787 2582 1495 725 903
Average Times Cited per Record
15.51 6.74 14.21 12.34 12.91 14.52 13.66 7.99 5 7.05
# Records Cited Over 100 Times
5 2.03%
27 1.80%
2 0.98%
3 1.56%
1 0.53%
1 0.69%
2 1.56%
2 0.50%
7 2.51%
4 2.12%

223
When identifying the top organizations, a ranking based on the number of publications
in WOS was listed (Table 5-11). However, whether the most productive organizations are also
those making the biggest impact in a technical field is not known. To clarify an organization’s
influence on the air filtration area, a ranking based on the total times their publications were
cited in WOS is shown in Table 5-21. There are some changes in the ranking in this list
compared to the overall rankings in the number of publications. However, the results matched
those that showed that the U.S. was the country that had the most citations over the 26 years,
and the top five organizations based on the total times cited are all located in the U.S. 11 out
of the 20 affiliations are located in the U.S., and Switzerland, China, Canada, Taiwan, Russia,
Denmark, Germany, and Singapore all have one affiliation in Table 5-21.
Table 5-22 lists the top 20 affiliations based on the average number of times cited per
record, and also confirms the bigger impact made by U.S. affiliations on air filtration R&D
because seven out of top 10 affiliations (and 10 out of the top 20) are located in the U.S.
Additionally, only three out of the 20 organizations listed in Table 5-22 (marked italic) were
among the top 25 organizations based on total publications (Table 5-11), and the rest of the
organizations in Table 5-22 are all ranked lower than 50 based on total publications.
This indicated that, although some organizations might not be active in publishing
continuously, the contribution of their research is still important due to the times it has been
cited through the years.

224
Table 5-21 Top 20 affiliations based on total times cited and their corresponding average times cited per record Ranking
on Total Times Cited
Affiliation Number of
Records
Total Times Cited
Per Record Average
Ranking on Total
Publication Volume
1 Univ Minnesota, USA 102 1,522 14.92 2 2 Univ Cincinnati, USA 64 1,433 22.39 4 3 National Institute for
Occupational Safety and Health, USA
128 1,261 9.85 1
4 Univ Tennessee, USA 27 1,081 40.04 19 5 Univ Calif Berkeley, USA 31 912 29.42 13 6 ETH, Switzerland 23 887 38.57 25 7 Hong Kong Polytechnic
Univ, China 40 797 19.93 6
8 North Carolina State Univ, USA
50 675 13.50 5
9 Harvard Univ, USA 37 619 16.73 9 10 Johns Hopkins Univ, USA 23 613 26.65 25 11 Environment Canada,
Canada 8 590 73.75 132
12 US EPA, USA 32 583 18.22 12 13 Centers for Disease Control
& Prevent, USA 34 561 16.50 11
14 National Taiwan Univ, Taiwan
38 528 13.89 7
15 CNRS (National Center for Scientific Research),
France
25 523 20.92 24
16 Russian Acad Science, Russia
71 486 6.85 3
17 Univ Washington, USA 12 474 39.50 70 18 Technical Univ Denmark,
Denmark 28 467 16.68 17
19 Karlsruhe Inst Technology, Germany
38 448 11.79 7
20 National Univ of Singapore, Singapore
12 444 37.00 80

225
Table 5-22 Top 20 affiliations based on the average times cited per record and their corresponding total time cited
Ranking on
Average Times Cited
Affiliation Number of
Records
Total Times Cited
Per Record Average
Ranking on Total
Publication Volume
1 Environment Canada, Canada
8 590 73.75 132
2 Oregon State Univ, USA 6 422 70.33 206 3 Oregon Health & Science
Univ, USA 6 286 47.67 206
4 Arizona State Univ, USA 7 309 44.14 166 5 Michigan Technological
Univ, USA 6 259 43.17 206
6 Univ Tennessee, USA 27 1,081 40.04 25 7 Univ Virginia, USA 10 396 39.60 101 8 Univ Washington, USA 12 474 39.50 70 9 Technical Univ of
Munich, Germany 6 233 38.83 206
10 Wythenshawe Hospital, UK
8 309 38.63 132
11 ETH, Switzerland 23 887 38.57 25 12 Univ Pittsburgh, USA 7 266 38.00 165 13 National Univ of
Singapore, Singapore 12 444 37.00 80
14 Hong Kong Univ of Science & Technology,
China
7 247 35.29 6
15 Kanagawa Academy of Science & Technology,
Japan
12 420 35.00 80
16 Chinese Univ of Hong Kong, China
10 331 33.10 101
17 Univ Heidelberg, Germany
8 251 31.38 132
18 Iowa State Univ, USA 10 296 29.60 101 19 Univ Calif Berkeley,
USA 31 912 29.42 13
20 Univ Padua, Italy 11 322 29.27 88

226
A visual way to show the contribution made by research organizations is illustrated in
Figure 5-16. The figure is based on the matrix of publications’ times cited versus research
affiliations from the 4,675 WOS records, and the red, yellow, and green colors indicate high,
medium, and low levels, respectively. Each of the red circles has a few organizations around
it, and the organizations that were positioned at the centers of the circles include the National
Institute of Occupational Safety and Health, University of Minnesota, University of Cincinnati,
North Carolina State University, and the Russian Academy of Sciences.
Figure 5-16. Overall times cited for research organizations
Furthermore, by selecting the top cited papers (60 papers cited more than 100 times
from 1990 to 2015 worldwide, and the sizes of the dots reflect the times of the papers being
cited), a map showing the correlations between countries who published those papers is shown
in Figure 5-17. Figure 5-17 implies that the U.S. has received the most citations overall (due

227
to the bigger size of the blue dot). The thick lines connecting countries suggest that those
countries worked on similar research areas based on the similarity of the keywords extracted
from their publications.
Figure 5-17. Countries with the 60 highest cited papers on air filtration in WOS

228
5.2.7 Hot Topics and Research Concentration Analyses
The first part of this section covers the research areas identified from WOS (similar
sources from EV, DII, and ABI are not equivalent due to the different classification systems
that are adopted by different data sources). In addition, shifts in research emphasis over the
past almost three decades are discussed. The second part focuses on the research topics via
clustering techniques, and each cluster will be explained. The third part details how technology
used for nonwoven air filtration has evolved, and the results are illustrated using bubble charts
based on technology terms versus publication or priority years.
5.2.7.1 Research Areas and Research Shifts in WOS
First, research areas at the mega, macro, and micro levels were analyzed based on the
data collection on air filtration in WOS. WOS assigns each journal at least one category based
on the focus of the publications within the journal. Before 2012, WOS used Subject Category
(SC) to classify the journals, and this consisted 175 categories. From 2012, Web of Science
Category (WOSC) replaced SC to classify all of the journals into 224 categories. Due to the
overlap in the classifications, it is normal for all of the categories to add up to more than 100%
of the total number of journal publications. The micro level of categories based on the air
filtration search mainly focused on Environmental Sciences, Chemical Engineering, Public,
Environmental & Occupational Health, Environmental Engineering, and Mechanical
Engineering. The old Subject Categories system (the version for classification before 2012 and
still used by WOS is renamed to “Research Areas”) supplied by WOS suggests that the main
topics of air filtration research at the micro level are Engineering, Materials Science, and
Chemistry. It also contains a wide variety of application areas related to environmental science,

229
immunology, epidemiology, and health areas. From the results of the WOSC and SC
classifications, air filtration is indeed a multidisciplinary research area.
To further fuse almost 200 categories found in the air filtration search, “Macro-
Disciplines” and “Mega-Disciplines” developed by Leydesdorff and Rafols et al. (who built a
matrix based on the journal-to-journal cross-citations, and conducted factor analysis to compile
the 224 categories of journals into at least 19 “Macro-Disciplines”, and further consolidate into
a few “Mega-Disciplines”) were adopted to group those micro categories. Five “Mega-
Disciplines” were identified from the highest level, and the distribution is illustrated in Figure
5-18. Twenty “Macro-Disciplines” surfaced (see Table 5-23). This means that all of the macro
categories are covered by the air filtration research, and the major categories are Environmental
Science and Technology (29%), Material Science (14%), and Mechanical Engineering (13%).
Figure 5-18. Mega-Disciplines of air filtration in WOS

230
Table 5-23 Macro-Disciplines of air filtration in WOS
Ranking # Records Percent Web of Science Category (Macro-Disciplines) 1 2241 29.12% Environment Science & Technology 2 1049 13.63% Materials Science 3 1013 13.16% Mechanical Engineering 4 686 8.91% Health & Social Issues 5 503 6.54% Geosciences 6 424 5.51% Biomedical Science 7 349 4.53% Infectious Diseases 8 340 4.42% Physics 9 323 4.20% Chemistry 10 215 2.79% Computer Science 11 204 2.65% Clinical Medicine 12 98 1.27% Cognitive Science 13 82 1.07% Mathematic Methods 14 75 0.97% Agriculture Science 15 57 0.74% Ecology Science 16 20 0.26% Economics, Politics & Geography 17 8 0.10% Business & Management 18 5 0.06% Psychology 19 2 0.03% Architecture 20 2 0.03% Social Studies
The “Science Overlay Map” in Figure 5-19 displays the distribution of the subjects at
the macro level. The map shows the interdisciplinary nature of air filtration research, and the
size of the circles corresponds with the number of publications in that area. Engineering,
Chemistry, and Material Science, Biomedical Science and Infectious Disease are the subjects
on which a lot of air filtration related research has been conducted. According to the CAGR
from 1990 to 2014, Infectious Diseases (12.00%), Chemistry (11.59%), and Biomedical
Sciences (10.07%) are the fastest growing macro-disciplines (see Figure 5-20).

231
Figure 5-19. “Science Overlay Map” on air filtration publications in WOS
Figure 5-20. Growth trends of Macro-Disciplines on air filtration publications in WOS
5.2.7.2 Topical Analysis
A few clustering tools (ClusterSuite by VantagePoint and VOSviewer) were used in
this study to identify the topics hidden in the documents from ST&I and business databases as
individual data sources (WOS, EV, DII, and ABI).
020406080
100120140160180
1990
1991
1992
1993
1994
1995
1996
1997
1998
1999
2000
2001
2002
2003
2004
2005
2006
2007
2008
2009
2010
2011
2012
2013
2014
2015
Num
ber
of P
ublic
atio
n
Environ Sci & Tech Materials Sci Mech EngHealth & Social Issues Geosciences Biomed SciInfectious Diseases

232
5.2.7.2.1 Air Filtration Search in WOS
The VOSviewer software was used initially for clustering textual data based on the
abstracts and titles from the air filtration search in WOS. Using Natural Language Processing
(NLP) algorithms, the abstracts and titles from air filtration search results can be grouped into
several clusters. Some are based on applications, and the rest are more manufacturing process
and technology focused. The blue clusters in Figure 5-21 is mainly words and phrases on
applications related to disease transmission, including publications that mention air filters used
in hospitals, homes, and other indoor environments. The purple clusters are about face
respirators and the problems associated with them. The green group of clusters contains words
and phrases associated with environmental purposes, and the main application is air sampling.
The yellow group is relatively small, and different types of contaminants are mentioned. The
red area concentrates on the processes and technologies associated with filters, and the word
“fiber” came up as one of the biggest group, indicating the heavy use of fibers in air filters.
Figure 5-22 shows R&D trends by years based on the same collection of texts. The color
indicates the changes throughout the years. The red circles indicate the most recent, and the
darker blue indicates more established areas, such as filters for removing allergens caused by
animals and preventing tuberculosis. From the close-ups in Figure 5-23 and Figure 5-24,
nanoparticles, nanofiber filters, CNT, N95, and filtering facepiece respirators (FFR) are more
recent terms. The shifts in application areas imply shifts in not only the use of technologies,
but also in the development of the technologies

233
Figure 5-21. Topical clustering based on abstracts and titles in WOS

234
Figure 5-22. Shifts in research topics based on abstracts and titles in WOS

235
Figure 5-23. Close-up of shifts in research topics based on abstracts and titles in WOS (1)
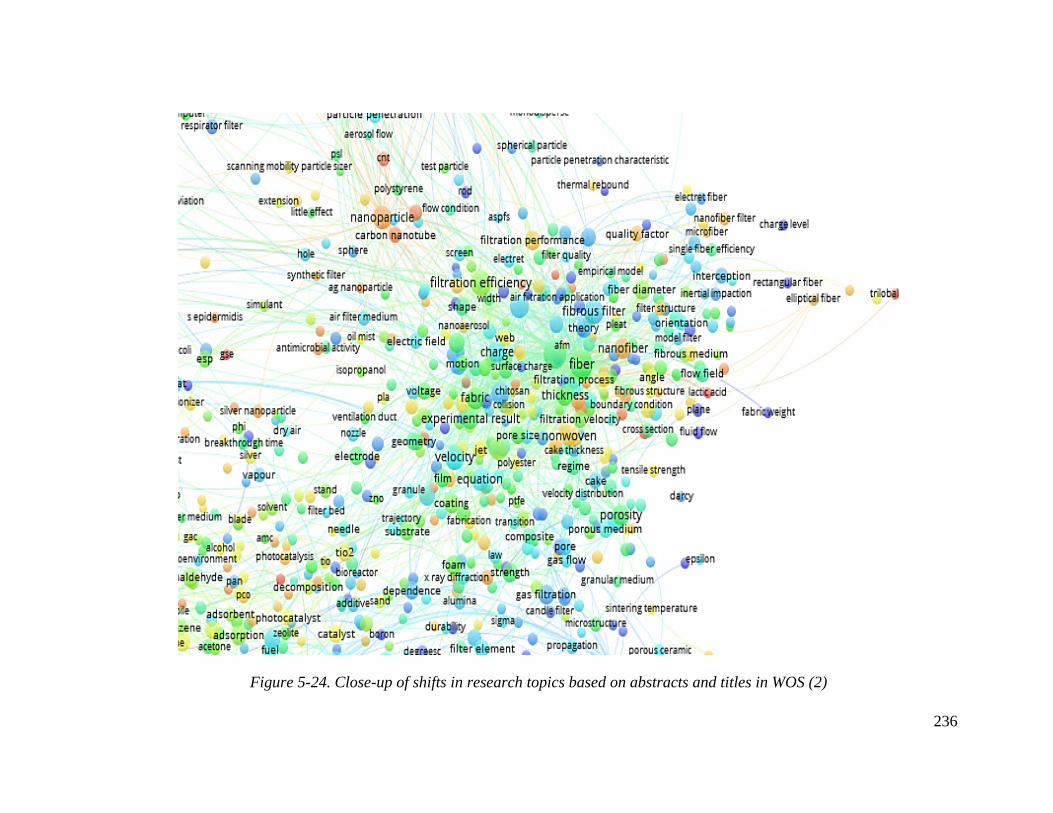
236
Figure 5-24. Close-up of shifts in research topics based on abstracts and titles in WOS (2)

237
ClusterSuite is an extension macro script developed by Search Technology, who also
developed VantagePoint, and it is used to aid in removing or combining low frequency words
and phrases extracted from abstract, keywords, titles, and other bibliometric information using
Natural Language Processing (NLP) algorithms. It helps in the achievement of higher accuracy
and coverage when building clusters based on factor analysis (principle component analysis)
in VantagePoint. From Figure 5-25, the “cleaning process” is shown in ten steps. By using the
default setting, the amount of words and phrases extracted from WOS air filtration records was
reduced to 4,701 from 116,937. More cleaning up was performed manually by removing
general and irrelevant terms, and combining synonyms and extremely similar terms, resulting
in about 2,500 words and phrases for the clustering process based on WOS air filtration
records.
A matrix was built on the over 2,000 terms vs. the publication years. Then TF*IDF
calculation was used again to rearrange the order of the over 2,000 key words and phrases
based on the square root TF*IDF values. TF*IDF is the multiplication of term frequency and
inverse document frequency, and it is aimed to remove the influence when one word is used
repeatedly only in one or a few documents. By selecting the top key terms, factor analysis was
used to conduct clustering. The factor analysis in VantagePoint is built upon the Principal
Component Analysis (PCA), and aims to reduce the dimensions of the large number of
keywords. By applying PCA, the clustering process in VantagePoint is an effective way to
showcase the entire spectrum of the air filtration research with extracted key terms. In order to
obtain a high coverage on the WOS air filtration records, an iterative approach was utilized to
determine the amount of keywords to include for the PCA analysis.

238
Figure 5-25. ClusterSuite results from VantagePoint (based on air filtration search from WOS)
Figure 5-26 demonstrates the results from the PCA analysis in clusters. The highest
coverage showed that 64% of the records (3,015 records out of 4,675) were included for the
clustering on air filtration search in WOS, and 19 clusters were identified. The largest cluster
is cluster 1: Interception, which includes 700 records.

239
Figure 5-26. Clustering from PCA analysis based on WOS air filtration search records
The factor map determines groups of items in the dataset that are similar by listing the
groupings that are important, and the lines are based on the overlaps of the clusters, which
are the support of the association rule X->Y. Each of the clusters in Figure 5-26 are described
in the following by listing all the keywords contained in each clusters.

240
Cluster 1: Filtering-Facepiece Respirators
Respirators, Filtering-Facepiece Respirators, N95, Occupational Safety, Respiratory
Protection, Fit Test, Workplace Protection Factors, Air-Purifying Respirator, Fit Factors,
Half-Facepiece Respirators, Total Inward Leakage
Cluster 2: Fibrous Filters
Fibrous Filters, Deposition, Collection Efficiency, Interception, Viscous Flow
Cluster 3: Titanium Dioxide
Volatile Organic-Compounds, Titanium Dioxide, Photocatalysis, Photocatalytic Oxidation
PCO, Indoor Air Purification, Photocatalyst, Photodegradation, Photocatalytic Activity
Cluster 4: Nanofibers
Nanofibers, Electrospinning, Electrospun Nanofibers
Cluster 5: Residual Dust Load
Residual Dust Load, Surface Cleaning Fraction, Un-Cleaned Surface
Cluster 6: Air Conditioning System
Indoor Air Quality, Ventilation, Air Conditioning System, HVAC Systems
Cluster 7: Natural Product

241
Bioaerosols, Escherichia Coli E. Coli, Antimicrobial Activity, Antibacterial Activity, Silver
Nanoparticles, Bacillus Subtilis, Antimicrobial Filters, Natural Product, Antimicrobial Air
Filtration
Cluster 8: Invasive Aspergillosis IA
Aspergillus, Invasive Aspergillosis IA, Nosocomial Aspergillosis, Immunocompromised
Patients, Stem-Cell Transplantation, Aspergillus SPP
Cluster 9: High-Temperature Oxidation
Fe-Cr-Al alloys, High-Temperature Oxidation, Oxidation Kinetics
Cluster 10: Incoming Flow
Rectangular Fibers, Aspect Ratio, Cross-Sectional Shape, Elliptic Fibers, Incoming Flow,
Circular Fibers
Cluster 11: Dust Cake
Pressure Drop, Ceramic Filters, Dust Cake, Pulse-Jet Cleaning, Residual Pressure Drop
Cluster 12: Penetration
Penetration, Sodium Chloride, Electret Filters, Penetrating Particle Size, Aerosol Penetration
Cluster 13: Nitrite Ion
Nitrite Ion, Sulfur Dioxide, Nitrogen Oxides NOx, Nitrogen Dioxide
242
Cluster 14: Surgical Masks
Filtering-Facepiece Respirators, N95, Healthcare Workers, Surgical Masks, N95 Respirators,
Infection Control, Severe Acute Respiratory Syndrome SARS, Facemasks
Cluster 15: Nonwovens
Nonwovens, Air Permeability, Nonwoven Fabrics, Pore Size Distribution, Tensile Strength,
Needle-Punched Nonwovens
Cluster 16: Silicon Carbide
Hot Gas Filtration, Electron Microscopy SEM, High Temperature, X-Ray Diffraction,
Silicon Carbide, Microstructure
Cluster 17: Clean Air Delivery Rate
Air Cleaner, Electrostatic Precipitator ESP, Clean Air Delivery Rate, Portable Air Cleaners
Cluster 18: Particulate Matter PM
Particulate Matter PM, PM2.5, PM10
Cluster 19: Adsorption
Adsorption, Activated Carbon AC

243
5.2.7.2.2 Air filtration search in EV
The same process for clustering using ClusterSuite was applied to the records retrieved
from EV, and this resulted in 3,120 key words and phrases after manual check and cleaning
(reduced from 182,959). The top 500 keywords and phrases were selected to perform the PCA
analysis to aid in the clustering procedure. 73% (6,592 of 9,016 records) of the records were
covered in the 21 clusters from the PCA analysis results (see Appendix C for the corresponding
figure). The largest cluster “diesel particulate filters” contains 3,222 publications because air
filtration was included.
Here are the descriptions of all the clusters:
Cluster 1: Diesel Particulate Filters
Air Filtration, Fuel Filters, Diesel Particulate Filters, Diesel Engines, Particulate Matter PM,
Diesel Oxidation Catalyst DOC
Cluster 2: Fibrous Filters
Fibrous Filters, Collection Efficiency, Interception, Inertial Impaction, Brownian Diffusion
Cluster 3: Nanotubes
Nanotechnology, Carbon Nanotubes CNTs, Nanostructured Materials, Nanocomposites,
Nanostructures, Single-Walled Carbon Nanotubes SWCNTs, Multi-Walled Carbon Nanotubes
MWCNTs, Nanotubes, Chemical Vapor Deposition
Cluster 4: Gas Generators
Biomass, Gas Generators, Syngas, Synthesis Gas, Biomass Gasification

244
Cluster 5: Waste Treatment
Waste Incineration, Heat Treatment, Waste Treatment, Waste Management, Solid Wastes,
Refuse Incinerators
Cluster 6: Filtering-Facepiece Respirators
Respirators, Respiratory Protection, Sodium Chloride, Filtering-Facepiece Respirators, N95,
Filter Penetration
Cluster 7: Indoor Air Quality
Air Quality, Indoor Air Pollution, Air Conditioning, Indoor Air Quality
Cluster 8: Biofilters
Biofilters, Biodegradation, Bioreactors, Biotrickling Filter, Biofilms
Cluster 9: Photocatalysis
Air Purification, Titanium Dioxide, Photocatalysis, Photocatalyst, Photodegradation,
Photocatalytic Oxidation PCO
Cluster 10: Hot Gas Filtration
Hot Gas Filtration, Ceramic Materials, Ceramic Candle Filters, Pressurized Fluidized, Candle
Filters

245
Cluster 11: Electric Discharges
Electric Discharges, Electric Corona, Corona Discharge, Electret Filter
Cluster 12: Gas Chromatography (one analytical method for air sampling)
Mass Spectrometry, Gas Chromatography, Chromatographic Analysis, Polycyclic Aromatic
Hydrocarbons, High Performance Liquid Chromatography
Cluster 13: Nanofibers
Nanofibers, Electrospinning, Polymer Fibres, Nanofabrication
Cluster 14: Trace Elements
Zinc Compounds, Copper Compounds, Trace Elements, Fe, Pb
Cluster 15: Global Warming
Gas Emissions, Leakage Fluid, Global Warming, Greenhouse Gases
Cluster 16: Pore Size
Permeability, Pore Size, Nonwoven Fabrics, Air Permeability, Pore Size Distribution
Cluster 17: Adsorption
Adsorption, Activated Carbon AC, Adsorbents
Cluster 18: Particle Size Distribution

246
Particle Size, Particle Size Analysis, Size Distribution, Particle Size Distribution, Mobility
Particle Sizer, Shape Memory Effect
Cluster 19: Electrostatic Precipitator ESP
Flue Gases, Electrostatic Precipitator ESP, Electrostatic Separators
Cluster 20: Electron Microscopy SEM
Electron Microscopy SEM, X Ray Diffraction, SEM
Cluster 21: Porous Media
Porous Materials, Porous Media, Computational Fluid Dynamics, Flow Simulation, Fluid
Dynamics
5.2.7.2.3 Air filtration search in DII
The amount of words and phrases extracted from the titles and abstracts from retrieved
patents in DII was 177,974 before applying the ClusterSuite script in VantagePoint. After
ClusterSuite was applied, there were 8,795 words and phrases left. Manual check and clean-
up has reduced the number of key terms to 5,493. The top 500 keywords and phrases were
chosen to conduct the PCA analysis, and 15 clustered were yielded, with a 54% coverage (the
corresponding figure is included in Appendix C). Half of the clusters are mainly about the
applications, and the yielded applications covers liquid filters, absorbent materials, and barrier
fabrics. This indicates that the nonwoven process that produces air filtration medium can also

247
be used for other purposes. The rest of the clusters covers terms related to contaminants and
filter medium, such as materials, and structures.
All the key terms covered in the clusters are listed here.
Cluster 1: Wound Dressing
Face Masks, Vacuum Cleaner Filters, Medical Applications, Wound Dressing, Surgical
Drapes, Coffee Bags, Sanitary Material, Cushioning Material, Disposable Diaper, Furnace
Filters, Sound Insulation Materials
Cluster 2: Agricultural Machine
Filter Element, Internal Combustion Engine, Construction Machine, Agricultural Machine,
Power Generation Equipment
Cluster 3: Polytetrafluoroethylene Porous Membrane
Pressure Loss, Polytetrafluoroethylene Porous Membrane, Electrospinning Method
Cluster 4: Waste Gas Filter
Diesel Engine Vehicle, Honey-Comb Filter, Ceramic Filter, Carbon Dioxide, Waste Gas Filter,
Carbon Monoxide, Diesel Particulate Filter, Gasoline Engine, Catalyst Carrier, Cleaning
Engine Combustion Air, Combustion Furnace, Gas Turbine System
Cluster 5: Basis Weight
Basis Weight, Fabric Weight, Non-Woven Fabric, Air Permeability, Melt Blow Method,
Average Fiber Diameter, Melting Point, Fiber Web

248
Cluster 6: Surgical Gown
Surgical Gown, Vacuum Cleaner Bag, Surgical Drapes, Sanitary Napkins
Cluster 7: Air Filter Cartridge
Filter Cartridge, Air Filter Cartridge, Air Cleaner Assembly, Media Pack, Power Generation
Equipment, Cleaning Engine Combustion Air
Cluster 8: Base Fabric
Glass Fiber, Air Permeable Support Material, Carbon Fiber, Composite Fiber, Short Fiber,
Natural Fiber, Metal Fibers, Bicomponent Fibers, Inorganic Fibers, Base Fabric, Activated
Carbon Particles, Organic Fiber, Second Fiber, Ceramic Fibers, Cotton Fibers, Nonwoven
Fabric Substrate, Filter Substrate
Cluster 9: ULPA Filter
Clean Room, High Efficiency Particulate Air HEPA Filter, Semiconductor Industry, Food
Industry, ULPA Filter, Pharmaceutical Industry, Clean Room Filter
Cluster 10: Silicon Dioxide
Titanium Dioxide, Silicon Dioxide, Aluminum Oxide
Cluster 11: Liquid Filter
Liquid Filter, Chemical Resistance

249
Cluster 12: Clean Room Filter
Cabin Air Filter, Vacuum Cleaner Filters, Clean Room Filter
Cluster 13: Pleated Filter Media
Filter Medium, Pleated Filter Media, Pleated Filter, Pleat Shape, Pleat Tips
Cluster 14: Oil Filter
Oil Filter, Fuel Filter
Cluster 15: Air Cleaner
Air Cleaner, Air Conditioner, Air Purifier, Air Purification Filter, Ultraviolet Lamp, Active
Carbon Filter, Peculiar Smell, HVAC System, Negative Ion Generator
5.2.7.2.4 Air filtration search in ABI
After applying NLP algorithms, the keywords and phrases based on the titles and
abstracts yielded from ABI air filtration searches were condensed to 2,416 key terms. Further
clean-up procedure reduced the key terms to 665 to perform clustering. One reason for much
smaller amount of key terms yielded is that trade journals use lots of generic terms and non-
technical words and phrases, which are not exclusive for air filter media manufacturing. Thus,
not a lot of technical information can be generated from the retrieved records, nor are there a
lot of technical information that is of high value. The following clustering results covered only

250
12% of the 12,592 records from ABI (see Appendix C for the corresponding figure). The terms
covered in the clusters are listed in this section.
Cluster 1: Carbon Monoxide Gas
Engine Oil, High Temperatures, Cabin Air, Aircraft Cabin, Hydraulic Fluids, Auxiliary Power
Unit APU, Carbon Monoxide Gas
Cluster 2: Greenhouse Gases
Power Plant, Global Warming, Sulfur Dioxide, Greenhouse Gases
Cluster 3: Filtration Efficiency
Pressure Drop, Particle Size, Resistance, Filtration Efficiency, ASHARE Standard 52.2, Filter
Efficiency, MERV, Lower Pressure Drop
Cluster 4: IAQ
Indoor Air Quality, IAQ, IAQ Problems
Cluster 5: Respirators
Respirators, Occupational Safety, Respiratory Protection, Respiratory Protection Program, Fit
Testing
Cluster 6: Filter Element
Filter Element, Internal Combustion Engine, Motor Vehicle, Filter Housing, Filter Device

251
Cluster 7: Recirculated Air
Fresh Air, Outside Air, High-Efficiency Filters, High Efficiency Particulate Air Filters,
Pressure Differential, Recirculated Air, Industrial Hygienist
Cluster 8: Indoor Air Quality
Indoor Air Quality, Air Quality, Environmental Protection Agency, Indoor Air, Indoor Air
Pollution, Sick Building Syndrome
Cluster 9: Compressed Air
Compressed Air, Compressed Air System, Compressed Air Filters
Cluster 10: MERV 8
Airborne Particles, HVAC Air Filter Selections, MERV, MERV 8
Cluster 11: Indoor Environmental Quality
Indoor Air Quality, Ventilation, Ventilation Systems, Green Buildings, Indoor Environmental
Quality, Supply Air, Proper Ventilation
Cluster 12: Mold Remediation
Mold Growth, Mold Remediation, Toxic Mold

252
5.2.7.3 Technology Terms Trend Analyses
Nonwoven process technology wise, two line charts (Figure 5-27 and Figure 5-28)
listed the nonwoven web formation technology terms extracted from WOS and EV documents’
abstracts and DII patent abstracts by publication years and priority years, respectively. The
number on y-axis corresponds to the number of publications or patent application of that year
that has mentioned the technical terms.
Overall more hits on the web formation technology terms are compared between DII
and the cumulative hits of WOS and EV. Electrospinning had the most rapid growth in
nonwovens technologies, and this trend might correspond to the bigger interest in the R&D on
nano-scale fibers, which offers better performances for air filtration products. Only one record
mentioned flash spinning in S&T databases, and it was in 1993. Flash spinning was seen more
frequently in DII, and the earliest record was from 1996. Moreover, wet-laid is commonly seen
in air filtration medium production in either source, indicating the use of wet laid process for
air filter media. The longest time lag between the first occurrences in DII and WOS/EV is
spunbond technology, with a time lag of 16 years (DII in 1982, and WOS in 1998). Dry-laid,
spunbond, and meltblown are continuously growing in air filtration applications based on DII,
however they seem to be less studied in academia due to the lower frequencies. The use of
bicomponent fibers started to bloom in mid 2000s in DII, but it remained single digits on the
hits in WOS and EV combined records. Other nonwoven non web formation techniques
commonly seen but not included in Figure 5-27 and Figure 5-28 are charging, needle punch,
and hollow fiber. Charging has received the most attention as a means to increase the efficiency
for air filtration over the past two decades from ST&I databases. Hollow fiber had very few
hits for a long time (since early 1990s) before finally started to pick up until recently.

253
The newest methods for producing air filter fabrics found from WOS and EV
publications are phase-separation (first occurrence was in 2009, not listed in Figures 5-27),
solution-blowing (2013), and centrifuge spinning (2013). For DII, the latest technology
identified was centrifuge spinning and self-assembly (both first occurrences were in 2006), and
phase-separation first appeared in 1991 (not listed in Figure 5-28). Solution-blowing was not
found in DII while electret film split fiber was not discovered in WOS and EV.
The higher frequency of the technology terms found in DII might be partially because
the patents are generally more technology oriented. Moreover, the R&D in nonwovens are
mostly driven by industry, but not much by academia, owing to the expensive cost of
machinery and the demand of large scale production. The higher hits resulting from DII also
confirmed that the nonwovens industry depends highly on patents.
Figure 5-27. Nonwoven web formation technology terms identified from abstracts across the publication years in WOS and EV combined dataset
0
5
10
15
20
25
30
35
meltblown dry-laid spunbond
bicomponent electrospinning wet-laid
solution-blowing flash-spinning centrifuge spinning
self-assembly

254
Figure 5-28. Nonwoven web formation technology terms identified from abstracts across the publication years in DII
5.2.8 Research Networking Analysis
Network analysis can be done at different levels, among countries, organizations, and
individual researchers. Based on the top organizations in publishing air filtration related
research in WOS, a research organizations collaboration network can be built using an auto-
correlation map (see Figure 5-29). In the map, the dotted lines indicate the collaborations
among the organizations, and the information box listed the organization name and their top
four collaborators, with the corresponding numbers of the publications and the publications
they collaborate on. For example, NIOSH has collaborated the most (18 papers) with URS
Corporation (a government contractor), and it published seven papers with University of
Cincinnati (NIOSH has a division in Cincinnati). However, none of the top organizations
0
5
10
15
20
25
30
35
1982
1983
1984
1987
1988
1989
1990
1991
1992
1993
1994
1995
1996
1997
1998
1999
2000
2001
2002
2003
2004
2005
2006
2007
2008
2009
2010
2011
2012
2013
2014
2015
meltblown dry-laid spunbond
bicomponent electrospinning wet-laid
electret film split fibres flash-spinning centrifuge spinning
self-assembly

255
collaborate at a higher level (>0.25). But that does not mean they do not collaborate at a higher
level with other organizations. One instance is North Carolina State University (NCSU), who
collaborated with Virginia Commonwealth University on 12 papers out of 50 total publications
by NCSU, but Virginia Commonwealth University is not shown in Figure 5-29 because it is
not one of the top organizations selected. With more organizations included, the correlation
relationship will change, however only top 25 organizations are included for this analysis in
Figure 5-29.
Another observation is that the research clusters are affected by the subject categories
to some extent. Figure 5-30 depicted the auto-correlation relationships on the Macro-
Disciplines based on the journals that the top organizations have published in. Most of them
are highly correlated with each other in terms of the research areas, and Environmental Science
and Technology is the top category for most of the top organizations. To confirm this, a cross-
correlation map between the affiliations and the publications sources was constructed to
examine if the top 25 organizations published in the same journals as a way to further compare
their research focuses (see Figure 5-31).
Indicated by the information listed in Figure 5-31, 3M and University of Cincinnati has
the highest correlation, implying that both organizations have been working on similar areas
as they published in very similar journals.

256
Figure 5-29. Top organization collaboration auto-correlation map from air filtration search in WOS

257
Figure 5-30. Macro-Disciplines of top organizations in WOS

258
Figure 5-31. Cross-correlation of top 25 organizations from air filtration search in WOS
based on their published sources
In addition, a citation network analysis was performed to identify how the researchers
from the top organizations cite and if they cite similar publications (see Figure 5-32).
Figure 5-32 targets the publications with a higher frequency of being cited, and the map
is based on the cross-correlation between the top organizations and papers cited >=50 times
from 1990 to 2015. The thicker the line is, the higher the correlation the organizations have,

259
and it means the more likely the organizations cite the same work. National Taiwan University
and Technical University of Denmark, 3M and University of Cincinnati are the ones with the
two highest correlations (>0.9), indicated by the correlation scores in Figure 5-33 and Figure
5-34.
All the figures (Figure 5-30, Figure 5-31, and Figure 5-32) illustrate the shared research
interests among the participants based on their likelihood to publish in the same areas or
research journals, and whether they cite the same papers.

260
Figure 5-32. Citation correlation map on top organizations and papers cited >=50 times in WOS
Figure 5-33. Close-up on the correlations between publications by University of Cincinnati and 3M Company
Figure 5-34. Close-up on the correlation between National Taiwan University and Technical University of Denmark
5.3 Research Profiling on the State of the Art of Selected Nonwoven Technologies
Trend analysis was performed first based on the retrievable bibliometric information
from each of the databases. A clustering analysis based on the nanofiber seed query search in
WOS was conducted to discover the information from WOS records. Again ClusterSuite in

261
VantagePoint was applied to perform PCA analysis to yield topical information on DII records.
Those analyses can serve as a good general overview of the current stage of the development
on the nonwoven technologies, especially the techniques for making micro, submicron,
ultrafine, and nano fibers.
5.3.1 Research Activity Trend Analyses
5.3.1.1 Trends on nonwoven technologies from WOS
The trend in publications about nonwoven technologies, including micro and
nanofibers, is displayed in Figure 5-35. From 1990 to 1991, the publication volume doubled
from 108 to 216, resulting in the highest CAGR. With continuous interest and growth in
making micro and nanofibers, the number of records reached 33,266 in 2014 and 34,119 in
2015 (by the time of data collection in April, 2016). The total number of publications added
to 274,394 until the year 2015, and the average CAGR from 1990 to 2014 (records from 2015
are not complete due to time lag) is 28.20%. There has been a continuous growth in micro and
nanofiber research publications.

262
Figure 5-35. Publication trend in nonwoven technologies for making micro and nanofibers in WOS
5.3.1.2 Trend analysis on nonwoven technologies from EV
In EV database, the search on nonwoven technologies, including the production of
micro and nanofibers, has yielded 322,715 records without performing any data cleaning. The
Compendex and Inspec databases overlap to some degree, and there is no way to remove the
duplicates without importing and going through all the records (when multiple databases are
chosen within EV, the search engine only provides the capability to remove duplicated records
for the first 1000 records, and can only view the first 4000 records resulting from any search
query), so only Compendex is chosen as it yields more results (189,800 records from
Compendex vs. 132,915 records from Inspec) and contains minimum number of duplicates
since the search is conducted in only one database.
In Compendex, the CAGR is 24.05%, which is a bit lower than that of WOS. The
cumulative trends in EV and WOS look alike, although the numbers for each year’s
publications are different for each of the databases (see Figure 5-36 for the trend in EV). The
0
50000
100000
150000
200000
250000
300000
0
5000
10000
15000
20000
25000
30000
35000
40000
1990 1992 1994 1996 1998 2000 2002 2004 2006 2008 2010 2012 2014
Num
ber o
f Pub
licat
ions
Publication Years
# of Records Cumulative Records
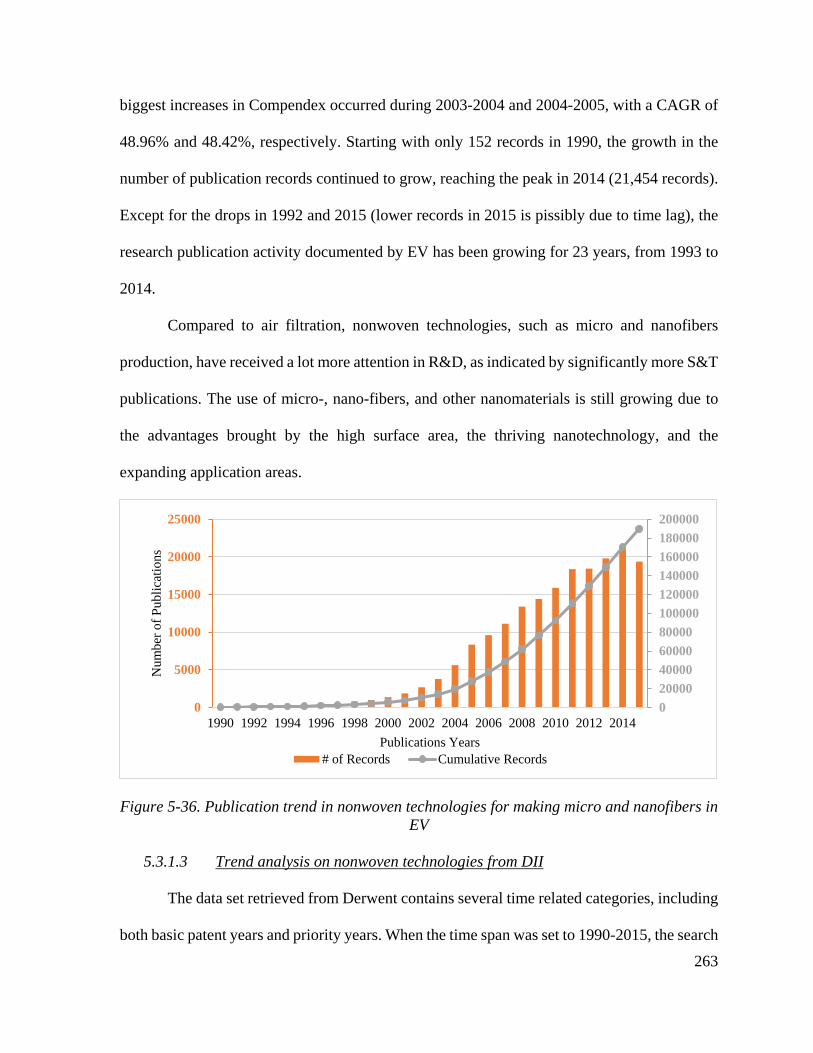
263
biggest increases in Compendex occurred during 2003-2004 and 2004-2005, with a CAGR of
48.96% and 48.42%, respectively. Starting with only 152 records in 1990, the growth in the
number of publication records continued to grow, reaching the peak in 2014 (21,454 records).
Except for the drops in 1992 and 2015 (lower records in 2015 is pissibly due to time lag), the
research publication activity documented by EV has been growing for 23 years, from 1993 to
2014.
Compared to air filtration, nonwoven technologies, such as micro and nanofibers
production, have received a lot more attention in R&D, as indicated by significantly more S&T
publications. The use of micro-, nano-fibers, and other nanomaterials is still growing due to
the advantages brought by the high surface area, the thriving nanotechnology, and the
expanding application areas.
Figure 5-36. Publication trend in nonwoven technologies for making micro and nanofibers in EV
5.3.1.3 Trend analysis on nonwoven technologies from DII
The data set retrieved from Derwent contains several time related categories, including
both basic patent years and priority years. When the time span was set to 1990-2015, the search
020000400006000080000100000120000140000160000180000200000
0
5000
10000
15000
20000
25000
1990 1992 1994 1996 1998 2000 2002 2004 2006 2008 2010 2012 2014
Num
ber o
f Pub
licat
ions
Publications Years# of Records Cumulative Records

264
query set retrieved 16,917 records, indicating the number of patent families. After cleaning up,
16,885 records are used for the analysis in Figure 5-37. As mentioned in 5.2.1.3, “basic patent
years” is the closest to the time span in the search field in DII. The CAGR for the patent
families is at 13.17% from 1990 to 2014, with the fastest growth from 2000 to 2013 with a
CAGR high than 40% each year. “Priority years” corresponds to the years on the first date
when patent documents are filed, so the sum of the records from “priority years” indicate the
amount of patent applications being filed worldwide. Hence, a total of 21,449 applications are
filed over a span of 37 years (1979 to 2016). To compare the patent applications based on the
priority years using the same timeframe, Figure 5-38 showcases the trend in the development
of patenting activities regarding the use of fine fibers and the technologies for making micro,
submicron, and nanofibers from 1990-2015, and the CAGR for patent applications based on
priority years is 10.49%. From 1998 to 2003 is the time phase with the highest increases in
patent applications (46.11% from 1998 to 1999, 30.33% from 1999 to 2000, 55.97% from 2000
to 2011, 26.81% from 2011 to 2012, and 28.14% from 2012 to 2013). Based on the time lag
calculation, from priority years to basic patent year, 41.97% of the patent families lagged one
year from making a claim to the patent office to being indexed into DII, 40.26% of them lagged
two years, and 1.46% lagged three years.
The numbers of IPC codes from each priority years are also included in Figure 5-38 to
measure the growth in the scope and expansion of the patenting activities on nonwoven
technologies. The yellow bars represent the trends in IPC codes (8 digits) as a reflection on the
changes of the IPC codes in the R&D scope. The high speed in the expansion in IPC codes
continue from 1980s until 2011, owing to the interdisciplinary nature of nanotechnology,
higher demand, and its expanding application areas. The 171 patent applications in 1990 took

265
up 1,008 IPC codes, meaning one patent application was filed under almost 6 IPC categories
on average; 1,913 patents are retrieved from 2008, occupying 13,182 IPC codes, an average of
8 categories for one patent. The increase in the numbers of the IPC codes suggested the
growing collaboration among sub-technology fields.
Figure 5-37. Patent trend in nonwoven technologies for making micro and nanofibers based on basic patent years
0
2000
4000
6000
8000
10000
12000
14000
16000
18000
0
200
400
600
800
1000
1200
1400
1600
1800
1990 1992 1994 1996 1998 2000 2002 2004 2006 2008 2010 2012 2014
Num
ber o
f Pat
ent F
amily
DII Basic Patent Years# Records Cumulative Records

266
Figure 5-38. Patent trend in nonwoven technologies for making micro and nanofibers based on priority years
5.3.1.4 Trend analysis on nonwoven technologies from ABI
ABI database concentrates on business information, so the collection of information on
the production of micro, submicron, and nanofibers features company information such as
patent approval, increased manufacturing capacity, and new business venture opportunities.
Such information probably may not carry the same weight as the ST&I publications, however
it can reveal the trend in the market. As shown in Figure 5-39, there is a huge spike in 2008,
indicating a sudden growth in the business information. The huge increase might reflect higher
interest from the market because Elmarco started to introduce a commercial scale nanofiber
producing device-Nanospider in 2004, and opened its offices in U.S. and Japan in 2008.
0
5000
10000
15000
20000
25000
0
2000
4000
6000
8000
10000
12000
14000
16000
1979 1982 1985 1988 1991 1994 1997 2000 2003 2006 2009 2012 2015
Num
ber o
f Pat
ent A
pplic
atio
nsO
R IP
Cs
Patent Priority Years
# Records Number of IPCs Cumulative Records
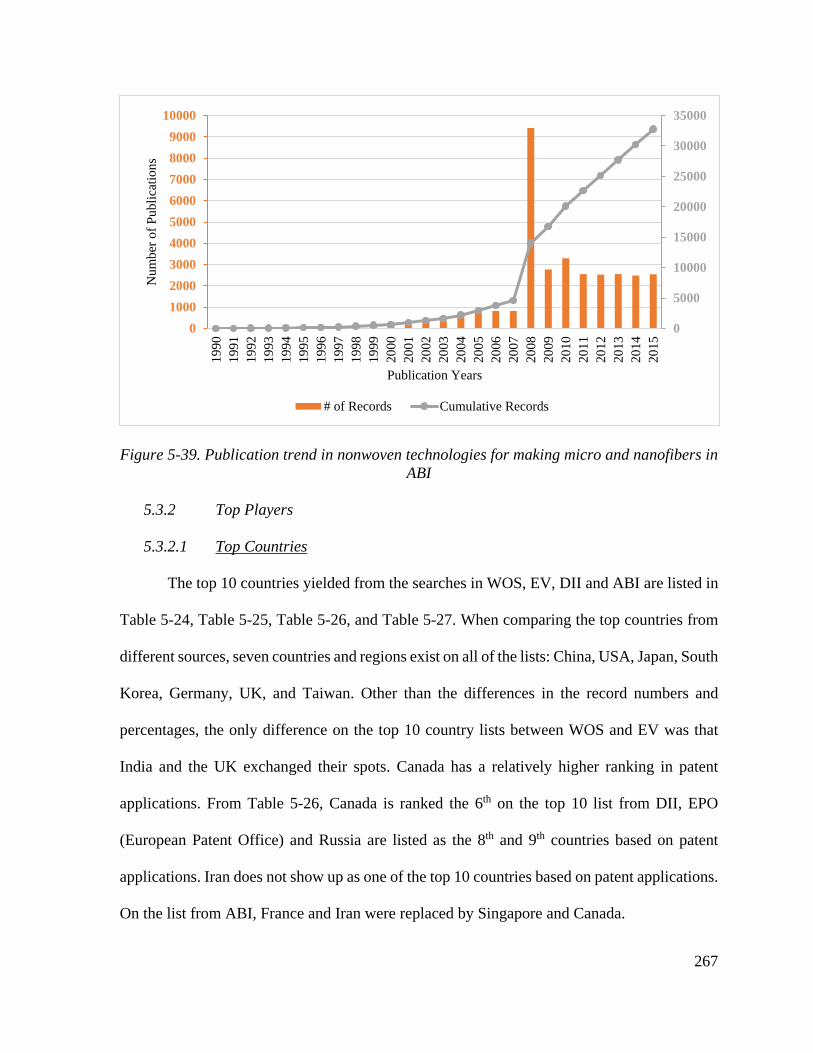
267
Figure 5-39. Publication trend in nonwoven technologies for making micro and nanofibers in ABI
5.3.2 Top Players
5.3.2.1 Top Countries
The top 10 countries yielded from the searches in WOS, EV, DII and ABI are listed in
Table 5-24, Table 5-25, Table 5-26, and Table 5-27. When comparing the top countries from
different sources, seven countries and regions exist on all of the lists: China, USA, Japan, South
Korea, Germany, UK, and Taiwan. Other than the differences in the record numbers and
percentages, the only difference on the top 10 country lists between WOS and EV was that
India and the UK exchanged their spots. Canada has a relatively higher ranking in patent
applications. From Table 5-26, Canada is ranked the 6th on the top 10 list from DII, EPO
(European Patent Office) and Russia are listed as the 8th and 9th countries based on patent
applications. Iran does not show up as one of the top 10 countries based on patent applications.
On the list from ABI, France and Iran were replaced by Singapore and Canada.
0
5000
10000
15000
20000
25000
30000
35000
0100020003000400050006000700080009000
10000
1990
1991
1992
1993
1994
1995
1996
1997
1998
1999
2000
2001
2002
2003
2004
2005
2006
2007
2008
2009
2010
2011
2012
2013
2014
2015
Num
ber o
f Pub
licat
ions
Publication Years
# of Records Cumulative Records

268
Table 5-24 Top 10 countries in terms of nonwoven technologies for making micro and nanofibers in WOS
Ranking # of Records Percent Country 1 83533 30.44% China 2 58809 21.43% USA 3 20784 7.58% Japan 4 20588 7.50% South Korea 5 14086 5.13% Germany 6 12539 4.57% India 7 10826 3.95% UK 8 10075 3.67% France 9 8756 3.19% Taiwan 10 8262 3.01% Iran
Table 5-25 Top 10 countries in terms of nonwoven technologies for making micro and nanofibers in EV
Ranking # of Records Percent Country 1 50265 26.48% China 2 39150 20.63% USA 3 14889 7.84% Japan 4 14346 7.56% South Korea 5 9040 4.76% Germany 6 7130 3.76% UK 7 7055 3.72% India 8 6869 3.62% France 9 6234 3.28% Taiwan 10 4974 2.62% Iran
Table 5-26 Top 10 countries in terms of nonwoven technologies for making micro and nanofibers in DII
Ranking # of Records Percent Country 1 4668 19.73% China 2 4202 17.76% Japan 3 3676 15.54% USA 4 3461 14.63% South Korea 5 515 2.18% Germany 6 406 1.72% Canada 7 393 1.66% Taiwan 8 362 1.53% European Patent Office

269
9 335 1.42% Russia 10 251 1.06% France
Table 5-27 Top 10 countries in terms of nonwoven technologies for making micro and nanofibers in ABI
Ranking # of Records Percent Country 1 4,353 13.29% USA 2 2,661 8.13% China 3 849 2.59% South Korea 4 533 1.63% UK 5 483 1.48% Japan 6 226 0.69% Singapore 7 219 0.67% India 8 217 0.66% Germany 9 185 0.56% Taiwan 10 122 0.37% Canada
5.3.2.2 Top Organizations
In this section, top organizations are listed in Table 5-28, Table 5-29, and Table 5-30.
It is hard to compare the affiliations between Compendex and WOS because the organizations
from WOS utilizes university systems as a unit, while EV uses individual department as the
measuring unit. However, some universities are retrieved in both databases as the top
organizations, including Chinese Academy of Sciences, University of California system,
Nanyang Technological University, National University of Singapore, University System of
Georgia (including Georgia Tech), and MIT.
On the top organizations list provided by DII (Table 5-30), 17 of them are companies,
and eight are research institutes (four South Korean universities, three are universities from
China, and one government funded research organization from France). But none of the U.S.
research organizations made it onto the list, while Chinese universities tend to publish more
patents overall. From the top organizations list in which the U.S. is chosen as the priority
country, one national laboratory and seven universities are mentioned (see Table 5-31).

270
Organizations publishing in trade journals were not able to be identified directly using
ABI search engine, nor was it able to download or process the records due to the high volume.
Table 5-28 Top 25 organizations from WOS Ranking # of
Records Top 25 Affiliations
1 15404 CHINESE ACADEMY OF SCIENCES 2 6655 CENTRE NATIONAL DE LA RECHERCHE SCIENTIFIQUE CNRS 3 5408 UNIVERSITY OF CALIFORNIA SYSTEM 4 5060 UNITED STATES DEPARTMENT OF ENERGY DOE 5 3989 TSINGHUA UNIVERSITY 6 3346 RUSSIAN ACADEMY OF SCIENCES 7 3258 NANYANG TECHNOLOGICAL UNIVERSITY 8 2936 NATIONAL UNIVERSITY OF SINGAPORE 9 2885 ZHEJIANG UNIVERSITY 10 2841 PEKING UNIVERSITY 11 2652 MAX PLANCK SOCIETY 12 2548 INDIAN INSTITUTE OF TECHNOLOGY IIT 13 2467 UNIVERSITY OF SCIENCE TECHNOLOGY OF CHINA 14 2339 NANJING UNIVERSITY 15 2255 UNIVERSITY SYSTEM OF GEORGIA 16 2247 JAPAN SCIENCE TECHNOLOGY AGENCY JST 17 2232 MASSACHUSETTS INSTITUTE OF TECHNOLOGY MIT 18 2206 COUNCIL OF SCIENTIFIC INDUSTRIAL RESEARCH CSIR INDIA 19 2186 SEOUL NATIONAL UNIVERSITY 20 2147 NATIONAL INSTITUTE OF ADVANCED INDUSTRIAL SCIENCE
TECHNOLOGY AIST 21 2102 PENNSYLVANIA COMMONWEALTH SYSTEM OF HIGHER
EDUCATION PCSHE 22 2086 JILIN UNIVERSITY 23 2077 FLORIDA STATE UNIVERSITY SYSTEM 24 2021 ISLAMIC AZAD UNIVERSITY 25 1934 CONSEJO SUPERIOR DE INVESTIGACIONES CIENTIFICAS CSIC
Table 5-29 Top 25 organizations from EV Ranking # of
Records Top 25 Affiliations
1 527 School of Materials Science and Engineering, Georgia Institute of Technology
2 499 School of Materials Science and Engineering, Nanyang Technological University
3 393 Department of Materials Science and Engineering, National Tsing Hua University
4 336 University of Chinese Academy of Sciences 5 329 Graduate School, Chinese Academy of Sciences

271
6 311 School of Chemical and Biomedical Engineering, Nanyang Technological University
7 298 School of Electrical and Electronic Engineering, Nanyang Technological University
8 295 Department of Engineering, University of Cambridge 9 290 Department of Materials Science and Engineering, Yonsei
University 10 279 Department of Chemistry, University of California 11 278 Department of Mechanical Engineering, National University of
Singapore 12 262 Department of Chemical and Biomolecular Engineering,
National University of Singapore 13 257 Beijing National Laboratory for Condensed Matter Physics,
Institute of Physics, Chinese Academy of Sciences 14 255 Department of Materials Science and Engineering,
Northwestern University 15 252 Department of Physics and Materials Science, City University
of Hong Kong 16 251 National Institute of Standards and Technology 17 246 School of Mechanical and Aerospace Engineering, Nanyang
Technological University 18 245 Department of Chemical Engineering, Massachusetts Institute
of Technology 19 243 Department of Materials Science and Engineering,
Massachusetts Institute of Technology 20 243 Department of Materials Science and Metallurgy, University of
Cambridge 21 235 Sandia National Laboratories 22 230 College of Textiles, Donghua University 23 229 Shenyang National Laboratory for Materials Science, Institute
of Metal Research, Chinese Academy of Sciences 24 214 National Center for Nanoscience and Technology 25 211 IEEE
Table 5-30 Top 25 organizations from DII
Ranking # Records Top 25 Patent Assignees 1 455 HON HAI PRECISION IND CO LTD 2 422 TORAY IND INC 3 357 UNIV DONGHUA 4 328 UNIV TSINGHUA 5 289 SAMSUNG ELECTRONICS CO LTD 6 231 TEIJIN LTD 7 224 KURARAY CO LTD 8 202 UNITIKA LTD

272
9 200 KOREA ADV INST SCI&TECHNOLOGY 10 183 KIMBERLY-CLARK WORLDWIDE INC 11 170 MATSUSHITA ELECTRIC WORKS LTD 12 160 E I DU PONT DE NEMOURS & CO 13 147 UNIV BEIJING CHEM TECHNOLOGY 14 146 DOKURITSU GYOSEI HOJIN SANGYO GIJUTSU SO 15 146 UNIV SEOUL NAT IND FOUND 16 130 INT BUSINESS MACHINES CORP 17 127 TOYOBO KK 18 124 MITSUBISHI RAYON CO LTD 19 111 DOKURITSU GYOSEI HOJIN BUSSHITSU ZAIRYO 20 105 COMMISSARIAT ENERGIE ATOMIQUE 21 101 UNIV KOREA IND & ACCADEMIC COOP GROUP 22 95 UNIV YONSEI IND ACADEMIC COOP FOUND 23 94 3M INNOVATIVE PROPERTIES CO 24 91 ASAHI CHEM IND CO LTD 25 90 LG CHEM LTD
Table 5-31 Top 25 organizations from DII with U.S. listed as priority countries
Ranking # Records Top 25 Patent Assignees 1 180 KIMBERLY-CLARK WORLDWIDE INC 2 149 E I DU PONT DE NEMOURS & CO 3 125 INT BUSINESS MACHINES CORP 4 83 3M INNOVATIVE PROPERTIES CO 5 73 UNIV CALIFORNIA 6 67 UNIV RICE WILLIAM MARSH 7 59 PROCTER & GAMBLE CO 8 48 LOCKHEED MARTIN CORP 9 46 MASSACHUSETTS INST TECHNOLOGY
Table 5-31 (continued) 10 43 DOW GLOBAL TECHNOLOGIES INC 11 38 APPLIED NANOSTRUCTURED
SOLUTIONS LLC 12 37 NANOSYS INC 13 36 EASTMAN CHEM CO 13 36 INTEL CORP 15 35 HEWLETT-PACKARD DEV CO LP 15 35 HONDA MOTOR CO LTD 15 35 NANTERO INC

273
15 35 SAMSUNG ELECTRONICS CO LTD 19 31 UNIV CORNELL 19 31 UNIV FLORIDA RES FOUND INC 21 30 CARESTREAM HEALTH INC 21 30 FIBERWEB INC 21 30 HARVARD COLLEGE 21 30 UNIV TEXAS SYSTEM 25 29 EXXON CHEM PATENTS INC 25 29 HYPERION CATALYSIS INT INC 25 29 LOS ALAMOS NAT SECURITY LLC
5.3.3 Top Publication Sources
The sources where the publications on the use of nonwoven technologies to make micro and
nanofibers are found from WOS, EV, and ABI, and they are all listed in this section.
5.3.3.1 Top Publication Sources in WOS
The top sources with the most publications on micro and nanofiber and their associated
nonwoven technologies in WOS are listed in Table 5-32. The number of retrieved records
using nonwoven technologies that can produce micro and nanofibers search queries is a lot
bigger than the number from the air filtration search query set.
Table 5-32 Top 25 journals with the most publications on nano and microfiber and their associated nonwoven technologies in WOS Ranking # of Records Source
1 6872 APPLIED PHYSICS LETTERS 2 5437 PHYSICAL REVIEW B 3 5286 NANOTECHNOLOGY 4 5089 JOURNAL OF PHYSICAL CHEMISTRY C 5 4428 NANO LETTERS

274
6 4310 RSC ADVANCES 7 3982 CARBON 8 3909 JOURNAL OF NANOSCIENCE AND NANOTECHNOLOGY 9 3759 JOURNAL OF APPLIED PHYSICS 10 2969 ELECTROCHIMICA ACTA 11 2789 MATERIALS LETTERS 12 2672 ACS APPLIED MATERIALS INTERFACES 13 2600 JOURNAL OF MATERIALS CHEMISTRY 14 2553 NANOSCALE 15 2550 ADVANCED MATERIALS 16 2528 ACS NANO 17 2493 APPLIED SURFACE SCIENCE 18 2401 JOURNAL OF THE AMERICAN CHEMICAL SOCIETY 19 2342 CHEMICAL COMMUNICATIONS 20 2253 JOURNAL OF APPLIED POLYMER SCIENCE 21 2219 LANGMUIR 22 2168 JOURNAL OF MATERIALS CHEMISTRY A 23 2120 JOURNAL OF MEMBRANE SCIENCE 24 2084 ADVANCED MATERIALS RESEARCH 25 2076 CHEMICAL PHYSICS LETTERS
5.3.3.2 Top Publication Sources in EV
Table 5-33 lists the top 25 journals retrieved from EV. When comparing the sources
between WOS and EV, they share the majority of the top journals (22 journals in common).
This confirms that there are duplicated records retrieved from both databases. Overall the
number of records retrieved from EV is lower than the same journal from WOS, for example,
Nanotechnology yielded 4,162 records in EV while 5,286 records were retrieved in WOS.
Table 5-33 Top 25 journals with the most publications on nano and microfiber and their associated nonwoven technologies in EV Ranking # of
Records Source
1 5679 Applied Physics Letters 2 4162 Nanotechnology

275
3 3492 Proceedings of SPIE - The International Society for Optical Engineering
4 3486 Carbon 5 3282 Journal of Physical Chemistry C 6 3259 Nano Letters 7 2892 Journal of Applied Physics 8 2744 Journal of Nanoscience and Nanotechnology 9 2393 Advanced Materials Research 10 2297 RSC Advances 11 2053 Materials Research Society Symposium Proceedings 12 1875 Journal of Applied Polymer Science 13 1864 Materials Letters 14 1813 ACS Nano 15 1783 Advanced Materials 16 1762 Electrochimica Acta 17 1660 Applied Surface Science 18 1594 ACS Applied Materials and Interfaces 19 1573 Journal of Membrane Science 20 1547 Journal of The American Chemical Society 21 1521 Journal of Materials Chemistry 22 1497 Journal of Physical Chemistry B 23 1451 Nanoscale 24 1416 Langmuir 25 1407 Physical Review Letters
5.3.3.3 Top Publication Sources in ABI
The most published journal in this category has retrieved almost 7,500 records, making
it the top one trade journal in terms of the number of retrieved records, and there are seven
trade journals that has retrieved more than 1,000 records (see Table 5-34). Compared to the
sources from WOS and EV, regardless of the journals, the overall amount of retrieved records
from one journal is much lower in ABI (except for Nanotechnology Business Journal).
Table 5-34 Top 25 journals with the most publications on nano and microfiber and their associated nonwoven technologies in ABI
Ranking # of Records Source 1 7,484 Nanotechnology Business Journal

276
2 4,863 Technology News Focus 3 2,221 Technology & Business Journal 4 1,903 Energy Weekly News 5 1,894 Biotech Week 6 1,724 Electronics Business Journal 7 1,297 Biotech Business Week 8 781 Chemical Business Newsbase 9 721 Politics & Government Week 10 695 Engineering Business Journal 11 373 Wireless News 12 322 Computer Weekly News 13 309 Electronic Engineering Times 14 261 Chemicals & Chemistry Business 15 226 Chemical Engineering Progress 16 210 PR Newswire Europe Including UK Disclose 17 196 Chemical & Engineering News 18 192 Telecommunications Weekly 19 187 Textile World 20 179 Journal of Transportation 21 174 Professional Services Close - Up 22 168 Electronics Weekly 23 157 Pharma Business Week 24 154 Entertainment Close - Up 25 138 Food Weekly News
5.3.4 Hot Topics and Research Concentration Analyses
For nonwoven technologies that can be used to produce micro and nanofibers, a
Science Overlay Map (Figure 5-40) is constructed based on the search results yielded from
WOS. Fibers at micro and nanoscale as well as selected nonwoven manufacturing technologies
for making those fibers has yielded more R&D activities on chemistry and material sciences
areas based on the Macro-Disciplines of WOSC.

277
Figure 5-40. “Science Overlay Map” on nonwoven technologies for making micro and nanofibers in WOS
Based on the association rules, the retrieved records from the nanofiber seed query
search in WOS was processed using VOSviewer to perform clustering. Clusters are presented
in Figure 5-41, and they can be divided into three groups. The one on the left has the highest
number of records related to the seed query result, and it deals with nanostructure and
nanocomposite materials, suggesting that materials such as CNTs and CNFs are the most
frequently used. Graphene also has received attention. Conductivity associated with the nano
materials is also explored in this series of clusters, including applications in lithium ion battery
and supercapacitor. Sensors is another application area in which nanofibers can be utilized to
enhance its current performance. Process temperature, catalyst, and dispersion are the research
areas commonly seen in nanofiber research. It also covers a variety of characterization methods
used for nanofiber or nanocomposite fabrication, such as transmission electron microscopy,
and X ray diffraction. The second series of clusters is located on the top right, focusing on the

278
biomedical applications, such as tissue engineering, scaffolds, protein, and collagen. Self-
assembly is the most sought after method used for those applications. The last series of clusters
discloses electrospinning information. As the most mentioned method for producing
nanofibers, the materials and fiber diameter are the two major research areas of
electrospinning. More specifically, solution electrospinning is the dominant method for
producing nanofibers.
Figure 5-41. Clustering based on the nanofiber seed query search in WOS
Then clustering is performed using PCA analysis by ClusterSuite, and only the
retrieved DII records on the selected nonwoven technologies are able to be processed due to
the limit of the software. ClusterSuite decreased the number of words and phrases extracted
from the raw DII records significantly, from 251,543 to 7,722. After manual cleaning up, this
clustering process has utilized the top 400 terms for the PCA analysis, see Figure 5-42.

279
The clustering on the topic of nonwoven technologies for micro and nanofiber
manufacturing yields 18 clusters, and covers 68% of the total records (11,517 out of 16,286
records). The biggest clusters are the two clusters, namely those for carbon nanotubes (cluster
16) and carbon nanotube film (cluster 9). Some applications are connected with them, which
signals the usage of the conductivity possessed by the carbon nanomaterials applied on other
metal nanoscale materials (metal nanowire, silver nanowire), solar cell, gas sensor, fuel cell,
lithium battery, supercapacitor, and electronics products, including touch screens and liquid
crystal display. Also based on the clusters yielded, nonwoven technologies with a focus on
making micro and nanofibers have been involved with applications such as air filter, liquid
filter, and absorbent material for packaging and hygiene. The nonwoven processes resulted
from the clusters are bicomponent, electrospinning, and meltblown processes, and they are also
the main technologies that have been utilized to manufacture fibers with smaller diameters.
Furthermore, the clusters point out that both natural fibers and synthetic fibers are used to make
fibers at micro, submicron, and nanoscales. Overall, the abstracts and titles from the patent
documents provide a good overview of the selected nonwoven technologies and applications
related to micro and nanofibers. In addition, polymeric materials are also covered in the
clusters. However, the specific mechanisms on how the nonwoven processes and polymers
work and react, and why they work, are not well explained.
The 18 clusters covered the following words and phrases:
Cluster 1: Sheath Portion
Core-Sheath Type Composite Fiber, Core Portion, Sheath Portion
Cluster 2: Deionized Water

280
Deionized Water, Mixed Solution, Volume Ratio, Nitric Acid, Hydrochloric Acid, Sulfuric
Acid
Cluster 3: Absorbent Article
Nonwoven Web, Sanitary Napkins, Training Pants, Absorbent Article, Feminine Hygiene
Products
Cluster 4: Air Filter
Melt-Blown Nonwoven Fabric, Average Fiber Diameter, Air Filter, Fabric Weight, Liquid
Filter
Cluster 5: Carbon Source Gas
Carrier Gas, Carbon Source Gas
Cluster 6: Sea-Island Type Composite Fiber
Island Component, Sea Component, Sea-Island Type Composite Fiber
Cluster 7: Polypropylene
Polypropylene, Polyamide, Polyolefin, Polyvinyl Alcohol, Polyethylene, Chitosan,
Polyethylene Terephthalate, Polyacrylonitrile, Polyurethane, Polylactic Acid, Polystyrene,
Polycaprolactone, Polyvinylidene Fluoride
Cluster 8: Staple Fibers

281
Polypropylene, Polyamide, Polyolefin, Bicomponent Fibers, Polyethylene, Melt-Blown Fiber,
Synthetic Fibers, Staple Fibers, Natural Fiber
Cluster 9: Carbon Nanotube Film
Carbon Nanotube CNT, Carbon Nanotube Film, Carbon Nanotube Structure, Carbon
Nanotube Array, Liquid Crystal Display, Touch Panel, Van Der Waals Attractive Force
Cluster 10: Absorption
Multicomponent Fiber, Hydroxide Ion, Functional Groups, Absorption, Glass Transition
Temperature, Packaging Material, Melt Blown Web, Surgical Gowns, Personal Care Products
Cluster 11: Core Component
Composite Fiber, Core Component, Sheath Component, Core-Sheath Type Composite Fiber
Cluster 12: Touch Screen
Solar Cell, Liquid Crystal Display, Light Emitting Diode, Transparent Electrode, Silver
Nanowires, Touch Panel, Metal Nanowire, Transparent Conductive Film, Touch Screen
Cluster 13: Relative Humidity
Polyvinylpyrrolidone, Relative Humidity, Inner Diameter, Spinning Device, Tubular Furnace
Cluster 14: Fuel Cell

282
Fuel Cell, Electrode Material, Lithium Ion Battery, Field Emission Display, Supercapacitor,
Secondary Battery, Gas Sensor, Electrical Double Layer Capacitor, Lithium Battery
Cluster 15: Nanofiber Manufacturing Apparatus
Manufacturing Nanofiber, Gas Flow, Nanofiber Manufacturing Apparatus
Cluster 16: Single-Walled Carbon Nanotubes
Carbon Nanotube CNT, Nanotubes, Single-Walled Carbon Nanotubes, Multi-Walled Carbon
Nanotubes
Cluster 17: Core Part
Core Part, Sheath Part
Cluster 18: Electrospinning
Nanofiber, Electrospinning

283
Figure 5-42. Clustering from PCA analysis based on DII selected nonwoven technologies related records

284
5.4 Research Profiling of the Use of Selected Nonwoven Technologies for Air Filter Media
5.4.1 Research Activity Trend Analyses
All the analysis in this section are based on the union of the records retrieved on air
filtration, and microfibers, nanofibers and their associated manufacturing methods, from WOS,
EV, DII, and ABI. Compared to the quantity of air filtration and selected nonwoven
technologies publications, publications on the use of micro and nanofibers manufactured from
those technologies in air filtration application are just a small fraction of the air filtration and
selected nonwoven technologies datasets.
5.4.1.1 Trend Analysis in WOS
The total records from WOS used for trend analysis are 303 records (see Figure 5-43).
The CAGR for publications on air filtration using selected nonwoven technologies from WOS
is 32.45% (from 1992 to 2014). The first record in WOS was found in 1992 (only one record),
and in 2014, the quantity increased to 40. By the time for the data collection (April, 2016), 63
records were retrieved from 2015, and it is more likely that there will be more records from
2015 after more publications being indexed into WOS in a few years.
Figure 5-43. Publications on air filtration using micro and nanofibers made from selected nonwoven technologies in WOS
0
50
100
150
200
250
300
350
0
10
20
30
40
50
60
70
1992 1994 1996 1998 2000 2002 2004 2006 2008 2010 2012 2014
Num
ber o
f Pub
licat
ions
Publication Years# Records Cumulative Records

285
5.4.1.2 Trend Analysis in EV
After cleaning up the retrieved datasets from Compendex and Inspec, 404 records are
kept to perform trend analyses (Figure 5-44). The records retrieved from EV started very low
on the topic of air filtration using micro and nanofibers as well as selected nonwoven
technologies, and the publication volume began to accelerate from 2000s. The largest increase
happened from 2007 to 2008 with a CAGR of 113.33%, and overall the CAGR is 11.98%.
Figure 5-44. Publications on air filtration using micro and nanofibers made from selected nonwoven technologies in EV
5.4.1.3 Trend Analysis in DII
DII yields 377 records, which reflects the number of the patent families, and the trend
based on “basic patent year” shows constant ups and downs (see Figure 5-45). After a
significant increase from 2005 to 2006, the fluctuations in the volume on a yearly basis has not
exceeded 30% in any year. The average CAGR from 1990 to 2015 is 24.37%.
0
50
100
150
200
250
300
350
400
450
0
10
20
30
40
50
60
1990 1992 1994 1996 1998 2000 2002 2004 2006 2008 2010 2012 2014
Num
ber o
f Pub
licat
ions
Publication Years
# Records Cumulative Records

286
Based on priority years (Figure 5-46), the total amount of records is 525, and the
timeframe traces from 2015 back to 1982 (34 years in total). With the earliest record found in
1982, no other record was retrieved from 1983 to 1987. The peak year was 2006, with 40
records retrieved. From 2005 to 2013, the changes in the numbers of annual patent applications
were fairly small, ranging from -5.56% to 14.29%. The CAGR from 1988 to 2014 is averaged
at 22.25%. However, the number of IPCs they have involved has grown dramatically (see
patterned vertical bars). It grew from 20 categories in 1990 to 483 in 2006, then the number of
IPC categories started to decline. Almost half of the patent families (48.28% of 377) indicate
a time lag between priority years and basic patent years of two years, 41.64% of the patent
families has a time lag of one year, and 5.31% of the records are indexed into Derwent the
same year when the patent is being filed.
Figure 5-45. Patents on air filtration using micro and nanofibers made from selected
nonwoven technologies in DII based on basic patent years
0
50
100
150
200
250
300
350
400
0
5
10
15
20
25
30
35
1990 1992 1994 1996 1998 2000 2002 2004 2006 2008 2010 2012 2014
Num
ber o
f Pat
ent F
amily
DII Basic Patent Years
# Records Cumulative Records

287
Figure 5-46. Patents on air filtration using micro and nanofibers made from selected
nonwoven technologies in DII based on priority years
5.4.1.4 Trend Analysis in ABI
ABI retrieves the least hits on the topic of air filtration using microfibers and
nanofibers. The first record was retrieved from 1994, and the gap between the first and the
second record was three years, from 1994 to 1998. Two largest increases were from 1997 to
1998 (162.50%), and from 2011 to 2013 (260.00%), and the trend is shown in Figure 5-47.
Figure 5-47. Publications on air filtration using micro and nanofibers made from selected nonwoven technologies in ABI
0
100
200
300
400
500
600
0
100
200
300
400
500
600
1990 1992 1994 1996 1998 2000 2002 2004 2006 2008 2010 2012 2014Num
ber o
f Pat
ent A
pplic
atio
ns o
r IPC
s
Patent Priority Years
# Records Number of IPCs Cumulative Records
0
50
100
150
200
250
05
10152025303540
1990 1992 1994 1996 1998 2000 2002 2004 2006 2008 2010 2012 2014
Num
ber o
f Pub
licat
ions
Publication Years
# Records Cumulative Records

288
5.4.2 Top Players
5.4.2.1 Top Countries
The top countries from records retrieved from WOS, EV, and DII are displayed in
Table 5-35, Table 5-36, and Table 5-37. ABI does not contain specific information regarding
the country. Among the top countries lists from three sources, six countries are seen on all the
lists: U.S., China, South Korea, Japan, Germany, and Czech Republic. When comparing WOS
and EV, nine out of the ten top countries were the same except for the differences in number
of records and rankings. Switzerland is only seen from WOS, while Saudi Arabia is only on
EV’s list. Japan is the top country in patenting activities, occupying 33.90% of patents globally,
and ranks fifth and fourth on lists from WOS and EV. Five other countries and regions appears
on the list from DII, and they are Canada, European Patent Office, Austria, Taiwan, and Russia.
Table 5-35 Top countries from publications on air filtration using micro and nanofibers made from selected nonwoven technologies in WOS
Ranking Country # Records Percent 1 USA 100 33.00% 2 China 71 23.43% 3 South Korea 39 12.87% 4 Poland 18 5.94% 5 Japan 15 4.95% 6 Czech Republic 10 3.30% 7 Turkey 9 2.97% 8 Germany 8 2.64% 8 Italy 8 2.64% 8 Switzerland 8 2.64% 8 UK 8 2.64%

289
Table 5-36 Top countries from publications on air filtration micro and nanofibers made from selected nonwoven technologies in EV
Ranking Country # Records Percent 1 USA 129 31.93% 2 China 90 22.28% 3 South Korea 24 5.94% 4 Japan 20 4.95% 5 Poland 18 4.46% 6 UK 17 4.21% 7 Germany 14 3.47% 8 Czech Republic 13 3.22% 9 Italy 10 2.48% 10 Saudi Arabia 8 1.98% 10 Spain 8 1.98% 10 Turkey 8 1.98%
Table 5-37 Top countries from patents on air filtration using micro and nanofibers made from selected nonwoven technologies in DII
Ranking Priority Countries # Records Percent 1 Japan 178 33.90% 2 USA 112 21.33% 3 South Korea 65 12.38% 4 China 41 7.81% 5 Germany 27 5.14% 6 Canada 13 2.48% 6 European Patent Office 13 2.48% 8 Austria 4 0.76% 8 Taiwan 4 0.76% 10 Czech Republic 3 0.57% 10 Russia 3 0.57%
5.4.2.2 Top Organizations
The research organizations publishing on the use of micro and nanofibers from selected
nonwoven technologies for air filtration purposes are listed from WOS, EV, and DII
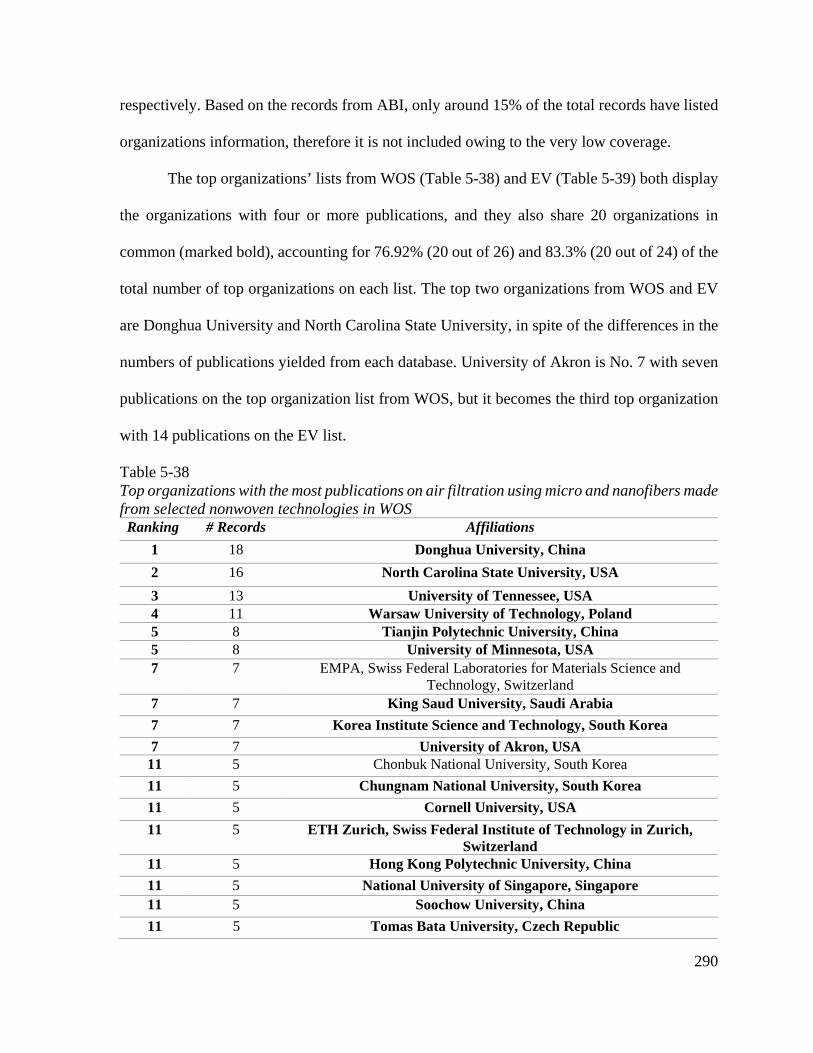
290
respectively. Based on the records from ABI, only around 15% of the total records have listed
organizations information, therefore it is not included owing to the very low coverage.
The top organizations’ lists from WOS (Table 5-38) and EV (Table 5-39) both display
the organizations with four or more publications, and they also share 20 organizations in
common (marked bold), accounting for 76.92% (20 out of 26) and 83.3% (20 out of 24) of the
total number of top organizations on each list. The top two organizations from WOS and EV
are Donghua University and North Carolina State University, in spite of the differences in the
numbers of publications yielded from each database. University of Akron is No. 7 with seven
publications on the top organization list from WOS, but it becomes the third top organization
with 14 publications on the EV list.
Table 5-38 Top organizations with the most publications on air filtration using micro and nanofibers made from selected nonwoven technologies in WOS Ranking # Records Affiliations
1 18 Donghua University, China 2 16 North Carolina State University, USA 3 13 University of Tennessee, USA 4 11 Warsaw University of Technology, Poland 5 8 Tianjin Polytechnic University, China 5 8 University of Minnesota, USA 7 7 EMPA, Swiss Federal Laboratories for Materials Science and
Technology, Switzerland 7 7 King Saud University, Saudi Arabia 7 7 Korea Institute Science and Technology, South Korea 7 7 University of Akron, USA
11 5 Chonbuk National University, South Korea 11 5 Chungnam National University, South Korea 11 5 Cornell University, USA 11 5 ETH Zurich, Swiss Federal Institute of Technology in Zurich,
Switzerland 11 5 Hong Kong Polytechnic University, China 11 5 National University of Singapore, Singapore 11 5 Soochow University, China 11 5 Tomas Bata University, Czech Republic

291
Table 5-38 (continued) 11 5 Tsinghua University, China 11 5 Virginia Commonwealth University, USA 21 4 Hanyang University, South Korea 21 4 Korea University, South Korea 21 4 National Institute of Advanced Industrial Science and Technology,
Japan 21 4 Seoul National University, South Korea 21 4 SPUR a.s., Czech Republic 21 4 Tanta University, Egypt
Table 5-39 Top organizations with the most publications on air filtration using micro and nanofibers made from selected nonwoven technologies in EV Ranking #
Records Affiliation
1 22 Donghua University, China 2 17 North Carolina State University, United States 3 14 University of Akron, United States 4 13 University of Tennessee, United States 5 12 Warsaw University of Technology, Poland 6 10 Tianjin Polytechnic University, China 6 10 Virginia Commonwealth University, United States 8 8 Auburn University, United States 9 7 King Saud University, Saudi Arabia 9 7 National University of Singapore, Singapore 9 7 SPUR a.s., Czech Republic 9 7 Tomas Bata University, Czech Republic 9 7 Tsinghua University, China 14 6 Hong Kong Polytechnic University, Hong Kong, China 14 6 University of Minnesota, United States 16 5 Chungnam National University, South Korea 16 5 Xiamen University, China 18 4 Cornell University, United States 18 4 ETH, Switzerland 18 4 Korea Institute of Science and Technology, South Korea 18 4 Massachusetts Institute of Technology, United States 18 4 National Institute of Advanced Industrial Science and Technology,
Japan 18 4 Soochow University, China 18 4 University of Manchester, United Kingdom

292
The top assignees (see Table 5-40) in DII consist of organizations with four or more
patents. The majority of them are corporations, and only three out of 26 are universities. Two
of those three universities, Donghua University and North Carolina State University, are also
the top two research organizations from WOS and EV, respectively.
Mann & Hummel, the company with the most patents on air filtration, drops to No. 20
on this list, and the main reason is because the company purchases roll goods for air filtration
products rather than producing roll goods. Japanese companies are the leaders in this area.
Toray, the top company in patenting air filter media using nanofibers, is listed as No. 4 on the
air filtration patent list with 196 patents, and also the No.2 company with 375 patents on the
list of nanofiber technology. Its R&D activities on using nanofibers for air filter media results
in 31 patent applications, occupying 15.82% of its total air filtration patents, and 8.22% of the
total number of patents on air filtration that mentioned the use of nanofibers globally. The No.
6 company from the air filtration list, 3M, maintains a similar percentage of patents that
incorporate the use of nanofibers versus its entire portfolio (15.30%). Leading organizations
on patenting air filtration products and the use of selected nonwoven technologies in air
filtration remarks their advantages in the nonwoven air filtration market, and they are more
likely to manufacture in-house, from the fibers to the end product.
Based on a sub-dataset that selects the U.S. as the only priority country (Table 5-41),
18 assignees have two or more patent publications. Eight of the 18 assignees are also seen on
the global top patent assignee list. Park J. C. from South Korea is the only individual patent
assignee that is seen on both top assignee list.
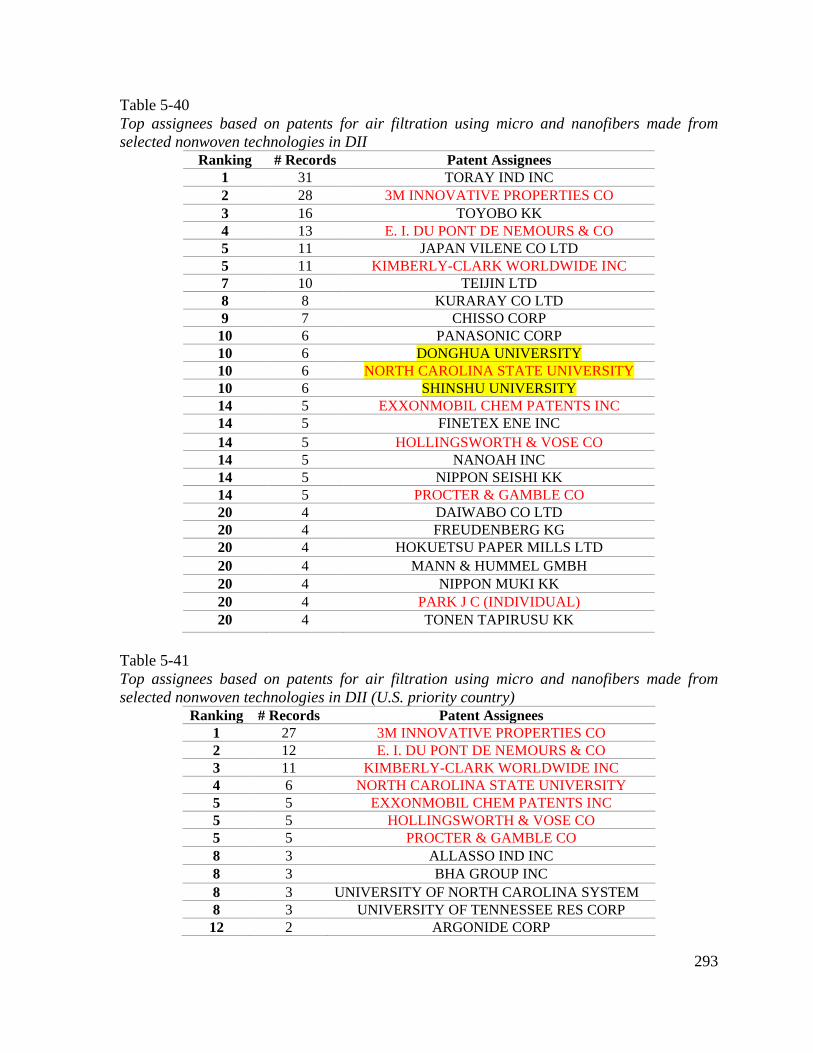
293
Table 5-40 Top assignees based on patents for air filtration using micro and nanofibers made from selected nonwoven technologies in DII
Ranking # Records Patent Assignees 1 31 TORAY IND INC 2 28 3M INNOVATIVE PROPERTIES CO 3 16 TOYOBO KK 4 13 E. I. DU PONT DE NEMOURS & CO 5 11 JAPAN VILENE CO LTD 5 11 KIMBERLY-CLARK WORLDWIDE INC 7 10 TEIJIN LTD 8 8 KURARAY CO LTD 9 7 CHISSO CORP
10 6 PANASONIC CORP 10 6 DONGHUA UNIVERSITY 10 6 NORTH CAROLINA STATE UNIVERSITY 10 6 SHINSHU UNIVERSITY 14 5 EXXONMOBIL CHEM PATENTS INC 14 5 FINETEX ENE INC 14 5 HOLLINGSWORTH & VOSE CO 14 5 NANOAH INC 14 5 NIPPON SEISHI KK 14 5 PROCTER & GAMBLE CO 20 4 DAIWABO CO LTD 20 4 FREUDENBERG KG 20 4 HOKUETSU PAPER MILLS LTD 20 4 MANN & HUMMEL GMBH 20 4 NIPPON MUKI KK 20 4 PARK J C (INDIVIDUAL) 20 4 TONEN TAPIRUSU KK
Table 5-41 Top assignees based on patents for air filtration using micro and nanofibers made from selected nonwoven technologies in DII (U.S. priority country)
Ranking # Records Patent Assignees 1 27 3M INNOVATIVE PROPERTIES CO 2 12 E. I. DU PONT DE NEMOURS & CO 3 11 KIMBERLY-CLARK WORLDWIDE INC 4 6 NORTH CAROLINA STATE UNIVERSITY 5 5 EXXONMOBIL CHEM PATENTS INC 5 5 HOLLINGSWORTH & VOSE CO 5 5 PROCTER & GAMBLE CO 8 3 ALLASSO IND INC 8 3 BHA GROUP INC 8 3 UNIVERSITY OF NORTH CAROLINA SYSTEM 8 3 UNIVERSITY OF TENNESSEE RES CORP 12 2 ARGONIDE CORP

294
Table 5-41 (continued) 12 2 DONALDSON CO INC 12 2 EASTMAN CHEM CO 12 2 PALL CORP 12 2 PARK J C (INDIVIDUAL) 12 2 POLYMER GROUP INC 12 2 RESEARCH TRIANGLE INSTITUTE
5.4.3 Top Journals
The publications sources retrieved from WOS and EV are listed in Table 5-42 and
Table 5-43, and 19 journals are in common, indicating the overlapping in WOS and EV.
Table 5-42 Publication sources on air filtration using selected nonwoven technologies in WOS Ranking # Records Source
1 16 Separation and Purification Technology 2 13 Aerosol Science and Technology 3 11 Journal of Aerosol Science 4 8 Journal of Membrane Science 4 8 Journal of Nanoparticle Research 6 7 Journal of Colloid and Interface Science 6 7 Journal of Nanoscience and Nanotechnology 8 6 Chemical Engineering Science 8 6 Journal of Applied Polymer Science 8 6 RSC Advances 11 5 Fibers and Polymers 11 5 Filtration & Separation 13 4 ACS Applied Materials & Interfaces 13 4 Annals of Occupational Hygiene 13 4 Fibres & Textiles in Eastern Europe 13 4 Journal of Materials Science 13 4 Polymer 13 4 Polymer Engineering and Science 13 4 Powder Technology 20 3 ACS Nano 20 3 Aerosol and Air Quality Research 20 3 Applied Surface Science 20 3 Carbon 20 3 Journal of Engineered Fibers and Fabrics 20 3 Journal of Materials Chemistry 20 3 Journal of Materials Chemistry A 20 3 Journal of Nanomaterials 20 3 Kona Powder and Particle Journal 20 3 Nanotechnology 20 3 Proceedings of The Fiber Society 2009 Spring Conference, Vols I and II 20 3 Science of The Total Environment

295
Table 5-43 Publication sources on air filtration using selected nonwoven technologies in EV Ranking #
Records Source
1 12 Advanced Materials Research 1 12 Separation and Purification Technology 3 11 Journal of Aerosol Science 4 9 Journal of Membrane Science 5 8 Aerosol Science and Technology 5 8 Journal of Nanoscience and Nanotechnology 7 7 Carbon 7 7 Journal of Applied Polymer Science 9 6 American Filtration and Separations Society Annual Conference 2011 -
Shape up to Green 9 6 Chemical Engineering Science 9 6 Filtration and Separation 9 6 Journal of Colloid and Interface Science 9 6 Journal of Materials Science 9 6 RSC Advances
15 5 Fibers and Polymers 16 4 ACS Nano 16 4 AIP Conference Proceedings 16 4 American Filtration and Separations Society Fall Conference 2014 -
Next Generation Filter Media Conference: Embracing Future Challenges
16 4 Applied Surface Science 16 4 AVR Allgemeiner Vliesstoff-Report 16 4 Chemical Engineering Journal 16 4 Fibres & Textiles in Eastern Europe 16 4 Industrial and Engineering Chemistry Research 16 4 Journal of Nanoparticle Research 16 4 Journal of Physics: Conference Series 16 4 Materials Science Forum 16 4 Nanotechnology 16 4 Nonwovens Industry 16 4 Polymer Engineering and Science
WOS also provided information on journals that have been cited the most, and Table
5-44 lists the top most cited journals based on the combined search on air filtration and selected
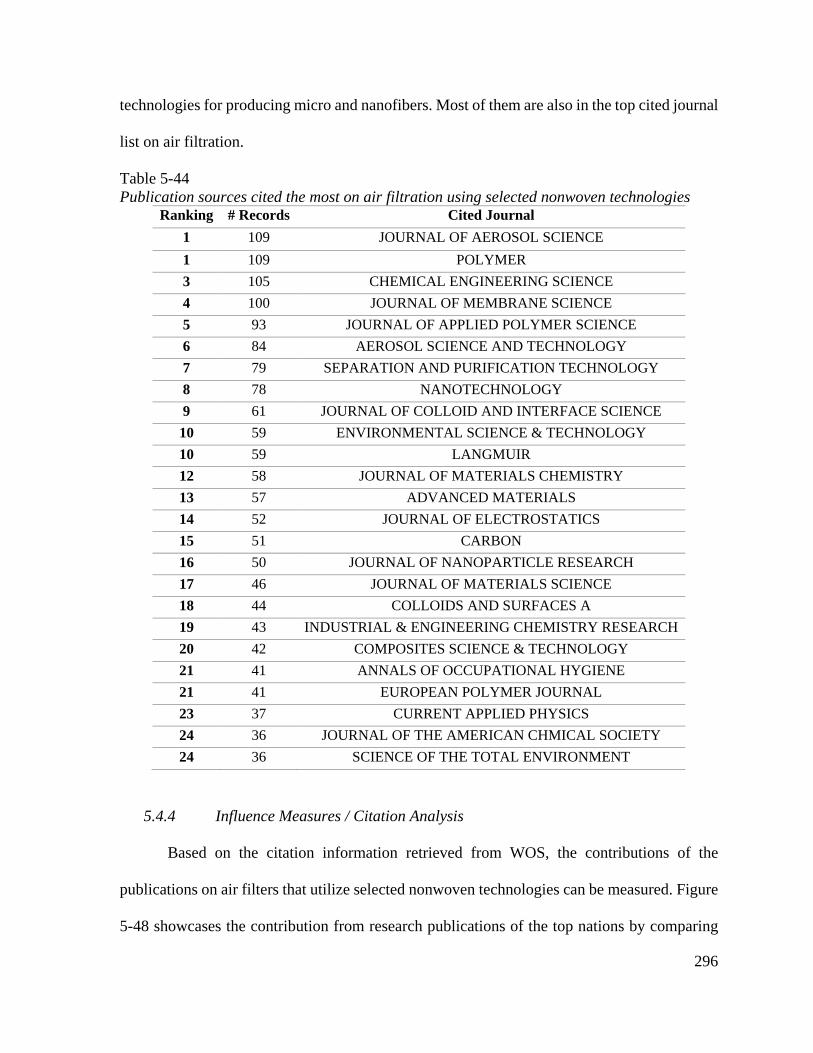
296
technologies for producing micro and nanofibers. Most of them are also in the top cited journal
list on air filtration.
Table 5-44 Publication sources cited the most on air filtration using selected nonwoven technologies
Ranking # Records Cited Journal 1 109 JOURNAL OF AEROSOL SCIENCE 1 109 POLYMER 3 105 CHEMICAL ENGINEERING SCIENCE 4 100 JOURNAL OF MEMBRANE SCIENCE 5 93 JOURNAL OF APPLIED POLYMER SCIENCE 6 84 AEROSOL SCIENCE AND TECHNOLOGY 7 79 SEPARATION AND PURIFICATION TECHNOLOGY 8 78 NANOTECHNOLOGY 9 61 JOURNAL OF COLLOID AND INTERFACE SCIENCE 10 59 ENVIRONMENTAL SCIENCE & TECHNOLOGY 10 59 LANGMUIR 12 58 JOURNAL OF MATERIALS CHEMISTRY 13 57 ADVANCED MATERIALS 14 52 JOURNAL OF ELECTROSTATICS 15 51 CARBON 16 50 JOURNAL OF NANOPARTICLE RESEARCH 17 46 JOURNAL OF MATERIALS SCIENCE 18 44 COLLOIDS AND SURFACES A 19 43 INDUSTRIAL & ENGINEERING CHEMISTRY RESEARCH 20 42 COMPOSITES SCIENCE & TECHNOLOGY 21 41 ANNALS OF OCCUPATIONAL HYGIENE 21 41 EUROPEAN POLYMER JOURNAL 23 37 CURRENT APPLIED PHYSICS 24 36 JOURNAL OF THE AMERICAN CHMICAL SOCIETY 24 36 SCIENCE OF THE TOTAL ENVIRONMENT
5.4.4 Influence Measures / Citation Analysis
Based on the citation information retrieved from WOS, the contributions of the
publications on air filters that utilize selected nonwoven technologies can be measured. Figure
5-48 showcases the contribution from research publications of the top nations by comparing

297
the average times cited per publication and total time cited. The X-axis is an indication of
publication volume. From highest to lowest, the countries are ranged from left to right. The
fifth productive country, Japan is the highest in average time cited per record although the total
times cited is the fourth among the top 10. Table 5-45 provides the detailed information
regarding the citations for the top 10 countries based on the publication volume.
Figure 5-48. Citations in WOS among the top 10 countries with the most publications on using selected nonwoven technologies for air filtration
Table 5-45 Citation information on using selected nonwoven technologies for air filtration publications in WOS
0
500
1000
1500
2000
2500
3000
0
5
10
15
20
25
30
35
Average Times Cited per Record Total Times Cited

298
At the institution level, the influences can be measured using the same approach. Total
times cited and average time cited per record are calculated given the number of publications.
Table 5-46 ranks the top affiliations by total time cited whereas Table 5-47 ranks them based
on the average times cited per record. Despite the low number on the publication records, US
Army Natick Research Center is listed as the top research organization by both the total times
cited and the average times cited. Based on the total times cited, two research organizations,
two companies, and 18 universities comprises the top list. According to the average times cited,
there are four companies, four research organizations, and 12 universities.
Table 5-46 Top 20 affiliations based on total citations and their corresponding average times cited per record
Ranking on Total Times Cited
Affiliation Number of
Records
Total Times Cited
Per Record Average
Ranking on Total
Publication Volume
1 US Army Natick Research Center, USA
3 880 293.33 27
2 Univ Tennessee, USA 13 551 42.38 3 3 Natl Univ Singapore,
Singapore 5 401 80.20 11
4 N Carolina State Univ, USA
16 262 16.38 2
5 Kanagawa Acad Sci & Technol, Japan
2 227 113.50 50
6 Arizona State Univ, USA 2 211 105.50 50 7 Michigan Technol Univ,
USA 1 187 187.00 89
8 Donghua Univ, China 18 182 10.11 1 9 Warsaw Univ Technol,
Poland 11 168 15.27 4
10 Univ Akron, USA 7 154 22.00 7 11 SUNY Stony Brook, USA 2 153 76.50 50 12 Hong Kong Polytech Univ,
China 5 146 29.20 11
13 Pusan Natl Univ, South Korea
2 134 67.00 50
14 Seoul Natl Univ, South Korea
4 129 32.25 21
15 Univ Minnesota, USA 8 123 15.38 5

299
Table 5-46 (continued) 16 Univ Oulu, Finland 2 119 59.50 50 17 Tampere Univ Technol,
Finland 3 110 36.67 27
18 SPUR a.s., Czech Republic 4 107 26.75 21 19 Tomas Bata Univ Zlin,
Czech Republic 5 106 21.20 11
20 Hiroshima Univ, Japan 3 96 32.00 27 20 Kyungpook Natl Univ,
South Korea 3 96 32.00 27
20 Japan Vilene Co Ltd, Japan 1 96 96.00 89 Table 5-47 Top 20 affiliations based on the average times cited per record and their corresponding total citations
Ranking on
Average Times Cited
Ranking on Average Times Cited per Record from High
to Low
Number of
Records
Total Times Cited
Per Record Average
Ranking on Total
Publication Volume
1 US Army Natick Research Center, USA
3 880 293.33 27
2 Michigan Technol Univ, USA 1 187 187.00 89 3 Kanagawa Acad Sci &
Technol, Japan 2 227 113.50 50
4 Arizona State Univ, USA 2 211 105.50 50 5 Japan Vilene Co Ltd, Japan 1 96 96.00 89 6 Natl Univ Singapore,
Singapore 5 401 80.20 11
7 SUNY Stony Brook, USA 2 153 76.50 50 8 Canatu Ltd, Finland 1 74 74.00 89 9 CIDETEC IK4, Spain 1 74 74.00 89 10 Pusan Natl Univ, South Korea 2 134 67.00 50 11 Oak Ridge Natl Lab, USA 1 67 67.00 89 12 3M Korea, South Korea 1 63 63.00 89 13 Tokyo Univ Sci, Japan 1 63 63.00 89 14 Univ Oulu, Finland 2 119 59.50 50 15 INRS (Institut national de
recherche et de sécurité), France
1 49 49.00 89
16 UHP (Henri Poincaré University), France
1 49 49.00 89
17 Rice Univ, USA 1 45 45.00 89 18 Univ Szeged, Hungary 1 45 45.00 89 19 Univ Tennessee, USA 13 551 42.38 3 20 Sam Yang Co, South Korea 1 42 42.00 89

300
5.4.5 Hot Topics and Research Concentration Analyses
One general analysis is initially conducted based on the data retrieved from WOS to
identify the state of the art of the use of micro and nanofibers manufactured by selected
nonwoven techniques for air filtration. The result in Figure 5-49 is based on the records from
WOS, and the clustering is processed using VOSviewer. It contains six clusters regarding the
selected nonwovens technologies for air filtration medium production. The biggest cluster is
about fiber formation. Electrospinning, coating and membranes, and some polymers used for
filter medium are included in the largest cluster, such as nylon, PAN, polyamide, and chitosan.
The cluster connected to the largest cluster to the top right is about performance, so low
pressure drop, high filtration efficiency, air permeability, and quality factor are frequently
mentioned; the third cluster (located to the right of the second cluster) also talks about the
measurement on the efficiency and effectiveness, and it focuses more on the modeling
technique, so particle size, sub-micron aerosols, penetration and such are mentioned. The
fourth cluster covers the use of carbon nanotubes for air filter media, as well as antimicrobial,
antibacterial property; the fifth cluster mentioned nanoparticle, VOCs, bioaerosols, electret
filter, and adsorption; and the last cluster (connected to the bottom of the largest cluster) names
a few characterization techniques, including electron microscopy (i.e. SEM), and it also covers
a few materials used for air purification, including titanium dioxide, and graphene oxide.
The same set of records also manifests the evolution on the use of certain selected
technologies for air filter media manufacturing (see Figure 5-50). The color of the circles
represents the year, moving from the oldest in blue to the latest in red. For example, the most
recent terms seen in WOS publications are lactic acid (PLA) (2104), graphene oxide (2014),
MWCNT (multiwall carbon nanotubes) (2013), nanofiber mat (2012), nanoparticles (2012),

301
VOC (2012), carbon nanotubes (2012), quality factor (2012), nanomaterial (2012); and the
older terms are electret filter (2003), indicating the charging technique has been used for a
while in improving air filter performance. Mid-2000s marks the timeframe for some materials
to be used more frequently in air filtration, such as chitosan, polypropylene, and other
polymers. It presents how the research and development on nonwoven technologies have
affected the adoption of micro and nanofibers in the area of air filter medium.
Figure 5-49. Clustering on publications regarding the use of selected nonwoven technologies for air filter manufacturing in WOS

302
Figure 5-50. Clustering on publications regarding the use of selected nonwoven technologies for air filter manufacturing in WOS by years
ClusteringSuite is also applied to the combined datasets to reduce the amount of
extracted key terms from abstracts, keywords and titles. In WOS, the extraction and cleaning
process reduces the phrases from 9,871 to 234. After manual checking, 184 phrases and words
are used to perform the PCA analysis, and 16 clusters are yielded, which covers 92% of the
retrieved records from WOS. The clusters are shown in Figure 5-51, and more key terms
related to the morphology of the product or fibers are found.
The same approach (ClusterSuite) also produces 16 clusters from the results of PCA
analysis in EV, covering 92% of the records. Using NLP, 11,630 key terms are extracted from
keywords, titles, and abstracts, and further combined to 372 key terms after removing low
frequency terms. For PCA analysis, the number of key terms used is restricted to the top 200.

303
Raw materials, filtration mechanisms, and manufacturing processes are all mentioned in the
clusters. Filtration, including water filtration and air filtration, is the only application found in
those clusters (see Figure 5-52).
One difference between the patent records and S&T publication records is that no
keywords are supplied with patent documents. When performing extractions based on the DII
records, the titles, dates, assignees, inventors, and abstracts are all the phrases being extracted.
For this clustering process on the patent topical information, only titles and abstracts are needed
(10, 932 in total). After applying a total of 9-11 steps using ClusterSuite script, 223 key terms
are generated, and among them, 188 terms are selected for the PCA analysis. In Figure 5-53,
13 clusters are identified from the PCA analysis, and 82% of the DII patent publications are
covered. The majority of the clusters are about the application areas, including air filtration,
and other application areas, such as liquid filtration, hygiene applications, and medical
applications. The most frequently used polymers are mentioned, and filtration performance
related parameters are also included in the clusters. But how the applications can be delivered,
for instance, the technology process, and the mechanisms, are not disclosed in those clusters.

304
Figure 5-51. Clusters from PCA analysis on the combined dataset of air filtration and selected nonwoven technology searches in WOS
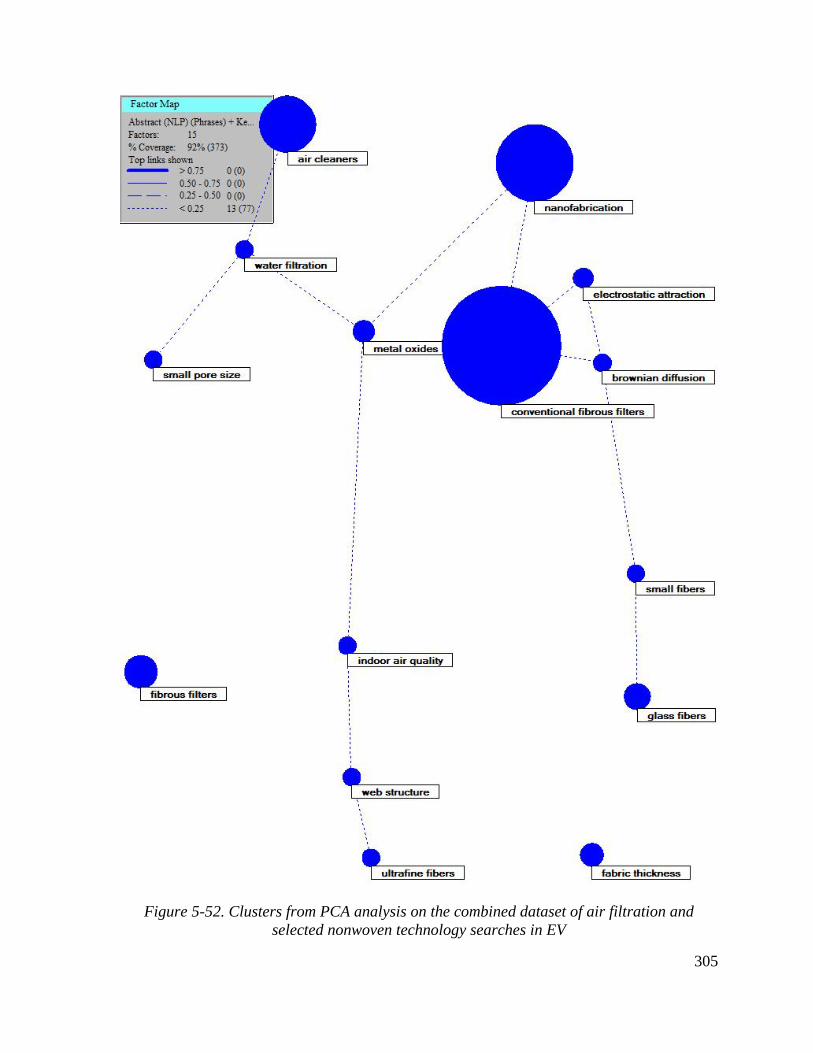
305
Figure 5-52. Clusters from PCA analysis on the combined dataset of air filtration and selected nonwoven technology searches in EV

306
Figure 5-53. Clusters from PCA analysis on the combined dataset of air filtration and selected nonwoven technology searches in DII
307
5.5 Clustering Results Comparison across the Sources
Based on the information yielded from clustering using VOSviewer and ClusterSuite,
different research concentrations can be identified from different sources.
The clusters from WOS, EV and DII share some similarities, differences also exist. The
abstracts and keywords supplied by authors and the database indexes from WOS and EV
provide more information regarding the mechanisms of air filtration and how the mechanisms
work. WOS and EV generally list key terms on the characterization methods, such as SEM,
TEM, X-ray diffraction, and simulation methods (computational fluid dynamics), which are
not identified from the key terms extracted from DII. This indicates that the characterization
and analytical methods might not be discussed in patent abstract or titles, or not discussed in
patents. The abstracts and titles in DII have been rewritten so the audience can understand
better, however they do not tend to explain the process by which the mechanism or technology
work. The abstracts and titles from DII records emphasize more the technical results and
descriptions of the use and advantages, than the illustration of the mechanisms and how the
materials fulfill the desired property.
When comparing the selected nonwoven technology clusters yielded from VOSviewer
(based on the records from seed query in WOS) and ClusterSuite (based on the complete query
set in DII), the major difference noticed is in the applications. The clusters yielded from the
ClusterSuite do not yield any biomedical related applications though tissue engineering and
cell culture appear in 93 and 46 records in DII respectively. Biomedical related applications
(scaffold, drug delivery, protein, etc.) were identified as a large application area for nanofibers
based on the nanofiber seed query in WOS, however they were not found as key terms from
DII records. It was surprising because patents are highly dependent on the applications, and at

308
least one application would be expected to be mentioned in each patent. The missing
application area might be the slower speed in commercialization on using nanofibers for
biomedical purposes, the absence of biomedical related IPC classifications (due to the
irrelevancy to our study), or such application could be a trade secret that does not get published
in public. Moreover, when comparing air filtration clusters from different data sources, one
distinct aspect from air filtration DII clusters is that the filter housing design and installation is
a large category, but is not found in either WOS, EV or ABI. DII records also covered the
installation of filtration component or device.

309
CHAPTER 6 In-depth Analyses and Discussions
6.1 Technology Evolutionary Path and Sub-System Analysis
The trend and topic analyses presented in Chapter 5 enable an observation of the shifts in
research. Some of the new technologies appearing in the past three to ten years were only found
in S&T publications yet made to commercialization. Others were invented and used by
industry before being adopted in fundamental S&T research. In this section, the pathways of
the development of the technology are discussed. First, the evolutions based on patents are
illustrated using DII IPC codes. Then the sub-systems based on IPC codes and clustering
results are presented to classify the research areas. The pathway hidden in the technology
development are explained later in this section.
6.1.1 Evolution of Air Filtration Patents
Since IPC codes stand for sub-technology fields, they are chosen to track the path for
the development of the technology in DII. However, one issue is that the IPC code system is
not an exclusive classification system, and sometimes similar technologies can be classified
into different multiple classifications. An approach to identify the evolution using patent
classification codes (IPC codes), proposed by Zhou et al. (2014), has three steps: identify sub-
technologies by dividing DII records based on time intervals using priority years; looking for
linkages among the identified sub-technologies; and detecting the “gradual evolutionary path”
across the years.
When comparing across the years, the air filtration search query set yielded several
categories that were in the top 25 of the IPC codes (4 digits, see Table 6-1): A61L, B01D,
B60H, F24F, and F02M. Three out of the top five categories are application based, B60H,

310
F24F, and F02M, and they also correspond with the two biggest air filtration application areas,
HVAC systems (for both commercial and residential use) and vehicles.
Table 6-1 IPC codes with the most records in air filtration search
IPC codes Descriptions of IPC codes (from WIPO website)
A61L
METHODS OR APPARATUS FOR STERILISING MATERIALS OR OBJECTS IN GENERAL; DISINFECTION, STERILISATION, OR DEODORISATION OF AIR; CHEMICAL ASPECTS OF BANDAGES, DRESSINGS, ABSORBENT PADS, OR SURGICAL ARTICLES; MATERIALS FOR BANDAGES, DRESSINGS, ABSORBENT PADS, OR SURGICAL ARTICLES
B01D SEPARATION
B60H ARRANGEMENTS OR ADAPTATIONS OF HEATING, COOLING, VENTILATING, OR OTHER AIR-TREATING DEVICES SPECIALLY FOR PASSENGER OR GOODS SPACES OF VEHICLES
F24F AIR-CONDITIONING; AIR-HUMIDIFICATION; VENTILATION; USE OF AIR CURRENTS FOR SCREENING
F02M SUPPLYING COMBUSTION ENGINES IN GENERAL WITH COMBUSTIBLE MIXTURES OR CONSTITUENTS THEREOF
By comparing the growth rates among IPC codes (4 digits) based on the patent
volumes, the fastest growing IPC codes over the years in air filtration are (Table 6-2):
Table 6-2 Air filtration IPC codes with the highest CAGR
CAGR (from first occurrence
till 2014) IPC codes
Definition of IPC codes
21.14% B01D SEPARATION
16.85% A61L
DEODORISATION OF AIR; CHEMICAL ASPECTS OF BANDAGES, DRESSINGS, ABSORBENT PADS, OR SURGICAL ARTICLES; MATERIALS FOR BANDAGES, DRESSINGS, ABSORBENT PADS, OR SURGICAL ARTICLES
16.52% B32B LAYERED PRODUCTS, I.E. PRODUCTS BUILT-UP OF STRATA OF FLAT OR NON-FLAT, E.G. CELLULAR OR HONEYCOMB, FORM
13.34% F02M SUPPLYING COMBUSTION ENGINES IN GENERAL WITH COMBUSTIBLE MIXTURES OR CONSTITUENTS THEREOF
12.91% D04H
MAKING TEXTILE FABRICS, E.G. FROM FIBRES OR FILAMENTARY MATERIAL; FABRICS MADE BY SUCH PROCESSES OR APPARATUS, E.G. FELTS, NON-WOVEN FABRICS; COTTON-WOOL; WADDING

311
To illustrate the changes in the research topics, a list of the IPC codes (among the top
500 IPCs) appearing in and after the year of 2005 is provided in Table 6-3. Almost half of IPC
codes on the emerging IPCs list are associated with D04H, which corresponds with the rapid
growth of the nonwoven fabric for air filtration purpose. Another growing trend is the patenting
activities on gas filtration, for both waste gas treatment and natural gas production. A61L also
has two sub-categories on the list, indicating new technologies to enhance the antimicrobial
and/or antibacterial functionality is under development to meet the growing demand of
disinfection and deodorization. B82Y started to be seen from 2005, which manifested the
growing accepted use of nanofibers in air filters, and thus nanofibers and the means to produce
nanofibers are the main novel nonwoven technologies for air filtration.
Table 6-3 Air filtration IPC codes appearing in and after 2005 Ranked by cumulative numbers
IPC codes that appear after 2005
IPC description Year of 1st occurrence
40 D04H-001/559 the fibres being within layered webs 2005 33 C10L-003/10 Working-up natural gas or synthetic natural gas* 2011 31 D04H-001/435 Polyesters (under D04H-001/4326: Condensation
or reaction polymers) 2005
24 A61L-009/013 containing animal or plant extracts, or vegetable material
2007
24 B32B-009/04 comprising such substance as the main or only constituent of a layer, next to another layer of a specific substance
2006
22 B01D-053/78 with gas-liquid contact 2007 20 D04H-001/413 containing granules other than absorbent
substances 2005
18 A01G-009/02 Receptacles, e.g. flower-pots or boxes; Glasses for cultivating flowers
2007
18 D04H-003/016 characterized by the fineness 2005
17 B01D-053/76 Gas phase processes, e.g. by using aerosols 2010 16 C10K-001/02 Dust removal 2006
15 B82Y-030/00 Nano-technology for materials or surface science, e.g. nano-composites
2005
15 D04H-003/147 Composite yarns or filaments 2006

312
Table 6-3 (continued) 14 B01D-005/00 Condensation of vapours; Recovering volatile
solvents by condensation 2009
14 D04H-001/55 Polyesters 2005 14 D04H-001/593 to layered webs 2005 14 D04H-003/153 Mixed yarns or filaments 2006 13 D04H-001/544 Olefin series 2006 12 D04H-003/009 Condensation or reaction polymers 2006 12 E06B-007/28 Other arrangements on doors or windows, e.g.
door-plates, windows adapted to carry plants, hooks for window cleaners
2014
12 G03B-021/14 Details 2008 11 A61L-101/04 Elemental carbon, e.g. active charcoal 2009 11 D04H-001/498 entanglement of layered webs 2007
Note: * means “treating substances to obtain them in desired final state or form, e.g., colouring by incorporating pigments, granulating, producing sheets or articles”.
Seven sub-areas surfaced from the top IPC codes in the air filtration search in DII.
a). Separation B01D is the largest category of the air filtration research area, which
covers 95% of the total retrieved records, and it has maintained a continuous growth at 21.14%.
Air filtration is obviously a major part of separation, however this category does not specify
the separation process, whether it is for gases or liquids. Under this category, B01D-046/00,
B01D-039/00, and their sub-categories are the main technology areas because they focus on
filtering processes and filtering materials respectively.
b). D04H is related to non-woven filter fabrics, and a large segment of air filter products
are composed of non-woven fabrics. The sub-categories under D04H specify different
materials and methods for producing non-woven fabrics, and the more attention has been
received by layered structures and smaller diameters and/or composite fibers. This is led by
the trend in designing air filters with high efficiency.
c). B32Bis another large segment of the technology field in air filtration because this
category focuses on the layered structure of the air filter. Within this category, the biggest sub-

313
categories are B32B-05/00 and B32B-27/00. The former mainly covers fibers, filaments,
granules, or powder embedded in a layered structure, and the latter concentrates on the layered
products made of synthetic resin.
d). A61L is about antibacterial or antimicrobial functionality offered by air filters,
which is about “disinfection, sterilization, and deodorization for air”.
e). B03C is involved because it covers an important mechanism for air filtration, which
is to apply electrostatic charges to air filters for separation purposes. Charging can increase the
initial filtration efficiency without increasing pressure drop, however it has drawbacks in
retaining the charge over time.
f). F24F is a category associated with HVAC systems, in which air filters are an
important component. Air filters used in HVAC systems have different grades, which are
defined by the number of particulates they let through. Depending on the use, selection on the
air filters can be made.
g). F02M and B60H are two classifications geared towards the filters used for vehicles.
F02M is about engine filters, and B60H covers cabin air filters. Different contaminants and
different mechanisms are targeted for those filters within these two categories.
6.1.2 Evolution of Selected Nonwoven Technology for Producing Micro and
Nanofibers Patents
To monitor the development of the selected nonwoven technologies, especially those
for making micro and nanofibers, the top categories and those with the highest growth were
identified. From the results yielded from the novel nonwoven technologies search with a focus
on micro and nanofibers, the top IPC categories in four digits across all years are listed in Table

314
6-4. Table 6-5 listed the fastest growing categories in four-digit IPC codes, while Table 6-6
provides the top five specific IPC categories with the highest growth rates.
Recognized as the two categories with rapid growth rate, both B82B and B82Y
categories are about nanotechnology, where the focus is on the engineering issues at a
molecular degree. B82Y and its sub-categories (B82Y-030/00 and B82Y-040/00) focus on the
nano-scale structure, including nanofibers. A few categories about the materials are mentioned,
C01B, B22F, D01F, and D01D target carbon, metal, and synthetic materials that are used to
make fine fibers, such as micro and nanofibers. D04H and B32B are seen on both the air
filtration and selected nonwoven technology IPC lists, marking the wide use of certain
nonwoven technologies and associated products, layered structures of nanocomposites, or any
layered structure that contains micro and nanofibers. Again, electro-spinning receives a high
growing rate in Table 6-6. H01L signaled the increased usage of nano-materials for
semiconductor components since it is one of the categories with higher growth rate.
Table 6-4 IPC codes with most records in nonwoven technology search
IPC codes
Descriptions of IPC codes (from WIPO website)
D01F CHEMICAL FEATURES IN THE MANUFACTURE OF MAN-MADE FILAMENTS, THREADS, FIBRES, BRISTLES OR RIBBONS; APPARATUS SPECIALLY ADAPTED FOR THE MANUFACTURE OF CARBON FILAMENTS
D04H MAKING TEXTILE FABRICS, e.g. FROM FIBRES OR FILAMENTARY MATERIAL; FABRICS MADE BY SUCH PROCESSES OR APPARATUS, e.g. FELTS, NON-WOVEN FABRICS; COTTON-WOOL; WADDING
D01D MECHANICAL METHODS OR APPARATUS IN THE MANUFACTURE OF MAN-MADE FILAMENTS, THREADS, FIBRES, BRISTLES OR RIBBONS
B32B LAYERED PRODUCTS, i.e. PRODUCTS BUILT-UP OF STRATA OF FLAT OR NON-FLAT, e.g. CELLULAR OR HONEYCOMB, FORM
C01B NON-METALLIC ELEMENTS; COMPOUNDS THEREOF B82B NANO-STRUCTURES FORMED BY MANIPULATION OF INDIVIDUAL
ATOMS, MOLECULES, OR LIMITED COLLECTIONS OF ATOMS OR MOLECULES AS DISCRETE UNITS; MANUFACTURE OR TREATMENT THEREOF

315
Table 6-5 Selected nonwoven technology IPC codes (4 digits) with highest CAGR
CAGR (from first occurrence till 2014)
IPC codes
Definitions of IPC codes
41.57% B82Y SPECIFIC USES OR APPLICATIONS OF NANO-STRUCTURES; MEASUREMENT OR ANALYSIS OF NANO-STRUCTURES; MANUFACTURE OR TREATMENT OF NANO-STRUCTURES
25.86% B22F WORKING METALLIC POWDER; MANUFACTURE OF ARTICLES FROM METALLIC POWDER; MAKING METALLIC POWDER; APPARATUS OR DEVICES SPECIALLY ADAPTED FOR METALLIC POWDER
24.95% B82B NANO-STRUCTURES FORMED BY MANIPULATION OF INDIVIDUAL ATOMS, MOLECULES, OR LIMITED COLLECTIONS OF ATOMS OR MOLECULES AS DISCRETE UNITS; MANUFACTURE OR TREATMENT THEREOF
22.45% C01B NON-METALLIC ELEMENTS; COMPOUNDS THEREOF 22.01% H01L SEMICONDUCTOR DEVICES; ELECTRIC SOLID STATE
DEVICES NOT OTHERWISE PROVIDED FOR
Table 6-6 Selected nonwoven technology IPC codes (8 digits) with highest CAGR
CAGR (from first occurrence till 2014)
IPC codes Definitions of IPC codes
56.80% B82Y-40/00 MANUFACTURE OR TREATMENT OF NANOSTRUCTURES
44.32% D04H-01/728 BY ELECTRO-SPINNING 40.08% B82Y-30/00 NANO-TECHNOLOGY FOR MATERIALS OR
SURFACE SCIENCE, E.G. NANO-COMPOSITES 34.79% B82B-01/00 NANO-STRUCTURES FORMED BY MANIPULATION
OF INDIVIDUAL ATOMS OR MOLECULES, OR LIMITED COLLECTIONS OF ATOMS OR MOLECULES AS DISCRETE UNITS
28.68% B82B-03/00 MANUFACTURE OR TREATMENT OF NANO-STRUCTURES BY MANIPULATION OF INDIVIDUAL ATOMS OR MOLECULES, OR LIMITED COLLECTIONS OF ATOMS OR MOLECULES AS DISCRETE UNITS

316
Table 6-7 lists the IPC categories from the selected nonwoven technology search that
appeared in and after 2005 among top 500 IPC codes. 13 out of 14 categories are first seen
from 2005. The exception is C22C-005/06 which was first found in 2008. D04H has three sub-
categories on the list, denoting the continuous growth and expansion on producing micro,
submicron, and nanofibers using nonwoven processes. The new application areas for fibers
with small diameters have emerged from the list too, including batteries (four sub-categories
under H01M), and hygiene and medical applications (two sub-categories under A61L).
Meanwhile, the noticeable changes in the IPC systems are served as a reflection on the
expansion of selected nonwoven technology field, their end products and applications. One
example is A61F-013/54, which is about hygiene products, and it is not seen from the retrieved
records since 2001 because that orginal classification has expanded to A61F-013/45~A61F-
013/53, occupying nine categories.
Table 6-7 Selected nonwoven technology IPC codes appearing after 2005
Ranked by volume
IPC codes that appear after 2005
IPC description Year of 1st occurrence
65 D04H-001/4326 Condensation or reaction polymers 2005 55 G06F-003/041 Digitisers, e.g. for touch screens or touch pads,
characterised by the transducing means 2005
53 C25D-011/26 of refractory metals or alloys based thereon 2005 48 H01G-009/042 characterised by the material 2005 47 D04H-001/4334 Polyamides 2005 40 A61L-015/28 Polysaccharides or their derivatives 2005 38 D04H-001/413 containing granules other than absorbent
substances (under D04H-001/4326) 2005
38 H01M-010/052 Li-accumulators 2005 37 H01M-004/133 Electrodes based on carbonaceous material,
e.g. graphite-intercalation compounds or CFx 2005
36 C22C-005/06 Alloys based on silver 2008 33 A61L-027/20 Polysaccharides 2005 33 C01B-033/021 Preparation 2005 33 H01M-004/134 Electrodes based on metals, Si or alloys 2005 33 H01M-004/139 Processes of manufacture 2005

317
Based on the IPC codes, the sub-systems that stand out among all the categories are:
a). B82B and B82Y, because they target at the nanostructured material, nanotechnology,
and its applications. The most sought after material for high efficiency air filtration is
nanofiber, and the manufacturing process has become popular since 1990s.
b). D01F and D04H comprise the second major technology system, and they focus on
making fibers with small diameters using a variety of nonwoven processes. The target fibers
include micro, submicron, ultra-fine, and nanofibers, and most fibers at micro, sub-micron,
and nanoscale are made of synthetic polymers. Currently the most commonly mentioned
technique for manufacturing nanofibers is electrospinning. The reason why electrospinning is
widely researched is its versatility, easy set-up, and low cost.
c). Materials related categories, C01B and B22F, make up the third technology sub-
system. New materials and techniques for making fibers at micro, submicron, and nanoscale
are under investigation almost every day, and researchers hope to bring new properties of fibers
with smaller diameters by modifying their morphology. Carbon materials, including carbon
nanotubes, carbon nanofibers, are used in all kinds of applications, ranging from solar cells to
biosensors. Metal nanowires are also a type of widely used nano-materials. Both natural and
man-made nanofibers are commonly mentioned in R&D as well. Nanostructured composite
fibers are another category that has received a lot of attention.
d). The application areas that micro, submicron, and nanofibers are concerned are
numerous. From the emerging IPC code list, H01M and G06F with regards to the energy and
electronics are the two areas with the most drastic growths. Filter medium and biomedical
application are also applications for fine fibers, especially nanofibers, according to the

318
clustering results via VOSviewer and ClusterSuite (VantagePoint), however they are not seen
on the list of emerging IPC codes.
6.1.3 Sub-Systems and Pathways in Air Filtration
In order to process all the information yielded from clustering, a clearer structure is
needed to manifest the relationships among the topics. Auto-correlation maps are an effective
tool to suggest the relationships among a single field. To build a subs-system auto-correlation
map, a clean-up procedure on the clusters is needed to merge similar clusters into one topic,
while deleting low coverage and not so relevant clusters from PCA analysis. Therefore, topics
from each database are identified to map out how they are associated with one another, and
only ST&I databases are included because of sufficient coverage from the PCA analysis. The
identified topics are then grouped to facilitate building sub-systems, which are derived based
on the correlations among the topic clusters. All the topics can be grouped into the following
sub-system categories: applications (AP), mechanisms (ME), materials and processes (MP),
analytic techniques (AT), and contaminants (CO), and the category of the topic is assigned
based on the majority of the key terms included in the clusters.
From the clusters of WOS, some terms are about applications (filtering-facepiece
respirators, hot gas filtration, HVAC, surgical mask, etc), some are about mechanism
(interception, inertia impaction, coalescence, adsorption, photocatalytic reactions, etc), some
are about contaminants (bioaerosols, gasesous contaminants, infections, etc), and some are
related to materials and processes (carbon nanotubes, nanofiber and electrospinning). Except
for electrospinning, other specific nonwoven technology was not found. See Table 6-8 for more
detailed information. The map in Figure 6-1 can be divided into three parts. The left series of
clusters is about filtration performances and how nanofibers can affect those parameters.

319
Respirators and face masks are applications associated with those clusters. The second part (on
the right) focuses on the air purification process, and adsorbents and photo-catalysts are the
main components in breaking down the toxic gases. Portable air cleaner and HVAC system
have adopted those filtration mechanisms. The third part consists a few clusters (towards the
bottom of Figure 6-1) on contaminants, indicating that air filters are often used to conduct
sampling analysis since air sampler is another major application category for air filtration.
Figure 6-1. Sub-system auto-correlation map of air filtration records in WOS

320
Table 6-8 Descriptions of sub-systems from air filtration WOS records # of Records
Sub-systems Topics Words or phrases
977 mechanism filter performance
pressure drop, fibrous filters, deposition, collection efficiency, interception, dust cake, viscous flow, single fiber efficiency, inertial impaction
475 application indoor air quality
indoor air quality, ventilation, air conditioning system, HVAC systems
439 application respirators and surgical masks
respirators, filtering-facepiece respirators, N95, healthcare workers, occupational safety, respiratory protection, surgical masks, N95 respirators, fit test, infection control, tuberculosis, workplace protection factors, n95, FFRs
379 mechanism adsorption volatile organic-compounds, adsorption, activated carbon AC
338 application air cleaning device
air cleaner, electrostatic precipitator ESP, clean air delivery rate, portable air cleaners
321 mechanism particle size penetration, sodium chloride, penetrating particle size
313 contaminants bioaerosols microorganisms, bioaerosols, escherichia coli E. coli, airborne microorganisms, bacillus subtilis
263 materials and process
other nanomaterials
nanoparticles, carbon nanotubes CNTs, antibacterial activity, silver nanoparticles
247 application hot gas filters hot gas filtration, high temperature, ceramic filters, ceramic candle filters, hot gas cleaning
227 contaminants gaseous contaminants
organic-compounds, nitrite ion, polycyclic aromatic-hydrocarbons, sulfur dioxide, nitrogen oxides NOx, nitric-oxide, nitrogen dioxide, quartz fiber filters
187 mechanism photocatalysis titanium dioxide, photocatalysis, photocatalytic oxidation PCO, indoor air purification, photocatalyst, photodegradation, photocatalytic activity
169 materials and process
nanofibers nanofibers, electrospinning, electrospun nanofibers, polymer nanofibers
162 analytical techniques
imaging and surface analysis
electron microscopy SEM, morphology, X-ray diffraction, transmission electron microscopy, SEM
157 contaminants infections aspergillus, infections, invasive aspergillosis IA, nosocomial aspergillosis, immunocompromised patients, neutropenic patients, stem-cell transplantation, particulate air filtration
144 contaminants allergens triiodide ion, house-dust mite, vacuum cleaners, cat allergen, dust mite allergens
113 mechanism pore size nonwovens, air permeability, pore size distribution 48 mechanism coalescence
effect liquid aerosols, coalescence

321
The development trends from the topics in WOS are illustrated in Figure 6-2, the R&D
on nanofibers and other nanomaterials starts to increase during the mid-2000s, and respirators
and indoor air quality are the fastest growing applications in air filtration.
Figure 6-2. Development trends of topics from WOS air filtration records
0
10
20
30
40
50
60
70
80
90
100
AP: air cleaning device AP: hot gas filters
AP: indoor air quality AP: respirators and surgical masks
AT: imaging and surface analysis CO: bioaerosols
CO: allergens CO: gaseous contaminants
CO: infections ME: adsorption
ME: coalescence effect ME: filter performance
ME: particle size ME: photocatalysis
ME: pore size MP: nanofibers
MP: other nanomaterials

322
Figure 6-2 (A). Application trends from WOS air filtration records
Figure 6-2 (B). Materials, processes, and mechanisms trends of topics from WOS air filtration records
0
5
10
15
20
25
30
35
40
45
50
AP: air cleaning device AP: hot gas filtersAP: indoor air quality AP: respirators and surgical masks
0
10
20
30
40
50
60
70
80
90
100
ME: adsorption ME: coalescence effect ME: filter performanceMP: nanofibers ME: particle size ME: photocatalysisME: pore size MP: other nanomaterials

323
The sub-systems map (see Figure 6-3) from EV shares some similarities with the one
from WOS. There are more specific applications yielded from EV records, such as diesel
particulate filter, electret filter, and biofilter. Simulation and gas chromatography are only
found in the clusters from EV, and this indicates that more publications in EV have reported
research results and findings using analytical instruments. The mechanisms that have
influences on air filtration are very similar in EV and WOS. Table 6-9 lists all the categories
of the sub-systems. Overall, the auto-correlation map (Figure 6-3) can also be divided into
three parts. One part connects all the topics on the left and top, and it is about air filtration in
removing solid particles or liquid aerosols. The one on the right focuses more on filtration
associated with gas emissions. The last part (bottom right) is on air sampling.
Table 6-9 Descriptions of sub-systems from air filtration EV records # of Records
Sub-systems Topics Words or phrases
953 mechanism filter performance
pressure drop, fibrous filters, collection efficiency, low pressure drop, filter pressure drop, interception, lower pressure drop, inertial impaction, brownian diffusion
665 application indoor air quality
air quality, indoor air pollution, air conditioning, indoor air quality
651 analytical techniques
simulation porous materials, computational fluid dynamics, porous media, fluid dynamics, flow simulation
612 mechanism photocatalysis air purification, titanium dioxide, photocatalysis, photocatalyst, photodegradation, photocatalytic oxidation PCO
603 mechanism particle size particle size, particle size analysis, size distribution, particle size distribution, mobility Particle Sizer, shape memory effect
563 contaminants gaseous contaminants
biomass, gas emissions, leakage fluid, gas generators, waste incineration, heat treatment, global warming, waste treatment, syngas, greenhouse gases, waste management, synthesis gas, biomass gasification, solid wastes, refuse incinerators
552 mechanism adsorption adsorption, activated carbon AC, adsorbents

324
Table 6-9 (continued) 369 analytical
techniques imaging and surface analysis
electron microscopy SEM, X ray diffraction, transmission electron microscopy, SEM
351 mechanism pore size permeability, pore size, Nonwoven Fabrics, air permeability, pore size distribution
350 application non non-woven air cleaning device
flue gases, electrostatic precipitator ESP, electrostatic separators
295 application biofilters biofilters, biodegradation, bioreactors, biotrickling filter, biofilms, packing material
290 application hot gas filters HOT GAS FILTRATION, ceramic materials, ceramic candle filters, pressurized fluidized, candle filters
284 analytical techniques
gas chromatography
mass spectrometry, gas chromatography, chromatographic analysis, polycyclic aromatic hydrocarbons, aromatic hydrocarbons, high performance liquid chromatography
283 application respirators and surgical masks
respirators, respiratory protection, sodium chloride, FILTERING-FACEPIECE RESPIRATORS, n95, filter penetration, surgical masks
278 materials and process
nanofibers nanofibers, electrospinning, polymer fibres, nanofabrication, nanofiltration
239 materials and process
other nanomaterials
nanotechnology, carbon nanotubes CNTs, nanostructured materials, nanocomposites, nanostructures, single-walled carbon nanotubes SWCNTs, nanotubes, chemical vapor deposition, multiwalled carbon nanotubes MWCNTs
237 application diesel particulate filters
fuel filters, diesel particulate filters, diesel engines, particulate matter PM, diesel oxidation catalyst DOC
181 application electret filters electrets, electret filters, corona discharge, electrostatic charge, electrostatic forces, electret filter media
173 contaminants trace elements zinc compounds, copper compounds, trace elements, fe, pb
122 mechanism coalescence effect
capture efficiency, coalescence, liquid aerosols, liquid droplets, coalescence filters
107 mechanism electric discharges
electric discharges, electric corona

325
Figure 6-3. Sub-system auto-correlation map of air filtration records in EV
The trends on each topic in EV are shown in Figure 6-4. Figure 6-4 (A) displays the
trends on applications, showing that indoor air quality is the biggest segment, and diesel
particulate filters R&D have been more active since the mid-2000s. Biofilters had two peaks,
one in 1997, and the other one in 2009. Figure 6-4 (B) showcased the trends in materials,
processes, and filtration mechanisms. Photocatalysts and adsorbents have received more
attention in air filtration from the 2000s, and nanomaterials, such as nanofibers and carbon
nanotubes, have mainly maintained continuous growth since the mid-2000s.

326
Figure 6-4. Development trends of topics from EV air filtration records
0
20
40
60
80
100
120
140
1990
1991
1992
1993
1994
1995
1996
1997
1998
1999
2000
2001
2002
2003
2004
2005
2006
2007
2008
2009
2010
2011
2012
2013
2014
2015
AP: biofilters AP: diesel particulate filtersAP: electret filters AP: hot gas filtersAP: indoor air quality AP: non non-woven air cleaning deviceAP: respirators and surgical masks AT: gas chromatographyAT: imaging and surface analysis AT: simulationCO: gaseous contaminants CO: trace elementsME: adsorption ME: coalescence effectME: electric discharges ME: filter performanceME: particle size ME: photocatalysisME: pore size MP: nanofibersMP: other nanomaterials

327
Figure 6-4 (A). Application trends of selected topics from EV air filtration records
Figure 6-4 (B). Materials, processes, and mechanisms trends of selected topics from EV air filtration records
0
10
20
30
40
50
60
70
AP: biofilters AP: diesel particulate filtersAP: electret filters AP: hot gas filtersAP: indoor air quality AP: non non-woven air cleaning device
0
10
20
30
40
50
60
70
80
90
100
ME: adsorption ME: coalescence effect ME: electric dischargesME: filter performance ME: particle size ME: photocatalysisME: pore size MP: nanofibers MP: other nanomaterials

328
DII records also tend to yield clusters on applications, and additionally it reveals more
terms associated with air filter medium manufacturing processes and materials (see Table
6-10). Within some clusters related to the non-woven processes, melt-blown and bi-component
are mentioned, which have not been identified in either WOS or EV. However, the terms
related to evaluating filtration efficiency (interception, inertia impaction, Brownian diffusion,
and quality factor), and the filtration mechanisms are not yielded in DII. After combining a
few clusters yielded from the PCA analysis, the auto-correlation map (see Figure 6-5) is
divided into three sections (very similar to WOS and EV): nonwoven materials, processes and
associated applications, including high efficiency air filters (on the left), air purification using
catalysts (the bottom right), and gas filtration (on the upper right). The series of clusters on the
left confirms the use of nonwovens for a wide range of applications, not limited to air filters.
Table 6-10 Descriptions of sub-systems from air filtration DII records # of Records
Sub-systems Topics Words or phrases
3440 application air cleaning device
air cleaner, air purifier, air purification filter, ultraviolet lamp, active carbon filter, peculiar smell, negative ion generator
1754 contaminants machine equipment emission
filter element, internal combustion engine, construction machine, agricultural machine
1602 materials and process
pleated filter medium
filter medium, pleated filter media, pleated filter, pleat shape, pleat tips
1472 materials and process
non-woven fabrics
non-woven fabric, air permeability, melt blow method, average fiber diameter, melting point, basis weight, fabric weight, fiber web, pressure loss
867 application high efficiency air filters
clean room, high efficiency particulate air HEPA filter, semiconductor industry, cabin air filter, food industry, ULPA filter, pharmaceutical industry, clean room filter

329
Table 6-10 (continued) 587 materials and
process fiber types and structures
glass fiber, carbon fiber, composite fiber, short fiber, natural fiber, metal fibers, bicomponent fibers, inorganic fibers, base fabric, activated carbon particles, organic fiber, second fiber, ceramic fibers, cotton fibers, nonwoven fabric substrate, filter substrate
441 application barrier fabrics vacuum cleaner, face masks, vacuum cleaner filters, medical applications, sanitary material, surgical gown, wound dressing, vacuum cleaner bag, surgical drapes, cushioning material, disposable diaper, coffee bags, sanitary product
409 materials and process
nanofibers air permeable support material, polytetrafluoroethylene porous membrane, electrospinning method
356 application hot gas filters diesel engine vehicle, honey-comb filter, ceramic filter, carbon dioxide, waste gas filter, carbon monoxide, diesel particulate filter, gasoline engine, catalyst carrier
351 application air filter cartridge
filter cartridge, air filter cartridge, air cleaner assembly, media pack, power generation equipment, cleaning engine combustion air
276 application liquid filters liquid filter, oil filter, fuel filter, heat resistance, chemical resistance
93 materials and process
photocatalysts titanium dioxide, silicon dioxide, aluminium oxide

330
Figure 6-5. Sub-system auto-correlation map of air filtration records in DII
The trends of the topics from DII air filtration records based on the priority years are
shown in Figure 6-6, the segment on the use of air cleaning device occupies the leading
position. High efficiency air filters started to increase from the mid-1990s, and the number of
patent publications maintained around the same for the past 10 years. Figure 6-6 (A) shows
that the air cleaning device is the biggest segment in terms of applications. From the trends
displayed in Figure 6-6 (B), the patenting activities regarding pleated filter medium and non-
woven fabrics have been on the rise since the 1990s. The nanofiber technology has been
applied to air filtration since 1989, but the patent volume is still relatively low.

331
Figure 6-6. Development trends of topics on DII air filtration records
Figure 6-6 (A). Applications trends of topics on DII air filtration records
0
50
100
150
200
250
300
1982
1983
1984
1985
1986
1987
1988
1989
1990
1991
1992
1993
1994
1995
1996
1997
1998
1999
2000
2001
2002
2003
2004
2005
2006
2007
2008
2009
2010
2011
2012
2013
2014
2015
AP: air cleaning device AP: air filter cartridgeAP: barrier fabrics AP: high efficiency air filtersAP: hot gas filters AP: liquid filtersCO: machine equipment emission MP: fiber types and structuresMP: nanofibers MP: non-woven fabricsMP: pleated filter medium MP: photocatalysts
0
50
100
150
200
250
300
1982
1983
1984
1985
1986
1987
1988
1989
1990
1991
1992
1993
1994
1995
1996
1997
1998
1999
2000
2001
2002
2003
2004
2005
2006
2007
2008
2009
2010
2011
2012
2013
2014
2015
AP: air cleaning device AP: air filter cartridgeAP: barrier fabrics AP: high efficiency air filtersAP: hot gas filters AP: liquid filters

332
Figure 6-6 (B). Materials, processes, and mechanisms trends of topics on DII air filtration
records
From the sub-systems identified in WOS, EV, and DII records, several mechanisms
have a strong influence on air filtration performance: interception, inertia impaction and
Brownian diffusion are the main mechanisms affecting filter performance. Those methods
emphasize trapping solid or liquid particles, which is a mechanical separation mechanism
mostly commonly seen in air filters. Other mechanisms, adsorption, photocatalytic oxidation,
coalescence, and electrostatic charging, are also widely used to breakdown toxic gases or
remove contaminants in air filtration. For instance, TiO2 is often used as a coating on top of a
substrate or an additive embedded to break down contaminants such as microorganisms and
VOCs. In air filtration, coalescent filter is to capture many tiny liquid aerosols (oil mist) before
they agglomerate into large liquid droplet and drain out, and it is used in filtration process for
compressed air. Activated carbon is another agent that is often used as an adsorbent in the
0
20
40
60
80
100
120
140
160
1982
1983
1984
1985
1986
1987
1988
1989
1990
1991
1992
1993
1994
1995
1996
1997
1998
1999
2000
2001
2002
2003
2004
2005
2006
2007
2008
2009
2010
2011
2012
2013
2014
2015
MP: fiber types and structures MP: nanofibersMP: non-woven fabrics MP: pleated filter mediumMP: photocatalysts

333
filters to improve filtration performance. Penetration and particle size, air permeability and
pore size, pressure drop/loss all impact the filtration efficiency of applications, such as surgical
masks, respirators. Nanofibers are incorporated into those applications because they can
optimize the performance of air filtration media and offer better filtration efficiency, but the
majority of R&D on nanofibers are conducted in academia rathan than in industry. To provide
anti-bacterial function, an anti-bacteria or anti-microbial agent can be added either during the
fiber forming process or the finishing process. Silver nanoparticles as an anti-microbial agent
are most commonly found from retrieved records.
Due to the higher demand from the market, high efficiency filters have received
attention from both academia and industry. The topics from WOS, EV, and DII all include
nanofibers and nanomaterials as segments, and their important status is rooted in the desired
higher filtration efficiency. Not so much specific information regarding the nonwoven process
is found in those clusters except for meltblown, bicomponent, and electrospinning, all of which
are methods to produce fibers at micro, submicron and nanoscale. Composite and layered
structures are also one of the major trends in air filter design. With the utilization of nanofibers
and ultrathin fibers, membranes are formed on top of other nonwoven substrates to fulfill the
air filtration purpose, thus membrane technology used in air filters is becoming more popular,
especially in S&T publications.
According to the clusters and maps, electrostatic precipitation is another method to
improve indoor air quality, and it does not need to be replaced or have degradation issues.
However, it might generate ozone and NOx while in use. A hybrid of electrostatic precipitation
and nonwoven fabric filters was under development from late 2000s. Another observation is
that natural and biodegradable materials are becoming the newest trends in material selection

334
for air filter manufacturing. Later, a technology terms based auto-correlation map will manifest
the relationships among the selected technologies.
6.1.4 Sub-Systems and Pathways in Selected Nonwoven Technologies
As explained before, only DII records on selected nonwoven technologies was
processed for PCA analysis. Therefore, to further develop a sub-system map, cleaning of the
DII clusters from PCA analysis is needed. A few clusters are combined due to the overlapping
technology field, such as cluster 3: absorption article and cluster 10: absorption. One cluster is
removed because of low occurrence (cluster 5: carbon source gas). To ensure the sub-systems
have a high coverage and for more accurate results, some manual checking is done to make
sure most of the terms are exclusive based on a few experts’ domain knowledge. Noticed from
other analyses, a few other clusters, such as biomedical and sensor applications found from
VOSviewer clusters, layers and substrates associated patent categories identified from IPC
codes, are added to present a more complete picture of selected nonwoven technologies and
the making of micro and nanofibers. For instance, sensor and detection device application has
become an individual cluster.
As a result, three sub-systems (see Figure 6-7 and Table 6-11) are derived from 15
clusters: materials and processes (MP), outcome (OC), and application (AP). They cover 80%
of the total records. Also, carbon nanomaterials and polymer based fine fibers other than
carbon nanotubes have formed two separate interconnected cluster groups on the auto-
correlation map. Electrospinning forms a third group composed of connected topical clusters,
and it is indeed the most researched manufacturing technique to form nanofibers.
The polymer-based fine fibers group (on the upper right of Figure 6-7) consists of the
most used polymers, nonwoven fiber formation techniques, and application areas. The

335
application areas include filter medium, absorption materials, and biomedical application.
Biomedical application refers to very general applications. Filter medium includes both air
filters and liquid filters. Within this group, nonwoven technology terms are included other than
electrospinning (see Table 6-11 for details of all topics), such as melt-blown, composite,
bicomponent, multicomponent, sheath-core, sea-island fibers, which are considered as the
outcomes of nonwoven manufacturing process.
For the carbon nanotubes group, the applications are mainly targeting at the superior
conductivity that CNTs possess. So both electronic device and energy equipment are
applications connected to this group. Although detection device (sensors) is not connected, it
is regarded as part of this group because of the use of carbon nanomateials for this application.
The last group indexes the electrospinning process, substances used to make solution
for electrospinning, the device, and the facility for this process. Also the features of nanofibers
that can be achieved by electrospinning is listed, including average diameter, and larger
specific surface area. However, no application related sub-system is connected to this group,
and it focuses only on the technology and process part of the process to produce nanofibers.

336
Figure 6-7. Sub-system auto-correlation map of selected nonwoven technology records in DII
Table 6-11 Descriptions of sub-systems from nonwoven technology DII records
# of records
Sub-systems
Topics Words or phrases
5204 materials and processes
carbon nanotubes
carbon nanotube CNT, nanotubes, single-walled carbon nanotubes, multi-walled carbon nanotubes, electrical conductivity, carbon nanotube film, chemical vapor deposition, carbon nanotube structure, carbon nanotube array, van der Waals attractive force
3045 materials and processes
electrospinning nanofiber, electrospinning, electrostatic spinning, average diameter, large specific surface area, electrospinning process, manufacturing nanofiber, electrostatic spinning method, electrostatic spinning solution, nanofiber manufacturing apparatus, electrospinning method

337
Table 6-11 (continued) 2083 materials
and processes
solution spinning solution, organic solvent, deionized water, mixed solution, polymer solution, nitric acid, hydrochloric acid, sulfuric acid, formic acid
1867 materials and processes
polymers polypropylene, polyvinylpyrrolidone, polyamide, polyolefin, polyvinyl alcohol, polyethylen, chitosan, polyethylene terephthalate, polyacrylonitrile, polyurethane, polylactic acid, functional groups, polystyrene, polycaprolactone, polyvinylidene fluoride
1683 application filter medium nonwoven fabric, melt-blown nonwoven fabric, average fiber diameter, fiber diameter, air filter, filter medium, filter media, fabric weight, liquid filter
1531 application energy fuel cell, solar cell, electrode material, lithium ion battery, supercapacitor, secondary battery, battery separator, lithium secondary battery, dye-sensitized solar cell, electrical double layer capacitor, lithium battery, energy storage device
1355 application electronic device
electronic device, field emission display, field emission device, liquid crystal display, light emitting diode, transparent electrode, silver nanowires, flat panel display, touch panel, metal nanowire, transparent conductive film, touch screen
1070 outcomes core-sheath type composite fibers
composite fiber, core component, sheath component, core-sheath type composite fiber, core-sheath type, core portion, sheath portion, core-sheath structure, core part, sheath part
930 materials and processes
layers and substrates
base material, silicon substrate, substrates, substrate surface, carbon nanotube layer, catalyst layer, semiconductor substrate, conductive substrate, glass substrate, flexible substrate, metal substrate, porous substrate, transparent substrate, crystalline substrate
888 outcomes fiber formation bicomponent fibers, multicomponent fiber, melt-blown fiber, synthetic fibers, staple fibers, conjugate fibre, glass transition temperature, natural fiber
Based on the priority years and the occurrences of the sub-system related terms, the
trends of the sub-systems and their corresponding topics are showcased in Figure 6-8. The data
here covers from 1990 to 2015 (note that data for 2014 and 2015 are not complete). Carbon

338
nanotubes and their related nanostructure have attracted attention from the early 2000s, and
the interest continued to grow until 2009. Only in the past five years has the interest started to
drop. Among the applications areas (Figure 6-8 (A)), electronic devices began to gain research
interest in 1997 (first occurrence was in 1995), however they have stayed at the same level for
the past five years. The energy area has demonstrated its continuously increasing potential in
utilizing fibers with small diameters since the 1990s, and it became the largest application
segment in 2008. Filter medium do not exhibit the highest growth potential (the line with
square markers). However, it is the first major application for fibers at micro, submicron, and
nanoscale, with a steady growth from the late 1980s. Figure 6-8 (B) illustrates the growths of
the topics on materials, processes, and outcomes in selected nonwoven technologies in the past
26 years. Except for carbon nanotubes, which started growing from around the 2000s, the rest
of the topics all began expanding in the mid-2000s. Carbon nanotubes occupy the leading
position in all topics, and solution electrospinning is the most mentioned electrospinning
technique in patents.

339
Figure 6-8. Development trends of the topics in nonwoven technology subs-systems
0
100
200
300
400
500
600
700
800
AP: absorbent materials AP: biomedical applicationAP: detection device AP: electronic deviceAP: energy AP: filter mediumMP: electrospinning MP: layers and substrateMP: polymers MP: process facilityMP: solution MP: carbon nanotubesOC: core-sheath type composite fiber OC: fiber formationOC: sea-island type composite fiber

340
Figure 6-8 (A). Applications trends of the topics in nonwoven technology subs-systems
Figure 6-8 (B). Materials, processes, and outcomes trends of the topics in nonwoven
technology subs-systems
0
50
100
150
200
250
300
AP: absorbent materials AP: biomedical application AP: detection deviceAP: electronic device AP: energy AP: filter medium
0
100
200
300
400
500
600
700
800
MP: carbon nanotubes MP: electrospinningMP: layers and substrate MP: polymersMP: process facility MP: solutionOC: core-sheath type composite fiber OC: fiber formationOC: sea-island type composite fiber

341
6.1.5 Relationships among Nonwoven Technologies in Air Filtration
To investigate the relationships among different technologies, two auto-correlation
maps are constructed based on the technology terms used in Section 5.2.7. Auto-correlation
maps demonstrate the relationships among a single field, and here the relationships among
different nonwoven technologies that are extracted from the abstracts of S&T publications and
patents are revealed in each map (Figure 6-9 and Figure 6-10).
According to the technology terms auto-correlation map yielded from the merged WOS
and EV dataset (Figure 6-9), the dry-laid web forming process, including carding and air-laid,
is the center of the map because it connects a variety of technologies. However, dry-laid does
not indicate any direct relationship with electrospinning and other techniques for making
nanofibers, meanwhile spunbond serves as a connecting point for dry-laid and electrospinning.
Meltblown is also connected to electrospinning via spunbond. This implies that the use of
nanofibers, the product of electrospinning, is tied together with spunbond webs. Phase-
separation and centrifuge spinning have a higher correlation, as they both represent means to
produce nanofibers.
Major nanofiber manufacturing methods, such as electrospinning and centrifuge
spinning, are not connected to the main series of clusters in the technology term based auto-
correlation map in DII (Figure 6-10). This indicates that the patents do not necessarily utilize
those novel technologies together with more established technologies, and the focus of some
patent documents might only be limited to novel technology, such as nanofiber, nano-
structured material, and nanocomposite associated technologies. Hydroentangling moves to
the connecting spot on this map, and the correlation coefficients between wet-laid and

342
hydroentagling, and spunbond and meltblown are higher. This is not surprising as spunbond
and meltblown are often used together to form composite structures for air filter media.
Both auto-correlation maps have a few technology terms not showing any connecting
relationships with the rest of the technology terms. One reason is that some technology terms
have low occurrences because they are not widely used in air filtration media production or
they are rather new to the application area, for example, solution blowing (not found in DII),
hollow fiber and self-assembly. Although charging yields the highest number of records in
regards to technology term frequency on both lists, it is not considered to be a nonwoven
manufacturing process, but rather a finishing process for air filter media. The technology terms
connected are mainly web forming and bonding methods.

343
Figure 6-9. Technology auto-correlation map from WOS and EV combined records

344
Figure 6-10. Technology auto-correlation map from DII records 6.2 Forecasting
A forecast of the potential growth of R&D activities will be able to shed light on the
future development regarding the use of the technology and/or application. Based on the
cumulative publication volumes in ST&I and business databases for two decades (1990-2010),
a ten-year (2011-2020) mid-term forecast is made based on the technology diffusion models
with a confidence interval (CI) of 95%. The validation data set for the forecasts is the actual

345
numbers of records retrieved in each databases from 2011 to 2015 (2014 and 2015 are included,
though they are not complete due to the time lag for publications to be indexed into databases).
Almost any technology goes through an S-shaped life cycle curve, and the Fisher-Pry
and Gompertz models are two statistical models that are frequently used in the research areas
of technology diffusion and adoption. The Fisher-Pry model, A.K.A Pearl model and logistic
curve, is used when the substitute technology can provide technological advantages over the
old one, and the curve from this model is symmetrical, representing the disruptive technology.
The Gompertz model is used to reflect the incremental changes in technologies, and it is more
widely used on the adoption of consumer products because the substitute technology is driven
by not only the technological aspect, but also the choice of consumers. Therefore, the trend
curves derived from these two models will be different. Representing disruptive technology,
the Fisher-Pry model starts slowly and accelerates later on before becoming mature and
declining, while the Gompertz model launches fast and then slows down. Both the Gompertz
and Fisher-Pry models are included in the forecast for the purpose of sensitivity analysis. The
two models are listed below:
Fisher-Pry Model 𝑦𝑦 = 𝐿𝐿1+𝑎𝑎𝑒𝑒−𝑏𝑏𝑏𝑏
Gompertz Model 𝑦𝑦 = 𝐿𝐿𝐿𝐿−𝑎𝑎𝑒𝑒−𝑏𝑏𝑏𝑏
Where:
L = Upper limit of Y
e = Base of the natural logarithm system 2.718282…
a and b = coefficients describing the curve
Based on the numbers of records retrieved from air filtration, and nonwoven
technology, mainly nanofiber and microfiber search queries, all the forecasts of the potential

346
trends of the R&D activities in WOS, EV, DII, and ABI are shown in Figure 6-11 to Figure
6-18.
For air filtration publications and patents, the Gompertz model generally fits better than
the Fisher-Pry model. Figure 6-11 is about the forecast of air filtration publications in WOS.
Although the forecast after 2010 deviates more, the Gompertz model is a better fit than the
Fish-Pry model according to the pre 2011 general trend. Also it is confirmed by the statistical
measure of goodness of fit, R2 for the data before 2011. In the Gompertz model, R2 is 99.54%,
while R2 in the Fisher-Pry model yields 97.35%. Based on the retrieved records from EV
(Figure 6-12), both the Gompertz and Fisher-Pry fit the data from previous years fairly well.
R2 is slightly higher in the Gompertz model (98.67% vs. 97.09%). The Fisher-Pry models used
in DII and ABI for air filtration search records are a little too optimistic, while the Gompertz
models (R2=99.97% in DII, and R2=99.81% in ABI) depict the forecast data closer to the reality
(Figure 6-13, Figure 6-14). All reported statistics are based on data through 2010 only.
Figure 6-11. Forecast of air filtration publications in WOS
0500
100015002000250030003500400045005000
1990
1991
1992
1993
1994
1995
1996
1997
1998
1999
2000
2001
2002
2003
2004
2005
2006
2007
2008
2009
2010
2011
2012
2013
2014
2015
2016
2017
2018
2019
2020
Cumulative Records Forecast Records (Gompertz Model)
Forecast Records (Fisher-Pry Model)

347
Figure 6-12. Forecast of air filtration publications in EV
Figure 6-13. Forecast of air filtration patenting activities in DII (based on priority years)
0
2000
4000
6000
8000
10000
12000
1400019
9019
9119
9219
9319
9419
9519
9619
9719
9819
9920
0020
0120
0220
0320
0420
0520
0620
0720
0820
0920
1020
1120
1220
1320
1420
1520
1620
1720
1820
1920
20
Cumulative Records Forecast Records (Gompertz Model)
Forecast Records (Fisher-Pry Model)
0
5000
10000
15000
20000
25000
1990
1991
1992
1993
1994
1995
1996
1997
1998
1999
2000
2001
2002
2003
2004
2005
2006
2007
2008
2009
2010
2011
2012
2013
2014
2015
2016
2017
2018
2019
2020
Cumulative Records Forecast Records (Gompertz Model)
Forecast Records (Fisher-Pry Model)

348
Figure 6-14. Forecast of air filtration trade journal publications in ABI
The trends on publications and patents on selected nonwoven technologies that are used
to make micro, submicron, and nanofibers are shown in Figure 6-15 to Figure 6-18. The
Gompertz models yielded lower R2 than the Fisher-Pry models in all four databases, so the
Fisher-Pry models statistically fit the data better. The R2 yielded in WOS, EV(Compendex),
and DII are all higher than 99% when using the Fisher-Pry model, except for ABI publications
(96.10%). However, the Fisher-Pry model only fits well with the forecast on the selected
nonwoven technology publications based on the records retrieved from EV (Figure 6-16). The
forecast after 2010 on DII (Figure 6-17) and ABI (Figure 6-18) using the Fisher-Pry models is
overestimated, while the Gompertz models underestimate it. The number of publications in
WOS exceeds both the estimated volumes using the Gompertz and Fisher-Pry models (Figure
6-15).
0
2000
4000
6000
8000
10000
12000
14000
16000
1990
1991
1992
1993
1994
1995
1996
1997
1998
1999
2000
2001
2002
2003
2004
2005
2006
2007
2008
2009
2010
2011
2012
2013
2014
2015
2016
2017
2018
2019
2020
Cumulative Records Forecast Records (Gompertz Model)
Forecast Records (Fisher-Pry Model)

349
Figure 6-15. Forecast of selected nonwoven technology publications in WOS
Figure 6-16. Forecast of selected nonwoven technology publications in EV
0
50000
100000
150000
200000
250000
300000
350000
400000
1990
1991
1992
1993
1994
1995
1996
1997
1998
1999
2000
2001
2002
2003
2004
2005
2006
2007
2008
2009
2010
2011
2012
2013
2014
2015
2016
2017
2018
2019
2020
Cumulative Records Forecast Records (Gompertz Model)
Forecast Records (Fisher-Pry Model)
0
50000
100000
150000
200000
250000
300000
1990
1991
1992
1993
1994
1995
1996
1997
1998
1999
2000
2001
2002
2003
2004
2005
2006
2007
2008
2009
2010
2011
2012
2013
2014
2015
2016
2017
2018
2019
2020
Cumulative Records Forecast Records (Gompertz Model)
Forecast records (Logistic Curve)
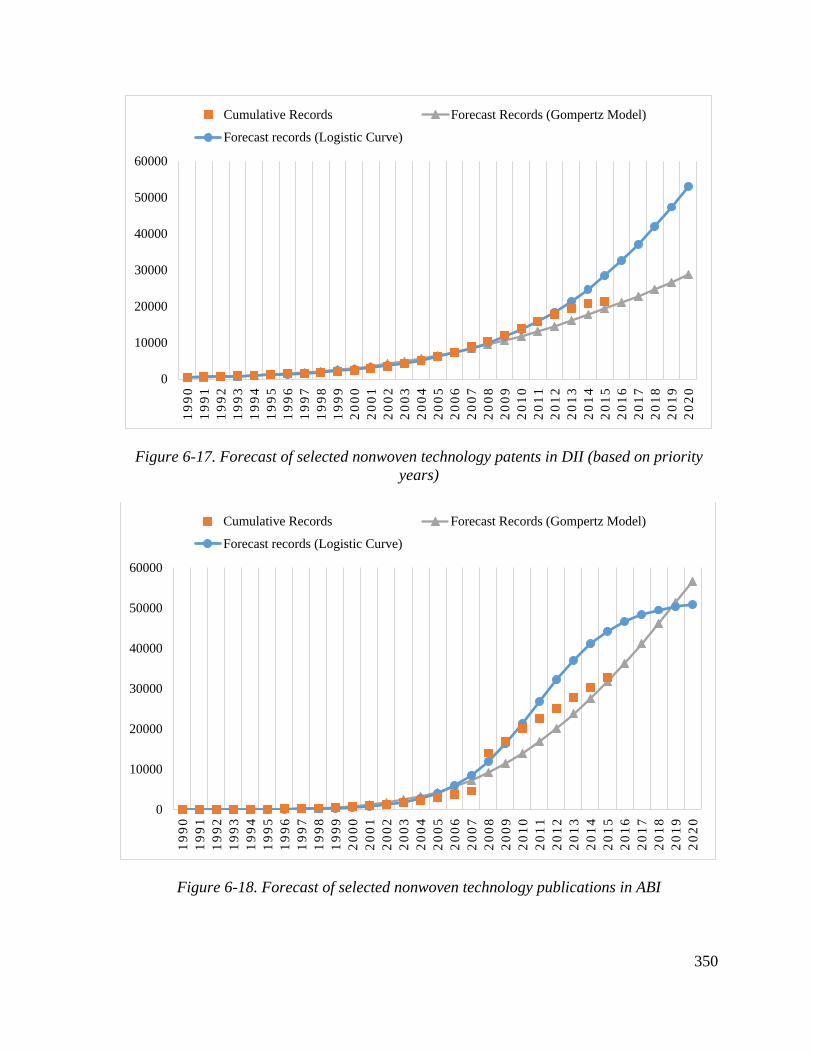
350
Figure 6-17. Forecast of selected nonwoven technology patents in DII (based on priority years)
Figure 6-18. Forecast of selected nonwoven technology publications in ABI
0
10000
20000
30000
40000
50000
60000
1990
1991
1992
1993
1994
1995
1996
1997
1998
1999
2000
2001
2002
2003
2004
2005
2006
2007
2008
2009
2010
2011
2012
2013
2014
2015
2016
2017
2018
2019
2020
Cumulative Records Forecast Records (Gompertz Model)
Forecast records (Logistic Curve)
0
10000
20000
30000
40000
50000
60000
1990
1991
1992
1993
1994
1995
1996
1997
1998
1999
2000
2001
2002
2003
2004
2005
2006
2007
2008
2009
2010
2011
2012
2013
2014
2015
2016
2017
2018
2019
2020
Cumulative Records Forecast Records (Gompertz Model)
Forecast records (Logistic Curve)

351
The same forecasting approach was also applied to the datasets of search queries on
records retrieved using selected nonwoven technologies for air filtration, and the potential
trends are shown in Figure 6-19 to Figure 6-22. The best forecast is the one based on
publications in EV using the Fisher-Pry model (Figure 6-20). In DII forecast, the Fisher-Pry
model overestimates the growth in patent applications, but the forecast derived from the
Gompertz model seems to fit the data in 2014 and 2015 better (2014 and 2015 might not be
complete data due to time lag). Both the forecasts based on publications in WOS and ABI
underestimate the actual growing rate (Figure 6-19 and Figure 6-22). Although the forecast did
not turn out to be very accurate, but statistically the Fisher-Pry model fits the historical R&D
growths in WOS, EV, and DII better than the Gompertz, resulting in R2 equal to 99.58%,
99.79% and 99.56%. However, the Gompertz (R2=99.17%) seems to fit the trend better on the
publications of ABI.
Figure 6-19. Forecast of selected nonwoven technology for air filtration publications in WOS
0
50
100
150
200
250
300
350
400
1990
1991
1992
1993
1994
1995
1996
1997
1998
1999
2000
2001
2002
2003
2004
2005
2006
2007
2008
2009
2010
2011
2012
2013
2014
2015
2016
2017
2018
2019
2020
Cumulative Records Forecast Records (Gompertz Model)
Forecast Records (Fisher-Pry Model)

352
Figure 6-20. Forecast of selected nonwoven technology for air filtration publications in EV
Figure 6-21. Forecast of selected nonwoven technology for air filtration patents in DII (based on priority years)
0
100
200
300
400
500
600
70019
9019
9119
9219
9319
9419
9519
9619
9719
9819
9920
0020
0120
0220
0320
0420
0520
0620
0720
0820
0920
1020
1120
1220
1320
1420
1520
1620
1720
1820
1920
20
Cumulative Records Forecast Records (Fisher-Pry Model)
Forecast Records (Gompertz Model)
0
200
400
600
800
1000
1200
1990
1991
1992
1993
1994
1995
1996
1997
1998
1999
2000
2001
2002
2003
2004
2005
2006
2007
2008
2009
2010
2011
2012
2013
2014
2015
2016
2017
2018
2019
2020
Cumulative Records Forecast Records (Gompertz Model)
Forecast Records (Fisher-Pry Model)

353
Figure 6-22. Forecast of selected nonwoven technology for air filtration trade journal publications in ABI
From the forecast results, neither model is able to forecast with impressive accuracy.
Forecasts are just rough approximations for the historical data. In reality, technical R&D
issues, product life cycle, and other external factors, such as economics and market, all affect
the choice of the model and the results of forecast.
6.3 Summary of Research Purposes
For Research Objective 1, research questions were proposed to gain an overview of the
state-of-the-art on the development of air filtration and novel nonwoven technologies, and the
use of those technologies for air filtration application. These research questions have been
answered by providing a big picture of the air filter research area and nonwoven technologies
(see sections 5.2, 5.3, and 6.1). An overview of the R&D on air filtration and selected
nonwoven technologies in academia and industry was discussed by revealing the trends, major
participants and evaluations of their contribution and collaboration, research topics in the
0
50
100
150
200
250
1990
1991
1992
1993
1994
1995
1996
1997
1998
1999
2000
2001
2002
2003
2004
2005
2006
2007
2008
2009
2010
2011
2012
2013
2014
2015
2016
2017
2018
2019
2020
Cumulative Records Forecast Records (Gompertz Model)
Forecast Records (Fisher-Pry Model)

354
fields, and technology evolutions within the research areas over the past 26 years. However,
PCA analysis via VantagePoint was not able to be run for the entire datasets retrieved from the
search queries on certain nonwoven technologies (micro and nanofibers) due to the huge
numbers of records retrieved from WOS, EV, and ABI. The in-depth analyses using PCA was
performed on DII nonwoven technology records. In addition, an association rule based
clustering analysis was conducted on the WOS publications yielded from nanofiber seed query.
A comprehensive overview of documents related to the use of certain nonwoven technologies,
with an emphasize on fibers with small diameters, for air filtration purposes was provided in
Section 5.4, and this is consistent with the idea that nonwoven technologies have enabled the
use of nanofibers and ultra-fine fibers to improve the performance of air filters. The last
research question of Research Objective 1 is on the effectiveness of the research approach, and
it is to test whether tech mining can be used as a research tool for nonwoven technology and
its application, air filtration. This is validated by the analyses conducted on retrieved records
on air filtration from all sources and relavant nonwoven technologies from DII (and WOS
using nanofiber seed query). The results and findings yielded from the study can serve as a
good example for nonwoven air filtration research from a technology management perspective
via tech mining.
The second research objective is to pair a suitable technology and process with an air
filtration related application. Section 6.1 on sub-systems based on clustering (PCA) and
technology terms fulfills the mission by linking R&D documents and application documents.
Based on the desired attributes and specifications for certain specific applications, the type of
technology, process or material can be selected for such an application in our case. For
instance, from the clustering results, for hot gas filtration, the filter has to be heat resistant and

355
sometimes chemical resistant, so ceramic or silicon carbide materials are good choices, and
PTFE porous membrane can be used on top of the ceramic or silicon carbide substrate to
enhance the filtration efficiency. This structure can be used for gases emitted during waste
treatment, radioactive contaminants treatment, biomass and coal ash from power stations. Also,
the same nonwoven process can meet the requirements of multiple applications, thus, the
choice of nonwoven process is based on the end application and its desired properties.
Research Objective 3, to determine other applications where novel nonwoven
technology will prove beneficial when compared to existing techniques, was initially answered
in the search results from all the databases, and later confirmed using the clustering process
based on the retrieved records from the seed query in WOS and the records from the second
set of search queries in DII. The second set of search queries covered not only novel technology
and process terms for producing nanofibers and nanofibers itself, but also the more established
end products: microfibers, submicron fibers, ultra-fine fibers, and their synonyms, as well as
processes to make them (mainly meltblown). Novel nonwoven technologies include
electrospinning, centrifuge spinning, ForcespinningTM, flash spinning, solution blown,
bicomponent/conjugate spinning, and hollow fibers. Meanwhile, meltblown is included in the
search queries because it is an established method to produce nonwoven air filter media fabrics
at industrial scale, and the ultra-fine fibers produced by such process can increase the filtration
efficiency and dust-holding capacity. Other methods used to produce nanofibers are also
incorporated in the search queries - template synthesis, phase separation and self-assembly.
However, they are not generally used to produce nanowebs for air filtration.
Based on the results yielded from the retrieved records of the nonwoven technology
and process oriented search from ST&I sources, biomedical applications, such as scaffolds,

356
tissue engineering, protein, and cell related research, form a major area to which nanofibers
are applied. Another category in which nanofibers are involved is absorbent materials for
hygiene, disinfection, and other medical products, including wound dressings, wipes,
protective clothing, and pads. Surgical masks are considered to be hygiene products as they
serve as protective barrier products, however they are already included as one type of air filter
products in this study. Moreover, energy associated applications have become another segment
utilizing nanofibers as a component in lithium ion battery, solar cells, fuel cells, and
supercapacitor. Detection devices, such as sensors, have become a research field that possesses
a large growth potential for nanofibers in the future. Liquid filtration was also an application
area for which nanofibers can be useful, because the widely accepted membrane technology
can utilize nanofibers. Among all of the existing technologies included in the search queries,
electrospinning is the most researched method in producing nanofibers, especially in academia,
and resulted in the exponential growth in S&T publications on that topic.
The goal of Research Objective 4 is to provide a forecast on the potential growth
regarding the use of the technology or/and application. The trends were derived from the
publication activities in ST&I and business databases from 1990 to 2010, and the forecast
started in 2011 and ended in 2020 (see section 6.2). The actual data from 2010 to 2015 (2014
and 2015 are not complete) were also included on the graphs for validation purposes.

357
CHAPTER 7 Conclusions and Future work
7.1 Conclusions Mining the R&D data on air filtration and nonwoven technologies from four different kinds of
sources can generate valuable information on the selected technology pathway, and hence
facilitate decision making by providing priority based insights for R&D managers, scholars,
and policy makers. Research on air filtration and its associated nonwoven technology that is
used to manufacture air filtration media has received attention worldwide, especially in North
America, Asia, and Europe, as indicated by the results in Chapter 5. The drive behind the
growth of air filtration and nonwovens technologies is the demand from the market. Since air
quality has risen to the attention of the general population globally, air filters have proven to
be quite effective in environment remediation, such as prevention of transmitted diseases and
reduce the exposure to air pollution. Thus air filters have become a household item all over the
world. Meanwhile, with stricter regulations and laws enforced regarding emissions and
building ventilation, air filtration has to face higher requirements. Therefore, high efficiency,
low pressure drop, and high dust holding capacity are highly desired when designing air filters.
Nonwoven processes are capable of producing high efficiency air filters and are widely used
for such applications. Indeed nonwoven filtration was projected as the market segment with
the highest growth from 2011 to 2016, despite the small percentage it occupies in the entire
nonwoven market (INDA&EDANA, 2012).
From the results on air filtration, one consistent finding is that nanofibers made with
nonwoven technologies have become a promising component in making high efficient
nonwoven fabrics for air filters since the late 1990s. The most frequently used technique for
manufacturing nanofibers is solution electrospinning because it is a versatile and cost-effective

358
process, and publications and patents on electrospinning have expanded dramatically. When
fibers with very small diameters are introduced into air filtration applications, the end product
is often a layered composite with a nanofiber membrane or a submicron fiberweb layer
supported by other non-woven substrates, or at least one pre-filter is placed upstream of the
nanofiber membrane to filter larger particles. The use of pre-filters can increase the service life
of the main filters. Nanofibers are proven to increase the filtration efficiency because the webs
have very high surface to weight ratio, small pore size, and interconnected pore structure.
However, they are relatively weak, and the process is not environmental friendly, and more
importantly, the thin layer of nanofibers will cause a higher pressure drop. Most importantly,
it has low productivity. Consequently, in industry, nanofiber added air filtration products are
not the mainstream line, microfiber, submicron fibers, and ultrafine fibers are still widely used
for air filter media, though there has been growing interest in using nanofibers in both academia
and industry. A comparison of the technical publications from S&T and patent databases, sub-
systems and their corresponding topics on air filtration and nonwoven technologies built upon
the PCA analysis have been detailed in sections 6.1.3 and 6.1.4.
Nonwoven air filters were also found to be used together with an electrostatic
precipitator to construct a hybrid filtration system for better filtration performance. Using
pleated filter medium is also a popular way to enhance air filtration performance. Another
effective way to improve filtration efficiency is via corona discharge, however research is still
under investigation on how to prevent or delay charge decay in electret filters. Furthermore,
utilizing additives that add to the surface of air filter media can break down toxic gases, such
as VOCs. Adsorption and photocatalytic oxidation are the most commonly seen mechanisms,
and they have received more attention since the mid-2000s with the use of nanoparticles.

359
HVAC and vehicle use are the top two categories in air filtration, as confirmed by the
IPC codes and keywords discovered from the EV and DII databases. However, air filters for
vehicle use were not listed in the clusters yielded in WOS. Air filters used in vehicles mainly
include cabin air filters, diesel particulate filters, and engine air filters. Overall, gas filtration
for industrial uses has received more attention during the 2000s. For instance, waste gases or
syngas from biomass was one field that was studied quite a bit. Respirators and surgical masks
are two applications that utilize almost the same mechanism in air filtration, and filtering face-
piece respirators and N95 masks are becoming the subjects most frequently investigated in
recent years, possibly due to the outbreaks of several transmittable diseases. Moreover, with
more exposure to nano-scale materials, air filters with higher efficiency need to be designed to
capture contaminants at nano-scale. HEPA and ULPA filters are mostly commonly used in
hospitals (operation theaters), pharmaceutical plants, the food industry, clean rooms, HVAC,
and semiconductor manufacturing facilities. From the air filtration search results, it was found
that another big segment of application for air filters is sampling. Air filters are frequently used
as a sampling tool for analyzing air quality and contaminants both indoors and outdoors, for
example radiation capturing and monitoring. However, the publications that mention using air
filters for sampling purposes do not tend to involve much technical information on the choice
of the air filters. To better facilitate capturing and sampling substances in the air, more selection
criteria based on the targeted substances is needed to enable more effective selection of the
type of air filters.
When comparing the R&D activities among countries, the U.S., China, and Japan are
the top countries in air filtration and associated nonwoven technology S&T publications and
patent applications. According to data from S&T journals, the most productive countries in

360
utilizing nonwoven processes to make fine fibers in air filtration products are the U.S., China
and South Korea. Japan was the top country in patent applications on using micro and nanofiber
technologies for air filtration, followed by the U.S., South Korea, and China. In addition,
publications from the U.S., Japan, Germany, and other developed countries received more
citations than China, an up and coming active participant in S&T journal publications.
Based on the top players’ profiles, research organizations, such as universities and
government agencies, tend to publish more articles in S&T journals and conference
proceedings, and they are much less active in patenting. Government agencies also publish
quite a lot in trade journals. Companies, on the other hand, are more likely to file for patents
rather than publishing in S&T journals. However, some companies prefer that their employees
publish in S&T journals. So the publication activities of companies vary. There is some degree
of collaboration found between universities and industry on air filtration publications, although
most companies do not stress fundamental research. Therefore, patent analysis is a necessary
component to profile R&D among companies. According to the retrieved records for this study,
3M is the only company that tends to publish in S&T research journals and business journals,
as well as files for patents. In addition, research collaborations among the top universities were
not frequently seen, in spite of the similarity that sometimes existed among the research focuses
of those universities. Moreover, some universities or research organizations collaborate mainly
within the same country, for instance, the Russian Academy of Sciences.
It is also noticeable that some companies use certain technology terms more
exclusively. For instance, Toyobo KK started using “electret film split fibres” for air filtration
products in their patents from the mid-1990s until the late 1990s, and this term was not seen in
other companies’ patents. Another example is “flash spinning”, a technology first invented by
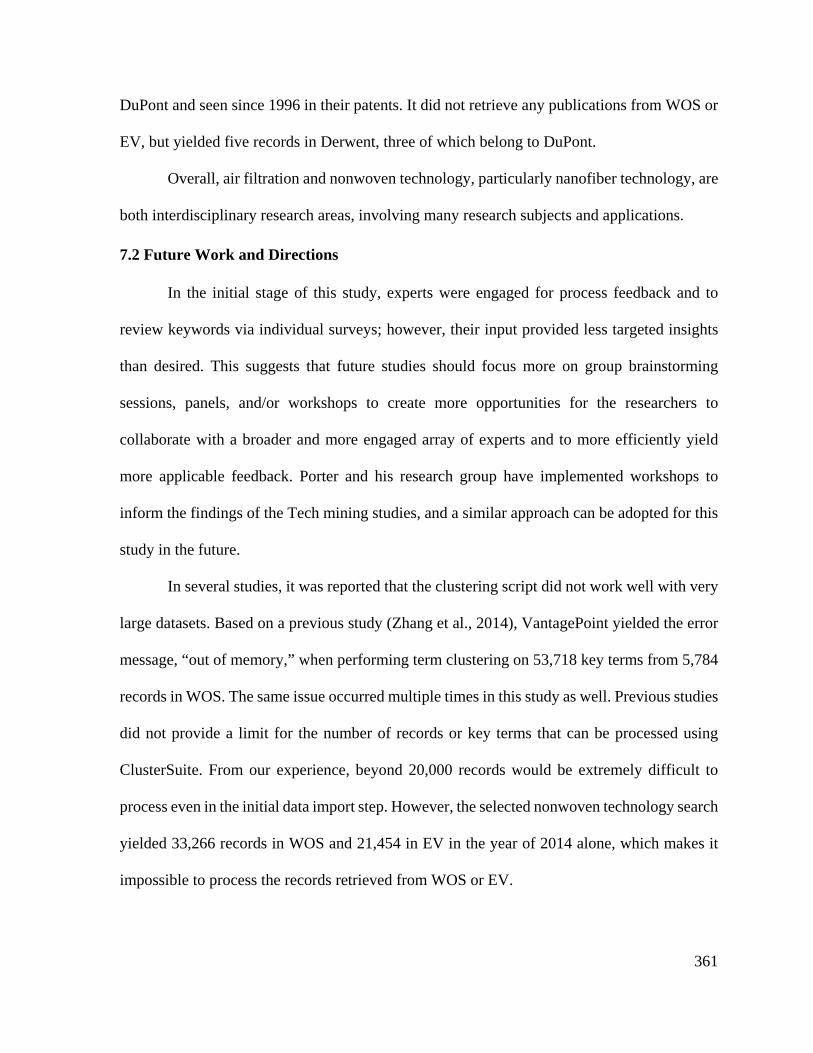
361
DuPont and seen since 1996 in their patents. It did not retrieve any publications from WOS or
EV, but yielded five records in Derwent, three of which belong to DuPont.
Overall, air filtration and nonwoven technology, particularly nanofiber technology, are
both interdisciplinary research areas, involving many research subjects and applications.
7.2 Future Work and Directions
In the initial stage of this study, experts were engaged for process feedback and to
review keywords via individual surveys; however, their input provided less targeted insights
than desired. This suggests that future studies should focus more on group brainstorming
sessions, panels, and/or workshops to create more opportunities for the researchers to
collaborate with a broader and more engaged array of experts and to more efficiently yield
more applicable feedback. Porter and his research group have implemented workshops to
inform the findings of the Tech mining studies, and a similar approach can be adopted for this
study in the future.
In several studies, it was reported that the clustering script did not work well with very
large datasets. Based on a previous study (Zhang et al., 2014), VantagePoint yielded the error
message, “out of memory,” when performing term clustering on 53,718 key terms from 5,784
records in WOS. The same issue occurred multiple times in this study as well. Previous studies
did not provide a limit for the number of records or key terms that can be processed using
ClusterSuite. From our experience, beyond 20,000 records would be extremely difficult to
process even in the initial data import step. However, the selected nonwoven technology search
yielded 33,266 records in WOS and 21,454 in EV in the year of 2014 alone, which makes it
impossible to process the records retrieved from WOS or EV.

362
The software programs used in the data analysis were VantagePoint, Excel, and
VOSviewer. They performed operations from records clean up and preprocessing, through
clustering. However, for advanced analysis, such as Principle Component Analysis, the results
may vary depending on the settings and algorithms in the software. So other software can be
incorporated into the data analysis to see if they yield different results and findings. The
coverages of the clusters formed via ClusterSuite and clustering (PCA) in VantagePoint were
not consistent. For example, 64%, 73%, and 54 % of the retrieved records on air filtration from
WOS, EV and DII were covered in the clusters. However, the clusters yielded from ABI
covered 12% of the records, which could cause information related to the study to be missing.
The clustering on the selected nonwoven technology search in DII covered 68% of the records.
The degree of coverage was improved to 92%, 92%, and 82% in the combined datasets in
WOS, EV, and DII, on the use of micro and nanofibers for air filtration. This indicated that
VantagePoint worked better with more technical information, such as ST&I data. From a
previous study (Zhang et al., 2014), the coverage was 32% of the records. The threshold of the
acceptable percentage of coverage has not been firmly established, yet higher coverage is
always desired when performing clustering analysis because it indicates higher accuracy and
more complete findings in the results (Zhang et al., 2014).
Furthermore, data retrieval on publications related to certain technologies and
applications was the focus of this study. Therefore, the data collected is mainly only related to
the ST&I activities. In the future, data related to technology can be paired with manufacturing,
and market or sales data, to identify trends from the technical side to the business side and end
users of the industry. By this means, the technlogy push and the market/demand pull can be
better coordinated.

363
REFERENCES
Akers, L., & Khorsandian, F. (2003). High Level Overview of Patent Search Types and Approaches. Chicago: PIUG.
Alencar, M. S. M., Porter, A. L., & Antunes, A. M. S. (2007). Nanopatenting patterns in
relation to product life cycle. Technological Forecasting and Social Change, 74(9), 1661-1680.
Altheide, D. L. (1996). Qualitative media analysis. Qualitative research methods Vol. 38.
Thousand Oaks: Sage. Anantharamaiah, N., Verenich, S., & Pourdeyhimi, B. (2008). Durable nonwoven fabrics via
fracturing bicomponent islands-in-the-sea filaments. Journal of Engineered Fibers and Fabrics, 3(3), 1-9.
Arora, S. K., Porter, A. L., Youtie, J., & Shapira, P. (2013). Capturing new developments in
an emerging technology: An updated search strategy for identifying nanotechnology research outputs. Scientometrics, 95(1), 351–370.
Arrue, J. L., Lopez, M. V. (1991), Conservation tillage research trends and priorities. Suelo Y
Planta, 1(4), 555–564. Badawy, M. K. (1998). Technology management education: alternative models. California
Management Review, 40(4), 94-116. Babbie, E. (2001). The practice of social research (9th ed.). Belmont: Wadsworth. Baglieri, D., & Cesaroni, F. (2013). Capturing the real value of patent analysis for R&D
strategies. Technology Analysis & Strategic Management, 25(8), 971–986. Batra, S. K., & Pourdeyhimi, B. (2012). Introduction to nonwovens technology. Lancaster,
PA.: DEStech Publications. Baumgarten, P.K. (1971). Electrostatic spinning of acrylic microfibers. J. Colloid Interface
Sci., 36, 71–79. Berelson, B. (1952). Content analysis in communication research. Retrieved from:
http://psycnet.apa.org.prox.lib.ncsu.edu/psycinfo/1953-07730-000. Bhat, G. S., & Malkan, S. R. (2002). Extruded continuous filament nonwovens: Advances in
scientific aspects. Journal of Applied Polymer Science, 83(3), 572-585. Bhat, G. S. & Malkan, S. R. (2007). Polymer-laid Web Formation. In S.J. Russell (Ed.),
Handbook of Nonwovens (pp. 143-200). Boca Raton, Fla: CRC Press.

364
Bonino, D., Ciaramella, A., & Corno, F. (2010). Review of the state-of-the-art in patent information and forthcoming evolutions in intelligent patent informatics. World Patent Information, 32(1), 30–38.
Bouchillon, R.E. (1992, April 7-10). Bicomponent Fibers Worldwide in 1NDA-TEC 92. Cary,
NC. Bowonder, B., Yadav, S., & Kumar, B. S. (2000). R&D spending patterns of global
firms. Research-Technology Management, 43(5), 40-56. Bramer, M. (2013). Principles of Data Mining. London: Springer London. Retrieved from
http://link.springer.com/10.1007/978-1-4471-4884-5. Bresee, R. R., & Ko, W-C. (2003). Fiber formation during melt blowing. International
Nonwovens Journal, 12(2), 21-28. Bresee, R. R., Qureshi, U. A., & Pelham, M. C. (2005). Influence of processing conditions on
melt blown web structure: Part 2–Primary airflow rate. International Nonwovens Journal, 14, 11–18.
Breitzman, A. F., & Mogee, M. E. (2002). The many applications of patent analysis. Journal
of Information Science, 28(3), 187–205. Bryman, A. (2004). Social research methods (2nd ed.). New York: Oxford University Press. Buer, A., Ugbolue, S. C., & Warner, S. B. (2001). Electrospinning and Properties of Some
Nanofibers. Textile Research Journal, 71(4), 323–328. https://doi.org/10.1177/004051750107100408
Burgelman, R. A., Christensen, C. M., & Wheelwright, S. C. (2004). Strategic Management of
Technology and Innovation (4th ed.). Boston, MA: McGraw Hill. Buschle-Diller, G., Cooper, J., Xie, Z., Wu, Y., Waldrup, J., & Ren, X. (2007). Release of
antibiotics from electrospun bicomponent fibers. Cellulose 14, 553–562. Butler, I. (1999). Worldwide prospects for spunbond. Nonwovens World, 8, 59–63. Chen, H., Zhang, G., Zhu, D., & Lu, J. (2015). A patent time series processing component for
technology intelligence by trend identification functionality. Neural Computing and Applications, 26(2), 345–353.
Cheng, C. Y. (1994). A polypropylene extrusion system for nonwoven processes. Tappi
Journal, 77 (12). Cheng, C. Y. (2006). Spunbonding and meltblowing fundamentals in nonwovens: The meltblowing process. INDA and NCRC short course, Raleigh, NC.

365
Chanaron, J. J., & Grange, T. (2006, June). Towards a re-definition of Technology Management. In The 3rd IEEE International Conference on Management Innovation and Technology (pp. 955–959).
Chanaron, J., & Jolly, D. (1999). Technological management: expanding the perspective of
management of technology. Management Decision, 37(8), 613–621. Choi, S., Kim, H., Yoon, J., Kim, K., & Lee, J. Y. (2012). An SAO-based Text-mining
Approach for Technology Roadmapping using Patent Information. R&D Management, 43(1), 52–74.
Chung, HY. (2011). Electrospinning: An industrial perspective. Proceedings from The Fiber
Society Spring 2011 Conference, Hong Kong, China. Cialdini, R. B. (1980). ‘Full-cycle social psychology’. In Bickman, L. (Ed.), Applied Social
Psychology Annual. Beverly Hills, CA: Sage, 1, 21–47. Coates, V., Farooque, M., Klavans, R., Lapid, K., Linstone, H. A., Pistorius, C., & Porter, A.
L. (2001). On the future of technological forecasting. Technological Forecasting and Social Change, 67(1), 1–17.
Cohen, A. M., & Hersh, W. R. (2005). A survey of current work in biomedical text
mining. Briefings in bioinformatics, 6(1), 57-71. Dahiya, A., Kamath, M., Hegde, R., Huang, H.-Y., & Gao, X. (2004, April). Spunbond
Technology. Retrieved from www.engr.utk.edu/mse/Textiles/Spunbond%20Technology.htm
Dahiya, A., Kamath, M., Hegde, R., Kotra, R., & Rong, H. (2004, April). Melt Blown
Technology. Retrieved from http://www.engr.utk.edu/mse/Textiles/Melt%20Blown%20Technology.htm
Daim, T. U., Rueda, G., Martin, H., & Gerdsri, P. (2006). Forecasting emerging technologies:
Use of bibliometrics and patent analysis. Technological Forecasting and Social Change, 73(8), 981–1012.
Damanpour, F., & Gopalakrishnan, S. (2001). The dynamics of the adoption of product and
process innovations in organizations. Journal of Management Studies, 38(1), 45-65. Dankbaar, B. (1993). Research and technology management in enterprises: issues for
community policy. Overall Strategic Review, EUR. Dasdemir, M., Maze, B., Anantharamaiah, N., & Pourdeyhimi, B. (2012). Influence of polymer
type, composition, and interface on the structural and mechanical properties of core/sheath type bicomponent nonwoven fibers. J. Mater. Sci. 47, 5955–5969.

366
Deitzel, J. M., Kleinmeyer, J., Harris, D., & Beck Tan, N. . (2001a). The effect of processing variables on the morphology of electrospun nanofibers and textiles. Polymer, 42(1), 261–272. https://doi.org/10.1016/S0032-3861(00)00250-0
Deitzel, J. M., Kleinmeyer, J. D., Hirvonen, J. K., & Beck Tan, N. C. (2001b). Controlled
deposition of electrospun poly(ethylene oxide) fibers. Polymer, 42(19), 8163–8170. https://doi.org/10.1016/S0032-3861(01)00336-6
Denton, M.J. (1982) The crimp curvature of bicomponent fibres. J. Text. Inst. 73, 253–263. Ding, Y., Chowdhury, G. G., & Foo, S. (2001). Bibliometric cartography of information
retrieval research by using co-word analysis. Information processing & management, 37(6), 817-842.
Drabek, J., & Zatloukal, M. (2013, April). Rheological evaluation of melt blown polymer melt.
In NOVEL TRENDS IN RHEOLOGY V (Vol. 1526, No. 1, pp. 237-247). AIP Publishing.
Dugan, J. S. (2002). U.S. Patent No. 6,461,729 B1. Washington, DC: U.S. Patent and
Trademark Office. Dutton, K. (2008). Overview and analysis of the meltblown process and parameters. Journal
of Textile and Apparel, Technology and Management 6(3), 1-25. Echambadi, R., Campbell, B. and Agarwal, R. (2006). ‘Encouraging best practice in
quantitative management research: an incomplete list of opportunities. Journal of Management Studies, 43, 1803–1822.
EDANA. (2015). Facts and figures. Retrieved from http://www.edana.org/discover-
nonwovens/facts-and-figures. EDANA. & INDA. (2012). Worldwide Outlook Nonwovens Industry. NC, US: INDA, &
Brussels, Belgium: EDANA. Edelman, L. (2008). Air filtration: Air filter media—an industry evolves. Filtration &
Separation, 45(9), 24–26. EITIM (European Institute of Technology and Innovation Management). Definition of
Technology Management. Retrieved from http://riga.tim.tu-berlin.de/eitim/index.php?option=com_content&view=article&id=2&Itemid=2.
Ellison, C. J., Phatak, A., Giles, D. W., Macosko, C. W., & Bates, F. S. (2007). Melt blown
nanofibers: Fiber diameter distributions and onset of fiber breakup. Polymer, 48(11), 3306–3316.
EPO. (2013). Archive. Retrieved from https://www.epo.org/news-issues/news/2013.html.
367
EPO. (2015). Statistics. Retrieved from https://www.epo.org/about-us/annual-reports-
statistics/statistics.html. Ernst, H. (2003). Patent information for strategic technology management. World Patent
Information, 25(3), 233–242. Fabry, B., Ernst, H., Langholz, J., & Köster, M. (2006). Patent portfolio analysis as a useful
tool for identifying R&D and business opportunities—an empirical application in the nutrition and health industry. World Patent Information, 28(3), 215–225.
Fall, C.J., Torcsvari, A., Benzineb, K., & Karetka, G. (2003). Automated categorization in the
international patent classification. ACM SIGIR Forum, 37 (1), 10–25. Fattori, M., Pedrazzi, G., & Turra, R. (2003). Text mining applied to patent mapping: a
practical business case. World Patent Information, 25(4), 335–342. Fedel, T. (2013). The Filter Factor, (May/June, 2013). Retrieved from
http://www.textileworld.com/Issues/2013/May-June/Nonwovens-Technical_Textiles/The_Filter_Factor.
Fedorova, N. (2006). Investigation of the utility of islands-in-the-sea bicomponent fiber
technology in the spunbond process. PhD Dissertation. North Carolina State University, Raleigh, NC.
Fedorova, N., & Pourdeyhimi, B. (2007). High strength nylon micro- and nanofiber based
nonwovens via spunbonding. Journal of Applied Polymer Science, 104(5), 3434–3442. Feldman, R., Regev, Y., & Gorodetsky, M. (2008). A modular information extraction system.
Intelligent Data Analysis, 12, 51–71. Feldman, R., & Sanger, J. (2007). The text mining handbook: advanced approaches in
analyzing unstructured data. Cambridge University Press. Fine, G. A., & Elsbach, K. D. (2000). Ethnography and experiment in social psychological
theory-building: tactics for integrating qualitative field data with quantitative lab data. Journal of Experimental Social Psychology, 36, 51–76.
Formhals, A. (1934). U.S. Patent No. 1,975,504. Washington, DC: U.S. Patent and Trademark
Office. Fox-Wolfgramm, S. J. (1997). Towards developing a methodology for doing qualitative
research: The dynamic-comparative case study method. Scandinavian Journal of Management, 13(4), 439–455.

368
Franzosi, R. P. (2004). Content Analysis. In M. Hardy & A. Bryman, Handbook of Data Analysis (pp. 548–565). London, United Kingdom: SAGE Publications, Ltd. Retrieved from http://knowledge.sagepub.com/view/handbook-of-data-analysis/n24.xml
Frey, L., Botan, C., & Kreps, G. (1999). Chapter 9: Textual Analysis. In Investigating
communication: An introduction to research methods. (2nd ed.). Boston: Allyn & Bacon.
Gahan, R., & Zguris, G. C. (2000, Jan.11-14). A review of the melt blown process. Proceedings
from The Fifteenth Annual Battery Conference on Applications and Advances, 145-149.
Garechana, G., Rio-Belver, R., Cilleruelo, E., & Gavilanes-Trapote, J. (2014). Capturing waste
recycling science. Technological Forecasting and Social Change, 81, 250–258. https://doi.org/10.1016/j.techfore.2012.07.005.
Garland, G. M. (2013). Technology Forecasting (TF) using Hybrid Tech Mining, TRIZ TF for
Research and Development Planning: Forecast for Nonwovens Air Filtration Media. PhD Dissertation. North Carolina State University, Raleigh, NC.
Gibson, P. W., Schreuder-Gibson, H. L., & Rivin, D. (1999). Electrospun fiber mats: Transport
properties. AIChE Journal, 45(1), 190–195. https://doi.org/10.1002/aic.690450116 Gilmore, T.F. (1992). Spunbond web formation processes: A critical review. In Spunbond
technology today 2: Onstream in the 90’s (pp.169-174). San Francisco, California: Miller Freeman.
Glaser, B. and Strauss, A. (1967). The Discovery of Grounded Theory: Strategies for
Qualitative Research. New York: Aldine De Gruyter. Gopalakrishnan, S., & Damanpour, F. (1997). A review of innovation research in economics,
sociology and technology management. Omega The International Journal of Management Science, 25(1), 15–28.
Gordon, T., Cookfair, A., LoTempio, V. and Lillis, B. (2012). Patent Fundamentals for
Scientists and Engineers, 3rd Edition. Boca Raton, FL: CRC Press. Grafe, T., & Graham, K. (2003, September 24-26). Polymeric nanofibers and nanofiber webs:
A new class of nonwovens. Paper presented at International Nonwovens Technical Conference (Joint INDA – TAPPI Conference), Atlanta, GA.
Granstrand, O. (1999). The economics and management of intellectual property: Towards
intellectual capitalism. Cheltenham: Edward Elgar Publishing. Gregor, E. (2015). Filtration - A Growth Market for Synthetic Fibers. International Fiber
Journal. Retrieved from http://www.egregor.com/wp-

369
content/uploads/2013/08/Filtration__A_Growth_Market_for_Synthetic_Fibers_by_Edward_C_Gregor.pdf.
Gregor, E. (1998). Book of Papers, Filtration Markets & Issues 9, IDEA. Guo, Y., Huang, L., & Porter, A. L. (2010). The research profiling method applied to nano-
enhanced, thin-film solar cells. R&D Management, 40(2), 195–208. https://doi.org/10.1111/j.1467-9310.2010.00600.x
Grupp, H., & Schmoch, U. (1999). Patent statistics in the age of globalisation: new legal
procedures, new analytical methods, new economic interpretation. Research Policy, 28(4), 377-396.
Gupta, A., Saquing, C. D., Afshari, M., Tonelli, A. E., Khan, S. A., & Kotek, R. (2009). Porous
Nylon-6 Fibers via a Novel Salt-Induced Electrospinning Method. Macromolecules, 42(3), 709–715. https://doi.org/10.1021/ma801918c
Gupta, P., & Wilkes, G. L. (2003). Some investigations on the fiber formation by utilizing a
side-by-side bicomponent electrospinning approach. Polymer, 44(20), 6353–6359. https://doi.org/10.1016/S0032-3861(03)00616-5
Hagewood, J. (2004). Properties study of new bico spunbond and meltblown barrier fabrics.
Proceedings to INTC. Hagewood, J. (2006). Spunbonding and meltblowing fundamentals in nonwovens: The
spunbonding process. INDA and NCRC short course, Raleigh, NC. Hatchuel, A. (2005, January 18). Competences et innovation. Le Monde. Hayati, I., Bailey, A., & Tadros, T. . (1987). Investigations into the mechanisms of
electrohydrodynamic spraying of liquids. Journal of Colloid and Interface Science, 117(1), 205–221. https://doi.org/10.1016/0021-9797(87)90185-8
Hearst, M. A. (1999, June). Untangling text data mining. In Proceedings of the 37th annual
meeting of the Association for Computational Linguistics on Computational Linguistics (pp. 3-10). Association for Computational Linguistics.
Hegde, R., Dahiya, A., & Kamath, M. G. (2004). Bicomponent Fibers. Retrieved from
http://www.engr.utk.edu/mse/Textiles/Bicomponent%20fibers.htm on April 4, 2014. Hegde, R., Dahiya, A., & Kamath, M. G. (2004). Nanofiber nonwovens. Retrieved from
http://www.engr.utk.edu/mse/pages/Textiles/Nanofiber%20Nonwovens.htm on April 4, 2014.
Hersh, W. R., & Bhupatiraju, R. T. (2003). TREC GENOMICS track overview. In TREC (Vol.
2003, pp. 14-23).

370
Hill, R.G. (1990). Book of papers. Fiber Production Conference, Greenville, SC, USA. Holsti, O. R. (1969). Content analysis for the social sciences and humanities. Addison-Wesley
Pub. Co Hu, X., Rousseau, R., & Chen, J. (2012). A new approach for measuring the value of patents
based on structural indicators for ego patent citation networks. Journal of the American Society for Information Science and Technology, 63(9), 1834–1842.
Hunt, D., Nguyen, L., & Rodgers, M. (Eds.). (2007). Patent searching: tools & techniques.
Hoboken, N.J: Wiley. Hutten, I. M. (2007). Liquid filter applications. In Handbook of non-woven filter media.
Burlington, MA: Elsevier. Iansiti, M. (2000). How the incumbent can win: managing technological transitions in the
semiconductor industry. Management Science, 46(2), 169–185. https://doi.org/10.1287/mnsc.46.2.169.11922
INDA. (2002). INDA Nonwovens Glossary. Cary, NC, USA: INDA. INDA. (2008). Worldwide outlook for the nonwovens industry 2007-2012. Cary, NC, USA:
INDA. INDA. (2011). North America: Nonwovens Industry Outlook Trends & Forecasts 2010-2015.
Cary, NC, USA: INDA INDA. (2015). Glossary of Terms. Retrieved from http://www.inda.org/about-
nonwovens/nonwovens-glossary-of-terms/. Ingwersen, P. (1982). Search procedures in the library analyzed from the cognitive point of
view. Journal of Documentation, 38, 165–191. Jaeger, R., Bergshoef, M. M., Batlle, C. M. I., Schönherr, H., & Julius Vancso, G. (1998).
Electrospinning of ultra-thin polymer fibers. Macromolecular Symposia, 127(1), 141–150. https://doi.org/10.1002/masy.19981270119
James, A. (1997). Principles of spin pack design: A guide to selecting components.
International Fiber Journal, 12(2), 16-20. Janasik, N., Honkela, T., & Bruun, H. (2009). Text Mining in Qualitative Research:
Application of an Unsupervised Learning Method. Organizational Research Methods, 12(3), 436–460.

371
Jeong, Y., & Yoon, B. (2015). Development of patent roadmap based on technology roadmap by analyzing patterns of patent development. Technovation, 39-40, 37–52.
Jirsak, O., & Wadsworth, L.C. (1999). Nonwoven textiles. Durham, NC: Carolina Academic
Press. Hox, J. J. & Boeije, H. R. (2005). Data Collection, Primay vs. Secondary. In Encyclopedia of
Social Management (Vol. 1). New York, USA: Elsevier Inc. Huang, C., Notten, A., & Rasters, N. (2011). Nanoscience and technology publications and
patents: A review of social science studies and search strategies. The Journal of Technology Transfer, 36(2), 145–172.
Huang, Y., Schuehle, J., Porter, A. L., & Youtie, J. (2015). A systematic method to create
search strategies for emerging technologies based on the Web of Science: illustrated for “Big Data.” Scientometrics, 105(3), 2005–2022. https://doi.org/10.1007/s11192-015-1638-y
Jick, T. D. (1979). Mixing qualitative and quantitative methods: triangulation in
action. Administrative Science Quarterly, 24, 602–611. Jun, S., & Park, S. S. (2013). Examining technological innovation of Apple using patent
analysis. Industrial Management & Data Systems, 113(6), 890–907. Kajanan, S., Bao, Y., Datta, A., VanderMeer, D., & Dutta, K. (2014). Efficient automatic
search query formulation using phrase-level analysis: Efficient Automatic Search Query Formulation Using Phrase-Level Analysis. Journal of the Association for Information Science and Technology, 65(5), 1058–1075.
Kuzhabekova, A., & Kuzma, J. (2014). Mapping the emerging field of genome
editing. Technology Analysis & Strategic Management, 26(3), 321-352. Keiser, J., & Utzinger, J. (2005). Emerging foodborne trematodiasis. Emerging infectious
diseases, 11(10). Kelly, D., & Cool, C. (2002). The effects of topic familiarity on information search
behavior. Proceedings of the 2nd ACM/IEEE-CS joint conference on Digital libraries (JCDL '02) (pp. 74–75). New York: ACM. doi:10.1145/544220.544232
Khalil, T. M. (1998). Management of technology: Future directions and needs for the new
century. National Science Foundation, NSF Grant No: DMI-9725914. Khalil, T., & Bayraktar, B. A. (1990). Management of Technology, the Key to Global
Competitiveness. In Proceedings, 2nd International Conference on Management of Technology, Miami, Feb (Vol. 28).

372
Kikutani, I., Radhakrishnan, J., Arikawa, S., Takaku, A., Okui, N., Jin, N., Niwa, F., & Kudo, Y. (1996). High-Speed Melt Spinning of Bicomponent Fibers: Mechanism of Fiber Structure Development in Poly (ethylene terephtalate)/Propylene System. Journal of Applied Polymer Science, 62, 1913-1924.
Kim, J.-S., & Reneker, D. H. (1999), Mechanical properties of composites using ultrafine
electrospun fibers. Polymer Composites, 20(1), 124–131. doi:10.1002/pc.10340 Kim, Y. G., Suh, J. H., & Park, S. C. (2008). Visualization of patent analysis for emerging
technology. Expert Systems with Applications, 34(3), 1804–1812. Kinney, G.A. (1967). Process for forming non-woven filamentary structures from fiber
forming synthetic organic polymers. US Patent 3338992. DuPont Co. Klaessig, F., Marrapese, M., & Abe, S. (2011). Current Perspectives in Nanotechnology
Terminology and Nomenclature. In V. Murashov & J. Howard (Eds.), Nanotechnology Standards (pp. 21–52). New York, NY: Springer New York. Retrieved from http://link.springer.com/10.1007/978-1-4419-7853-0_2
Knight, H. J. (2013). Patent strategy for researchers and research managers (Third edition).
Hoboken, NJ: Wiley. Kohlbacher, F. (2006, January). The use of qualitative content analysis in case study research.
In Forum Qualitative Sozialforschung/Forum: Qualitative Social Research (Vol. 7, No. 1).
Kostoff, R. N., Boylan, R., & Simons, G. R. (2004). Disruptive technology roadmaps.
Technological Forecasting and Social Change, 71(1-2), 141–159. Kostoff, R. N., & DeMarco, R. A. (2001). Peer reviewed: Extracting information from the
literature by text mining. Analytical Chemistry, 73(13), 370 A–378 A. https://doi.org/10.1021/ac012472h
Kostoff, R. N., Koytcheff, R. G., & Lau, C. G. Y. (2007). Global nanotechnology research
literature overview. Technological Forecasting and Social Change, 74(9), 1733–1747. Kostoff, R. N., Stump, J. A., Johnson, D., Murday, J. S., Lau, C. G., & Tolles, W. M. (2006).
The structure and infrastructure of the global nanotechnology literature. Journal of Nanoparticle Research, 8(3-4), 301-321.
Kostoff, R. N., Toothman, D. R., Eberhart, H. J., & Humenik, J. A. (2001). Text mining using
database tomography and bibliometrics: A review. Technological Forecasting and Social Change, 68(3), 223–253.
Kracauer, S. (1952). The challenge of qualitative content analysis. Public Opinion
Quarterly, 16(4), 631-642.

373
Krippendorff, K. (2012). Content Analysis: An Introduction to Its Methodology. Beverly Hills,
CA: Sage Publications. Kubo, E., & Watanabe, M. (1994). Spinning for nonwovens. In Advanced fiber spinning
technology. Larrondo, L., & St. John Manley, R. (1981a). Electrostatic fiber spinning from polymer melts.
I. Experimental observations on fiber formation and properties. Journal of Polymer Science: Polymer Physics Edition, 19(6), 909–920.
Larrondo, L., & St. John Manley, R. (1981b). Electrostatic fiber spinning from polymer melts.
II. Examination of the flow field in an electrically driven jet. Journal of Polymer Science: Polymer Physics Edition, 19(6), 921–932.
Lasswell, H. D. (1948). The structure and function of communication in society. The
communication of ideas, 37, 215-228. Lee, C., Jeon, J., & Park, Y. (2011). Monitoring trends of technological changes based on the
dynamic patent lattice: A modified formal concept analysis approach. Technological Forecasting and Social Change, 78(4), 690–702.
Lee, C., Park, H., & Park, Y. (2013). Keeping abreast of technology-driven business model
evolution: a dynamic patent analysis approach. Technology Analysis & Strategic Management, 25(5), 487–505.
Lee, K. H., Kim, H. Y., Ryu, Y. J., Kim, K. W., & Choi, S. W. (2003). Mechanical behavior
of electrospun fiber mats of poly(vinyl chloride)/polyurethane polyblends. Journal of Polymer Science Part B: Polymer Physics, 41(11), 1256–1262. https://doi.org/10.1002/polb.10482
Lee, S., & Obendorf, S. K. (2007). Use of Electrospun Nanofiber Web for Protective Textile
Materials as Barriers to Liquid Penetration. Textile Research Journal, 77(9), 696–702. Lee, S., Yoon, B., Lee, C., & Park, J. (2009). Business planning based on technological
capabilities: Patent analysis for technology-driven roadmapping. Technological Forecasting and Social Change, 76(6), 769–786.
Lee, S., Yoon, B., & Park, Y. (2009). An approach to discovering new technology
opportunities: Keyword-based patent map approach. Technovation, 29(6-7), 481–497. Leech, N. L., & Onwuegbuzie, A. J. (2008). Qualitative data analysis: A compendium of
techniques and a framework for selection for school psychology research and beyond. School Psychology Quarterly, 23(4), 587–604.

374
Li, D., & Xia, Y. (2004). Direct Fabrication of Composite and Ceramic Hollow Nanofibers by Electrospinning. Nano Letters, 4, 933–938.
Li, L. L., Ding, G., Feng, N., Wang, M. H., & Ho, Y. S. (2009). Global stem cell research
trend: Bibliometric analysis as a tool for mapping of trends from 1991 to 2006. Scientometrics, 80(1), 39-58.
Lichtenthaler, E. (2003). Third generation management of technology intelligence
processes. R&D Management, 33(4), 361-375. Lim, H.S. (2010). A Review of Spunbond Process. Journal of Textile and Apparel, Technology
and Management 6(3), 1-13. Lin, F.-R., Hsieh, L.-S., & Chuang, F.-T. (2009). Discovering genres of online discussion
threads via text mining. Computers & Education, 52(2), 481–495. doi:http://dx.doi.org.prox.lib.ncsu.edu/10.1016/j.compedu.2008.10.005
Lin, T., Wang, H., & Wang, X. (2005). Self‐crimping bicomponent nanofibers electrospun
from polyacrylonitrile and elastomeric polyurethane. Advanced Materials, 17(22), 2699-2703.
Liu, C-Y., & Yang, J.C. (2008). Decoding patent information using patent maps. Data Science
Journal, 7, 14-22. Loscertales, G. Barrero, A., Guerrero, I., Cortijo, R., Marquez, M., & Gañán-Calvo, AM.
(2002). Micro/Nano Encapsulation via Electrified Coaxial Liquid Jets. Science 295, 1695–1698.
Louks, J. W., Perez, M. A., & Swan, M. D. (2000). Microfibers and method of making. Lozano, K., & Sarkar, K. (2009). U.S. Patent Application No. 12/404,907. Washington, DC:
U.S. Patent and Trademark Office. Lund, A. , Jonasson, C., Johansson, D., Haagensen, B., & Hagström. (2012). Piezoelectric
polymeric bicomponent fibers produced by melt spinning. J. Appl. Polym. Sci. 126, 490–500.
Luo, J., Xu, G.-B., & Wang, F.-M. (2009). External configuration and crimp parameters of
PTT (Polytrimethylene terephthalate)/PET (Polyethylene terephthalate) conjugated fiber. Fibers Polym. 10, 508–512.
Ma, J., & Porter, A. L. (2015). Analyzing patent topical information to identify technology
pathways and potential opportunities. Scientometrics, 102(1), 811-827. Makoto, K., Yasuhiko, N., Miyoshi, O., & Koji, W. (1971). U.S. Patent No. 3,562,374.
Washington, DC: U.S. Patent and Trademark Office.

375
Malkan, S. (1995). An overview of spunbonding and meltblowing technologies. Tappi
Journal, 78, 185-185. Malkan, S., & Wadsworth, L. (1992). A review on spunbond technology. International
Nonwovens Bulletin, 3, 24-33. Malkan, S., & Wadsworth, L. (1993). Polymer-laid systems. In Turbak A. (Ed.), Nonwovens:
Theory, process, performance, and testing (pp.171-192). Atlanta: TAPPI Press. Mango, P. (2012, May 16). Dispersible Nonwovens for Flushable Wipes. Nonwovens Industry.
Retrieved from http://www.nonwovens-industry.com/contents/view_experts-opinion/2012-05-16/dispersible-nonwovens-for-flushable-wipes.
Marmon, S.E., Samuels, B.P. & Wazeerud-Din, E.S. (1998). Entangled nonwoven fabrics and methods for forming the same from splittable multicomponent fibers. Kimberly-Clark, US: WO 9823804. Martin, G. (2009). Mixing in Single Screw Extrusion. Shrewsbury, Shropshire, U.K.:
iSmithers. Martino, J. (1993). Technological Forecasting for Decision Making (3rd ed.). New York:
McGraw-Hill Inc. Martino, J. P. (2003). A review of selected recent advances in technological forecasting.
Technological Forecasting and Social Change, 70(8), 719–733. Masiakowski, P., & Wang, S. (2013). Integration of software tools in patent analysis. World
Patent Information, 35(2), 97–104. Mason, R. M., Lefebvre, L. A., & Khalil, T. M. (1996). Management of Technology V:
Technology Management in a Changing World: Proceedings of the Fifth International Conference on Management of Technology, February 27-March 1, 1996 Miami, Florida, USA. Elsevier Advanced Technology.
Mayring, P. (2000, June). Qualitative content analysis [28 paragraphs]. Forum Qualitative
Sozialforschung / Forum: Qualitative Social Research [On-line Journal], 1(2), Art. 20. Available at: http://www.qualitative-research.net/fqs-texte/2-00/2-00mayring-e.htm.
Mazé, B., Tafreshi, H. V., & Pourdeyhimi, B. (2008). Case studies of air filtration at
microscales: micro-and nanofiber media. J. Eng. Fibers and Fabrics, 3(2), 7–12. McCann, J., Li, T., & Xia, Y. (2005). Electrospinning of nanofibers with core-sheath, hollow,
or porous structures. Journal of Materials Chemistry, 15, 735-738.

376
McCulloch, S. (1999). Histroy of the development of melt blowing technology. International Nonwovens Journal, 8(1), 139-149.
McCulloch, S. R., Pourdeyhimi, B., & Zamfir, M. (2003, June 1) Recent developments in
spunbonding and meltblowing: Technologies have seen variety of innovations over the years. Nonwovens Industry, 34, 48-52.
McEachin, Z., & Lozano, K. (2012). Production and characterization of polycaprolactone
nanofibers via forcespinningTM technology. Journal of Applied Polymer Science, 126(2), 473–479.
McNally, E.K. (1998). Melt blown technology innovations. Tappi Journal, 81(3), 193-198. McKelvey, J. M., Polymer Processing, John Wiley & Sons, New York, 1962. Michielsen, S., Pourdeyhimi, B., & Desai, P. (2006). Review of thermally point‐bonded
nonwovens: Materials, processes, and properties. Journal of Applied Polymer Science, 99(5), 2489-2496.
Miner, G. (2012). Practical Text Mining and Statistical Analysis for Non-structured Text Data
Applications. Mintzberg, H. (1979). An emerging strategy of direct research. Administrative Science
Quarterly, 24, 105–116. Moghe, A., & Gupta, B. (2008). Co‐axial electrospinning for nanofiber structures: preparation
and applications. Polymer Reviews, 48(2), 353–377. Mogoutov, A., & Kahane, B. (2007). Data search strategy for science and technology
emergence: A scalable and evolutionary query for nanotechnology tracking. Research Policy, 36(6), 893–903.
Montefusco, A. F. (2005). The use of nonwovens in air filtration. Filtration & Separation,
42(2), 30–31. https://doi.org/10.1016/S0015-1882(05)00446-5 Moses, M., Hohman, M. M., Shin, Y. M., Rutledge, G. C., & Brenner, M. P. (2001a).
Electrospinning and electrically forced jets. I. Stability theory. Physics of Fluids, 13, 2201-2220.
Moses, M., Hohman, M. M., Shin, Y. M., Rutledge, G. C., & Brenner, M. P. (2001b).
Electrospinning and electrically forced jets. II. Applications. Physics of Fluids, 13, 2221-2236.
Mostyn, B. (1985). The content analysis of qualitative research data: A dynamic approach. In
Michael Brenner, Jennifer Brown & David Canter (Eds.), The research interview, uses and approaches (pp.115-145). London: Academic Press.

377
Norris, I. D., Shaker, M. M., Ko, F. K., & MacDiarmid, A. G. (2000). Electrostatic fabrication
of ultrafine conducting fibers: polyaniline/polyethylene oxide blends. Synthetic Metals, 114(2), 109–114. https://doi.org/10.1016/S0379-6779(00)00217-4
Oh, T. H. (2006). Melt spinning and drawing process of PET side-by-side bicomponent fibers.
Journal of Applied Polymer Science, 101(3), 1362–1367. Phaal, R., Farrukh, C. J. P., & Probert, D. R. (2004). Technology roadmapping—A planning
framework for evolution and revolution. Technological Forecasting and Social Change, 71(1-2), 5–26.
Pike, R. D. (1999). Superfine microfiber nonwoven web. Porter, A. L. (2007). How “tech mining” can enhance R&D management. Research
Technology Management, 50(2), 15. Porter, A., & Cunningham, S. (2005). Tech Mining: Exploiting New Technologies for
Competitive Advantage. New Jersey: John Wiley & Sons, Inc. Porter, A. L., Youtie, J., Shapira, P., & Schoeneck, D. J. (2008). Refining search terms for
nanotechnology. Journal of Nanoparticle Research, 10, 715–728. Pourdeyhimi, B. (2011). Nanofibers: Competing technologies. Nanofibers for the 3rd
Millennium (N3M) Conference, Raleigh, North Carolina. Pourmohammadi, A. (2007). Thermal Bonding. In S.J. Russell (Ed.), Handbook of Nonwovens
(pp. 298-329). Boca Raton, Fla: CRC Press. Purchas, D. B., & Sutherland, K. (2002). Filter media standards. In Handbook of filter media.
New York: Elsevier. Qin, J. (2000), Semantic similarities between a keyword database and a controlled vocabulary
database: An investigation in the antibiotic resistance literature. Journal of the American Society for Information Science, 51(2), 166–180.
Radhakrishnan, J., Kikutani, T., Okui N. (1997). High-Speed Melt Spinning of Sheath-Core
Bicomponent Polyester Fibers: High and Low Molecular Weight Poly(ethylene Terephthalate) Systems, Text. Res. J. 67, 684–694.
Reneker D.H., & Chun I. (1996). Nanometre diameter fibres of polymer, produced by
electrospinning. Nanotechnology, 7(3), 216-223. Rivette, K.G., and D. Kline. 1999. Rembrandts in the attic: Unlocking the hidden value of
patents. Boston, MA: Harvard Business School Press.

378
Rosato, D., Rosato, M. & Rosato, D. (2000). Concise encyclopedia of plastics. Boston, MA: Kluwer Academic.
Rupp, J. (n.d.). Spunbond & Meltblown Nonwovens: Part two of a five-part series on
nonwoven manufacturing technologies, (May/June, 2008). Retrieved from http://www.textileworld.com/Issues/2008/May-June/Nonwovens-Technical_Textiles/Spunbond_and_Meltblown_Nonwovens
Rwei, S.P., Lin, Y.T., Su, Y.Y. (2005). Study of self-crimp polyester fibers. Polym. Eng. Sci.
45, 838–845. Rwei, S.P., Jue, Z.F., & Chen, F.L. (2004). PBT/PET conjugated fibers: melt spinning, fiber properties and thermal bonding. Polymer Engineering and Science, 331-344. Ryan, G. W., & Bernard, H. R. (2000). Data management and analysis methods. In Norman
K. Denzin & Yvonna S. Lincoln (Eds.), Handbook of qualitative research (pp.769-802). Thousand Oaks: Sage.
Saine, J., Sinangil, M., Allen, M., & McCulloch, J. (1998, Nov. 18-20). Advanced hot melt
adhesive technology. Proceeding from the 8th Annual TANDEC Conference. Santo, M.d. M., et al. (2006). Text mining as a valuable tool in foresight exercises: A study on
nanotechnology. Technological Forecasting & Social Change, 73, 1013–1027. Sarkar, K., Gomez, C., Zambrano, S., Ramirez, M., de Hoyos, E., Vasquez, H., & Lozano, K.
(2010). Electrospinning to forcespinning™. Materials Today, 13(11), 12-14. Scarbrough, H. & Swan, J. (2001). Explaining the diffusion of knowledge management: The
role of fashion. British Journal of Management, 12, 3-12. Schafer, A., Fane, A., & Waite, T. (n.d.). Nanofiltration : principles and applications.
Retrieved from http://catalog.lib.ncsu.edu/record/NCSU1750116. Scheu, M., Veefkind, V., Verbandt, Y., Galan, E. M., Absalom, R., & Förster, W. (2006).
Mapping nanotechnology patents: The EPO approach. World Patent Information, 28, 204- 211.
Shah, S. K., & Corley, K. G. (2006). Building better theory by bridging the quantitative–
qualitative divide. Journal of Management Studies, 43(8), 1821-1835. Shambaugh, R.L. (1988). A macroscopic view of the melt-blowing process for producing
microfibers. Industrial Engineering Chemistry Research, 27(12), 2363-2372. Shi, X. Q., Ito, H., & Kikutani, T. (2006). Structure development and properties of high-speed
melt spun poly(butylene terephthalate)/poly(butylene adipate-co-terephthalate) bicomponent fibers. Polymer 47, 611–616.

379
Shim, E. (2014). Course notes from TT/NW503. The Nonwovens Institute, North Carolina
State University, Raleigh, NC, USA. Shin, Y. M., Hohman, M. M., Brenner, M. P., & Rutledge, G. C. (2001). Experimental
characterization of electrospinning: the electrically forced jet and instabilities. Polymer, 42(25), 09955–09967. https://doi.org/10.1016/S0032-3861(01)00540-7
Sievering, R., & Waltermann, H. (April 1997). Modern spin packs. International Fiber
Journal, 29-30. Singh, N., Hu, C., & Roehl, W. S. (2007). Text mining a decade of progress in hospitality
human resource management research: Identifying emerging thematic development. International Journal of Hospitality Management, 26(1), 131-147.
Smorada, R. S. (2002). Nonwoven fabrics, spunbonded. Encyclopedia of polymer science and
technology. New Jersey, USA: John Wiley & Sons, Inc. Spivak, A. F., & Dzenis, Y. A. (1999). A Condition of the Existence of a Conductive Liquid
Meniscus in an External Electric Field. Journal of Applied Mechanics, 66(4), 1026–1028. https://doi.org/10.1115/1.2791775
Staff Report. (1989). Melt Blown Technology Today. San Francisco, CA: Miller Freeman
Publications Inc.. Subbiah, T., Bhat, G. S., Tock, R. W., Parameswaran, S., & Ramkumar, S. S. (2005).
Electrospinning of nanofibers. Journal of Applied Polymer Science, 96(2), 557–569. Sun, C. (Qin), Zhang, D., Liu, Y., & Xiao, R. (2004). Preliminary study on fiber splitting of
bicomponent meltblown fibers. Journal of Applied Polymer Science, 93, 2090–2094. Sun, Z., Zussman, E., Yarin, A. l., Wendorff, J. H., & Greiner, A. (2003). Compound Core–
Shell Polymer Nanofibers by Co-Electrospinning. Adv. Mater. 15, 1929–1932. Sutherland, K. (2008). Filters and Filtration Handbook (5th Edition). Burlington, MA:
Elsevier. Sutherland, K. (2013a). 50th Anniversary: Half a century of developments in filtration.
Filtration+ Separation, 50(1), 14–16. Sutherland, K. (2013b). 50th Anniversary: Half a century of developments in filtration–Part 2.
Filtration+ Separation, 50(2), 16–19. Tan, P.-N., Steinbach, M., & Kumar, V. (2006). Introduction to Data Mining (1st ed.).
In Library of congress (Vol. 74).

380
Taylor, G. (1964). Disintegration of water droplets in an electric field. Proceedings of the Royal Society A, 280 (1382), 383.
Taylor, G. (1969). Electrically driven jets. Proceedings of the Royal Society A, 313(1515), 453. Teevan, J., Dumais, S., & Horvitz, E. (2007). Characterizing the value of personalizing
search. Proceedings of the 30th annual international ACM SIGIR conference on Research and development in information retrieval (SIGIR '07) (pp. 757–758). New York: ACM.
Thelwall, M. (2008). Bibliometrics to webometrics. Journal of Information Science, 34(4),
605–621. Titscher, S., & Jenner, B. (2000). Methods of text and discourse analysis: In search of
meaning. Sage. Trappey, C. V., Wu, H.-Y., Taghaboni-Dutta, F., & Trappey, A. J. C. (2011). Using patent data
for technology forecasting: China RFID patent analysis. Advanced Engineering Informatics, 25(1), 53–64.
Tsai, P. P., Huang, H. Y., & Wadsworth, L. C. (1999, March). Electrostatic decay of corona-
charged melt blown electret at ambient and elevated temperatures. TAPPI Nonwovens Conference Proceedings, Orlando, USA.
Tsai, P. P., & Wadsworth, L. C. (1995). U.S. Patent No. 5,401,446. Washington, DC: U.S.
Patent and Trademark Office. Tseng, Y.-H., Lin, C.-J., & Lin, Y.-I. (2007). Text mining techniques for patent analysis.
Information Processing & Management, 43(5), 1216–1247. Tschirky, H. P. (1994). The role of technology forecasting and assessment in technology
management. R&D Management, 24(2), 121–129. https://doi.org/10.1111/j.1467-9310.1994.tb00864.x
Turbak, A. F. (Ed.). (1993). Nonwovens: Theory, process, performance, and testing. Atlanta,
GA: TAPPI Press. United States Environmental Protection Agency. (2009). National Primary Drinking Water
Regulations. United States Environmental Protection Agency. Retrieved from http://water.epa.gov/drink/contaminants/upload/mcl-2.pdf.
Vargas, E. (1989). Meltblown technology today: An overview of raw materials, processes,
products, markets, and emerging end uses. San Francisco, CA: Miller Freeman.

381
Veefkind, V., Hurtado-Albir, J., Angelucci, S., Karachalios, K., & Thumm, N. (2012). A new EPO classification scheme for climate change mitigation technologies. World Patent Information, 34(2), 106-111.
Voelker, H., Zettler, H. D., Fath, W., & Berbner, H. (1996). U.S. Patent No. 5,494,616.
Washington, DC: U.S. Patent and Trademark Office. von Winterfeldt, D. (2013). Bridging the gap between science and decision making.
Proceedings of the National Academy of Sciences, 110(Supplement_3), 14055–14061. Wakeman, R.J. & Tarleton, E.S. (2005). Solid/ Liquid Separation: Principles of Industrial
Filtration. New York: Elsevier Science, Inc. Walker, C. (September/October 2012). Nanofibers are revolutionizing the nonwovens
industry. Paper 360°, 39. Wang, X., Drew, C., Lee, S.-H., Senecal, K. J., Kumar, J., & Samuelson, L. A. (2002).
Electrospun nanofibrous membranes for highly sensitive optical sensors. Nano Letters, 2(11), 1273–1275.
Warner, S. B., Buer, A., Grimler, M., Ugbolue, S. C., Rutledge, G. C., Shin, M. Y. (1988). A
Fundamental Investigation of the Formation and Properties of Electrospun Fibers. Project M98-D01, National Textile Center Annual Reports, 83.
Watzl, A. (2005). Spunbond and spunlace - the future of nonwovens?. Retrieved from
http://www.texdata.com/content/0527e.pdf. Web of Science. (2014). Web of Science core collection help. Retrieved from
http://images.webofknowledge.com.prox.lib.ncsu.edu/WOKRS522_2R1/help/WOS/hp_search.html.
Weick, K. E. (1979). The Social Psychology of Organizing. Reading, MA: Addison-Wesley. Weitz, R. T., Harnau, L., Rauschenbach, S., Burghard, M., & Kern, K. (2008). Polymer
nanofibers via nozzle-free centrifugal spinning. Nano Letters, 8(4), 1187-1191. Wilson, A. (2007). Development of the nonwovens industry. In S.J. Russell (Ed.), Handbook
of Nonwovens (pp. 1-15). Boca Raton, Fla: CRC Press. WIPO. (2014). World intellectual property indicators 2013. Geneva: World Intellectual
Property Organization. Retrieved from http://www.wipo.int/ipstats/en/wipi/. Wu, F.-S., Hsu, C.-C., Lee, P.-C., & Su, H.-N. (2011). A systematic approach for integrated
trend analysis—The case of etching. Technological Forecasting and Social Change, 78(3), 386–407.

382
Xie, S., Zhang, J., & Ho, Y. S. (2008). Assessment of world aerosol research trends by bibliometric analysis. Scientometrics, 77(1), 113-130.
Yeh, A. S., Hirschman, L., & Morgan, A. A. (2003). Evaluation of text data mining for
database curation: lessons learned from the KDD Challenge Cup. Bioinformatics, 19(suppl 1), i331-i339.
Yoon, B. & Park, Y. (2004). A text-mining-based patent network: Analytical tool for high-
technology trend The Journal of High Technology Management Research 15(1), 37-50.
Youtie, J., Shapira, P., & Porter, A. L. (2008). Nanotechnology publications and citations by
leading countries and blocs. Journal of Nanoparticle Research, 10(6), 981–986. Yu, C. H., Jannasch-Pennell, A., & DiGangi, S. (2011). Compatibility between text mining
and qualitative research in the perspectives of grounded theory, content analysis, and reliability. The Qualitative Report, 16(3), 730–744.
Zapletalova, T. (2009). Mechanisms in Bicomponent Fiber Spinning During Melt Blown
Process. PhD Dissertation. North Carolina State University, Raleigh, NC. Retrieved from http://repository.lib.ncsu.edu/ir/bitstream/1840.16/5935/1/etd.pdf.
Zeronian S. H., et al. (1999). The fine structure of bicomponent polyester fibers, Journal of
Applied Polymer Science, 71, 1163–1173. Zhang, D. (1996). Fundamental Investigation of the Spunbonding Process. Ph.D. Dissertation. University of Tennessee, Knoxville, TN. Zhang, D., Sun, C. (Qin), & Song, H. (2004). An investigation of fiber splitting of bicomponent
meltblown/microfiber nonwovens by water treatment. J. Appl. Polym. Sci. 94, 1218–1226.
Zhang, X., & Lu, Y. (2014). Centrifugal spinning: an alternative approach to fabricate
nanofibers at high speed and low cost. Polymer Reviews, 54(4), 677-701. Zhao, R. (2002). Melt Blown Dies: A Hot Innovation Spot. International Nonwovens Journal,
11(4), 37–41. Zhao, R., & Wadsworth, L.C. (2003). Study of polypropylene/poly(ethylene terephthalate)
bicomponent melt-blowing process: The fiber temperature and elongational viscosity profiles of the spinline. Journal of Applied Polymer Science, 89, 1145–1150.
Zhao, R., Wadsworth, L. C., Zhang, D., & Sun, C. (2002).Polymer distribution during
bicomponent melt blowing of poly(propylene)/poly(ethylene terephthalate) and its improvement. Journal of Applied Polymer Science, 85, 2885–2889.

383
Zhao, R., Wadsworth, L. C., Sun, C., & Zhang, D. (2003). Properties of PP/PET bicomponent melt blown microfiber nonwovens after heat-treatment, Polym. Int. 52, 133–137.
Zhao, Y., & Liu, Y. (2012).The Preparation of Spunbonded PA6/PET Segment Bicomponent
Fiber., J. Text. Sci. Eng. 2, 106. Zhou, X., Porter, A.L., Robinson, D.K.R., Shim, M.S., and Guo, Y. (2014), Nano-enabled drug
delivery: A research profile, Nanomedicine: Nanotechnology, Biology and Medicine. 10(5), 889-896. doi:10.1016/j.nano.2014.03.001.
Zitt, M., & Bassecoulard, E. (1994). Development of a method for detection and trend analysis
of research fronts built by lexical or cocitation analysis. Scientometrics, 30(1), 333-351.
Zobel, S., & Gries, T. (2010). The use of nonwovens as filtration materials. In Application of
nonwovens in technical textiles. Boca Raton: Woodhead. Zucker, L. G., Darby, M. R., Furner, J., Liu, R. C., & Ma, H. (2007). Minerva unbound:
Knowledge stocks, knowledge flows and new knowledge production. Research Policy, 36(6), 850–863.

384
APPENDICES

385
APPENDIX A RECRUITMENT EMAIL FOR SURVEY OF KEYWORDS

386
Yingjie Ou
College of Textiles, North Carolina State University 1000 Main Campus Dr., Rm #1150
Raleigh, NC, 27606 Dear XXX,
Thank you for attending the Industrial Advisory Board meeting hosted by the Nonwovens
Institute at NCSU this November. While at the meeting, I would like to seek your opinions and
feedback as an expert on some preliminary results from my dissertation study “Evolution of
Emergent Technologies for Producing Nonwoven Fabrics for Air Filtration”. The goals of the
dissertation study are to map out, evaluate, and forecast the technological innovations in
nonwovens manufacturing, particularly in regards to filtration applications. Tech mining (text
mining used for technology management in high technology areas) is utilized to retrieve,
process, and extract novel, meaningful, and actionable information out of a large amount of
textual data collected from several databases, covering science and technology publications,
patents, and trade journals. The survey serves as a quality check to screen out any potential
problems at a preliminary stage.
You have been invited to participate in this study due to your expertise and knowledge on the
selected nonwoven technologies and familiarity with related applications. Your participation
would consist of rating and reviewing extracted keywords from patents and publications on
selected nonwovens technologies and applications, and would take approximately 5 to 10
minutes. Your responses to the survey would be kept anonymous. I would appreciate if you
could take the time to participate in this study. Your feedback and suggestions would be of
great value.

387
If you agree to participate, please respond to this email, or talk directly to me at the Nonwovens
IAB meeting. I could ask you the survey questions during the meeting breaks, or if you prefer,
I could call you at a later time.
There is no direct benefit or compensation provided if you agree to participate, however, upon
request, I would be happy to provide updates and further findings of this research. Your
participation may help to shed light on why certain nonwoven technologies should be selected
for a particular application area.
The Institutional Review Board (IRB) at North Carolina State University has determined that
participation in this study poses minimal risk to participants, and measures will be
implemented to minimize this risk. If you have any concerns about your rights or how you are
being treated please contact the IRB administrator at North Carolina State University, Debra
Paxton, at (919) 515-4514. Should you have questions and concerns about this project or your
benefits or risks associated with being in this study, please feel free to contact Dr. Willliam
Oxenham, who may be contacted at (919) 515–6573 or [email protected], or
Yingjie Ou at (336) 340-0749 or [email protected].
Thank you very much for your help in advance!
Yingjie Ou

388
APPENDIX B
SURVEY OF KEYWORDS FOR SEARCH QUERIES FORMULATION

389
Thank you for participating in our study, and your opinions and feedback are much
appreciated!
Research Background: The goals of the dissertation study are to map out, evaluate,
and forecast the emerging technological innovations in nonwovens manufacturing, particularly
in regards to the use of nanofibers in air filtration. Microfibers, submicron, and ultra-fine fibers
are also included in the technology landscape search. Tech mining (text mining used for
technology management in high technology areas) is utilized to retrieve, process, and extract
novel, meaningful, and actionable information out of a large amount of textual data from
several databases, covering science and technology articles, patents, and trade journals. The
survey serves as a quality check to screen out any potential problems at a preliminary stage.
In order to grasp data as complete and accurate as possible, a variety of search queries
comprised of keywords and indexes are formulated to conduct the searches for the study. For
example, in the Web of Science database, which is a scientific literature database, to search for
publications on air filtration using fine fibers, the following search queries are used:
Examples of Search Queries for Web of Science Search #: Search Queries:
1
TOPIC: (nanofib* OR "nano-fib*" OR "nanoscale* fib*" OR "nano-scale* fib*" OR "nanosize* fib*" OR "nano-size* fib*" OR "nanostructur*" OR "nano-structure*" OR "nanocomposite*" OR "nano-composite*" OR "nanoparticle*" OR "nano-particle*" OR "nanocoating*" OR "nano-coating*" OR "microfib*" OR "micro-fib*" OR "micro-denier fib*" OR "submicro* fib*" OR "sub-micro* fib*” OR (nano* AND fibril*))
2
TOPIC: ("air filt*" OR "aerosol filt*" OR "gas filt*" OR (("high*-efficien*" OR "high-perform*") AND filt*) OR (HEPA AND filt*) OR (ULPA AND filt*) OR "clean-room filt*" OR "cleanroom filt*" OR "surgical room filt*" OR "face mask*" OR respirator OR respirators OR ((air OR aerosol OR gas*) AND ("coalescence filt*" OR "fibrous filt*" OR "particulate filt*" OR "particle filt*" OR "nano-filt*" OR nanofilt* OR "indoor air quality" OR "particulate matter" OR PM)) NOT (liquid OR water OR fuel OR diesel)
3 #1 AND #2
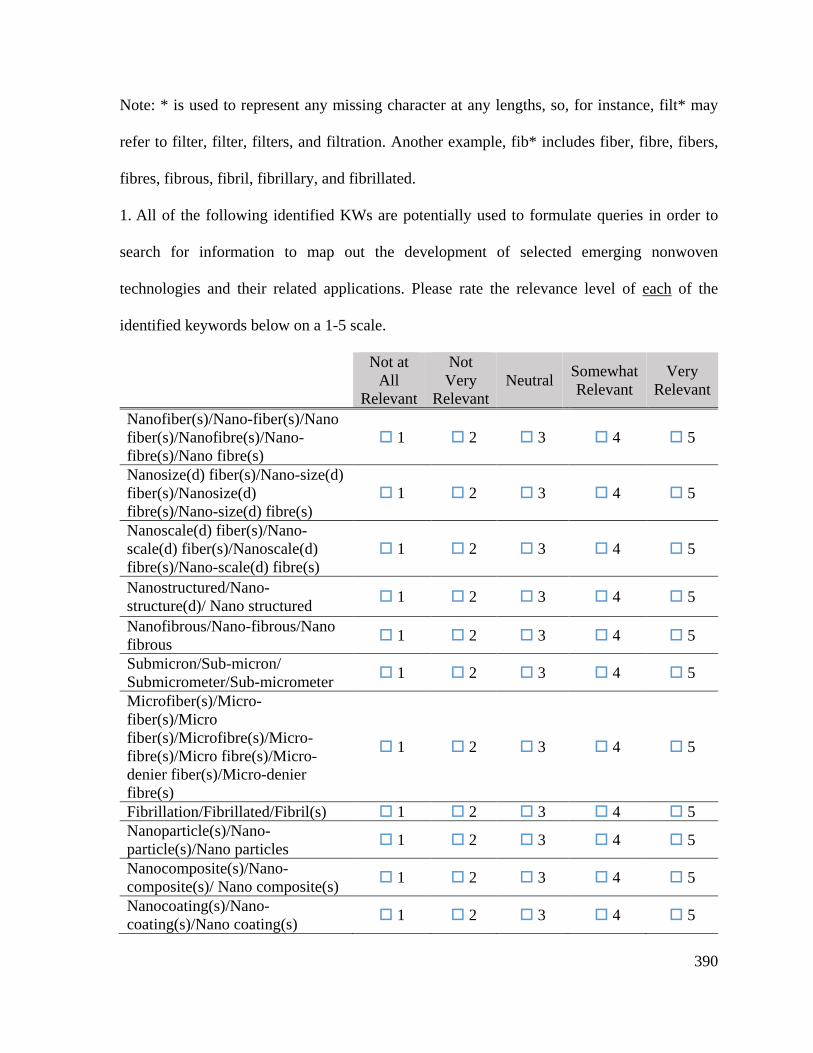
390
Note: * is used to represent any missing character at any lengths, so, for instance, filt* may
refer to filter, filter, filters, and filtration. Another example, fib* includes fiber, fibre, fibers,
fibres, fibrous, fibril, fibrillary, and fibrillated.
1. All of the following identified KWs are potentially used to formulate queries in order to
search for information to map out the development of selected emerging nonwoven
technologies and their related applications. Please rate the relevance level of each of the
identified keywords below on a 1-5 scale.
Not at
All Relevant
Not Very
Relevant Neutral Somewhat
Relevant Very
Relevant
Nanofiber(s)/Nano-fiber(s)/Nano fiber(s)/Nanofibre(s)/Nano-fibre(s)/Nano fibre(s)
1 2 3 4 5
Nanosize(d) fiber(s)/Nano-size(d) fiber(s)/Nanosize(d) fibre(s)/Nano-size(d) fibre(s)
1 2 3 4 5
Nanoscale(d) fiber(s)/Nano-scale(d) fiber(s)/Nanoscale(d) fibre(s)/Nano-scale(d) fibre(s)
1 2 3 4 5
Nanostructured/Nano-structure(d)/ Nano structured 1 2 3 4 5
Nanofibrous/Nano-fibrous/Nano fibrous 1 2 3 4 5
Submicron/Sub-micron/ Submicrometer/Sub-micrometer 1 2 3 4 5
Microfiber(s)/Micro-fiber(s)/Micro fiber(s)/Microfibre(s)/Micro-fibre(s)/Micro fibre(s)/Micro-denier fiber(s)/Micro-denier fibre(s)
1 2 3 4 5
Fibrillation/Fibrillated/Fibril(s) 1 2 3 4 5 Nanoparticle(s)/Nano-particle(s)/Nano particles 1 2 3 4 5
Nanocomposite(s)/Nano-composite(s)/ Nano composite(s) 1 2 3 4 5
Nanocoating(s)/Nano-coating(s)/Nano coating(s) 1 2 3 4 5

391
Electro spinning/Electro-spinning/ Electrospinning/Electrostatic spinning/ Electrostatic-spinning/ Electrospun/Electro-spun
1 2 3 4 5
Electro-spray/Electrohydrodynamic spray 1 2 3 4 5
Meltblowing/Melt blowing/ Melt-blowing/Meltblown/Melt blown/ Melt-blown/Meltblow
1 2 3 4 5
Solution blowing/Solution blown/ Solution-blown 1 2 3 4 5
Flash spinning/Flash-spinning/ Flash-spun 1 2 3 4 5
Rotary jet spinning/Rotary jet-spinning/Rotary spinning/Rotary spun
1 2 3 4 5
Centrifugal spinning/Centrifuge spinning/Centrifugally spun 1 2 3 4 5
Forcespinning/Forcespun 1 2 3 4 5 Bicomponent/Bi-component/ Multicomponent/Multi-component
1 2 3 4 5
Conjugate(d) 1 2 3 4 5 Segmented-pie/Wedged 1 2 3 4 5 Island(s)-in-the-sea/I-S/ I/S /INS 1 2 3 4 5 Sacrificial fiber(s) 1 2 3 4 5 Splittable fiber(s)/Fiber splittability/Split-fiber 1 2 3 4 5
Corona discharge/Corona discharging/ Corona discharged 1 2 3 4 5
Electret filter(s)/Electret(s) 1 2 3 4 5 Electrostatically charged filter(s)/Electrostatic charge/Electric charge/Charging
1 2 3 4 5
Air filter(s)/Air filtration/Air filtration media (medium) 1 2 3 4 5
Aerosol filter(s)/Aerosol filtration/Aerosol filtration media (medium)
1 2 3 4 5
Gas filter(s)/Gas filtration/Gas filtration media (medium)/Gas phase filtration/Gas-phase filtration
1 2 3 4 5

392
HEPA/High efficiency particulate air filter (filtration) 1 2 3 4 5
ULPA/Ultra low penetration air filter (filtration) 1 2 3 4 5
Loaded filter(s) 1 2 3 4 5 Particulate filter(s)/ Particulate filter media (medium)/ Particulate filtration/ Particulate filtration media (medium)
1 2 3 4 5
Particle filter(s)/Particle filtration 1 2 3 4 5 Coalescence filter(s)/Coalescence filtration 1 2 3 4 5
Nanofilter(s)/Nano-filter(s)/Nano filter(s)/Nanofiltration/Nano-filtration/Nano filtration
1 2 3 4 5
Fibrous filter/Fibrous filtration 1 2 3 4 5 High performance filter(s)/High-performance filter(s) 1 2 3 4 5
High efficiency filter(s)/High-efficiency filter(s) 1 2 3 4 5
Indoor air quality 1 2 3 4 5 Clean room filter(s)/Cleanroom filter(s)/ 1 2 3 4 5
Surgical room filter(s) 1 2 3 4 5 Face mask/Respirator(s) 1 2 3 4 5 High temperature filter(s)/High temperature filtration 1 2 3 4 5
Membrane(s) 1 2 3 4 5 Particulate matter/ PM2.5/PM10/Airborne particulate/Suspended particulate
1 2 3 4 5
2. Now that you have had more time to think about the keywords, what do you think of their
overall relevance? Please rate the overall relevance on the same scale of 1 to 5.
Not at All Relevant
Not Very Relevant Neutral
Somewhat Relevant
Very Relevant
1 2 3 4 5

393
3. Are there any other keywords that should be included in the results? If yes, what are they?
4. Using the same scale of 1-5 previously defined, please rate each keyword added in question
#5.
Not at All Relevant
Not Very Relevant Neutral Somewhat
Relevant Very
Relevant
1 2 3 4 5
1 2 3 4 5
1 2 3 4 5
1 2 3 4 5
1 2 3 4 5
1 2 3 4 5
1 2 3 4 5
5. Is there anything else that you would like to add that might help us improve this study?

394
APPENDIX C
CLUSTERS ON AIR FILTRATION AND SELECTED NONWOVEN TECHNOLOGIES USED IN AIR FILTRATION PUBLICATIONS AND PATENTS
USING PCA ANALYSIS
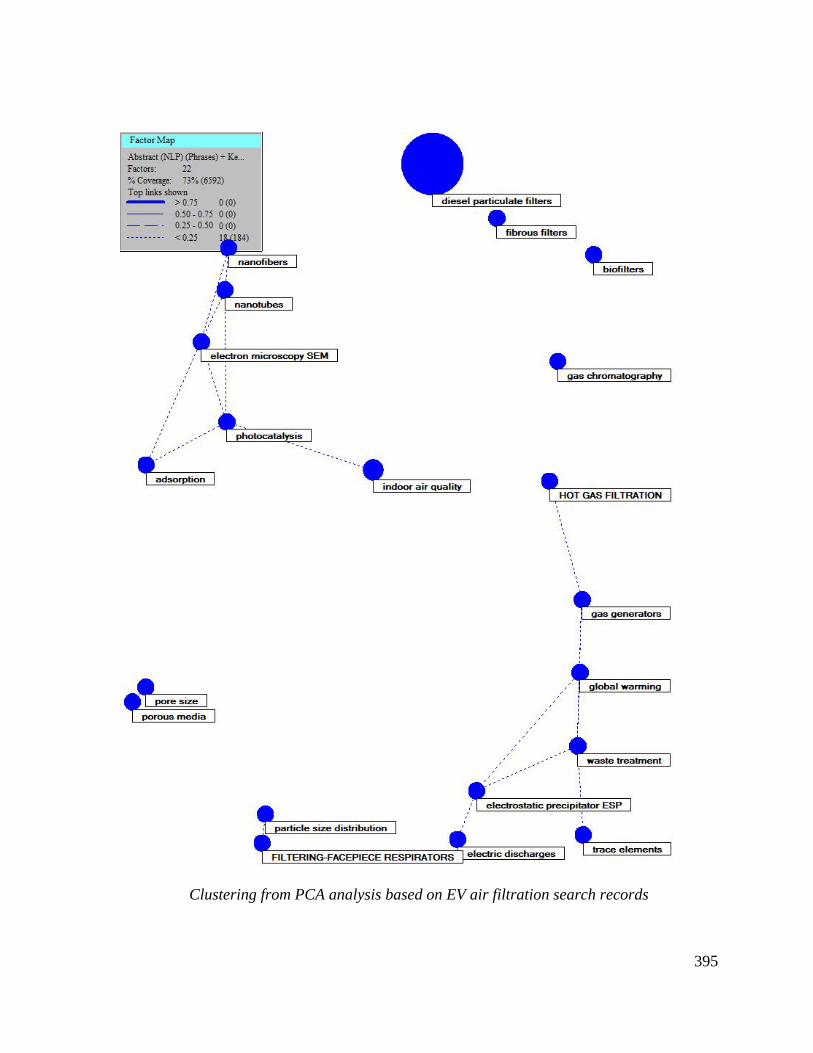
395
Clustering from PCA analysis based on EV air filtration search records

396
Clustering from PCA analysis based on DII air filtration search records

397
Clustering from PCA analysis based on ABI air filtration search records