abstract - avantgarde.com.np · 2 nepal has human poverty index (hpi) of 31.12 and is a member...
TRANSCRIPT
WHAT FACTORS INFLUENCE CONSUMERS' PURCHASE DECISION ALONG
WITH QUALITY (CERTIFICATION) MARK
ABSTRACT
Quality of fast moving consumer goods (FMCG) in the nations is a subject of debate where
standardization and quality certification is not mandatory. Consumers have to make purchase
decisions based on their perceived quality and experience. Identification of the factors building
consumer perception on quality of FMCG products, resulting in purchase and repurchase decisions,
are important for understanding consumer behavior. Also, the changing socio-economic context and
effect of globalization is a subject of study in emerging markets.
Although there is national quality certification agency and widespread visibility of
International Standardization Organization (ISO) there is no mandatory legal provision for
manufactures to obtain Quality certification mark. Also, consumer's perception on quality among
consumers in Nepal and its relationship with perceived quality had remained largely
unstudied or limited studied.
This paper examines the role of five highly influencing factors namely product
usefulness, brand image, price-quality relationship, involvement with the product, and
convenience. Also this paper analyzed the role of quality certification marks on Fast moving
consumer goods (FMCGs) products in consumer repurchase decision. A total of 195
consumers have been intercepted to collect their opinion through the survey questionnaires
immediately after their purchase from retail marts and super stores.
The results show that, among five factors, brand image is the only significant
indicator of perceived quality and certification mark moderate significantly to build consumer
attitude toward the FMCG products resulting in purchase/repurchase decision. Also, the
demographic variables sex, education, and age effect on repurchase decision.

2
Nepal has human poverty index (HPI) of 31.12 and is a member country of world's
least developed countries. It has a human development index of 0.458 and therefore major
sections of Nepali consumers are in the Bottom of the Pyramid (BOP). This research also
found that consumers in Bottom of Pyramid (BOP) are quality conscious, prefer branded
product. Also, the results indicate increasing scope of medium and large scale retail marts and
stores in emerging market.
Keywords: FMCG, repurchase decision, perceived quality, quality certification mark.
INTRODUCTION
In todays world, it is fair to state that 'everyone is a consumer' especially in urban and
semi-urban areas of human settlements. The role as a consumer is such that it lasts for
lifetime. Purchase of goods and services are to satisfy basic human needs or wants for food,
clothing, shelter, and entertainment. Need based purchase are generally for own consumption.
We make consumption and purchase decisions on regular basis. "In the most general
term, a decision is selection of an option from two or more alternative choices. And the scope
of consumer decision making is far broader than the mere selection of one brand from a
number of brands" Schiffman, Kanuk, & Kumar, p. 426 (2010).
With consumer decisions, we feel best about our selection of alternatives, based on
thorough knowledge of all possible facts about goods or services. Good shopping skills help
consumers make wise choices in today’s complex and diverse marketplace. In making
frequent purchases, consumers develop a set of evaluative criteria for use in making the
selection of the product to purchase. According to Boone and Kurtz (1995), commonly used
evaluative criteria include price, advertising, brand name, and country of origin.

3
The study conducted on consumer's purchase behavior found that shopping frequency,
time in mall, travel time, convenience, purchase intent and demographical factors act as a
predictor variable of consumers' purchasing behavior (Nicholls et. all, 1996).
Limited studies have been found to analyze the consumers' purchase decision in
relation to quality certification marks obtained by product and services. According to Dick
(2000) from empirical perspective, previous research has failed to establish a causal
relationship between certification and improvement in operational performance of the firm
indicating no preference by consumer. The longitudinal studies in scholarly journals found no
relation or a negative one (King & Lenox, 2001; Heras, Dick & Casadesus, 2002).
This study conducted in Nepal on the role of five factors namely product usefulness,
brand image, price-quality relationship, involvement with the product, and convenience in
consumer repurchase decision of FMCG products and found brand image the significant
indicator of perceived quality and certification mark having significant moderating role. This
result has been found in different form compared to previous such research findings and may
be indicative towards the changing preferences of consumers in globalized society even from
the people with limited purchasing power.
The macroeconomic indicators of Nepal belong to the category of Least Developed
Country (LDC) and human development index of Nepal is 0.458 as reported by Central
Bureau of Statistics (2013). Nepali consumer market is emerging as it is evident from
improved purchasing power parity (PPP) index and declining poverty rates in past few years.
There are limited shopping malls like Bluebird and Bishal Bazar having relatively long
history but numerous shopping malls and retail marts have been emerged in the capital city of
Kathmandu and outside at recent. One of the prominent examples of retail store is
Bhatbhateni Superstore with its widespread coverage, scale, and expansion in last few years.

4
Small retail stores like Big-mart, Saleways, K&K mart are new examples observed in
the city and other smaller shops have also developed in new stores where consumer can see
the products with its price tags and make a selection. Also, the increasing coverage of
advertisements in daily popular newspapers, Television, and FM radio broadcasting of
international branded products and their availability in these retail marts and superstores had
provided consumer choices in making purchase decisions more selective.
Quality of daily consumable products popularly known as fast moving consumer
goods (FMCG) in Nepali context has been the subject of debate. Consumer's perception on
quality among Nepali people and its relationship with different aspects of perceived quality
had remained largely unstudied or limited studied.
Nepal bureau of standards and measurements (NBSM) and International Standard
Organization (ISO), and Hazard Analysis and Critical Control Process (HACCP) are the
organizations existed in Nepal for quality certification of product and processes. But, their
influence in consumer purchase decision had not been comprehensively studied yet. Due to
the widespread coverage of FMCG products supplied through the small enterprises and
cottage industries and no mandatory legal provisioning of quality certification in the country,
there had been limited products available to the consumers certified with national quality
certification mark known as 'NS'.
The objective of this research is to identify the influencing factors in the consumer
purchase decision of FMCG products from nearby and reachable retail marts and stores.
Also, this research is to study the moderation effect of quality certification mark on purchase
decision of the consumers.
This research had been carried out by reviewing relevant literatures and prior research
studies to identify the research domain, research variables, develop a conceptual framework,

5
and formulate hypotheses for testing. Hypotheses had been tested empirically through
research design using the primary data obtained through consumer survey.
These data had been collected by the researcher on his own and using enumerators.
These data had been collected by intercepting the consumers who have just made the
purchase of FMCG products in different representative areas of Kathmandu including small
retail marts and superstores. With representative sample size of 195 in number, data analysis
had been carried out using independent f-test, analysis of variances, correlation analysis and
multiple regression analysis.
LITERATURE REVIEW
Generally consumers have common needs and wants. Every consumer is an individual
and therefore has different preferences. Age, sex, occupation, average monthly household
income, and individual preferences influence 'what consumers buy?' Various external factors
like advertisements, promotions, peer recommendations, and parental preferences are likely
to influence consumer buying decision.
According to Schifffman, Kanuk, & Kumar, p. 426 (2010) not all consumer while
making decisions are in a situation to receive (or require) the same degree of information.
There are three specific levels of consumer decision making ranging from very high to very
low: extensive problem solving, limited problem solving, and routine response behavior. For
daily consumable goods consumers have experience with the product category and a well-
established set of criteria to evaluate the brands they are considering and exhibit routinized
response behavior. In some case, they may search for a small amount of additional
information or review what they already known.

6
The nature of decision made by the consumers varies depending upon the category of
products being purchased. Broadly, two categories fast moving consumer goods (FMCGs)
and durables are taken into consideration.
Many authors have given their attention in the decision making process by consumers
while purchase. It is considered that consumer pass through various successive stages in
making choices about which products and services to buy (Berkowitz et al., 1997). Generally,
marketing literatures had defined five stages of purchase decision: problem recognition,
information search, evaluation of alternatives, purchase decision, and post-purchase behavior.
Research studies done about the information search category had been found mainly
focused on cost perspective. While making purchase decision consumers vary as to which
product attributes they see as most relevant and the importance as per the attribute attached to
it. They will pay the maximum attention to the attributes that delivered the sought benefits
(Kotler, 2000).
According to Schifffman, Kanuk, & Kumar, p. 431 (2010) consumers involved in
decision making on FMCGs may be loyal in these categories. It is highly probable that
consumers are loyal to more than one brand. They may try variety of brands and buy one
brand to which there is dominant loyalty. In purchase of FMCGs, situations are there when
consumers buys impulsively after being exposed to limited information search.
Regarding the durable goods replacement purchases, Bayus (1991) tried to develop a
model for better understanding of the timing applying alternative evaluation indicators such
as product value, size, styling, costs, and brand image. Capraro et al. (2003) analyzed the
effects of knowledge, switching risk, and satisfaction on the likelihood of defection.
The decision process in the actual purchase is the act of making the purchase or not.
The factors influencing the actual purchase include attitude of sellers, unanticipated

7
situational factors, perceived risk, brand decision, vendor decision, quantity decision, timing
decision, and payment method decision. Nicholls et al. (1996) found in their study that
shopping frequency, time in mall, travel time, convenience, purchase intent and demographic
factors act as predictor variables to understand the differences in consumers’ purchase
behavior. In terms of demographic variables Rawwas et al. (1996) proposed a consumer
purchase decision model for the nationalistic and world minded consumers. Hsieh et al.
(2004) analyzed role of brand, country, and corporate dimensions on purchase behavior.
Consumers experience some level of satisfaction or dissatisfaction after the purchase
Bloemer et al., (2003). Such experience of customer satisfaction in consumer leads to re-
purchase behavior resulting to build customer loyalty. Roehm et al. (2002) investigated the
effects of loyalty programs on loyalty to packaged goods brands in their model to study on
customer loyalty. Lemon et al. (2002) used the expected future use, overall satisfaction, and
usage as independent variables to study customer loyalty.
The most generic form of assurance of quality of any product or services is to meet
the standards as per the specifications. In business, product or services having minimum
acceptable standards can be of having quality certification mark. Certification marks and
quality labels can be defined as 'marks used upon or in connection with the products and
services of one or more persons to certify regional or other origin, material, mode of
manufacture, quality, accuracy, or other characteristics of such goods or services' Phelps,
(1949).
'Quality labels are designed to provide the consumer with product quality information,
hence reducing the information asymmetry between suppliers and buyers Fotopoulos and
Krystallis, (2003). Salim and Mourad, (2008) has referred to Caswell, 1998; Jahn et al., 2005;
Karstens and Belz, (2006) about perceived credibility of quality labels 'A quality label assists

8
the ill-informed consumer by transforming credence or experience attributes into 'quasi-
search attributes' that the consumer can search for'.
Researchers have different findings on significance of quality certification of products
and services. Brunco et. all.(2002) mentioned about objective and subjective type quality of
products and services. Product-oriented quality, process-oriented quality and quality control
constitute objective quality where as user oriented quality as subjective quality.
According to Dragusanu et. all. (2014) the basic logic behind the certifications is that
they provide credible information to consumers about the attributes of products. Certification
marks simply certify that products meet given conditions and argued that certification scheme
that maximizes social welfare is the one that maximizes aggregate consumer surplus
(Menapace and Moschini, 2010). They concluded that certification improves the ability of
reputation to operate as a mechanism for assuring quality.
Furthermore, researchers found quality certification widely used in U.S. and
Geographic Indicators (GIs) used in Europe. Confusion already exists among consumers
about the relation between geographical origin and existing GI labels in Europe and
certification marks in the U.S. (Marette et al., 2007). From an empirical perspective, Dick
(2000) mentioned that previous research has failed to establish a causal relationship between
certification and improvement in operational performance.
Although few practitioner surveys suggest an association between certification and
improvement in operational performance (e.g., Rao et al, 1997; Jeng, 1998), but longitudinal
studies in scholarly journals have found either no such relationship or a negative one (King &
Lenox, 2001; Heras, Dick & Casadesus, 2002). Also, the results of research study by Terlaak
and King (2004) suggest that certified facilities grow faster after certification, and that
operational improvements do not account for this growth. Results also indicate that the

9
growth effect is greater when buyers have greater difficulty acquiring information about
suppliers.
In an study about people judging the quality of two foods- shrimp and cheese- at two
price levels and two consumption situations found that perceived price had a positive impact
on perceived quality among highly involved consumers, and that the elegant physical
surroundings positively impacted the consumer's perceived quality and feelings during eating
(Torben, 2005).
Research findings of Masta, (2011) stated "Increasingly over the last few years,
competition for consumers’ food dollars has intensified. The Company believes its
competitive advantages include convenient locations, the quality of service it provides its
customers, competitive pricing, product variety, and quality and a pleasant shopping
environment."
Wijesundera, and Abeysekera (2010) research findings indicated that there were
statistical relationships between price, product, education, occupation and brand preference
and there was no statistical relationship between place, promotion, age, average monthly
household income, marital status, skin type, social factors, and substitute product with the
brand preference.
Singh and Sharma, (2013) found significant difference between the awareness among
the customers regarding the quality marks belongs to rural and urban areas. Also, the
demographic variables play an important role to influence the perception of customers
towards the quality marks in products. Results show that among the variables age, education
level, and gender have the most significant impact on consumer’s brand loyalty.
CONCEPTUAL FRAMEWORK

10
Based on the literature research and discussion among various factors determining
consumer purchase decision, the conceptual framework of the study in reference to FMCG
product in this study has is shown in figure 2.
Figure 2
Conceptual framework of research.
Product Usefulness
Brand Image
Price-Quality
relationship
Involvement with
the product
Convenience:
- Availability
- Accessibility
- Shopkeeper behavior
Quality
certification
Marks
( , ISO)
Repurchase Decision

11
Product usefulness measure the consumer's opinion of a product and inclination to use
it based on the situation they are currently purchased (Ziamou and Ratneshwar 2003). In this
research product usefulness had been used to measure the consumer opinion about the
product consumers had just purchased. It also measures their overall opinion on the product
from utilitarian point of view to fulfill needs. Brand measure a person's evaluation of a brand
with an emphasis on its quality relative to other brands (Keller and Aaker 1992). Brand
Image represents the overall opinion of the consumer about the brand they prefer among
others. Brand image evaluate the consumers likeness to the purchased brand they had
purchased just before compared to other brands.
Price-quality relationship measures a consumer's belief that there is a positive
relationship between product price and quality (Lichtenstein, Nancy, and Netemeyer 1993).
In this study consumer's general belief for a product had been taken considering positive
relationship between prices with quality. This implies that higher the price of a product, better
the quality. In saying the other way round consumers have to pay a bit more to buy the best.
As per the involvement theory, in regular and frequent purchases, consumers go
through almost no information search or very limited information search and demonstrate
routine response behavior which is very low in the continuum of involvement. People search
information of the product generally through seeing the product or feeling through touching
it. A thorough testing can also be a way to confirm repurchase.
Quality certification marks and quality labels can be defined as 'marks used upon or in
connection with the products and services of one or more persons to certify regional or other
origin, material, mode of manufacture, quality, accuracy, or other characteristics of such
goods or services' (Phelps, 1949). Quality certified products posses a mark on its packaging
and confirm to the minimum of its specifications. Quality certification marks may confirm to
product quality or process quality. Consumers are willing to pay a large premium for
12
convenience, and an additional premium for certification of nutritional value (Masters and
Sanogo, 2002). Convenience in purchasing covers a number of factors. As per the
researcher's own experience and opinion convenience in consumer purchase and repurchase
decision of FMCG products refers convenient location, accessible distance, availability of
range of products, and seller behavior during purchase.
Based on the above conceptual framework following hypotheses had been formulated
for testing through the results.
H1: There is a positive relationship and significant effect of product usefulness, brand
image, positive attitude towards price-quality relationship, consumer involvement, and
convenience factors on consumer repurchase decision.
H2: Quality certification marks like (NS, ISO standards) significantly and positively
moderate on the consumer repurchase decision determined by the factors like product
usefulness, Brand Image, positive attitude towards price-quality relationship, Involvement
with the product, and convenience.
H3: Demographic variable like Gender significantly moderate on the consumer
repurchase decision determined by the factors like attitude toward usefulness of the
product, price-quality relationship, brand image, involvement with the product, and
convenience factors.
Research Design
This study had been carried out by collecting the consumer opinion on FMCG
products by intercepting the customers immediately after their purchase. Opinion had been
collected on local Nepali language for better understanding by all class and level of literate
consumers. Survey instruments for each variable have been adopted from the previous
research studies that are relevant to this study. Three survey items in nine points scale had
13
been adopted to measure the 'product usefulness' from Ziamou and Ratneshwar (2003) with
cronbach's alpha ranged from .79 to .86. Likewise to measure the brand Image, two survey
instruments had been adopted having seven point scale from Lam and Mukherjee (2005)
having cronbach's alpha 0.94.
To measure the positive price quality relationship, two survey questionnaires in seven
point scale had been adopted from Lichtenstein, Ridgway, and Netemeyer (1993) having
cronbach's alpha of .78. Two items had been adopted to measure the 'Involvement with the
product' from Peck, and Terry (2003) having alpha of 0.71 validity and one item added based
on background of the study, literature, and the context.
Also, based on the literature review of the recent research reports four items
determining the convenience having their effect on consumer's purchase decision have been
prepared for survey. Also, based on the research objective two survey items, measuring the
moderating effect of quality certification mark, that influence consumer's purchase decision
have been developed and tested. The dependent variable repurchase decision question in nine
point scales had been adopted from Ziamou and Ratneshwar (2003). The face validity of
these questionnaires had been tested in the peer group within the MPhil class among five
scholars and a professor. The survey questionnaire in English as well as in Nepali language is
in Annexure-1.
Data
Considering the nature of respondents, questionnaire had been prepared in English
language and then translated to Nepali language. To test the reliability of the translation,
English language questionnaires had been administered to six different persons on Dec 03,
2014 and same persons were administered with Nepali language questionnaire after five days.
14
The correlation coefficient of each respondent was checked that ranged from 0.53 to 0.87 to
an average value of 0.68.
Primary data had been collected by the researcher and three enumerators in different
locations of retail marts and superstores in capital city Kathmandu. The retail marts and
superstores belong to the areas of Kathmandu, and Lalitpur district located in Satungal,
Bhatbhateni superstore Kalanki and Krishna Galli Patan, Kirtipur, Mid Baneshwor, and
Samakhushi. A prior permission had been taken from the manager of superstore and shop
keeper for data collection. Respondents had been surveyed with proper introduction of the
researcher and enumerators.
The time for data collection was early morning from 7 AM to 9AM, afternoon from 1
PM to 6 PM and evening from 7 PM to 8 PM at which there is generally rush in the stores.
Respondents were the shoppers visited the shop during the time at which enumerator and
researcher was present at the place. One response took from 5 to 7 minutes. Among the
requested some of them turned down the request, while some questionnaires were found not
filled completely. Valid data had been reported while analyzing the results.
Data Analysis and Results
In the questionnaire, each item of all variables were collected from lower value
(Strongly Disagree) to higher value (Strongly Agree) except for the questionnaires of
dependent variable 'repurchase decision' and 'brand image'. Therefore recompilation was
carried out for the variable 'brand image' in 7-point scale by reversing the value '1' to '7', '2' to
'6', '3' to '5' and vice versa with '4' remain unchanged. Also the dependent variable 'repurchase
decision' in 9-point scale, the response '1' recomputed to '9', '2' to '8', '3' to '7', '4' to '6', and
vice versa with '5' remain unchanged. The computer application used for analysis was
Statistical Package for Social Science (SPSS) version 17.

15
The questionnaires representing the variables had been computed in summated scales.
Descriptive statistics had been measured and hypotheses had been tested using independent t-
test, ANOVA, measure of correlation, and regression analysis. The regression model using
ordinary least squares method (Gujrati, Porter, and Gunasekar. 2009) for analysis is:
1 = 0 + 1 1 + 2 2 + 3 3 + 4 4 + 5 5 + μi ----------- Model 1
Where, y1 = Repurchase decision, x1 = Product Usefulness, x3 = Attitude toward the
brand Image, x4 = Attitude toward the price-quality relationship, x4 = Perception on quality
due to product attributes, x5 = Convenience factors, μi = Residual Term
The second regression model used for analysis to study the moderating effect on the
variables was:
1 = 0 + 1i 1i + 2 2 + 3 + 3 1i + 4 2i + μi ----------- Model 2
Where, Y1 = Repurchase decision, x1i = Significant ith
variable obtained from model
1, x2 = Moderating variable Quality Certification (QC) mark, d = Dummy Variable for
gender, 0 = Male, 1 = Female, I1i = Interaction Variable (Significant variable in Model 1and
QC Mark), I2i = Interaction variable (Significant variable in Model 1 and Dummy), μi =
Residual Term
Reliability Analysis
Cronbach's alphas were calculated for each instrument. The result of reliability
analysis before and after item deletion has been presented in table 1. For the instrument
'attitude toward brand image' even after recoding cronbach's alpha remain unchanged.
Among six variables cronbach's alpha of five variables exceeded 0.6 while it suffered
for the variable 'Purchase decision due to Involvement with the product'. Therefore, among
three items 'I identify the quality of the product by inspection' had been dropped. This led to
result the cronbach's alpha of .584. Considering the cronbach's alpha value obtained as .71 by

16
Peck, and Terry (2003) while testing reliability of this variable 'Involvement with the
product', this variable had been taken for further analysis.
Comparison among different groups
In order to identify the statistically significant difference in the effect of independent
research variables and dependent variable F-test and t-test had been carried out. Also the
descriptive statistics of all the research variables with overall and gender wise mean and
standard deviation along with F statistics are given in table 2.
Analysis of Variance (ANOVA) between demographic variables and study variables
A One way Analysis of variance had been conducted between respondents profile and
research variables. The ANOVA result is in table 3.
One way ANOVA showed no statistically significant difference between occupation,
and average monthly household income of the consumers with research variables. However
significant differences exist among age groups on 'convenience factor' (F=2.951, F<.05) and
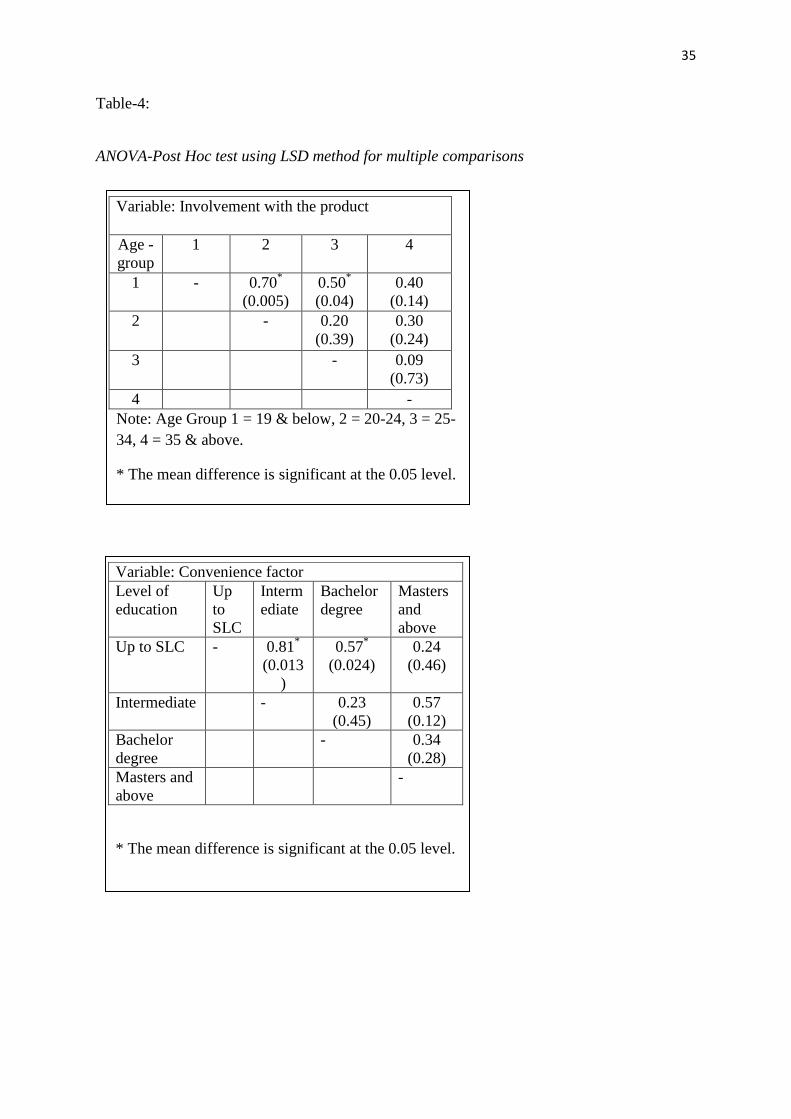
the levels of education on 'involvement with the product' (F=2.802, F<.05). Multiple
comparisons using Post Hoc tests using means differences of variables 'convenience factor'
and 'involvement with the product' is sown in table 4. The test showed that the consumers
below the age of 19 consider 'involvement with the product' factor differently as compared to
age group 20-24 and 25-34. Also, the consumers having education level up to SLC consider
"convenience factor" differently compared to Intermediate and Bachelor level.
Pearson correlation coefficient was computed to find the relationship between the
research variables under study and demographic variables as shown in table 5. The results
showed significantly (p<.05) negative relationship between consumer Age-group with
product usefulness. The result showed significantly positive relationship between the factor

17
Brand Image with Sex (female consumers) and average monthly household income. Also, the
factor repurchase decision has significantly positive relation with the female consumers.
To examine the nature and strength of relationship between the different variables
under study Pearson correlation test was conducted which is shown in table 6. While
observing the table 6, a significant positive correlation (p<.01) exists between the consumer's
repurchase decision due to usefulness of the product with all other study variables Brand
image, PQ relationship, Involvement, QC mark, and convenience. However there is no
significant relationship exists with repurchase decision. Also, brand image has a strong
significant positive correlation (p<.01) with repurchase. The variable price-quality
relationship has a significant positive correlation (p<.01) with convenience factor and
positive correlation (p<.05) with the factor involvement with the product. The convenience
factor had a statistically significant positive correlation (p<.01) with all studied variables
except brand image. However, Repurchase decision has a statistically significant positive
correlation (p<.01) with Brand image and QC mark (p<.05).
The robustness of the relationship between the different variables was tested using
regression analysis. At first, as per model 1, independent variables Product Usefulness, Brand
Image, PQ-relationship, Involvement with the product, and convenience were regressed
against the dependent variable repurchase decision. In the second step, as per model 2,
moderating effect of Gender and QC-Mark on the repurchase decision was analyzed on the
variables observed statistically significant in step one.
The regression analysis of the result obtained as per model 1 is depicted in table 7.
The result of regression analysis resulted 'Brand' having statistically significant (F = 8.612, p
= 0.000) relationship with consumers' repurchase decision. However, other variables have
been observed insignificant with the dependent variable. This model-4 had R2 value of 0.087
and adjusted R2 value of 0.077.

18
To examine the moderating effect of QC mark on brand image and consumer's
repurchase decision, a new variable Interaction1 (Brand × QC mark) was computed and
regressed. The result showed statistically significant (F = 14.792, p = 0.000) effect as in table
8. This model-2 had R2 value of 0.075 and adjusted R
2 value of 0.070. This analysis showed
that Quality certification mark has moderating effect on Branded products that influence
positively on repurchase decision.
Also to test the moderating effect of Gender on brand image and consumer's
repurchase decision, a new variable Interaction2 (Brand × Gender) was computed.
Regression analysis was conducted by incorporating this new variable in the model that
yielded the result shown in table 9.
The result show that Gender does not moderate on the consumer's repurchases due to
the brand image. This model has F= 8.675 with R2 value of 0.090 and adjusted R
2 as 0.079.
Based on the result of multiple regression analysis and moderated multiple regression
analysis, the hypothesized relationships have been tested. The result of this research found
that there is a positive relationship and significantly positive effect of 'brand image' on
consumer repurchases decision. While the factors product usefulness, positive attitude
towards price-quality relationship, Involvement with the product, and convenience have no
significant effect on repurchase decision. Also the quality certification marks like (NS, ISO
standards) significantly and positively moderate on the consumer repurchase decision due to
the factor 'Brand Image'. The demographic variable 'gender' does not moderate the repurchase
decision.
SUMMARY OF FINDINGS, DISCUSSIONS, AND IMPLICATIONS
Consumer's purchase and repurchase decision of FMCG products is related with
customer satisfaction. Generally the prime factors influencing customer satisfaction are

19
quality products at right price, proper after sales service, and delivering the promised
benefits.
Out of the five influencing factors of trial purchase and repurchase of FMCG
products, this research found the consumers opinion on factors that influence in descending
priority order as product usefulness (M=6.63, SD=1.69), Brand image (M=5.16, SD=1.41),
Convenience (M=4.78, SD=1.26), price-quality relationship (M=4.56, SD=1.64), and product
attributes (M= 3.74, SD=1.42).
This study found statistically significant difference among age groups on
'convenience factor' and the level of education on 'involvement with the product in repurchase
decision. However no significant difference had been observed between occupation and
average monthly household income with research variables.
While analyzing the relationship between demographic variables and factors effecting
consumer repurchase decision, significant relationship (p<.05) has been found between
consumer Age-group with product usefulness, Sex with brand image and repurchase decision,
and average monthly household income with brand image. However, no significant
relationship has been found among others. Also, during analysis of the relationship between
study variables, consumers' repurchase decision has a statistically significant relationship
with Brand image of the product and quality certification mark in the product. Also, the
correlation between other variables like product usefulness, Brand image, PQ-relationship,
involvement with the product, and convenience factor has been observed.
Multiple regression analysis resulted in 'Brand image' having statistically significant
relationship with consumers' repurchase decision. However, other variables were observed to
be insignificant with repurchase decision. Also the branded products moderated with Quality
20
Certification Marks had a significantly positive relationship with repurchase decision.
However, Gender did not moderate the repurchase decision due to Brand Image.
DISCUSSIONS
The importance of utilitarian factor resembles with the universal phenomenon of
FMCG products as they are for daily use. The findings that the 'brand image' being most
significant is consistent with the finding of Bayus (1991), Boone and Kurtz (1995),
Schifffman, Kanuk, & Kumar (2010), Gihan Wijesundera (2010), and Sing & Sharma (2013).
The insignificance of the variable 'repurchase decision due to Involvement with the product'
suffered from its pre-conditions that touch is an effective tool in the absence of useful
product-related information as found by Peck, Joann and Wiggins, Jennifer (2006).
The price-quality relationship being second least significant is also consistent with the
finding of Schifffman, Kanuk, & Kumar (2010) as 'consumers often rely on price as an
indicator of quality in absence of direct experience or other information as brand, store
image'. This finding also resembles with the findings of Bakar et.al (2011) that 'price being a
management capability is supporting function for market oriented firms in free market
economy'. However, price and cost were significant factors of consumer decision in the
findings of the study conducted by Bayus (1991), Boone and Kurtz (1995).
The findings of this research do not significantly reveal convenience factor being
statistically significant factor influencing consumer repurchase decision despite of its
significant mean value (M=4.78). This result contradicts with the findings of Masta, D. A.
(2011) stated that "Increasingly over the last few years, competition for consumers’ food
dollars has intensified. The Company believes its competitive advantages include convenient
locations, the quality of service it provides its customers, competitive pricing, product
variety, and quality and a pleasant shopping environment." This may be due to the context as

21
well as purpose of the study being professional and academic. However, Nicholls et al.
(1996) had found 'convenience' along with other factors as significant variable influencing
consumer repurchase decision.
Finding of this research, on role of demographic variable in repurchase decision, that
age, sex, and education have a significant role in consumer purchase decision on brand image
exactly resembles with the finding with Singh and Sharma, (2013). The statistical relationship
between the price, product, education, and occupation was found insignificant in this
research. Also, the relationship between the age and average monthly household income with
research variables found significant. Both the relationship contradicted with the findings of
Gihan Wijesundera (2010). This may be due to the reason that the Gihan Wijesundera (2010)
study was to measure the attitude towards only one product (beauty soap) while this study
was on the repurchase decision of FMCG products.
The revelation of results from the regression analysis that, only 'brand image' having
strong relationship with consumer repurchase decision show consumers increasing inclination
towards consumerism of the society created by multinational enterprises and globalization.
This finding is in line with the several other studies referred in this research. Considering the
Human Development index of Nepal (0.458), Nepali consumers being at the Bottom of the
Pyramid (BOP) have been found to be very brand conscious as mentioned by Pralhad, C.K.
(2010).
The result of moderation effect of quality certification mark to branded products on
repurchase decision is consistent with the findings of Sanchez et al., (2001) reported a
positive relationship between the presence of quality standards and aspects related to food
safety. However, no moderation effect (p=.056) of gender on repurchases decision of branded
product was found in regression analysis.

22
IMPLICATIONS
This research was carried out rigorously using robust statistical methods and most of
its results resemble with the findings of previous researches. The generalizability of findings
of this research has a valid ground. Academicians, researchers, and professionals in this field
can find these research findings useful for academic and professional use.
This research has a wider coverage of population and market. Retail marketer and
superstores can find practical implications to increase their sales and customer handling.
They can increase their sales concentrating more on branded and clearly labeled and
packaged products. Also, this research reveal that, FMCG producers can sustain their
business only by selling products on the brand with proper labeling and quality certification.
Preference of the people on convenience factor and branded products showed that
consumers in emerging market and on BOP have more preference on superstores and mini-
marts where they can select product of their choice irrespective of the physical inspection.
This shows that there is increasing scope of medium scales marts and large scale stores in
emerging markets availing with the various products with minimum assured quality
represented with brand and labeling.
Further, this research has an academic implication for students and researchers where
they can further research by covering more cities, and contexts. More demographic variables
and additional factors affecting consumer purchase decision may be captured. Also, this
research may be carried out based on single product category.
23
REFERENCES
Bakar, A.A.A., Hashim, F., Ahmad, H., Isa, F. M., & Dzakaria, H., (2011). Distinctive
Capabilities and Strategic Thrusts of Malaysia's Institutions of Higher Learning.
International Journal of Marketing Studies, Vol. 1, No. 2, pp. 158-164.
Bayus, B.L. (1991), “The consumer durable replacement buyer”, Journal of Marketing, Vol.
55 No. 1, pp. 42-51.
Berkowitz, E.N., Kerin, R.A., Hartley, S.W. and Rudelius, W. (1997), Marketing, 5th ed.,
McGraw-Hill/Irwin, Boston, MA.
Bloemer, J.M., Brijs, T., Vanhoof, K. and Swinnen, G. (2003), “Comparing complete and
partial classification for identifying customers at risk”, International Journal of
Research in Marketing, Vol. 20 No. 2, pp. 117-31.
Boone, L.E. and Kurtz, D.L. (1995). Contemporary Marketing, 8th ed., Dryden, Orlando, FL.
Bruner, G.C. (2009). Marketing Sales Hand Book. GCBII Productions. Carbondale, Illinois
USA.
Brunso, K., Fjord, T. A., and Grunert, K.G. (2002). "Consumers' food choice and quality
perception". The Aarhus School of Business, Working paper no 77, ISSN 09072101.
Capraro, A.J., Broniarczyk, S. and Srivastava, R.K. (2003). “Factors influencing the
likelihood of customer defection: the role of consumer knowledge”, Journal of the
Academy of Marketing Science, Vol. 31 No. 2, pp. 164-76.
Central Bureau of Statistics (2013). Environment Statistics of Nepal, Government of Nepal.
National Planning commission Secretariat. Thapathali, Kathmandu, Nepal.

24
Dragusanu, R., Giovannucci, D, and Nunn, N. (2013). "The Economics of Fair Trade". A
working paper for the Journal of Economic Perspectives.
Fotopoulos, C., & Krystallis, A., (2003). Quality labels as a marketing advantage: The case of
the “PDO Zagora” apples in the Greek market. European Journal of Marketing, Vol.
37, ISS: 10, pp.1350 - 1374.
Gillespie, A.H. & Smith, L.E. (2008). Food Decision-Making Framework: Connecting
Sustainable Food Systems to Health and Well-Being. Journal of Hunger &
Environmental Nutrition, 3, 328-346.
Grunert, K.G. (2002). A review of European research on consumer response to nutritional
information on food labels. Journal of Public Health, Vol.34, pp. 1–25.
Gujrati, D.N., Porter, D.C. & Gunasekar, S. (2009). Basic Econometrics. 5th Eds. McGraw
Hill Education (India) Private Limited, New Delhi.
Heras, I. & Dick, G.P., & Casadesus, M. (2002). "ISO 9000 registration's impact on sales and
profitability: A longitudinal analysis of performance before and after accreditation".
The International Journal of Quality & Reliability Management. 19, 774–791.
Jeng, Y. C. (1998). "Performance evaluation of ISO 9000 registered companies in Taiwan".
TQM Magazine, 10, pp.132 – 138.
Keller, K. L., and David, A. A. (1992). “The Effects of Sequential Introduction of Brand
Extensions,” Journal of Marketing research, Vol. 29 (February), pp. 35-50.
King A. & Lenox M. (2001). "Lean and Green? An empirical examination of the relationship
between lean production and environmental performance". Production and
Operations Management, 10, pp. 244–256.
Kotler, P. (2000), Marketing Management, Prentice-Hall, Upper Saddle River, NJ.

25
Kupiec, B. and Revell, B. (2001). Measuring consumer quality judgments. British Food
Journal, Vol. 103, No. 1, pp. 7-22.
Lam, S. Y., and Mukherjee, A. (2005). The Effects of Merchandise Coordination and
Juxtaposition on Consumers’ Product Evaluation and Purchase Intention in Store-
Based Retailing,” Journal of Research, Vol. 81 (3), pp. 231-250.
Lemon, K.N., White, T.B. and Winer, R.S. (2002), “Dynamic customer relationship
management: incorporating future considerations into the service retention decision”,
Journal of Marketing, Vol. 66 No. 1, pp. 1-14.
Lichtenstein, D. R., Ridgway, N. M., & Netemeyer R.G. (1993). Price Perceptions and
Consumer Shopping Behavior: A Field Study. Journal of Marketing Research, Vol.
30 (May), pp. 234-245.
Marette, S., R., Clemens, B.A., and Babcock (2007). "The Recent International and
Regulatory Decisions about Geographical Indications". Working Paper 07-MWP 10,
Midwest Agribusiness Trade Research and Information Center (MATRIC), Iowa State
University, Ames, Iowa, USA, 35 p.
Masta, D.A. (2011). Competition and Product Quality in the Supermarket Industry. The
Quarterly Journal of Economics. Vol. 126 (3). pp. 1539-1591.
Masters, W. A., and Diakalia, S. (2002). "Welfare Gains from Quality Certification of Infant
Foods: Results from a Market Experiment in Mali," American Journal of Agricultural
Economics, 84 (4), 974-989.
Menapace, L., and Moschini, G. (2010). "Quality Certification by Geographical Indications,
Trademarks and Firm Reputation". Iowa State University, Department of Economics,
Working Paper No. 09024.

26
Mousa, S. & Touzani, M. (2008). The perceived credibility of quality labels: a scale
validation with refinement. International journal of consumer studies, 32, 526-533.
Nicholls, J.A.F., Roslow, S., Dublish, S. and Comer, L.B. (1996), “Relationship between
situational variables and purchasing in India and the USA”, International Marketing
Review, Vol. 13 No. 6, pp. 6-21.
Peck, J., & Terry, L. C. (2003). Individual Differences in Haptic Information Processing: The
'Need for Touch' Scale. Journal of consumer Research ,Vol. 30 (December), pp. 430-
442.
Phelps, D.M. (1949). Certification Marks under the Lanham Act. Journal of Marketing, Vol.
13, No. 4, pp. 498-505.
Pralhad, C.K. (2010). The fortune at the bottom of the pyramid. Pearson Education, Inc,
Dorling Kindersley (India) Pvt. Ltd., New Delhi.
Rao, S., Ragu, T. S. & Solis, L. E. (1997). "Does ISO 9000 Have an Effect on Quality
Management Practices? An International Empirical Study". Total Quality
Management, 8, pp. 335-346.
Rawwas, M.Y.A., Rajendran, K.N. and Wuehrer, G.A. (1996), “The influences of
worldmindedness and nationalism on consumer evaluation of domestic and foreign
products”, International Marketing Review, Vol. 13 No. 2, pp. 20-38.
Roehm, M.L., Pullins, E.B. and Roehm, H.A. (2002), “Designing loyalty-building programs
for packaged goods brands”, Journal of Marketing Research, Vol. 39 No. 2, pp. 202-
14.
Sanchez, M., Sanjuan, A., Akl, G. (2001). The influence of experience in consumption and
personal attitude on the purchase of lamb and beef. 71st Seminar of European

27
Association of Agricultural Economics. The food consumer in the early 21st century,
Zaragoza, Spain.
Schiffman, L.G., Kanuk, L.L., & Kumar, S. R. (2010). Consumer Behavior. ed.10. Pearson:
Delhi.
Singh, H. & Sharma, H. (2013). Consumer Perception towards the Quality Marks of
Products. International Journal of Management and Social Sciences Research
(IJMSSR), Vol.2, No.9, 2013, Page 50-53.
Terlaak, A., and King, A.A. (2004). "The effect of certification with the ISO 9000 quality
management standard: A signaling approach". Journal of Economic Behavior and
Organization.
Torben, H. (2005).Understanding consumer perception of food quality: The cases of Shrimp
and Cheeses. British Food Journal, 107, no.7 (2005), pp. 500-525.
Verbeke, W., & Viaene, J. (1999b). Consumer attitude to beef quality labeling and
associations with beef quality labels. Journal of International Food and Agribusiness
Marketing. Vol. 10 (3), pp. 45-65.
Wijesundera, G., & Abeysekera, R. (2010). Factors influencing the demand of beauty soap
among female consumers in the greater Colombo region. ICBI 2010 - University of
Kelaniya, Sri Lanka.
Ziamou, P, and Ratneshwar, S. (2003). “Innovations in Product Functionality: When and
Why are Explicit Comparisons Effective,” Journal of Marketing, 67 (April), pp. 49-
61.

28
ANNEXURE-I
Survey questionnaires to identify the factors influencing consumer's purchase
decision along with quality certification mark.
Dear Respondent,
This survey is being conducted for the partial fulfillment of the course Masters in Philosophy
under Kathmandu University School of Management. You are about to participate in a
Market Research Activity on the identification of factors influencing consumer's purchase
decision along with quality certification mark. Your participation is purely voluntary and
your unbiased judgment may have fruitful implication on academic as well as practical field.
Also, you have the choice to opt out of this activity at any time.
For each of the statements, please indicate your score ratings as mentioned against each
question.
1. How useful is the product you have bought?
1 2 3 4 5 6 7 8 9
Not at all
Useful
Very useful
2. What is your overall opinion of the product
you have purchased just now?
1 2 3 4 5 6 7 8 9
Very
Unlikely
Very Likely
3. How likely are you to repurchase this product
again?
1 2 3 4 5 6 7 8 9
Very
Unlikely
Very Likely
4. What is your overall opinion about Brand Image
you have bought?
1 2 3 4 5 6 7
Good Bad
5. How much do you like Brand Image of the product
you have purchased just before?
1 2 3 4 5 6 7
Like very
much
Very
useful
6. Generally speaking, the higher the price of a
product, better the quality.
1 2 3 4 5 6 7
Disagree
Strongly
Agree
Strongly
7. You always have to pay a bit more for the best.
1 2 3 4 5 6 7
Disagree
Strongly
Agree
Strongly
8. I identify the quality of any product by seeing it.
1 2 3 4 5 6 7
Disagree
Strongly
Agree
Strongly

29
9. I identify the quality of the product by touching it.
1 2 3 4 5 6 7
Disagree
Strongly
Agree
Strongly
10. I identify the quality of the product by inspection.
1 2 3 4 5 6 7
Disagree
Strongly
Agree
Strongly
11. Quality Certification (QC) mark, like and
ISO, is really convincing for me to purchase the
product.
1 2 3 4 5 6 7
Disagree
Strongly
Agree
Strongly
12. I believe that Quality Certification (QC) marks,
like and ISO, are true measures of quality.
1 2 3 4 5 6 7
Disagree
Strongly
Agree
Strongly
13. The shop that I bought is located very convenient
to me.
1 2 3 4 5 6 7
Disagree
Strongly
Agree
Strongly
14. The shop that I bought is very accessible to me.
1 2 3 4 5 6 7
Disagree
Strongly
Agree
Strongly
15. The shop that I bought is available with all daily
consumable goods.
1 2 3 4 5 6 7
Disagree
Strongly
Agree
Strongly
16. I shop there because shopkeeper behavior during
purchase is very good.
1 2 3 4 5 6 7
Disagree
Strongly
Agree
Strongly
Age:------------ Gender: Male / Female / Other
Occupation: 1. Business Person 2. Job Holder 3. Student 4.House wife 5. Others
Education: 1. Up-to SLC 2. Intermediate 3. Bachelor degree 4. Masters and above
Monthly income of family: 1. Less than NPR 15,000 per month 2. NPR 15,000 to 30,000
per month 3. NPR 30,000 to 50,000 per month 4. NPR 50,000 and above
<<< Thank you very much for taking the time for your help to this study>>>

30
उपभोक्ता खरिद निर्णयमा प्रभाव पािे गरु्स्ति प्रमार् चिन्ह सहहतका कािक तत्वहरुको पहहिािका लाचग सरे्ब
महोदय , यो सरे्ब काठमान्डौं ववश्वववद्यालय व्यर्बस्थापि संकाय स्िातकोत्ति तह दर्णि र्ास्र बर्बषयको आंशर्क परिपूनतणका लाचग गरिएको हो । तपााँई उपभोक्ता खरिद निर्णयमा प्रभाव पािे गुर्स्ति प्रमार् चिन्ह सहहतका कािक तत्वहरुको पहहिाि सम्र्बन्न्ि र्बजाि cिुसन्िाि कायणमा सहभागी हुिु हुदैछ । तपााँईको सहभाचगता बर्बरु्द्ध स्वैन्छछक हो । तपााँईको निस्पIIIf मुल्याङ्किले रै्lIfक एवं व्यर्बर्ानयक If]रमा फलदायी प्रभाव पािण सक्िेछ । तपााँई कुिै पनि समय यस कायणक्रमर्बाट र्बाहहरिि सक्िु हुिेछ । तलका प्रत्येक कथनमा तपााँईको मुल्याङ्कन सम्बन्धित प्रश्नसंगै c+ककत गनुुहोस ्।
१. तपााँईले ककिकेो सामाि कन्त्तको उपयोगी छ ?
१ २ ३ ४ ५ ६ ७ ८ ९
पटक्कै उपयोगी
छैि ।
निकै उपयोगी
छ ।
२. तपााँईले भखणिै ककिेको सामाि र्बािे तपााँईको समग्र मुल्याङ्कि
के हो ।
१ २ ३ ४ ५ ६ ७ ८ ९
ििै ििाम्रो छ। ििै िाम्रो छ।
३. तपााँईले यही सामाि फेिी पनि ककन्िु हुन्छ त ?
१ २ ३ ४ ५ ६ ७ ८ ९
ककन्छु । ककन्न्दि।
४. तपााँईले ककिकेो सामािको ब्राण्ड (िाम) र्बािे तपााँईको समग्र मुल्याङ्कि के छ ।
१ २ ३ ४ ५ ६ ७
िाम्रो ििाम्रो
५. तपााँईलाई भखणिै ककिेको सामािको ब्राण्ड कन्त्तको मि पछण ।
१ २ ३ ४ ५ ६ ७
िेिै मि पछण । मिै पदैि ।
६. सािािर्तया भन्िुपदाण, कुिै सामािको मुल्य र्बहि हुिुभिेको गुर्स्ति पनि िाम्रो हुिु हो ।
१ २ ३ ४ ५ ६ ७
पटक्कै सहमत
छैि ।
िेिै
सहमत छु ।
७. िाम्रो सामािको लाचग त cशल र्बहि नतिै पछण िी।
१ २ ३ ४ ५ ६ ७
पटक्कै सहमत
छैि ।
िेिै
सहमत छु ।
८. मैले सामािको गुर्स्ति त हेिेि िै पत्ता लगाउाँ छु ।
१ २ ३ ४ ५ ६ ७
पटक्कै सहमत
छैि ।
िेिै
सहमत छु ।
१ २ ३ ४ ५ ६ ७
31
९. मैले सामािको गुर्स्ति छामेि पत्ता लगाउाँ छु ।
पटक्कै सहमत
छैि ।
िेिै
सहमत छु ।
१०. मैले सामािको गुर्स्ति परिIfर् र्बाट पत्ता लगाउाँ छु ।
१ २ ३ ४ ५ ६ ७
पटक्कै सहमत
छैि ।
िेिै
सहमत छु ।
११. मेिो वविािमा, 'गुर्स्ति प्रमार् चिन्ह' जस्त ै , ISO, हरुिै
गुर्स्तिका सहह मापकहरु हुि ्।
१ २ ३ ४ ५ ६ ७
पटक्कै सहमत
छैि ।
िेिै
सहमत छु ।
१२. मलाई सामाि ककन्दा 'गुर्स्ति प्रमार् चिन्ह' जस्तै , ISO,
हरुमाचथिै गुर्स्तिको ववश्वास लाग्दछ ।
१ २ ३ ४ ५ ६ ७
पटक्कै सहमत
छैि ।
िेिै
सहमत छु ।
१३. मैले सामाि ककन्िे पसल मेिा लाचग निकै सुबर्बिाजिक छ ।
१ २ ३ ४ ५ ६ ७
पटक्कै सहमत
छैि ।
िेिै
सहमत छु ।
१४. मैले सामाि ककन्िे पसल मलाई निकै पायक पदणछ ।
१ २ ३ ४ ५ ६ ७
पटक्कै सहमत
छैि ।
िेिै
सहमत छु ।
१५. मैले सामाि ककन्िे पसलमा दैनिक उपभोग्य सामािहरु सर्बै पाईन्छ ।
१ २ ३ ४ ५ ६ ७
पटक्कै सहमत
छैि ।
िेिै
सहमत छु ।
१६. म यही पसलमा सामाि ककन्छु ककिकी सामाि ककन्दा साहुजीले गिे व्यर्बहाि िेिै िाम्रो छ ।
१ २ ३ ४ ५ ६ ७
पटक्कै सहमत
छैि ।
िेिै
सहमत छु ।
ऊमेर: ----- र्बषण ललङग:् महहला / पुरुष / cन्य
पेशा: १ .रयापाि २. जाचगि ३. बर्बिाथी ४. गहृहर्ी ५.cन्य
लशIIIff: १ .एस .एल.सी .सम्म २. आई .ए . ३. स्िातक ४. स्िाकोत्ति ि माचथ
पररवारको मालसक आय: १ .रु.१५०००|- भन्दा थोिै २ .रु.१५,०००|- देखख रु .३०,०००|- सम्म
३ .रु .३०,०००|- देखख रु .५०,०००|- सम्म ४ .रु .५०,०००|- भन्दा िेिै
------- समय प्रगान गरर यस cध्य्यन सहयोग गनु ुभएकोमा िधयबाग ।--------

32
List of Tables
Table-1
Cronbach's Alpha of different variables
VARIABLE NO. OF
ITEMS
NO. OF
ITEMS
DELETED
CRONBACHE'S
ALPHA
WITHOUT ITEM
DELETION
CRONBACH'S
ALPHA WITH
ITEM
DELETION
Product usefulness 2 0 .702
Brand Image
2
0
.662
Price- Quality
relationship
2
0
.606
Involvement with the
product
3
1
.468
.584
QC mark
2
0
.820
convenience
4
0
.693

33
Table-2
Descriptive statistics - Gender
VARIABLE Overall
Mean
Overall
SD
GENDER N MEAN
STD.
DEVIAT
ION
F p
Product usefulness 6.63 1.69 Male 118 6.57 1.64 0.370 0.544
Female 68 6.73 1.76
Purchase decision due to Brand Image 5.15 1.41 Male 116 4.98 1.43 2.203 0.139
Female 65 5.44 1.36
Purchase due to Price- Quality
relationship
4.56 1.54 Male 119 4.43 1.45 0.080 0.777
Female 68 4.78 1.67
Purchase decision due to Involvement
with the product
3.74 1.42 Male 119 3.76 1.33 0.440 0.508
Female 68 3.70 1.62
Perception on quality due to QC mark 4.84 1.62 Male 119 4.80 1.61 4.439 0.037
Female 67 4.96 1.65
Purchase decision due to convenience 4.78 1.26 Male 118 4.70 1.28 2.622 0.107
Female 67 5.00 1.18
Consumer's Repurchase decision 6.09 2.78 Male 117 5.73 2.66 6.757 0.010
Female 66 6.82 2.83

34
Table-3
ANOVA - Socio-demographic groups of study variable
Group Usefulness Brand Image PQ relationship Involvement
F Sig. F Sig F Sig F Sig
Age-Group 2.326 .076 1.532 .208 2.172 .093 2.250 .084
Education 2.034 .111 .684 .563 .469 .705 2.802 .041*
Occupation 1.79 .133 .835 .505 1.42 .230 2.024 .093
Household
Income
.312 .869 2.049 .090 .759 .553 .804 .524
Group QC Mark Convenience Repurchase
F Sig. F Sig F Sig
Age-Group 1.423 .237 2.951 .034* .528 .664
Education 1.735 .162 .965 .410 1.402 .244
Occupation .279 .891 .337 .852 2.231 .068
Household
Income
.733 .570 .680 .606 .345 .847
P<.05*
35
Table-4:
ANOVA-Post Hoc test using LSD method for multiple comparisons
Variable: Involvement with the product
Age -
group
1 2 3 4
1 - 0.70*
(0.005)
0.50*
(0.04)
0.40
(0.14)
2 - 0.20
(0.39)
0.30
(0.24)
3 - 0.09
(0.73)
4 -
Note: Age Group 1 = 19 & below, 2 = 20-24, 3 = 25-
34, 4 = 35 & above.
* The mean difference is significant at the 0.05 level.
Variable: Convenience factor
Level of
education
Up
to
SLC
Interm
ediate
Bachelor
degree
Masters
and
above
Up to SLC - 0.81*
(0.013
)
0.57*
(0.024)
0.24
(0.46)
Intermediate - 0.23
(0.45)
0.57
(0.12)
Bachelor
degree
- 0.34
(0.28)
Masters and
above
-
* The mean difference is significant at the 0.05 level.

36
Table-5
Correlation between demographic and study variables
Age group Sex Occupation Education Income
Usefulness -.145* .045 -.079 -.126 .065
PQ relationship .096 .108 -.032 .060 .114
Involvement -.137 -.021 .071 -.093 .118
QC mark -.037 .049 .033 -.023 -.021
Brand Image .081 .156* -.040 .074 .164
*
Convenience -.109 .119 .069 -.122 .078
Repurchase -.093 .190* .080 -.120 -.071
Note: p<.01**, p<.05*.

37
Table-6
Correlation between different study variables
Usefulness
Brand
Image
PQ
relationship
Involvem
ent QC mark convenience
Repurch
ase
Usefulness
Brand image .424**
PQ relation .196**
-.005
Involvement .284**
.027 .151*
QC mark .215**
.066 -.037 .114
Convenience .390**
.073 .218**
.330**
.236**
Repurchase .077 .264**
-.133 -.015 .147* .036
Note: p<.01**, p<.05*, QC-Quality certification, PQ-Price Quality

38
Table-7
Multiple Regression Analysis to assess the relationship between dependent variable
(repurchase decision) and independent variables.
Model
Unstandardized
Coefficients
Standardized
Coefficients
t Sig. B Std. Error Beta
1 (Constant) 4.127 1.202 3.433 .001
Mean_Use -.018 .147 -.011 -.125 .901
Mean_Brand .531 .158 .270 3.362 .001
Mean_PQrelation -.231 .135 -.126 -1.705 .090
Mean_involvement -.057 .151 -.029 -.374 .709
Mean_convenience .129 .183 .057 .705 .482
2 (Constant) 4.106 1.188 3.458 .001
Mean_Brand .522 .141 .265 3.697 .000
Mean_PQrelation -.233 .134 -.127 -1.733 .085
Mean_Involvement -.060 .148 -.031 -.407 .685
Mean_convenience .122 .174 .054 .703 .483
3 (Constant) 3.992 1.151 3.468 .001
Mean_Brand .523 .141 .265 3.709 .000
Mean_PQrelation -.236 .134 -.129 -1.767 .079
Mean_convenience .101 .166 .045 .612 .541
4 (Constant) 4.372 .968 4.518 .000
Mean_Brand .529 .140 .269 3.776 .000
Mean_PQrelation -.220 .131 -.120 -1.683 .094
Dependent Variable: Consumers' repurchase decision.

39
Table-8
Moderated Multiple Regression (MMR) analysis to assess moderating effect of Quality
certification (QC) mark on Brand Image.
Model
Unstandardized
Coefficients
Standardized
Coefficients
t Sig. B Std. Error Beta
1 (Constant) 3.554 .749 4.747 .000
Mean_Brand .277 .183 .140 1.515 .131
Interaction1 .043 .022 .183 1.982 .049
2 (Constant) 4.442 .467 9.503 .000
Interaction1 .065 .017 .273 3.846 .000
Dependent variable: Consumers' repurchase decision.

40
Table-9
Moderated Multiple Regression (MMR) analysis to assess the relationship between
brand image on Gender.
Model
Unstandardized
Coefficients
Standardized
Coefficients
t Sig. B Std. Error Beta
1 (Constant) 3.611 .753 4.799 .000
Mean_Brand .430 .148 .220 2.912 .004
Interaction2 .149 .077 .146 1.927 .056
Dependent Variable: Consumers' repurchase decision.