absolute radiometric calibration of narrow-swath imaging sensors with reference to non-coincident...
TRANSCRIPT
IEEE TRANSACTIONS ON GEOSCIENCE AND REMOTE SENSING, VOL. 51, NO. 3, MARCH 2013 1309
Absolute Radiometric Calibration of Narrow-SwathImaging Sensors With Reference to
Non-Coincident Wide-Swath SensorsJoel McCorkel, Kurtis Thome, and Ronald B. Lockwood
Abstract—An inter-calibration method is developed to provideabsolute radiometric calibration of narrow-swath imaging sensorswith reference to non-coincident wide-swath sensors. The methodpredicts at-sensor radiance using non-coincident imagery fromthe reference sensor and knowledge of spectral reflectance ofthe test site. The imagery of the reference sensor is restrictedto acquisitions that provide similar view and solar illuminationgeometries to reduce uncertainties due to directional reflectanceeffects. Spectral reflectance of the test site is found with a simpleiterative radiative transfer method using radiance values of awell-understood wide-swath sensor and spectral shape informa-tion based on historical ground-based measurements. At-sensorradiance is calculated for the narrow-swath sensor using this spec-tral reflectance and atmospheric parameters that are also basedon historical in-situ measurements. Results of the inter-calibrationmethod show agreement on the 2–5% level in most spectral regionswith the vicarious calibration technique relying on coincidentground-based measurements referred to as the reflectance-basedapproach. While the variability of the inter-calibration methodbased on non-coincident image pairs is significantly larger, resultsare consistent with techniques relying on in-situ measurements.The method is also insensitive to spectral differences betweenthe sensors by transferring to surface spectral reflectance priorto prediction of at-sensor radiance. The utility of this inter-cal-ibration method is made clear by its flexibility to utilize imagepairings with acquisition dates differing in excess of 30 daysallowing frequent absolute calibration comparisons between wide-and narrow-swath sensors.
Index Terms—Hyperspectral sensors, intercalibration, radio-metric calibration, reflectance retrieval.
I. INTRODUCTION
EARTH-observing satellite sensors provide measurementsfor a wide range of climatic and environmental studies.
It is critical that these sensors remain calibrated in order toachieve synergy among coexisting sensors and legacy amonggenerations of sensors. There are several methods of radiomet-ric calibration of satellite sensors including preflight, on-board
Manuscript received February 21, 2012; revised June 27, 2012; acceptedAugust 4, 2012. Date of publication January 15, 2013; date of current versionFebruary 21, 2013.
J. McCorkel and K. Thome are with the Sciences and Exploration Di-rectorate, NASA/GSFC, Greenbelt, MD 20771 USA (e-mail: [email protected]; [email protected]).
R. B. Lockwood is with the MIT Lincoln Laboratory, Group 97-SensorsTechnology and Systems Applications, Lexington, MA 02421 USA (e-mail:[email protected]).
Color versions of one or more of the figures in this paper are available onlineat http://ieeexplore.ieee.org.
Digital Object Identifier 10.1109/TGRS.2012.2219874
instrumentation, lunar, or solar illumination, and methods thatuse terrestrial scenes acquired on-orbit. Each method has itsown strengths and weaknesses. Preflight characterization is themost thorough, but it is often difficult to create a test apparatusthat exactly emulates operational conditions and anticipate howthe senor may be affected by launch and the space environ-ment [1]. Many sensors, including Hyperion, have on-boardcalibrators that provide valuable information about sensor be-havior such as detector-to-detector variability and trends insensor health. To date, on-board calibrators have not been ableto provide an absolute calibration that is more accurate than thepreflight characterization.
Several techniques have been developed to characterizesensors vicariously and independently from prelaunch andon-board calibrators including repeated lunar acquisitions,comparisons to other sensors, and comparisons to ground-based measurements. One method of vicarious validation of at-sensor radiance is the reflectance-based approach, successfullyimplemented by several research groups and applied to dozensof Earth-observing sensors [2]–[6]. This method relies onin-situ measurements that characterize surface reflectance andatmospheric properties of a test site for input to a radiativetransfer model to predict at-sensor radiance. These values arethen compared with corresponding measurements of the air-borne or spaced-based sensor.
One issue with the reflectance-based approach is that itrequires collection of the ground data coincident with the viewof the site by the sensor being calibrated. Such an approachis problematic when the goal is to calibrate more than a fewsensors. Relying on satellite-based sensors to characterize thesite or a test site that is invariant with time provides manymore opportunities for radiometric calibration through cross-calibration.
Ideally, the data from both sensors would be coincident intime with identical view and solar geometries. Teillet et al.[7] developed a variation of the approach to account for smallchanges in view and solar geometry. In this case, the aircraftsensor is used to derive the surface reflectance of a test site bothspatially and spectrally [7].
Simplification of the cross-calibration problem is achievedby limiting the data sets to nearly coincident views of thesame test site. The simultaneous nadir overpass method is suchan approach [8], [9]. The method obtains the largest numberof coincident views near the polar regions for typical sun-synchronous, near-polar orbits. Such overlapping data sets limitthe approach to spectral regions for which the radiance from
0196-2892/$31.00 © 2013 IEEE
1310 IEEE TRANSACTIONS ON GEOSCIENCE AND REMOTE SENSING, VOL. 51, NO. 3, MARCH 2013
snow and ice can be well predicted because even sensors undercomparison sharing similar acquisition times and geometrieswill differ in spectral coverage exacerbating the calibrationtransfer [10], [11].
A drawback to the above methods is that one must limit theintercomparisons to geographic regions near the poles wheresignificant overlaps occur or must wait for fortuitous overlapsat other locations. Overlaps are more prevalent between largeswath sensors, though they require corrections for differing sunand view angles. The difficulty remains for narrow-swath sen-sors for which overlapping opportunities may be limited. Thiswork presents a method to transfer the radiometric calibrationfrom a wide-swath sensor to any other sensor. A wide-swathsensor has the advantage of sampling the entire Earth’s surfacenearly every day. This means that most other sensors with vary-ing swath widths and duty cycles must have near-overlappingimagery with varying degrees of similarity between acquisitiontime and geometry. The wide-swath sensors chosen for thiswork are MODIS, both on the Terra and Aqua platforms, dueto their remarkably accurate radiometric calibration [12], [13].Terra was launched in December 1999 with a 10:30 A.M.equatorial crossing time and Aqua was launched in May 2002with a 1:30 P.M. equatorial crossing time. Terra is commonlyknown as the “AM” satellite and Aqua, the “PM” satellite due totheir equatorial crossing times. MODIS has spatial resolutionsof 250, 500, and 1000 m, depending on the spectral band,covering a swath width of 2330 km. The MODIS sensors havea total of 36 bands, 19 of which are within the solar reflectiveregion of the electromagnetic spectrum.
Hyperion is a convenient test case for a sensor to calibratewith this method. First, it is an on-demand sensor with anarrow swath of 7.5 km showing that this method can beused with nearly any sensor. Second, Hyperion is an imagingspectrometer with spectral channels covering the solar reflectiveregion with about 10-nm sampling and 10–11 nm bandwidthsallowing this method to be tested with the same spectral fidelity.Last, past work has provided a well-understood radiometriccharacterization of Hyperion that these and future results can beheld against [14], [15]. Hyperion is aboard the Earth Observing1 spacecraft launched in November 2000, providing significantlifetime overlap with both MODIS sensors.
The next section describes the test site used for this study andpast work that will serve as a baseline to assess the reliabilityof this new method. The past work uses the reflectance-basedapproach of vicarious calibration to characterize Hyperion. Thethird section describes the inter-calibration method developedin this work. The method uses the well-understood radiometriccalibration of a wide-swath sensor, MODIS, in conjunction witha mean reflectance curve of historical in-situ measurements topredict the at-sensor radiance of the test case sensor, Hype-rion. The accuracy and variability of this method are testedwith image dates matching those used in the reflectance-basedapproach. Further results test the flexibility of this method byusing non-coincident image pairs.
II. TEST SITE DESCRIPTION
Desirable test site properties for the reflectance-based ap-proach as well as other calibration methods include high-
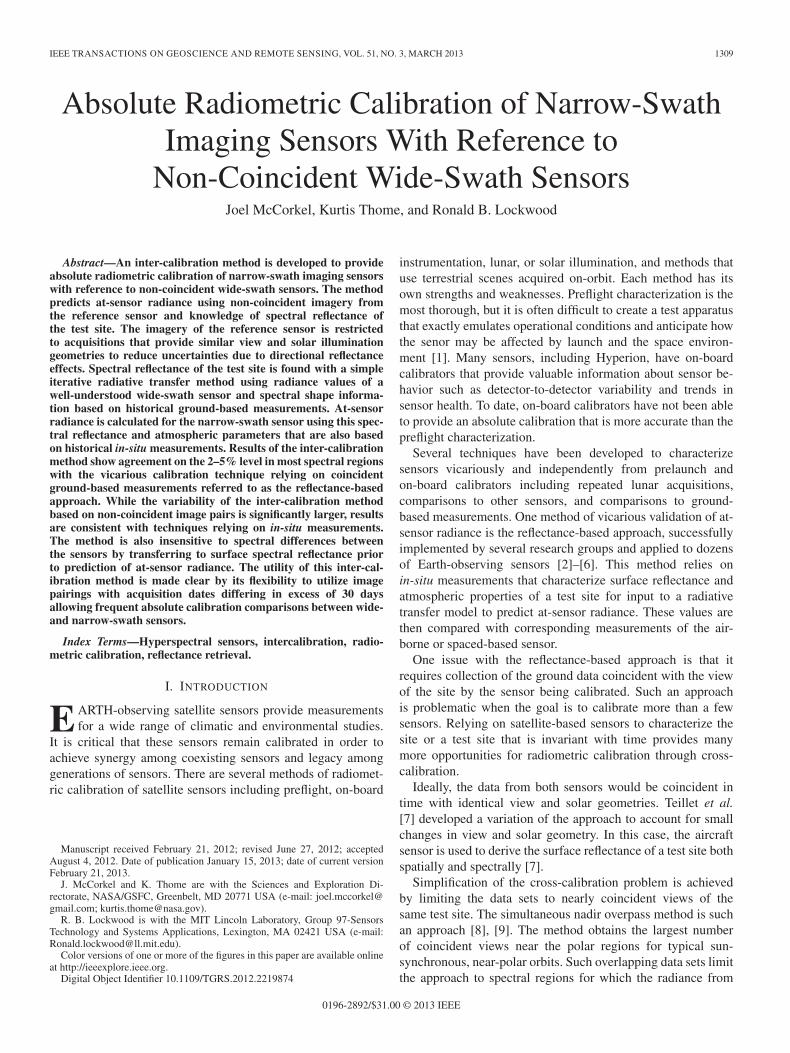
Fig. 1. Surface reflectance of the test site at RVPN. The thin lines representdata retrieved over the 2000–2009 period, and the black line is the mean of thehistorical reflectance.
reflectance, spatially uniform over large areas, and high in ele-vation [16]. The overarching idea behind these characteristicsis to get closer to a more ideal case of zero atmosphere bymaximizing the signal due to directly reflected solar irradi-ance. A bright test site with a reflectance with 0.3 or greatermaximizes signal component due to directly reflected solarirradiance for most spectral regions. Spatially uniform sitesreduce concerns such as registration and adjacency effects seenin some radiative transfer studies when the surface reflectancesurrounding the test site is different than that of the test site.Test sites at high elevations have less atmospheric aerosols;therefore, errors associated with their characterization haveless effect. Other desirable test site characteristics are nearLambertian reflectance properties and temporally stability. Anear-Lambertian site reduces effects due to solar and view ge-ometries. A temporally stable site allows consistency betweenday-to-day, season-to-season, and year-to-year studies. Last,logistics and cost of traveling to a test site with an assortmentof personnel and instrumentation control the locality of the testsite. The Railroad Valley Playa (RVPN), a large desert basin inNevada, satisfactorily satisfies the criteria described above andis selected for this work. The RVPN test site is centered near38.497◦ N, 115.690◦ W, and is 1438 m above sea level.
Over the 2000–2009 period, there have been hundreds offield campaigns that characterize several test sites in the south-western United States with RVPN being one of the mostregularly visited. The atmospheric and surface reflectancedata recorded on these campaigns amount to a vast librarythat spreads over varying seasons and surface conditions. Re-flectance of a test site is a function of a multitude of factors in-cluding solar illumination angle, soil moisture, and atmosphericconditions. This makes it difficult to predict the reflectance forany given time and hence the need for measurements during thetime of sensor overpass [5], [17].
The historical library of RVPN surface reflectance showssubstantial scatter over time and illumination angle, but inspec-tion of this scatter spectrally indicates flat offsets from one dayto the next. Consider as an example a collection of nine years ofreflectance data of a 1-km by 1-km area of RVPN that is charac-terized for the reflectance-based calibration of MODIS shownin Fig. 1. Each of the 51 thin lines represents reflectance data
MCCORKEL et al.: ABSOLUTE RADIOMETRIC CALIBRATION OF NARROW-SWATH IMAGING SENSORS 1311
collected during the reflectance-based approach of calibratingTerra or Aqua MODIS [4]. Similar results are obtained whenconsidering the larger number of data sets collected for smallersized footprints. The effects seen in the figure for spectralregions around 1350 nm and 1800 nm are due to strong watervapor absorption, and therefore measurements have very lowsignal-to-noise ratio. The thick black line in Fig. 1 shows themean of all 51 reflectance data.
III. INTER-CALIBRATION METHOD
A method is developed to radiometrically characterize allof the channels of an imaging spectrometer using an inter-calibration scheme. As mentioned above, inter-calibration ofspace-based Earth-observing sensors is a well-documentedmethod of radiometric calibration [11], [18]–[26]. Most effortscompare temporal trends of various sensors using frequent ac-quisitions of a near-ideal test site. These methods only providetemporal change relative to each other and the test site itselfwhere other efforts use spectral knowledge of the sensor tomake absolute radiometric comparisons. This work uses a well-understood multispectral sensor and a well-known test siteto predict a continuous spectrum of at-sensor radiance suit-able to characterize a variety of sensors including an imagingspectrometer as used for a test case here. The first part ofthis section describes the inter-calibration scheme and howit is applied in this work. Next, image pair selection basedon acquisition time and geometry is discussed. The third partpresents a simple method to derive a continuous reflectancespectrum using MODIS radiance, and the last part describeshow it is used to find a calibration for Hyperion.
A. Inter-Calibration Scenarios
One approach to inter-calibration makes use of spatiallyoverlapping images from the sensors under study. The sensorseach have their own orbit, and, therefore their imagery will beacquired with unique view and solar illumination geometries.The ideal case for inter-calibration is when the sensors are onthe same spacecraft, so as to acquire imagery under identicalconditions such as the case for ASTER and Terra MODIS. Aslightly less ideal case is when two sensors are in the sameorbit, but with a slight temporal difference. For example, beforearriving to its destination orbit, Landsat 7 was placed in atandem orbit with Landsat 5 allowing for the inter-calibrationof the Landsat 7 Enhanced Thematic Mapper Plus (ETM+)and Landsat 5 Thematic Mapper (TM) to establish calibrationcontinuity [21], [25]. Similar work has been done for ETM+and Terra MODIS, which follows ETM+ by approximately30 min [22]. Any difference in acquisition time or date in-creases uncertainties due to changes in surface and atmosphericconditions affecting the radiance incident at the sensors. Theeffects of the atmosphere and the surface on the calibrationare further exacerbated when the sensors view the same areaat different view angles.
This work studies inter-calibration results for two of theaforementioned scenarios: (1) the sensors have the same ge-ometry and nearly coincident image acquisitions; and (2) the
sensors have the nearly the same geometry but different ac-quisition dates. Studying both scenarios with the same sensorpair is possible because Hyperion’s orbit preceded MODIS by40 min early in its mission, but experienced an orbit change inmid-2005, after which only non-coincident comparisons weretypical. These two scenarios can be labeled as coincident andnon-coincident, referring to the image acquisition time andgeometry. The coincident case, as well as results from thereflectance-based approach, is held as a baseline for comparingthe non-coincident case. Application of the non-coincident caseis far more general since not nearly as many sensors fall underthe coincident case. The inter-calibration method used for bothcases is nearly identical, the only difference being that the non-coincident case requires a search of image pairs from the twosensors that have matching geometries.
B. Image Pair Selection
Hyperion-MODIS image pairs are selected according to theinter-calibration scenarios discussed above. Image pair selec-tion for the coincident case is straightforward; images acquiredon the same date, which have overlapping spatial locations,qualify. The spatial locations are narrowed to the test sitesdiscussed in the next section. Image pair selection for thenon-coincident case requires consideration of temporal andgeometrical compatibility.
Temporal matching is important due to the variability inher-ent to atmospheric conditions. This is most easily accounted forthrough the use of a large number of data sets over which out-liers such as cloudy days are discarded and smaller atmosphericeffects such as variable ozone and water vapor will averageout. Differences in imaging geometry have a larger impacton the total radiance seen at the sensor due to the fact thatthe surface reflectance is a function of view and illuminationangles. This variability in reflectance is typically characterizedwith a bidirectional reflectance distribution function (BRDF).Many surfaces have a BRDF with complicated structure suchas vegetation and urban environments or those with a strongspecular component such as water and snow. The test sites usedfor reflectance-based and inter-calibration methods are muchsimpler in this regard and are assumed to be Lambertian forwhich BRDF is constant. Effort is given to reduce uncertaintiesdue to variability of surface BRDF by considering only similargeometries. The reflectance-based approach relies on measur-ing surface reflectance close in time to the sensor overpass tominimize uncertainties caused by differing illumination anglesbetween in-situ measurements and the satellite imager. Thecoincident case of inter-calibration has nearly identical viewinggeometries and only small differences in illumination angles.The non-coincident scenario relies on selecting image pairs thatshare similar geometries to reduce BRDF effects.
Processing routines are developed for this work that findHyperion-MODIS image pairs that share similar view and solargeometry. Inputs to this routine are the library of images fromboth sensors, a maximum angular difference of the geometriesbetween the two sensors, and the maximum temporal differ-ence between the acquisition dates of the image pair. Restrict-ing the geometric difference between an image pair reduces
1312 IEEE TRANSACTIONS ON GEOSCIENCE AND REMOTE SENSING, VOL. 51, NO. 3, MARCH 2013
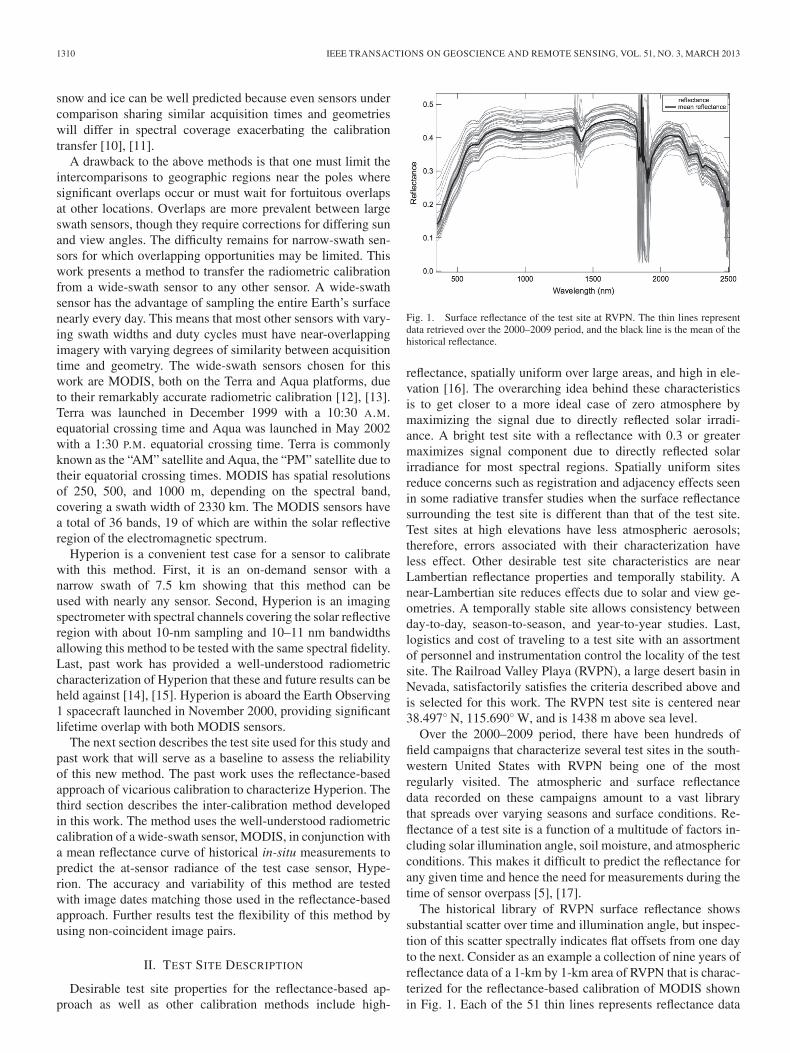
Fig. 2. Top-of-atmosphere total and component spectral radiance for a typicalday at RVPN.
uncertainties induced by the lack of knowledge about surfaceBRDF. Restricting the temporal difference between the imagepair may reduce the effect of differing atmospheric conditions.However, increased restrictions placed on these parameters re-sult in fewer image pairs satisfying the geometry requirements.
C. Deriving Continuous Reflectance Spectrum
A challenge of this work is predicting a continuous spectrumof at-sensor radiance when radiance at discrete spectral posi-tions is known. This is achieved by deriving surface reflectanceusing a combination of data consisting of multispectral in-formation from MODIS and prior knowledge of the spectralstructure of the surface. The RVPN test site has the advantageof nearly a decade of in-situ measurements as discussed in theprevious section, and the mean of these measurements is scaledto best fit the MODIS radiance values for each image pair.
A simple iterative model is used to predict multispectralreflectance of the RVPN test site so that the most appropriatescaling of the reflectance curve can be found. At-sensor radi-ance for an Earth viewing sensor is a sum of different sources:surface reflected radiance and atmospherically scattered radi-ance. Surface reflected radiance is further specified as a sum oflight directly transmitted to and from the surface and reflecteddownwelling diffuse light scattered by the atmosphere. Thissum is represented by (1) as
Ltotal = Ldirect + Ldiffuse + Lsky (1)
where Ltotal is at-sensor radiance, Ldirect is directly transmit-ted surface reflected radiance, Ldiffuse is diffuse atmosphericreflected radiance, and Lsky is upwelling atmospherically scat-tered radiance. The total radiance is modeled with these com-ponents because they are readily obtained from MODTRAN5.
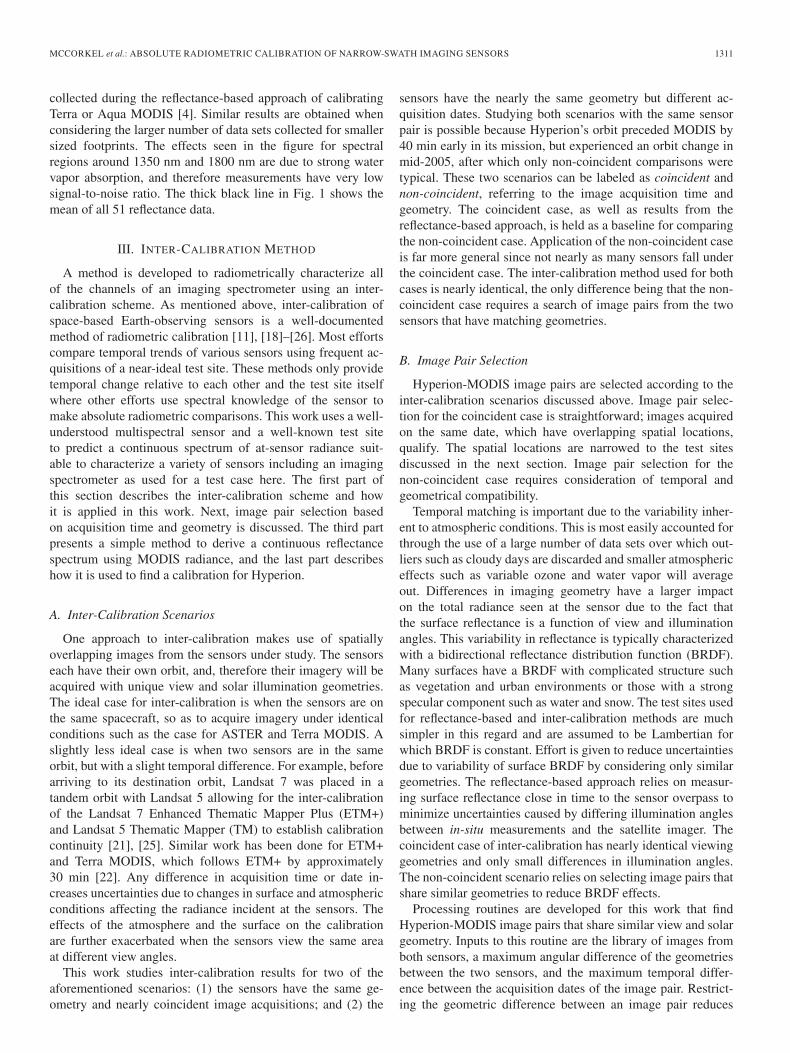
The proportions of these components vary significantly overthe spectral region considered in this work as shown in Figs. 2and 3. Fig. 2 shows top-of-atmosphere-spectral radiance, cal-culated with MODTRAN5, from RVPN on a typical day andFig. 3 gives a better idea of the fractional amount of eachcomponent. The near zero signal in the spectral regions near1350 nm and 1800 nm are due to atmospheric water vaporabsorption. Additional atmospheric absorbers as well as theinherent solar irradiance cause other sharply varying featuresin the radiance spectrum. Important features of Fig. 3 to noteare the rapidly increasing proportions of diffuse radiance com-ponents as shorter wavelengths are approached.
Fig. 3. Fractional components of top-of-atmosphere spectral radiance for atypical day at RVPN.
The goal is to predict the surface reflectance at the spectrallocations covered by MODIS using radiance values reported byMODIS as values for Ltotal. Unfortunately, surface reflectanceis coupled with all three radiance components that make upthe total at-sensor radiance shown in (1). One could rely onthe appropriate data product from MODIS that provides thesurface reflectance, but the goal of this effort is to developa method that would be appropriate in the case that no suchdata product is available. Ldiffuse is the smallest componentof the total radiance throughout the spectrum. Lsky only be-comes a significant portion of the total as the lower wavelengthbound is approached. Ldirect is the component that is mostheavily dependent on surface reflectance for the spectral regionlonger than 500 nm. Therefore, an approximation of surfacereflectance can be made by modeling Ldirect with
Ldirect =ρsurfaceTdownTupEsun cos θSZA
π(2)
where �surface is surface reflectance, Tdown is the atmospherictransmission along the solar-ground path, Tup is the transmis-sion along the ground-sensor path, Esun is exoatmosphericirradiance corrected for Earth-sun distance, and θSZA is thesolar zenith angle. This model assumes a Lambertian surface.The combination of (1) and (2) yields
ρsurface =π(Ltotal − Ldiffuse − Lsky)
TdownTupEsun cos θSZA. (3)
An iterative algorithm is developed because inputs toMODTRAN require information about the surface reflectance,the desired product. The seed provided to the algorithm forsurface reflectance input is the historical mean of RVPN.Atmospheric inputs to MODTRAN consist of the default desertaerosol model and average parameters found for RVPN. Pre-vious work shows that MODTRAN inputs representing theaverage atmosphere have insignificant effects on calibrationresults relative to using atmospheric parameters derived forthe given day when considering results averaged over multipledays [27].
Outputs from the initial MODTRAN iteration includeLdiffuse, Lsky, Tdown, and Tup. These are combined with spec-tral radiance reported by MODIS (Ltotal) to arrive at an initialestimate of multispectral surface reflectance according to (3).These data are compared against the input reflectance thathas been band averaged. A spectrally flat offset is found that
MCCORKEL et al.: ABSOLUTE RADIOMETRIC CALIBRATION OF NARROW-SWATH IMAGING SENSORS 1313
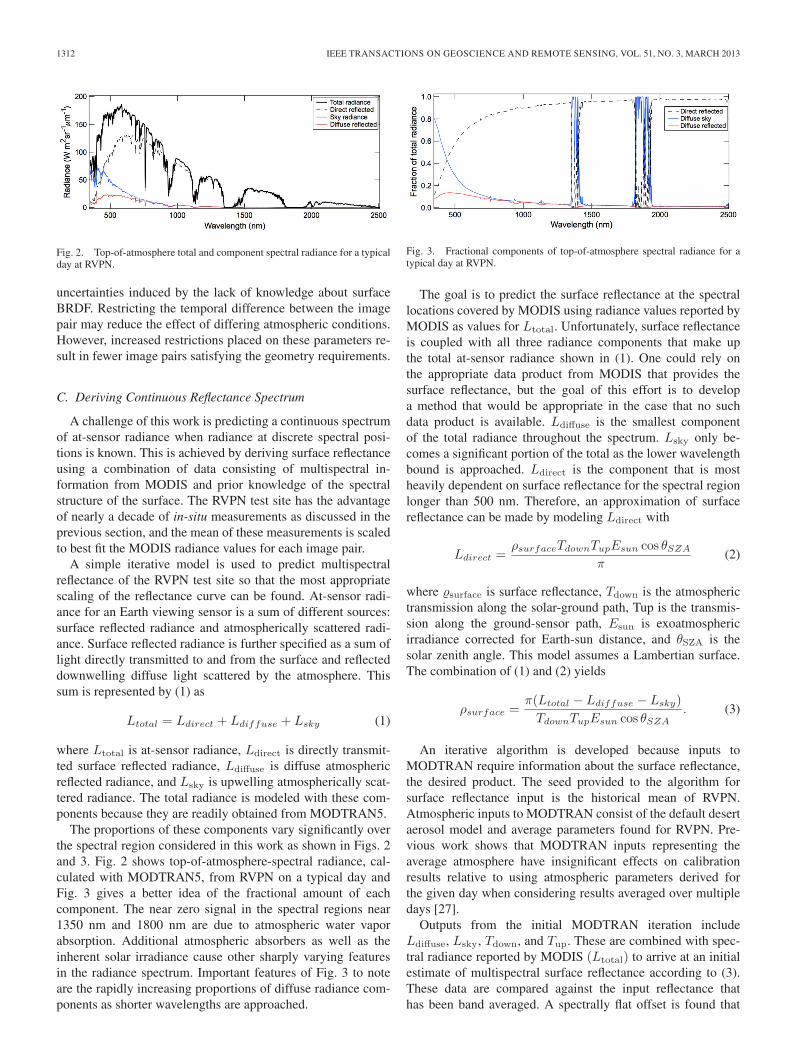
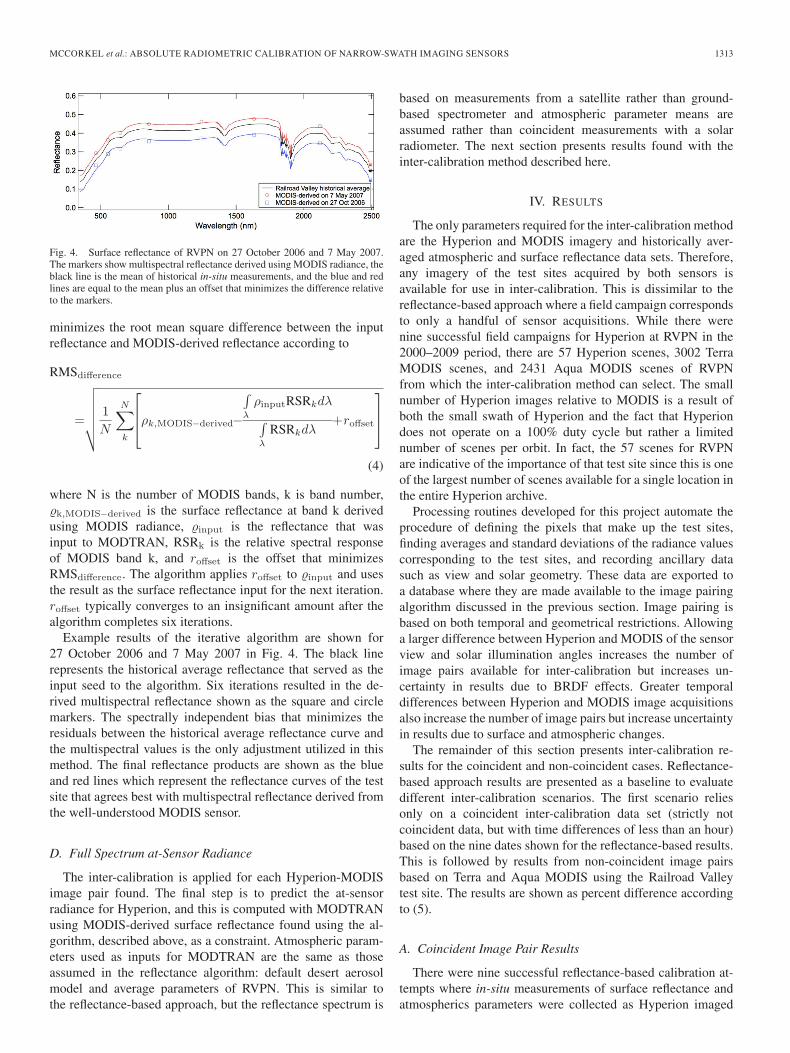
Fig. 4. Surface reflectance of RVPN on 27 October 2006 and 7 May 2007.The markers show multispectral reflectance derived using MODIS radiance, theblack line is the mean of historical in-situ measurements, and the blue and redlines are equal to the mean plus an offset that minimizes the difference relativeto the markers.
minimizes the root mean square difference between the inputreflectance and MODIS-derived reflectance according to
RMSdifference
=
√√√√√√1
N
N∑k
⎡⎢⎣ρk,MODIS−derived−
∫λ
ρinputRSRkdλ
∫λ
RSRkdλ+roffset
⎤⎥⎦
(4)
where N is the number of MODIS bands, k is band number,�k,MODIS−derived is the surface reflectance at band k derivedusing MODIS radiance, �input is the reflectance that wasinput to MODTRAN, RSRk is the relative spectral responseof MODIS band k, and roffset is the offset that minimizesRMSdifference. The algorithm applies roffset to �input and usesthe result as the surface reflectance input for the next iteration.roffset typically converges to an insignificant amount after thealgorithm completes six iterations.
Example results of the iterative algorithm are shown for27 October 2006 and 7 May 2007 in Fig. 4. The black linerepresents the historical average reflectance that served as theinput seed to the algorithm. Six iterations resulted in the de-rived multispectral reflectance shown as the square and circlemarkers. The spectrally independent bias that minimizes theresiduals between the historical average reflectance curve andthe multispectral values is the only adjustment utilized in thismethod. The final reflectance products are shown as the blueand red lines which represent the reflectance curves of the testsite that agrees best with multispectral reflectance derived fromthe well-understood MODIS sensor.
D. Full Spectrum at-Sensor Radiance
The inter-calibration is applied for each Hyperion-MODISimage pair found. The final step is to predict the at-sensorradiance for Hyperion, and this is computed with MODTRANusing MODIS-derived surface reflectance found using the al-gorithm, described above, as a constraint. Atmospheric param-eters used as inputs for MODTRAN are the same as thoseassumed in the reflectance algorithm: default desert aerosolmodel and average parameters of RVPN. This is similar tothe reflectance-based approach, but the reflectance spectrum is
based on measurements from a satellite rather than ground-based spectrometer and atmospheric parameter means areassumed rather than coincident measurements with a solarradiometer. The next section presents results found with theinter-calibration method described here.
IV. RESULTS
The only parameters required for the inter-calibration methodare the Hyperion and MODIS imagery and historically aver-aged atmospheric and surface reflectance data sets. Therefore,any imagery of the test sites acquired by both sensors isavailable for use in inter-calibration. This is dissimilar to thereflectance-based approach where a field campaign correspondsto only a handful of sensor acquisitions. While there werenine successful field campaigns for Hyperion at RVPN in the2000–2009 period, there are 57 Hyperion scenes, 3002 TerraMODIS scenes, and 2431 Aqua MODIS scenes of RVPNfrom which the inter-calibration method can select. The smallnumber of Hyperion images relative to MODIS is a result ofboth the small swath of Hyperion and the fact that Hyperiondoes not operate on a 100% duty cycle but rather a limitednumber of scenes per orbit. In fact, the 57 scenes for RVPNare indicative of the importance of that test site since this is oneof the largest number of scenes available for a single location inthe entire Hyperion archive.
Processing routines developed for this project automate theprocedure of defining the pixels that make up the test sites,finding averages and standard deviations of the radiance valuescorresponding to the test sites, and recording ancillary datasuch as view and solar geometry. These data are exported toa database where they are made available to the image pairingalgorithm discussed in the previous section. Image pairing isbased on both temporal and geometrical restrictions. Allowinga larger difference between Hyperion and MODIS of the sensorview and solar illumination angles increases the number ofimage pairs available for inter-calibration but increases un-certainty in results due to BRDF effects. Greater temporaldifferences between Hyperion and MODIS image acquisitionsalso increase the number of image pairs but increase uncertaintyin results due to surface and atmospheric changes.
The remainder of this section presents inter-calibration re-sults for the coincident and non-coincident cases. Reflectance-based approach results are presented as a baseline to evaluatedifferent inter-calibration scenarios. The first scenario reliesonly on a coincident inter-calibration data set (strictly notcoincident data, but with time differences of less than an hour)based on the nine dates shown for the reflectance-based results.This is followed by results from non-coincident image pairsbased on Terra and Aqua MODIS using the Railroad Valleytest site. The results are shown as percent difference accordingto (5).
A. Coincident Image Pair Results
There were nine successful reflectance-based calibration at-tempts where in-situ measurements of surface reflectance andatmospherics parameters were collected as Hyperion imaged
1314 IEEE TRANSACTIONS ON GEOSCIENCE AND REMOTE SENSING, VOL. 51, NO. 3, MARCH 2013
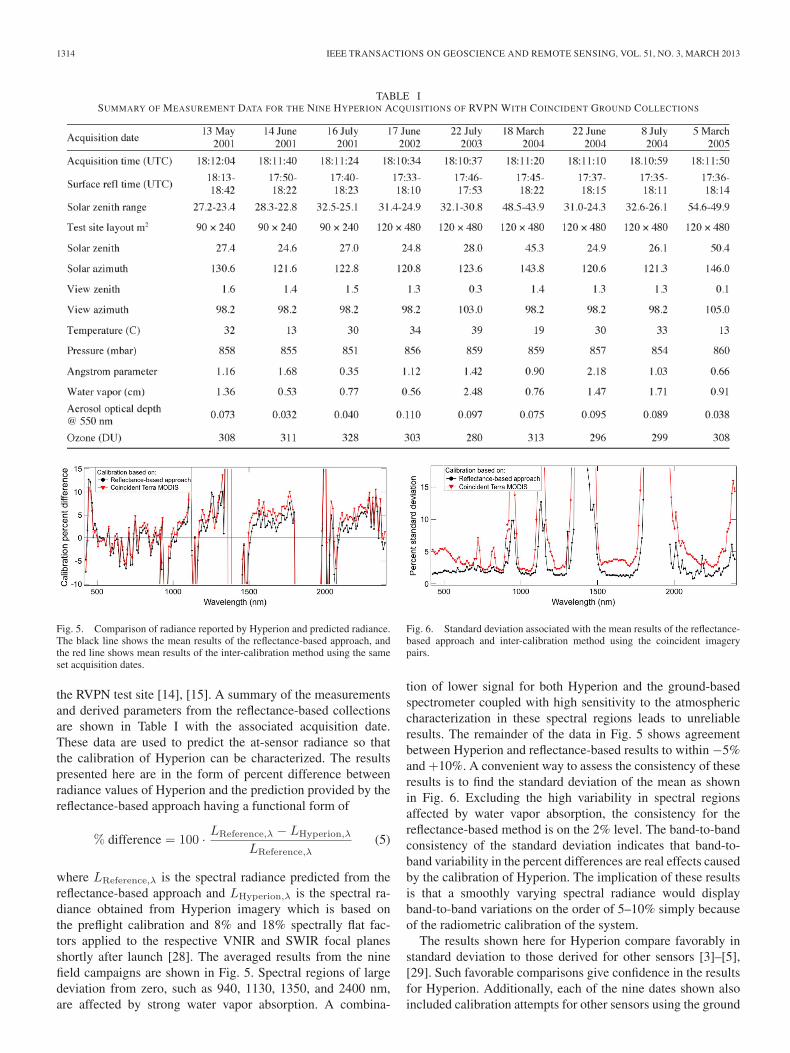
TABLE ISUMMARY OF MEASUREMENT DATA FOR THE NINE HYPERION ACQUISITIONS OF RVPN WITH COINCIDENT GROUND COLLECTIONS
Fig. 5. Comparison of radiance reported by Hyperion and predicted radiance.The black line shows the mean results of the reflectance-based approach, andthe red line shows mean results of the inter-calibration method using the sameset acquisition dates.
the RVPN test site [14], [15]. A summary of the measurementsand derived parameters from the reflectance-based collectionsare shown in Table I with the associated acquisition date.These data are used to predict the at-sensor radiance so thatthe calibration of Hyperion can be characterized. The resultspresented here are in the form of percent difference betweenradiance values of Hyperion and the prediction provided by thereflectance-based approach having a functional form of
% difference = 100 · LReference,λ − LHyperion,λ
LReference,λ(5)
where LReference,λ is the spectral radiance predicted from thereflectance-based approach and LHyperion,λ is the spectral ra-diance obtained from Hyperion imagery which is based onthe preflight calibration and 8% and 18% spectrally flat fac-tors applied to the respective VNIR and SWIR focal planesshortly after launch [28]. The averaged results from the ninefield campaigns are shown in Fig. 5. Spectral regions of largedeviation from zero, such as 940, 1130, 1350, and 2400 nm,are affected by strong water vapor absorption. A combina-
Fig. 6. Standard deviation associated with the mean results of the reflectance-based approach and inter-calibration method using the coincident imagerypairs.
tion of lower signal for both Hyperion and the ground-basedspectrometer coupled with high sensitivity to the atmosphericcharacterization in these spectral regions leads to unreliableresults. The remainder of the data in Fig. 5 shows agreementbetween Hyperion and reflectance-based results to within −5%and +10%. A convenient way to assess the consistency of theseresults is to find the standard deviation of the mean as shownin Fig. 6. Excluding the high variability in spectral regionsaffected by water vapor absorption, the consistency for thereflectance-based method is on the 2% level. The band-to-bandconsistency of the standard deviation indicates that band-to-band variability in the percent differences are real effects causedby the calibration of Hyperion. The implication of these resultsis that a smoothly varying spectral radiance would displayband-to-band variations on the order of 5–10% simply becauseof the radiometric calibration of the system.
The results shown here for Hyperion compare favorably instandard deviation to those derived for other sensors [3]–[5],[29]. Such favorable comparisons give confidence in the resultsfor Hyperion. Additionally, each of the nine dates shown alsoincluded calibration attempts for other sensors using the ground
MCCORKEL et al.: ABSOLUTE RADIOMETRIC CALIBRATION OF NARROW-SWATH IMAGING SENSORS 1315
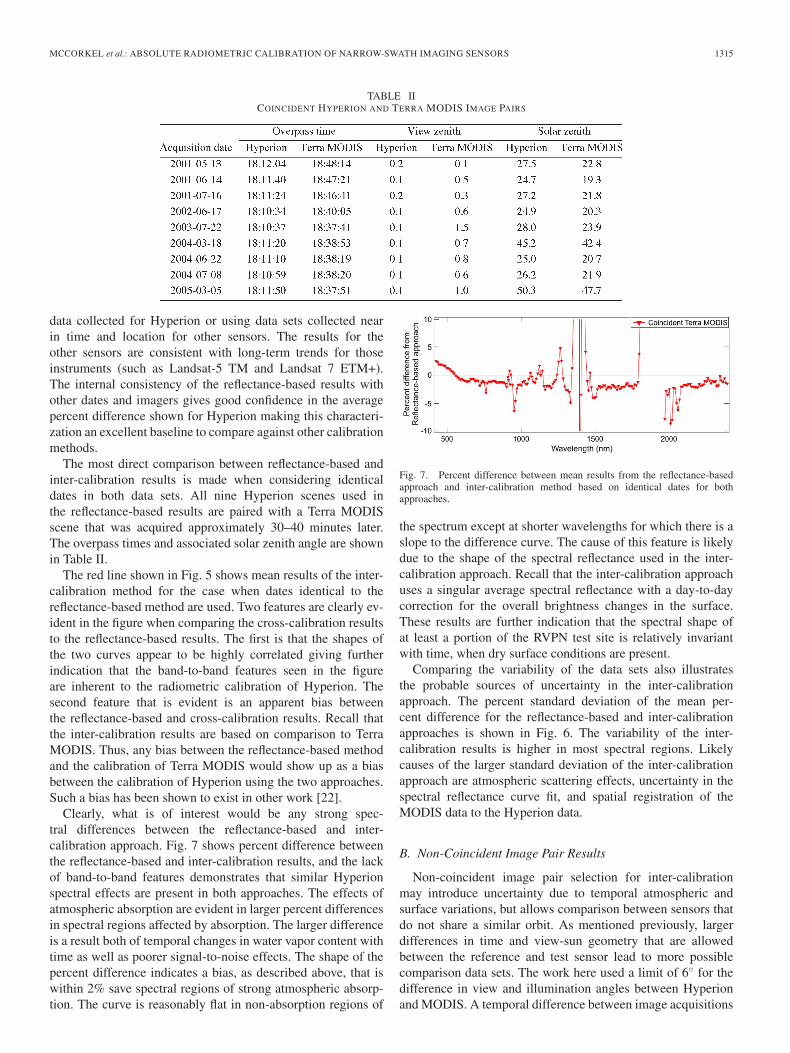
TABLE IICOINCIDENT HYPERION AND TERRA MODIS IMAGE PAIRS
data collected for Hyperion or using data sets collected nearin time and location for other sensors. The results for theother sensors are consistent with long-term trends for thoseinstruments (such as Landsat-5 TM and Landsat 7 ETM+).The internal consistency of the reflectance-based results withother dates and imagers gives good confidence in the averagepercent difference shown for Hyperion making this characteri-zation an excellent baseline to compare against other calibrationmethods.
The most direct comparison between reflectance-based andinter-calibration results is made when considering identicaldates in both data sets. All nine Hyperion scenes used inthe reflectance-based results are paired with a Terra MODISscene that was acquired approximately 30–40 minutes later.The overpass times and associated solar zenith angle are shownin Table II.
The red line shown in Fig. 5 shows mean results of the inter-calibration method for the case when dates identical to thereflectance-based method are used. Two features are clearly ev-ident in the figure when comparing the cross-calibration resultsto the reflectance-based results. The first is that the shapes ofthe two curves appear to be highly correlated giving furtherindication that the band-to-band features seen in the figureare inherent to the radiometric calibration of Hyperion. Thesecond feature that is evident is an apparent bias betweenthe reflectance-based and cross-calibration results. Recall thatthe inter-calibration results are based on comparison to TerraMODIS. Thus, any bias between the reflectance-based methodand the calibration of Terra MODIS would show up as a biasbetween the calibration of Hyperion using the two approaches.Such a bias has been shown to exist in other work [22].
Clearly, what is of interest would be any strong spec-tral differences between the reflectance-based and inter-calibration approach. Fig. 7 shows percent difference betweenthe reflectance-based and inter-calibration results, and the lackof band-to-band features demonstrates that similar Hyperionspectral effects are present in both approaches. The effects ofatmospheric absorption are evident in larger percent differencesin spectral regions affected by absorption. The larger differenceis a result both of temporal changes in water vapor content withtime as well as poorer signal-to-noise effects. The shape of thepercent difference indicates a bias, as described above, that iswithin 2% save spectral regions of strong atmospheric absorp-tion. The curve is reasonably flat in non-absorption regions of
Fig. 7. Percent difference between mean results from the reflectance-basedapproach and inter-calibration method based on identical dates for bothapproaches.
the spectrum except at shorter wavelengths for which there is aslope to the difference curve. The cause of this feature is likelydue to the shape of the spectral reflectance used in the inter-calibration approach. Recall that the inter-calibration approachuses a singular average spectral reflectance with a day-to-daycorrection for the overall brightness changes in the surface.These results are further indication that the spectral shape ofat least a portion of the RVPN test site is relatively invariantwith time, when dry surface conditions are present.
Comparing the variability of the data sets also illustratesthe probable sources of uncertainty in the inter-calibrationapproach. The percent standard deviation of the mean per-cent difference for the reflectance-based and inter-calibrationapproaches is shown in Fig. 6. The variability of the inter-calibration results is higher in most spectral regions. Likelycauses of the larger standard deviation of the inter-calibrationapproach are atmospheric scattering effects, uncertainty in thespectral reflectance curve fit, and spatial registration of theMODIS data to the Hyperion data.
B. Non-Coincident Image Pair Results
Non-coincident image pair selection for inter-calibrationmay introduce uncertainty due to temporal atmospheric andsurface variations, but allows comparison between sensors thatdo not share a similar orbit. As mentioned previously, largerdifferences in time and view-sun geometry that are allowedbetween the reference and test sensor lead to more possiblecomparison data sets. The work here used a limit of 6◦ for thedifference in view and illumination angles between Hyperionand MODIS. A temporal difference between image acquisitions
1316 IEEE TRANSACTIONS ON GEOSCIENCE AND REMOTE SENSING, VOL. 51, NO. 3, MARCH 2013
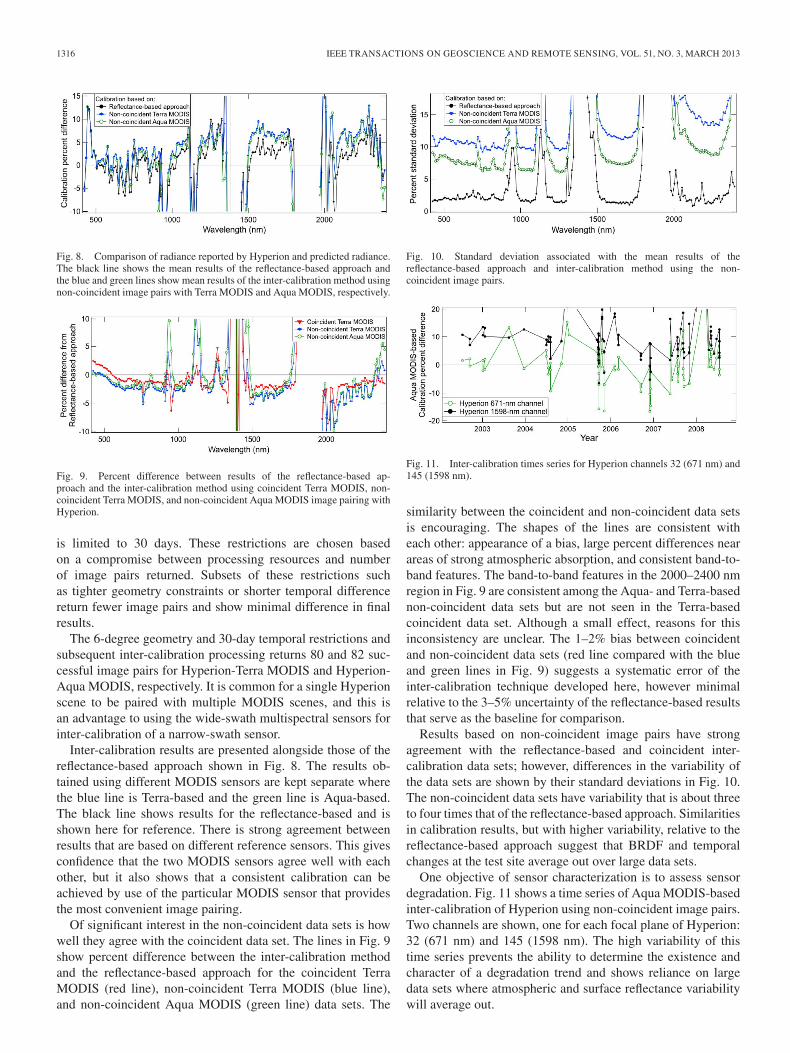
Fig. 8. Comparison of radiance reported by Hyperion and predicted radiance.The black line shows the mean results of the reflectance-based approach andthe blue and green lines show mean results of the inter-calibration method usingnon-coincident image pairs with Terra MODIS and Aqua MODIS, respectively.
Fig. 9. Percent difference between results of the reflectance-based ap-proach and the inter-calibration method using coincident Terra MODIS, non-coincident Terra MODIS, and non-coincident Aqua MODIS image pairing withHyperion.
is limited to 30 days. These restrictions are chosen basedon a compromise between processing resources and numberof image pairs returned. Subsets of these restrictions suchas tighter geometry constraints or shorter temporal differencereturn fewer image pairs and show minimal difference in finalresults.
The 6-degree geometry and 30-day temporal restrictions andsubsequent inter-calibration processing returns 80 and 82 suc-cessful image pairs for Hyperion-Terra MODIS and Hyperion-Aqua MODIS, respectively. It is common for a single Hyperionscene to be paired with multiple MODIS scenes, and this isan advantage to using the wide-swath multispectral sensors forinter-calibration of a narrow-swath sensor.
Inter-calibration results are presented alongside those of thereflectance-based approach shown in Fig. 8. The results ob-tained using different MODIS sensors are kept separate wherethe blue line is Terra-based and the green line is Aqua-based.The black line shows results for the reflectance-based and isshown here for reference. There is strong agreement betweenresults that are based on different reference sensors. This givesconfidence that the two MODIS sensors agree well with eachother, but it also shows that a consistent calibration can beachieved by use of the particular MODIS sensor that providesthe most convenient image pairing.
Of significant interest in the non-coincident data sets is howwell they agree with the coincident data set. The lines in Fig. 9show percent difference between the inter-calibration methodand the reflectance-based approach for the coincident TerraMODIS (red line), non-coincident Terra MODIS (blue line),and non-coincident Aqua MODIS (green line) data sets. The
Fig. 10. Standard deviation associated with the mean results of thereflectance-based approach and inter-calibration method using the non-coincident image pairs.
Fig. 11. Inter-calibration times series for Hyperion channels 32 (671 nm) and145 (1598 nm).
similarity between the coincident and non-coincident data setsis encouraging. The shapes of the lines are consistent witheach other: appearance of a bias, large percent differences nearareas of strong atmospheric absorption, and consistent band-to-band features. The band-to-band features in the 2000–2400 nmregion in Fig. 9 are consistent among the Aqua- and Terra-basednon-coincident data sets but are not seen in the Terra-basedcoincident data set. Although a small effect, reasons for thisinconsistency are unclear. The 1–2% bias between coincidentand non-coincident data sets (red line compared with the blueand green lines in Fig. 9) suggests a systematic error of theinter-calibration technique developed here, however minimalrelative to the 3–5% uncertainty of the reflectance-based resultsthat serve as the baseline for comparison.
Results based on non-coincident image pairs have strongagreement with the reflectance-based and coincident inter-calibration data sets; however, differences in the variability ofthe data sets are shown by their standard deviations in Fig. 10.The non-coincident data sets have variability that is about threeto four times that of the reflectance-based approach. Similaritiesin calibration results, but with higher variability, relative to thereflectance-based approach suggest that BRDF and temporalchanges at the test site average out over large data sets.
One objective of sensor characterization is to assess sensordegradation. Fig. 11 shows a time series of Aqua MODIS-basedinter-calibration of Hyperion using non-coincident image pairs.Two channels are shown, one for each focal plane of Hyperion:32 (671 nm) and 145 (1598 nm). The high variability of thistime series prevents the ability to determine the existence andcharacter of a degradation trend and shows reliance on largedata sets where atmospheric and surface reflectance variabilitywill average out.
MCCORKEL et al.: ABSOLUTE RADIOMETRIC CALIBRATION OF NARROW-SWATH IMAGING SENSORS 1317
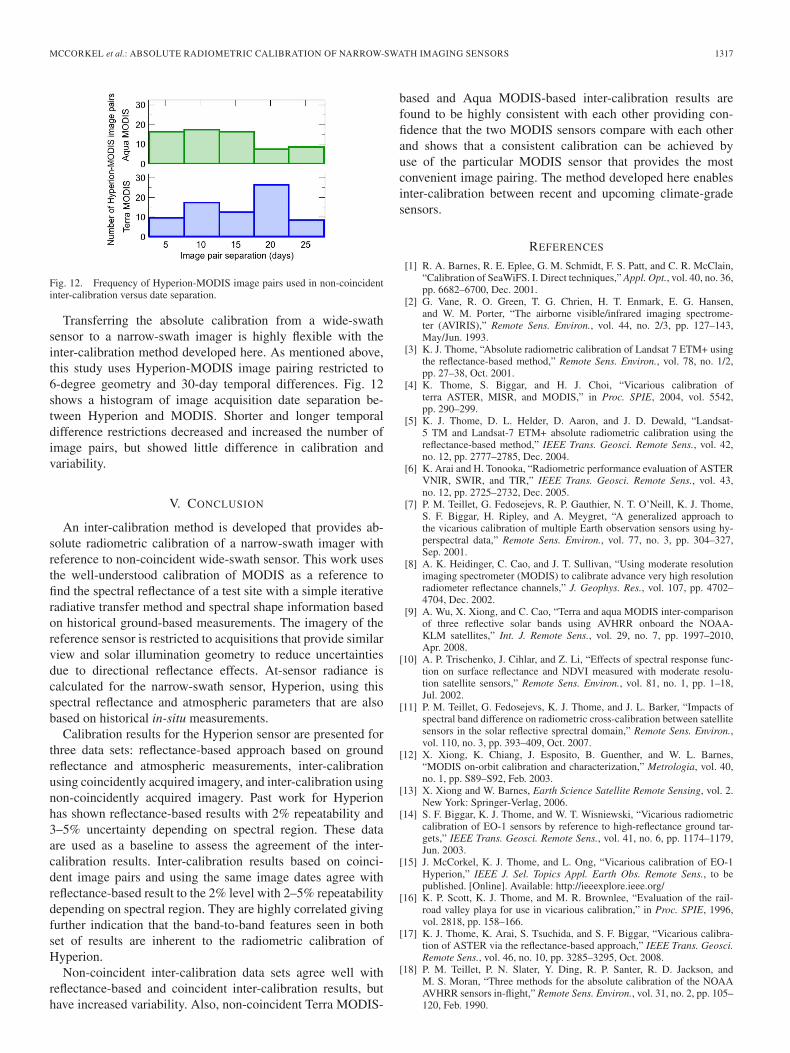
Fig. 12. Frequency of Hyperion-MODIS image pairs used in non-coincidentinter-calibration versus date separation.
Transferring the absolute calibration from a wide-swathsensor to a narrow-swath imager is highly flexible with theinter-calibration method developed here. As mentioned above,this study uses Hyperion-MODIS image pairing restricted to6-degree geometry and 30-day temporal differences. Fig. 12shows a histogram of image acquisition date separation be-tween Hyperion and MODIS. Shorter and longer temporaldifference restrictions decreased and increased the number ofimage pairs, but showed little difference in calibration andvariability.
V. CONCLUSION
An inter-calibration method is developed that provides ab-solute radiometric calibration of a narrow-swath imager withreference to non-coincident wide-swath sensor. This work usesthe well-understood calibration of MODIS as a reference tofind the spectral reflectance of a test site with a simple iterativeradiative transfer method and spectral shape information basedon historical ground-based measurements. The imagery of thereference sensor is restricted to acquisitions that provide similarview and solar illumination geometry to reduce uncertaintiesdue to directional reflectance effects. At-sensor radiance iscalculated for the narrow-swath sensor, Hyperion, using thisspectral reflectance and atmospheric parameters that are alsobased on historical in-situ measurements.
Calibration results for the Hyperion sensor are presented forthree data sets: reflectance-based approach based on groundreflectance and atmospheric measurements, inter-calibrationusing coincidently acquired imagery, and inter-calibration usingnon-coincidently acquired imagery. Past work for Hyperionhas shown reflectance-based results with 2% repeatability and3–5% uncertainty depending on spectral region. These dataare used as a baseline to assess the agreement of the inter-calibration results. Inter-calibration results based on coinci-dent image pairs and using the same image dates agree withreflectance-based result to the 2% level with 2–5% repeatabilitydepending on spectral region. They are highly correlated givingfurther indication that the band-to-band features seen in bothset of results are inherent to the radiometric calibration ofHyperion.
Non-coincident inter-calibration data sets agree well withreflectance-based and coincident inter-calibration results, buthave increased variability. Also, non-coincident Terra MODIS-
based and Aqua MODIS-based inter-calibration results arefound to be highly consistent with each other providing con-fidence that the two MODIS sensors compare with each otherand shows that a consistent calibration can be achieved byuse of the particular MODIS sensor that provides the mostconvenient image pairing. The method developed here enablesinter-calibration between recent and upcoming climate-gradesensors.
REFERENCES
[1] R. A. Barnes, R. E. Eplee, G. M. Schmidt, F. S. Patt, and C. R. McClain,“Calibration of SeaWiFS. I. Direct techniques,” Appl. Opt., vol. 40, no. 36,pp. 6682–6700, Dec. 2001.
[2] G. Vane, R. O. Green, T. G. Chrien, H. T. Enmark, E. G. Hansen,and W. M. Porter, “The airborne visible/infrared imaging spectrome-ter (AVIRIS),” Remote Sens. Environ., vol. 44, no. 2/3, pp. 127–143,May/Jun. 1993.
[3] K. J. Thome, “Absolute radiometric calibration of Landsat 7 ETM+ usingthe reflectance-based method,” Remote Sens. Environ., vol. 78, no. 1/2,pp. 27–38, Oct. 2001.
[4] K. Thome, S. Biggar, and H. J. Choi, “Vicarious calibration ofterra ASTER, MISR, and MODIS,” in Proc. SPIE, 2004, vol. 5542,pp. 290–299.
[5] K. J. Thome, D. L. Helder, D. Aaron, and J. D. Dewald, “Landsat-5 TM and Landsat-7 ETM+ absolute radiometric calibration using thereflectance-based method,” IEEE Trans. Geosci. Remote Sens., vol. 42,no. 12, pp. 2777–2785, Dec. 2004.
[6] K. Arai and H. Tonooka, “Radiometric performance evaluation of ASTERVNIR, SWIR, and TIR,” IEEE Trans. Geosci. Remote Sens., vol. 43,no. 12, pp. 2725–2732, Dec. 2005.
[7] P. M. Teillet, G. Fedosejevs, R. P. Gauthier, N. T. O’Neill, K. J. Thome,S. F. Biggar, H. Ripley, and A. Meygret, “A generalized approach tothe vicarious calibration of multiple Earth observation sensors using hy-perspectral data,” Remote Sens. Environ., vol. 77, no. 3, pp. 304–327,Sep. 2001.
[8] A. K. Heidinger, C. Cao, and J. T. Sullivan, “Using moderate resolutionimaging spectrometer (MODIS) to calibrate advance very high resolutionradiometer reflectance channels,” J. Geophys. Res., vol. 107, pp. 4702–4704, Dec. 2002.
[9] A. Wu, X. Xiong, and C. Cao, “Terra and aqua MODIS inter-comparisonof three reflective solar bands using AVHRR onboard the NOAA-KLM satellites,” Int. J. Remote Sens., vol. 29, no. 7, pp. 1997–2010,Apr. 2008.
[10] A. P. Trischenko, J. Cihlar, and Z. Li, “Effects of spectral response func-tion on surface reflectance and NDVI measured with moderate resolu-tion satellite sensors,” Remote Sens. Environ., vol. 81, no. 1, pp. 1–18,Jul. 2002.
[11] P. M. Teillet, G. Fedosejevs, K. J. Thome, and J. L. Barker, “Impacts ofspectral band difference on radiometric cross-calibration between satellitesensors in the solar reflective sprectral domain,” Remote Sens. Environ.,vol. 110, no. 3, pp. 393–409, Oct. 2007.
[12] X. Xiong, K. Chiang, J. Esposito, B. Guenther, and W. L. Barnes,“MODIS on-orbit calibration and characterization,” Metrologia, vol. 40,no. 1, pp. S89–S92, Feb. 2003.
[13] X. Xiong and W. Barnes, Earth Science Satellite Remote Sensing, vol. 2.New York: Springer-Verlag, 2006.
[14] S. F. Biggar, K. J. Thome, and W. T. Wisniewski, “Vicarious radiometriccalibration of EO-1 sensors by reference to high-reflectance ground tar-gets,” IEEE Trans. Geosci. Remote Sens., vol. 41, no. 6, pp. 1174–1179,Jun. 2003.
[15] J. McCorkel, K. J. Thome, and L. Ong, “Vicarious calibration of EO-1Hyperion,” IEEE J. Sel. Topics Appl. Earth Obs. Remote Sens., to bepublished. [Online]. Available: http://ieeexplore.ieee.org/
[16] K. P. Scott, K. J. Thome, and M. R. Brownlee, “Evaluation of the rail-road valley playa for use in vicarious calibration,” in Proc. SPIE, 1996,vol. 2818, pp. 158–166.
[17] K. J. Thome, K. Arai, S. Tsuchida, and S. F. Biggar, “Vicarious calibra-tion of ASTER via the reflectance-based approach,” IEEE Trans. Geosci.Remote Sens., vol. 46, no. 10, pp. 3285–3295, Oct. 2008.
[18] P. M. Teillet, P. N. Slater, Y. Ding, R. P. Santer, R. D. Jackson, andM. S. Moran, “Three methods for the absolute calibration of the NOAAAVHRR sensors in-flight,” Remote Sens. Environ., vol. 31, no. 2, pp. 105–120, Feb. 1990.
1318 IEEE TRANSACTIONS ON GEOSCIENCE AND REMOTE SENSING, VOL. 51, NO. 3, MARCH 2013
[19] F. Cabot, O. Hagolle, and P. Henry, “Relative and multitemporal cal-ibration of AVHRR, SeaWiFS, and VEGETATION using POLDERcharacterization of desert sites,” in Proc. IEEE IGARSS, 2000, vol. 5,pp. 2188–2190.
[20] D. M. O’Brien and R. M. Mitchell, “An error budget for cross-calibrationof AVHRR short-wave channels against ASTR-2,” Remote Sens. Environ.,vol. 75, no. 2, pp. 216–229, Feb. 2001.
[21] P. M. Teillet, J. L. Barker, B. L. Markham, R. R. Irish, G. Fedosejevs, andJ. C. Storey, “Radiometric cross-calibration of the Landsat-7 ETM+ andLandsat-5 TM sensors based on tandem data sets,” Remote Sens. Environ.,vol. 78, no. 1/2, pp. 39–54, Oct. 2001.
[22] K. J. Thome, E. E. Whittington, and N. Smith, “Radiometric calibrationof MODIS with reference to Landsat-7 ETM+,” in Proc. SPIE, 2002,vol. 4483, pp. 203–210.
[23] G. Chander, D. J. Meyer, and D. L. Helder, “Cross calibration of theLandsat-7 ETM+ and EO-1 ALI sensor,” IEEE Trans. Geosci. RemoteSens., vol. 42, no. 12, pp. 2821–2831, Dec. 2004.
[24] L. Nguyen, D. R. Doelling, P. Minnis, and J. K. Ayers, “Rapid techniqueto cross calibrate satellite imager visible channels,” in Proc. SPIE, 2004,vol. 5542, pp. 227–235.
[25] P. M. Teillet, B. L. Markham, and R. R. Irish, “Landsat cross-calibrationbased on near simultaneous imaging of common ground targets,” RemoteSens. Environ., vol. 102, no. 3/4, pp. 264–270, Jun. 2006.
[26] G. Meister, B. A. Franz, E. J. Kwiatkowska, and C. R. McClain, “Cor-rections to the calibration of MODIS aqua ocean color bands derivedfrom SeaWiFS data,” IEEE Trans. Geosci. Remote Sens., vol. 50, no. 1,pp. 310–319, Jan. 2012.
[27] N. Leisso and K. Thome, “Effect of atmospheric characterization on thereflectance based vicarious method of radiometric calibration of Landsat7 ETM+,” in Proc. 15th Annu. CALCON Tech. Conf., Logan, UT, 2005.
[28] J. S. Pearlman, P. S. Barry, C. C. Segal, J. Shepanski, D. Beiso, andS. L. Carman, “Hyperion, a space-based imaging spectrometer,” IEEETrans. Geosci. Remote Sens., vol. 41, no. 6, pp. 1160–1173, Jun. 2003.
[29] J. McCorkel, K. T. Thome, S. F. Biggar, and M. J. Kuester, “Radiometriccalibration of advanced land imager using reflectance-based results be-tween 2001 and 2005,” in Proc. SPIE, 2006, vol. 6296, p. 62 960G.
Joel McCorkel received the B.S. degree in opticalengineering and the Ph.D. degree in optical sciencesfrom the University of Arizona, Tucson.
He joined the National Ecological ObservatoryNetwork as a Staff Scientist for the AirborneObservation Platform in 2009. Currently, he isa Physical Scientist in the Biospheric SciencesLaboratory at NASA’s Goddard Space Flight Center,Greenbelt, MD.
Kurtis Thome received the B.S. degree in meteorol-ogy from Texas A&M University, College Station,and the M.S. and Ph.D. degrees in atmospheric sci-ences from the University of Arizona, Tucson.
He then joined what is now the College of OpticalSciences becoming a Full Professor in 2006. Heserved as the Director of the Remote Sensing Groupfrom 1997 to 2008. He moved to NASA’s GoddardSpace Flight Center in 2008 as a Physical Scientistin the Biospheric Sciences Laboratory. He has beena member of the Landsat-7, ASTER, MODIS, and
EO-1 Science Teams providing vicarious calibration results for those andother imaging sensors. He is the Instrument Scientist for the Visible InfraredImaging Radiometer Suite on the Joint Polar Satellite System, and is servingas the Calibration Lead for the Thermal Infrared Sensor on the Landsat DataContinuity Mission. He is the Deputy Project Scientist for CLARREO forwhich he is also the Instrument Lead for the Reflected Solar Instrument.
Dr. Thome is a Fellow of SPIE.
Ronald B. Lockwood received the B.A. degree fromTexas Tech University, Lubbock and the M.S. andPh.D. degrees from the University of Wisconsin,Madison, all in physics.
He is a member of the technical staff at MIT Lin-coln Laboratory, Lexington, MA. Previously, from1993 through 2009, he worked in the Space VehiclesDirectorate and its predecessor organizations at theAir Force Research Laboratory at Hanscom AFB,MA. He was the Deputy Principal Investigator forthe ARTEMIS payload, a space-based imaging spec-
trometer, where his work focused on the sensor calibration and performance.He continues to develop technology for spectral remote sensing applications atthe MIT Lincoln Laboratory.