absolute calibration method for nanosecond-resolved, time … · provide a calibration curve for...
TRANSCRIPT

SANDIA REPORT SAND2010-2470 Unlimited Release Printed April 2010
Absolute Calibration Method for Nanosecond-Resolved, Time-Streaked, Fiber Optic Light Collection, Spectroscopy Systems Mark D. Johnston, Bryan V. Oliver, Darryl W. Droemer, Brent Frogget, Marlon D. Crain, Yitzhak Maron Prepared by Sandia National Laboratories Albuquerque, New Mexico 87185 and Livermore, California 94550
Sandia National Laboratories is a multi-program laboratory operated by Sandia Corporation, a wholly owned subsidiary of Lockheed Martin Corporation, for the U.S. Department of Energy's National Nuclear Security Administration under contract DE-AC04-94AL85000.
Approved for public release; further dissemination unlimited.
2
Issued by Sandia National Laboratories, operated for the United States Department of Energy by Sandia Corporation. NOTICE: This report was prepared as an account of work sponsored by an agency of the United States Government. Neither the United States Government, nor any agency thereof, nor any of their employees, nor any of their contractors, subcontractors, or their employees, make any warranty, express or implied, or assume any legal liability or responsibility for the accuracy, completeness, or usefulness of any information, apparatus, product, or process disclosed, or represent that its use would not infringe privately owned rights. Reference herein to any specific commercial product, process, or service by trade name, trademark, manufacturer, or otherwise, does not necessarily constitute or imply its endorsement, recommendation, or favoring by the United States Government, any agency thereof, or any of their contractors or subcontractors. The views and opinions expressed herein do not necessarily state or reflect those of the United States Government, any agency thereof, or any of their contractors. Printed in the United States of America. This report has been reproduced directly from the best available copy. Available to DOE and DOE contractors from U.S. Department of Energy Office of Scientific and Technical Information P.O. Box 62 Oak Ridge, TN 37831 Telephone: (865) 576-8401 Facsimile: (865) 576-5728 E-Mail: [email protected] Online ordering: http://www.osti.gov/bridge Available to the public from U.S. Department of Commerce National Technical Information Service 5285 Port Royal Rd. Springfield, VA 22161 Telephone: (800) 553-6847 Facsimile: (703) 605-6900 E-Mail: [email protected] Online order: http://www.ntis.gov/help/ordermethods.asp?loc=7-4-0#online

3
SAND2010-2470 Unlimited Release Printed April 2010
Absolute Calibration Method for Fast-Streaked, Fiber Optic Light Collection, Spectroscopy
Systems
Mark D. Johnston1 and Bryan V. Oliver
Advanced Radiographic Technologies Department
Sandia National Laboratories P.O. Box 5800
Albuquerque, New Mexico 87185-1195
Darryl W. Droemer, Brent Frogget, and Marlon D. Crain National Security Technologies, LLC
P.O. Box 98521 Las Vegas, NV 89193
Yitzhak Maron
Weizmann Institute of Science Rehovot, Israel 76100
Abstract
This report outlines a convenient method to calibrate fast (<1ns resolution) streaked, fiber optic light collection, spectroscopy systems. Such a system is used to collect spectral data on plasmas generated in the A-K gap of electron beam diodes fielded on the RITS-6 accelerator (8-12MV, 140-200kA). On RITS, light is collected through a small diameter (200 micron) optical fiber and recorded on a fast streak camera at the output of 1 meter Czerny-Turner monochromator (F/7 optics). To calibrate such a system, it is necessary to efficiently couple light from a spectral lamp into a 200 micron diameter fiber, split it into its spectral components, with 10 Angstroms or less resolution, and record it on a streak camera with 1ns or less temporal resolution. One method of doing this is with a DC short arc lamp. For this report, a 300W xenon arc lamp (Oriel Model 6258) was used. Since the radiance of the xenon arc varies from the cathode to the anode, just the area around the tip of the cathode (“hotspot”) was imaged onto the fiber producing the highest intensity output. To compensate for chromatic aberrations, the signal was optimized at each wavelength measured. Output power at each wavelength was measured using 10nm bandpass interference filters and a calibrated photodetector. These measurements give power at discrete wavelengths across the spectrum, and when linearly interpolated, provide a calibration curve for the lamp. The fiber is then attached to the entrance of the monochromator and a spectrum is taken. The shape of the spectrum is determined by the collective responsivity of the optics, monochromator, and streak tube across the spectral region of interest. The ratio of this curve to the measured bandpass filter curve at each
4
wavelength produces a correction factor (Q) curve. This curve is then applied to the experimental data and the resultant spectra are given in absolute intensity units (photons/sec/cm2/steradian/nm). Error analysis shows this method to be accurate to within +/- 20%. 1Email: [email protected]

5
Acknowledgements I would like to thank all of the authors for their various contributions to this report. Bryan Oliver as manager of the Advanced Radiographic Technologies Department (1645) provided much guidance and support. Darryl Droemer as manager of the on-site National Security Technologies (NSTec) group has provided continual support for the diagnostics fielded on RITS. Brent Frogget from NSTec Los Alamos Operations provided the optical simulations. Marlon Crain from NSTec provided technical support. Prof. Yitzak Maron has been a close collaborator for many years on radiographic diodes and plasma spectroscopy. His analyses and discussions have proven invaluable. Finally, I would like to personally recognize my father, Dr. Clare C. Johnston, who passed away last year during the time this work was being completed. His interests in spectroscopy and physics led to numerous discussions regarding the work I was doing on RITS. These discussions helped to strengthen my research and this report. He will be missed. Sandia National Laboratories is a multi-program laboratory operated by Sandia Corporation, a wholly owned subsidiary of Lockheed Martin Corporation, for the U.S. Department of Energy's National Nuclear Security Administration under contract DE-AC04-94AL85000.

6

7
Table of Contents
LIST OF FIGURES ...................................................................................................................................... 8
LIST OF TABLES........................................................................................................................................ 9
I. INTRODUCTION ................................................................................................................................... 11
II. Experimental Configuration ............................................................................................................. 11
III. Arc Lamp Measurements ................................................................................................................. 12
IV. Calibration of Streaked Arc Lamp Spectra ................................................................................ 17
V. Calibration of Experimental Data................................................................................................... 19
VI. Error Analysis.................................................................................................................................... 26
VII. Conclusions ...................................................................................................................................... 27
8
List of Figures
Figure 1. Focusing optics for SMP diode experiments..................................................... 11 Figure 2. Arc lamp angular intensity distribution (Courtesy of Oriel). ............................ 12 Figure 3. Typical arc intensity distribution for a low power xenon arc lamp (Courtesy of Oriel)............................................................................................................ 13 Figure 4. Measured Total Lamp Radiance and Linear Curve-Fit for 300W Xenon Arc Lamp. ............................................................................................. 14 Figure 5. DC Arc Lamp Spectral Curves (courtesy of Oriel). Plotted on a log scale....... 15 Figure 6. Spectral irradiance curve for a 5J xenon flashlamp (courtesy of Oriel)............ 15 Figure 7. Focal spot position versus wavelength. ............................................................. 16 Figure 8. 300W Xenon Arc lamp calibration curves. ....................................................... 16 Figure 9. Streaked spectra of a 300W xenon arc lamp (360ns recorded). ........................ 17 Figure 10. 300W xenon arc lamp streaked spectrum (raw data). ..................................... 18 Figure 11. Correction (Q) curve obtained for 300W xenon arc lamp............................... 19 Figure 12. Corrected 300W xenon arc lamp raw streaked spectrum (brown curve) overplotted with measured bandpass filter curves. ........................................................... 19 Figure 13. Self-Magnetic Pinch Diode Streaked Spectra. ................................................ 20 Figure 14. SMP diode 5ns integrated spectral lineouts (raw data). .................................. 21 Figure 15. SMP diode 5ns integrated spectral lineouts in absolute units. ........................ 21 Figure 16. Light collection efficiency versus wavelength. ............................................... 22 Figure 17. Examples of fiber optic imaging of a plane source at various wavelengths. .. 23 Figure 18. Focal Spot size at centerline at 500nm (Code V Illumination Analysis). ....... 23 Figure 19. Focal spot size at centerline at 405nm (Code V Illumination Analysis). ........ 24 Figure 20. SMP Diode streaked spectra (corrected). ........................................................ 25 Figure 21. Streak camera linearity response measurements using HeNe laser source. .... 25

9
List of Tables
Table 1. 300W xenon arc lamp calibration measurements and corrections. .................... 14 Table 2. Components and associated errors in absolute spectral intensity measurements............................................................................................................................................ 26

10

11
I. Introduction Streak camera spectra are used to collect time-resolved information on plasmas generated within the vacuum (A-K gap) region of radiographic diodes fielded on the RITS-6 accelerator [1,2]. One of the challenges to performing these types of measurements is to accurately calibrate the intensity in terms of absolute units. The reason for this difficulty is that the sweep speed of the streak camera is fast (<10ns/mm), so the calibration source needs to be very intense to be measured. Most calibration lamp sources (ex. tungsten lamps) are not sufficiently bright to be measured with this system. Arc lamps (xenon and mercury) provide sufficient intensity, but efficient coupling of the arc onto the small optical fibers (200 micron diameter) used in these experiments is difficult. Lasers provide another means of obtaining sufficient intensities for streaked calibrations; however, multiple laser lines at several wavelengths are required to obtain an adequate curve for calibration purposes. Arc lamps can be DC or pulsed. Pulsed arc lamps are brighter, but have a wavelength-dependant, time-varying spectra over a few microseconds pulsewidth, which makes absolute measurements difficult. In contrast, DC arc lamps have very stable outputs, but are less intense per unit time, meaning the calibration data often needs to be extrapolated to the intensity levels of the experimental data. Still the advantage of having a DC source makes up for the lack of signal intensity, so for our experiments, a 300W DC xenon arc lamp (Oriel Model 6258) was chosen, since its spectrum is relatively flat through the visible region as compared with mercury or pulsed xenon arc lamps (see figures 5 and 6) [3]. II. Experimental Configuration
Figure 1. Focusing optics for SMP diode experiments.
Figure 1 shows the optics used to collect the light from the A-K region of the electron beam diode. A lens/fiber assembly is attached to the outside of the RITS vacuum chamber. Light from a 1.0mm diameter region at the center of the chamber is collected through a 50mm diameter, 150mm focal length achromatic lens (Edmund Optics 32-886) and reimaged onto a 200 micron diameter, fused silica optical fiber (Polymicro
177.8mm + 6.75mm = 184.6mm
48.2 mm
756mm + distance to lens 20.0mm + half lens thickness (6.75mm) = 782.8mm
1.0mm focal spot
11x1 linear array
Flange 19.1mm
3” Glass Windows: 6.5mm thickness (uncoated) Open Aperture: 59.0mm
Baffle 80mm
38mm

12
Technologies FVP200220240), which is part of an 11x1 fiber array. The optical fiber transits the light 10 meters into a shielded screenroom, where it is refocused onto the entrance slit of a 1 meter McPherson monochromator (Model 2061) (operated as a spectrometer) [4] and recorded on an NSTec L-CA-24 streak camera [5,6] with a Spectral Instruments SI 800 CCD readout [7].
III. Arc Lamp Measurements To calibrate this setup, we need to collect light through the entire system as fielded on the RITS experiments. This allows the system to be corrected as a whole rather than correcting for each component individually. To begin, we need to know the calibration curve for the arc lamp. This is measured directly using a calibrated photodetector (Ophir Model PD300-UV) and a series of calibrated 10nm bandpass interference filters (Melles-Griot). The photodetector/bandpass filters measure the lamp’s irradiance at 50cm with no optics. The photodetector measures power per unit area (1cm2) of photon flux hitting the detector surface at 50cm from the source. This measurement is dependent on the position of the detector from the source and falls off as 1/ (distance) 2. The arc lamp emits light in 4 steradians; however, due to shadowing from the electrodes, there is an angular dependence (figure 2) to the output. To eliminate the need to correct for this shadowing effect, measurements are taken at 90o (perpendicular to the axis of the arc) [3].
Figure 2. Arc lamp angular intensity distribution (Courtesy of Oriel) [3].
By determining the solid angle subtended by the detector, one can obtain the power radiated per unit wavelength per solid angle. Taking this value over a sphere, gives the total power radiated per unit wavelength. The integral of this value over all wavelengths is the total power output for the lamp (300W minus any convective heat losses).

13
Knowing the arc dimensions, one can determine an average spectral radiance for the lamp; however, the actual radiance varies with position as seen in figure 3 [3].
Figure 3. Typical arc intensity distribution for a low power xenon arc lamp
(Courtesy of Oriel) [3]. The spectral radiance (W/cm2/steradian/nm) can be converted into spectral intensity which gives power in units of photons per second (Photons/sec/cm2/steradian/nm) using the following fundamental relationships, where E is energy, h is Planck’s constant, c is the speed of light, and is wavelength [8].
hcEN
hcE
1 (Equation 1)
This gives the total number of photons (N) per unit wavelength emitted from the arc. Examples of the measurements and calculations for the 300W xenon arc lamp used on the RITS experiments are given in Table 1.

14
Table 1. 300W xenon arc lamp calibration measurements and corrections.
Plotted over all wavelengths, this gives the calibration curve for the lamp (figure 4). This is a smooth curve derived from a finite number of points each integrated over 10nm FWHM bands through the visible region. A representative spectrum for the lamp from the manufacturer is given in figure 5 [3]. By increasing the number of points measured and decreasing the filter widths, the curve shape in figure 4 would approach that of figure 5. For example, this could be done using a scanning monochromator into a photomultiplier tube; however, for our purposes, the method employed here is simpler and introduces little error. Since the optical system only collects a portion of the total light emitted by the arc, we need to redo this measurement using the experimental optics (figure 1). The focal spot size of the fiber/lens assembly is smaller than the arc, and since the arc’s radiance varies with position (figure 3), what is measured is an average radiance. To try and get as much light as possible into the fiber, the fiber is focused onto the tip of the cathode. Since we are focusing using glass optics (achromat) over a wide spectral region, the focal distance varies with wavelength as shown in figure 7.
y = 2E+15x + 1E+17
R2 = 0.9462
0.0E+00
2.0E+17
4.0E+17
6.0E+17
8.0E+17
1.0E+18
1.2E+18
1.4E+18
1.6E+18
400 450 500 550 600 650
Wavelength (nm)
Sp
ec
tra
l In
ste
ns
ity
(P
ho
ton
s/s
ec
/cm
^2
/sr/
nm
)
Total Lamp Radiance Curve
Linear Curve-Fit
Figure 4. Measured Total Lamp Radiance and Linear Curve-Fit
for 300W Xenon Arc Lamp.

15
Figure 5. DC Arc Lamp Spectral Curves (courtesy of Oriel). Plotted on a log scale [3].
Figure 6. Spectral irradiance curve for a 5J xenon flashlamp (courtesy of Oriel) [3].
5J Xenon Flashlamp
DC Arc Lamps
100W Hg 100W Xe
300W Xe

16
Figure 7. Focal spot position versus wavelength.
Since the collection efficiency of the optics varies with wavelength, the focus is optimized for one wavelength near the center (500nm in our case), causing the low and high wavelengths to be slightly defocused. Measuring the arc lamp’s spectrum in this manner produces a curve (blue curve in figure 8), which is compared with the total radiance curve (figure 4), to correct for the shape. The lamp’s radiance is then measured through the experimental optics with the focus adjusted for each wavelength. This curve (shown in red in figure 8) has the correct shape, i.e. that of the original radiance curve, but a different intensity level (27% variation) due to the different areas of the arc measured with and without the experimental optics. Corrections are also made for optical transmission losses through reflections and absorptions which reduce the total throughput of the system by 25%, i.e. 4% transmission losses per uncoated optical surface [9].
y = 2E+15x + 3E+16
R2 = 0.9054
0.0E+00
2.0E+17
4.0E+17
6.0E+17
8.0E+17
1.0E+18
1.2E+18
1.4E+18
1.6E+18
400 450 500 550 600 650
Wavelength (nm)
Sp
ectr
al
Ins
ten
sit
y (
Ph
oto
ns
/sec
/cm
^2
/sr/
nm
)
Focus optimized at 500nm(blue curve)
Focus optimized at each wavelength (red curve)
Total Lamp Radiance Curve (green curve)
Figure 8. 300W Xenon Arc lamp calibration curves.
150mm Achromatic Lens

17
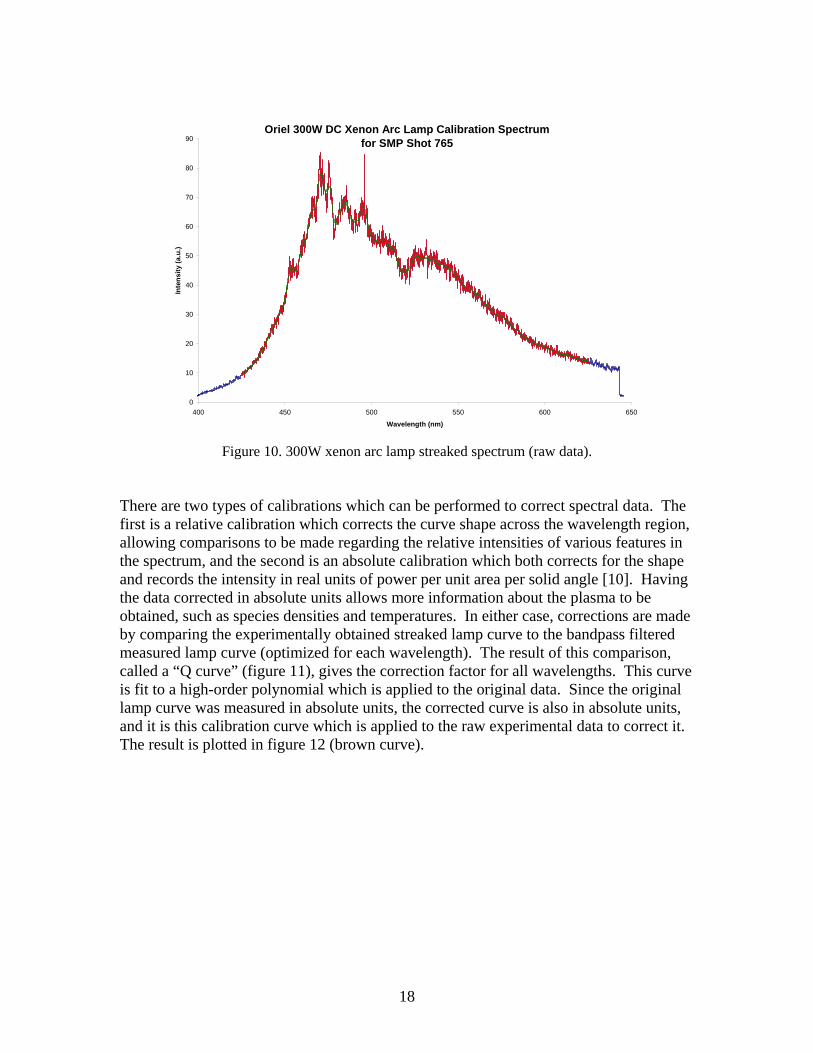
IV. Calibration of Streaked Arc Lamp Spectra Once the correct lamp calibration curve is obtained using the experimental optics (red curve in figure 8), then the lamp spectrum is measured through the monochromator/streak camera system. Figure 9 shows the raw spectral image obtained for the 300W xenon arc lamp (corrected for wavelength). The sweep speed is 9.6ns/millimeter and the entire image records 360ns from top to bottom. Figure 10 shows an averaged lineout over a portion of the central region of the image. The red curve is the raw spectrum, and superimposed on it is the smoothed green curve. The sides (blue portions) are removed from the analyses to avoid errors due to decreased sensitivity near the edges.
Figure 9. Streaked spectra of a 300W xenon arc lamp (360ns recorded).
Time
360ns
18
Figure 10. 300W xenon arc lamp streaked spectrum (raw data). There are two types of calibrations which can be performed to correct spectral data. The first is a relative calibration which corrects the curve shape across the wavelength region, allowing comparisons to be made regarding the relative intensities of various features in the spectrum, and the second is an absolute calibration which both corrects for the shape and records the intensity in real units of power per unit area per solid angle [10]. Having the data corrected in absolute units allows more information about the plasma to be obtained, such as species densities and temperatures. In either case, corrections are made by comparing the experimentally obtained streaked lamp curve to the bandpass filtered measured lamp curve (optimized for each wavelength). The result of this comparison, called a “Q curve” (figure 11), gives the correction factor for all wavelengths. This curve is fit to a high-order polynomial which is applied to the original data. Since the original lamp curve was measured in absolute units, the corrected curve is also in absolute units, and it is this calibration curve which is applied to the raw experimental data to correct it. The result is plotted in figure 12 (brown curve).
Oriel 300W DC Xenon Arc Lamp Calibration Spectrum for SMP Shot 765
0
10
20
30
40
50
60
70
80
90
400 450 500 550 600 650
Wavelength (nm)
Inte
ns
ity
(a.u
.)

19
Q Curve for Shot 765 (Pixels 1275-1675)
y = 5.499116983E+02x6 - 9.569277683E+06x5 + 2.339538208E+10x4 - 2.428299904E+13x3 + 1.277661478E+16x2 - 3.374602964E+18x + 3.567745293E+20
R2 = 9.979948973E-010
1E+16
2E+16
3E+16
4E+16
5E+16
6E+16
7E+16
8E+16
9E+16
425 445 465 485 505 525 545 565 585 605 625
Wavelength (nm)
Inte
nsi
ty (
a.u
.)
Figure 11. Correction (Q) curve obtained for 300W xenon arc lamp.
y = 1.747224E+15x + 2.598466E+16
R2 = 9.054118E-01
0.0E+00
2.0E+17
4.0E+17
6.0E+17
8.0E+17
1.0E+18
1.2E+18
1.4E+18
1.6E+18
400 450 500 550 600 650
Wavelength (nm)
Sp
ec
tra
l In
ste
ns
ity
(P
ho
ton
s/s
ec/
cm
^2
/sr/
nm
)
Focus optimized at 500nm
Focus optimized at each wavelength
Total Lamp Radiance Curve
SMP Diode Optics1 meter calibration fiber used
Lamp Curve
Figure 12. Corrected 300W xenon arc lamp raw streaked spectrum (brown curve) overplotted
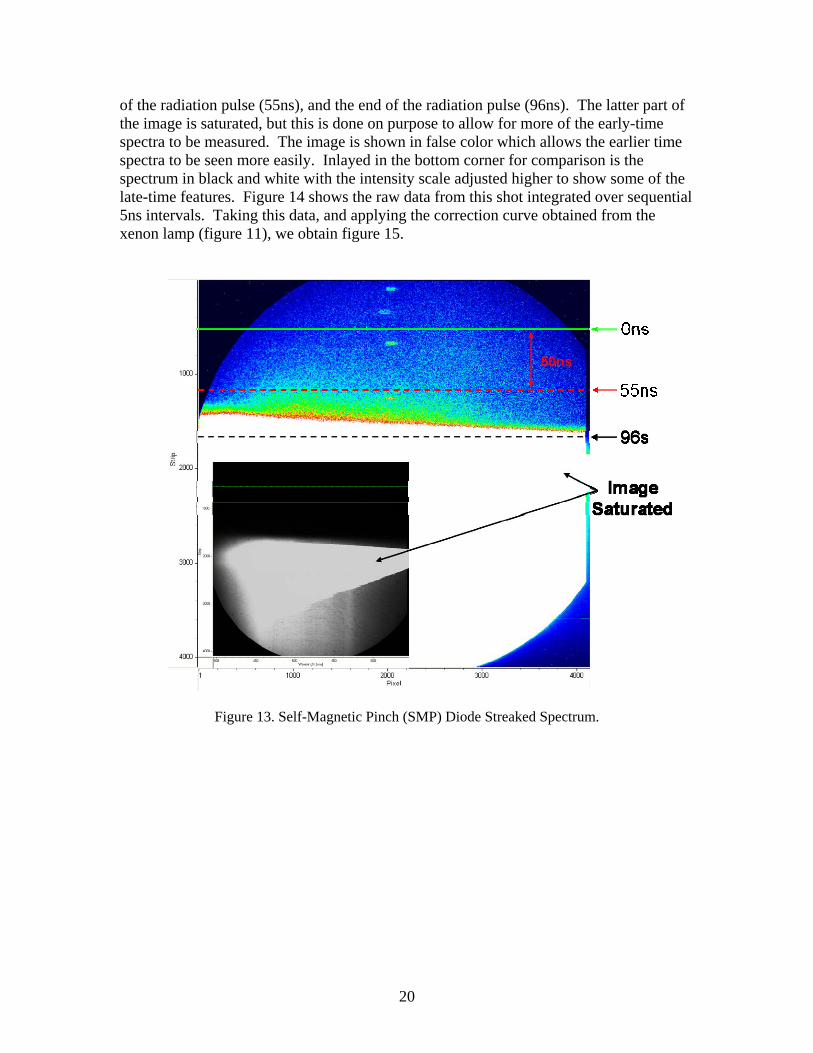
with measured bandpass filter curves. V. Calibration of Experimental Data Figure 13 shows an experimental streaked spectrum from a Self-Magnetic Pinch (SMP) shot on the RITS-6 accelerator [11]. Time goes from top to bottom; three lines have been placed on the spectrum to show when current first reaches the diode (0ns), the mid-point
20
of the radiation pulse (55ns), and the end of the radiation pulse (96ns). The latter part of the image is saturated, but this is done on purpose to allow for more of the early-time spectra to be measured. The image is shown in false color which allows the earlier time spectra to be seen more easily. Inlayed in the bottom corner for comparison is the spectrum in black and white with the intensity scale adjusted higher to show some of the late-time features. Figure 14 shows the raw data from this shot integrated over sequential 5ns intervals. Taking this data, and applying the correction curve obtained from the xenon lamp (figure 11), we obtain figure 15.
Figure 13. Self-Magnetic Pinch (SMP) Diode Streaked Spectrum.

21
0.0E+00
5.0E+04
1.0E+05
1.5E+05
2.0E+05
2.5E+05
400 450 500 550 600
Wavelength (nm)
Inte
ns
ity
(a.
u.)
66-71ns
71-76ns
76-81ns
81-86ns
86-91ns
40X increase in peak intensity in 35ns
Figure 14. SMP diode 5ns integrated spectral lineouts (raw data).
0.0E+00
5.0E+19
1.0E+20
1.5E+20
2.0E+20
2.5E+20
3.0E+20
425 475 525 575 625
Wavelength (nm)
Sp
ec
tra
l In
ten
sit
y (P
ho
ton
s/s
ec/
cm^
2/s
r/n
m)
66-71ns
71-76ns
76-81ns
81-86ns
86-91ns
Figure 15. SMP diode 5ns integrated spectral lineouts in absolute units.
One difficulty with this setup is focusing the light effectively onto the fiber. Since the fiber is small, variations in the focal position with wavelength cause variations in the collection efficiency. To try and compensate for this, we use a 150mm fl, 50mm diameter (F/3) lens which underfills (14o solid angle) the F/2.2 fiber (25.4o solid angle)

22
allowing for some variation in the focal position relative to the fiber face (see figure 17); this is done at the price of sacrificing some light collection. Figure 16 shows the variation in collection efficiency with wavelength. Since both focal spot size and location vary with wavelength (see figure 7) (focal spot size varies by 3% across the visible region), as the focal spot moves off the centerline position (0.0mm), the light collection efficiency decreases (figure 16). From the plot, for 500nm light, over a uniform 0.85cm diameter plasma column, the light collection efficiency is 86 +/- 4%, and at just the centerline position, the collection efficiency varies by 11% from 450-700nm.
0
10
20
30
40
50
60
70
80
90
100
-10 -9 -8 -7 -6 -5 -4 -3 -2 -1 0 1 2 3 4 5 6 7 8 9 10
Distance from Centerline (mm)
Co
llec
tio
n E
ffic
ien
cy
(Pe
rcen
tag
e)
405nm
450nm
500nm
550nm
600nm
650nm
700nm
Figure 16. Light collection efficiency versus wavelength.
Since the optimal focal position of the fiber for most wavelengths is shifted from the centerline (see figure 7), then for a small source (arc lamp or SMP diode), this means the fiber is imaging away from the source, and the light collected from the source region is not in the best focus. Because of the long focal length for the optics (78.3cm), light within a few millimeters of the centerline is well collimated (figure 16) (+/- 2% variation); however, light for wavelengths which focus at greater distances from the centerline (>5mm) is larger and more diffuse at the centerline position. This translates into losses on the fiber side. This is illustrated in figure 17 which shows three cases; one where the light focuses directly onto the fiber face, one where it focuses beyond the fiber face, and one where it focuses before the fiber face. In the two latter cases, some light from the centerline position is lost and not collected. This loss is especially great at shorter wavelengths (ex. 400nm) as can be seen in Figure 16. To visually illustrate the difference, figures 18 and 19 shows simulated spot profiles using Code V illumination analysis (LUM) at the centerline plane for 500nm and 405nm cases, respectively [12]. As can be seen, the 500nm case has a well defined boundary within a tight (1mm diameter) focal spot, in contrast, the 405nm case is more diffuse with an edge/boundary

23
extending out beyond a 2mm diameter. Therefore, to avoid having to deal with corrections for off-axis focusing, changes in spot size, and collection efficiencies at the centerline position, we limit our data analyses to the region between 475-575nm where the focus varies only +/- 2mm about the centerline axis.
Figure 17. Examples of fiber optic imaging of a plane source at various wavelengths.
Figure 18. Focal Spot size at centerline at 500nm (Code V Illumination Analysis) [12].
2.0000 MM
2.0000 MM
0.0000
1.0000
0.5000
SMPvisB4relative irradiance
Total flux 0.40313E-07 WattsMax irradiance 0.85509E-05 Watts/CM^2Min irradiance 0.00000E+00 Watts/CM^2
500nm
400nm, 600nm, 700nm
500-575nm
Optical Fiber Light Collection Cone (14o)
Focus
Focus

24
Figure 19. Focal spot size at centerline at 405nm (Code V Illumination Analysis) [12].
Taking figure 15 and limiting the wavelength region to between 475-575nm we obtain the plots in figure 20 (accurate to within +/- 20%) which can be used to measure electron temperatures and densities from the continua generated on-axis. Note that the earliest time spectrum in Figure 20 is comparable in intensity to the arc lamp measurements (see figure 12); however, subsequent spectra rapidly increase in intensity and are many times more intense than the calibration source. This means the calibration data needs to be extrapolated to correct the experimental data. This is done by determining the variation in intensity response for the streak camera/CCD system, which is linear, with photon energy. This linearity is measured using a HeNe laser, and the results are shown in Figure 21.
2.0000 MM
2.0000 MM
0.0000
1.0000
0.5000
SMPvisB4relative irradiance
Total flux 0.38107E-07 WattsMax irradiance 0.46061E-05 Watts/CM^2Min irradiance 0.00000E+00 Watts/CM^2

25
0.0E+00
5.0E+18
1.0E+19
1.5E+19
2.0E+19
2.5E+19
3.0E+19
475 500 525 550 575
Wavelength (nm)
Sp
ectr
al I
nte
ns
ity
(Ph
oto
ns/
sec/
cm^
2/s
r/n
m)
66-71ns
71-76ns
76-81ns
81-86ns
86-91ns
Figure 20. SMP Diode streaked spectra (corrected).
Figure 21. Streak camera linearity response measurements using HeNe laser source.
HeNe Laser Power versus Monochromator/Streak Camera System Intensity
y = 2294.3x + 286.72
R2 = 0.9823
y = -601.02x2 + 3315.5x + 24.942
R2 = 0.997
y = 5204.7x - 85.109
R2 = 0.9986
0
1000
2000
3000
4000
5000
6000
7000
8000
9000
0 0.2 0.4 0.6 0.8 1 1.2 1.4 1.6 1.8
Laser Power (mW)
Inte
nsi
ty (
a.u
.)
650V setting 480ns sweep speed 780 setting 150g/mm gratingDirect Fiber Input
4% Decrease in power using jumper fiber
F-Matching Lens
Direct Fiber Input
F-Matching Lens increases intensity by a
factor of 2.3x

26
VI. Error Analysis Finally, some comments need to be made regarding the errors associated with this calibration method. Several quantities (listed in table 2) are used in various calculations to determine the absolute spectral intensities for the experimental data. Some of these quantities are measured directly while others are obtained from the manufacturers. In general, direct measurements are preferable; however, in practice this it is not always possible or practical. While an effort has been made to identify all the associated errors in these measurements, it is important to note that measurements with larger uncertainties will tend to dominate the error calculations, so smaller uncertainties associated with other measurements, can for all practical purposes be neglected. That said, the effort here was to identify the various measurements taken and their associated errors, and conduct a semi-rigorous error analysis to determine the overall error in the final absolute intensities. Uncertainties were determined using the propagation of errors (least squares) method [13, 14].
Component Percent Error (+/-) Power Meter 3.0 Bandpass Filter-Peak Transmission 2.5 Bandpass Filter-FWHM 20 Bandpass Filter-Central Wavelength 0.5 Arc Size Measurement 25 Solid Angle Measurements 2.0 Power/Irradiance Measurements 20 Radiance Measurements 30 Streak Camera Intensity 5.4 Focal Spot Size 15 Optical transmission 5
Table 2. Components and associated errors in absolute spectral intensity measurements.
For the lamp curve measurements, the largest error is associated with the FWHM of the bandpass filter. This leads to a +/- 20.4% error in the power measurements. The error in the calculated total lamp radiance is +/- 32% and is dominated by the error in the effective arc size, which was obtained from the manufacturer, rather than directly measured. The error in the radiance measured through the experimental optics is less (+/- 15%) due to the direct measurement of the focal spot size; however, this error could be reduced further by better spot size measurements, for example, using a beam profile device. Errors in the intensity measurements of the streak camera/CCD system are +/- 5.4% leading to a total error of +/- 20% when extrapolated to higher intensities. A total error of +/- 20% represents a high level of accuracy for these types of measurements.

27
VII. Conclusions In summary, the aforementioned method was used to correct streaked spectra taken on electron beam diodes fielded on the RITS accelerator. This method uses a 300W DC xenon arc lamp as the calibration source. The arc lamp’s irradiance curve is measured directly without any optics. The radiance of the arc is then calculated and measured using the experimental optics. The arc is measured through the spectrograph/streak camera system and the resultant spectrum is compared with the measured radiance curve obtained from a NIST calibrated power meter and bandpass filter set. The corrected streaked spectrum is given in absolute units of photons/sec/cm2/sr/nm. The correction curve obtained from the arc lamp is applied to the experimental spectra and linear extrapolations are made to match the experimental intensity levels. Chromatic aberrations due to the optics are considered and minimized. The resultant experimental spectra are in units of absolute intensity which can be used to determine plasma parameters within the electron beam diodes fielded on the RITS accelerator.

28
VIII. Appendix Model BN-50 Streak Tube Streak Tube: STA 116.5 (Quartz Face) Size: 50mm diameter Phosphor: S-20 multi-alkali photocathode Operating Voltage: 20kV Dynamic Range: >1000 Slit Width: 1.0mm Static Spatial Resolution: 23 lp/mm Dynamic Spatial Resolution: 21 lp/mm center; 16 lp/mm edges Temporal Resolution: 0.6ns/mm to 9.6ns/mm Sweep Speeds: 30ns to 480ns Delft Electronic Products (DEP) Image Intensifier Type PP0400J S/N J0321343 Format: 40mm diameter; GEN II Phosphor: P43 Windows: Fiber Optic Resolution: 37 lp/mm Gain: 4775 cd/m2/lx @ 945V Sensitivity: 45mA/W (varies with wavelength) Uniformity: 20% EBI: 0.01 lx Spectral Instruments SI-800 CCD Camera Sensor: Kodak KAF16801E Pixels Array: 4096 x 4096 Pixel Size: 9µm pixels Image Area: 36.8mm x 36.8mm Operating Temperature: -10°C Operation Digitization: 16 bit Linearity 0-80%: 1% Readout Speeds: 1MHz; 500KHz

29
References [1] D. Johnson, V. Bailey, R. Altes, P. Corcoran, et al., “Status of the 10MV, 120kA RITS-6 Inductive Voltage Adder,” Proceedings of the 15th IEEE International Pulsed Power Conference, 314 (2007). [2] K. Hahn, N. Bruner, M.D. Johnston, B.V. Oliver, et al., "Overview of the Self-
Magnetic Pinch Diode Investigations on RITS-6," IEEE Transactions on Plasma Science (in publication).
[3] The Newport Oriel Light Resource, Newport Corporation, Irvine, CA (2004). [4] McPherson, Inc., 7A Stuart Road, Chelmsford, MA 01824. [5] National Security Technologies, LLC., Livermore Operations, 161 South Vasco
Road, Suite A, Livermore, CA 94550. [6] R.W. Olsen, “EG&G, Inc., Fast Streak Camera Operation,” SPIE-High Speed
Photography, Videography, and Photonics VI, 981, 71 (1988). [7] Spectral Instruments, Inc., 420 N. Bonita Avenue, Tucson, AZ 85745. [8] W.R. McCluney, Introduction to Radiometry and Photometry, Artech House,
Boston (1994). [9] M. Young, Optics and Lasers, 5th ed., Springer-Verlag, Berlin (2000). [10] W.L. Wolfe, Introduction to Radiometry, SPIE Optical Engineering Press,
Bellingham, WA (1998). [11] M.D. Johnston, B.V. Oliver, S. Portillo, T.A. Mehlhorn, et al., “Investigation of
Plasma Formation and Propagation in Relativistic Electron Beam Diodes,” 35th IEEE International Conference on Plasma Science, Karlsruhe, Germany, (2008).
[12] Code V: Optical Design and Analysis Software for Imaging and
Telecommunication Optics is a product of Optical Research Associates, Pasadena, CA 91107.
[13] P.R. Bevington and D.K. Robinson, Data Reduction and Error Analysis for the
Physical Sciences, 3rd ed., McGraw-Hill Inc., New York (2002). [14] J.R. Taylor, An Introduction to Error Analysis: The Study of Uncertainties in
Physical Measurements 2nd ed., University Science Books, Sausalito, CA (1997).

30
Distribution: 1 Voss Scientific Attn: D. R. Welch 418 Washington St. SE Albuquerque, NM 87108 1 Dept. of Electrical & Computer Engineering Attn: Edl Schamiloglu MSC01 1100 1 University of New Mexico Albuquerque, NM 87131-001 5 MS 1195 M. D. Johnston 3 MS 1195 B. V. Oliver 1 MS 1195 K. D. Hahn 1 MS 1195 T. J. Webb 1 MS 1195 J. J. Leckbee 1 MS 1195 I. Molina 1 MS 1193 D. W. Droemer 1 MS 1193 M. D. Crain 1 MS 1193 M. E. Cuneo 1 MS 1193 D. C. Rovang 1 MS 1194 J. R. Woodworth 1 MS 1196 J. E. Bailey 1 MS 0123 D. Chavez, LDRD Office, 1011 1 MS 9536 Technical Library (electronic copy)